Submitted:
17 June 2024
Posted:
18 June 2024
You are already at the latest version
Abstract
Functional copy number alterations (fCNAs) are DNA copy number changes with concordant differential gene expression. These are less likely to be bystander genetic lesions and could serve as robust and reproducible tumor biomarkers. To identify candidate fCNAs in neuroendocrine tumors (NETs), we integrated chromosomal microarray (CMA) and RNA-seq differential gene expression data from 31 pancreatic (pNET) and 33 small bowel neuroendocrine tumors (sbNET). Tumors were resected from 47 early disease progression (24 months) patients. Candidate fCNAs that accurately differentiated these groups in this discovery cohort were then replicated using fluorescence in situ hybridization (FISH) on formalin-fixed, paraffin-embedded (FFPE) tissues in a larger validation cohort of 60 pNETs and 82 sbNETs (52 early and 65 late disease progression samples). Logistic regression analysis determined the predictive ability of these biomarkers as well as the assay performance metrics of sensitivity, specificity, and area under the curve. Our results indicate that copy number changes at chromosomal loci 4p16.3, 7q31.2, 9p21.3, 17q12, 18q21.2, and 19q12 may be used as diagnostic and prognostic NET biomarkers. This involves a rapid, cost-effective approach to determine primary tumor site for patients with metastatic liver NETs and to guide risk stratified therapeutic decisions.
Keywords:
Neuroendocrine tumors
; functional copy number alterations
; fluorescence in situ hybridization
; diagnostic biomarkers
; risk-stratifying biomarkers
1. Introduction
Neuroendocrine tumors (NETs) are epithelial neuroendocrine neoplasms with high metastatic potential. Up to 60% of patients have advanced metastatic liver disease at the time of diagnosis1,2. Primary NETs in the abdomen are regularly missed due to small tumor size, body habitus, and limitations of abdominal imaging [1]. Twelve to fifty percent of primary gastroenteropancreatic NETs (GEP NETs) go undetected by imaging [2].
GEP NETs that originate in the pancreas (pNETs) and small bowel (sbNETs) comprise half of all GEP NETs [3]. Both tumor sites cause similar signs and symptoms, including abdominal pain, nausea, poor appetite, weight loss, and diarrhea [3]. Distinguishing between these two primary sites is important for guiding proper clinical management.
The incidence of GEP NETs is 3.56 per 100,000 people [3], but there remains a relatively high proportion of tumors that have an unknown primary (0.86 per 100,000 people) [3]. While the incidence of sbNETs is twice as high as pNETs (12,000 vs 6,000 cases annually in the United States) pNETs are more aggressive with a 5-year survival of 50% compared to 69% for sbNETs [3,4]. Treatment options for Grade 1 or Grade 2 (G1/G2) pNETs include surgery, somatostatin analogues (SSAs) [5], peptide receptor radionuclide therapy (PRRT) [6], everolimus [7,8,9] (an mTOR inhibitor), sunitinib [10] (a VEGF inhibitor), and capecitabine/temozolomide chemotherapy [11,12]. There is limited consensus on the order of treatment when patients have progressive disease (PD). Treatment options for G1/G2 sbNETs include surgery, PRRT, and everolimus [5,6,13]. Treatment order is more established in sbNETs with SSAs being the primary treatment followed by PRRT and then everolimus for PD.
Immunohistochemistry is routinely used to infer site of origin in metastatic NETs of occult origin [14,15,16]. The most commonly employed markers include CDX2 (midgut) [17], polyclonal PAX8 (pancreas) [18], TTF-1 (lung) [19], and SATB2 (rectum) [20]. None of these are NET-specific, though, and have been adapted for this purpose from more widespread use as markers of adenocarcinoma site of origin [21]. Because of the infrequency of NETs relative to other malignant epithelial tumors, complementary (serotonin for midgut) or best-in-class (islet 1 and PAX6 for pancreas and OTP for lung) NET-specific markers are not on the test menus of most clinical laboratories [15,22,23,24]. Many laboratories have switched from polyclonal to better performing (for adenocarcinoma applications) monoclonal PAX8 antibodies, the latter of which are non-reactive in pancreatic NETs (i.e., polyclonal PAX8-positivity in pNETs is due to cross-reactivity with PAX6). Even with access to all the best-performing markers at the University of Iowa, up to 5% of NETs still defy site of origin assignment after exhaustive immunohistochemical and radiologic evaluation. In this backdrop, the lead authors of the 2022 World Health Organization NET Classification stated that there remains a critical need for additional biomarkers to better classify NETs [25].
Copy number alterations (CNAs) are changes in chromosomal content that result in gain or loss in copies of DNA segments while functional copy number alterations (fCNAs) are changes in chromosomal content that also impact expression of genes within the region. Somatic fCNAs are predicted to be cancer drivers as opposed to bystander lesions [26]. CNAs can be detected through techniques such as whole genome sequencing (WGS), optical genome mapping, chromosomal microarray platforms (CMA) or fluorescence in situ hybridization (FISH), while fCNAs can be detected through pairing those techniques with gene expression analysis. Over the last decade, CNA profile studies of NETs have yielded promising results but notable discrepancies between studies have been observed [27,28,29,30,31,32,33,34,35,36,37]. Robust analysis of CNA profile differences between pNETs and sbNETs is still needed.
We present here the results of a pipeline used to identify fCNA profile differences between pNETs and sbNETs, as well as early and late disease progression tumors, with the goal of developing a panel of clinically applicable FISH probes for use as diagnostic and prognostic NET biomarker testing. This type of testing has direct relevance to metastatic NETs of unknown origin detected in the liver. To identify diagnostic NET biomarkers, a discovery cohort of patient-matched normal-primary-metastatic tumors underwent CMA and RNA-sequencing to identify fCNAs on 64 patients diagnosed with GEP NET (31 pNETs and 33 sbNETs). We further analyzed the prognostic value of these fCNAs in NETs, specifically with regard to time to progression. We replicated fCNAs using FISH on patient specimen derived tissue microarrays (TMAs) and selected probes based on their location within fCNAs of interest. Based on these collective findings, we propose a testing algorithm for primary site (pNET vs sbNET) and disease progression (late disease progression [LDP] or early disease progression [EDP]) that can be rapidly and inexpensively performed on formalin-fixed, paraffin-embedded (FFPE) NET tissue. Overall, these findings support fCNA utility as effective diagnostic and prognostic biomarkers in NETs.
2. Results
2.1. Copy Number Alteration Differences between pNETs and sbNETs
To establish primary and metastatic CNA profiles in pNETs and sbNETs, normal-primary-metastatic tumors underwent CMA profiling. In total, 47 pNET (28 primary, 19 metastatic) and 63 sbNET (32 primary, 31 metastatic) specimens were assessed by CMA. No significant CNA differences were observed between primary and metastatic tumors for either NET type (Supplementary Figure S1 and S2).
Considerable evidence suggests there are unique CNAs in pNETs and sbNETs, but discrepancies between studies have been observed27-32. To determine the comprehensive CNA profiles of pNETs and sbNETs, normal tissue-primary tumor pairs underwent CMA profiling. A total of 49 pNET and 63 sbNET patients were tested. We observed higher copy number gain events of chromosomes 4, 5, 7, 9, 12, 13, 14 and 17-20 in pNETs (Fisher exact test p<0.05). Copy number loss events of chromosomes 9 and 18 were detected almost exclusively in sbNETs (Fisher exact test p<0.05). These observations indicate robust and reproducible CNA profile differences between pancreatic and small bowel NETs (Figure 1).
Functional copy number alterations (fCNAs) are somatic changes in chromosomal content that affect the expression of genes within the region. To establish fCNA profiles in pNETs and sbNETs, we performed patient-matched RNA-sequencing of 31 pNETs (Supplementary Table S1) and 33 sbNETs (Supplementary Table S2) that underwent CMA profiling. To analyze the prognostic value of fCNAs in NETs, we separated our samples based on time to progression: late disease progression or LDP (>24 months until progression, n=17) and early disease progression or EDP (<24 months until progression, n=46). CNAs that were present in at least 15% of the cohort with significant concordant gene expression changes (increased expression in a chromosomal gain and decreased expression in chromosomal loss) were identified as potential fCNA biomarkers (Table 1). fCNA profiles were compared and a panel of differentiating fCNAs were selected (Table 2).
The results showed gains in 5q31, 7q31.1, 9p22.1, 17q11.2, 18q21.1, and 19q13.2 indicated pancreatic primary tumor site while a gain in 4p16.3 and loss in 9p22.1 and/or 18q21.1 indicated small bowel primary site. Notable loss of chromosome 18 in sbNETs is well established in the literature [27,29,30,33,34,35,36]. Potential prognostic NET biomarkers included gains in 7q31.1, 9p22.1, and 19q13.2.
2.2. FISH Validation of fCNA Differences between pNETs and sbNETs
2.2.1. Diagnosis
FISH is a cytogenetic technique that can be performed on formalin-fixed, paraffin embedded (FFPE) tissue to identify gene and locus specific CNAs. To replicate the diagnostic potential of our selected fCNAs and respective probes, FISH analyses were performed on 300 nuclei of pNET (n=60, Supplementary Table S3) and sbNET (n=82, Supplementary Table S4) FFPE specimens. Our results indicate that CCNE1 copy number gain is the strongest indicator of primary site with observed 5x higher rates in pNET samples (44% vs 9%, Χ2= 31.87, p<0.00001) (Table 3). Additional copy number gains in SMAD4 (25% vs 5%, Χ 2=15.69, p=0.00008), ERBB2 (22% vs 6%, Χ2=10.63, p=0.001), and CDKN2A (22% vs 7%, Χ2= 9.07, p=0.003) were observed 3-5x more frequently in pNETs tumors (Figure 2). Copy number loss in SMAD4 was reported in 60% of sbNET tumors, which is consistent with the literature [27,29,30,33,34,35,36]. Normal copy number status in CCNE1 was significantly more frequent in sbNET tumors (64% vs 40%, Χ2=10.99, p=0.0009). There were no significant CNA differences between pNET and sbNET tumors reported in CKS1B, FGFR3, CSF1R, and MET.
Thresholding copy number loss on FISH of FFPE sections is challenging as signal is assessed in a 2D section of a 3D structure (ie, the nucleus), resulting in the incorrect impression of loss in some subset of normal nuclei. We assessed the background apparent deletion rate due to sectioning and found an average background deletion rate of 28.3%. We used this important value to decipher between loss due to artifact versus true copy number loss (Supplementary Table S5).
2.2.2. Prognosis
Next, we assessed whether these same fCNAs could be used as prognostic NET biomarkers. To determine if our fCNAs findings could predict disease progression, we separated our specimens into late disease progression (LDP) and early disease progression (EDP) with a cutoff of 5.5 years until reported disease progression. FISH analyses were performed on 300 nuclei of pNET (LDP= 24, EDP= 17) and sbNET (LDP=41, EDP= 36) FFPE specimens. Copy number gain in CDKN2A was 2.2x more frequent in LDP pNET tumors (42% vs 19%, Χ2=12.48, p= 0.0004) (Table 4). SMAD4 copy number gain was 2.9x more frequent in EDP pNET tumors (42% vs 10%, Χ2=11.50, p= 0.0007). There were no prognostic implications for sbNET samples using these probes in our data set (Supplementary Table S6). These results validate CNAs in CDKN2A and SMAD4 as independent potential prognostic pNET biomarkers.
2.3. Logistic Regression, Performance Metrics and Clinical Decision Tree Development
Logistic regression analysis is used to determine the probability of multiple independent variables with one dichotomous outcome. Logistic regression can be used to analyze the sensitivity, specificity, and receiver operating characteristic curve (ROC) metrics to assess the quality of a model. Using our FISH data set, each specimen per probe was given a “normalized score” (see Methods section Clinical Decision Tree Development) to use for logistic regression analysis (Supplementary Table S7). The results indicate MET, ERBB2, SMAD4, and CCNE1 copy number status is significantly associated with primary tumor site (Table 5a). CCNE1 had the strongest effect on primary site (0.92-1.00, CI=0.41-1.00, p=0.034), followed by SMAD4 (0.90-1.00, CI= 0.39-1.00, p=0.046), ERBB2 (0.62-0.99, CI=0.43-0.99, p=0.001), and MET (0.70-0.93, CI=0.33-0.99, p=0.035). CDKN2A had a higher effect than MET on primary site, however, it did not reach significance in multivariate analysis. The performance metrics of our model are comparable to those achieved with IHC (Table 5b) [14,15,16]. Based on these metrics, our model resulted in an area under the ROC curve (AUC) score of 0.902 (Figure 3).
When assessing the prognostic impact of these probes, gain of CCNE1 was associated with early disease progression (EDP) in pNETs (gain, 0.46-0.89, CI=0.24-0.99, p=0.039) and sbNETs (normal, 0.58-0.91, CI=0.41-0.99, p=0.043) (Supplementary Table S8). In addition, FGFR3 gain was associated with EDP in sbNETs (0.70-0.95, CI=0.52-0.99, p= 0.0004) (Supplementary Table S9). CSF1R loss was suggestive of LDP in sbNETs (0.57, CI=0.40-0.73, p=0.07). Unlike our single probe analysis, CDKN2A and SMAD4 had no impact on pNET prognosis in the multivariate analysis.
We created a clinical decision tree (DT) using CNAs as diagnostic biomarkers (Figure 4). Our DT suggests assessing copy number status for ERBB2, CCNE1, CDKN2A, and MET is effective for differentiating between pNETs and sbNETs. If ERBB2 is gained, the tumor has a 90% chance of being from the pancreas; however, if ERBB2 is lost or normal CCNE1 copy number status should be assessed. If CCNE1 is gained, then the tumor has a greater than 80% chance of being from the pancreas but if it is lost or normal, CDKN2A copy number status should be assessed. If CDKN2A is gained or normal, the tumor has a slightly greater than 60% chance of being from the pancreas and 40% chance of being from the small bowel. If CDKN2A is lost and MET is either lost or normal, the sample has a greater than 80% chance of being from the small bowel; however, if MET is gained and ERBB2 is normal, it has a greater than 85% chance of being from the pancreas. Lastly, if MET is gained, but ERBB2 is lost, the tumor has a greater than 90% chance of being from the small bowel. SMAD4 was not suggestive in our DT and that may be due to CCNE1 and SMAD4 copy number being highly correlated in our dataset (0.635) (Supplementary Table S10). Overall, these findings support the use of CNAs in MET, CDKN2A, ERBB2, and CCNE1 as simple diagnostic NET biomarkers.
3. Discussion
The aim of this paper was to determine if CNAs could be used as NET biomarkers by integrating patient-matched CNA and gene expression data to identify fCNAs. We replicated fCNAs by selecting probes based on their location with fCNAs of interest using FISH on patient specimen derived tissue microarrays with the goal of developing a fast clinical DT that could be applied in any testing laboratory to expedite medical decision making.
FISH is a widely available methodology that offers a cost-effective approach with relatively rapid turnaround time. Through the identification, replication, and prioritization of FISH probes in this study, there is a potential to improve the diagnostic assessment of NETs while reducing the cost and the time of results, thus improving patient care.
Our findings support the use of CNAs in MET, ERBB2, SMAD4, and CCNE1 as diagnostic NET biomarkers and resulted in an AUC of 0.902. This compares favorably to a previously published immunochemistry-based algorithm that resulted in an ROC of 0.864 for the distinction of tumors from the pancreatic versus small bowel or pulmonary origin [38]. Taken together, we recommend assessing the copy number status of MET, CDKN2A, ERBB2, and CCNE1 to differentiate between pNETs and sbNETs. Although SMAD4 was statistically associated with primary site, its copy number status was highly correlated with that of CCNE1 (0.635). Our findings suggest FGFR3, CDKN2A, SMAD4, and CCNE1 are valuable prognostic NET biomarkers. Many studies of other tumor types show that CCNE1 gain is a key marker of poor prognosis which may dictate more aggressive clinical management [39,40,41,42,43,44,45].
Limitations of our study includes the moderate sample size of the dataset. This reflects the rarity of NETs making it challenging to gather larger cohorts and this is especially limiting for our time to progression analysis. For our CMA discovery cohort, the average PFS was 2.4 years, which is different from the PFS of our FISH validation cohort and the literature at approximately 5.5 years [27,28,29,30,33]. Another limitation includes the missing values of the dataset. To combat this, we used the median score for each probe for missing data, however, observed FISH results for all variables and all samples would provide more accurate overall results. A general limitation is that data gathered from clinical samples and electronic health records are not always complete across all samples.
To our surprise there were no significant CNAs differences in FGFR3 and CSF1R between pNETs and sbNETs using FISH and logistic regression analyses even though we observed significant CNA differences in our CMA data discovery cohort. Secondly, CKS1B copy number gain was not associated with PFS in this study but has been correlated with poor PFS in pan-cancer analyses [46,47,48,49,50,51,52]. It is important to note that those studies did not include assessing the correlation between GEP NET prognosis and CKS1B copy number status. Lastly, we determined there was no significant difference in CDKN2A copy number loss between pNETs and sbNETs although our CMA data suggested otherwise. CDKN2A has been shown to be a tumor suppressor in pNETs and focal CDKN2A loss has been observed [28]. Another reason why CDKN2A loss might not have been observed is due to the inherent challenges of assessing loss (as opposed to gain) in FFPE samples.
In summary, we found significant CNA differences in CDKN2A, ERBB2, SMAD4, and CCNE1 between pNET and sbNET tumor samples after combined analyses of chromosomal microarray, RNA-sequencing, and fluorescence in situ hybridization data. Using the FISH data, we performed logistic regression analysis and performance metrics while developing a clinical decision tree to help determine primary tumor site and guide risk stratified therapeutic decisions for metastatic tumors of unknown origin detected in the liver. This combinatorial approach to biomarker identification has proven highly effective and may represent a powerful way to define clinically relevant biomarkers for additional NET primary sites in the future.
4. Materials and Methods
4.1. Patient Cohort
All patients for this single institution study were enrolled under an Institutional Review Board approved protocol. The CMA discovery cohort consisted of patient-matched normal-primary-metastatic tumors of 47 pNETs (28 primary, 19 metastatic) and 63 sbNETs (32 primary, 31 metastatic). Normal-primary-metastatic tumors refer to the primary and metastatic tumor specimen as well as normal, healthy adjacent tissue derived from the same patient. The FISH replication cohort consisted of patient-matched normal-primary-metastatic tumors of 84 pNETs (76 primary, 3 metastatic liver, 5 metastatic lymph node) and 98 sbNETs (86 primary, 7 metastatic liver, 5 metastatic lymph node). Patient cohort demographics are listed in Supplementary Table S11. Fresh tissues were collected were placed in RNAlater solution (Thermo Fisher Scientific, Waltham, MA) and nucleic acids were isolated using RNeasy Plus Universal Mini Kit (Qiagen, Valencia, CA) or DNeasy blood & Tissue Kit (Qiagen, Valencia, CA) per protocols recommended by the manufacturers.
4.2. Microarray Protocols
Microarray experiments were performed using the Nimblegen human CGH 720 K Whole Genome Tiling version 3.0 array (Roche NimbleGen; Madison, WI) and the Affymetrix CytoScan high-definition (HD) array (Affymetrix array, Santa Clara, CA, USA) according to manufacturers’ instructions. Calculation of log2 ratio values and quality control metrics were assessed using the NimbleScan software tool (version 2.5; Roche NimbleGen) or ChAS (Chromosome Analysis Software) tool (version 1.1.2; Affymetrix) (CytoScan). CNA calling and data interpretation were performed using the Nexus Copy Number software (version 6.1, BioDiscovery; El Segundo, CA) and the Rank segmentation algorithm (for Nimblegen arrays) or SNPRank segmentation algorithm (CytoScanHD) supplied with the Nexus software suite [53]. Allele Specific Copy Number Analysis of Tumors (ASCAT) processing was performed to identify ploidy and percent normal tissue.
4.3. RNA Processing
RNA-seq was performed within the Genomics Division of the University of Iowa Institute of Human Genetics (Iowa, City, IA) using the Illumina TruSeq protocol (Illumina, Inc., San Diego, CA) as previously described [54]. RNA-seq count data was normalized using FPKM. To identify differentially expressed genes, TopHat (v 2.1.0), Cuffquant, Cuffnorm, and Cuffduff were performed comparing tumors against healthy adjacent pancreatic or small bowel tissue. Statistically significant expression change was determined by assessing the false discovery rate (FDR) adjusted p-value (q-value), with significance defined as q<0.05.
4.4. fCNA Identification
The R package iGC [55] integrates sample paired copy number and gene expression analysis to identify concordant differential gene expression. Log2 copy number values from Nimblegen or Affymetrix were utilized to analyze the association of copy number and mRNA levels of 31 pNET and 33 sbNET samples. CNAs that were observed in at least 20% of samples were assessed. Allelic imbalance and loss of heterozygosity lesions were removed. Genes were retained for which expression was predicted to be driven by either copy number gain (and increased expression) or copy number loss (and decreased expression) events and met previously defined p and FDR thresholds. No fold change threshold was utilized for the iGC analysis.
4.5. Fluorescence in situ Hybridization (FISH)
TMAs were assembled from formalin-fixed, paraffin embedded lesions of 60 pNET and 82 sbNET primary and metastatic specimens arrayed in triplicate (2-micron sections). FISH studies were performed using Empire Genomics FISH probes CKS1B-20-OR, FGFR3-20-OR, CSFR1-20-GR, MET-20-GR, CDKN2A-20-GR, ERBB2-20-OR, SMAD4-20-GR, CCNE1-20-OR (Empire Genomics, Inc., New York, USA) per the protocol recommended by the manufacturer (empiregenomics.com/resources/protocols-procedures). One hundred nuclei per section and three sections per patient specimen for a total of 300 nuclei were scored. Briefly, slides were baked for a minimum of 8 hours at 45C, de-paraffinized with Hemo-De and then rehydrated before heating in Dako pre-treatment 20x. The samples were digested with pepsin at 37C for 5 minutes. After digestion, slides were washed with Dako buffer and dehydrated with a series of 70%, 85%, and 100% ethanol. The slides were then probed, denatured, and hybridized for 48 hours at 37C. Unbound probe was washed from the slides and they were counterstained with DAPI. FISH slides were analyzed at 100x magnification using CytoVision (Leica, USA) filters.
Counts for loss, normal, and gain signal pattern nuclei were average for each specimen and probe set. Statistical differences were assessed using Chi-Square test, with significance defined as p<0.05. Firth’s Bias-Reduced logistic regression was used to estimate the predicted probability of association of CNAs with tissue of origin status. Copy number loss was defined at or below 28.3% of nuclei showed less than two copies to account for “pseudo-loss” due to the plane of sectioning. Copy number gain was defined at or above 15.3% of nuclei. These values were calculated by assessing the average percent copy number loss, normal, and gain within our entire dataset and selecting the highest variable range value for pNETs (loss) and sbNETs (gain) respectively. Duplicate CNAs of the same probe set with the largest variable range were chosen. Samples outside of these loss and gain thresholds were determined to be normal. Descriptive statistics for loss, normal, and gain values are listed in the table provided (Supplementary Table S12).
4.6. Logistic Regression Analysis and DT Development
Logistic regression and statistical analyses were performed by assessing the 8 loci biomarker variables in the FISH dataset. To do so, each biomarker per sample was given a score. The score was determined by calculating the percent normal nuclei, subtracting the percent loss nuclei, and adding the percent gain nuclei. Therefore, a sample probed with a biomarker that resulted in 60% normal, 28% loss, and 12% gain would be given a score of 44 (60-28+12). Loss, normal, and gain values were determined by thresholds set on the original variables. Missing data was imputed with the median score for each probe. The biomarker and response variables were tested within a pipeline with the Analysis of Overdispersed Data (aod- version 1.3.2) and ggplot2 (version 3.4.4) R packages.
DT dataset curation was performed by assessing the 8 loci biomarker variables in the FISH dataset categorically. For example, if a probe for any given sample was lost a value of 1 was designated, while normal and gains were designated with 2 and 3 respectively. Missing data was designated with 0. The decision tree was developed using the rpart (version 4.1.23) and partykit (version 1.2.20) R packages.
Supplementary Materials
The following supporting information can be downloaded at the website of this paper posted on Preprints.org, Figure S1: Primary vs metastatic pNET CMA results; Figure S2: Primary vs metastatic sbNET CMA results; Table S1: iGC results for pNETs; Table S2: iGC results for sbNETs; Table S3: FISH TMA and patient information for pNETs; Table S4: FISH TMA and patient information for sbNETs; Table S5: Percent average copy number loss, normal, and gain for fCNA biomarkers; Table S6: Percent average copy number loss, normal, and gain for fCNA biomarkers based on sbNET time until progression; Table S7: Logistic regression results based on primary tumor site; Table S8: Logistic regression results for pNETs based on time until progression; Table S9: Logistic regression results for sbNETs based on time until progression; Table S10: Probe copy number correlation coefficients; Table S11: Patient demographics; Table S12: Descriptive statistics for FISH data.
Author Contributions
Conceptualization, H.V., A.B., T.B., J.M., B.D.; methodology, H.V., E.K., Q.Q., T.B., P.B, B.D.; data curation, H.V., H.M., K.K., A.S., T.B., B.B., A.B., B.D.; writing—original draft preparation, H.V., B.D.; writing—review and editing, H.V., E.K., A.B., T.B., P.B., D.Q., J.H., B.D.; funding acquisition, H.V., T.B., A.B., J.H., D.Q., B.D. All authors have read and agreed to the published version of the manuscript.
Funding
This research was funded by an NCI NET SPORE grant to B.D., D.Q., J.H., and T.B. (P50 CA174521), an Interdisciplinary Genetics T32 Predoctoral Training Grant H.V. (GM 008629), an NCI R01 grant to D.Q., B.D., P.B., and A.B. (CA260200), and by the Stead Family Department of Pediatrics departmental funds.
Institutional Review Board Statement
The study was conducted in accordance with the Declaration of Helsinki. Patients presenting to the University of Iowa with pNETs and sbNETs were consented for genetic studies and entered into a tumor registry approved by the University of Iowa Institutional Review Board (IRB#: 199911057).
Informed Consent Statement
Informed written consent was provided by all patients in accordance with a protocol approved by the University of Iowa Institutional Review Board (IRB Number 199911057), and studies were conducted in accordance with the Belmont Report.
Conflicts of Interest
The authors declare no conflicts of interest.
References
- Wang, S.C.; Parekh, J.R.; Zuraek, M.B.; Venook, A.P.; Bergsland, E.K.; Warren, R.S.; Nakakura, E.K. Identification of Unknown Primary Tumors in Patients With Neuroendocrine Liver Metastases. Arch. Surg. 2010, 145, 276–280. [Google Scholar] [CrossRef] [PubMed]
- Modlin, I.M. , et al., Gastroenteropancreatic neuroendocrine tumours. Lancet Oncol, 2008. 9(1): p. 61-72.
- Dasari, A.; Shen, C.; Halperin, D.; Zhao, B.; Zhou, S.; Xu, Y.; Shih, T.; Yao, J.C. Trends in the Incidence, Prevalence, and Survival Outcomes in Patients with Neuroendocrine Tumors in the United States. JAMA Oncol. 2017, 3, 1335–1342. [Google Scholar] [CrossRef] [PubMed]
- Caplin, M.E. Pavel, and P. Ruszniewski, Lanreotide in metastatic enteropancreatic neuroendocrine tumors. N Engl J Med, 2014. 371(16): p. 1556-7.
- Rinke, A.; Müller, H.-H.; Schade-Brittinger, C.; Klose, K.-J.; Barth, P.; Wied, M.; Mayer, C.; Aminossadati, B.; Pape, U.-F.; Bläker, M.; et al. Placebo-Controlled, Double-Blind, Prospective, Randomized Study on the Effect of Octreotide LAR in the Control of Tumor Growth in Patients With Metastatic Neuroendocrine Midgut Tumors: A Report From the PROMID Study Group. J. Clin. Oncol. 2009, 27, 4656–4663. [Google Scholar] [CrossRef] [PubMed]
- Brabander, T. , et al., Long-Term Efficacy, Survival, and Safety of [(177)Lu-DOTA(0),Tyr(3)]octreotate in Patients with Gastroenteropancreatic and Bronchial Neuroendocrine Tumors. Clin Cancer Res, 2017. 23(16): p. 4617-4624.
- Yao, J.C.; Phan, A.T.; Chang, D.Z.; Wolff, R.A.; Hess, K.; Gupta, S.; Jacobs, C.; Mares, J.E.; Landgraf, A.N.; Rashid, A.; et al. Efficacy of RAD001 (Everolimus) and Octreotide LAR in Advanced Low- to Intermediate-Grade Neuroendocrine Tumors: Results of a Phase II Study. J. Clin. Oncol. 2008, 26, 4311–4318. [Google Scholar] [CrossRef] [PubMed]
- Yao, J.C.; Shah, M.H.; Ito, T.; Bohas, C.L.; Wolin, E.M.; Van Cutsem, E.; Hobday, T.J.; Okusaka, T.; Capdevila, J.; de Vries, E.G.; et al. Everolimus for Advanced Pancreatic Neuroendocrine Tumors. New Engl. J. Med. 2011, 364, 514–523. [Google Scholar] [CrossRef]
- Yao, J.C.; Fazio, N.; Singh, S.; Buzzoni, R.; Carnaghi, C.; Wolin, E.; Tomasek, J.; Raderer, M.; Lahner, H.; Voi, M.; et al. Everolimus for the treatment of advanced, non-functional neuroendocrine tumours of the lung or gastrointestinal tract (RADIANT-4): a randomised, placebo-controlled, phase 3 study. Lancet 2015, 387, 968–977. [Google Scholar] [CrossRef]
- Raymond, E.; Dahan, L.; Raoul, J.-L.; Bang, Y.-J.; Borbath, I.; Lombard-Bohas, C.; Valle, J.; Metrakos, P.; Smith, D.; Vinik, A.; et al. Sunitinib Malate for the Treatment of Pancreatic Neuroendocrine Tumors. New Engl. J. Med. 2011, 364, 501–513. [Google Scholar] [CrossRef]
- Kunz, P.L.; Graham, N.T.; Catalano, P.J.; Nimeiri, H.S.; Fisher, G.A.; Longacre, T.A.; Suarez, C.J.; Martin, B.A.; Yao, J.C.; Kulke, M.H.; et al. Randomized Study of Temozolomide or Temozolomide and Capecitabine in Patients With Advanced Pancreatic Neuroendocrine Tumors (ECOG-ACRIN E2211). J. Clin. Oncol. 2023, 41, 1359–1369. [Google Scholar] [CrossRef]
- Strosberg, J.R.; Fine, R.L.; Choi, J.; Nasir, A.; Coppola, D.; Chen, D.; Helm, J.; Kvols, L. First-line chemotherapy with capecitabine and temozolomide in patients with metastatic pancreatic endocrine carcinomas. Cancer 2010, 117, 268–275. [Google Scholar] [CrossRef]
- Yao, J.C.; Voi, M.; Rouyrre, N.; Singh, S. Everolimus in ileum neuroendocrine tumours - Authors' reply. Lancet 2016, 388, 236–7. [Google Scholar] [CrossRef] [PubMed]
- Bellizzi, A.M. , Assigning site of origin in metastatic neuroendocrine neoplasms: a clinically significant application of diagnostic immunohistochemistry. Adv Anat Pathol, 2013. 20(5): p. 285-314.
- Bellizzi, A.M. , Immunohistochemistry in the diagnosis and classification of neuroendocrine neoplasms: what can brown do for you? Hum Pathol, 2020. 96: p. 8-33.
- Maxwell, J.E.; Sherman, S.K.; Stashek, K.M.; O'Dorisio, T.M.; Bellizzi, A.M.; Howe, J.R. A practical method to determine the site of unknown primary in metastatic neuroendocrine tumors. Surgery 2014, 156, 1359–1366. [Google Scholar] [CrossRef] [PubMed]
- Erickson, L.A.; Papouchado, B.; Dimashkieh, H.; Zhang, S.; Nakamura, N.; Lloyd, R.V. Cdx2 as a Marker for Neuroendocrine Tumors of Unknown Primary Sites. Endocr. Pathol. 2004, 15, 247–252. [Google Scholar] [CrossRef]
- Long, K.B.; Srivastava, A.; Hirsch, M.S.; Hornick, J.L. PAX8 Expression in Well-differentiated Pancreatic Endocrine Tumors: Correlation With Clinicopathologic Features and Comparison With Gastrointestinal and Pulmonary Carcinoid Tumors. Am. J. Surg. Pathol. 2010, 34, 723–729. [Google Scholar] [CrossRef] [PubMed]
- Folpe, A.L.; Gown, A.M.; Lamps, L.W.; Garcia, R.; Dail, D.H.; Zarbo, R.J.; A Schmidt, R. Thyroid transcription factor-1: immunohistochemical evaluation in pulmonary neuroendocrine tumors. . 1999, 12, 5–8. [Google Scholar] [PubMed]
- Bellizzi, A.M. SATB2 in neuroendocrine neoplasms: strong expression is restricted to well-differentiated tumours of lower gastrointestinal tract origin and is most frequent in Merkel cell carcinoma among poorly differentiated carcinomas. Histopathology 2019, 76, 251–264. [Google Scholar] [CrossRef] [PubMed]
- Bellizzi, A.M.; M. , A. An Algorithmic Immunohistochemical Approach to Define Tumor Type and Assign Site of Origin. Adv. Anat. Pathol. 2020, 27, 114–163. [Google Scholar] [CrossRef] [PubMed]
- Schmitt, A.M. , et al., Islet 1 (Isl1) expression is a reliable marker for pancreatic endocrine tumors and their metastases. Am J Surg Pathol, 2008. 32(3): p. 420-5.
- Graham, R.P.; Shrestha, B.; Caron, B.L.; Smyrk, T.C.; Grogg, K.L.; Lloyd, R.V.; Zhang, L. Islet-1 Is a Sensitive But Not Entirely Specific Marker for Pancreatic Neuroendocrine Neoplasms and Their Metastases. Am. J. Surg. Pathol. 2013, 37, 399–405. [Google Scholar] [CrossRef] [PubMed]
- Nonaka, D.; Papaxoinis, G.; Mansoor, W. Diagnostic Utility of Orthopedia Homeobox (OTP) in Pulmonary Carcinoid Tumors. Am. J. Surg. Pathol. 2016, 40, 738–744. [Google Scholar] [CrossRef]
- Rindi, G.; Mete, O.; Uccella, S.; Basturk, O.; La Rosa, S.; Brosens, L.A.A.; Ezzat, S.; de Herder, W.W.; Klimstra, D.S.; Papotti, M.; et al. Overview of the 2022 WHO Classification of Neuroendocrine Neoplasms. Endocr. Pathol. 2022, 33, 115–154. [Google Scholar] [CrossRef]
- Taylor, B.S.; Barretina, J.; Socci, N.D.; DeCarolis, P.; Ladanyi, M.; Meyerson, M.; Singer, S.; Sander, C. Functional Copy-Number Alterations in Cancer. PLOS ONE 2008, 3, e3179. [Google Scholar] [CrossRef] [PubMed]
- Andersson, E.; Swärd, C.; Stenman, G.; Ahlman, H.; Nilsson, O. High-resolution genomic profiling reveals gain of chromosome 14 as a predictor of poor outcome in ileal carcinoids. Endocrine-Related Cancer 2009, 16, 953–966. [Google Scholar] [CrossRef] [PubMed]
- Scarpa, A.; Chang, D.K.; Nones, K.; Corbo, V.; Patch, A.-M.; Bailey, P.; Lawlor, R.T.; Johns, A.L.; Miller, D.K.; Mafficini, A.; et al. Whole-genome landscape of pancreatic neuroendocrine tumours. Nature 2017, 543, 65–71. [Google Scholar] [CrossRef] [PubMed]
- Banck, M.S.; Kanwar, R.; Kulkarni, A.A.; Boora, G.K.; Metge, F.; Kipp, B.R.; Zhang, L.; Thorland, E.C.; Minn, K.T.; Tentu, R.; et al. The genomic landscape of small intestine neuroendocrine tumors. J. Clin. Investig. 2013, 123, 2502–2508. [Google Scholar] [CrossRef] [PubMed]
- Hashemi, J.; Fotouhi, O.; Sulaiman, L.; Kjellman, M.; Höög, A.; Zedenius, J.; Larsson, C. Copy number alterations in small intestinal neuroendocrine tumors determined by array comparative genomic hybridization. BMC Cancer 2013, 13, 505–505. [Google Scholar] [CrossRef] [PubMed]
- Hofving, T. , et al., The neuroendocrine phenotype, genomic profile and therapeutic sensitivity of GEPNET cell lines. Endocr Relat Cancer, 2018. 25(4): p. X1-X2.
- Hu, W.; Feng, Z.; Modica, I.; Klimstra, D.S.; Song, L.; Allen, P.J.; Brennan, M.F.; Levine, A.J.; Tang, L.H. Gene Amplifications in Well-Differentiated Pancreatic Neuroendocrine Tumors Inactivate the p53 Pathway. Genes Cancer 2010, 1, 360–368. [Google Scholar] [CrossRef] [PubMed]
- Kulke, M.H.; Freed, E.; Chiang, D.Y.; Philips, J.; Zahrieh, D.; Glickman, J.N.; Shivdasani, R.A. High-resolution analysis of genetic alterations in small bowel carcinoid tumors reveals areas of recurrent amplification and loss. Genes, Chromosom. Cancer 2008, 47, 591–603. [Google Scholar] [CrossRef] [PubMed]
- Kytölä, S.; Höög, A.; Nord, B.; Cedermark, B.; Frisk, T.; Larsson, C.; Kjellman, M. Comparative Genomic Hybridization Identifies Loss of 18q22-qter as an Early and Specific Event in Tumorigenesis of Midgut Carcinoids. Am. J. Pathol. 2001, 158, 1803–1808. [Google Scholar] [CrossRef] [PubMed]
- Lollgen, R.M.; Hessman, O.; Szabo, E.; Westin, G.; Akerstrom, G. Chromosome 18 deletions are common events in classical midgut carcinoid tumors. Int. J. Cancer 2001, 92, 812–815. [Google Scholar] [CrossRef]
- Simbolo, M.; Vicentini, C.; Mafficini, A.; Fassan, M.; Pedron, S.; Corbo, V.; Mastracci, L.; Rusev, B.; Pedrazzani, C.; Landoni, L.; et al. Mutational and copy number asset of primary sporadic neuroendocrine tumors of the small intestine. Virchows Arch. 2018, 473, 709–717. [Google Scholar] [CrossRef]
- Gebauer, N.; Schmidt-Werthern, C.; Bernard, V.; Feller, A.C.; Keck, T.; Begum, N.; Rades, D.; Lehnert, H.; Brabant, G.; Thorns, C. Genomic landscape of pancreatic neuroendocrine tumors. World J. Gastroenterol. 2014, 20, 17498–17506. [Google Scholar] [CrossRef] [PubMed]
- Koo, J.; Mertens, R.B.; Mirocha, J.M.; Wang, H.L.; Dhall, D. Value of Islet 1 and PAX8 in identifying metastatic neuroendocrine tumors of pancreatic origin. Mod. Pathol. 2012, 25, 893–901. [Google Scholar] [CrossRef]
- Zhao, H.; Wang, J.; Zhang, Y.; Yuan, M.; Yang, S.; Li, L.; Yang, H. Prognostic Values of CCNE1 Amplification and Overexpression in Cancer Patients: A Systematic Review and Meta-analysis. J. Cancer 2018, 9, 2397–2407. [Google Scholar] [CrossRef] [PubMed]
- Ayhan, A.; Kuhn, E.; Wu, R.-C.; Ogawa, H.; Bahadirli-Talbott, A.; Mao, T.-L.; Sugimura, H.; Shih, I.-M.; Wang, T.-L. CCNE1 copy-number gain and overexpression identify ovarian clear cell carcinoma with a poor prognosis. Mod. Pathol. 2017, 30, 297–303. [Google Scholar] [CrossRef] [PubMed]
- Nakayama, N.; Nakayama, K.; Shamima, Y.; Ishikawa, M.; Katagiri, A.; Iida, K.; Miyazaki, K. Gene amplification CCNE1 is related to poor survival and potential therapeutic target in ovarian cancer. Cancer 2010, 116, 2621–2634. [Google Scholar] [CrossRef]
- Nakayama, K.; Rahman, M.T.; Rahman, M.; Nakamura, K.; Ishikawa, M.; Katagiri, H.; Sato, E.; Ishibashi, T.; Iida, K.; Ishikawa, N.; et al. CCNE1 amplification is associated with aggressive potential in endometrioid endometrial carcinomas. Int. J. Oncol. 2015, 48, 506–516. [Google Scholar] [CrossRef] [PubMed]
- Zhou, Z.; Bandla, S.; Ye, J.; Xia, Y.; Que, J.; Luketich, J.D.; Pennathur, A.; Peters, J.H.; Tan, D.; E Godfrey, T. Cyclin E involved in early stage carcinogenesis of esophageal adenocarcinoma by SNP DNA microarray and immunohistochemical studies. BMC Gastroenterol. 2014, 14, 78–78. [Google Scholar] [CrossRef] [PubMed]
- Farley, J.; Smith, L.M.; Darcy, K.M.; Sobel, E.; O'Connor, D.; Henderson, B.; E Morrison, L.; Birrer, M.J. Cyclin E expression is a significant predictor of survival in advanced, suboptimally debulked ovarian epithelial cancers: a Gynecologic Oncology Group study. . 2003, 63, 1235–41. [Google Scholar] [PubMed]
- Matsushita, R. , et al., Tumour-suppressive microRNA-144-5p directly targets CCNE1/2 as potential prognostic markers in bladder cancer. Br J Cancer, 2015. 113(2): p. 282-9.
- Masuda, T.-A.; Inoue, H.; Nishida, K.; Sonoda, H.; Yoshikawa, Y.; Kakeji, Y.; Utsunomiya, T.; Mori, M. Cyclin-dependent kinase 1 gene expression is associated with poor prognosis in gastric carcinoma. . 2003, 9, 5693–8. [Google Scholar]
- Kitajima, S.; Kudo, Y.; Ogawa, I.; Bashir, T.; Kitagawa, M.; Miyauchi, M.; Pagano, M.; Takata, T. Role of Cks1 Overexpression in Oral Squamous Cell Carcinomas: Cooperation with Skp2 in Promoting p27 Degradation. Am. J. Pathol. 2004, 165, 2147–2155. [Google Scholar] [CrossRef]
- Shapira, M.; Ben-Izhak, O.; Bishara, B.; Futerman, B.; Minkov, I.; Krausz, M.M.; Pagano, M.; Hershko, D.D. Alterations in the expression of the cell cycle regulatory protein cyclin kinase subunit 1 in colorectal carcinoma. Cancer 2004, 100, 1615–1621. [Google Scholar] [CrossRef] [PubMed]
- Zhang, Y.; Chen, Y.; You, F.; Li, W.; Lang, Z.; Zou, Z. Prognostic and clinicopathological significance of Cks1 in cancer: Evidence from a meta-analysis. J. Cell. Physiol. 2019, 234, 13423–13430. [Google Scholar] [CrossRef] [PubMed]
- Shapira, M.; Ben–Izhak, O.; Linn, S.; Futerman, B.; Minkov, I.; Hershko, D.D. The prognostic impact of the ubiquitin ligase subunits Skp2 and Cks1 in colorectal carcinoma. Cancer 2005, 103, 1336–1346. [Google Scholar] [CrossRef] [PubMed]
- Slotky, M.; Shapira, M.; Ben-Izhak, O.; Linn, S.; Futerman, B.; Tsalic, M.; Hershko, D.D. The expression of the ubiquitin ligase subunit Cks1 in human breast cancer. Breast Cancer Res. 2005, 7, R737–R744. [Google Scholar] [CrossRef] [PubMed]
- Xu, L.; Fan, S.; Zhao, J.; Zhou, P.; Chu, S.; Luo, J.; Wen, Q.; Chen, L.; Wen, S.; Wang, L.; et al. Increased expression of Cks1 protein is associated with lymph node metastasis and poor prognosis in nasopharyngeal carcinoma. Diagn. Pathol. 2017, 12, 1–7. [Google Scholar] [CrossRef] [PubMed]
- BioDiscovery, l. Nexus Copy Number Version 7. 5 User Manual. 2014.
- Scott, A.T.; Weitz, M.; Breheny, P.J.; Ear, P.H.; Darbro, B.; Brown, B.J.; Braun, T.A.; Li, G.; Umesalma, S.; Kaemmer, C.A.; et al. Gene Expression Signatures Identify Novel Therapeutics for Metastatic Pancreatic Neuroendocrine Tumors. Clin. Cancer Res. 2020, 26, 2011–2021. [Google Scholar] [CrossRef]
- Lai, Y.P. , et al., iGC-an integrated analysis package of gene expression and copy number alteration. BMC Bioinformatics, 2017. 18(1): p. 35.
Figure 1.
CMA data comparing pNET and sbNET tumor samples. The top row indicates the chromosomes 1-22. Below that is the frequency of the CNA event. Significance indicated by blue significance line. Genes, exons, CNAs, microRNAS (miRNA), and cancer-related genes are listed below the significance bar. Blue represents copy number gain. Red represents copy number loss.
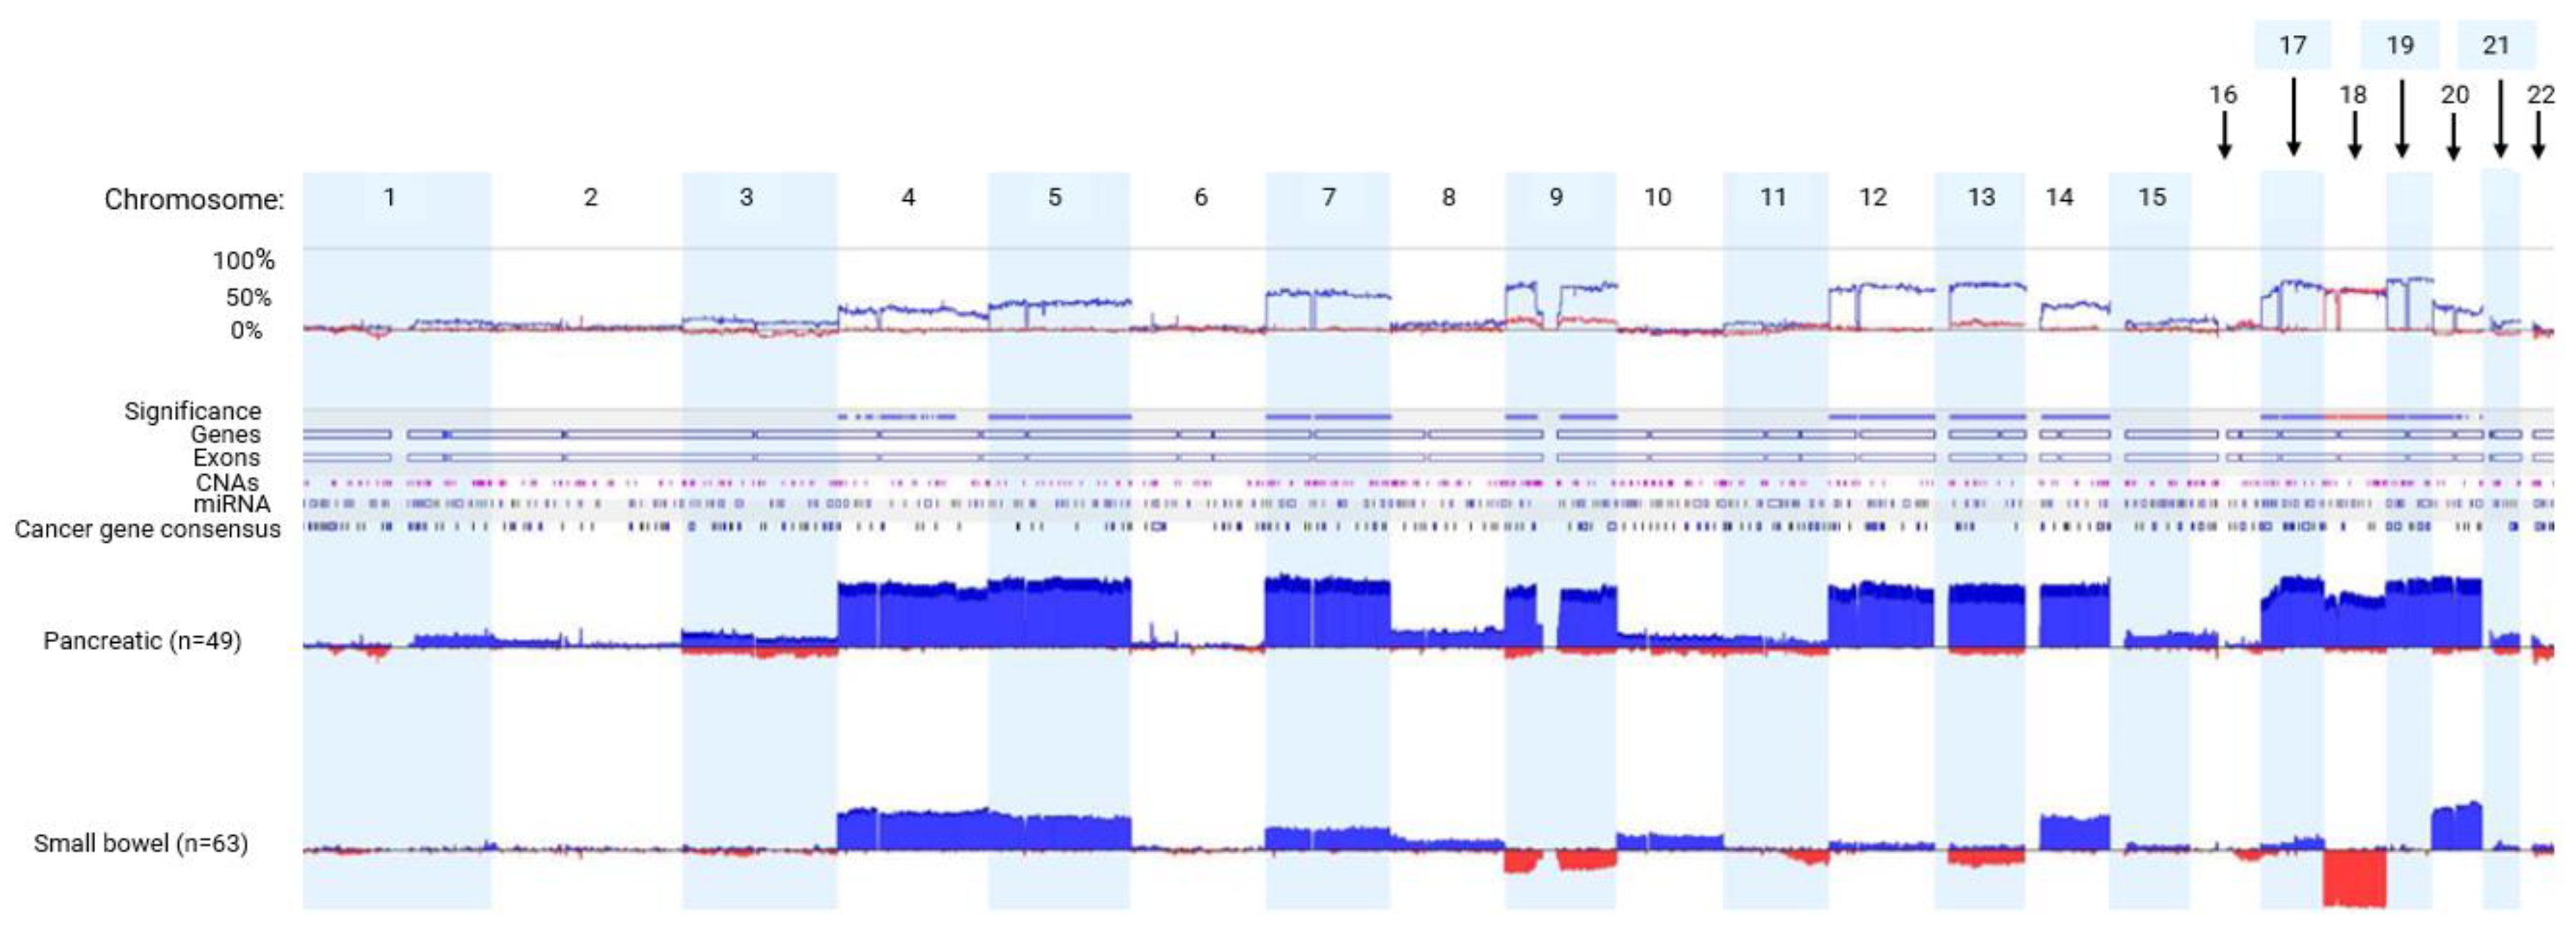
Figure 2.
FISH analysis of CKS1B, MET, CDKN2A, ERBB2, SMAD4, and CCNE1. Images are representative of copy gains of (A.) CDKN2A, (B.) ERBB2, and (C.) SMAD4 as well as loss of (D.) SMAD4.
Figure 2.
FISH analysis of CKS1B, MET, CDKN2A, ERBB2, SMAD4, and CCNE1. Images are representative of copy gains of (A.) CDKN2A, (B.) ERBB2, and (C.) SMAD4 as well as loss of (D.) SMAD4.
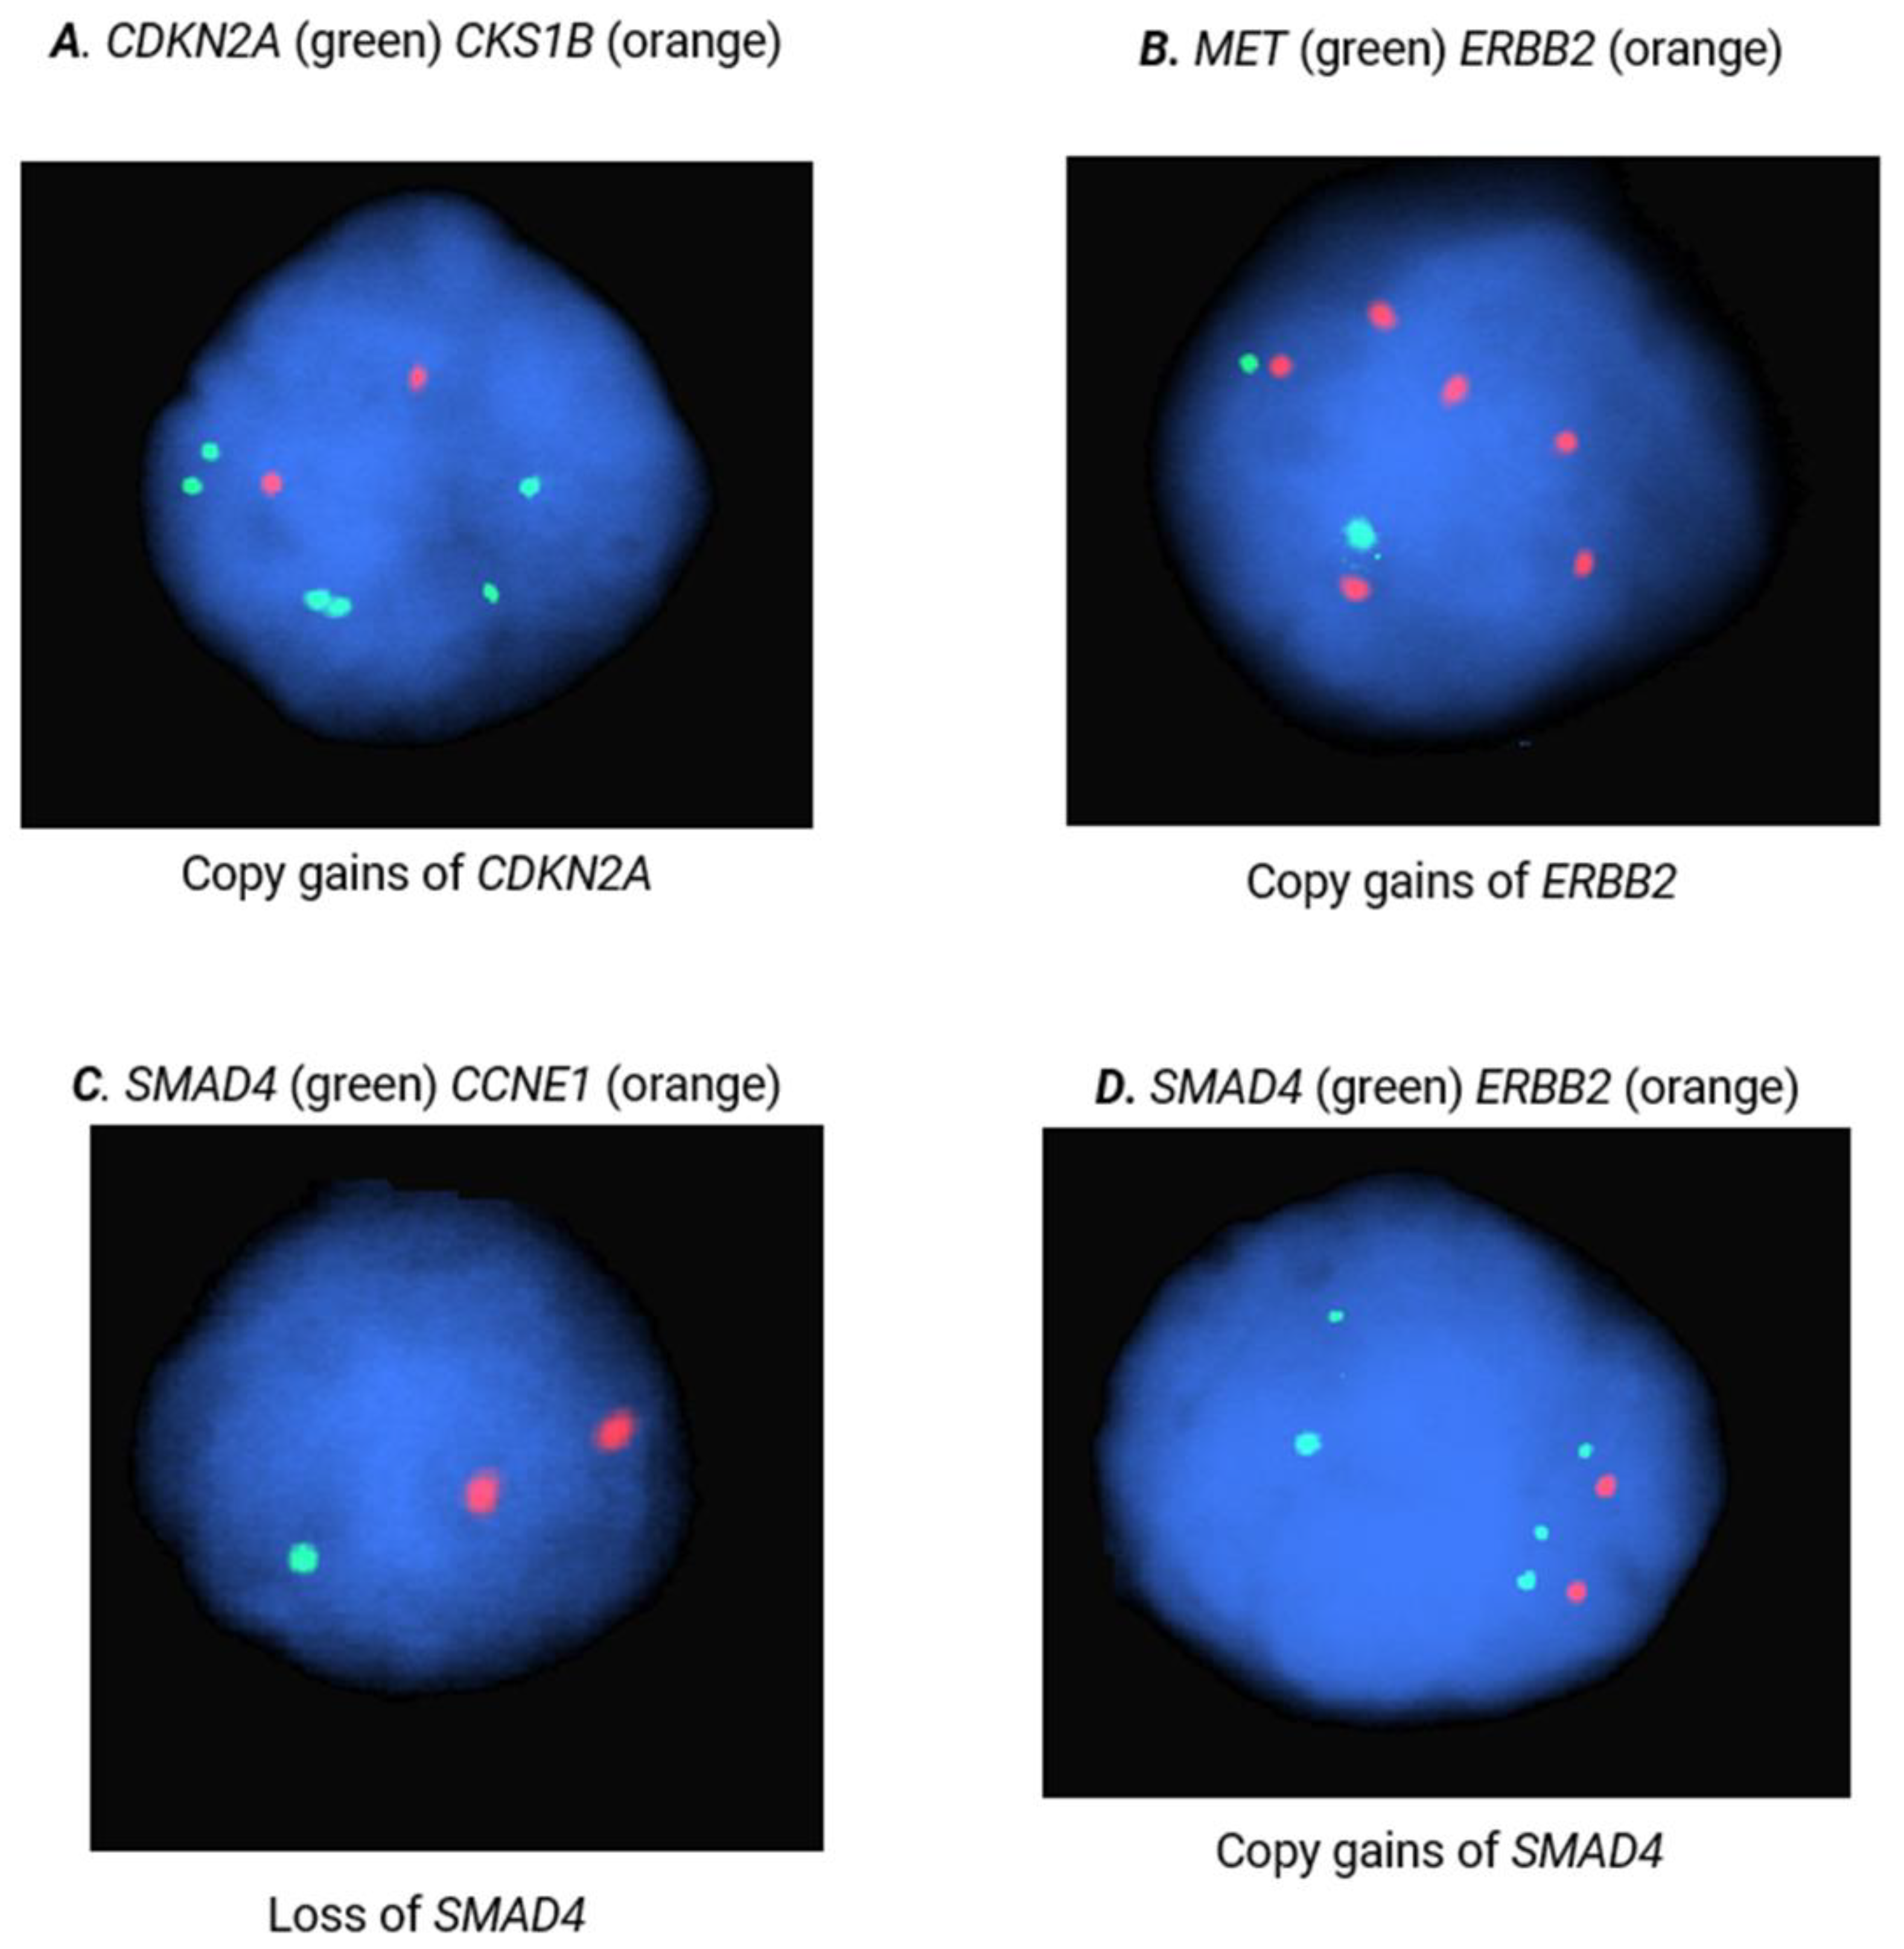
Figure 3.
Receiver 0perating characteristic curve (ROC) curve analysis using CNAs in CCNE1, SMAD4, ERBB2, and CDKN2A as diagnostic NET biomarkers.
Figure 3.
Receiver 0perating characteristic curve (ROC) curve analysis using CNAs in CCNE1, SMAD4, ERBB2, and CDKN2A as diagnostic NET biomarkers.
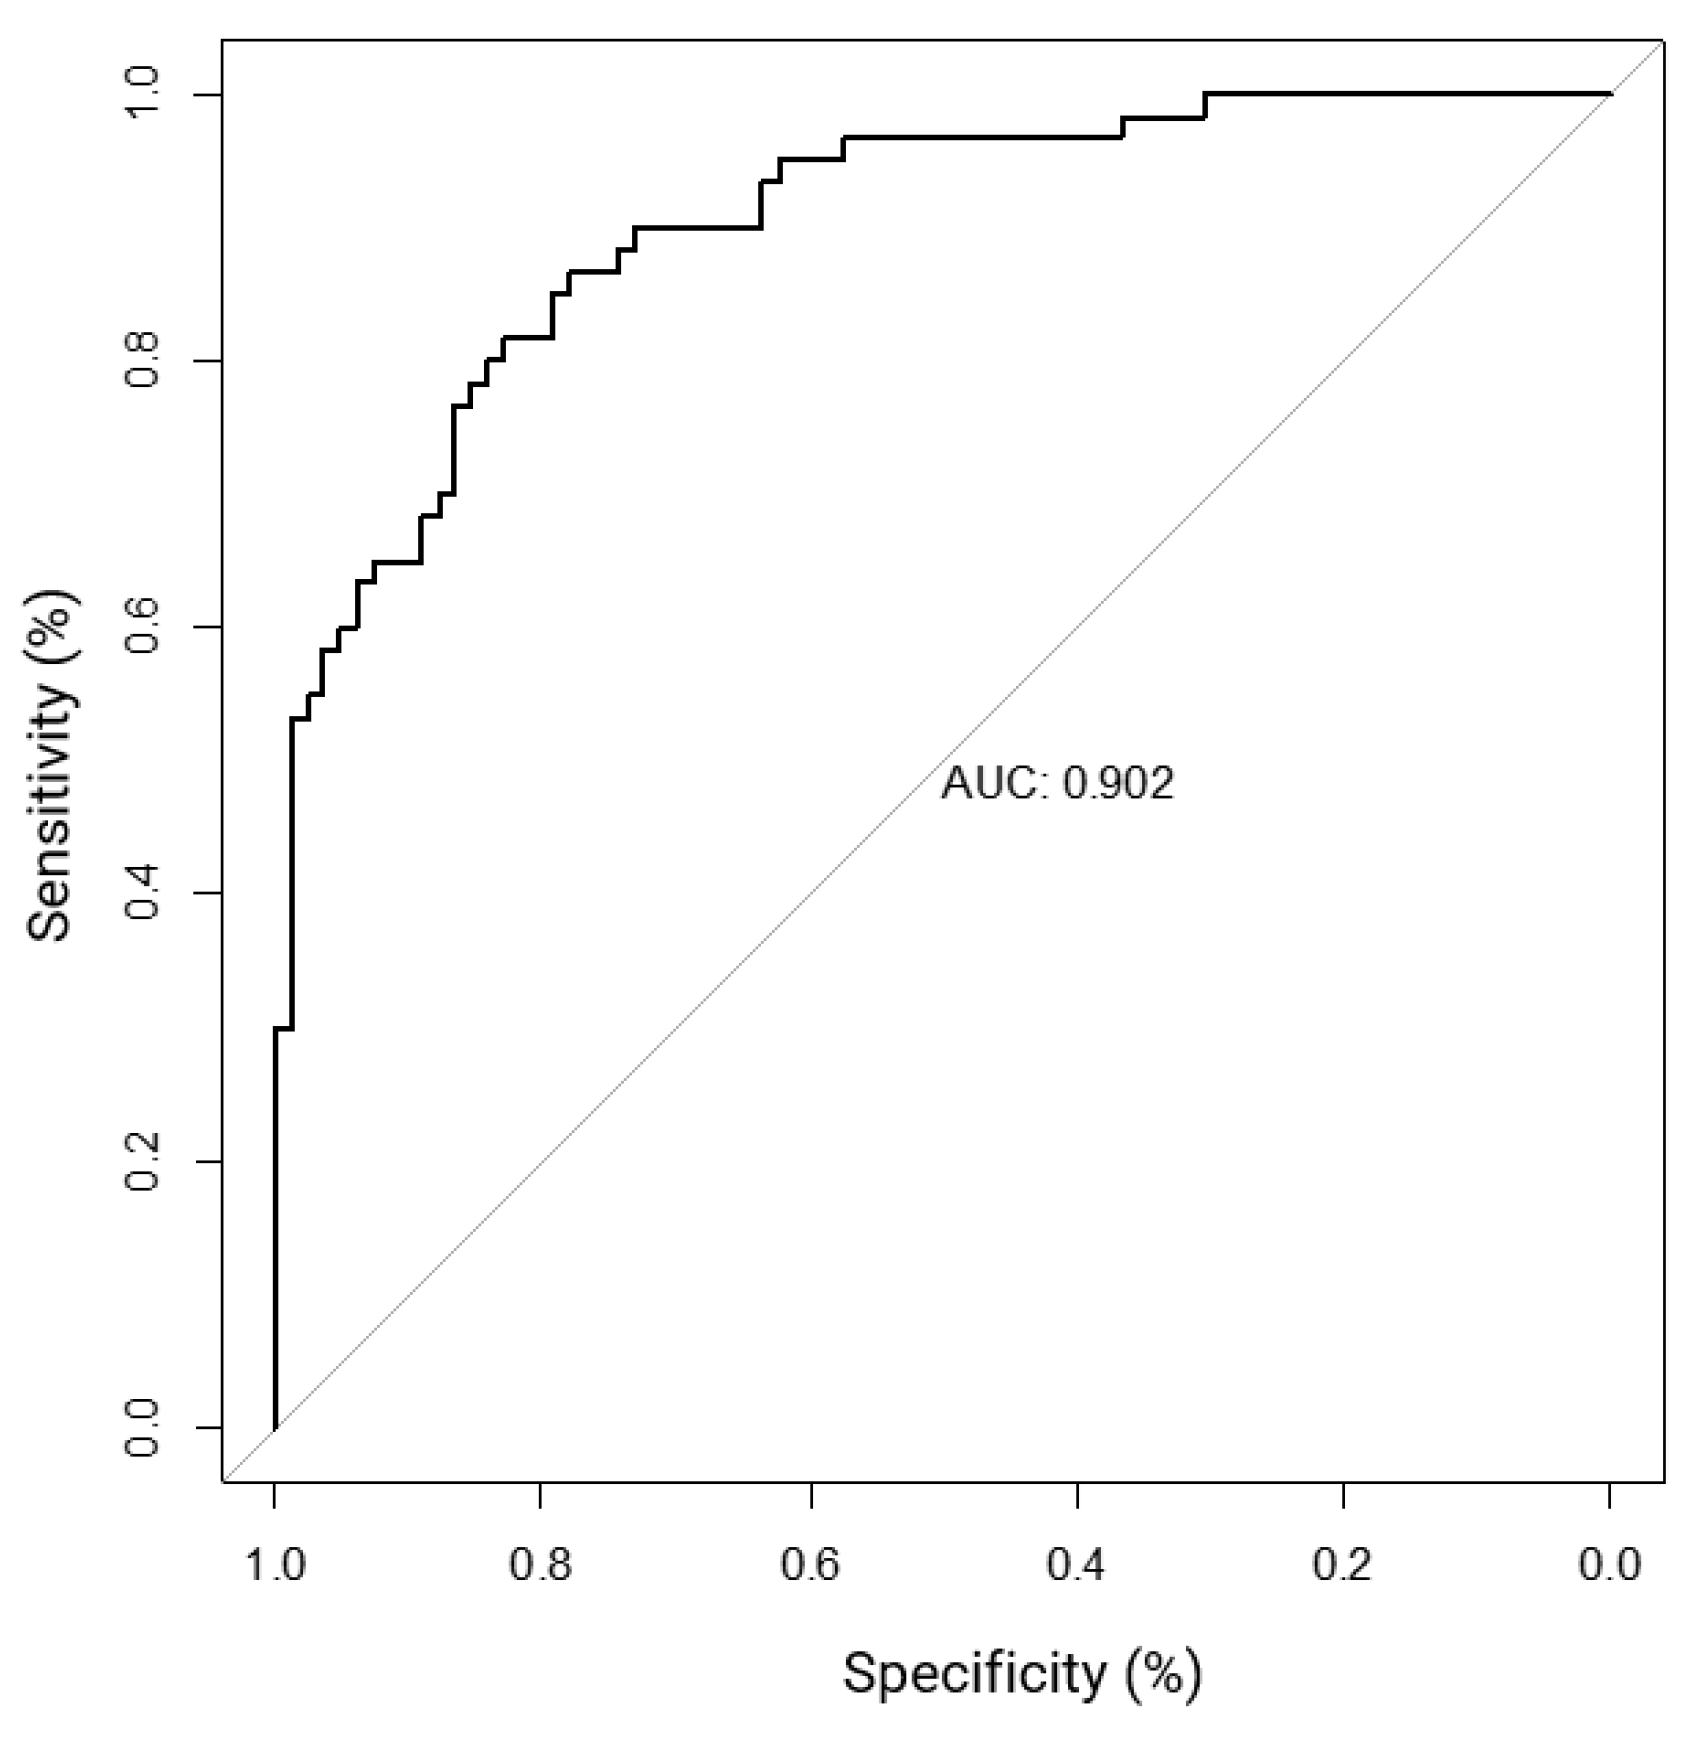
Figure 4.
Clinical DT models using CNAs in ERBB2, CCNE1, CDKN2A, and MET as NET biomarkers. The shading of the boxes represents the favorable primary tumor site while the right -hand side represents the predicted probabilities based on site.
Figure 4.
Clinical DT models using CNAs in ERBB2, CCNE1, CDKN2A, and MET as NET biomarkers. The shading of the boxes represents the favorable primary tumor site while the right -hand side represents the predicted probabilities based on site.
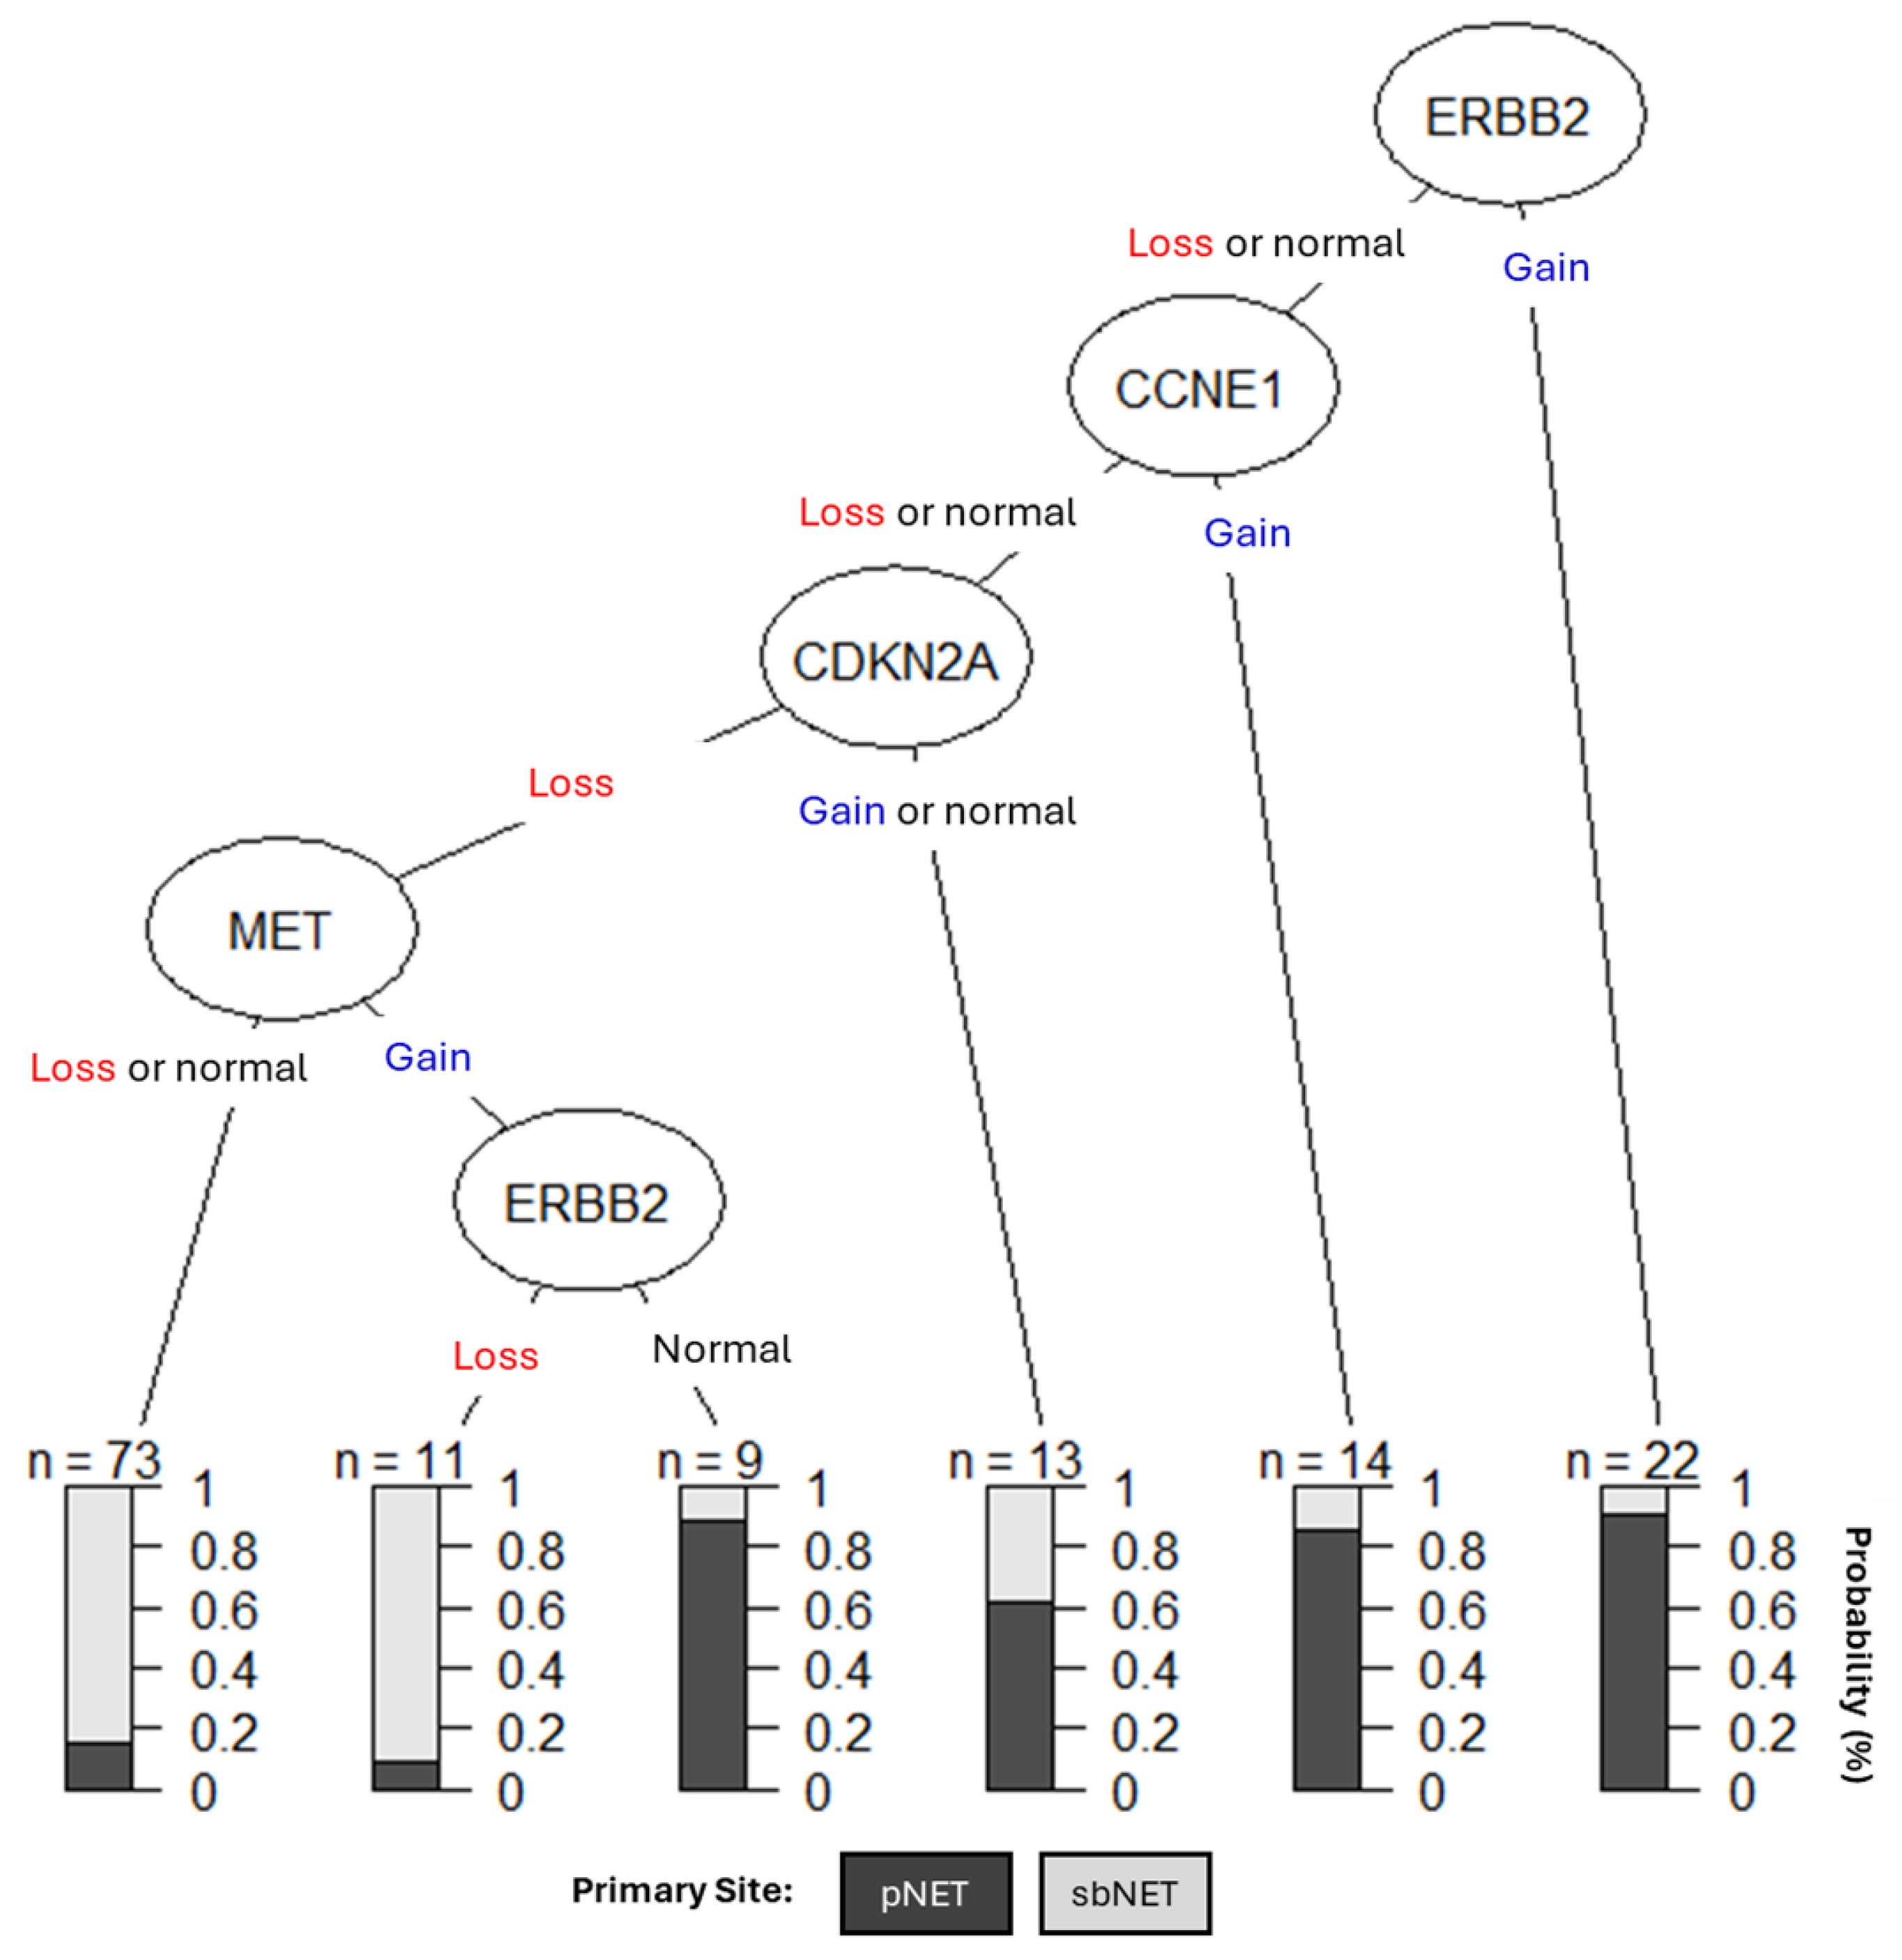

Table 1.
fCNA loci and examples of genes within those loci that exhibited copy number alterations and concordant gene expression changes.
Table 1.
fCNA loci and examples of genes within those loci that exhibited copy number alterations and concordant gene expression changes.
| CNA (%) | RNA-Seq (Log2Fold) | ||||||||
|---|---|---|---|---|---|---|---|---|---|
| fCNA Locus & Genes | P | FDR | L | N | G | L | N | G | Δ N vs L or G |
| 4p16.3 | |||||||||
| Family with Sequence Similarity 218 (FAM218A) | 6.04E-06 | 0.01 | 0% | 48% | 52% | NA | 0.7 | 3.7 | 3.0 |
| UNC-5 Netrin Receptor C (UNC5C) | 0.0002 | 0.03 | 0% | 42% | 58% | NA | 1.3 | 4.0 | 2.7 |
| 5q21.2-31.3 | |||||||||
| CART Prepropeptide (CARTPT) | 7.98E-05 | 0.03 | 0% | 35% | 65% | NA | 0.6 | 6.4 | 5.8 |
| Protocadherin Gamma Subfamily B, 3 (PCDHGB3) | 0.0002 | 0.03 | 0% | 42% | 58% | NA | 0.6 | 3.1 | 2.5 |
| 7q21.3—q31.1 | |||||||||
| ATP-binding Cassette Subfamily B MemberB (ABCB1) | 0.0004 | 0.04 | 0% | 39% | 61% | NA | 1.6 | 5.2 | 3.6 |
| Reelin (RELN) | 0.0004 | 0.04 | 0% | 35% | 65% | NA | 0.8 | 4.7 | 3.9 |
| 9p24.2-q34.11 | |||||||||
| Very Low Density Lipoprotein Receptor (VLDLR) | 0.0001 | 0.03 | 3% | 42% | 55% | -0.1 | -0.4 | 1.3 | 1.6 |
| Torsin Family 1 Member B (TOR1B) | 0.0004 | 0.04 | 3% | 39% | 58% | 0.6 | 0.8 | 1.7 | 0.9 |
| 17p11.2-13.117q11.2-15.3 | |||||||||
| TNF Receptor Associated Factor 4 (TRAF4) | 0.0001 | 0.03 | 3% | 26% | 71% | -0.2 | -0.4 | 1.3 | 1.7 |
| Ras Related Dexamethasone Induced 1 (RASD1) | 0.0003 | 0.03 | 6% | 42% | 52% | 4.5 | 1.1 | 4.5 | 3.0 |
| 18q21.1 | |||||||||
| Ectopic P Granules 5 Autophagy Tethering Factor (EPG5) | 0.0002 | 0.01 | 64% | 36% | 0% | -0.6 | 0.2 | NA | -0.9 |
| Ferrochelatase (FECH) | 0.001 | 0.03 | 64% | 36% | 0% | -0.3 | 0.3 | NA | -0.6 |
| 19q13.12-13.42 | |||||||||
| RNA Polymerase II Subunit I (POLR2I) | 0.0001 | 0.03 | 0% | 32% | 68% | NA | 1.0 | 3.1 | 2.0 |
| Leucine Rich Repeat and Fibronectin Type III Domain Containing 1 (LRFN1) | 7.27E-05 | 0.03 | 0% | 32% | 68% | NA | -0.7 | 1.6 | 2.3 |
L= loss. N= normal. G= gain. Δ= difference. P-value, false discovery rate (FDR).
Table 2.
Differential panel of CNAs and associated commercially available and clinically used cancer related gene probes.
Table 2.
Differential panel of CNAs and associated commercially available and clinically used cancer related gene probes.
| fCNA results | Biomarker | Commercially available and clinically used probes (locus) |
|---|---|---|
| 1q21.3+ | EDP | CKS1B (1q21.3) |
| 4p16.3+ | LDP | FGFR3 (4p16.3) |
| 5q31.2-31.3+ | EDP | CSF1R (5q32) |
| 7q21.3-q31.1+ | pNET/EDP | MET (7q31.2) |
| 9p24.2-q34.11+ | pNET | CDKN2A (9p21.3) |
| 17p11.2-17q13.1+ | pNET | ERBB2 (17q12) |
| 17q11.2-17q15.3+ | EDP | |
| 18q21.1- | sbNET | SMAD4 (18q21.2) |
| 19q13.12-19q13.42+ | pNET | CCNE1 (19q12) |
EDP= early disease progression. LDP= late disease progression. + indicates copy number gain - indicates copy number loss.
Table 3.
FISH results assessing the average percentage of copy number loss, normal, and gain of biomarkers between pNETs and sbNETs. Χ2= Chi-square.
Table 3.
FISH results assessing the average percentage of copy number loss, normal, and gain of biomarkers between pNETs and sbNETs. Χ2= Chi-square.
| Probe | CN loss (%) | CN normal (%) | CN gain (%) |
|---|---|---|---|
| CKS1B | Χ2= 2.59 p-value (p)=0.27 | ||
| pNET (n= 27) | 36 | 54 | 9 |
| sbNET (n= 26) | 27 | 59 | 14 |
| Χ2 | 1.88 | 0.4 | 1.17 |
| P | 0.17 | 0.53 | 0.28 |
| FGFR3 | Χ2= 7.04 p= 0.70 | ||
| pNET (n= 16) | 26 | 51 | 23 |
| sbNET (n= 44) | 21 | 55 | 24 |
| Χ2 | 0.7 | 0.32 | 0.03 |
| P | 0.4 | 0.57 | 0.87 |
| CSF1R | Χ2= 4.63 p= 0.10 | ||
| pNET (n= 21) | 17 | 56 | 27 |
| sbNET (n= 31) | 23 | 62 | 15 |
| Χ2 | 1.13 | 0.74 | 4.34 |
| P | 0.29 | 0.39 | 0.04 |
| MET | Χ2= 5.84 p= 0.054 | ||
| pNET (n= 42) | 24 | 53 | 24 |
| sbNET (n= 53) | 28 | 62 | 11 |
| Χ2 | 0.42 | 1.64 | 5.84 |
| P | 0.52 | 0.2 | 0.02 |
| CDKN2A | Χ2= 9.25 p=0.01 | ||
| pNET (n= 19) | 22 | 56 | 22 |
| sbNET (n= 14) | 29 | 64 | 7 |
| Χ2 | 1.29 | 1.33 | 9.07 |
| P | 0.26 | 0.25 | 0.003 |
| ERBB2 | Χ2= 10.77 p=0.005 | ||
| pNET (n= 37) | 22 | 56 | 22 |
| sbNET (n= 31) | 29 | 65 | 6 |
| Χ2 | 1.29 | 1.69 | 10.63 |
| P | 0.26 | 0.19 | 0.001 |
| SMAD4 | Χ2= 29.12 p<0.00001 | ||
| pNET (n= 22) | 26 | 49 | 25 |
| sbNET (n= 17) | 60 | 35 | 5 |
| Χ2 | 23.58 | 4.02 | 15.69 |
| P | <0.00001 | 0.04 | 0.00008 |
| CCNE1 | Χ2= 21.92 p 0.00001 | ||
| pNET (n= 22) | 16 | 40 | 44 |
| sbNET (n= 17) | 28 | 64 | 9 |
| Χ2 | 4.04 | 10.99 | 31.87 |
| P | 0.04 | 0.0009 | <0.00001 |
CN= copy number. LDP= later disease progression. EDP= early disease progression. P-value calculated by Chi-square test (Χ2). False Discovery rate (FDR)=0.006.
Table 4.
FISH results assessing the average percentage of copy number loss, normal, and gain of biomarkers between LDP and EDP.
Table 4.
FISH results assessing the average percentage of copy number loss, normal, and gain of biomarkers between LDP and EDP.
| Probe | CN loss (%) | CN normal (%) | CN gain (%) |
|---|---|---|---|
| CKS1B | Χ2=1.81 p= 0.41 | ||
| LDP (n= 6) | 36 | 58 | 7 |
| EDP (n= 10) | 44 | 48 | 8 |
| Χ2 | 1.45 | 1.79 | 0.08 |
| P | 0.23 | 0.18 | 0.77 |
| FGFR3 | Χ2=36.55 p<0.00001 | ||
| LDP (n= 15) | 24 | 52 | 24 |
| EDP (n= 1) | 63 | 32 | 4 |
| Χ2 | 31.76 | 7.9 | 16.39 |
| P | 0.00001 | 0.005 | 0.00005 |
| CSF1R | Χ2=1.41 p=0.49 | ||
| LDP (n=13) | 19 | 56 | 24 |
| EDP (n=6) | 13 | 61 | 26 |
| Χ2 | 1.41 | 0.4 | 0.08 |
| P | 0.23 | 0.53 | 0.78 |
| MET | Χ2=0.09 p=0.96 | ||
| LDP (n=16) | 24 | 49 | 27 |
| EDP (n=11) | 23 | 52 | 27 |
| Χ2 | 0.06 | 0.08 | 0.01 |
| P | 0.81 | 0.78 | 0.93 |
| CDKN2A | Χ2=12.49 p=0.002 | ||
| LDP (n=6) | 16 | 42 | 42 |
| EDP (n=3) | 23 | 58 | 19 |
| Χ2 | 1.56 | 5.12 | 12.48 |
| P | 0.21 | 0.02 | 0.0004 |
| ERBB2 | Χ2= 2.80 p= 0.25 | ||
| LDP (n=15) | 20 | 52 | 28 |
| EDP (n= 10) | 27 | 54 | 19 |
| Χ2 | 1.36 | 0.08 | 2.25 |
| P | 0.24 | 0.78 | 0.13 |
| SMAD4 | Χ2=12.78 p=0.002 | ||
| LDP (n=5) | 37 | 53 | 10 |
| EDP (n=14) | 23 | 48 | 29 |
| Χ2 | 4.67 | 3.02 | 11.5 |
| P | 0.03 | 0.08 | 0.0007 |
| CCNE1 | Χ2=0.52 p=0.77 | ||
| LDP (n=5) | 15 | 39 | 46 |
| EDP (n=14) | 17 | 42 | 41 |
| Χ2 | 0.15 | 0.19 | 0.51 |
| P | 0.7 | 0.67 | 0.48 |
CN= copy number. LDP= later disease progression. EDP= early disease progression. P-value calculated by Chi-square test (Χ2). False Discovery rate (FDR)=0.006.
Table 5.
Logistic regression results based on primary tumor site. (a) Reported scores of statistical analyses per probe. (b) Quality control metrics for the overall model with reported AUC.
Table 5.
Logistic regression results based on primary tumor site. (a) Reported scores of statistical analyses per probe. (b) Quality control metrics for the overall model with reported AUC.
| (a.) Probe | Score | Effect Size | 95% CI | z value | p-value | |
|---|---|---|---|---|---|---|
| CKS1B | -40 to -10 | 0.72-0.88 | 0.07-1.00 | -1.19 | 0.232 | |
| FGFR3 | -30-2 | 0.59-0.74 | 0.15-0.98 | -1.25 | 0.212 | |
| CSF1R | 90 | 0.70 | 0.30-0.92 | 1.91 | 0.056 | |
| MET | 80 | 0.70 | 0.33-0.91 | 2.11 | 0.035 | |
| CDKN2A | 70-80 | 0.77-0.88 | 0.23-1.00 | 1.61 | 0.107 | |
| ERBB2 | 60-80 | 0.62-0.95 | 0.43-0.99 | 3.45 | 0.001 | |
| SMAD4 | 50-90 | 0.90-1.00 | 0.39-1.00 | 2.00 | 0.046 | |
| (b.) Performance Metrics | ||||||
| PseudoR2 | 0.44 | |||||
| p-value | 5.23 x 10⁻¹⁵ | |||||
| Sensitivity | 0.68 | |||||
| Specificity | 0.89 | |||||
| AUC | 0.902 | |||||
CI = confidence interval. AUC= area under the ROC curve.
Disclaimer/Publisher’s Note: The statements, opinions and data contained in all publications are solely those of the individual author(s) and contributor(s) and not of MDPI and/or the editor(s). MDPI and/or the editor(s) disclaim responsibility for any injury to people or property resulting from any ideas, methods, instructions or products referred to in the content. |
© 2024 by the authors. Licensee MDPI, Basel, Switzerland. This article is an open access article distributed under the terms and conditions of the Creative Commons Attribution (CC BY) license (http://creativecommons.org/licenses/by/4.0/).
Copyright: This open access article is published under a Creative Commons CC BY 4.0 license, which permit the free download, distribution, and reuse, provided that the author and preprint are cited in any reuse.


