
Submitted:
15 June 2024
Posted:
17 June 2024
You are already at the latest version
Abstract
Inflammation is the body’s response to infection, injury, or other stimuli. Acute inflammation is a crucial component of the immune system’s defense, aimed at eliminating infected or damaged cells and halting disease progression. A subtle interaction between pro- and anti-inflammatory processes determines its progression to inflammation resolution or to chronic inflammation. In this study, we propose a generic model of inflammation through a system of reaction-diffusion equations involving various inflammatory and anti-inflammatory cells and cytokines. We investigate the formation of patterns, determined by the emergence of Turing structures, through linear stability analysis and numerical simulations. These theoretical findings are further supported by observations of similar patterns in skin diseases.
Keywords:
inflammation
; modelling
; pattern formation
; Turing structures
1. Introduction
1.1. Biological Background
Inflammation is an important mechanism participating in the immune response to harmful stimuli. Many cellular and molecular pathways are activated during the inflammatory process [1]. Inflammation has some disease-specific features, but the mechanism of the immune response is generic [2]. It starts with the identification of primary stimuli by cell surface patterns recognition receptors (PRRs). PRRs are proteins whose role is to sense a specific type of dangerous stimuli such as DAMPs (Damage-associated molecular pattern molecules) or PAMPs (Pathogen-associated molecular pattern molecules). The recognition process leads to the activation of intra-cellular signalling pathways such as NF-B, MAPK and JAK-STAT pathways which causes gene transcription activation on the cellular level. Therefore, numerous inflammatory agents such as inflammatory cytokines and chemokines are released [3]. Then, immune cells migrate from the bloodstream to the region of inflammation [4]. After the set-up of the immune response, inflammatory agents are mobilized in order to restore homeostasis and to resolve inflammation. In fact, an effective anti-inflammatory process is needed to promote the reduction of inflammation [5]. The sensors of blood-circulating monocytes do not detect stimuli, monocytes are not recruited to the site of inflammation. Conversely, in cases of uncontrolled inflammation, acute inflammation fails to stop tissue damage, leading to chronic inflammatory conditions. This imbalance contributes to the progression of various inflammatory diseases such as cancer [6], atherosclerosis [7] or skin diseases [8].
In the process of immune response, immune cells perform significant and crucial functions. A major step in the immune response is the recruitment of immune cells to the area of inflammation such as T cells, lymphocytes and monocytes. T cells are a type of leukocytes that differentiate into several subtypes such T helper Th1 and Th2 and regulate the maturation of monocytes into macrophages [9]. Th1 cells are considered pro-inflammatory because they secrete INF[10] to activate M1 type macrophages as shown in Figure 1. Classically activated macrophages (M1) produce pro-inflammatory cytokines, promote elimination of affected tissue cells and inhibits cell proliferation. In contrast, alternatively activated macrophages (M2 type) are induced by Il-4 and IL-13 produced by Th2 cells [11]. Unlike M1 macrophages, M2 macrophages promote cell repair and cells proliferation [12]. Similarly to macrophages, inflammatory cytokines can be categorized into two types: pro-inflammatory and anti-inflammatory. Pro-inflammatory cytokines, such as TNF-, IL-12, and IL-6, are produced to enhance inflammation. In contrast, IL-10, IL-4 and TGF- are anti-inflammatory cytokines produced to down-regulate inflammation [13] by inhibiting the production of pro-inflammatory cytokines by macrophages. For example, anti-inflammatory cytokines has an effect on the production of inflammatory cytokines such as IL-1, TNF-, and IL-6 [14,15]. As macrophages produce more inflammatory cytokines, additional immune cells become activated causing the recruitment of even more immune cells to the inflammation site.
Inflammation plays a major role in skin diseases since it is essential for defending against infection and injury but can also lead to chronic skin conditions when uncontrolled. For example, acne results from inflammation of hair follicles and sebaceous glands [16]. Another skin disease example is eczema (atopic dermatitis) which causes the skin to become dry and itchy. Eczema is a type of dermatitis that can be caused by an overactive immune system to allergens or irritants. This disease is considered as an itchy inflammatory skin disease that touches one out of four school-aged children [17]. The emergence of such diseases starts by the disruption of the human skin [18]. The defense mechanism of the skin is composed of three layers that are the barrier of the skin, innate immunity and acquired immunity [19]. Human skin functioning is controlled by a complex network of cellular interactions that regulate essential physiological processes, including immune responses and inflammation. Several factors can cause a defect in the epidermal barrier such as genetics, obesity, excessive smoking and alcohol consumption [20,21]. The effect of such risk factors leads to genetic mutations and impairment of the epidermal barrier functions [22]. Epigenetic modification impacts the activity of the transcription of genes resulting to the translation of new mRNA and metylation of DNA. Therefore, they affect the functioning, polarization of cells and the secretion of cytokines [20]. As a result, skin inflammation can arise depending on the presence of immune cells, inflammatory cytokines profiles and the intensity of the immune response. Abnormal pro-inflammatory cytokines production by macrophages and dendritic cells leads to dysfunctional immune responses and emergence of several inflammatory skin diseases [23]. Some inflammatory skin diseases such as Psoriasis are depicted by an increase in the concentration of pro-inflammatory cytokines correlated with a severe chronic inflammation [24]. Atopic Dermatitis is highlighted by an abnormal immune response including enhanced type 2 inflammation correlated by overexpression of inflammatory cytokines (IL-4 and IL-13). Type 2 inflammatory cytokines inhibit the expression of epidermal proteins (FLG) and promote the itch-scratch cycle by activating neurons [25]. Hence, a dysfunction in the inflammatory processes induces loss of epidermal integrity, chronic inflammation of the skin, and increased sensitivity to infections. As a result, many symptoms appear on the skin such as red papules and plaques. Several approaches are considered in order to suppress the inflammatory process particularly the production of pro-inflammatory cytokines. For example, SOCS proteins regulates the signaling of pro-inflammatory cytokines through the modulation of the JAK/STAT pathway [24].
1.2. Modelling of Inflammation
Theoretical modelling of inflammation is tackled by different approaches particularly the study of inflammation initiation due to respiratory infections [26]. Authors present a system of nonlinear ordinary differential equations to study the interactions between macrophages, pro-inflammatory, bacteria and anti-inflammatory cytokines. The study shows that an inflammatory state can set-up depending on the model parameters. According to [26], anti-inflammatory cytokines helps to reduce the intensity of inflammation. Mathematical modelling is a valuable tool to understand the interplay between pro-inflammatory and anti-inflammatory signaling [27]. The study presents a mathematical model to describe the interplay between Tumor Necrosis Factor (TNF) and IL-10 inflammatory cytokines in monocytes. Based on experimental data collection, authors show the role of IL-10 early feedback in switching the inflammation. Several studies describes the propagation of inflammation in tissue as a reaction-diffusion wave [28,29], in particular, in atherosclerosis models. The interplay between macrophages, pro-inflammatory cytokines and oxidized low-density lipoproteins (ox-LDL) triggers the set-up of inflammation.
1.3. Pattern Formation
Spatiotemporal patterns formation is widely manifested in various systems far from the thermodynamic equilibrium and exchanging matter and energy with the environment [30]. A. Turing suggested that organ formation in living organisms occurs due to the instability of a spatially homogeneous state in a system of interacting chemicals (morphogens) distributed over the growing embryo [31]. The non-homogeneous distribution of the concentrations of these chemicals influences the behavior of cells leading to their differentiation and organ formation. There are some experimental confirmations of this mechanism, in particular, for the growth of birds’ feathers [32], for the branching pattern of lungs [33], the formation of fingers [34], and the left-right asymmetry of body organs [35]. Turing instability has been also identified in many non-biological systems [36,37,38,39].
The conditions of the emergence of dissipative structures in a two-component systems can be formulated in terms of short-range activation and long-range inhibition, since one of the variables, referred to as a self-activator, should upregulate its own production at the uniform stationary state, and another variable should be a self-inhibitor, acting in the opposite way. Moreover, the diffusion coefficient of the self-inhibitor should be sufficiently higher than that of the self-activator. It is worth noting, that although this is the general concept for emergence of Turing patterns in the systems with greater number of variables as well [40,41], another possibilities for Turing patterns formation exist in multicomponent systems, that can bypass the requirement of short-range activator and long-range inhibitor [42]. However, this requirement is strictly necessary for two-component systems.
Pattern formation in biomedical models can be determined by different mechanisms. As such, the interaction of inflammation and chemotaxis can result in formation of fatty streaks in atherosclerosis [43]. Turing instability was suggested as the mechanism of pattern formation in Crohn’s disease [44]. In this work we study pattern formation in a generic model of inflammation with short-range activation (inflammation) and long-range inhibition (anti-inflammation) mechanism.
2. Model of Immune Response and Inflammation
Inflammation as a part of the immune response includes several steps common for different diseases. They are based on the interaction of different immune cells (monocytes, macrophages, lymphocytes) and cytokines as described in Figure 1. We formulate in this section a generic model of inflammation and reduce it to a simpler two-equation model in order to perform its stability analysis.
2.1. Generic Model of Inflammation
We formulate the model of inflammation for the concentrations of pro- and anti-inflammatory monocytes, macrophages, lymphocytes and cytokines. Equations for pro-inflammatory and anti-inflammatory monocytes and are considered in the following form:
The constants and characterize the rate of monocytes penetration through the vessel wall, and are the densities of the corresponding monocytes in blood, and is death rate of and monocytes. Cell influx depends on the concentration of inflammatory cytokines with saturation. [45]. Thus, the first term in the right-hand side of this equation represents the influx of monocytes from the blood [46], the second term describes the differentiation of monocytes into macrophages [47,48,49], and the third term corresponds to the death of monocytes.
Next, in the equations for macrophages and :
the first term characterizes the differentiation of monocytes into macrophages [47,48,49], the second term describes transformation of macrophages into foam cells [50] in the case of atherosclerosis but it can be canceled for other diseases, and the third term corresponds to the death of macrophages.
Equations for T-helper cells and :
model the influx of T-cells from the blood (similar to monocytes) [46] and death of T-cells. Here and are the rates of cell penetration, and are the densities of and cells in blood, and are the death rates of and cells.
Equations for T-helper cytokines (IFN-, IL-1) and (IL-4, IL-13):
describe productions of cytokines and by T-lymphocytes with the rates and . They promote the differentiation of and monocytes into and macrophages with rate constants and and consumed (internalized) due to this interaction [48]. The third term corresponds to the degradation of cytokines with the rate constants and .
Equation for pro-inflammatory cytokines (IL-6, IL-12 and TNF-):
Macrophages produce pro-inflammatory cytokines with the rate constant activating endothelial cells [48]. The second term corresponds to the degradation of cytokines with the rate . Anti-inflammatory cytocines downregulate production. Equation for anti-inflammatory cytokines (IL-10 and TGF-):
2.2. Reduced inflammation model
In order to study pattern formation in the model of inflammation, we will formally reduce system (1)-(10) to a system of two equations. This reduction is based on the approximations of detailed equilibrium for some variables (fast and slow variables) and on the assumption that some constants are small and the corresponding terms can be neglected. The simplified model provides a starting point for further investigations of the complete model without these assumptions.
Equating zero the right-hand side of equation (3) for , we get
Similar, from equation (4),
3. Pattern Formation
3.1. Analysis of Non-Spatially-Distributed System
Denoting for convenience , , we obtain the non-spatially-distributed system, considered in this section:
all the parameters of which are positive. The nullclines of the system (18) are
The first nullcline, referred to as A-nullcline, is a pair of lines, intersecting at . The second nullcline, B-nullcline, is a hyperbola with the asymptotes , always situated in the left half-plane, and , always has a positive slope and intersects the ordinate axis in the lower half-plane. B-nullcline goes through the point , touching the abscissa axis at it, and it has a positive second derivative equal to .
The system (18) has a stationary state for all values of parameters. As Figure 2 illustrates, depending on the values of parameters, the system can have one or two stationary states in the first quadrant, where the solutions have physical meaning. Note that the phase vectors are not defined at the lines and where one of the denominators of system (18) vanish, but they do not belong to the first quadrant.
In order to identify the parameter region, where the system has one or two stationary states in the first quadrant, it is useful first of all to retrieve the conditions, under which the nullclines touch each other in the first quadrant. They can be obtained by consideration of the following system, which respresent the conditions, that the nullclines have the same first derivative at their common point:
Its straightforward transformation gives the following conditions for the touching of the nullclines in the first quadrant (see example in Figure 2a):
From the geometrical reasoning it is clear that there are two stationary states in the first quadrant if the slope of the second line of A-nullcline is greater than the slope in the case of touching the B-nullcline, but not greater than the slope of its asymptote (see Figure 2b):
The case of one stationary state in the first quadrant, apart from the case of touching of nullclines, described by Eqs. (20), is realised in the situation, when the slope of the second line of A-nullcline is greater than the slope of the asymptote of the B-nullcline (see Figure 2c):
or in a borderline situation, when their slopes are equal, but the second line of A-nullcline lies higher than the asymptote of the B-nullcline (see Figure 2d):
The Jacobian matrix at the stationary state is as follows:
which indicates that this point is always a stable node. According to the second Poincaré Index Theorem [52], the neighbouring simple stationary state along the B-nullcline can be only a saddle. Therefore, in the cases of one stationary state in the first quadrant, described by Eqs. (22) and (23), this state in always unstable. In the case of two stationary states in the first quadrant, described by Eqs. (21), the state with smaller coordinates is also unstable. The stability of the stationary state with greater coordinate is a less trivial question, and it seems to be dependent on the specific values of parameters. Further we will consider the case, corresponding to Figure 2, fixing the values , , and varying the value of . In this case, there exist a stable stationary state in the region :
that can be checked by straightforward calculations. This state corresponds to persistent inflammation under strong enough activation of corresponding cytokines.
3.2. Turing Structures in a Spatially-Distributed System
In this section, we consider a spatially-distributed system
focusing on the formation of stationary non-uniform structures in it, i.e., the Turing patterns. Their emergence is determined by the system linearized at a corresponding stationary state [31]. For simplicity of calculations, we set here , and consider as a parameter of the problem. In general case of a system
where and denote the perturbations of the stationary state, the conditions for Turing instability can be formulated in the following way:
The first two inequalities ensure the stability of a corresponding stationary state in the absence of diffusion, while the third condition indicates that in its presence the modes with some wavelengths become unstable, eventually producing a non-uniform stationary pattern. Of note, the formation of Turing structures in the considered system (26) is impossible around the uniform stationary state due to the fact, that both variables there act as self-inhibitors, downregulating their own production at the uniform stationary state, which follows from Eq. (24).
As it was mentioned in Section 3.1, in the region there exists a stationary state with coordinates , , which is stable in the absence of diffusion implying the fulfillment of the first two conditions for Turing instability around this state. The third condition, applied to the system (26), turns into the inequality
Figure 3 depicts the part of the region in the parametric space where this condition is also fulfilled, and the formation of the Turing patterns can take place. Note that the diffusion coefficients should not differ very much, i.e., the value of already results in the Turing instability for every considered value of . This is crucial from the biological point of view, since diffusivities of different cytokines can hardly differ an order of magnitude or more under identical conditions.
Turing patterns formation for the considered system was studied numerically in the two-dimensional square domain. The size of the domain was chosen to be sufficiently large in order for several of the unstable wavelengths to fit it under any of the used parameter sets. As initial conditions we consider a sufficiently strong local perturbation of the form
which corresponds to the local initiation of the plaque formation process. The simulations were performed with the C++ implemented code. Zero flux conditions were considered at the boundaries. The equations were solved using the method of splitting into physical processes, i.e., at each time step, the reaction and diffusion terms were calculated sequentially. The space step was chosen to be sufficiently small to correctly reproduce the emerging structures; the time step was chosen in order to minimize the computation time while maintaining the functionality of the implicit Crank-Nicholson method, used to solve the diffusion equations, and the fourth order Runge-Kutta method, used to solve the reaction equations. It was verified that the refinement of discretization does not qualitatively affect the result.
An important moment is that numerical simulations of the considered system (26) demonstrated unrestrained growth of solutions under sufficiently high values of and . This is related to the fact that the model describes only the initial stage of inflammation progression. There are various other anti-inflammatory mechanisms initiated at more advanced stages of inflammation [53,54]. Moreover, there are some simplifying assumptions in the model, such as cell influx is not limited and cytokines production is a linear function of cell concentration without limitation mechanisms. In order to implicitly account for the fact of restrained inflammation growth, the following restrictions were introduced and implemented within the program code:
the functions of and being defined in Eqs. (25). The value of the constant is considered as parameter. We will return to this question in the discussion, and we will prove that the solution is bounded under some conditions on parameters (Appendix).
Figure 4 shows the dynamics of Turing patterns formation under for different values of parameters and , the most right snapshots displaying visually stabilized patterns. Depending on the parameter values, the considered system can exhibit several qualitatively different ways of self-completion of initial local excitation into Turing patterns. Some aspects of the shown dynamics correspond to the ones, previously reported for other classical nonlinear systems [55,56,57].
Close to the boundary of the Turing instability region under low values of , the spot-like structures eventually appear. In this case, as shown in Figure 4a, initial excitation results in the propagation of a circular wave, and the values of model variables in its interior region oscillate around the stationary state . The spots close to the initial excitation arise in result of the rotational symmetry breaking of these oscillatory tails. The positions of the spots, situated further from the initial excitation, are strongly affected by their proximity to the boundaries of the computational domain. Under higher values of , as Figure 4b demonstrates, the rotational symmetry breaking does not happen and the resulting patterns represent concentric circles, deformed due to the boundary effects.
Deeper in the Turing instability region, the nature of the patterns changes drastically. Under higher values of and sufficiently low values of , this process begins with the elongating of the initial spot in one direction, along which it has a slightly increased ratio of activator to inhibitor. The evolution of the developed snakelike structures, that can tear, corrugate and fuse together, may result in stripes, aligned in one direction, as illustrated by Figure 4c, or in labyrinth patterns, as exemplified by Figure 4d, as well as in various transient patterns. Under sufficiently high values of the initial excitation transforms into thick spot, which develops into Turing pattern via consecutive symmetry breaking, as Figure 4e shows.
Interestingly, the choice of the value of by itself affects the form of the emerging patterns. For example, Figure 5a shows the evolution of the considered system under the values of model parameters, corresponding to Figure 4c, but under greater value of . In this case, the spot-like structures begin to break apart after the initial elongation, eventually resulting in a domain covered in spots, rather than parallel stripes. Under further increase of for the same values of and , the initially formed spot-like structure becomes much more stable and retains its shape during the numerical simulation (at least until ). However, such localized structure can be perturbed by external noise. Sufficiently strong noise can result in displacement of the structure, and even stronger noise can lead also to its self-completion. Figure 5b illustrates the corresponding numerical simulation, where the random number in the range is added to the values of both variables at every grid point at every time step. Note that during the simulation these perturbations once add up to disturbance sufficiently strong to initiate a new localized structure near the left boundary.
4. Discussion
We suggest in this work a generic model of inflammation, which includes the main cell types involved in this process, and pro- and anti-inflammatory cytokines. After some simplifications, we reduce this model to a two-equation model since the analysis of the complete model would be excessively difficult, and it would not give an analytical result.
Inflammatory diseases. Inflammation is a complex physiological process including many cell types, cytokines and chemokines with multiple interactions between them and various positive and negative feedbacks. We can represent these multiple factors as two big groups, pro-inflammatory and anti-inflammatory factors. Pro-inflammatory factors stimulate their own production and the production of anti-inflammatory factors, while the latter downregulate the production of both of them. This kind of interaction together with diffusion (or random motion for cells) can result in a non-homogeneous spatial distribution of these factors leading to the formation of lesions (or plaques). Inflammatory skin diseases manifest spectacular examples of different plaques. Among them, linear, target, multiform and serpiginous plaques, which are also observed in modelling results (Figure 6 and Figure 7).
We hypothesize that the interaction of pro- and anti-inflammatory factors determine the lesion shape, size, and growth rate. Mathematical modelling shows that in the presence of only pro-inflammatory factors, the lesion grows as a single circular plaque, which is not the case for the majority of patients. The presence of different plaque forms (Figure 6 and Figure 7) confirms the hypothesis about the role of anti-inflammatory factors in their formation.
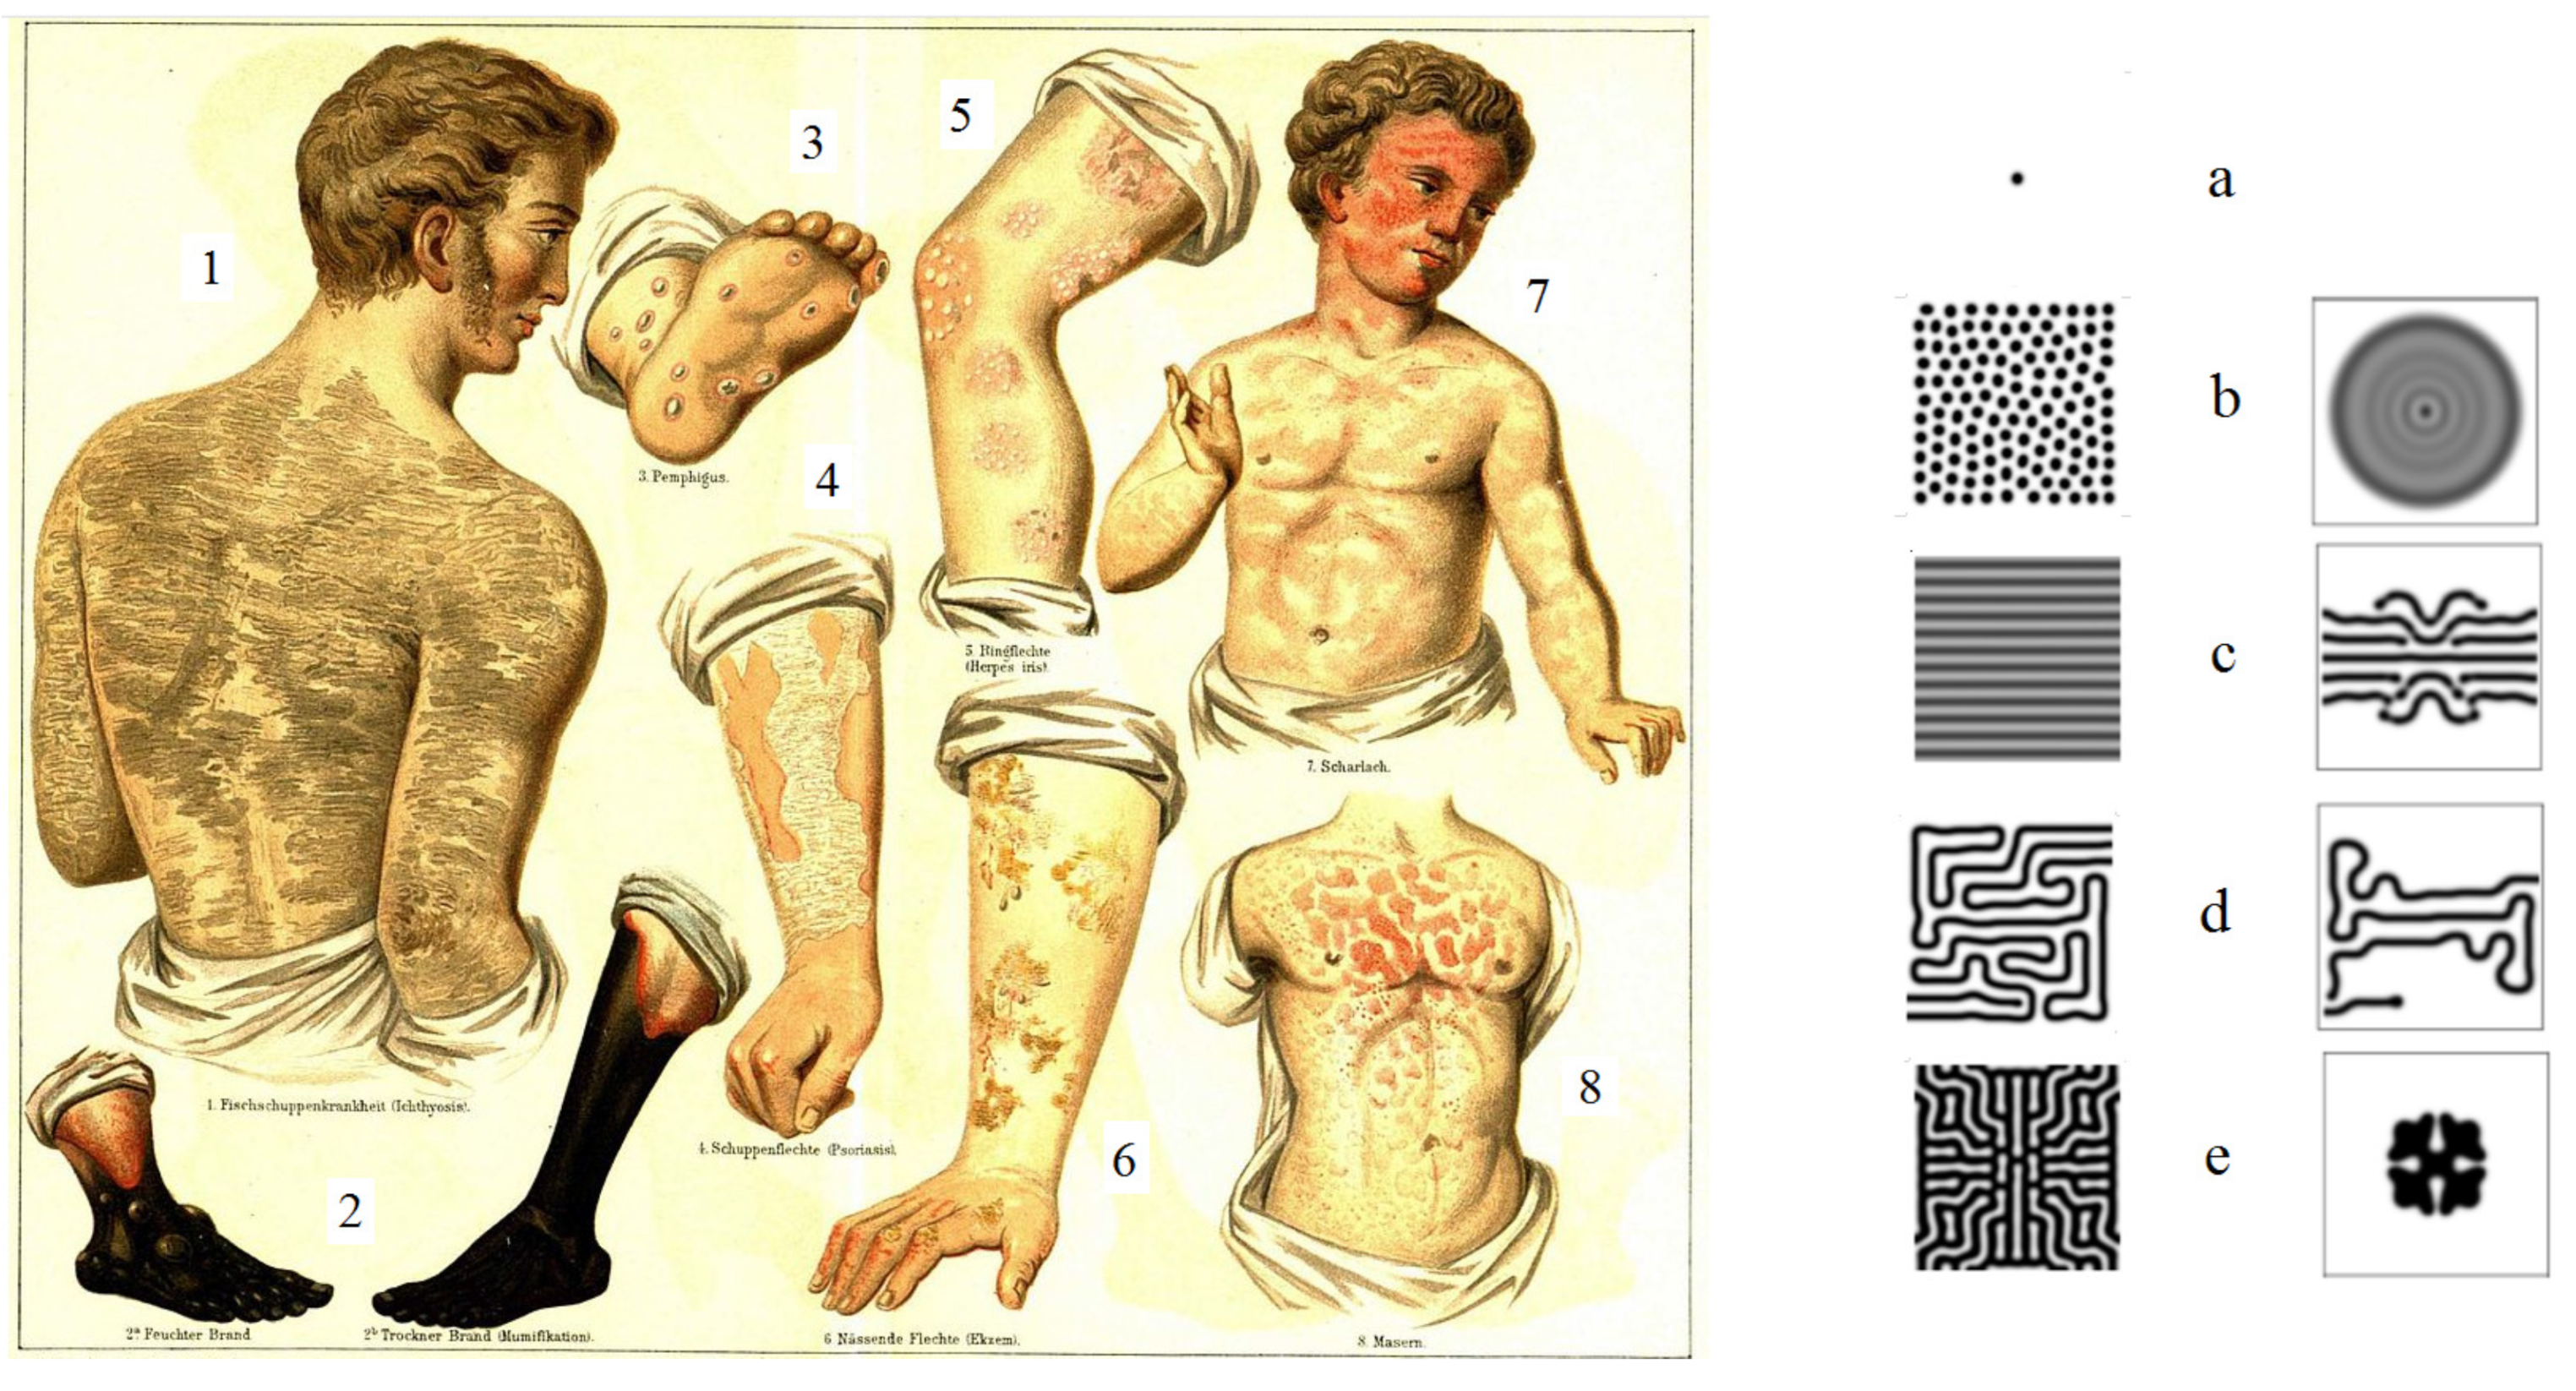
We consider as example skin lesions observed in eczema. Figure 6 shows linear and target lesions and the corresponding patterns obtained in numerical simulations. Figure 7 presents drawings of some other lesions with different structures. Most of them have some similarities with the simulated structures. Cases 1 and 7 correspond to stripe patterns c, case 3 to single dot and case 5 to multiple dot patterns a and b. Case 6 resembles the transient cross pattern e (right), and case 8 the labyrinth pattern d.
Short range activation - long range inhibition. Conditions of the emergence of dissipative structures imply that the diffusion coefficient of inhibitor is greater than the diffusion coefficient of activator. Activating and inhibiting pathways include cells (monocytes, macrophages, foam cells, smooth muscle cells, T-helper cells) and cytokines. Molecular weights of pro-inflammatory cytokines (IL-6 - 26 kDa, IL-12 - 70 kDa, TNF- - 17.3 kDa) is an average greater that of anti-inflammatory cytokines (IL-10 - 18 kDa, TGF- (active form) - 12 kDa). Since the diffusion coefficient is in inverse proportion to the power of molecular weight, then anti-inflammatory cytokines diffuse faster.
The motion of pro- and anti-inflammatory monocytes and macrophages is similar to each other. However, foam cells, being among the main sources of pro-inflammatory cytokines, do not move. On the other hand, smooth muscle cells migrate to form fibrous cap and to protect the plaque from further influx of monocytes. Though we do not explicitly consider smooth muscle cells in the model, the cytokines which determine their migration, such as platelet-derived growth factor (PDGF) and heparin binding epidermal growth factor (HB-EGF) produced by macrophages, TGF- and so on [58,59], indirectly downregulate the influx of monocytes. In the framework of our model they can be considered as anti-inflammatory factors.
Thus, in spite of the complexity of atherogenesis and numerous factors involved in this processes, faster diffusion of anti-atherogenetic factors seems plausible.
Wave propagation. Reduced inflammatory model developed in this work has from one to three non-negative stationary points. Their number and stability depend on the parameters of the model. Besides stable zero stationary point, the model can have one more stable and unstable points. Therefore, it is a bistable case, and the transition from the disease-free stationary point to a disease stationary point occurs if the initial perturbation is sufficiently large.
If we consider a spatially distributed system with a localized in space initial perturbation of the disease-free equilibrium, then transition to the disease equilibrium occurs in the form of travelling waves. Existence and stability of such waves in the two-equation pro-inflammatory system was studied in [28]. Transition waves for more complete pro- and anti-inflammatory systems will be studied in the subsequent works. Let us only mention here that in the pro-inflammatory model the disease equilibrium is stable. Wave propagation describes growth of a single circular plaque. In the case of pro- and anti-inflammatory model, the disease equilibrium can become unstable. In this case, the solution behind the wave is non-homogeneous in space, and we obtain multiple plaques with different shapes.
Random perturbations of cell and cytokine concentrations specific for physiological systems can be essential at the initial stage of plaque growth. After the initiations, small randomly located lesions can merge and form a single plaque, as it is the case of the process is dominated by pro-inflammatory factors, or they can evolve to a multiple plaque with a complex lesion structure under the influence of anti-inflammatory factors.
Limitations and perspectives. Studying inflammatory diseases, we encounter the usual difficulties of the biomedical modelling: physiological processes are too complex, they contain many unknown or partially known factors, the values of kinetic parameters are basically unknown. In this case, we have to rely on qualitative models which are in agreement with established physiological data. We have to simplify the model grouping them into two classes, pro- and anti-inflammatory.
Some of the kinetic constants are estimated in the literature, some other are considered as free parameters and varied in numerical simulations. Generic inflammatory model, obtained by a formal reduction from a more complete model, contains a relatively small number of parameters. Their values are chosen from the conditions of the emergence of spatial structures. The application of these qualitative ideas and results to specific inflammatory diseases will require further investigations.
Acknowledgements
The last author has been supported by the RUDN University Strategic Academic Leadership Program.
References
- Chovatiya, R.; Medzhitov, R. Stress, inflammation, and defense of homeostasis. Mol. Cell 2014, 54, 281–288. [Google Scholar] [CrossRef]
- Chen, L.; Deng, H.; Cui, H.; Fang, J.; Zuo, Z.; Deng, J.; Li, Y.; Wang, X.; Zhao, L. Inflammatory responses and inflammation-associated diseases in organs. Oncotarget 2018, 9, 7204–7218. [Google Scholar] [CrossRef] [PubMed]
- Marchi, S.; Guilbaud, E.; Tait, S.W.G.; Yamazaki, T.; Galluzzi, L. Mitochondrial control of inflammation. Nat. Rev. Immunol. 2023, 23, 159–173. [Google Scholar] [CrossRef] [PubMed]
- Shi, C.; Pamer, E.G. Monocyte recruitment during infection and inflammation. Nat. Rev. Immunol. 2011, 11, 762–774. [Google Scholar] [CrossRef]
- Ma, Z.; Du, B.; Li, J.; Yang, Y.; Zhu, F. An insight into anti-inflammatory activities and inflammation related diseases of anthocyanins: A review of both in vivo and in vitro investigations. Int. J. Mol. Sci. 2021, 22. [Google Scholar] [CrossRef] [PubMed]
- Singh, N.; Baby, D.; Rajguru, J.; Patil, P.; Thakkannavar, S.; Pujari, V. Inflammation and cancer. Ann. Afr. Med. 2019, 18. [Google Scholar] [CrossRef]
- Henein, M.Y.; Vancheri, S.; Longo, G.; Vancheri, F. The role of inflammation in cardiovascular disease. Int. J. Mol. Sci. 2022, 23. [Google Scholar] [CrossRef]
- Tampa, M.; Neagu, M.; Caruntu, C.; Constantin, C.; Georgescu, S.R. Skin inflammation—A cornerstone in dermatological conditions. J. Pers. Med. 2022, 12. [Google Scholar] [CrossRef] [PubMed]
- Bayik, D.; Tross, D.; Haile, L.A.; Verthelyi, D.; Klinman, D.M. Regulation of the maturation of human monocytes into immunosuppressive macrophages. Blood Adv. 2017, 1, 2510–2519. [Google Scholar] [CrossRef]
- Bartlett, B.; Ludewick, H.P.; Misra, A.; Lee, S.; Dwivedi, G. Macrophages and T cells in atherosclerosis: a translational perspective. Am. J. Physiol. Heart Circ. Physiol. 2019, 317. [Google Scholar] [CrossRef]
- Tabas, I.; Lichtman, A.H. Monocyte-macrophages and T cells in atherosclerosis. Immunity 2017, 47, 621–634. [Google Scholar] [CrossRef] [PubMed]
- Mills, C.D. M1 and M2 macrophages: Oracles of health and disease. Crit. Rev. Immunol. 2012, 32, 463–488. [Google Scholar] [CrossRef] [PubMed]
- Arango Duque, G.; Descoteaux, A. Macrophage cytokines: involvement in immunity and infectious diseases. Front. Immunol. 2014, 5. [Google Scholar] [CrossRef] [PubMed]
- Wojdasiewicz, P.; Poniatowski, ŁA.; Szukiewicz, D. The role of inflammatory and anti-inflammatory cytokines in the pathogenesis of osteoarthritis. Mediators Inflamm. 2014, 2014, 1–19. [Google Scholar] [CrossRef] [PubMed]
- Schuerwegh, A.J.; Dombrecht, E.J.; Stevens, W.J.; Van Offel, J.F.; Bridts, C.H.; De Clerck, L.S. Influence of pro-inflammatory (IL-1α, IL-6, TNF-α, IFN-γ) and anti-inflammatory (IL-4) cytokines on chondrocyte function. Osteoarthritis Cartilage 2003, 11, 681–687. [Google Scholar] [CrossRef] [PubMed]
- Tanghetti, E.A. The role of inflammation in the pathology of acne. J. Clin. Aesthet. Dermatol. 2013, 6, 27–35. [Google Scholar] [PubMed]
- Brown, S.J. Atopic eczema. Clin. Med. 2016, 16, 66–69. [Google Scholar] [CrossRef] [PubMed]
- Diotallevi, F.; Offidani, A. Skin, autoimmunity and inflammation: A comprehensive exploration through scientific research. Int. J. Mol. Sci. 2023, 24. [Google Scholar] [CrossRef] [PubMed]
- Turvey, S.E.; Broide, D.H. Innate immunity. J. Allergy Clin. Immunol. 2010, 125, S24–S32. [Google Scholar] [CrossRef] [PubMed]
- Sroka-Tomaszewska, J.; Trzeciak, M. Molecular mechanisms of atopic dermatitis pathogenesis. Int. J. Mol. Sci. 2021, 22. [Google Scholar] [CrossRef]
- Sawada, Y.; Saito-Sasaki, N.; Mashima, E.; Nakamura, M. Daily lifestyle and inflammatory skin diseases. Int. J. Mol. Sci. 2021, 22. [Google Scholar] [CrossRef] [PubMed]
- Dainichi, T.; Hanakawa, S.; Kabashima, K. Classification of inflammatory skin diseases: A proposal based on the disorders of the three-layered defense systems, barrier, innate immunity and acquired immunity. J. Dermatol. Sci. 2014, 76, 81–89. [Google Scholar] [CrossRef] [PubMed]
- Yoshimura, A.; Aki, D.; Ito, M. SOCS, SPRED, and NR4a: Negative regulators of cytokine signaling and transcription in immune tolerance. Proc. Jpn. Acad. Ser. B Phys. Biol. Sci. 2021, 97, 277–291. [Google Scholar] [CrossRef] [PubMed]
- Cianciulli, A.; Calvello, R.; Porro, C.; Lofrumento, D.D.; Panaro, M.A. Inflammatory skin diseases: Focus on the role of suppressors of cytokine signaling (SOCS) proteins. Cells 2024, 13. [Google Scholar] [CrossRef] [PubMed]
- Beck, L.A.; Cork, M.J.; Amagai, M.; De Benedetto, A.; Kabashima, K.; Hamilton, J.D.; Rossi, A.B. Type 2 inflammation contributes to skin barrier dysfunction in atopic dermatitis. JID Innov. 2022, 2. [Google Scholar] [CrossRef] [PubMed]
- Herald, M.C. General model of inflammation. Bull. Math. Biol. 2010, 72, 765–779. [Google Scholar] [CrossRef] [PubMed]
- Nikaein, N.; Tuerxun, K.; Cedersund, G.; Eklund, D.; Kruse, R.; Särndahl, E.; Nånberg, E.; Thonig, A.; Repsilber, D.; Persson, A.; Nyman, E. Mathematical models disentangle the role of IL-10 feedbacks in human monocytes upon proinflammatory activation. J. Biol. Chem. 2023, 299. [Google Scholar] [CrossRef] [PubMed]
- El Khatib, N.; Genieys, S.; Volpert, V. Atherosclerosis initiation modeled as an inflammatory process. Mathematical Modelling of Natural Phenomena 2007, 2, 126–141. [Google Scholar] [CrossRef]
- El Hajj, W.; El Khatib, N.; Volpert, V. Inflammation propagation modeled as a reaction-diffusion wave. Math. Biosci. 2023, 365. [Google Scholar] [CrossRef]
- Cross, M.C.; Hohenberg, P.C. Pattern formation outside of equilibrium. Reviews of modern physics 1993, 65, 851. [Google Scholar] [CrossRef]
- Turing, A.M. The chemical basis of morphogenesis. Bulletin of mathematical biology 1990, 52, 153–197. [Google Scholar] [CrossRef] [PubMed]
- Harris, M.P.; Williamson, S.; Fallon, J.F.; Meinhardt, H.; Prum, R.O. Molecular evidence for an activator–inhibitor mechanism in development of embryonic feather branching. Proceedings of the National Academy of Sciences 2005, 102, 11734–11739. [Google Scholar] [CrossRef] [PubMed]
- Xu, H.; Sun, M.; Zhao, X. Turing mechanism underlying a branching model for lung morphogenesis. PloS one 2017, 12, e0174946. [Google Scholar] [CrossRef]
- Raspopovic, J.; Marcon, L.; Russo, L.; Sharpe, J. Digit patterning is controlled by a Bmp-Sox9-Wnt Turing network modulated by morphogen gradients. Science 2014, 345, 566–570. [Google Scholar] [CrossRef] [PubMed]
- Graham, J.H.; Freeman, D.C.; Emlen, J.M. Antisymmetry, directional asymmetry, and dynamic morphogenesis. In Developmental instability: Its origins and evolutionary implications; Springer, 1994; pp. 123–139. [Google Scholar]
- De Kepper, P.; Castets, V.; Dulos, E.; Boissonade, J. Turing-type chemical patterns in the chlorite-iodide-malonic acid reaction. Physica D: Nonlinear Phenomena 1991, 49, 161–169. [Google Scholar] [CrossRef]
- Astrov, Y.; Ammelt, E.; Teperick, S.; Purwins, H.G. Hexagon and stripe Turing structures in a gas discharge system. Physics Letters A 1996, 211, 184–190. [Google Scholar] [CrossRef]
- Spinelli, L.; Tissoni, G.; Brambilla, M.; Prati, F.; Lugiato, L. Spatial solitons in semiconductor microcavities. Physical Review A 1998, 58, 2542. [Google Scholar] [CrossRef]
- Short, M.B.; Brantingham, P.J.; Bertozzi, A.L.; Tita, G.E. Dissipation and displacement of hotspots in reaction-diffusion models of crime. Proceedings of the National Academy of Sciences 2010, 107, 3961–3965. [Google Scholar] [CrossRef] [PubMed]
- Tóth, Á.; Horváth, D. Diffusion-driven instabilities by immobilizing the autocatalyst in ionic systems. Chaos: An Interdisciplinary Journal of Nonlinear Science 2015, 25, 064304. [Google Scholar] [CrossRef] [PubMed]
- Nesterenko, A.M.; Kuznetsov, M.B.; Korotkova, D.D.; Zaraisky, A.G. Morphogene adsorption as a Turing instability regulator: Theoretical analysis and possible applications in multicellular embryonic systems. PloS one 2017, 12, e0171212. [Google Scholar] [CrossRef] [PubMed]
- Kuznetsov, M.; Polezhaev, A. Widening the criteria for emergence of Turing patterns. Chaos: An Interdisciplinary Journal of Nonlinear Science 2020, 30, 033106. [Google Scholar] [CrossRef] [PubMed]
- Younes, G.A.; Kuznetsov, M.; Khatib, N.E.; Volpert, V. Mathematical modeling of the interaction of atherosclerotic inflammation and chemotaxis: formation of fatty streaks. Submitted.
- Nadin, G.; Ogier-Denis, E.; Toledo, A.I.; Zaag, H. A Turing mechanism in order to explain the patchy nature of Crohn’s disease. Journal of Mathematical Biology 2021, 83. [Google Scholar] [CrossRef] [PubMed]
- Grudzinska, M.K.; Kurzejamska, E.; Bojakowski, K.; Soin, J.; Lehmann, M.H.; Reinecke, H.; Murry, C.E.; Soderberg-Naucler, C.; Religa, P. Monocyte Chemoattractant Protein 1–Mediated Migration of Mesenchymal Stem Cells Is a Source of Intimal Hyperplasia. Arteriosclerosis, Thrombosis, and Vascular Biology 2013, 33, 1271–1279. [Google Scholar] [CrossRef] [PubMed]
- N, O.A. Atherosclerosis; Palmarium Academic Publishing, 2013.
- Gui, T.; Shimokado, A.; Sun, Y.; Akasaka, T.; Muragaki, Y. Diverse roles of macrophages in atherosclerosis: from inflammatory biology to biomarker discovery. Mediators of inflammation 2012, 2012. [Google Scholar] [CrossRef] [PubMed]
- Ramji, D.P.; Davies, T.S. Cytokines in atherosclerosis: Key players in all stages of disease and promising therapeutic targets. Cytokine & growth factor reviews 2015, 26, 673–685. [Google Scholar]
- Almer, G.; Frascione, D.; Pali-Scholl, I.; Vonach, C.; Lukschal, A.; Stremnitzer, C.; Diesner, S.C.; Jensen-Jarolim, E.; Prassl, R.; Mangge, H. Interleukin-10: an anti-inflammatory marker to target atherosclerotic lesions via PEGylated liposomes. Molecular pharmaceutics 2013, 10, 175–186. [Google Scholar] [CrossRef] [PubMed]
- Friedman, A.; Hao, W. A mathematical model of atherosclerosis with reverse cholesterol transport and associated risk factors. Bulletin of mathematical biology 2015, 77, 758–781. [Google Scholar] [CrossRef] [PubMed]
- Han, X.; Boisvert, W.A.; Parthasarathy, S. The role of IL-10 in atherosclerosis. Atherogenesis: InTech, 2012; 361–84. [Google Scholar]
- Bautin, N.; Leontovich, E. Methods and ways of the qualitative analysis of dynamical systems in a plane. Nauka. Moscow.(Russian). Botelho, F. and Gaiko, VA (2006). Global analysis of planar neural networks. Nonlinear Anal 1990, 64, 117. [Google Scholar]
- Anderton, H.; Alqudah, S. Cell death in skin function, inflammation, and disease. Biochemical Journal 2022, 479, 1621–1651. [Google Scholar] [CrossRef]
- Nguyen, A.V.; Soulika, A.M. The Dynamics of the Skin’s Immune System. Int. J. Mol. Sci. 2019, 20. [Google Scholar] [CrossRef] [PubMed]
- Kuznetsov, M.; Kolobov, A.; Polezhaev, A. Pattern formation in a reaction-diffusion system of Fitzhugh-Nagumo type before the onset of subcritical Turing bifurcation. Physical Review E 2017, 95, 052208. [Google Scholar] [CrossRef] [PubMed]
- Kaminaga, A.; Vanag, V.K.; Epstein, I.R. A reaction–diffusion memory device. Angewandte Chemie International Edition 2006, 45, 3087–3089. [Google Scholar] [CrossRef] [PubMed]
- Muratov, C.; Osipov, V. Scenarios of domain pattern formation in a reaction-diffusion system. Physical Review E 1996, 54, 4860. [Google Scholar] [CrossRef] [PubMed]
- Newby, A.C.; Zaltsman, A.B. Fibrous cap formation or destruction—the critical importance of vascular smooth muscle cell proliferation, migration and matrix formation. Cardiovascular research 1999, 41, 345–360. [Google Scholar] [CrossRef] [PubMed]
- Gerthoffer, W.T. Mechanisms of vascular smooth muscle cell migration. Circulation research 2007, 100, 607–621. [Google Scholar] [CrossRef] [PubMed]
Figure 1.
Scheme depicting the biological phenomena of inflammation including Th1-Th2 lymphocytes, monocytes, M1-M2 macrophages, C1-C2 cytokines and C3-C4 cytokines. Inflammatory cytokines C3 (IL-6, IL-12, TNF-) induce the influx of lymphocytes and monocytes. Th1 produce C1 cytokines (IL-1, IFN-) and promote differentiation of monocytes into M1 macrophages. Similarly, Th2 produce C2 cytokines (IL-4, IL-13) and promote differentiation of monocytes into M2 macrophages. Classically activated macrophages (M1) and alternatively activated macrophages (M2) produce respectively pro-inflammatory C3 and anti-inflammatory cytokines C4 (IL-10, TGF-). C4 anti-inflammatory cytokines inhibit the production of pro-inflammatory cytokines and the differentiation of monocytes into M1 macrophages.
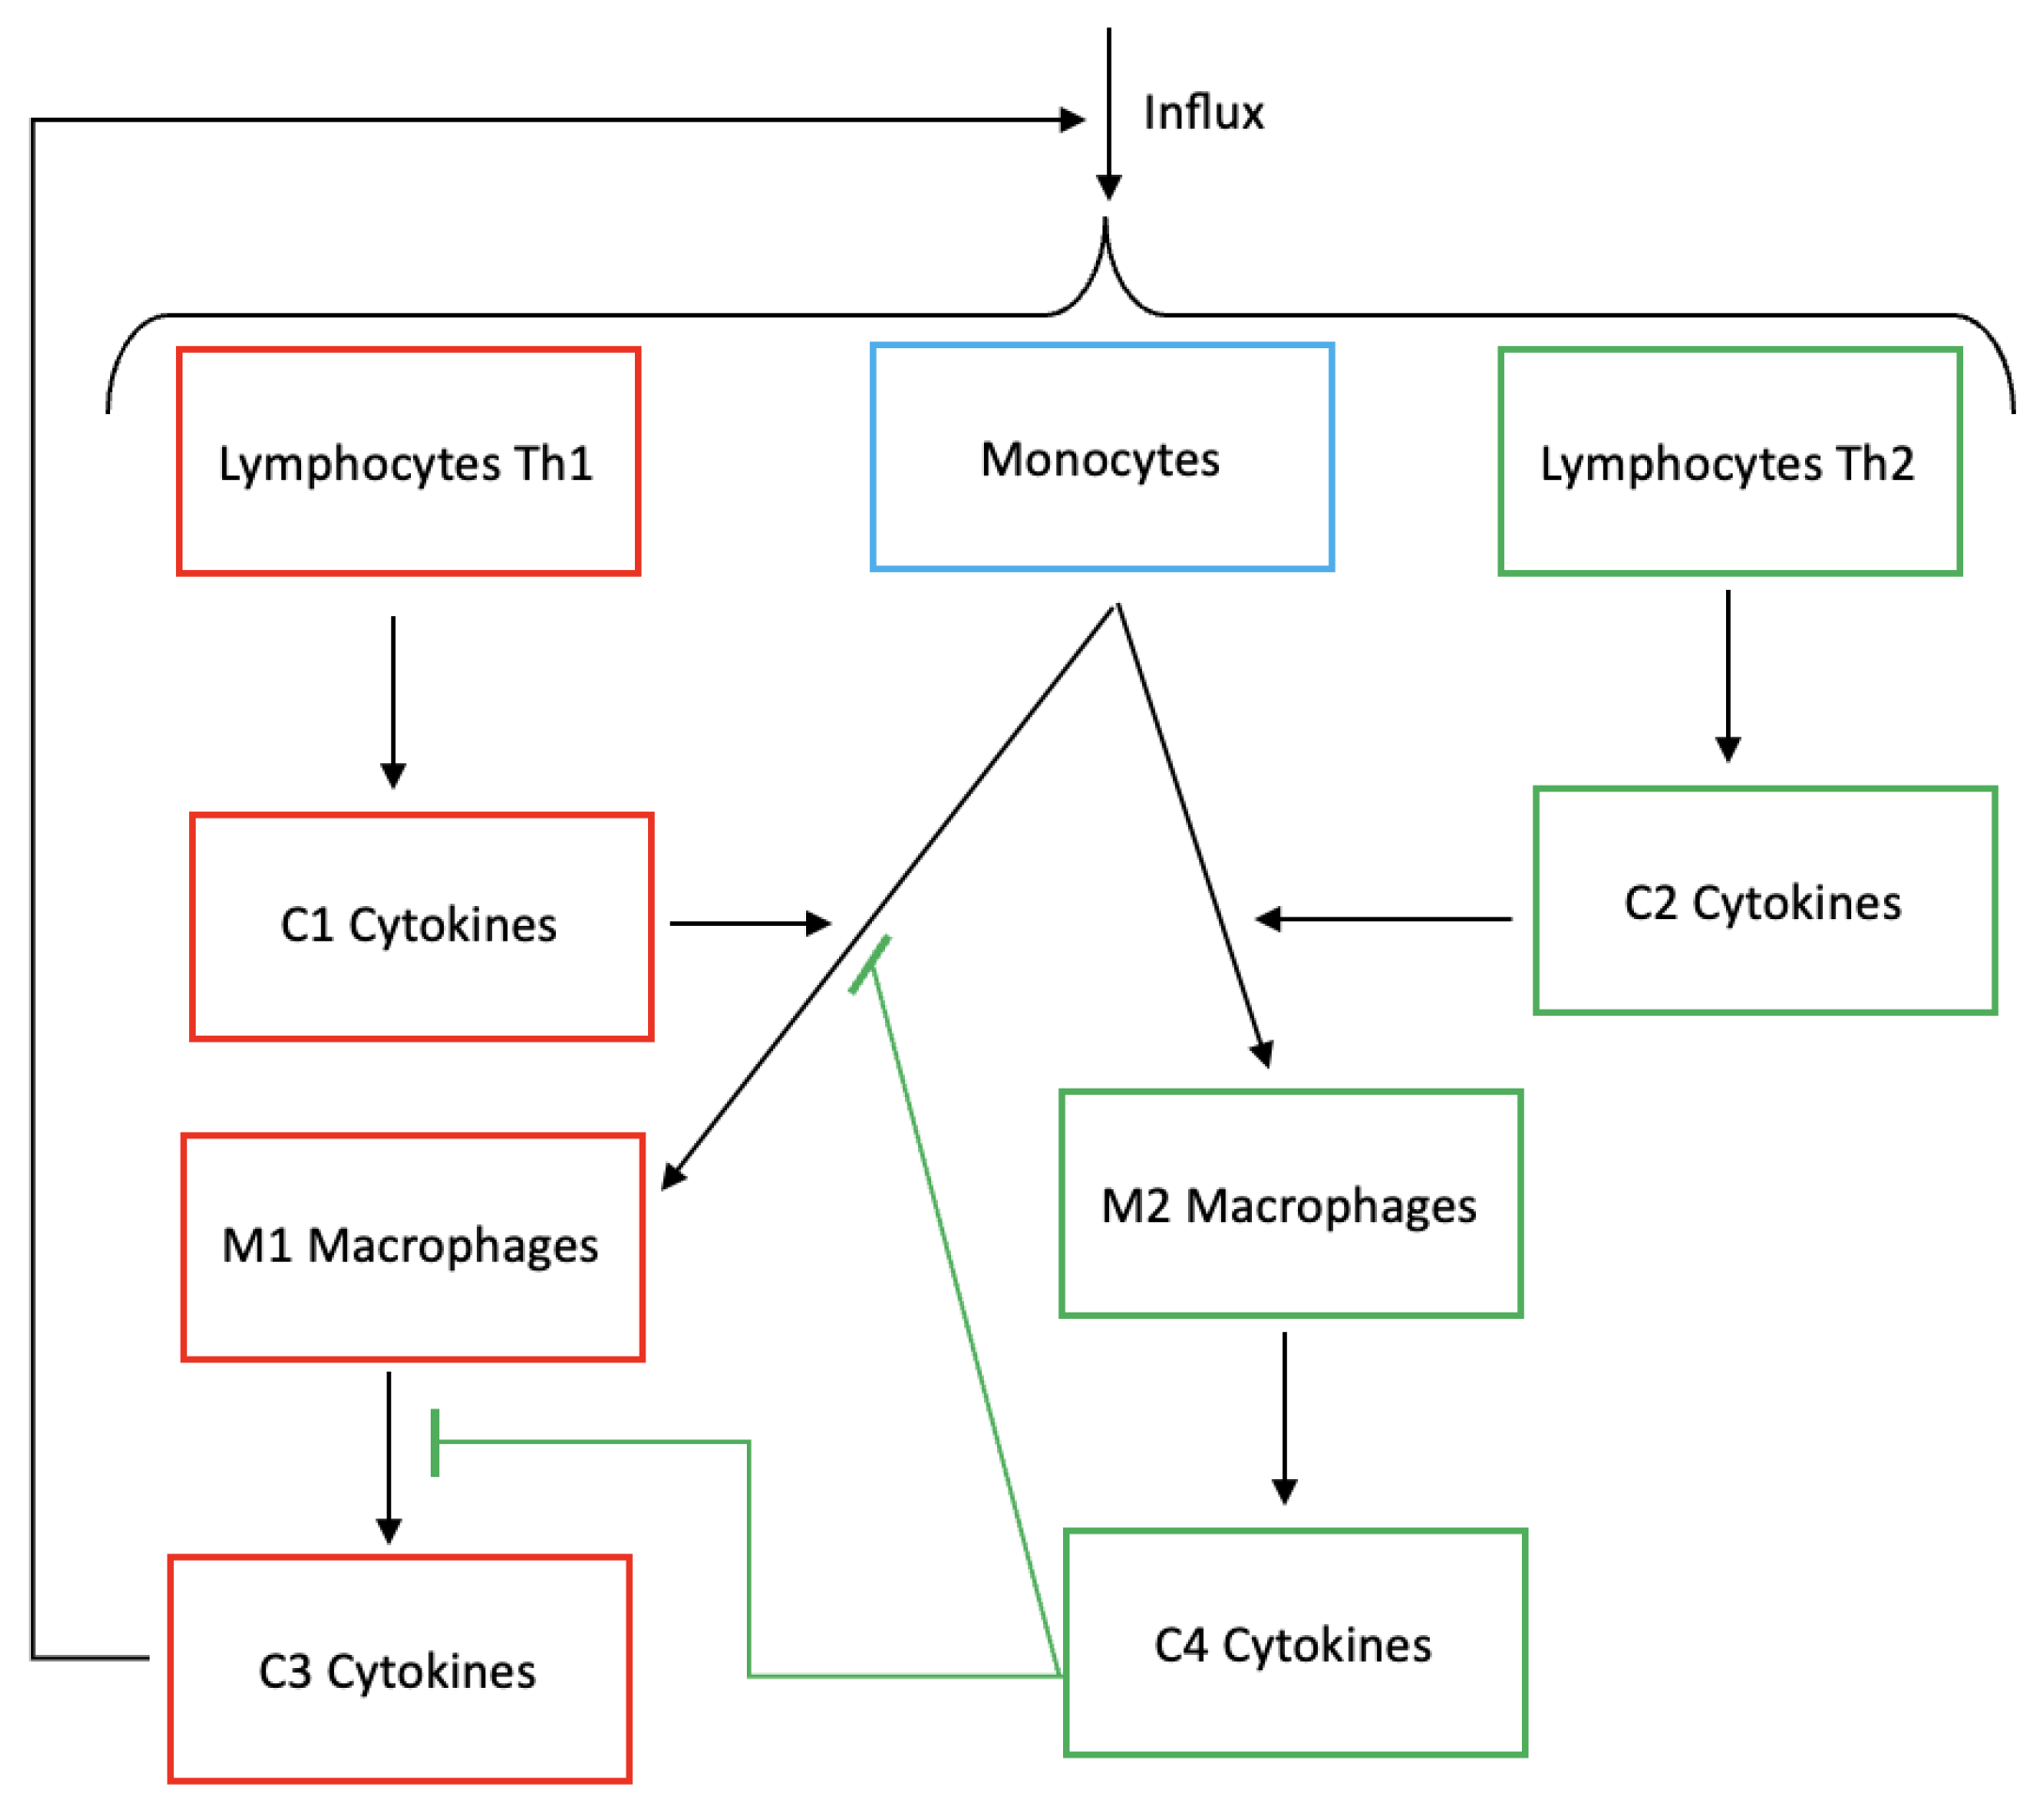
Figure 2.
Phase portraits of the system (18) under the values of parameters , and , equal to a) 4, b) 4.2, c) 6, d) 5. Red lines are A-nullclines, green solid lines are B-nullclines, green dashed lines are its asymtpotes. Gray solid lines are abscissa axes, gray dashed lines along with the vertical asymptotes are the sets, where the phase vectors are not defined.
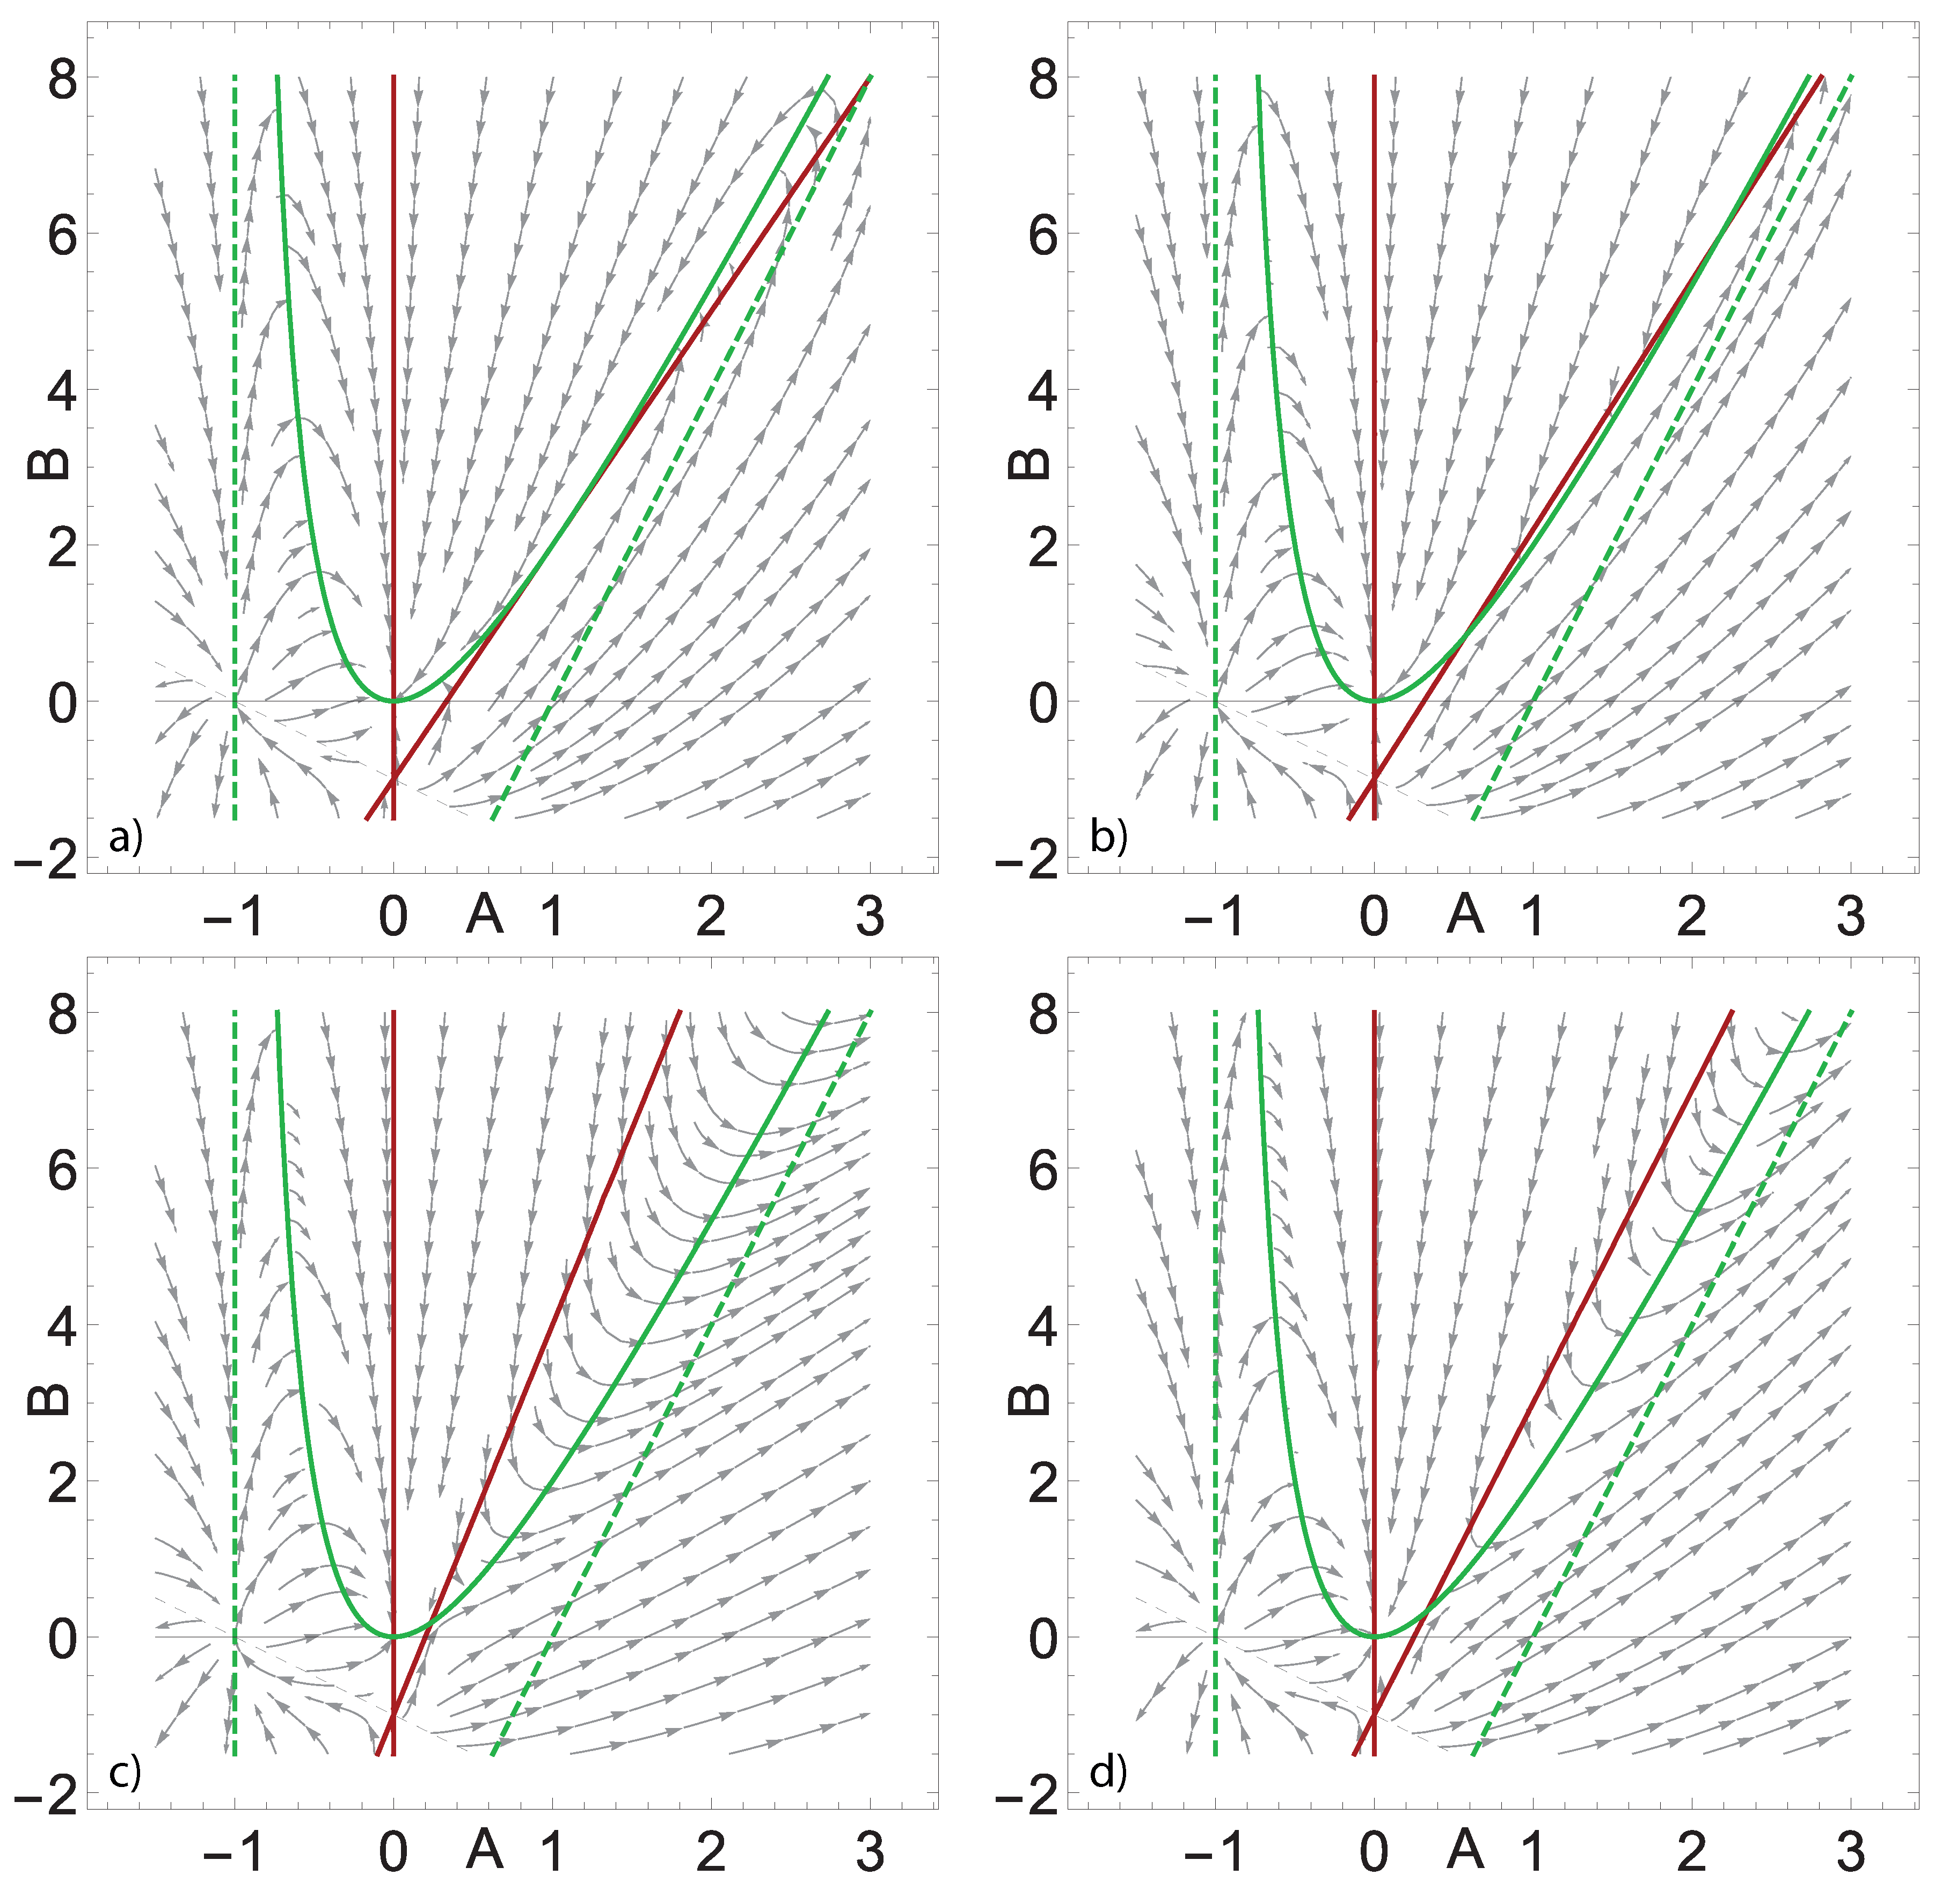
Figure 3.
Gray area denotes the region of Turing instability of the system (26) which continues with increase in .
Figure 3.
Gray area denotes the region of Turing instability of the system (26) which continues with increase in .
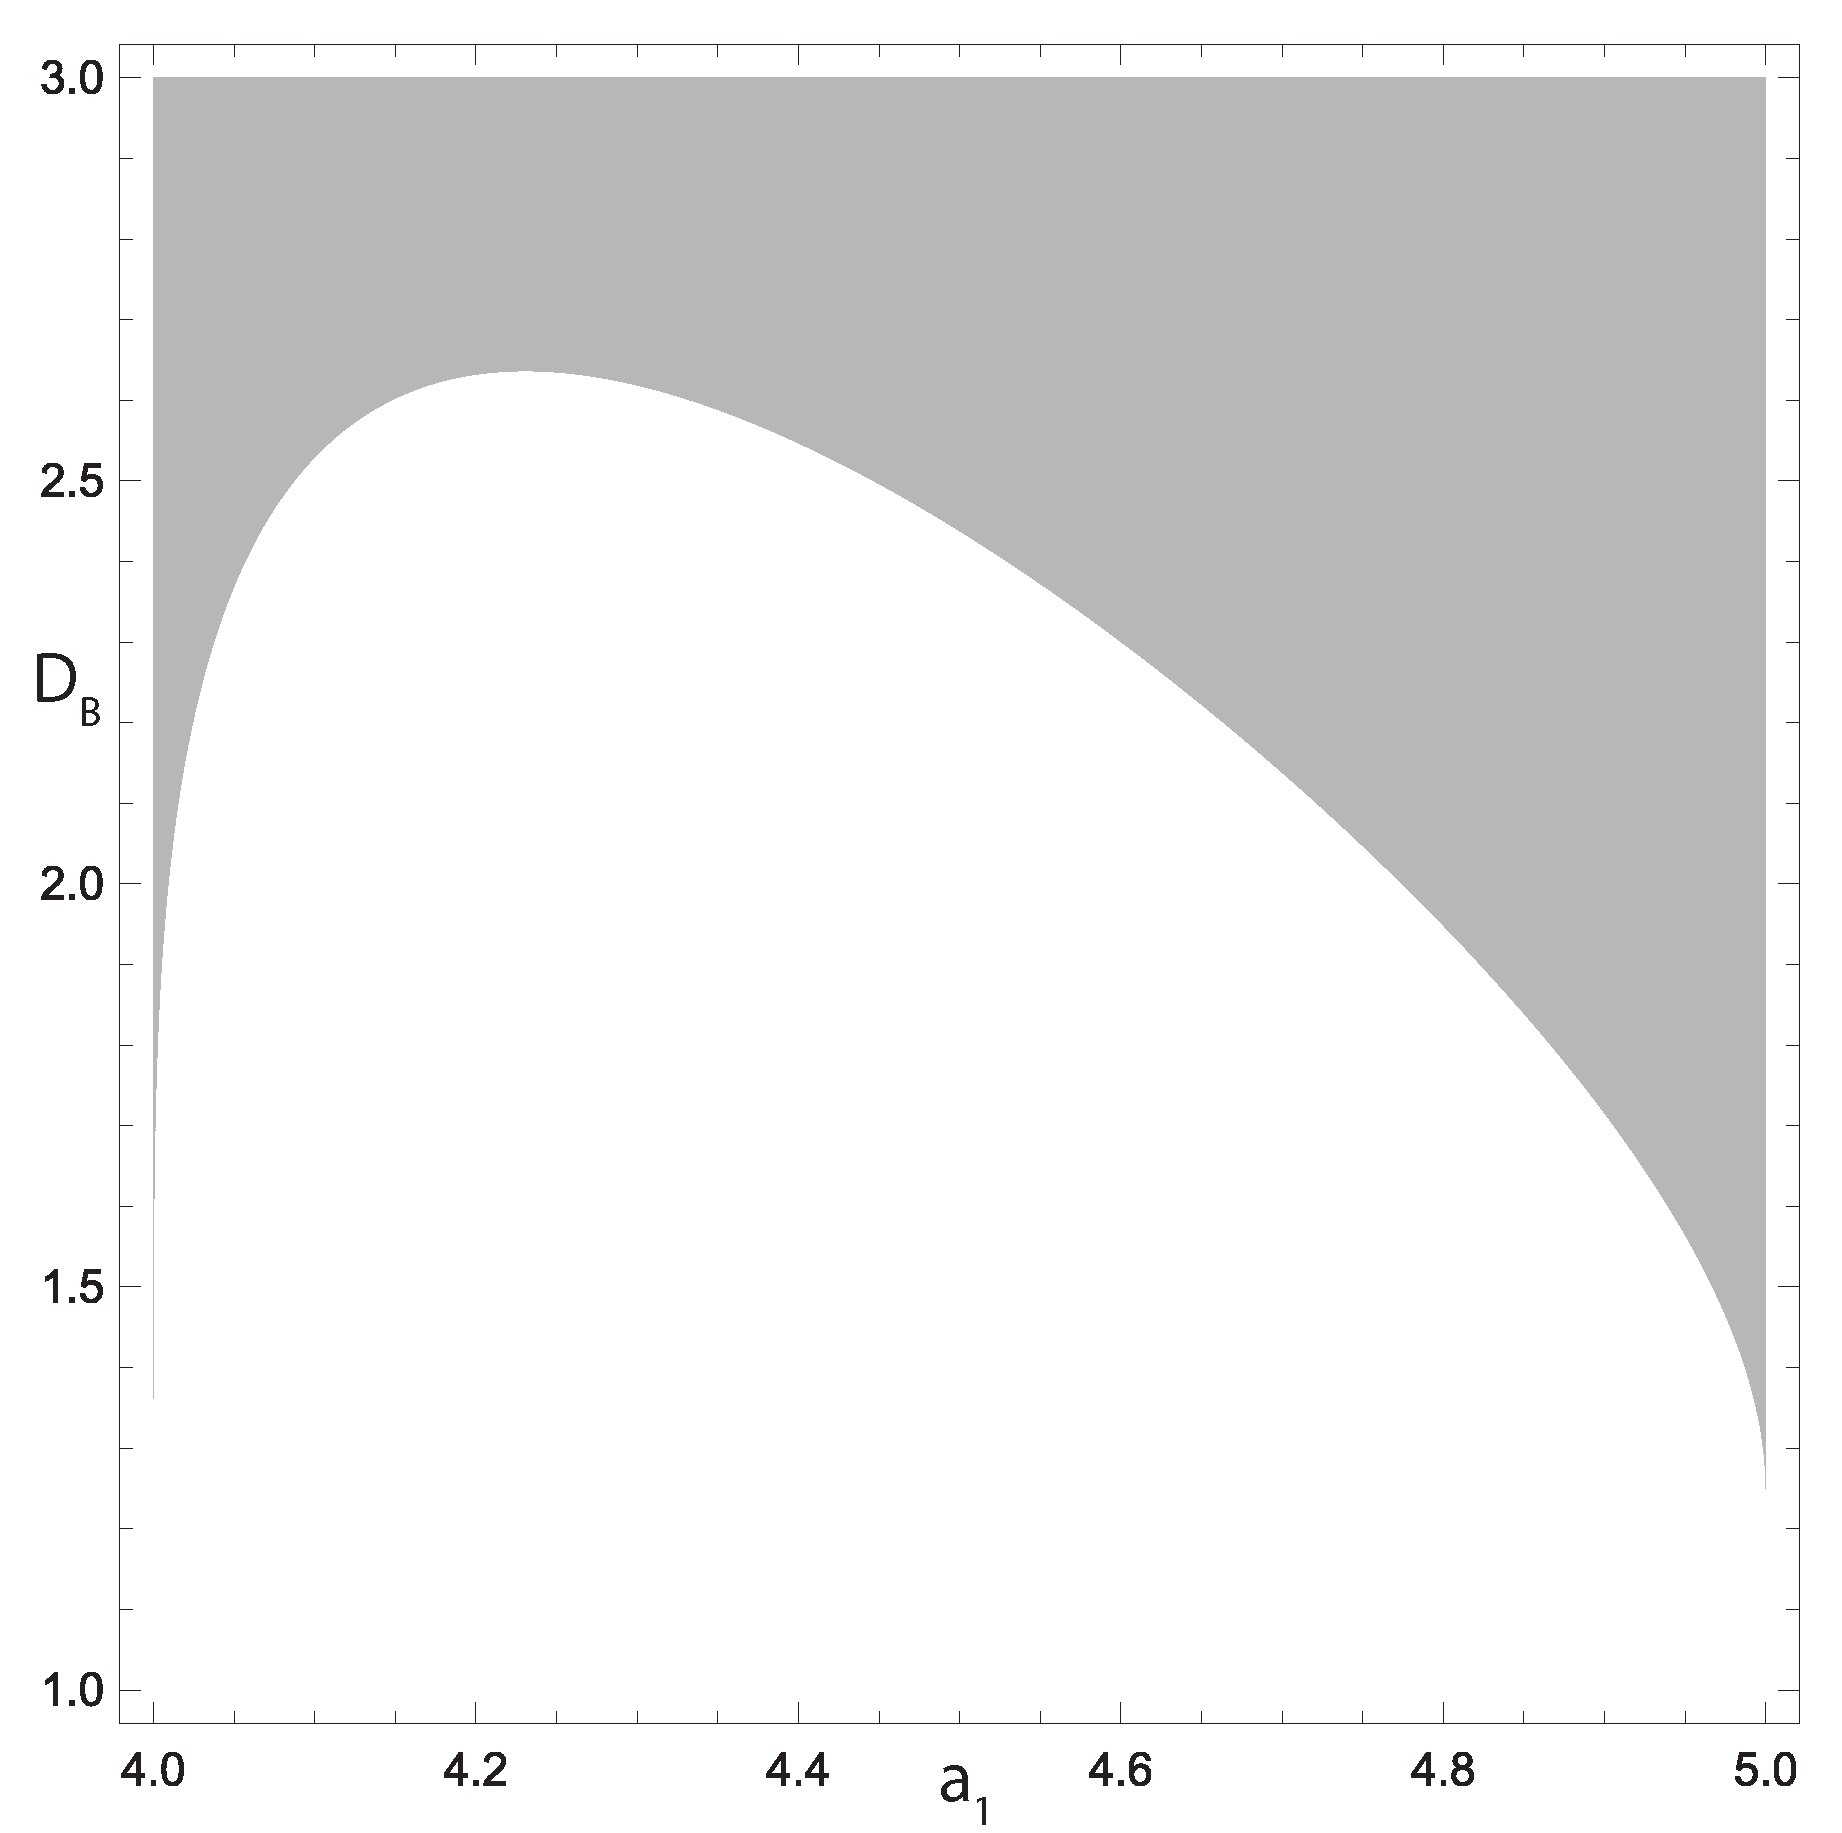
Figure 4.
Dynamics of Turing patterns formation in the system (28), . Variable A is shown. Parameters and time values (from left to right) are: (a) , ; t=200, 400, 800, 3500; (b) , ; t=200, 400, 1200, 3500; (c) , ; t=500, 900, 4700, 16000; (d) , ; t=100, 300, 7500, 35000; (e) , ; t=200, 400, 600, 6500.
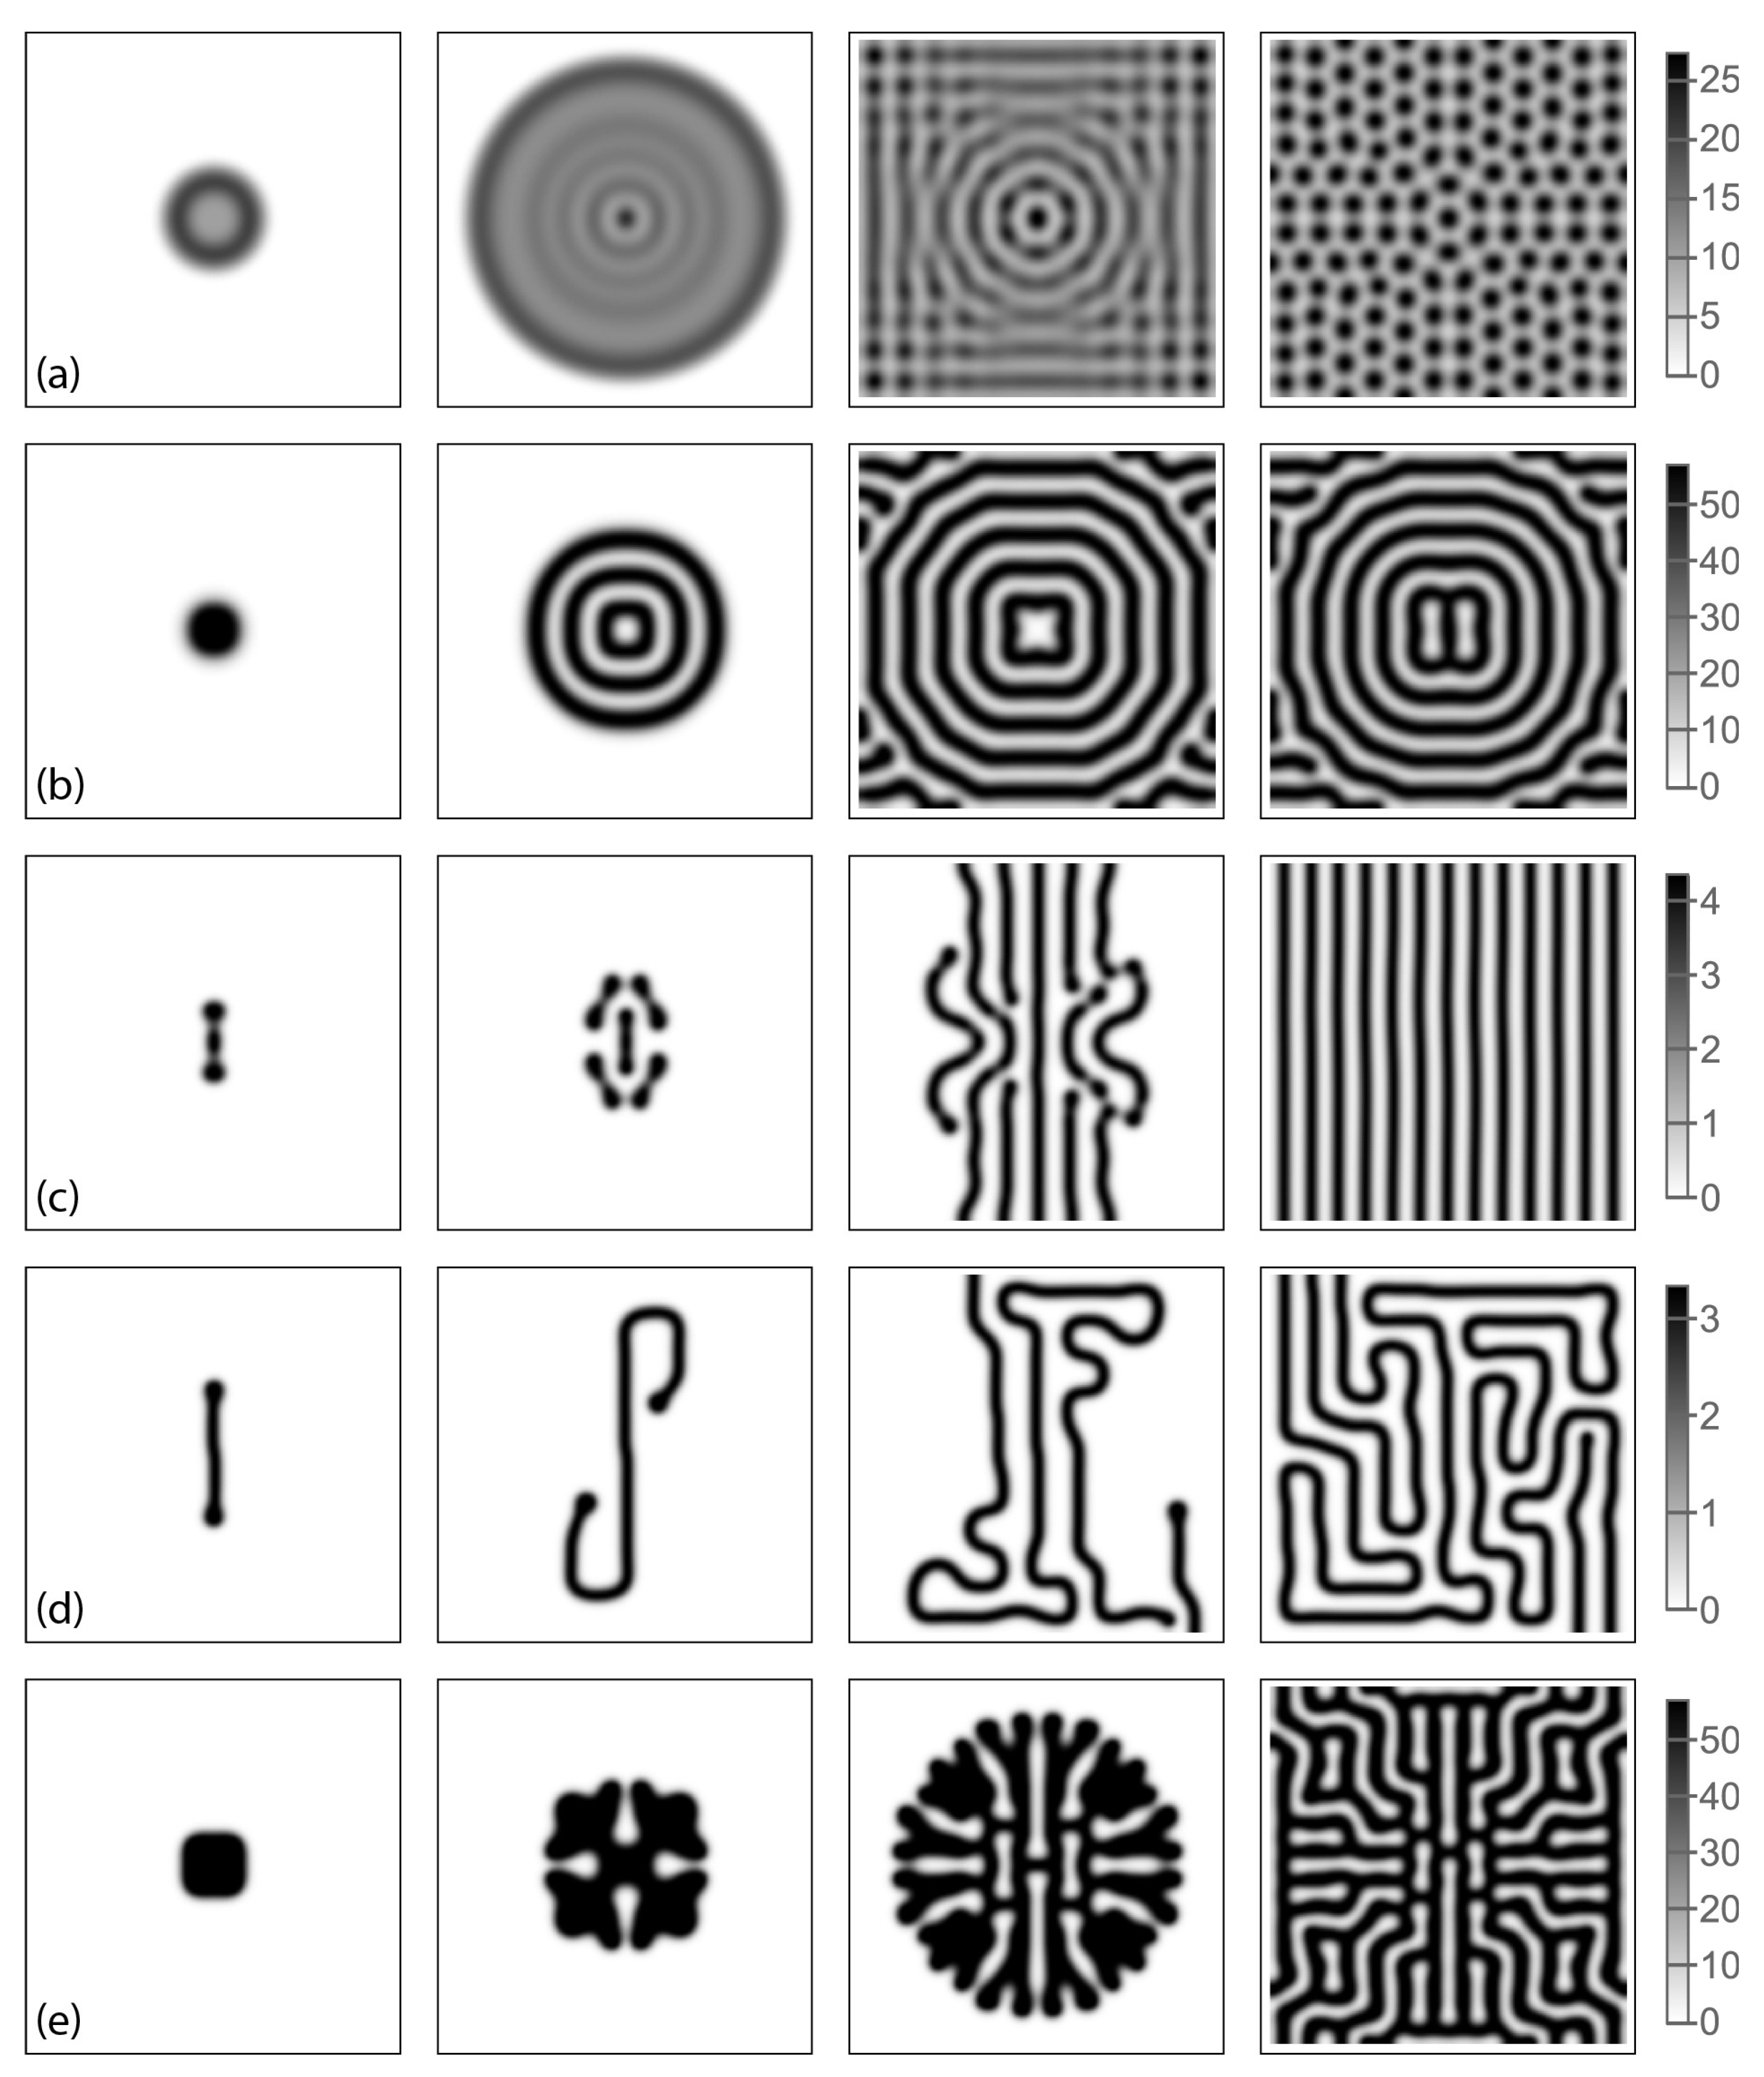
Figure 5.
Dynamics of Turing patterns formation in the system (26) under , . Variable A is shown. Restriction parameter and time values (from left to right) are: (a) ; t=60, 1500, 3000, 8000; (b) ; t=60, 200, 400, 1300; the system evolves under additional noise (see text).
Figure 5.
Dynamics of Turing patterns formation in the system (26) under , . Variable A is shown. Restriction parameter and time values (from left to right) are: (a) ; t=60, 1500, 3000, 8000; (b) ; t=60, 200, 400, 1300; the system evolves under additional noise (see text).
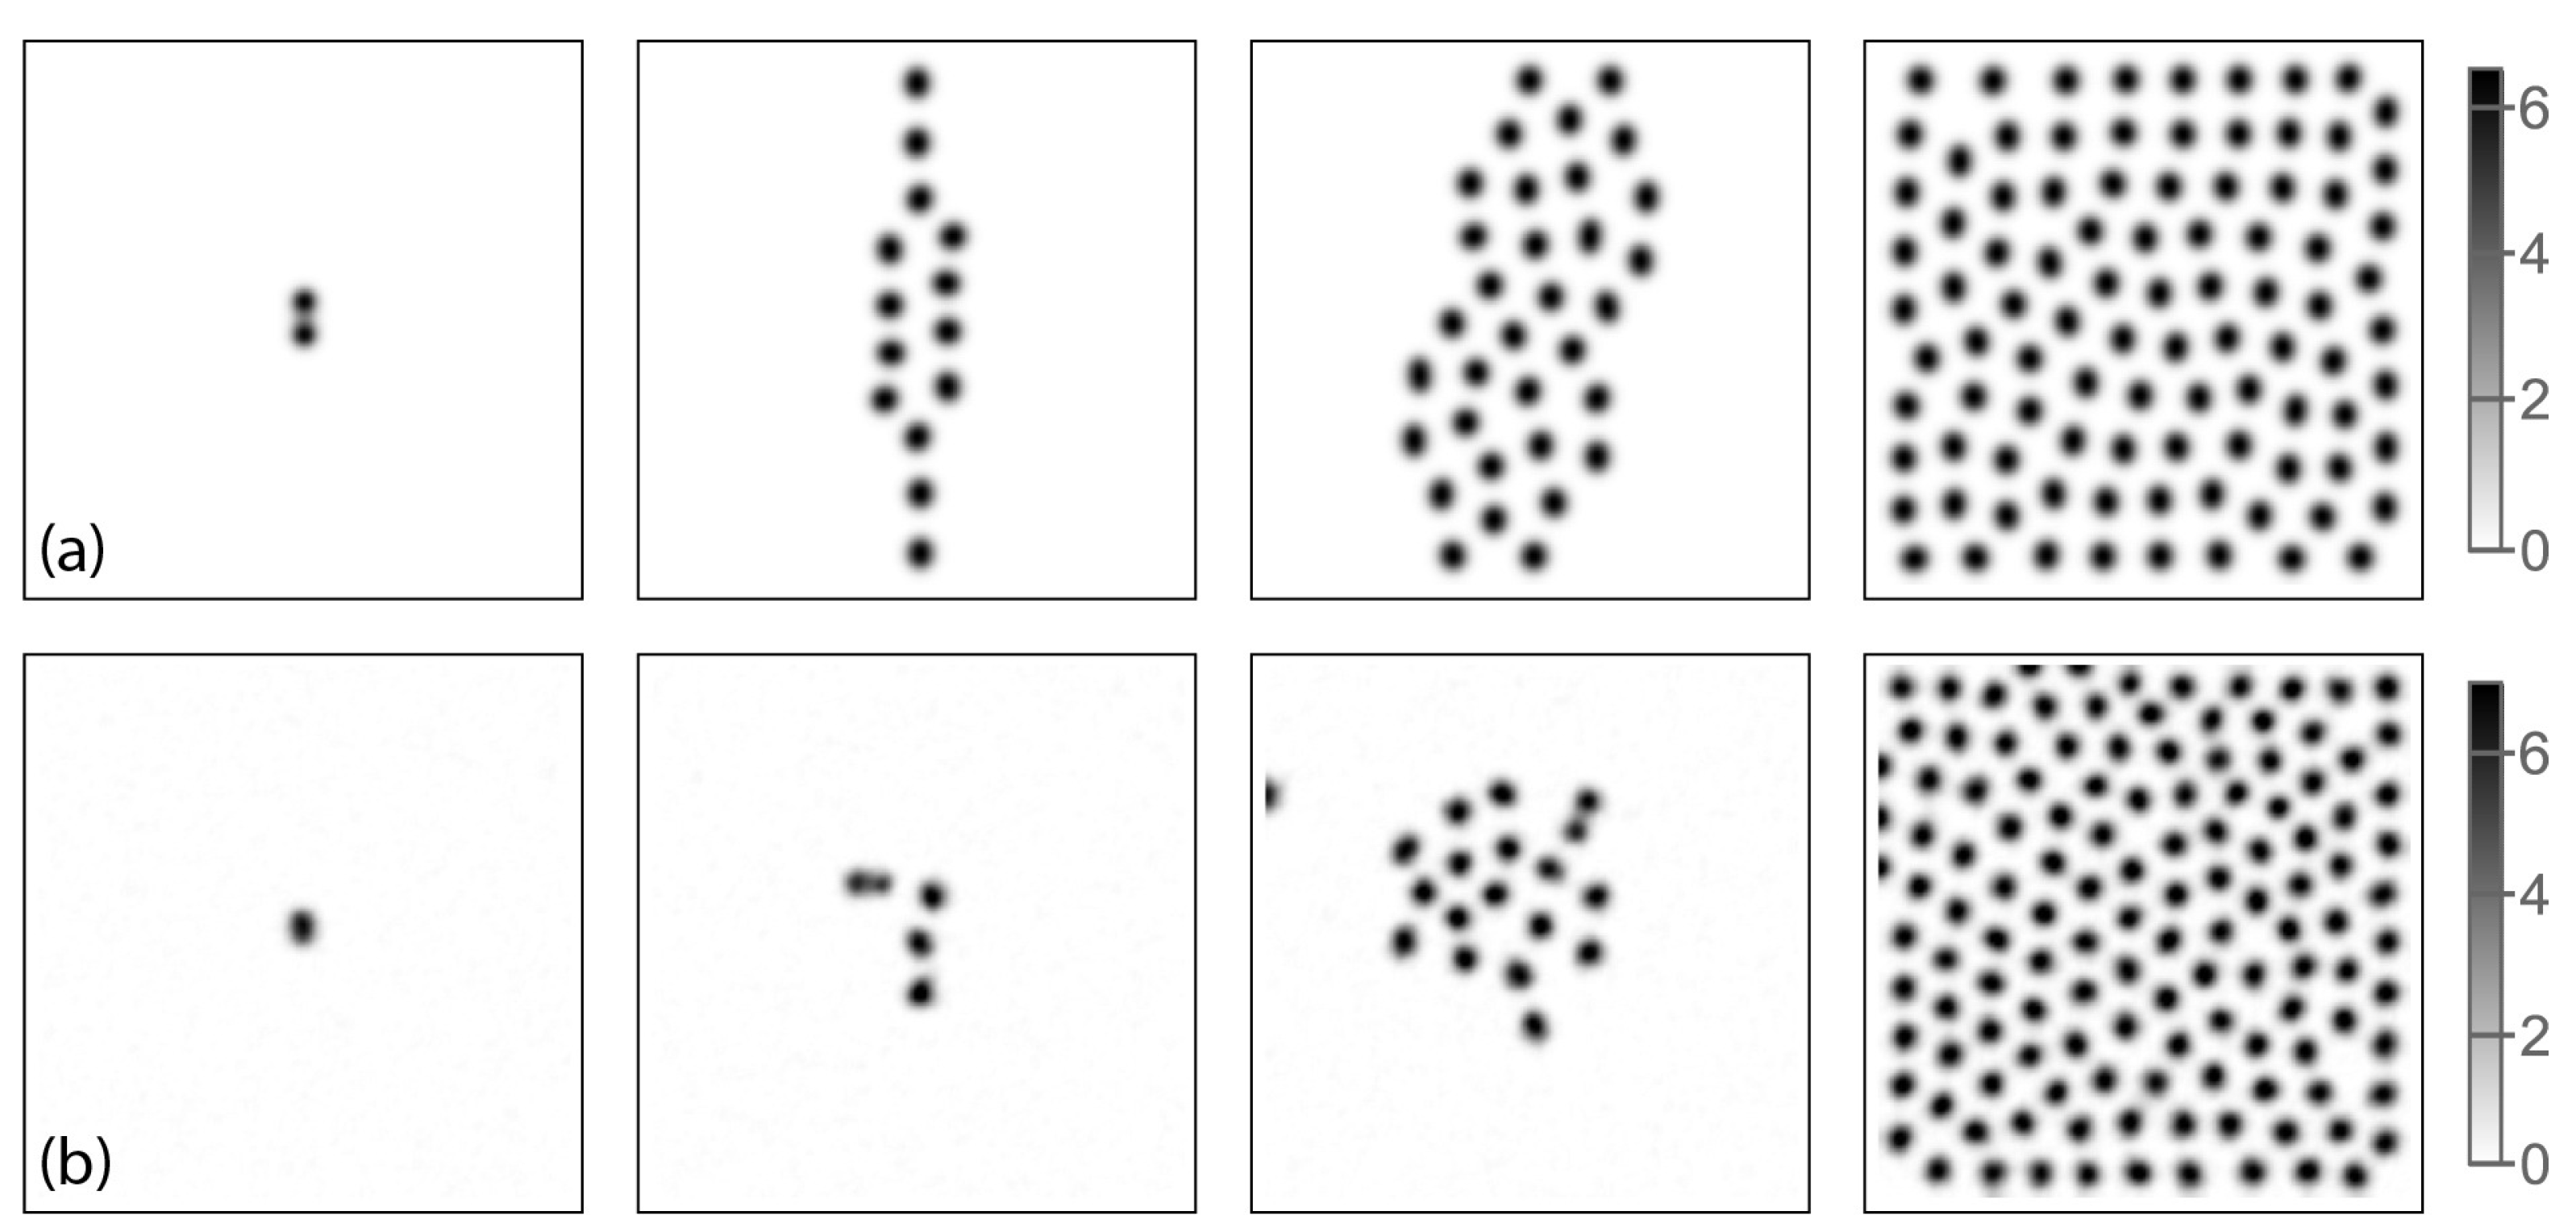
Figure 6.
Linear (left), target (middle), and multiform (right) skin lesions and numerical simulations. https://www.dermnetnz.org/topics/terminology. Let us also indicate serpiginous plaques in Figure 4 (d).
Figure 6.
Linear (left), target (middle), and multiform (right) skin lesions and numerical simulations. https://www.dermnetnz.org/topics/terminology. Let us also indicate serpiginous plaques in Figure 4 (d).
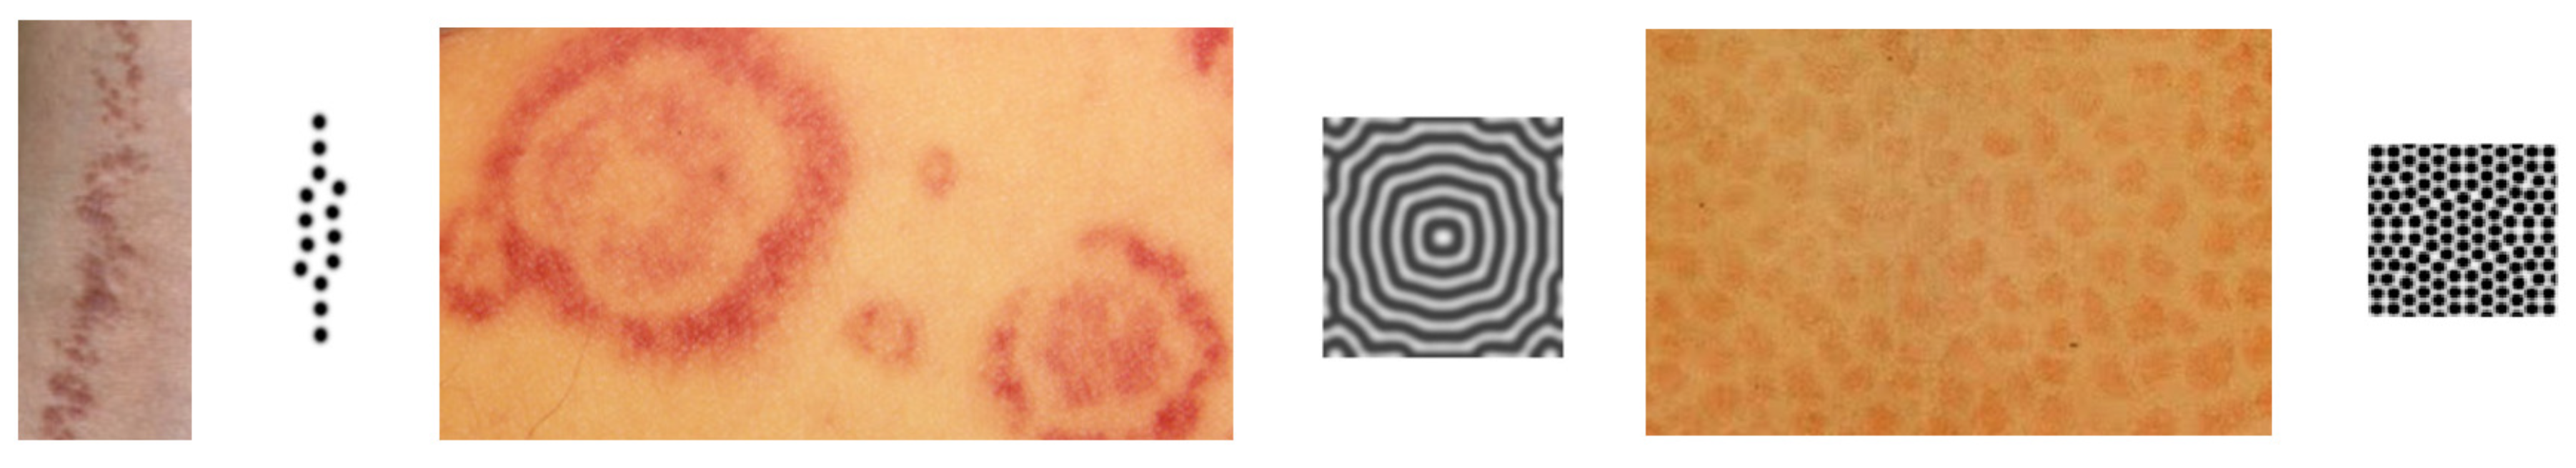
Figure 7.
Left: different forms of skin lesions from “Maladies de la peau”, vol. 8 of the 4th edition of Meyers Konversations-Lexikon, https://fr.wikipedia.org/wiki/Eczema. Right: different patterns in numerical simulations (the values of parameters are given in the appendix). Final patterns are shown in the left column and the corresponding transient patterns in the right column. Skin lesions shown at the left correspond to some of the numerical patterns: 1 - c (left), 3 - a, 5 - b (left), 6 - e (right), 7 - c (right), 8 - d (left).
Disclaimer/Publisher’s Note: The statements, opinions and data contained in all publications are solely those of the individual author(s) and contributor(s) and not of MDPI and/or the editor(s). MDPI and/or the editor(s) disclaim responsibility for any injury to people or property resulting from any ideas, methods, instructions or products referred to in the content. |
© 2024 by the authors. Licensee MDPI, Basel, Switzerland. This article is an open access article distributed under the terms and conditions of the Creative Commons Attribution (CC BY) license (http://creativecommons.org/licenses/by/4.0/).
Copyright: This open access article is published under a Creative Commons CC BY 4.0 license, which permit the free download, distribution, and reuse, provided that the author and preprint are cited in any reuse.


