Submitted:
11 June 2024
Posted:
12 June 2024
You are already at the latest version
Abstract
Extreme heat is a climate hazard that has been linked with high morbidity and mortality. The way extreme heat events are felt in the population varies depending on a variety of factors, such as age, employment status, living conditions, air-conditioning, housing conditions, habits, behaviors, and other socio-demographic parameters. To quantify and locate vulnerabilities of populations to extreme heat, we analyze socio-economic data at the NUTS3 level for the national case study of Greece and at the census tract level for the local case study of the city of Athens. The target variable for this study is defined as the average daily mortality during heatwaves per 100,000 individuals and a methodology is developed for constructing this variable, based on socio-economic data available in public databases. Independent variables were selected based on their contribution to socioeconomic vulnerability; they include the percentage of elderly, retired, unemployed, renting, living alone, residing in smaller houses, living in older houses, and immigrants from developing countries. An ensemble gradient boosted tree model was employed for this study to obtain feature importance metrics that was used to construct a composite index of socioeconomic heat vulnerability. The socioeconomic heat vulnerability index (SHVI) was calculated for each prefecture in Greece and for each census tract in the city of Athens, Greece. The unique feature of this SHVI is that it can be applied to any geographical resolution using the same methodology and produces a result that is not only quantifiable, but also allows comparison between vulnerability scores of different regions. This application aimed to map the SHVI of both prefecture and city, to examine the significance of scale, to identify vulnerability hotspots, and rank the most vulnerable areas, which are prioritized by authorities for interventions that protect public health.
Keywords:
socioeconomic vulnerability
; resilience
; climate change
; morbidity
; mortality
; urban setting
1. Introduction
In recent years, the phenomenon of extreme heat has emerged as a critical issue, posing significant risks to public health and urban environments worldwide [1]. Heatwaves can be deadly—during the summer of 2003, over 70,000 additional deaths were recorded, while about 20 years later, in the summer of 2022, an estimated number that exceeds 61,500 deaths occurred in Europe [2]. The escalation of such events is closely linked to climate change, leading to increased frequencies and intensities of heatwaves [3,4], affecting resilience and health and wellbeing in cities [5]. In fact, relative to other climate hazards, extreme heat is responsible for the highest morbidity and mortality [6]. Urban areas, due to their dense populations and infrastructure, are especially susceptible to the adverse effects of heatwaves, which can not only lead to heightened mortality rates, but may also strain public health systems [7,8]. Given that over 60% of the world population is expected to live in cities by 2030 [9], it is imperative for urban planners and policymakers to understand, quantify, locate and assess heat-health risks, and develop effective adaptation strategies in the cities to protect populations and public health.
The climate change risk assessment to human health presented within the 5th Assessment Report of the IPCC [10] states that risk is considered to result from the interaction of climatic hazard, vulnerability and exposure of humans, ecosystems, economic, social or cultural assets. Climate change vulnerability is a complex issue as it is not only related to the intensity of extreme events, but also to the socio-economic status of populations, such as poverty, unemployment, age of home, educational level, living conditions, health conditions, etc. The way a heat wave is experienced by society depends on a variety of factors, such as individual attributes, socio-demographics, availability of air-conditioning, individual attributes, health condition, connection with community, having a car, being elderly, ill, mobility-challenged, socially-isolated, living alone, etc. [11]. There are many factors that define socio-economic vulnerability to extreme heat and developing a composite socio-economic heat vulnerability index (SHVI) that clusters them all is an important tool to allow urban planners and local authorities locate such vulnerabilities, combine them with other hazard-specific vulnerabilities and develop a plan for timely action.
In this study, we delve into the intricate relationship between urban resilience and socio-economic vulnerability in the face of climate hazards, with a particular focus on extreme heat. A growing body of literature has explored various facets of this issue, emphasizing the importance of statistical and deep learning models in understanding and mitigating these effects. For instance, Founda and Santamouris [12] shed light on the synergies between Urban Heat Island (UHI) effects and heatwaves in Athens: They highlighted the increased thermal risk for urban residents due to a positive feedback loop between UHIs and heatwaves, intensifying average UHI magnitude by up to 3.5°C during heatwaves compared to summer background conditions. Heat wave risk has also been linked with age, leading to a variety of adverse health conditions, such as cardiovascular, respiratory, and other effects, meaning that heat wave mortality will not always be classified as such [13]. Similarly, recent research underscores the role of socio-economic pathways in shaping future urban heat-related challenges, suggesting that vulnerability is a crucial determinant of heat-related risk and mortality in cities [14]. Their findings indicate that future urban climate risks are significantly driven by population growth and changes in vulnerability, with climate conditions alone being of lesser influence [15,16].
In this article, we develop a methodology on quantifying and assessing socio-economic vulnerability to extreme heat. It is implemented at the level of prefecture, or regional unit (NUTS3 level) in Greece, with a case study centered on Athens, a densely populated urban environment that exemplifies the challenges and vulnerabilities associated with extreme heat. The primary objective is to quantify the average daily mortality during heatwave periods per 100,000 individuals, employing machine learning, namely gradient boosting ensemble, for capturing nonlinear relationships within limited data volumes. The methodology encompasses several key steps, including the grouping of NUTS3 regions, identification of heatwave events following established criteria [17] and combining aggregated mortality data with temperature time series to construct an appropriate target variable. Independent variables were selected based on their contribution to socioeconomic vulnerability, emphasizing the negative impact of certain demographic and housing characteristics on heat resilience [11]. The overarching aim of this study is to map vulnerability hotspots, rank the most vulnerable areas, and offer a clearer understanding of how socio-economic factors influence heat-related risks. The construction of a composite index, combined with visualization techniques, provides a novel approach to assessing and addressing the multifaceted issue of extreme heat in urban settings. Contrary to other indeces developed on vulnerability to extreme heat, the SHVI can be applied to any geographical resolution using the same methodology and produces a result that is not only quantifiable, but also allows comparison between vulnerability scores of different regions. The article contributes to the ongoing discourse on urban resilience, offering valuable insights and tools for policymakers, urban planners, and public health officials tasked with mitigating the impacts of climate change-induced heatwaves.
2. Materials and Methods
For the analysis of the hazard dependent vulnerability of the population of Athens to extreme heat, we attempt to quantify and correlate socio-economic indicators, as shown in Table 1, with a composite constructed target predictor for extreme heat impact. The predictor is the average number of daily deaths per 100,000 people during heatwaves. To develop it, we use weekly mortality rate timeseries from Eurostat for all 52 prefectures (NUTS3 regions) in Greece from the 2011 national census and corresponding temperature time series for the 2015 to 2020 time period. Since the study evaluates mortality, all data during and after the COVID-19 pandemic were removed. Assuming that some of the temperature time series of the 52 prefectures are quite similar, as temperatures will not vary so dramatically in the NUTS3 regions, we grouped the country in 10 groups, following adjacency rules and the zonal demarcations established by the Greek Ministry of Environment to estimate the needs of households for heating or cooling. For each of the 10 groups, we chose one main urban center and used the same temperature time series for all prefectures that are included in the group. The delineation of the 10 groups is shown in Figure 1. The analysis is conducted in two levels: (i) the prefecture (NUTS3) level on which the model is trained with the mortality and temperature timeseries, and (ii) the Census tract level for the city of Athens. The city is divided in 494 census tracts, which has a granularity that is smaller than the zip code level, and socio-economic data are available for each tract, thus enabling us to quantify, differentiate and map the SHVI at the city level. Results in this study are presented both at the national level (NUTS3 granularity) and the city level (census tract granularity).
Next, we identify the heatwave events in the given time series. According to Russo et al. (2015), heatwave events are defined as a period of at least three consecutive days where the maximum temperature (Tmax) exceeds the threshold set at the 90th percentile of daily maximum temperatures, calculated over a 31-day centered window. Heatwave events were defined for each of the ten NUTS3 grouping timeseries and were then used to aggregate the mortality rate of each NUTS3 region (see Figure 1 for the number of heatwave events identified per group). We proceed to identify which socio-economic variables are the most important ones for predicting the number of deaths during heatwaves. These dependent variables of the analysis were chosen based on their contribution to socio-economic vulnerability as per literature [11], as well as based on data availability. Several such variables were considered and a final group of eight were selected, based on their contribution in predicting the number of deaths. These eight variables are the following: (i) % elderly (older than 65 years old); (ii) % retired; (iii) % living in houses built before 1980; (iv) % living alone; (v) % renting (vi) % houses smaller than 60 m2; (vii) % unemployed; and (viii) % immigrants from developing countries. Values of these 8 variables along with their spatial distribution both for the national case study of Greece and the city case study of Athens are shown in Figure 2 and Figure 3, respectively.
When it comes to model selection, tree-based machine learning methods, including ensemble approaches, have shown superior solutions compared to traditional analysis in health research, potentially applicable to environmental health studies [18]. Specifically for urban resilience, a holistic approach that considers both aspects of environmental and socio-economic variables aligns with the flexible modeling potential of ensemble decision trees [19]. Many different ensemble decision tree methods have been used in studies in the fields of health, environment, and urban resilience, including Random Forest [20], Extreme Gradient Boosting (XGB) [21], and Categorical Boosting (CatBoost) [22]. These tree-based machine learning methods have been used in the field of health for statistical inference, variable selection and the estimation of causal effects. Hu and Li [18] highlight the use of ensemble trees to select important predictors, demonstrating the application of feature importance in statistical analysis.
For the socioeconomic heat vulnerability model, three methods, namely Random Forest [23], XGB [21] and CatBoost [24] were examined and compared to identify the strongest one in predicting the average heatwave mortality rate from the socioeconomic indicators. Due to the relatively small amount of data (coming from only 52 NUTS3 regions), each model was evaluated with cross validation for a range of hyperparameters (such as the model’s learning rate, max depth, and regularization parameters), using the python package hyperopt [25]. With hyperopt, after defining the hyperparameter space and its distribution, hyperparameters are selected using Bayesian Optimization, by modelling their response surface using probabilistic methods (such as Gaussian Processes, and Tree Parzen Estimators). For each hyperparameter selection, a 5-fold cross validation is performed, and the average mean squared error of all 5 folds is used as a comparison metric for each hyperparameter grouping. Hyperopt is then used for 1000 runs for each of the three methods, resulting in XGB being the most accurate method overall, ranking first on all coefficients of determination, namely Mean Squared Error (MSE), Mean Absolute Error (MAE) and R2. All regression results appear in Table 2. The hyperparameter values chosen for the XGB model are shown in Table 3.
XGB's capability to provide feature importance metrics was utilized to construct the composite index of socioeconomic heat vulnerability, as shown in Equation 1. The index was formulated as a weighted average, where each variable's contribution was multiplied by its respective feature importance value. This method offers a percentage-based index, aligning with the structure of the input variables.
where, x is the feature importance value of feature i and v is the value of the feature i, for each j region in the C case study area. The SHVI ranges from 0 to 1, with 0 being the least possible vulnerable area with no vulnerable population and 1 the most possible vulnerable area, with the entire population having all possible vulnerabilities. In this specific case, a value of 1 is unattainable, as some variables are mutually exclusive (unemployed and retired), but depending on the feature importance values of each variable the maximum possible SHVI value will be 1 – min(xunemployed,xretired), or 0.986.
Further quantifying the link between SHVI, temperature and mortality risk is difficult, due to the lack of data for mortality by each socioeconomic variable. However, the Eurostat mortality dataset is separated by age group, allowing us to further analyze the connection between age, temperature and mortality risk. In order to identify the breakpoints between temperature increase and mortality rate increase, we use a piecewise regression. It is a statistical technique used to model different phases within data by fitting multiple lines, each representing a distinct segment of the data. It is particularly useful when the relationship between variables changes at certain points, known as "breakpoints." Toms and Lesperance [26] demonstrated the use of piecewise regression to model ecological thresholds. They used breakpoints in their analysis to estimate the width of edge effects in understory plant communities, comparing various models to determine the most accurate representation of ecological thresholds [26]. Xiang et al. [27] applied multiple linear regression models, including piecewise regression, to study the impact of environmental visual exposure on pedestrian emotion in high-density urban areas of Hong Kong [27]. Using piecewise regression for the data of Central Athens, we identify the breakpoints where a temperature increase corresponds to a mortality rate increase for the different age groupings, elderly (age >= 65) and young (age < 65). Even though this analysis and the breakpoint identification only includes age and not all other socioeconomic variables that compose the SHVI, it is a good quantifiable indicator between temperature increase and mortality risk, especially since age plays the biggest role out of all socioeconomic variables in the SHVI calculation. A step-by-step flowchart of the overall methodology is shown in Figure 4. All data relevant for this analysis can be found in the ARSINOE project Zenodo community [28].
3. Results
Results from the piecewise regression are shown in Table 4 and Table 5 and in Figure 5: In each Table (young and elderly population, respectively), we see the breakpoints, in deg C—there are two breakpoints for the elderly and one for the young population. The first elderly breakpoint corresponds to cold temperatures and is not included in our analysis. The second breakpoint is located at 32.9795 deg C, ranging from 31.707 to 34.252 for the 95% confidence interval (CI). The single breakpoint for the young is located at 37.3017 deg C (36.806 to 37.797, 95% CI). We can see that the mortality rate breakpoints greatly differ between the elderly and young population of Athens, with a mean difference 4.32 deg Celsius (2.55 to 6.09, 95% CI). From this, we can conclude that being elderly corresponds to an increase in mortality rate at temperatures 4.32 degrees lower than if they were young, showing a strong correlation between age, temperature increase and mortality risk. While the r2 scores of the two regressions are low (0.169 and 0.30), meaning that temperature and age do not adequately capture all the variance in mortality rates, the breakpoints identified are statistically significant (p scores of ~ 0). While age and mortality risk are always highly correlated, temperature extremes demonstrably exacerbate the mortality rate. However, due to lack of data on mortality rate by socioeconomic category, we utilize the SHVI to demonstrate the extreme heat socioeconomic vulnerability risk in Greece and Athens.
For the calculation of the SHVI per equation 1, we need the feature importance values. According to the XGB analysis, feature importance results from XGB are shown in Table 6. Overall, the most important variables for the model were the percentage of the population as elderly and retired (45,5% and 24,4% respectively). This is expected for a dependent variable of mortality. However, age was not the only significant variable used in the model’s predictions. The third most important variable, houses built before 1980, had a notable feature importance of 13%, followed by percentage of people living alone and people renting their homes (6.3% and 5.8% respectively). The percentage of population as unemployed, immigrants from developing countries and people living in small houses (< 60 m2) were almost insignificant in the overall model’s predictive ability (1.4%, 1% and 2,3% respectively). Based on the feature importance values, the SHVI is then calculated as shown in equation 1 for each NUTS3 region in Greece and each census tract area in Athens, as shown in Figure 6 and Figure 7, respectively. In Figure 6, we also include in part (b) a bivariant graph indicating the overall exposure of the population to extreme heat by plotting both vulnerability and population of each prefecture. In the latter plot, dark blue areas signify both high population and high socio-economic vulnerability scores. Areas that appear with the highest vulnerability are not necessarily colored blue, if they are not highly populated as well. On the other hand, areas with medium high vulnerability scores appear blue due to the high exposure that results from the combination of vulnerability and population. In Figure 7, part (b) is a 3-D bivariant plot, in which the height of each census tract column corresponds to the population and the color of the column corresponds to the SHVI score. In Athens, the highest columns appear in the center with a medium high SHVI (orange).
In addition to the NUTS3 level analysis for the national case study of Greece, we group prefectures by administrative regions (NUTS2) to see the overall socioeconomic vulnerability to heat by region. This is shown in Figure 8, where SHVI by prefecture is grouped at the NUTS2 level. The highest SHVI value at the NUTS3 level is found in the NUTS2 Region EL52 (Kentriki Makedonia). The second largest urban center in Greece, the city of Thessaloniki is found in this Region (EL523) with a large percentage of mainly old houses and a large number of immigrants are found in EL526.
When plotting all SHVI’s for the city of Athens (one value per census tract) as a function of distance from the center of the city, we see that there is a strong correlation of vulnerability with distance, which is the highest at the center of the city and falls to lower values as we move away from the center. This is shown in Figure 9 and is mainly due to the fact that at the city center, buildings are older and there is usually a higher concentration of socioeconomically vulnerable people.
4. Discussion
Following up on the presentation of our results, the importance of scale should be emphasized; i.e., the difference when viewing a region overall and in depth. When examining the vulnerability of Greece as a whole, we see that the SHVI ranges between [16.4%-29.13%], with a mean of 22.48% (population weighted mean of 21.63%) and a standard deviation of 2.94. For an indicator that ranges from 0 to 100%, this gives an overall image for the socioeconomic vulnerability of Greece that might be considered medium to good. However, when examining the vulnerability of the city of Athens and each of its census tracts, as shown in Figure 7, we see a different picture, with an SHVI ranging from [14.3%-42.32%], with a mean of 32.64% (population weighted mean of 32.98%) and a standard deviation of 5.79. Overall, the city of Athens accounts for around 657,000 people, out of the 1,029,000 people in the Central Athens sector NUTS3 region (NUTS3 code EL303, shown in Figure 8), with a mean SHVI 8.97% higher than the NUTS3 region’s SHVI. Additionally, the maximum SHVI in the city center reaches 42.32%. For reference, with the current SHVI calculation, a region consisting entirely of a population over 65 years old would achieve an SHVI score of 45.5% with regards to heatwave mortality. This disparity shows the concentration of vulnerable people in the city of Athens and the importance of examining an urban environment in depth, instead of the aggregated socioeconomic indices of the entire region or country.
The heat vulnerability index developed in this article uses solely socio-economic data to record, quantify, and locate the geographical variability of vulnerability at both the national and the city level for Greece and Athens, respectively. This variability is observed due to differences in socio-economic characteristics at the regional and local level, as well as differences in demographics, living standards and other cultural characteristics. The highest vulnerabilities were spotted at urban areas with high density of older houses, and high proportions of elderly, immigrants from developing countries and lower income households. This analysis can help the nation and the city prioritize where the citizen needs are more urgent in order to plan interventions, or adaptation measures, such as cooling stations, green shaded areas, neighborhood watches for the elderly and people living alone, etc. Identifying vulnerabilities can better prepare authorities and can help streamline efforts towards adaptation and mitigation measures to address the effect of heat on public health. In conclusion, the following policy and practice recommendations are natural outcomes of this work: (i) Socio-economic factors are critical to define population vulnerabilities to heatwaves; (ii) being elderly, unemployed, an immigrant, and living in an old house increase vulnerability; and (iii) prevention measures should include house retrofitting & training/education of the vulnerable
Author Contributions
KZ: conceptualization, methodology, software, data curation, visualization, writing—original draft. CP: conceptualization, supervision, writing—review & editing; CL: conceptualization, methodology, writing—original draft, writing—review & editing, project administration, funding acquisition. All authors have read and agreed to the published version of the manuscript.
Funding
The work described in this paper has been conducted within the project ARSINOE. This project has received funding from the European Union’s Horizon 2020 Innovation Action programme under Grant Agreement No. 101037424 ARSINOE. The project has also received funding from the European Cooperation in Science and Technology COST Action CA20138 NexusNet.
Data Availability Statement
All data relevant for this analysis can be found in the ARSINOE project Zenodo community [28].
Conflicts of Interest
The authors declare no conflicts of interest. The funders had no role in the design of the study; in the collection, analyses, or interpretation of data; in the writing of the manuscript; or in the decision to publish the results.
References
- Meehl, G.A.; Tebaldi, C. More intense, more frequent, and longer lasting heat waves in the 21st century. Science 2004, 305, 994–997. [Google Scholar] [CrossRef]
- Ballester, J.; Quijal-Zamorano, M.; Turrubiates, R.F.M.; Pegenaute, F.; Herrmann, F.R.; Robine, J.M.; Basagaña, X.; Tonne, C.; Antó, J.M.; Achebak, H. Heat-related mortality in Europe during the summer of 2022. Nat. Med. 2023, 29, 1857–1866. [Google Scholar] [CrossRef]
- Ellena, M.; Breil, M.; Soriani, S. The heat-health nexus in the urban context: A systematic literature review exploring the socio-economic vulnerabilities and built environment characteristics. Urban Clim. 2020, 34, 100676. [Google Scholar] [CrossRef]
- Guo, Y.; Gasparrini, A.; Li, S.; Sera, F.; Vicedo-Cabrera, A.M.; de Sousa Zanotti Stagliorio Coelho, M.; Saldiva, P.H.N.; Lavigne, E.; Tawatsupa, B.; Punnasiri, K.; et al. Quantifying excess deaths related to heatwaves under climate change scenarios: A multicountry time series modelling study. PLOS Med. 2018, 15, e1002629. [Google Scholar] [CrossRef]
- Kearl, Z.; Vogel, J. Urban extreme heat, climate change, and saving lives: Lessons from Washington state. Urban Clim. 2023, 47, 101392. [Google Scholar] [CrossRef]
- Hammer, J.; Ruggieri, D.G.; Thomas, C.; Caum, J. Local Extreme Heat Planning: an Interactive Tool to Examine a Heat Vulnerability Index for Philadelphia, Pennsylvania. J. Urban Heal. 2020, 97, 519–528. [Google Scholar] [CrossRef]
- Zaidi, R.Z.; Pelling, M. Institutionally configured risk: Assessing urban resilience and disaster risk reduction to heat wave risk in London. Urban Stud. 2013, 52, 1218–1233. [Google Scholar] [CrossRef]
- Paravantis, J.; Santamouris, M.; Cartalis, C.; Efthymiou, C.; Kontoulis, N. Mortality Associated with High Ambient Temperatures, Heatwaves, and the Urban Heat Island in Athens, Greece. Sustainability 2017, 9, 606. [Google Scholar] [CrossRef]
- Romero-Lankao, P.; Qin, H.; Dickinson, K. Urban vulnerability to temperature-related hazards: A meta-analysis and meta-knowledge approach. Glob. Environ. Chang. 2012, 22, 670–683. [Google Scholar] [CrossRef]
- IPCC, 2014: Climate Change 2014: Synthesis Report. Contribution of Working Groups I, II and III to the Fifth Assessment Report of the Intergovernmental Panel on Climate Change [Core Writing Team, R.K. Pachauri and L.A. Meyer (eds.)]. IPCC, Geneva, Switzerland, 151 pp.
- Nayak, S.; Shrestha, S.; Kinney, P.; Ross, Z.; Sheridan, S.; Pantea, C.; Hsu, W.; Muscatiello, N.; Hwang, S. Development of a heat vulnerability index for New York State. Public Heal. 2018, 161, 127–137. [Google Scholar] [CrossRef]
- Founda, D.; Santamouris, M. Synergies between Urban Heat Island and Heat Waves in Athens (Greece), during an extremely hot summer (2012). Sci. Rep. 2017, 7, 1–11. [Google Scholar] [CrossRef]
- Bunker, A.; Wildenhain, J.; Vandenbergh, A.; Henschke, N.; Rocklöv, J.; Hajat, S.; Sauerborn, R. Effects of Air Temperature on Climate-Sensitive Mortality and Morbidity Outcomes in the Elderly; a Systematic Review and Meta-analysis of Epidemiological Evidence. EBioMedicine 2016, 6, 258–268. [Google Scholar] [CrossRef]
- Cutler, M.J.; Marlon, J.R.; Howe, P.D.; Leiserowitz, A. The Influence of Political Ideology and Socioeconomic Vulnerability on Perceived Health Risks of Heat Waves in the Context of Climate Change. Weather. Clim. Soc. 2018, 10, 731–746. [Google Scholar] [CrossRef]
- Rohat, G.; Wilhelmi, O.; Flacke, J.; Monaghan, A.; Gao, J.; Dao, H.; van Maarseveen, M. Characterizing the role of socioeconomic pathways in shaping future urban heat-related challenges. Sci. Total. Environ. 2019, 695, 133941. [Google Scholar] [CrossRef]
- Romero-Lankao, P.; Gnatz, D.M.; Wilhelmi, O.; Hayden, M.H. Urban Sustainability and Resilience: From Theory to Practice. Sustainability 2016, 8, 1224. [Google Scholar] [CrossRef]
- Russo, S.; Sillmann, J.; Fischer, E.M. Top ten European heatwaves since 1950 and their occurrence in the coming decades. Environ. Res. Lett. 2015, 10, 124003. [Google Scholar] [CrossRef]
- Hu, L.; Li, L. Using Tree-Based Machine Learning for Health Studies: Literature Review and Case Series. Int. J. Environ. Res. Public Heal. 2022, 19, 16080. [Google Scholar] [CrossRef]
- Meerow, S.; Newell, J.P.; Stults, M. Defining urban resilience: A review. Landsc. Urban Plan. 2016, 147, 38–49. [Google Scholar] [CrossRef]
- Belgiu, M.; Drăguţ, L. Random forest in remote sensing: A review of applications and future directions. ISPRS J. Photogramm. Remote Sens. 2016, 114, 24–31. [Google Scholar] [CrossRef]
- Chen, T.; Guestrin, C. XGBoost: A Scalable Tree Boosting System. In Proceedings of the KDD ’16: 22nd ACM SIGKDD International Conference on Knowledge Discovery and Data Mining, San Francisco, CA, USA, 13–17 August 2016; Association for Computing Machinery: New York, NY, USA, 2016; pp. 785–794. [Google Scholar] [CrossRef]
- Hancock, J.T.; Khoshgoftaar, T.M. CatBoost for big data: an interdisciplinary review. J. Big Data 2020, 7, 1–45. [Google Scholar] [CrossRef]
- Ho, T. K. (1995, August). Random decision forests. In Proceedings of 3rd international conference on document analysis and recognition (Vol. 1; pp. 278–282.
- Prokhorenkova, L., Gusev, G., Vorobev, A., Dorogush, A. V., & Gulin, A. (2018). CatBoost: unbiased boosting with categorical features. Advances in neural information processing systems, 31. https://dl.acm.org/doi/pdf/10.5555/3327757.3327770.
- Bergstra, J. , Yamins, D., & Cox, D. (2013, February). Making a science of model search: Hyperparameter optimization in hundreds of dimensions for vision architectures. In International conference on machine learning (pp. 115-123). PMLR. https://proceedings.mlr.press/v28/bergstra13.pdf.
- Toms, J.D.; Lesperance, M.L. Piecewise regression: A tool for identifying ecological thresholds. Ecology 2003, 84, 2034–2041. [Google Scholar] [CrossRef]
- Xiang, L.; Cai, M.; Ren, C.; Ng, E. Modeling pedestrian emotion in high-density cities using visual exposure and machine learning: Tracking real-time physiology and psychology in Hong Kong. J. Affect. Disord. 2021, 205, 108273. [Google Scholar] [CrossRef]
- Ziliaskopoulos, K. (2023). Athens Socioeconomic Heat Vulnerability Index - Features and Index per region [Data set]. Zenodo. [CrossRef]
Figure 1.
The 10 groups (zones) with similar temperature profiles that Greece is grouped in. Each group is colored differently and includes a different number of prefectures (NUTS3 regions). In the adjacent table, the number of heatwave events for each group from 2015 to 2020 are listed.
Figure 1.
The 10 groups (zones) with similar temperature profiles that Greece is grouped in. Each group is colored differently and includes a different number of prefectures (NUTS3 regions). In the adjacent table, the number of heatwave events for each group from 2015 to 2020 are listed.
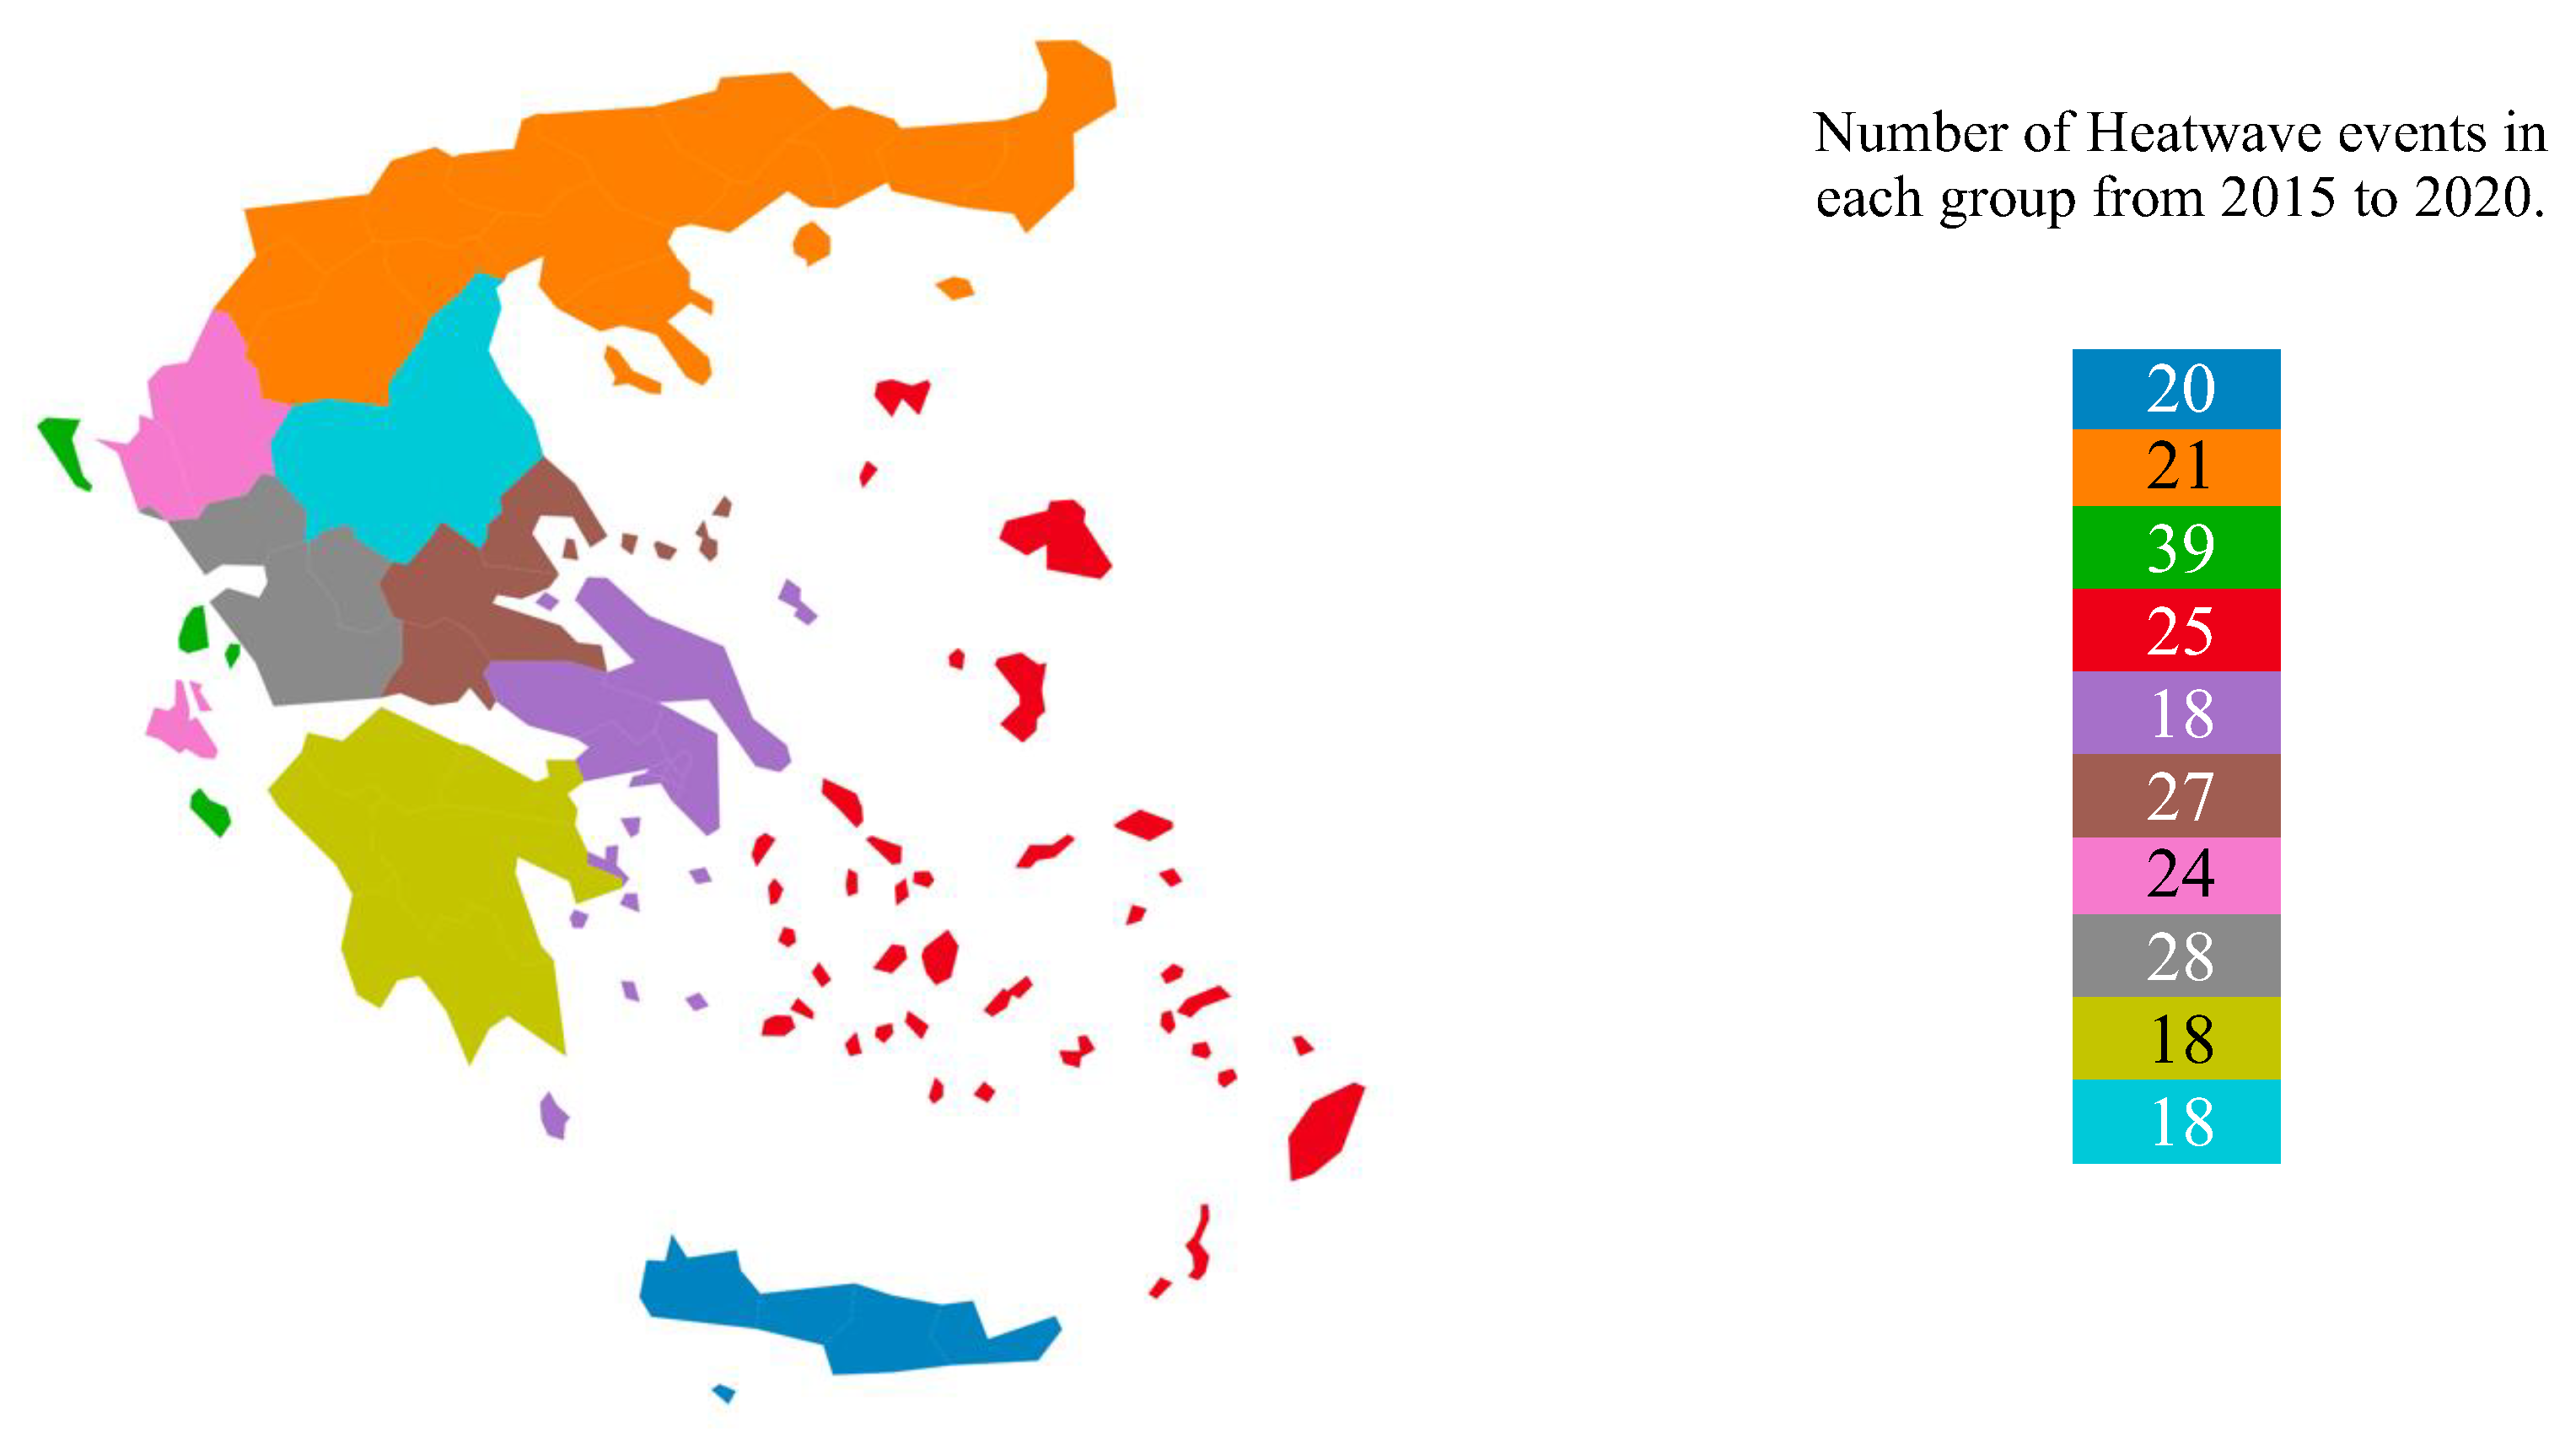
Figure 2.
Distribution of socio-economic variables throughout Greece for each prefecture (NUTS3). Reported values are fractions for all variables.
Figure 2.
Distribution of socio-economic variables throughout Greece for each prefecture (NUTS3). Reported values are fractions for all variables.
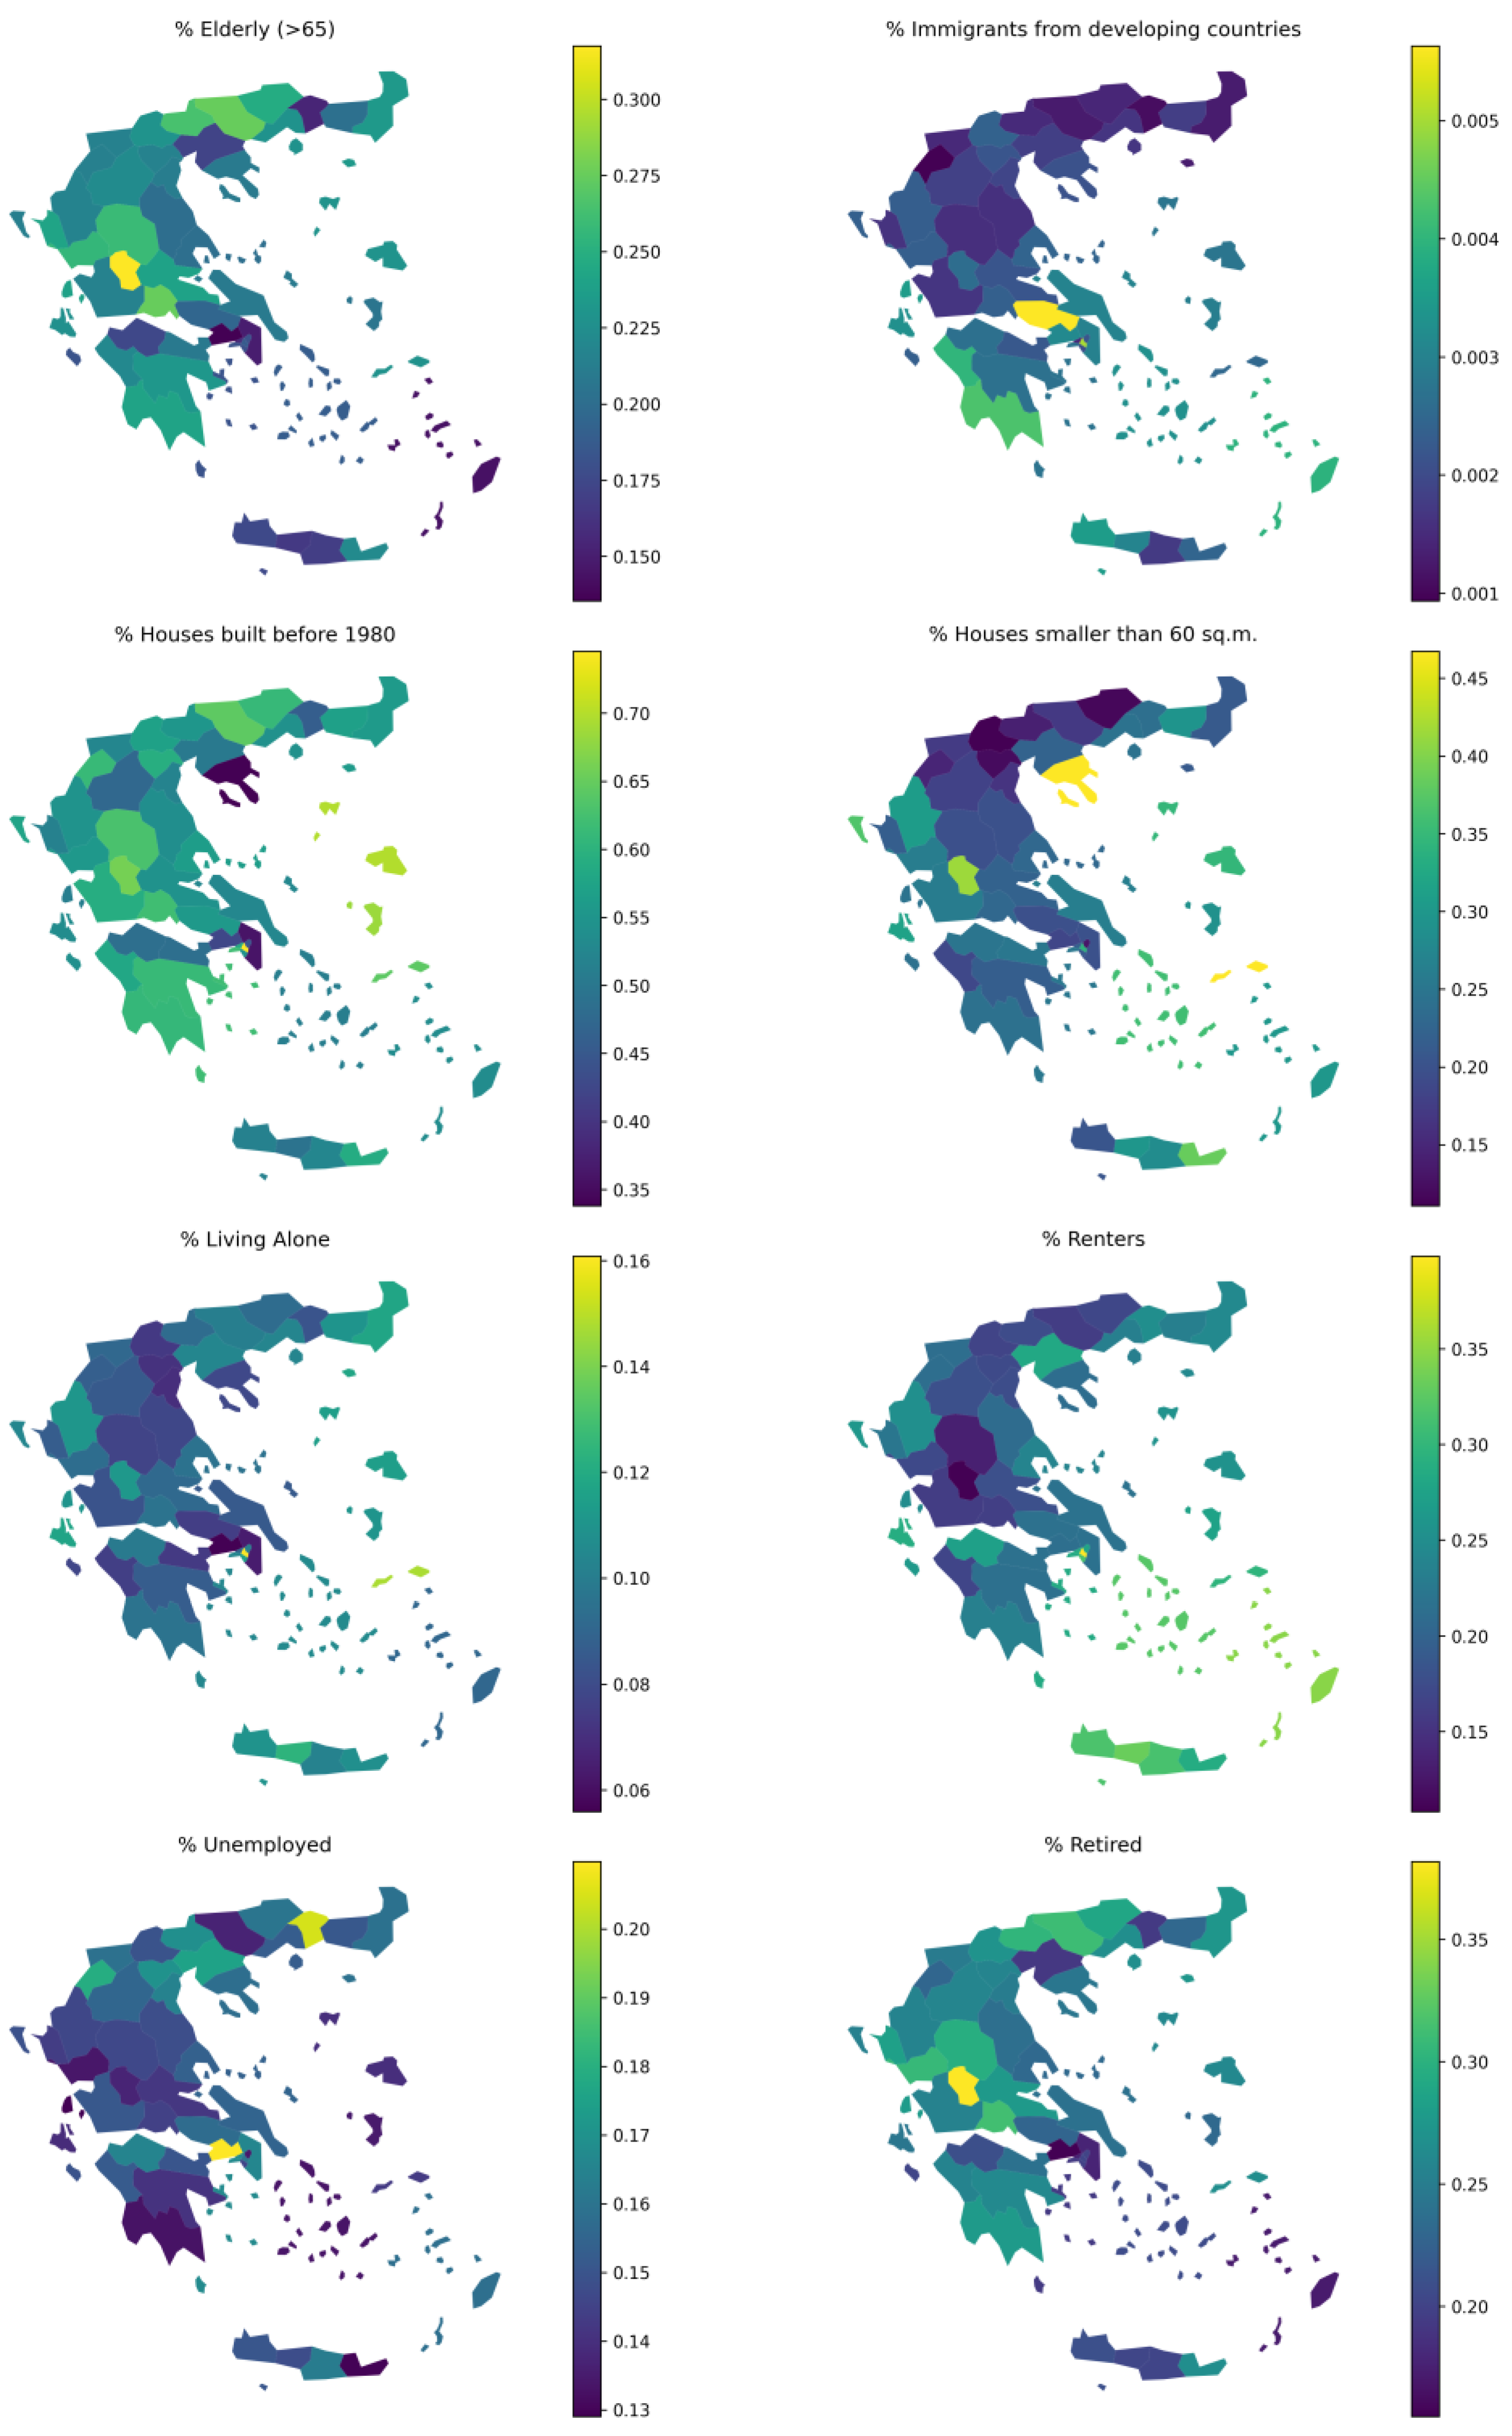
Figure 3.
Distribution of socio-economic variables throughout Athens for each census tract. Reported values are fractions for all variables.
Figure 3.
Distribution of socio-economic variables throughout Athens for each census tract. Reported values are fractions for all variables.
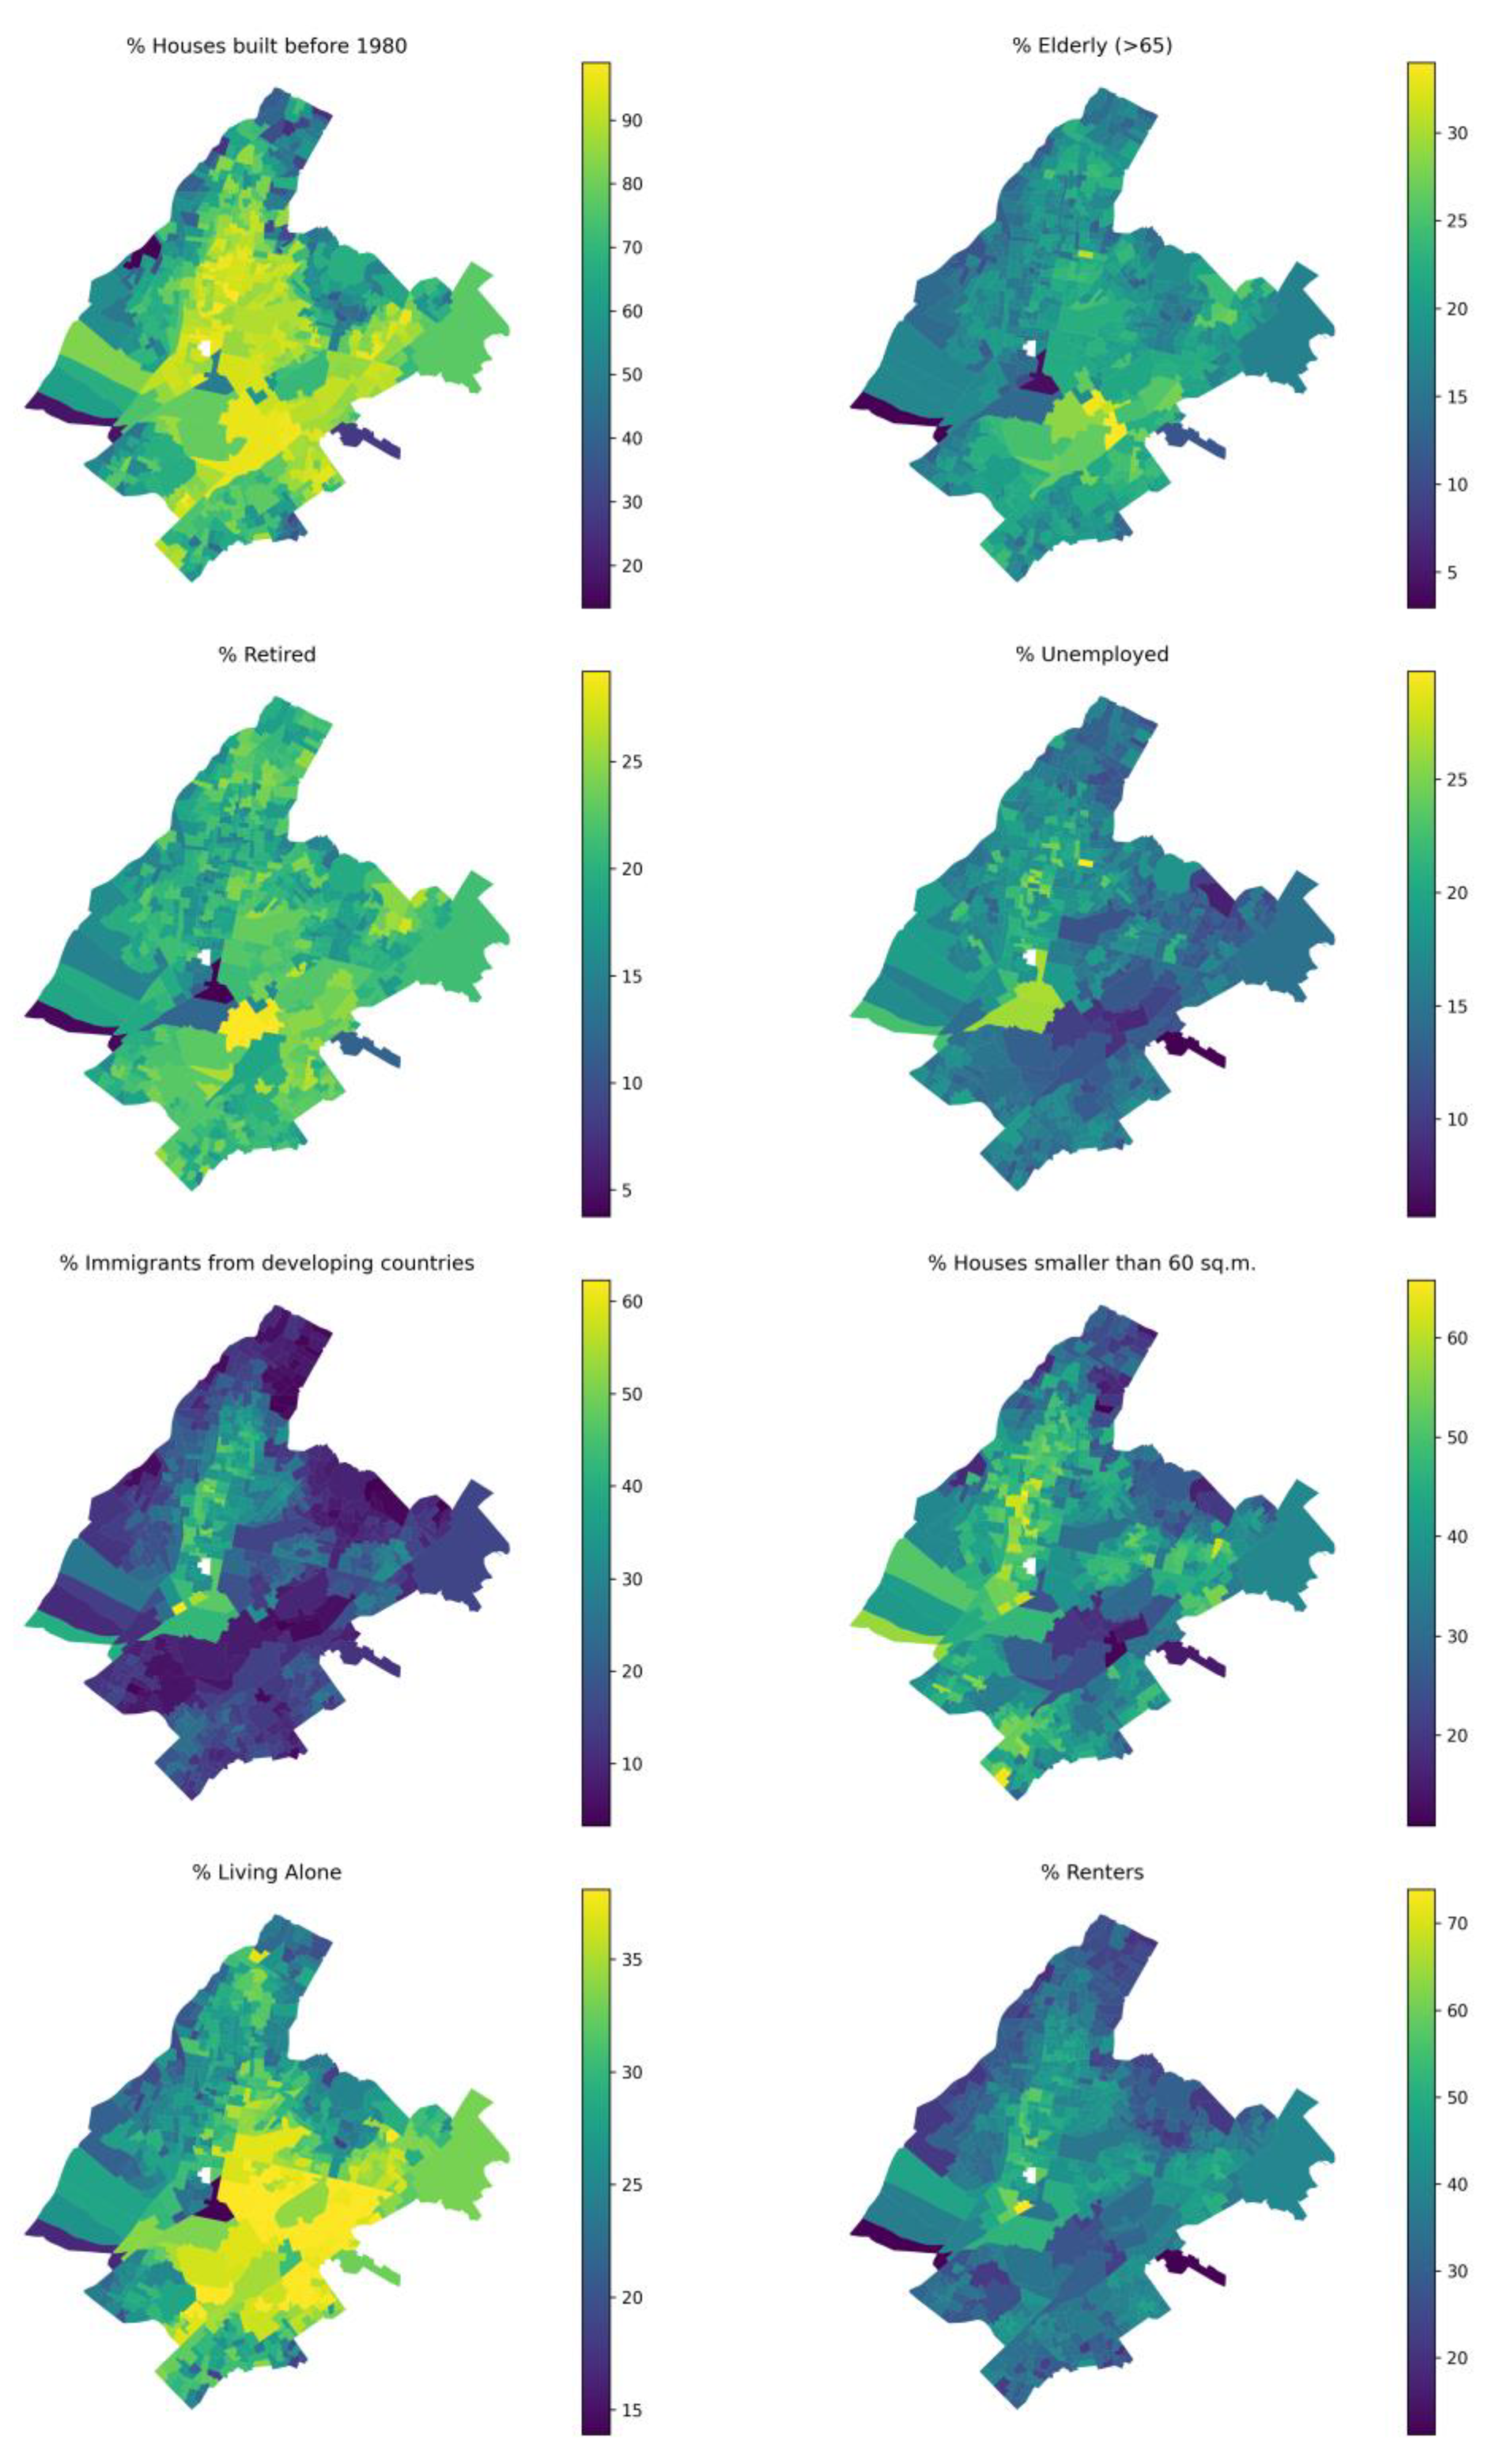
Figure 4.
Flowchart of the methodology for the calculation of the SHVI at national-level (for Greece) and city-level (for Athens).
Figure 4.
Flowchart of the methodology for the calculation of the SHVI at national-level (for Greece) and city-level (for Athens).
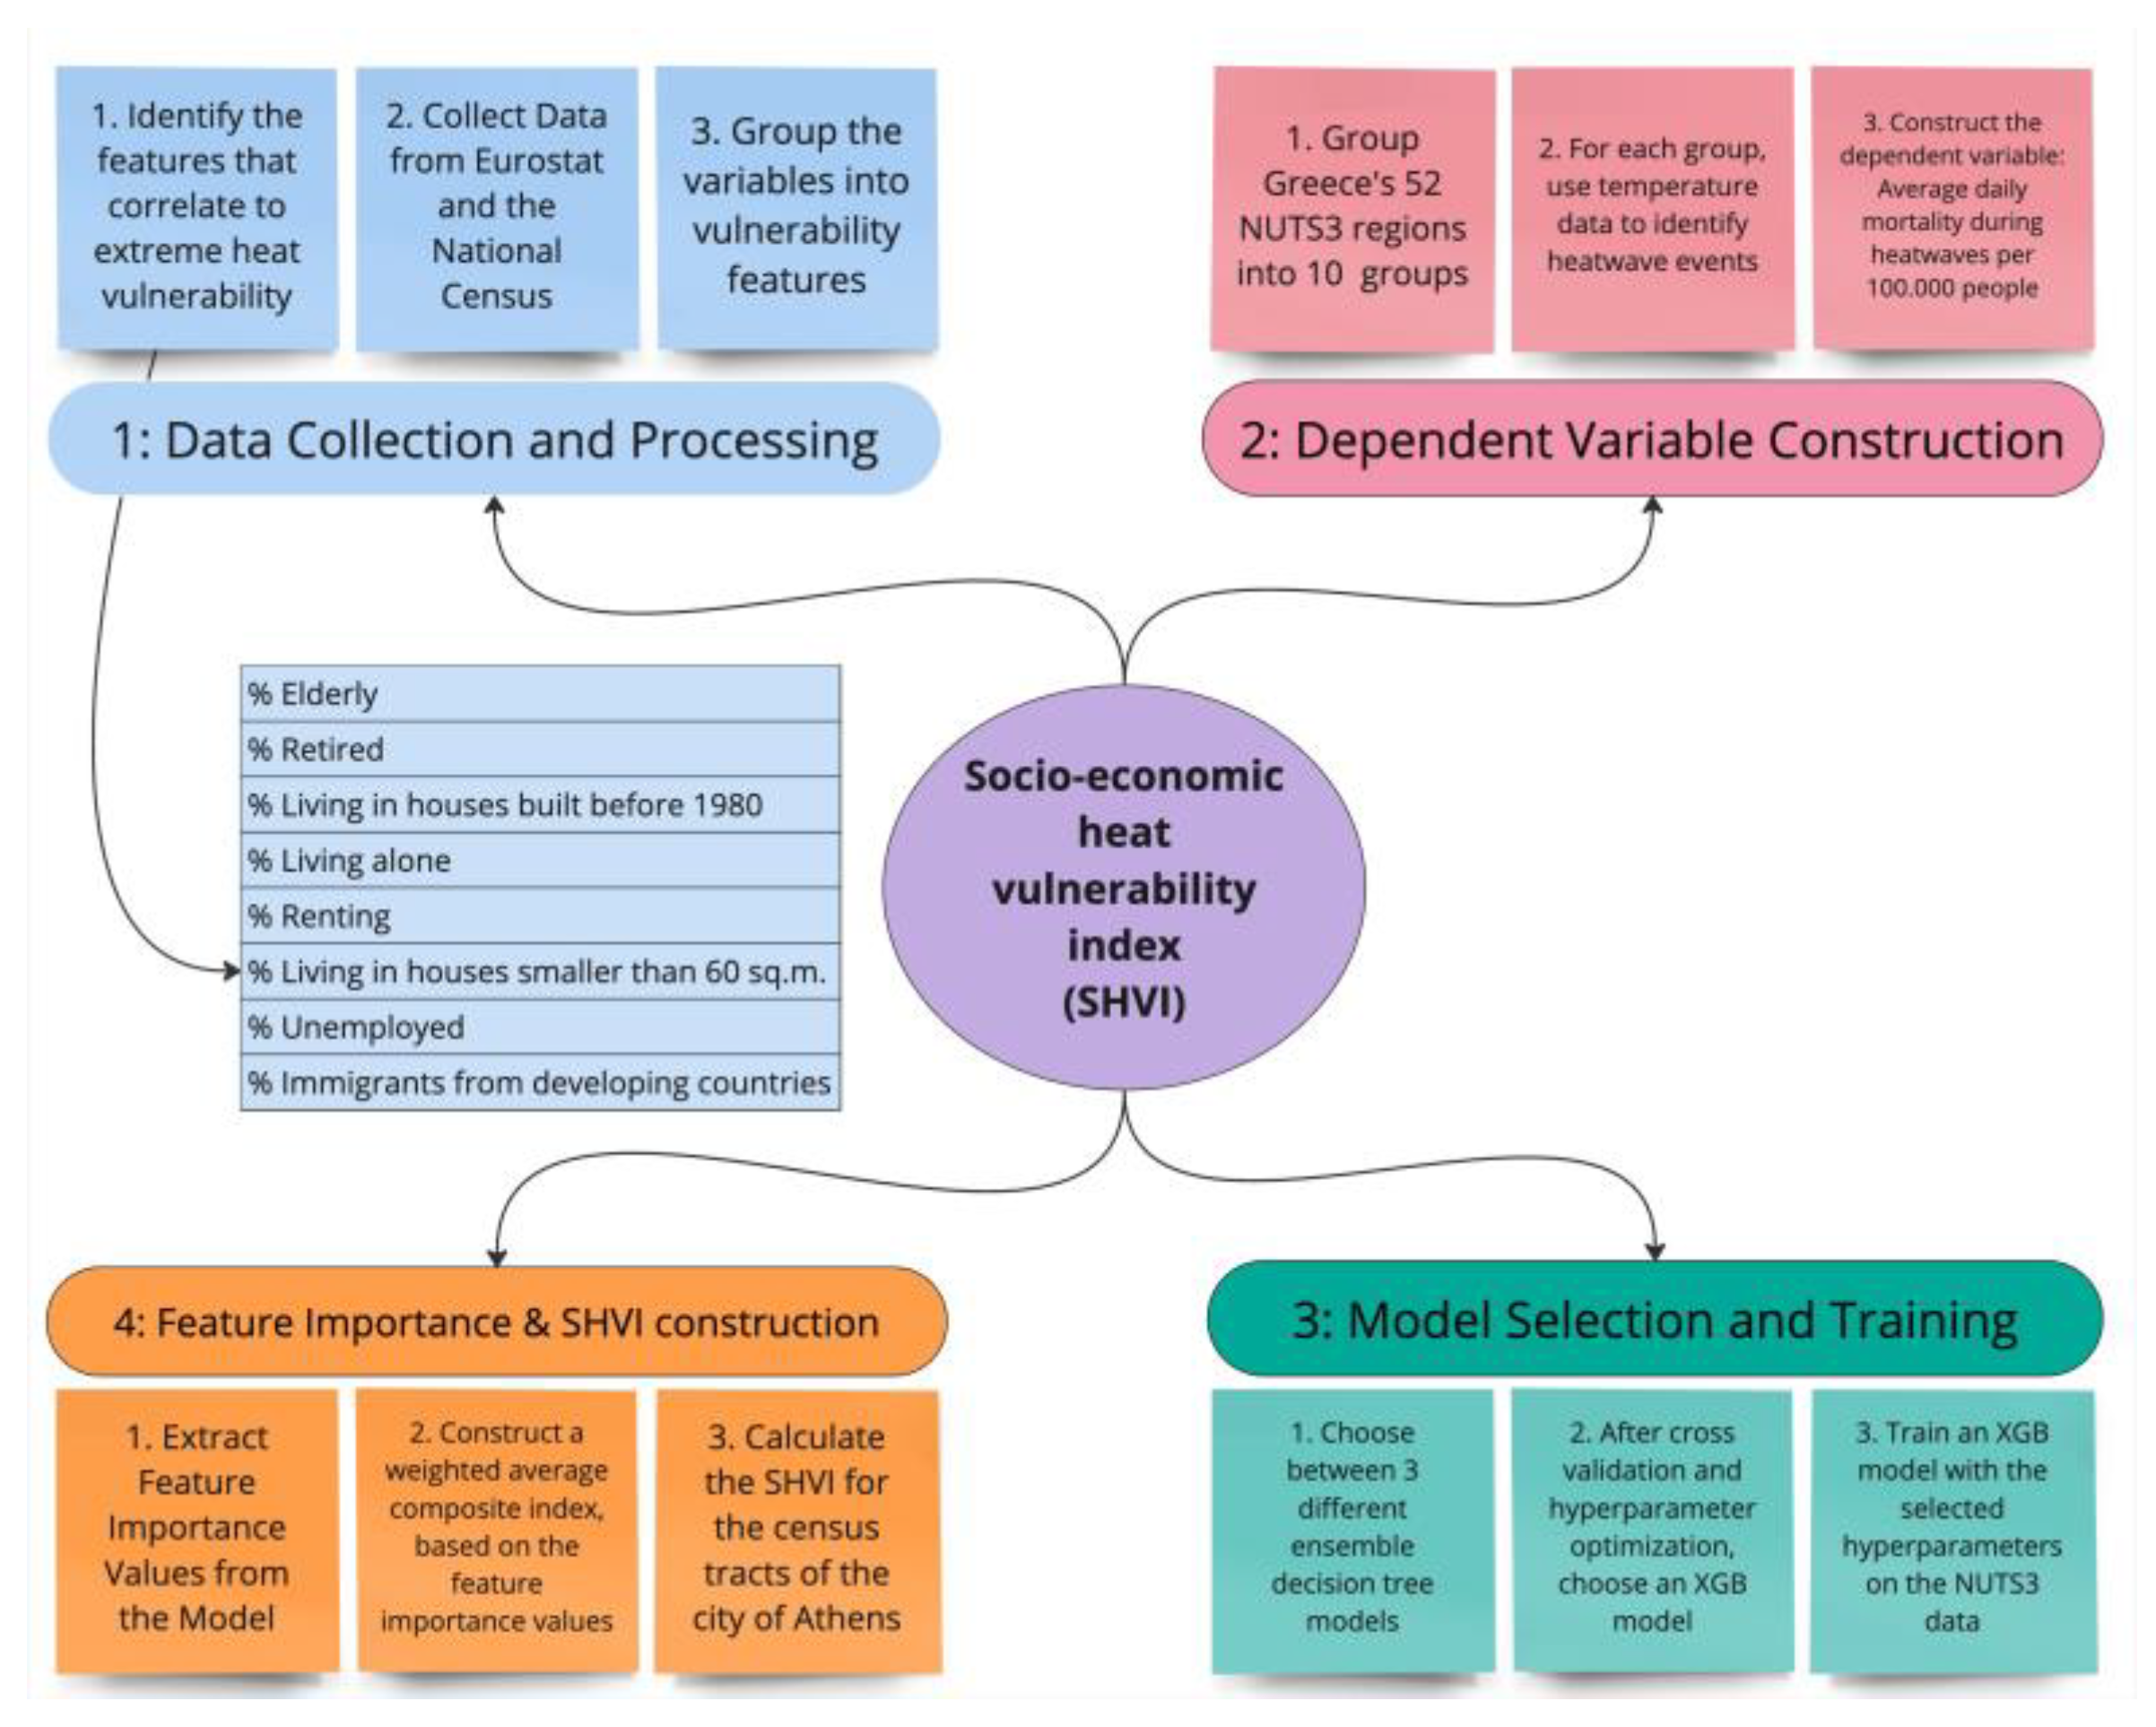
Figure 5.
Results of piecewise regression: Comparison of young and elderly mortality rates as a function of temperature. Vertical blue lines show the 3 breakpoints of the regression along with their confidence intervals (shaded light blue area around the breakpoint lines).
Figure 5.
Results of piecewise regression: Comparison of young and elderly mortality rates as a function of temperature. Vertical blue lines show the 3 breakpoints of the regression along with their confidence intervals (shaded light blue area around the breakpoint lines).
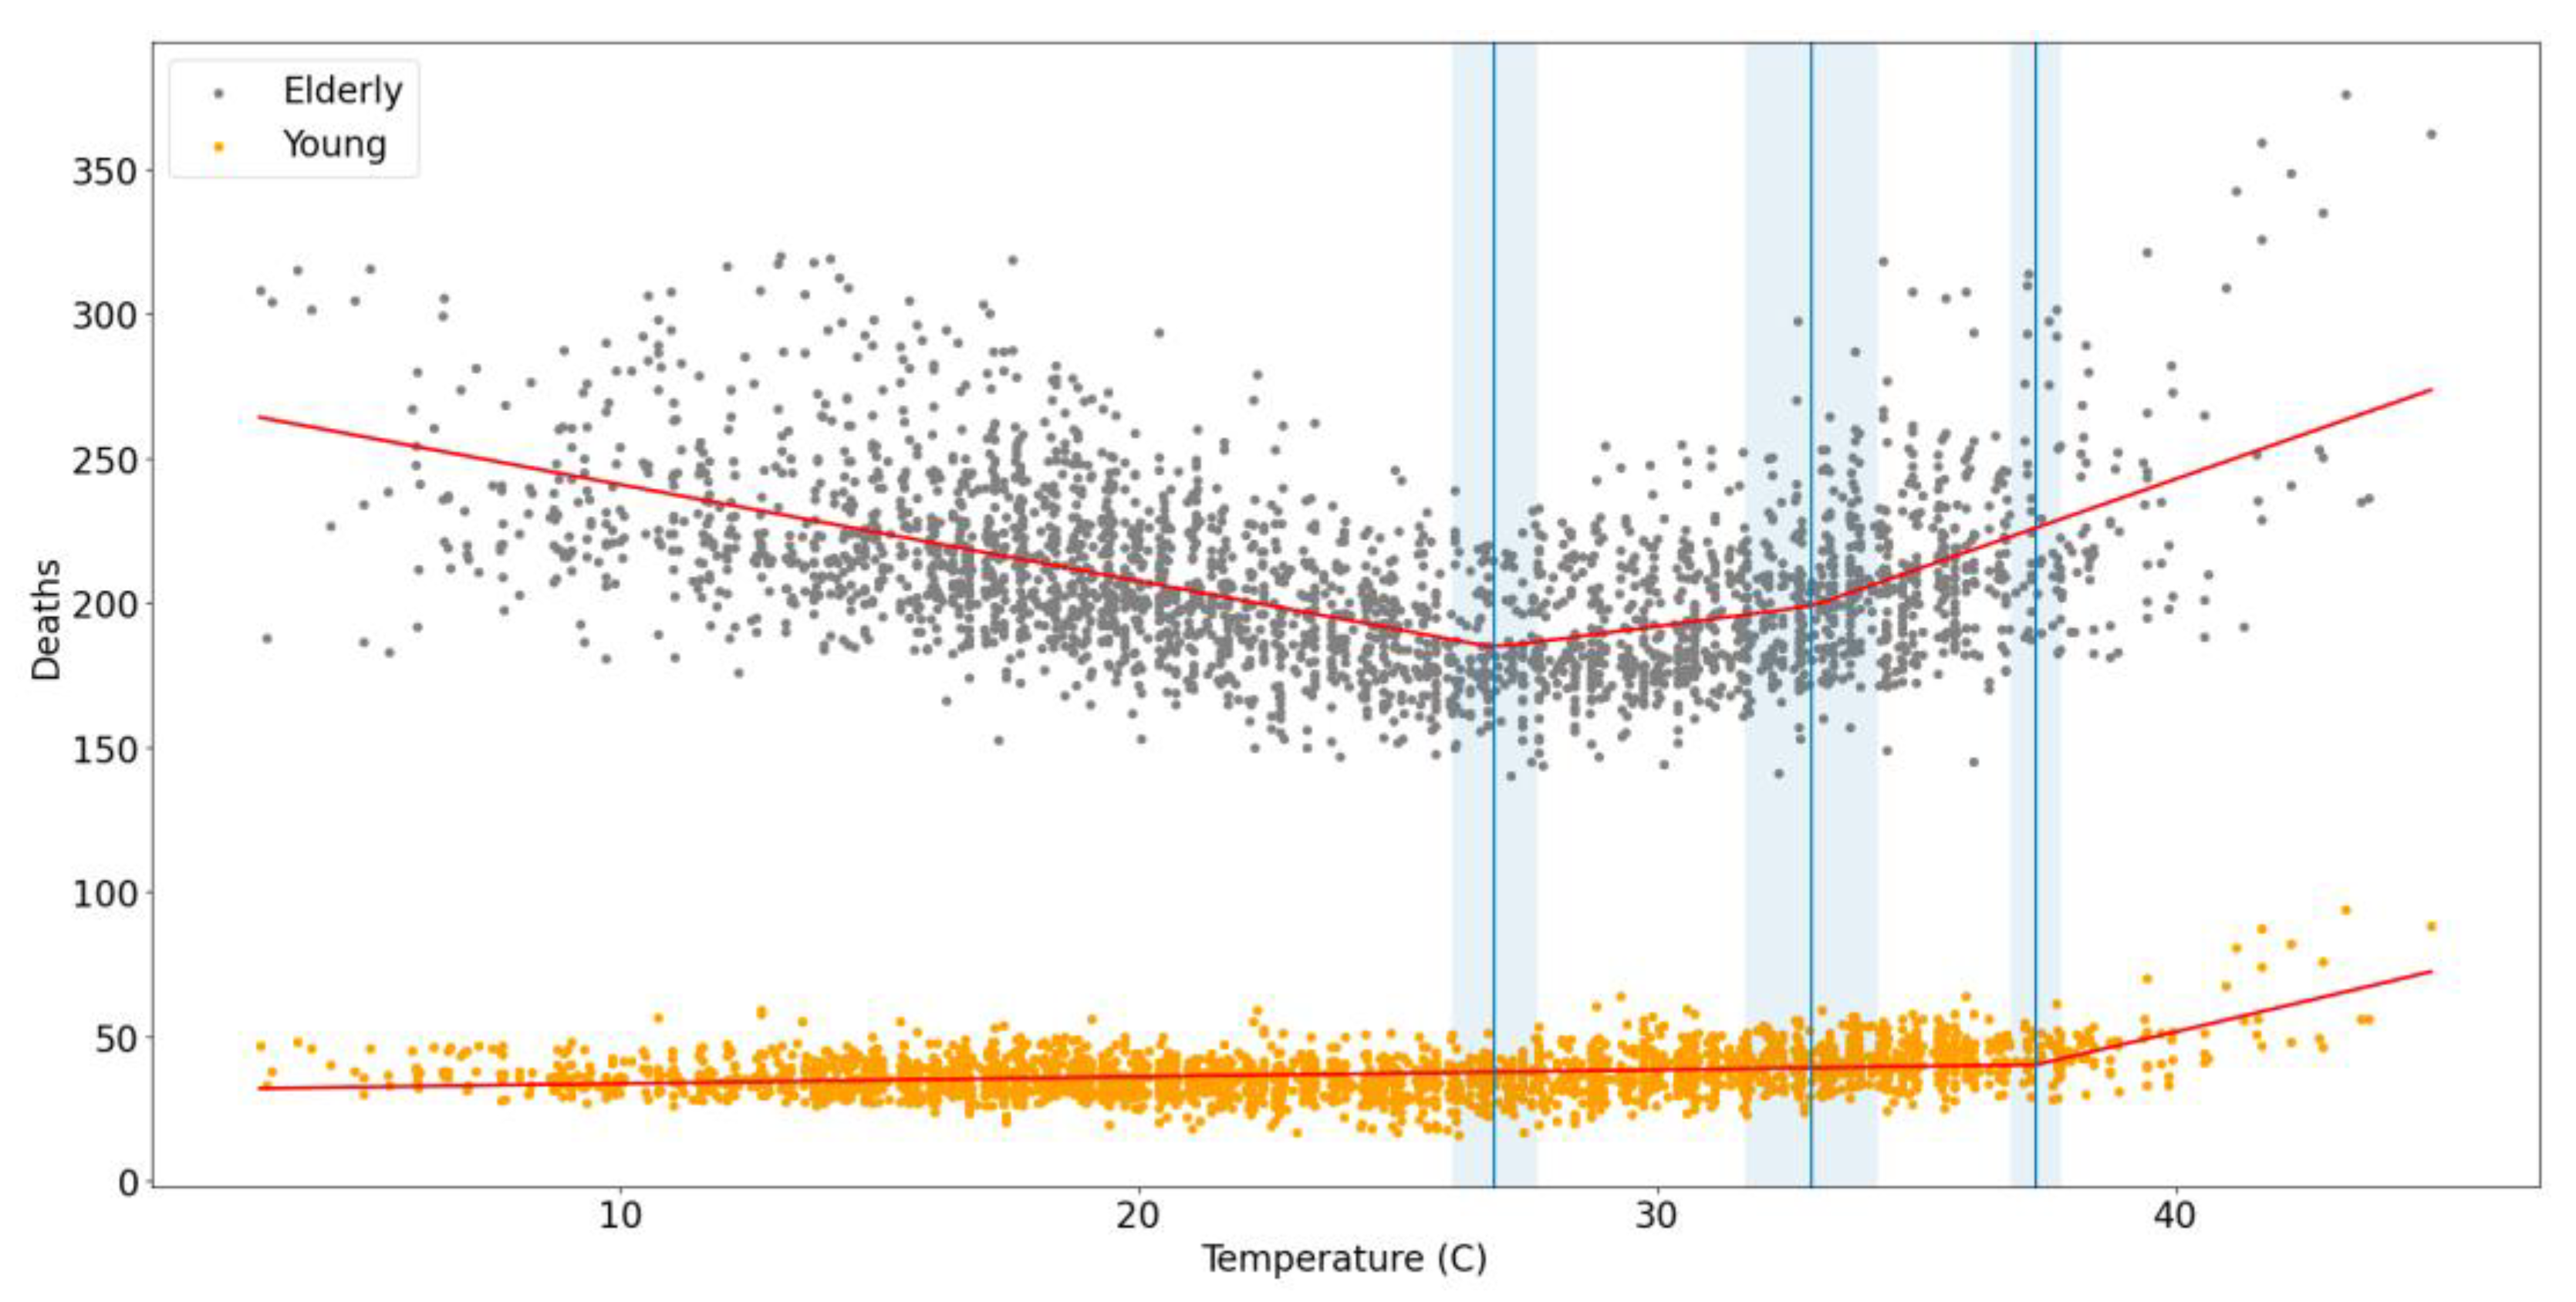
Figure 6.
(a) % SHVI values shown throughout Greece by NUTS3 region and (b) bivariant graph indicating the overall exposure of the population to extreme heat, by differentiating prefectures that have a combination of high population and high vulnerability.
Figure 6.
(a) % SHVI values shown throughout Greece by NUTS3 region and (b) bivariant graph indicating the overall exposure of the population to extreme heat, by differentiating prefectures that have a combination of high population and high vulnerability.
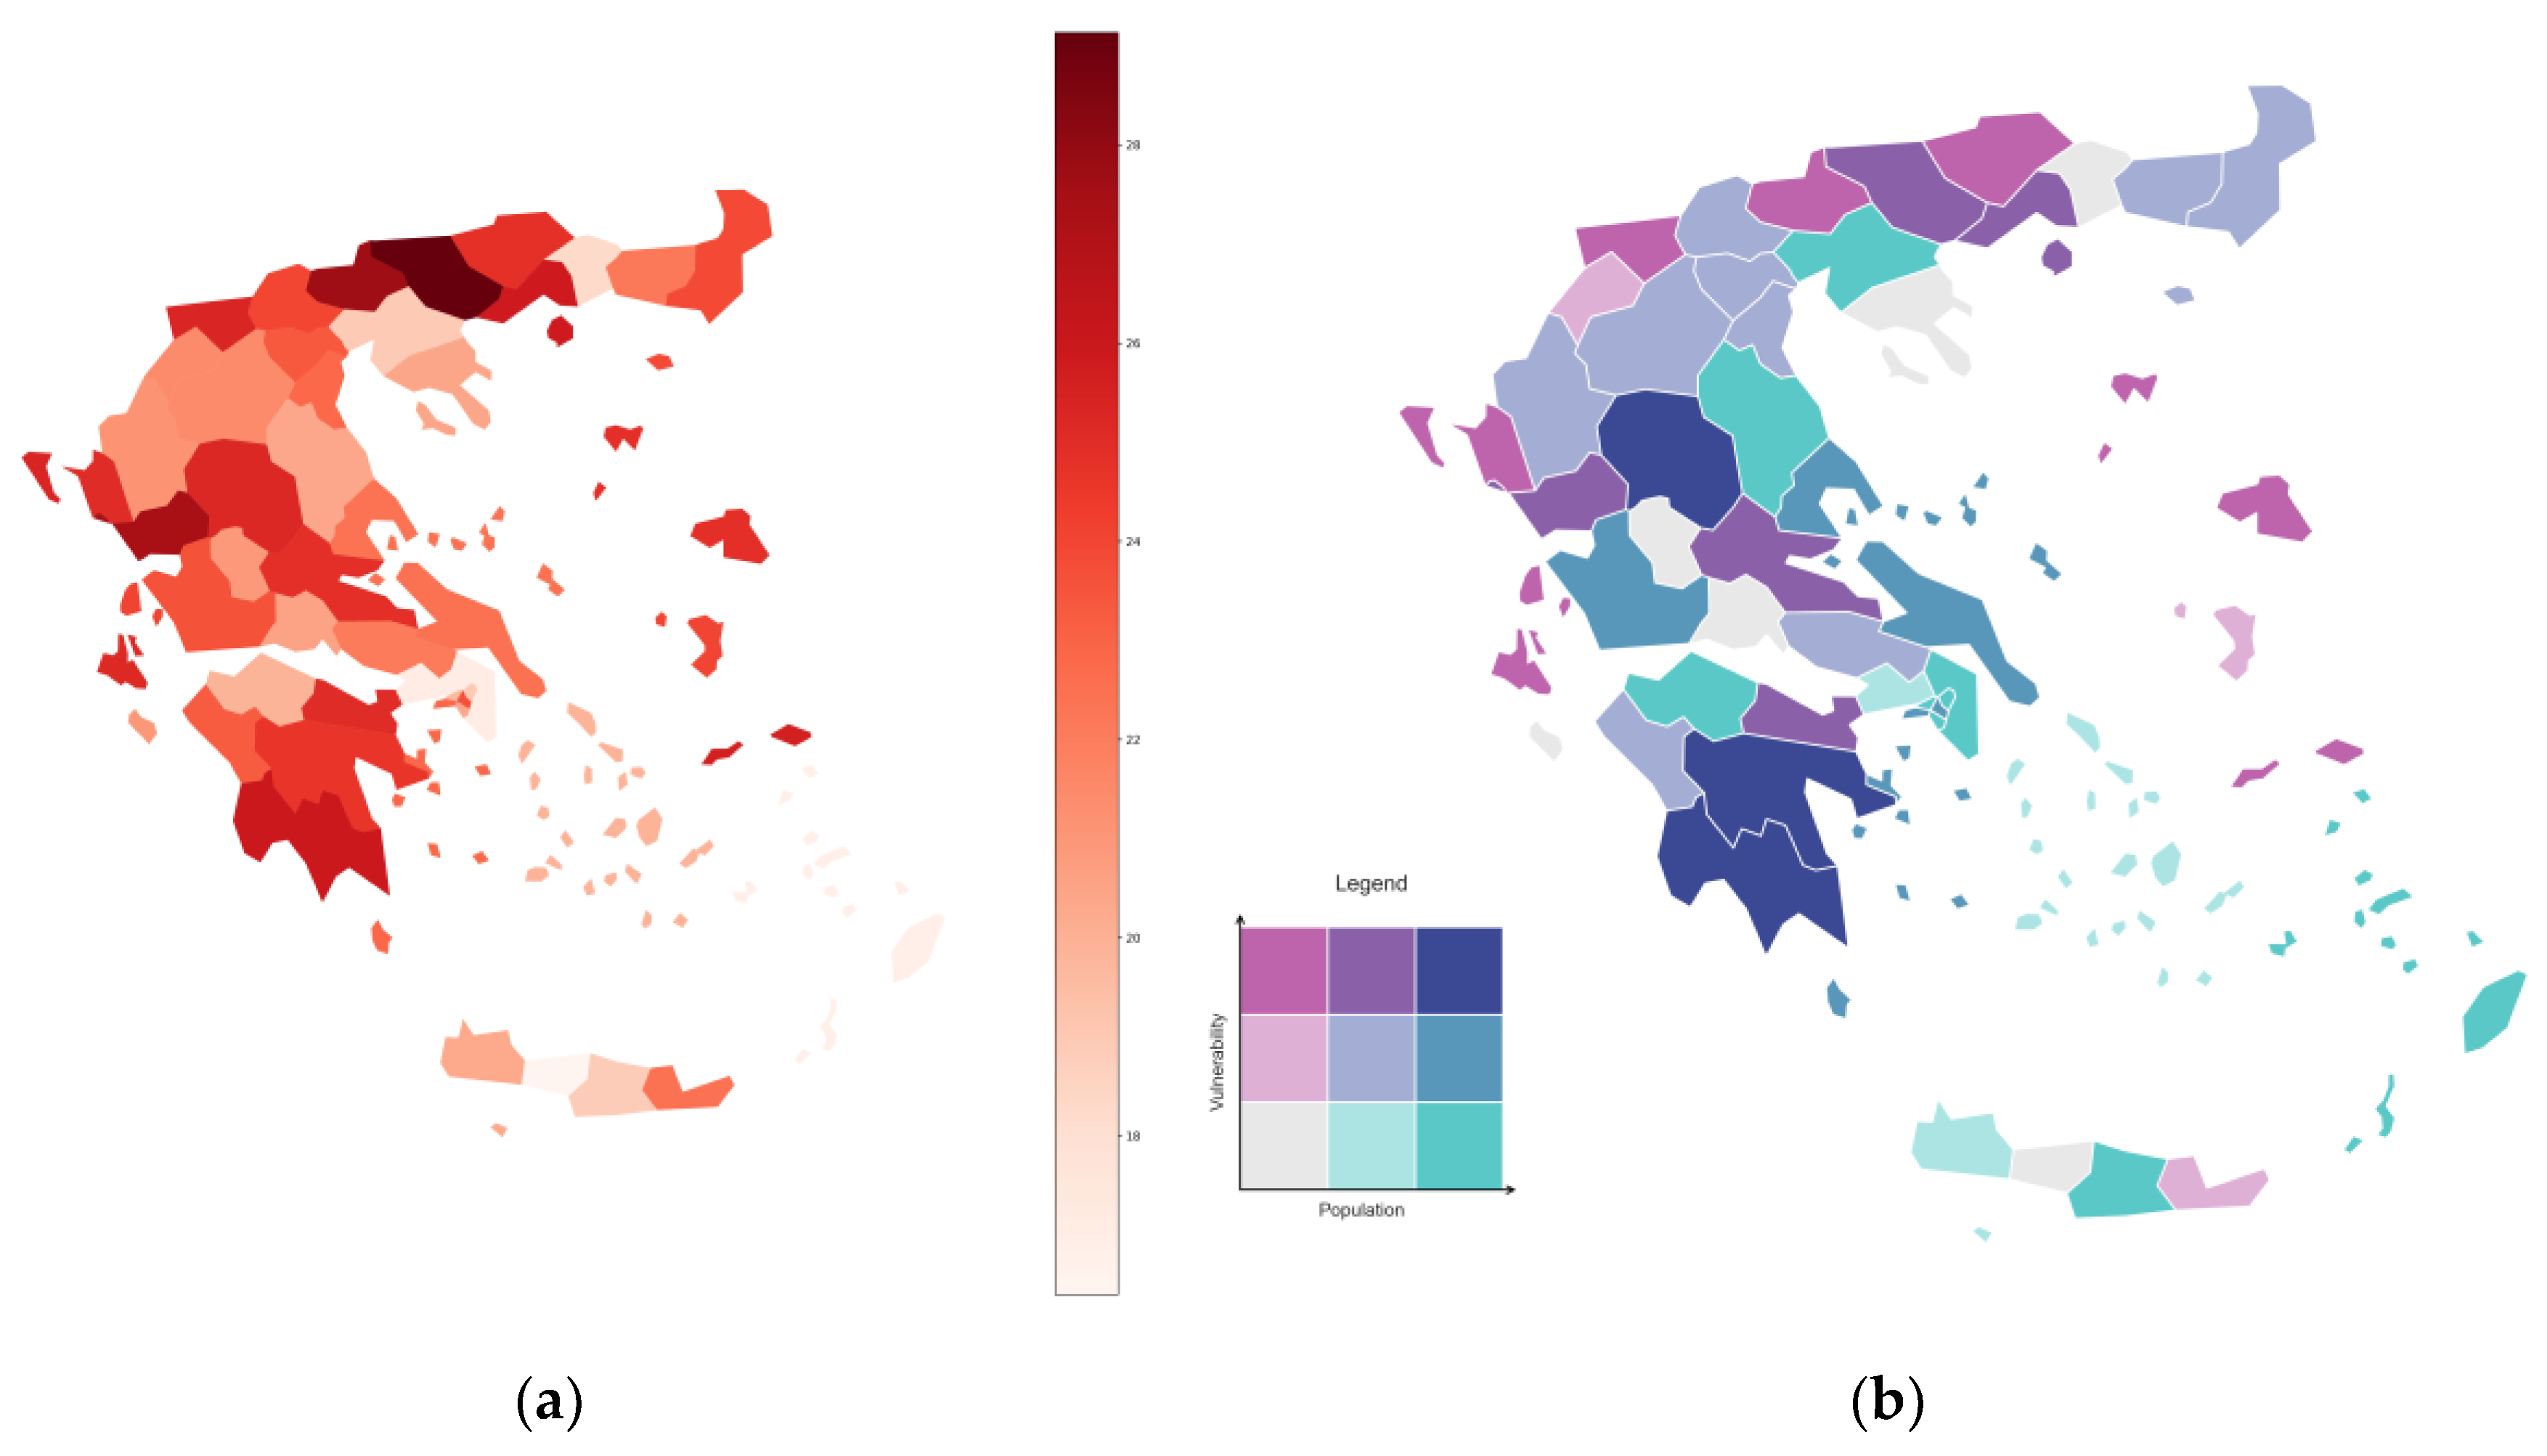
Figure 7.
(a) % SHVI values shown throughout the city of Athens by census tract and (b) 3-D bivariant graph indicating the overall exposure of the Athens population to extreme heat, by differentiating census tracts by both population and vulnerability scores.
Figure 7.
(a) % SHVI values shown throughout the city of Athens by census tract and (b) 3-D bivariant graph indicating the overall exposure of the Athens population to extreme heat, by differentiating census tracts by both population and vulnerability scores.
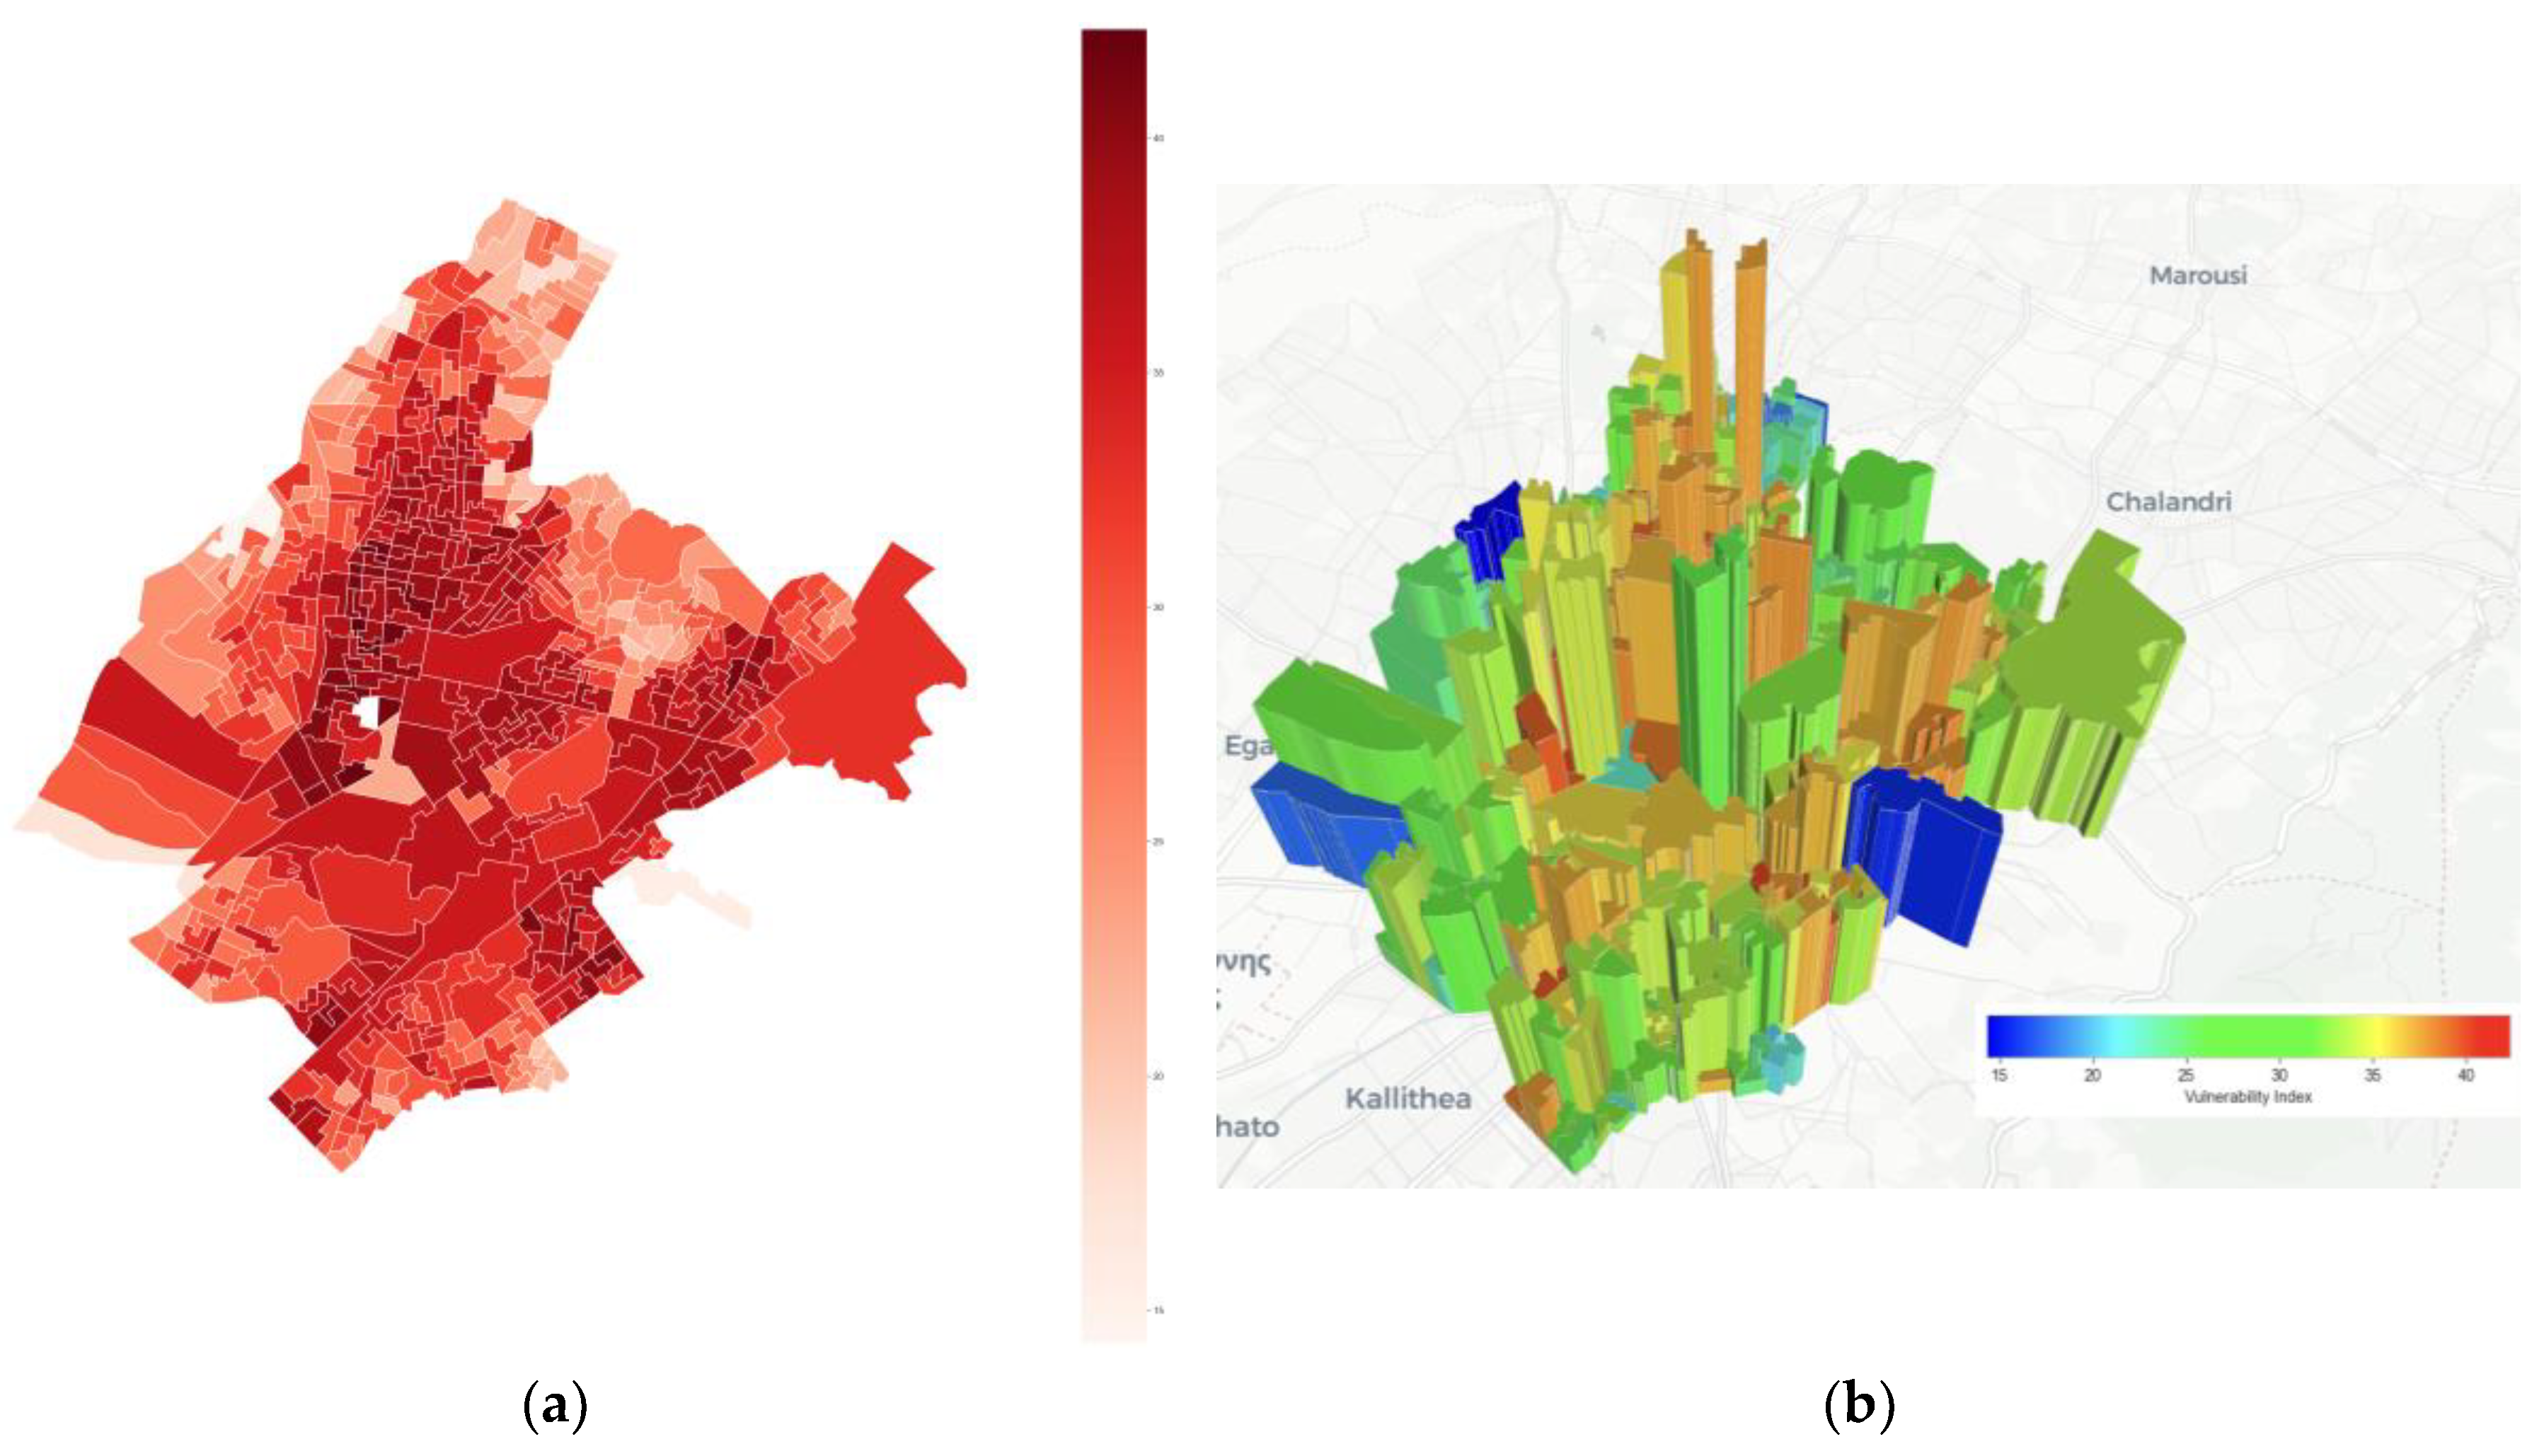
Figure 8.
SHVI scores for all NUTS3 regions in Greece grouped at the NUTS2 level.
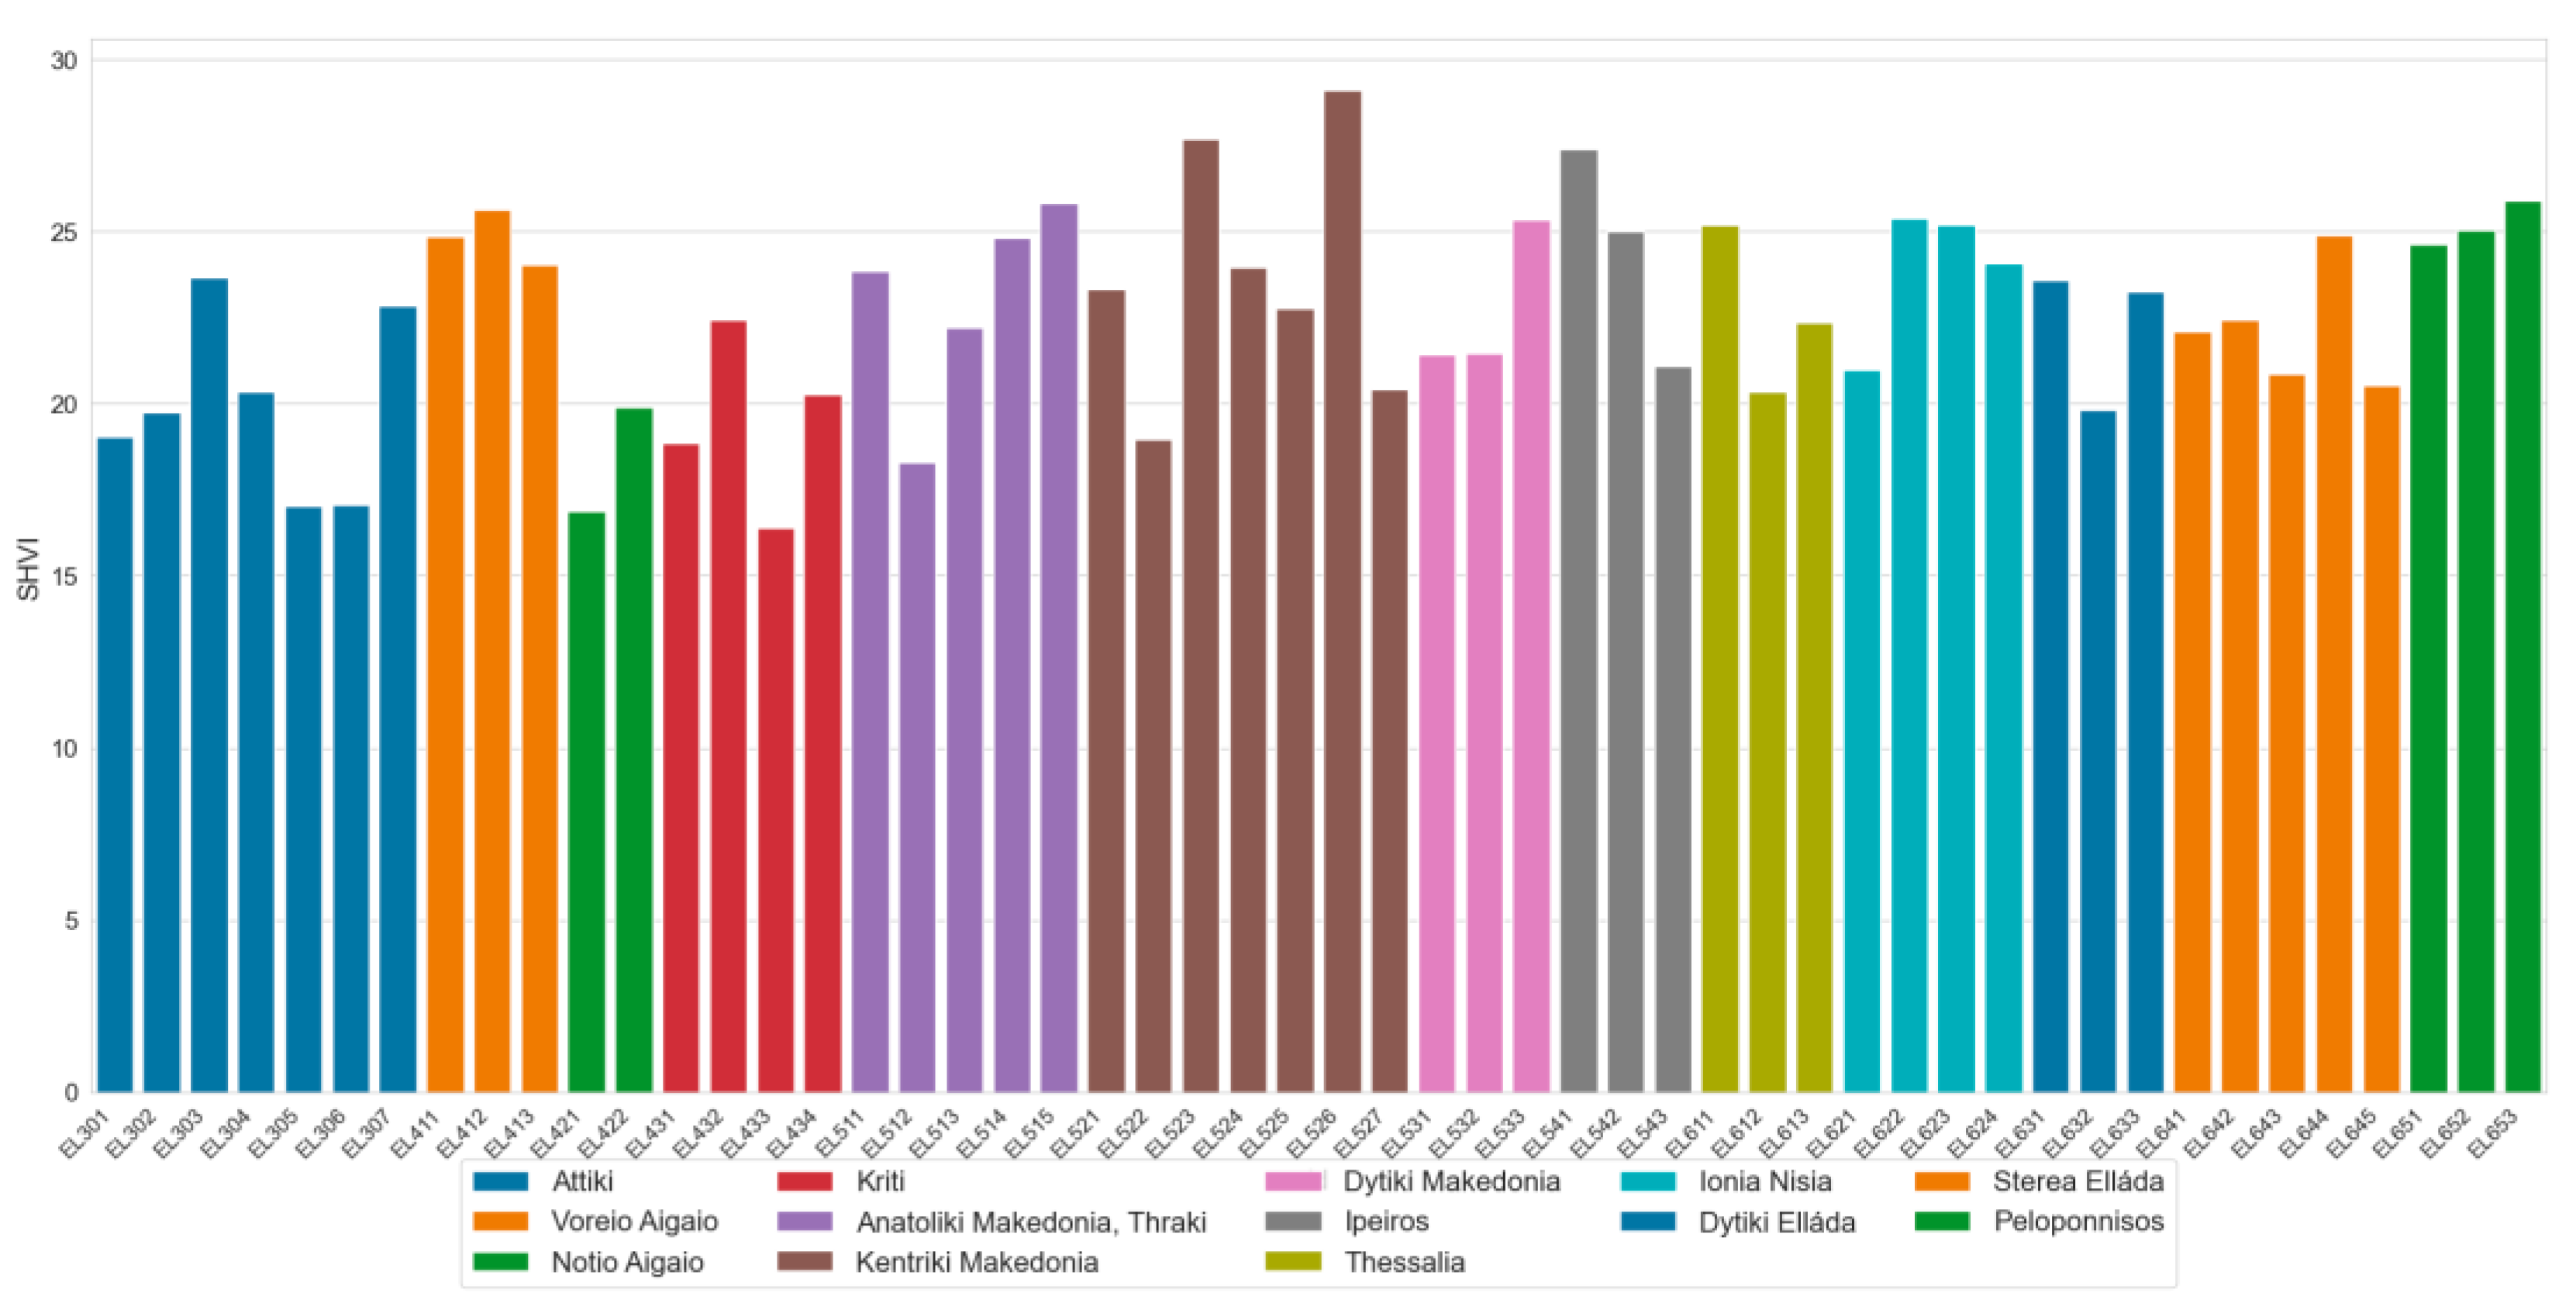
Figure 9.
Correlation between SHVI and distance from the center (in meters) for Athens.
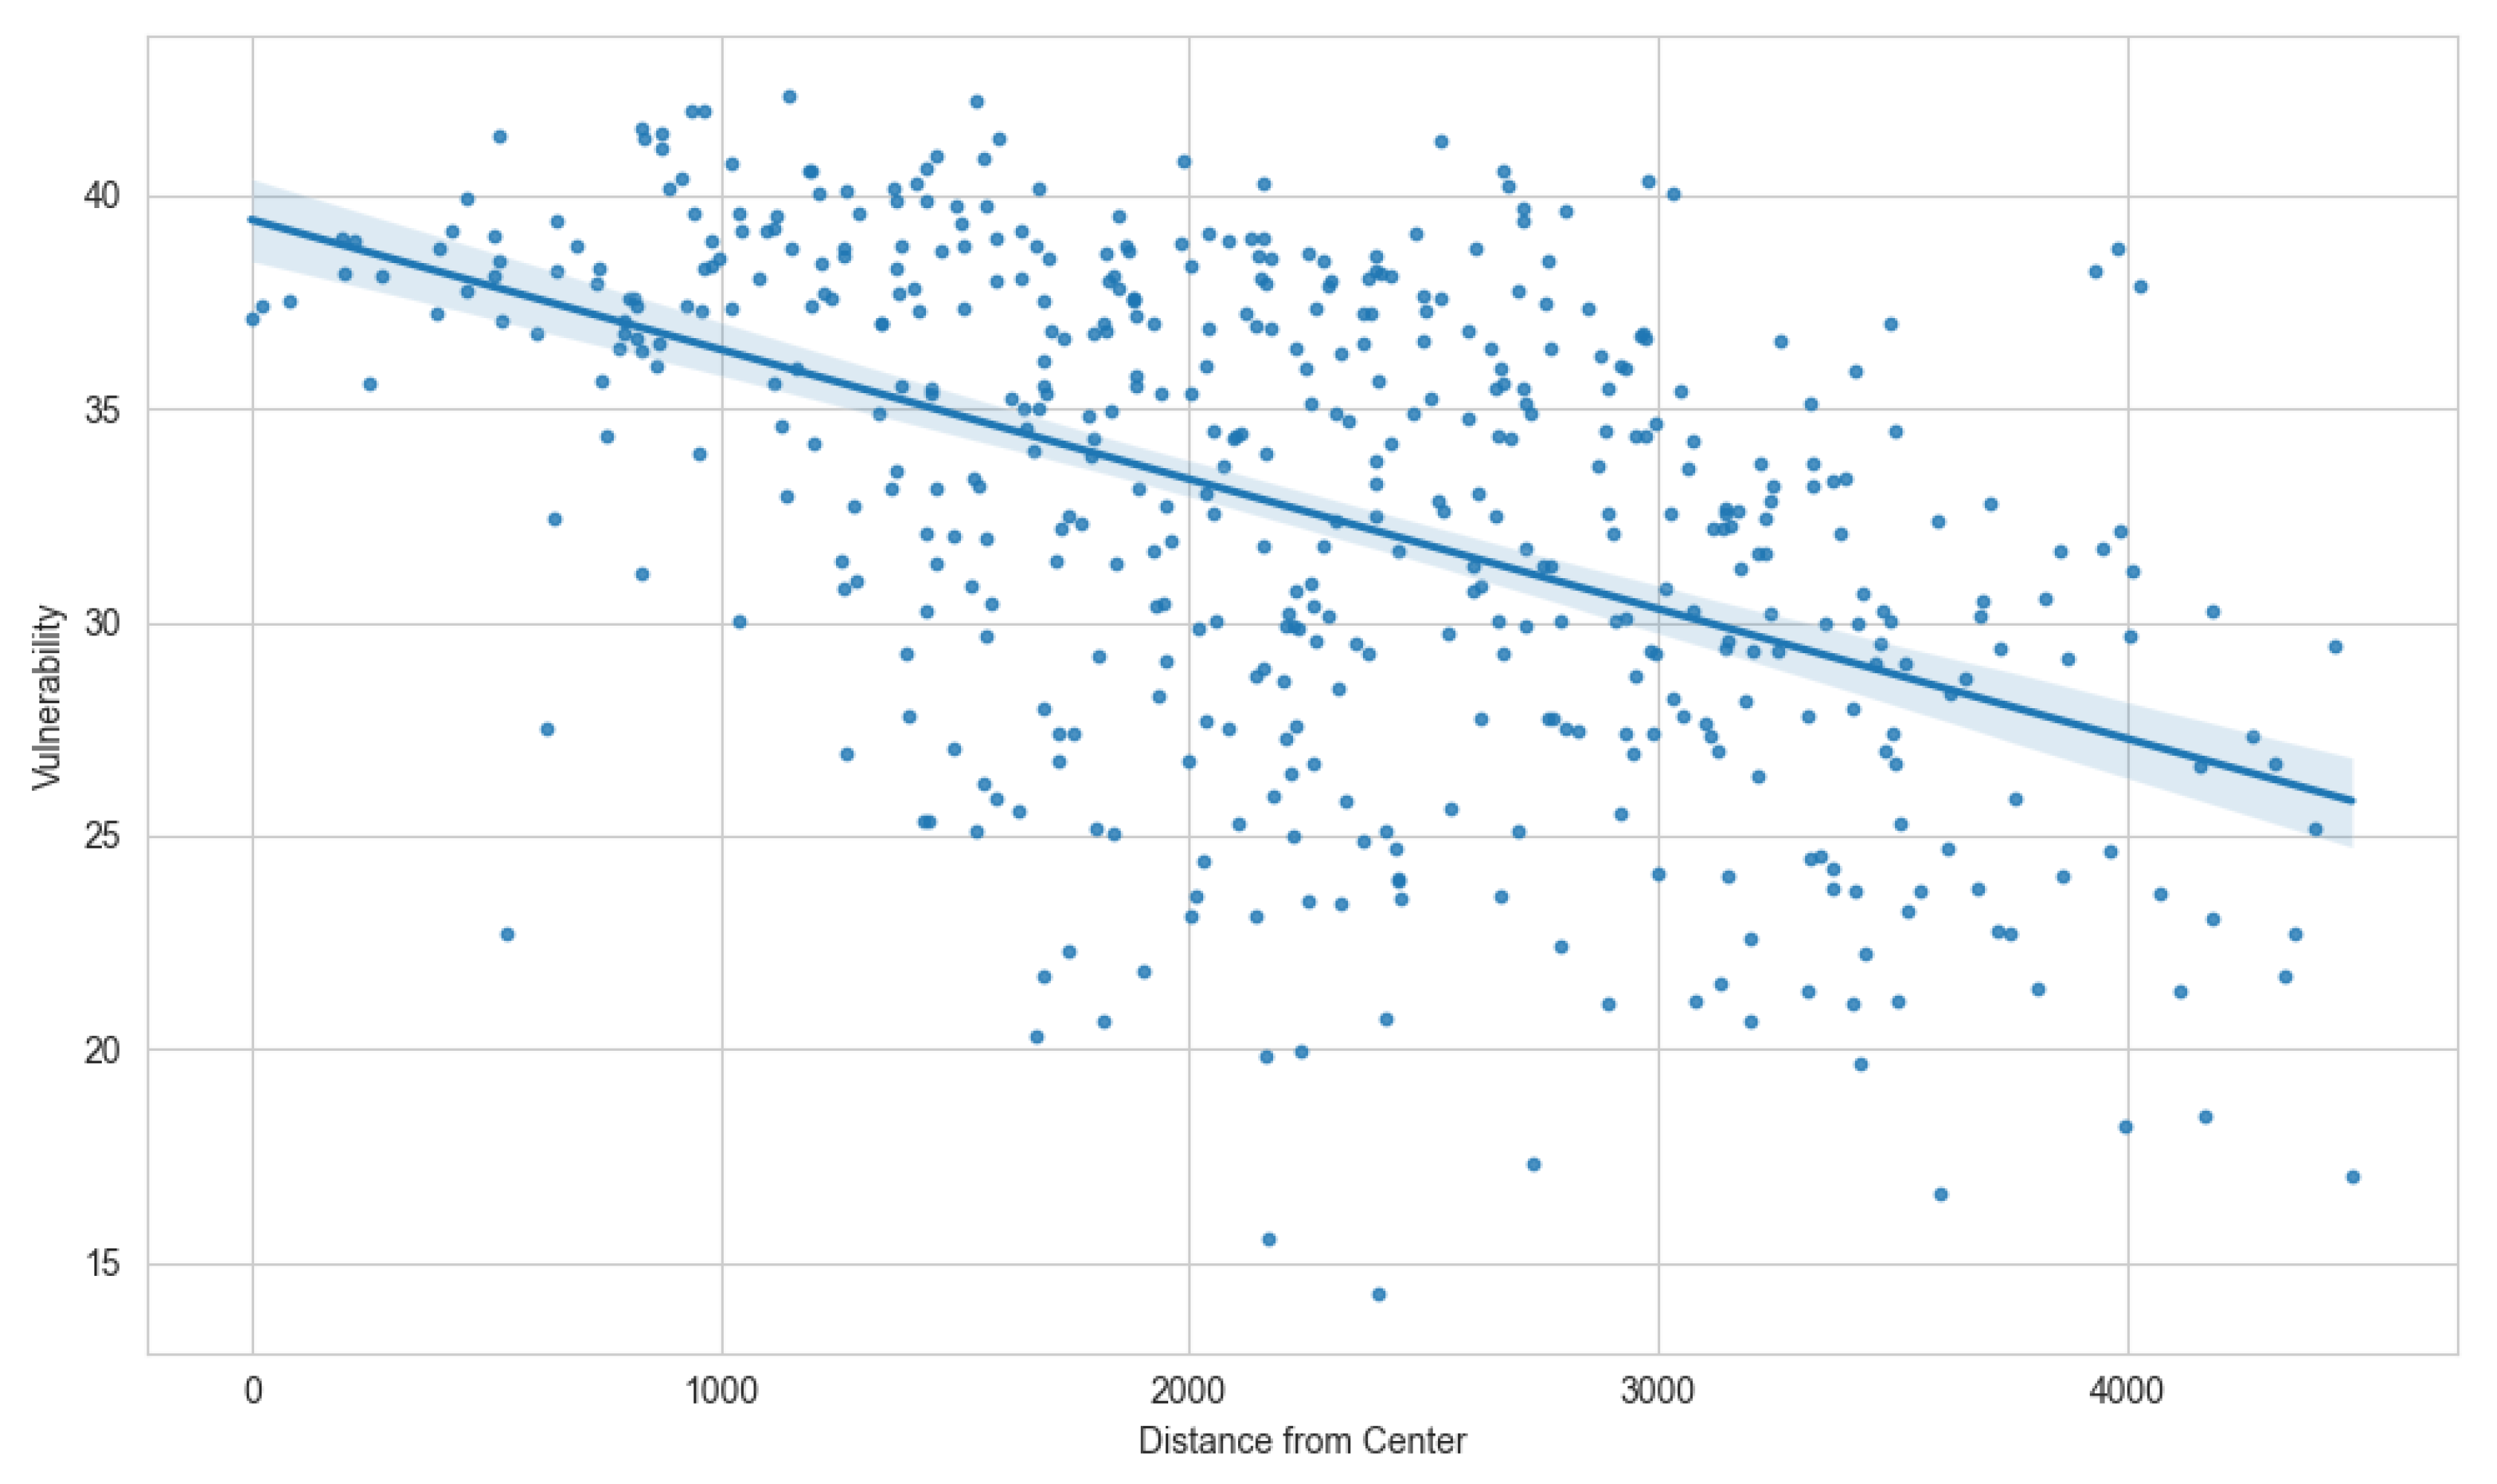

Table 1.
Socio-economic indicators used for the development of the SHVI.
| Data description | Scale and units | Data Source |
|---|---|---|
| Maximum temperature for 10 Greek cities, 2015-2020 | Hourly, Celsius | Open Weather Map https://openweathermap.org/ |
| Number of people by age group, from the 2011 national census | Per NUTS3 region and per census tract in Athens | Hellenic Statistical Authority |
| Number of people by country of origin, from the 2011 national census | Per NUTS3 region and per census tract in Athens | Hellenic Statistical Authority |
| Number of people by different household sizes (e.g. 2-people households, 4-people households, etc.) from the 2011 census | Per NUTS3 region and per census tract in Athens | Hellenic Statistical Authority |
| Number of people by employment status, (employed, looking for work, first-time looking, student, retired, independent, housework, other) from the 2011 census | Per NUTS3 region and per census tract in Athens | Hellenic Statistical Authority |
| Number of dwellings by living status (owner, renting, cooperative ownership, communal housing, other) from the 2011 census | Per NUTS3 region and per census tract in Athens | Hellenic Statistical Authority |
| Number of dwellings by square footage, from the 2011 census | Per NUTS3 region and per census tract in Athens | Hellenic Statistical Authority |
| Number of dwellings by age of building, from the 2011 census | Per NUTS3 region and per census tract in Athens | Hellenic Statistical Authority |
| Number of deaths by age group, 2015-2020 | Per NUTS3 region, weekly | Eurostat |
Table 2.
Regression results on the prediction of average number of daily deaths per 100,000 people during heatwaves for three methods.
Table 2.
Regression results on the prediction of average number of daily deaths per 100,000 people during heatwaves for three methods.
| Method | MSE | MAE | R2 |
|---|---|---|---|
| XGB | 2.1437 | 0.9 | 0.737 |
| Catboost | 3.724 | 1.688 | 0.726 |
| Random Forest | 4.882 | 1.9 | 0.642 |
Table 3.
Hyperparameter values for the selected XGB method.
| Hyperparameter name | Hyperparameter value |
|---|---|
| Column sample by tree | 0,862 |
| Gamma | 1,309 |
| Learning rate | 952 * 10-5 |
| Max depth | 17 |
| Minimum child weight | 2 |
| Number of estimators | 1372 |
| Alpha regularization | 0,2086 |
| Lambda regularization | 1,007 |
| Subsample | 0,96 |
Table 4.
Piecewise regression data – Young Population.
| No. Observations | 2983 | |||||
| No. Model Parameters | 4 | |||||
| Degrees of Freedom | 2979 | |||||
| Res. Sum of Squares | 1.29253e+05 | |||||
| Total Sum of Squares | 1.55617e+05 | |||||
| R Squared | 0.169419 | |||||
| Adjusted R Squared | 0.168303 | |||||
| Converged | True | |||||
| Estimate | Std Err | t-value | P>|t| | [0.025 | 0.975] | |
| Constant | 31.2981 | 0.395 | 79.296 | 0 | 30.524 | 32.072 |
| Alpha1 | 0.23707 | 0.0159 | 14.957 | 7.94e-49 | 0.206 | 0.26815 |
| Beta | 3.99292 | 0.387 | 10.326 | - | 3.2347 | 4.7511 |
| Breakpoint | 37.3017 | 0.253 | - | - | 36.806 | 37.797 |
| These alphas (gradients of segments) are estimated from betas (change in gradient) | ||||||
| Alpha2 | 4.23 | 0.386 | 10.948 | 2.23e-27 | 3.4724 | 4.9875 |
Table 5.
Piecewise regression data – Elderly Population.
| No. Observations | 2983 | |||||
| No. Model Parameters | 6 | |||||
| Degrees of Freedom | 2977 | |||||
| Res. Sum of Squares | 1.85371e+06 | |||||
| Total Sum of Squares | 2.65208e+06 | |||||
| R Squared | 0.301034 | |||||
| Adjusted R Squared | 0.299624 | |||||
| Converged | True | |||||
| Estimate | Std Err | t-value | P>|t| | [0.025 | 0.975] | |
| Constant | 274.319 | 2.33 | 117.8 | 0 | 269.75 | 278.89 |
| Alpha1 | -3.34262 | 0.121 | -27.629 | 8.9e-150 | -3.5798 | -3.1054 |
| Beta1 | 5.68021 | 0.573 | 9.9095 | - | 4.5563 | 6.8041 |
| Beta2 | 3.92391 | 0.759 | 5.1673 | - | 2.4349 | 5.4129 |
| Breakpoint1 | 26.8632 | 0.418 | - | - | 26.043 | 27.683 |
| Breakpoint2 | 32.9795 | 0.649 | - | - | 31.707 | 34.252 |
| These alphas (gradients of segments) are estimated from betas (change in gradient) | ||||||
| Alpha2 | 2.33759 | 0.56 | 4.1721 | 3.1e-05 | 1.239 | 3.4362 |
| Alpha3 | 6.2615 | 0.513 | 12.216 | 1.6e-33 | 5.2565 | 7.2665 |
Table 6.
Hyperparameter values for the selected XGB method.
| Feature Name | Feature Importance Value |
|---|---|
| % Elderly | 0.455 |
| % Retired | 0.245 |
| % Living in houses built before 1980 | 0.130 |
| % Living alone | 0.063 |
| % Renting | 0.058 |
| % Living in houses smaller than 60 m2 | 0.023 |
| % Unemployed | 0.014 |
| % Immigrants from developing countries | 0.010 |
Disclaimer/Publisher’s Note: The statements, opinions and data contained in all publications are solely those of the individual author(s) and contributor(s) and not of MDPI and/or the editor(s). MDPI and/or the editor(s) disclaim responsibility for any injury to people or property resulting from any ideas, methods, instructions or products referred to in the content. |
© 2024 by the authors. Licensee MDPI, Basel, Switzerland. This article is an open access article distributed under the terms and conditions of the Creative Commons Attribution (CC BY) license (http://creativecommons.org/licenses/by/4.0/).
Copyright: This open access article is published under a Creative Commons CC BY 4.0 license, which permit the free download, distribution, and reuse, provided that the author and preprint are cited in any reuse.


