Submitted:
11 June 2024
Posted:
12 June 2024
You are already at the latest version
Abstract
Gestational diabetes mellitus (GDM) triggers alterations in the maternal gut microbiome. Alongside metabolic shifts, microbial products may impact clinical factors and influence pregnancy outcomes. Here, we performed two separate analyses to integrate the maternal microbiome-metabolomic differences from a subset of the “Choosing Healthy Options in Carbohydrate Energy” (CHOICE) study. Women diagnosed with GDM were randomized to a diet higher in complex carbohydrates (CHOICE, n=18, 60% complex carbohydrate/25% fat/15% protein) or a conventional GDM diet (CONV, n=16, 40% carbohydrate/45% fat/15% protein). All meals were provided, diets were eucaloric, and fiber content was similar. CHOICE diet was associated with increases in TMAO, lysophosphotidylcholines, indoxyl sulfate, and several triglyceride (TG) species, while CONV diet was associated with higher plasma hippuric acid, aspartic acid, betaine, glutamic acid, indole propionic acid, and indoleacetic acid, suggesting that differences in lipid metabolism and tryptophan utilization pathways are linked to specific maternal diets. We also identified two latent metabolic groups not associated with either diet treatment: one metabolome associated with higher fasting glucose, and the other associated with higher fasting TGs after 7 weeks on either diet. Our study underscores the importance of utilizing dietary approaches to optimize maternal-fetal health outcomes in GDM treatment.
Keywords:
GDM
; Diabetes
; Microbiome
; Pregnancy
; Diet Intervention
; Metabolomics
1. Introduction
Maternal metabolism plays a critical role in regulation of fetal growth, organ development, epigenetic programming, and microbiome acquisition [1]. Of particular concern is the rise in maternal obesity, which now affects around 30% of women prior to pregnancy [2] and increases the risk of adverse pregnancy outcomes by 50% compared to women with a normal BMI [3]. During a healthy pregnancy, maternal insulin resistance develops in mid to late gestation to support fetal nutrient and energy demands [4]. Gestational diabetes mellitus (GDM) is a common condition in women with pre-existing obesity and insulin resistance, typically diagnosed by week 26 of pregnancy. In 2020, GDM impacted 7.8% of pregnancies in the US, and was much more likely in women with pre-pregnancy obesity compared to women with a lean BMI before pregnancy (12.6% vs 3.7%, respectively) [5]. In combination with obesity, GDM is associated with an increased risk for preeclampsia, cesarean section delivery, and preterm birth [6]. The American Diabetes Association suggests that dietary modifications alone may be sufficient to control GDM in 70-85% of diagnoses [7], achieved by reducing carbohydrate intake to 40% of total energy, and subsequently increasing lipid intake to offset the loss of energy [8]. However, evidence supporting a conventional GDM diet is currently lacking. GDM diets higher fat may accelerate weight gain and increase fetal fat mass, as well as exacerbate the chronic inflammatory profile developed during pregnancy, thereby increasing the long-term risk of offspring metabolic syndrome [8]. Thus, alternative diet options are needed that allow for adequate control of GDM while also providing lower fat and more palatable and culturally-sensitive dietary choices for women with GDM.
The maternal microbiome undergoes significant shifts and adapts in response to pregnancy-related changes [9]. These microbiome modifications are thought to prepare the vaginal and gut communities for vertical transfer of Bifidobacteria and other beneficial microbes to the infant, seeding the early gut environment [10]. In contrast, women with GDM tend to have gut communities enriched in opportunistic pathogens from the Enterobacteriaceae family, while Bifidobacteria are depleted [11]. Vertically transmitted microbes from mother to infant are significantly more likely to persist past 8 months of age [12], suggesting early life acquisition of maternal microbes shapes long-term development of the infant gut microbiome.
We previously found CHOICE diet increases Bifidobacteria and alters early life acquisition of the infant microbiome in women with GDM based on shotgun metagenomics [13]. Here, we describe the interaction between the maternal microbiome and plasma metabolome after a 7-week GDM diet-intervention using a randomized trial of a conventional high-fat, low complex carbohydrate intervention (CONV) or a low-fat, higher complex carbohydrate diet (CHOICE). We hypothesized that lipid species would differ in abundance between the CHOICE and CONV diets, and that these lipids would be associated with microbial metabolism of carbohydrates and lipid biosynthesis. Surprisingly, we found CHOICE was associated with higher triglyceride species, while CONV was associated with higher plasma amino acid levels and microbially-derived tryptophan metabolites. We also found latent metabolic clusters not associated with diet group, in which half of the participants responded to diet with higher fasting triglycerides (TGs), while the other half responded with elevated fasting glucose.
2. Materials and Methods
- Participants & Study Protocol
This study was approved by the Colorado Multiple Internal Review Board and was registered at http://www.clinicaltrials.gov (NCT02244814). All research was performed in accordance with relevant guidelines and regulations and study protocols have been described previously [14,15]. Briefly, GDM was diagnosed using the Carpenter and Coustan criteria [16] between gestational weeks 24 and 28. Entry criteria included age of 20-36 years, BMI of 26-39 kg/m2, a singleton pregnancy, no significant or obstetric comorbidities, no history of preterm labor or preeclampsia prior to term, and treatment of GDM with diet alone. Participants were excluded if they met criteria for overt diabetes, were likely to require more than GDM diet intervention (fasting glucose >105 mg/dL or fasting TGs >400 mg/dL), were taking beta blockers, antihypertensives, or glucocorticoids, were smokers, or were non-English speaking. From the original cohort of 46 women with GDM, 34 women in this subgroup had complete measurement data and stool samples from the study visits at 30- and 37-weeks’ gestation (n=16, CONV; n=18, CHOICE). Maternal stool samples were excluded if the participant used antibiotics within 4 weeks of the sampling time.
Dietary intervention began between gestational weeks 30 and 31 and continued to delivery. Detailed information on the diets has been described [17]. Briefly, diets were eucaloric, contained similar amounts of fiber, and had the following macronutrient distributions: CONV, 40% complex carbohydrate/45% fat/15% protein; CHOICE, 60% complex carbohydrate/25% fat/15% protein. Daily kilocalories were distributed as 25% breakfast/25% lunch/30% dinner/20% snacks. Importantly, carbohydrates in both diet arms were composed of foods with a low- to moderate-glycemic index. We defined complex carbohydrates as “polysaccharides and starches primarily derived from grains, vegetables, and fruits that tend to attenuate a sharp postprandial rise in plasma glucose” [15] All menus were tailored to individual participant food preferences and meals were prepared by the Clinical Translational Research Center (CTRC) Nutrition Services at the University of Colorado Anschutz Medical Campus. Meals were picked up by the participants or delivered every 72 hours when they met with investigators.
- Blood measures
Maternal blood samples were obtained at two different visits at 30-31- and 36-37-weeks’ gestation as described previously [15]. A fasting (10-h) blood sample was collected prior to a 2-h oral glucose tolerance test (OGTT) at baseline (30-31 weeks’) and again after 7 weeks on the diet (36-37 weeks’). OGTT measurements were taken at 0, 30, 60, 90, and 120 minutes using a peripheral intravenous line. Matsuda index was calculated using the standard method [18]. HOMA-IR was calculated as [fasting_insulin (uU/L) x (fasting_glucose (mmol/L)]/22.5. Hepatic insulin resistance was calculated by multiplying glucose area under the curve (AUC) by insulin AUC calculated during the first 30 minutes of the OGTT [19]. Gestational weight gain was determined by the change in weight from the first prenatal visit to delivery and weight gain on diet by the change in weight from time of diet randomization to delivery. Additional blood measures (i.e., TGs, free fatty acids (FFAs), glycerol, glucose, C-peptide, and insulin) were performed at breakfast meal studies at baseline and 36-37 weeks’ gestation, where participants consumed a standardized breakfast meal (30% of total daily energy intake) consistent with their randomized diet assignment after an overnight fast (≥10-h) as previously [15].
- Targeted plasma metabolomics
Aliquots of plasma obtained before and after diet therapy were analyzed by Biocrates (Innsbruck, Austria). Samples were shipped on dry ice and were stored at -80°C upon arrival. Biocrates' commercially available MxP® Quant 500 kit was used for the quantification of several endogenous metabolites of various biochemical classes. Lipids and hexoses were measured by flow injection analysis-tandem mass spectrometry (FIA-MS/MS) using a 5500 QTRAP® instrument (AB Sciex, Darmstadt, Germany) with an electrospray ionization (ESI) source, and small molecules were measured by liquid chromatography-tandem mass spectrometry (LC-MS/MS) using a different 5500 QTRAP® instrument (AB Sciex). The experimental metabolomics measurement technique is described in detail by patents EP1897014B1 and EP1875401B1. Briefly, a 96-well based sample preparation device was used to quantitatively analyze over 600 metabolites in each sample. The device consists of inserts that have been impregnated with internal standards, and a predefined sample amount was added to the inserts. Next, a phenyl isothiocyanate (PITC) solution was added to derivatize some of the analytes (e.g., amino acids), and after the derivatization was completed, the target analytes were extracted with an organic solvent, followed by a dilution step. The obtained extracts were then analyzed by FIA-MS/MS and LC-MS/MS methods using multiple reaction monitoring (MRM) to detect the analytes. Data were quantified using appropriate mass spectrometry software (SciexAnalyst®) and imported into Biocrates MetlDQ™ software for further analysis.
A short and medium chain fatty acid assay was established for human plasma samples. Internal standards were added to the samples and afterwards derivatized with a mixture of N-(3-dimethylaminopropyl)-N'-ethylcarbodiimide hydrochloride (EDC) and 3-nitrophenylhydrazine hydrochloride (3-NPH). The metabolites were determined by ultra-high-performance liquid chromatography-tandem mass spectrometry (UHPLC-MS/MS) with MRM in negative mode using a Xevo TQ-S (Waters, Vienna, Austria) instrument with ESI. All analytes were quantified using an external 7-point calibration. Data were quantified using appropriate mass spectrometry software (Waters MassLynx™) and imported into the Biocrates MetlDQ™ software for further analysis. The assay has been validated for human plasma according to European Medicines Agency (EMA) guidelines. As an alternate measure of health-associated metabolites, we used the Biocrates MetaboINDICATOR tool to combine metabolites into sums or ratios according to the analyte class or their association with obesity and diabetes. From the MetaboINDICATOR list, we created the following variables: ratio of secondary to primary bile acids, secondary bile acid conjugation, secondary bile acid synthesis, total amino acids, total aromatic amino acids, total branched-chain amino acids, total indoles, total cholesterol esters, total diacylglycerides, total lysophosphatidylcholine, total phosphatidylcholine, total phosphatidylcholine aa (two acyl-bound groups), total phosphatidylcholine ae (one acyl- and one alkyl-bound group), total sphingomyelin, total saturated TGs, total unsaturated TGs, total TGs, total ceramides, total long-chain ceramides (C14-C20), total very long-chain ceramides (> C20), and trimethylamine-N-oxide (TMAO synthesis). A detailed table of the equations used to create these variables can be found in Table S1.
- Stool sample collection and metagenomics processing
Maternal stool samples were collected at 30-31- and 36-37-weeks’ gestation by participants within 24 hours of their clinic visit and stored at -20°C until delivery to the laboratory, whereupon aliquots were separated and stored at -80°C until analysis. The DNA sequencing and processing protocols are described previously [13]. Briefly, DNA extraction was performed using the QIAamp PowerFecal DNA kit (Qiagen Inc, Carlsbad, CA). Triplicate shotgun metagenomic libraries were constructed for each stool sample (except for one pair of maternal samples, which was sequenced in duplicate) using the plexWell LP384 kit (seqWell Inc., Beverly, MA) following the manufacturer’s protocol. Shotgun metagenomic sequencing of the pooled libraries was performed on the NovaSeq 6000 (Illumina, San Diego, CA) at 2 x 150 bp read length by Novogene Inc. (Sacramento, CA). Raw sequence reads were trimmed and processed for quality using BBMap [20]. Metaphlan2 was used to retrieve the taxonomy and relative abundances using default settings [21]. The participants’ sequence libraries at all timepoints were further concatenated for contig assembly using MEGAHIT [22] Contigs ≥1000 bp were mapped to the MEGAHIT co-assembly using bowtie2 [23]. Contigs were predicted for gene function with Prodigal [24] using default settings and annotated to the KEGG database using KofamScan [25] Reads per kilobyte million (RPKM) were calculated for each annotation for downstream analysis.
- Statistical analysis
Metabolites were removed prior to analyses if >50% of the samples had values below the level of detection. The remaining values were imputed using ClustImpute if they were below the level of detection [26] with the following settings: 10 iterations, 10 steps to convergence, 2 clusters, 50 steps per iteration. Before conducting the analysis, the data were transformed. For the microbiota species, a pseudo-count of one was added to the count table, followed by transformation to relative abundance, and CLR-transformation. Species were removed from the analysis if more than 60% of stool samples had no detection of the taxa. The KEGG gene annotation RPKM values and metabolomics data were log2 transformed using a pseudo-count of one. We then used the transformed data to compute the delta (difference from baseline (31 weeks gestation) to 37 weeks gestation), allowing us to inspect the change in taxonomic abundances, KEGG gene content, and metabolomic measures associated with each diet group. The MixOmics R package [27] was used to identify metagenomic and metabolomic features that were altered between diet groups using the delta-transformed measures. Since we were interested in both taxonomy and KEGG gene annotation in the metagenomics data, we performed two separate analyses to integrate the taxonomic-metabolomics data, as well as the KEGG annotations-metabolomics data using the DIABLO method in the MixOmics package with a design matrix value of 0.1 to bias the model toward finding features related to diet. DIABLO models were tuned to determine the optimal number of features to keep (minimum 5, maximum 50) and the number of components required to fit the data. ANOVA was used to test for group-wise significance within the sPLS-DA ordination along component one. K-means clustering was used to split the metabolomics data into two groups based on the change in metabolic profile. These K-means groups were used to test for differences in the log fold change in clinical data including: fasting glucose, fasting insulin, fasting FFAs, fasting glycerol, fasting TGs, and values calculated from an OGTT for Matsuda index, glucose AUC, insulin AUC, hepatic insulin resistance, and HOMA-IR. LASSO regression identified features linking microbiota species or KEGG annotation with the metabolomics data and ANOVA was used to test for statistical significance. Next, Clusterprofiler [28] was used to conduct an over-representation analysis on the KEGG genes associated with diet, the metabolome, or our latent K-groups and to summarize the KEGG genes into KEGG pathways. False-discovery rate correction was applied to all statistical tests using the Benjamini-Hochberg method.
3. Results
3.1. CHOICE Diet Enriches Carbohydrate Metabolizing Pathways in the Gut Microbiome, Altering Lipid Metabolism and Tryptophan Utilization Pathways
To expand our secondary analysis of microbiome alterations in the CHOICE study [13], we measured maternal plasma metabolites at baseline and 37 weeks gestation. Our targeted metabolomics assay generated over 630 metabolites from the Biocrates MxP® Quant500 assay and 19 short-/medium-chain fatty acids for a total of 649 metabolites measured. Filtering metabolites in which >50% of samples had values below the level of detection produced a final total of 535 metabolites composed of 525 metabolites from the Quant500 assay, and 10 metabolites from the short-/medium-chain fatty acids assay. Of the metabolites removed, a majority belonged to lipid-related classes such as carnitines, ceramides, choline, diacylglycerides, or TGs. Several microbiome-related metabolites were also removed, including selected tryptophan derivatives (indole and serotonin) as well as the short-chain fatty acids propionate and butyrate, which were undetectable in the majority of subjects. Since these metabolites are biologically active compounds, we assessed whether there was a difference in detection between diet groups and found no evidence of a difference (chi-squared p > 0.05 for indole, serotonin, propionate, and butyrate). A full list of metabolites and their inclusion/exclusion from this analysis are available in Table S2. Unless noted otherwise, all subsequent data analyses were applied to values representing changes in microbiome or metabolome features through time (i.e., delta-transformed values).
We first integrated our gut taxonomic and plasma metabolomic data by diet group using the DIABLO pipeline in the MixOmics R package. sPLS-DA analysis selected nine microbial taxa and 50 metabolites that were significantly changed between diet groups. An ANOVA on component one of the sPLS-DA ordination suggests the DIABLO model significantly discriminates between diet groups (microbiome p<0.001, metabolome p<0.001) (Figure 1A). Several microbes were selected that were in accordance with our previous results (Figure 1B). Both Bifidobacterium adolescentis, and Ruminococcus bromii were enriched after CHOICE diet, as well as Bacteroides ovatus, Faecalibacterium prausnitzii, Parabacteroides merdae, and Bacteroides fragilis. In comparison, CONV diet resulted in a microbiome enriched in Bacteroides uniformis, Ruminococcus obeum, and Prevotella copri. Within the metabolomics data, CHOICE diet was associated with increases in TMAO, lysophosphotidylcholines, indoxyl sulfate, and several TG species, while CONV diet was associated with higher plasma hippuric acid, aspartic acid, betaine, glutamic acid, indole propionic acid, and indoleacetic acid, suggesting that differences in lipid metabolism and tryptophan utilization pathways are linked to diet. MetaboINDICATOR-transformed values showed no difference between diet groups, in agreement with our primary lipid outcomes (Figure 1C).
We then performed a similar analysis using microbial gene annotations in place of microbiota taxonomy (Figure 2A) and found 26 KEGG genes associated with diet group. Of these gene-diet associations, 19 were more abundant after CHOICE diet and eight were more abundant after CONV diet (Figure 2B and 2C, which display features discriminating diet groups along ordination components one and two, respectively). An ANOVA on component one of the sPLS-DA ordination suggests the DIABLO model with KEGG genes also discriminates between diet groups (microbiome p<0.01, metabolome p<0.001) (Figure 1A). (Figure 2A). Over-representation analysis suggests CHOICE diet increased the abundance of microbial genes related to carbohydrate metabolism, while CONV diet was associated with an enrichment of amino acid metabolism and inflammatory pathways, such as antimicrobial resistance and lipopolysaccharide (LPS) biosynthesis (Figure 2D).
3.2. Bimodal Response to GDM Diet Intervention Is Characterized by a Relative Increase of Fasting TGs or Fasting Glucose in Participants Independent of Diet Treatment Group
Next, we sought to identify latent metabolic groups within our data to identify differences in how participants responded to each diet treatment (i.e., how parameters changed relative to start of diet in terms of fold-change). Using K-means clustering on the transformed metabolomics data, we found two clusters that were not associated with either diet (chi-squared p=0.699). Upon further analysis, we found cluster one was associated with relatively higher levels of fasting plasma TGs after the diet treatment (KTG), while cluster two was associated with relatively higher fasting glucose (KGL) (Figure 3A, Table S3). Note that on average, both K groups displayed an increase in fasting TGs and a decrease in fasting glucose, which are changes we expected in late gestation (higher fasting TGs) and after several weeks on GDM diet intervention (lower fasting glucose). Compared to KGL, KTG had 50% higher fasting TGs (log2 fold change 0.169±0.272 and 0.338±0.180, respectively), concomitant with 62% lower fasting glucose (log2 fold change -0.063±0.112 and -0.165±0.133, respectively). MetaboINDICATOR-transformed values suggest that KTG has much higher plasma fasting lipid levels (total ceramides, total lysophosphatidylcholines, total TGs, total saturated TGs, total unsaturated TGs) compared to KGL (Figure 3B). We also found nominally significant associations between KGL and the relative abundances of Escherichia coli (p=0.017, p-adjust=0.173) and Ruminococcus torques (p=0.025, p-adjust=0.173), while KTG was enriched in Bacteroides xylanisolvens (p=0.044, p-adjust=0.173), though these comparisons did not survive FDR correction (Figure 3C, Table S4).
While none of the KEGG genes were significantly associated with K-means groups after FDR (Table S5), the pathways represented by the genes differed significantly between KTG and KGL microbiomes (Figure 3D). The KTG cluster acquired genes related to the biosynthesis of cofactors (B vitamins), including Riboflavin (B2) Metabolism, Pantothenate (B5) Biosynthesis, Folate (B9) Biosynthesis, and Nicotinate and Nicotinamide (B3) Metabolism. In contrast, KGL was characterized by an increase in carbohydrate-metabolizing pathways (Ascorbate and Aldarate Metabolism, Pentose and Glucuronate Interconversions, Propanoate Metabolism, and Glycolysis/Gluconeogenesis), amino acid/nucleotide metabolism (Nucleotide Metabolism, Purine Metabolism, Pyrimidine Metabolism, and Arginine Biosynthesis), and pathways related to virulence factors (Teichoic Acid Biosynthesis, Cationic Antimicrobial Peptide (CAMP) Resistance, and Staphylococcus Aureus Infection). The full list of pathways can be found in Table S6.
3.3. Microbiome Metabolic Pathways Are Negatively Associated with Host Plasma Lipid Levels
Since we found evidence of latent metabolic groups within our data, we interrogated the data for linear associations between gut microbes and plasma metabolites regardless of diet or K-group. Using LASSO variable selection and ANOVA, we identified associations between various lipids and common gut bacteria such as Ruminococcus hominis, P. copri, and Dorea formicigenerans. Notably, many of the lipids associated with gut microbes had a fatty acid C18 chain length (Table S7). We also found a negative relationship between taxa and two amino acids: Bifidobacterium bifidum and glycine, as well as Klebsiella pneumoniae and isovalerate.
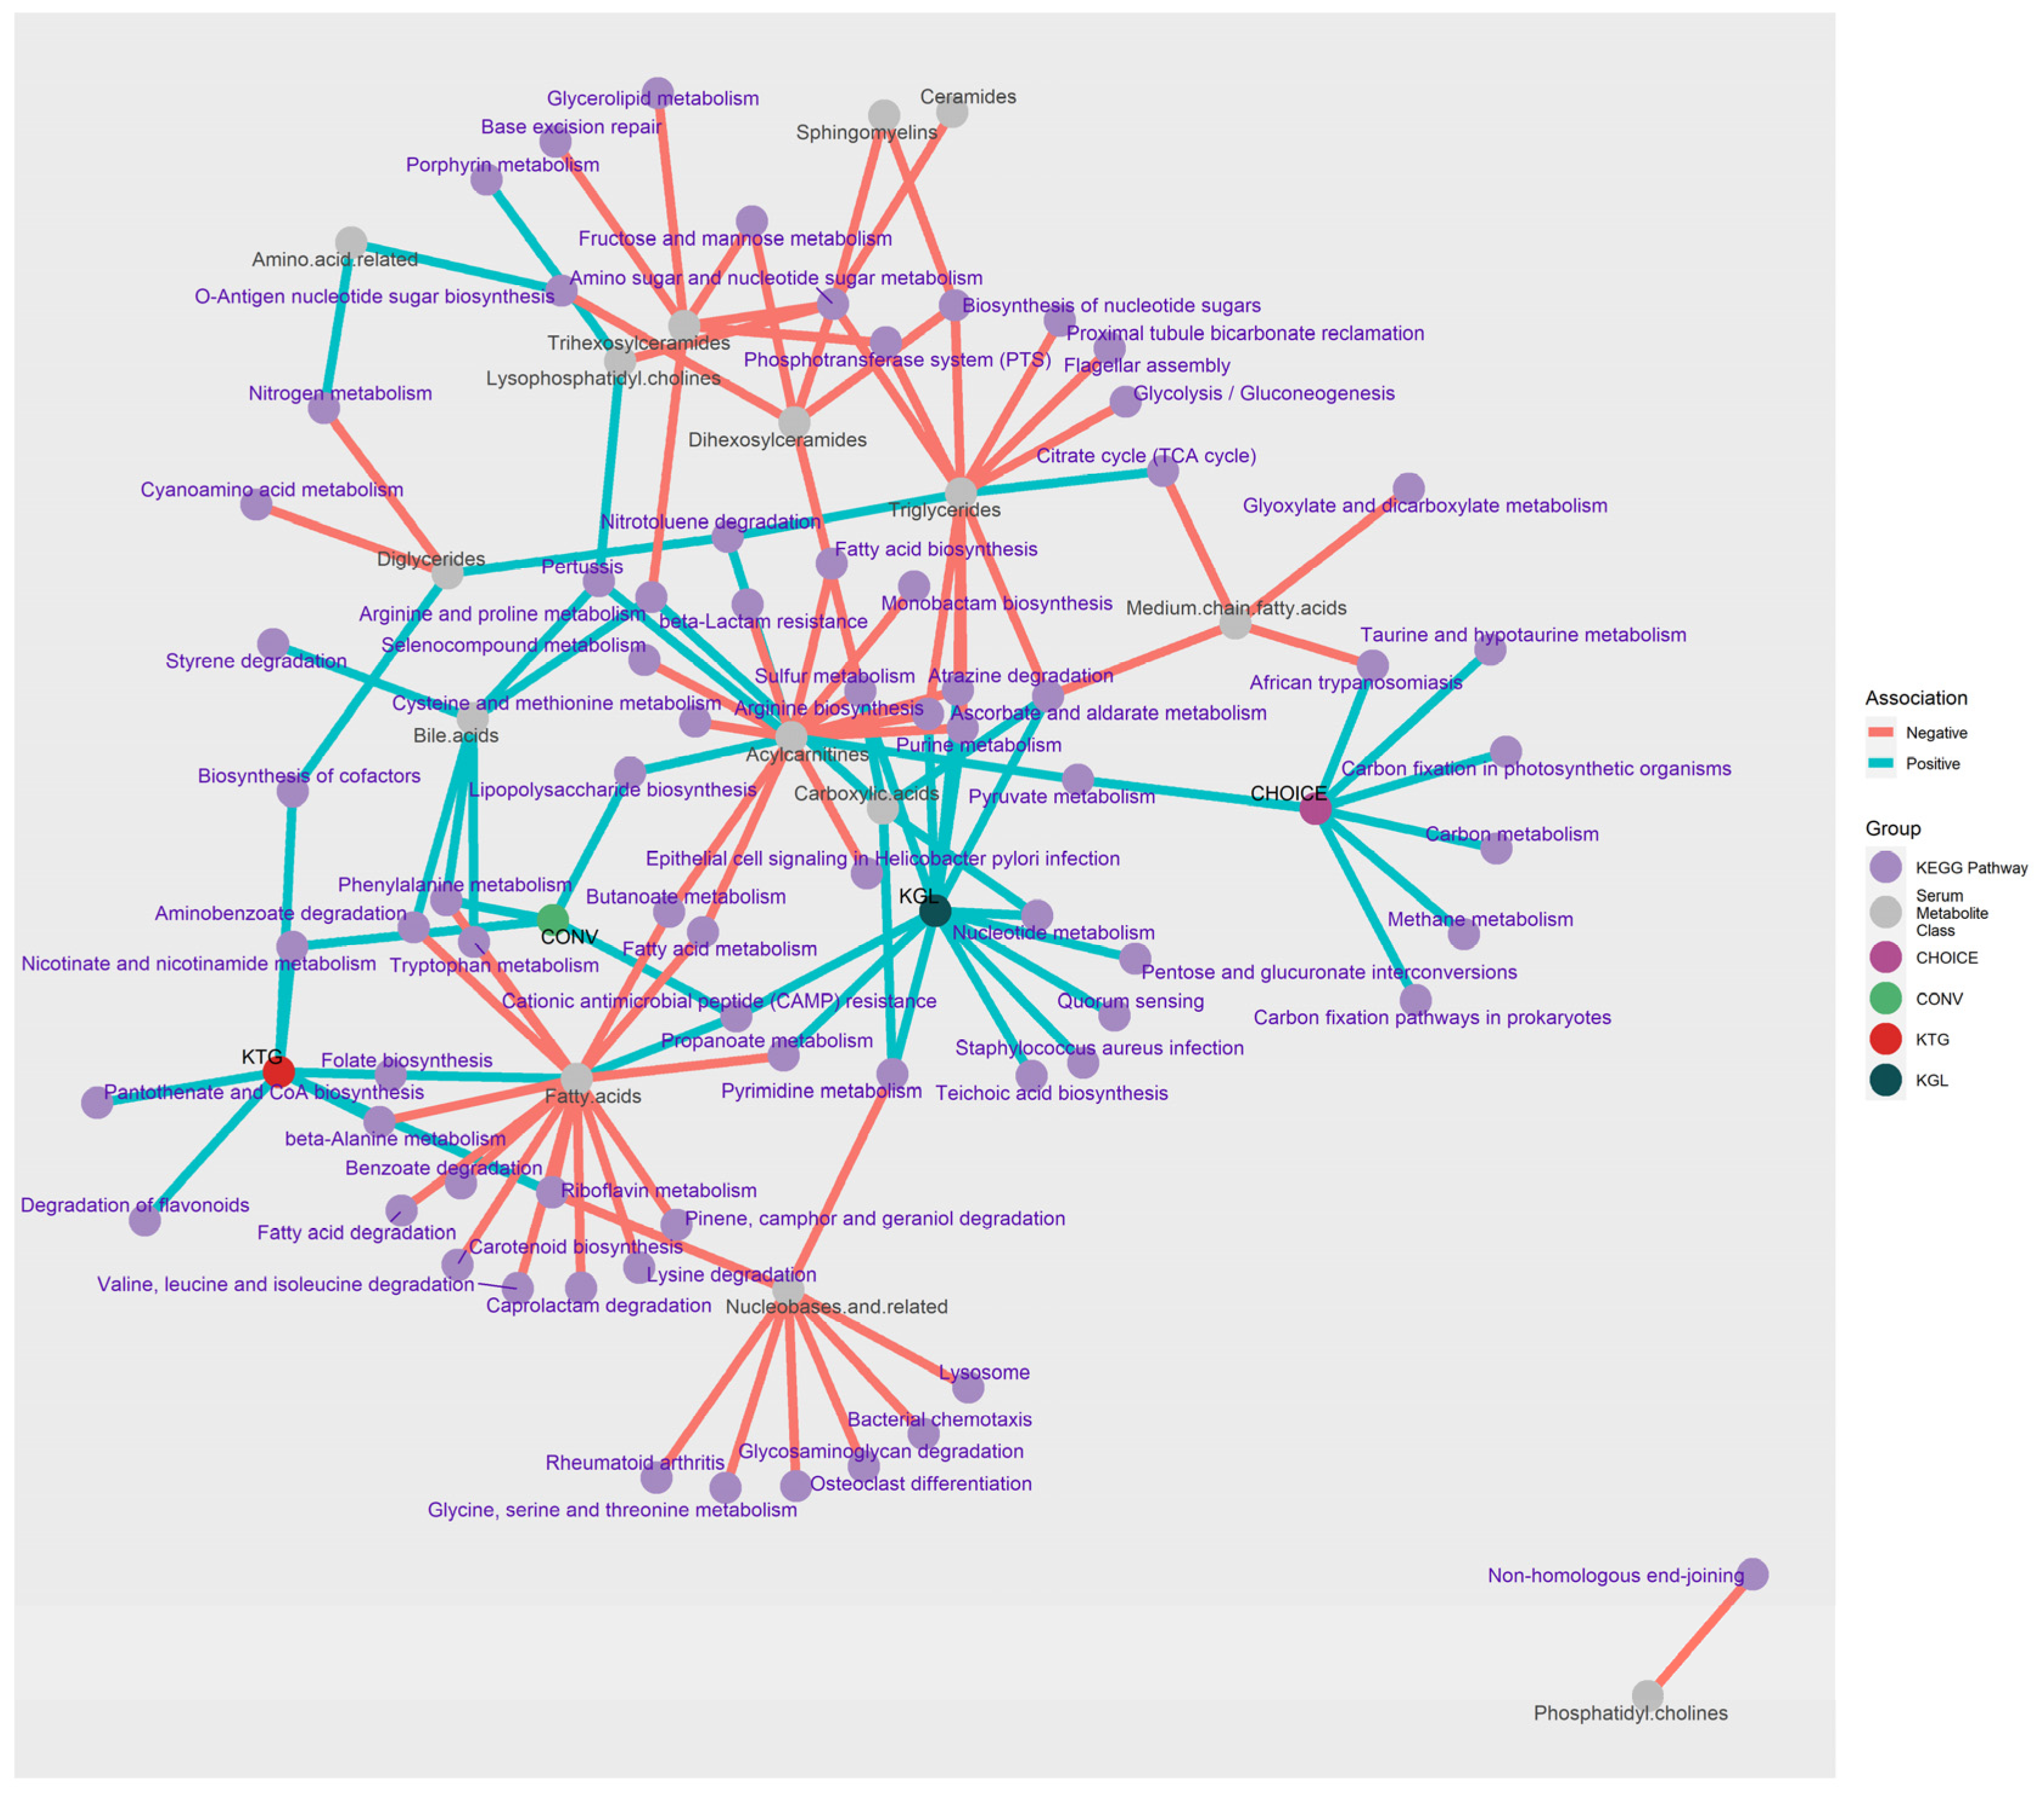
LASSO regression between metabolites and KEGG gene annotations identified 1131 significant associations after FDR correction. To interpret these results, KEGG genes were grouped by metabolite class and direction of association before differentially abundant pathways were determined using an over-representation analysis (Table S8). To aid in the interpretation of these data, a network plot showing the KEGG pathways linked to metabolites, diet group, and K-means group is shown in Figure 4. Around 2/3s of the pathways identified from the KEGG annotations were negatively associated with plasma metabolites (negative n=67, positive n=25), and almost half of the analyte classes belonged to Fatty Acids, TGs, or Acylcarnitines (n=45).
Plasma fatty acids (specifically, docosahexaenoic acid, dodecanoic acid, eicosadienoic acid, and eicosapentaenoic acid) were positively associated with Folate (B9) Biosynthesis and CAMP Resistance. Negative associations (n=15 pathways) were with Riboflavin (B2) Metabolism, Carotenoid Biosynthesis, and K01692 (paaF, echA; enoyl-CoA hydratase), which is involved in the beta oxidation of fatty acids and has activity in a variety of pathways (Beta-Alanine Metabolism; Valine, Leucine and Isoleucine Degradation; Phenylalanine Metabolism; Tryptophan Metabolism; Aminobenzoate Degradation; and Lysine Degradation). Despite being composed of fatty acid chains, plasma TGs were not associated with any fatty acid-related pathways. Rather, TGs were positively associated with Nitrotoluene Degradation and the Citrate Cycle (TCA cycle), and negatively associated with carbohydrate metabolism and uptake pathways (Glycolysis/Gluconeogenesis, Phosphotransferase System (PTS), and Ascorbate and Aldarate Metabolism) as well as nucleotide and amino acid recycling (Amino Sugar and Nucleotide Sugar Metabolism, Purine Metabolism, Arginine Biosynthesis, and Biosynthesis of Nucleotide Sugars).
Several lipid classes (carnitines, TGs, fatty acids) shared KEGG gene pathways with each other. Metabolite classes acylcarnitines-fatty acids shared Fatty Acid Metabolism and Butanoate Metabolism; acylcarnitine-TGs shared amino acid metabolism pathways (Arginine Biosynthesis, Atrazine Degradation, Purine Metabolism, Sulfur Metabolism); fatty acids-bile acids shared phenolic-compound metabolism (Tryptophan and Phenylalanine Metabolism and Aminobenzoate Degradation). The KEGG pathway Amino Sugar and Nucleotide Sugar Metabolism was negatively associated with six plasma lipid classes within TGs, ceramides, sphingomyelins, and lysophosphotidylcholines, representing the pathway with the greatest number of associations with the change in plasma metabolite levels after 7 weeks on diet. A full list of the over-representation analysis results can be found in Table S6.
4. Discussion
As global rates of GDM incidence continue to climb, it is more important than ever to have effective and well-tolerated dietary interventions to manage glycemia, reduce the risk of adverse pregnancy outcomes, and improve maternal and fetal health. In this follow-up sub-analysis of the CHOICE cohort, we investigated the impact of two GDM diet treatments on the gut microbiome and plasma metabolomic profile in pregnant women with GDM. We identified several changes to the gut microbiome at the taxonomic and functional levels as well as two latent metabolic groups associated with relatively higher late gestation fasting TG and glucose levels. Our findings revealed significant associations between GDM diet intervention, microbial taxa, and plasma metabolites, shedding light on potential mechanisms underlying metabolic changes observed in diet control of GDM.
Several of the diet-associated metabolites can be produced by gut microbes. For instance, we found CHOICE diet enriched in indoxyl sulfate and CONV diet enriched in indole propionic acid, indoleacetic acid, hippuric acid, and betaine. Tryptophan metabolism occurs through three pathways: one human (kynurenine), one bacterial (indole and indole derivatives), and one shared (serotonin) [29,30]. In a recent analysis on a multi-ethnic cohort of type 2 diabetes (T2D) patients, indoleacetic acid was positively associated with T2D, while indole propionic acid was negatively associated, and indoxyl sulfate had no association with T2D [31]. In particular, indole propionic acid has been investigated for its beneficial role in health [32] and it may play a role in T2D development through the regulation and preservation of pancreatic beta cells [33,34]. Other examples of microbially-derived metabolites can be found in germ-free mouse studies, where germ-free mice have decreased levels of TMAO, hippuric acid, and indole derivatives compared to specific pathogen-free mice [35]. We saw increases in plasma hippuric acid in participants on CONV diet; hippuric acid has been linked to better insulin secretion and lower fasting glucose levels in patients at high risk for T2D [36]. Similarly, supplementation of betaine has been shown to lower circulating TGs [37], which, in addition to diet, may explain why CONV diet was not associated with increases in many fasting TG species compared to CHOICE diet.
In contrast to CONV diet, one of the top metabolites associated with CHOICE diet was TMAO, a metabolic byproduct of gut microbiome metabolism of dietary choline, carnitine, and betaine [38]. TMAO has been implicated in various physiological processes in health and disease. These include lipid metabolism, inflammation, and cardiovascular health, though its exact role remains controversial [38]. This controversy continues in its role with GDM, where some studies report positive associations between TMAO levels and GDM [39,40], while others report a negative [41,42] or no association [43]. A recent study measured plasma TMAO and its metabolic precursor, TMA, and found the conversion of TMA to TMAO conversion ratio (TMAO:TMA) was inversely associated with GDM, while TMA levels were positively associated with GDM [44]. Moreover, the highest levels of circulating TMAO are achieved after fish consumption, a dietary pattern known to have beneficial effects on health [38]. Together, this suggests a potential role of TMA, rather than TMAO, in GDM pathophysiology, though more research is needed to elucidate the mechanisms underlying the effects of TMA and TMAO in pregnancy. Despite the primary analysis finding no difference in GDM glycemia between diet arms [15], these findings suggest CONV diet participants have an overall healthier metabolomic profile than CHOICE diet participants, reflected by changes in lipid metabolism, amino acid utilization, and microbial metabolism of dietary components.
Concordant with our previous microbiome analysis [14], we identified distinct shifts in gut microbiome composition associated with diet intervention. CHOICE diet was enriched in beneficial taxa such as B. adolescentis and R. bromii. We also observed an enrichment of genes related to carbohydrate metabolism after CHOICE diet. Both B. adolescentis and R. bromii are key metabolizers of complex carbohydrates within the gut microbiome [45]. A reduction in B. adolescentis has previously been linked to T2D in humans [46], while administration of B. adolescentis has been shown to improve insulin sensitivity and reduce accumulated fat mass in high-fat diet-fed rats [47]. In the human gut, R. bromii is a key primary degrader of complex carbohydrates [48], though its relationship with diabetes is unclear. R. bromii was significantly higher in women with GDM in the second trimester [49], while others have found R. bromii was decreased in women with GDM across all trimesters of pregnancy [50]. Similar to our previous analysis, CONV diet treatment was associated with an enrichment in P. copri. A higher abundance of P. copri is associated with worse insulin resistance and glycemic control both in adults with and without T2D [51,52,53] through the biosynthesis of branched-chain amino acids and LPS by the taxon [51,52]. Both branched-chain amino acids [54] and LPS [55,56] are implicated in the development and maintenance of insulin resistance by enhancing inflammation and lipid accumulation in various tissues [57,58]. While CONV diet was not associated with changes in branched-chain amino acid levels, KEGG gene pathways revealed an enrichment in amino acid metabolism and inflammatory pathways such as antimicrobial resistance and LPS biosynthesis, that potentially impact gut function in women with GDM on higher fat diets.
Despite no significant associations between taxonomy and K-group, the gene content between KTG and KGL microbiomes differed significantly after GDM diet intervention. Interestingly, several pathways negatively associated with the lipid class of analytes were positively associated with KGL (relatively higher fasting glucose), including CAMP Resistance, Propanoate Metabolism, Ascorbate/Alderate Metabolism, Atrazine Degradation, Arginine Biosynthesis, Sulfur Metabolism, Nucleotide Metabolism, Pyrimidine Metabolism, and Purine Metabolism. This suggests that the KGL group, which has relatively lower fasting plasma TGs, may be due to shifts in microbial gene content associated with reductions in plasma lipid levels. We also identified a link between the Folate Biosynthesis pathway and increased plasma docosahexaenoic acid and eicosapentaenoic acid, which are downstream products of linolenic acid. A murine study investigating the effects of a folate-poor diet on circulating lipids found hypermethylation of Fads2, which encodes the first step in the desaturation and elongation of linoleic acid and linolenic acid to arachidonic acid and docosahexaenoic acid, respectively [59]. These findings align with previous studies suggesting that diet modulates the gut microbiome, with implications for host metabolism and health outcomes. For example, plant-based diets (legumes, grains, fruits, and vegetables) promote the growth of beneficial bacteria and enhance metabolic function, while diets rich in saturated fats (meat, eggs, cheese) can alter microbial composition and contribute to metabolic dysfunction [60,61]. Within this paradigm, it is interesting to note that microbiome shifts in CHOICE diet participants resemble alterations due to plant-based diets, while microbiome shifts on CONV diet resembled a microbiome fed an animal-based diet, despite the diets only differing in macronutrient content of carbohydrate and fat (i.e., protein was the same). On the other hand, our plasma metabolomics data suggest CHOICE diet participants had relatively larger increases in fasting TGs and other lipid species, while CONV diet shows evidence of metabolic shifts towards healthier GDM outcomes, as noted above. Moreover, KTG and KGL were not associated with diet group, but likely reflect differences in response to diet treatment within each diet arm. Thus, in our cohort of pregnant women with GDM, alterations to microbiome composition and function were closely linked to the intake of carbohydrates and lipids, while plasma metabolic changes relied on diet and other variables such as host response to diet as well as microbiome metabolic responses to changes in macronutrient availability.
While the primary outcomes of this cohort were adequately powered [17], human gut microbiome and metabolomics data contain a large amount of variability due to differences in genetics, developmental programming events, and lifestyle. Additionally, since this is a secondary analysis using a subset of CHOICE participants, limitations of this study include the small sample size relative to the number of variables included in the analysis. We also acknowledge that several biologically-relevant metabolites (e.g., indole and butyrate) were excluded from the analysis due to the measurements falling below the limit of detection. Strengths of the study include the randomized controlled trial study design, and close monitoring of participant adherence to diet. Future studies with larger cohorts are warranted to validate our findings and elucidate causal relationships between dietary interventions, gut microbiome dynamics, and maternal metabolic health in GDM. Moreover, mechanistic studies exploring the functional roles of specific microbial taxa and metabolic pathways in modulating host metabolism during pregnancy are needed to provide deeper insights into the underlying mechanisms. Integrating multi-omics approaches, including metagenomics, transcriptomics, proteomics, and metabolomics, will enable comprehensive characterization of the host-microbiome interactions driving metabolic changes in GDM and illuminate the intricate processes linking gut microbiome activity to host metabolism in circulation and in tissues.
Our study highlights the complex interplay between dietary interventions, gut microbiome composition, and plasma metabolites in pregnant women with GDM. Given the significant associations between diet, microbiome, and metabolic health, personalized dietary approaches tailored to individual metabolic profiles and microbial communities may offer promising strategies for optimizing maternal-fetal health outcomes in GDM diet interventions.
Supplementary Materials
The following supporting information can be downloaded at: www.mdpi.com/xxx/s1, Table S1: Equations for MetaboINDICATOR-transformed metabolomics data. Table S2: Metabolites that were kept or removed from the analysis. Table S3: Fasting plasma measures compared by K-means group. Table S4: ANOVA of LASSO-selected species versus K-means group. Table S5: ANOVA of LASSO-selected KEGG gene annotations versus K-means group. Table S6: Over-representation analysis of KEGG genes associated with diet group, K-means group, or metabolomics data. Table S7: ANOVA of plasma metabolites versus microbiome species after LASSO variable selection. Table S8: ANOVA of plasma metabolites versus microbiome KEGG gene annotations after LASSO variable selection.
Author Contributions
TLH and LAB designed the clinical study from which samples were generated. DNF and JEF provided guidance on the study design related to microbiome studies data interpretation and analysis. JMK processed stool samples for sequence acquisition. KYS performed biostatistical and bioinformatic analyses. All authors contributed to and approved the manuscript.
Funding
This study was supported by the National Institute of Diabetes, Digestive, and Kidney Diseases (R01 DKTG01659 to TLH), American Diabetes Association/Glaxo Smith Kline Targeted Research Award (1-13-GSK-13), and Janssen Pharmaceuticals. The funders had no role in the design, conduct, or reporting of this work.
Data Availability Statement
The shotgun metagenomic data generated and analyzed during the current study are deposited in the NCBI Sequence Read Archive under BioProject ID PRJNA845806. https://www.ncbi.nlm.nih.gov/sra.
Acknowledgments
The authors wish to thank the participants of the CHOICE study and Emily Dunn, Kristy Rolloff, Laurie Kay Moss, Nicole Hirsch, and Sarah Farabi at University of Colorado Anschutz Medical Campus for collection and storage of clinical samples. We thank Rachel Janssen for editing the manuscript.
Conflicts of Interest
The authors declare no conflicts of interest.
References
- Hsu; Tain The Good, the Bad, and the Ugly of Pregnancy Nutrients and Developmental Programming of Adult Disease. Nutrients 2019, 11, 894. [CrossRef]
- Driscoll, A.; Gregory, E. Increases in Prepregnancy Obesity: United States, 2016–2019. NCHS Data Brief 2020, 392. [Google Scholar]
- Wang, M.C.; Freaney, P.M.; Perak, A.M.; Greenland, P.; Lloyd-Jones, D.M.; Grobman, W.A.; Khan, S.S. Trends in Prepregnancy Obesity and Association With Adverse Pregnancy Outcomes in the United States, 2013 to 2018. J Am Heart Assoc 2021, 10. [Google Scholar] [CrossRef]
- Sonagra, A.D. Normal Pregnancy- A State of Insulin Resistance. JOURNAL OF CLINICAL AND DIAGNOSTIC RESEARCH 2014. [Google Scholar] [CrossRef]
- Gregory, E.C.; Ely, D.M. Trends and Characteristics in Gestational Diabetes: United States, 2016-2020. Natl Vital Stat Rep 2022, 71, 1–15. [Google Scholar]
- Black, M.H.; Sacks, D.A.; Xiang, A.H.; Lawrence, J.M. Clinical Outcomes of Pregnancies Complicated by Mild Gestational Diabetes Mellitus Differ by Combinations of Abnormal Oral Glucose Tolerance Test Values. Diabetes Care 2010, 33, 2524–2530. [Google Scholar] [CrossRef]
- American Diabetes Association Management of Diabetes in Pregnancy. Diabetes Care 2017, 40, S114–S119. [CrossRef]
- Black, M.H.; Sacks, D.A.; Xiang, A.H.; Lawrence, J.M. Clinical Outcomes of Pregnancies Complicated by Mild Gestational Diabetes Mellitus Differ by Combinations of Abnormal Oral Glucose Tolerance Test Values. Diabetes Care 2010, 33, 2524–2530. [Google Scholar] [CrossRef]
- Parrettini, S.; Caroli, A.; Torlone, E. Nutrition and Metabolic Adaptations in Physiological and Complicated Pregnancy: Focus on Obesity and Gestational Diabetes. Front Endocrinol (Lausanne) 2020, 11. [Google Scholar] [CrossRef]
- Gorczyca, K.; Obuchowska, A.; Kimber-Trojnar, Ż.; Wierzchowska-Opoka, M.; Leszczyńska-Gorzelak, B. Changes in the Gut Microbiome and Pathologies in Pregnancy. Int J Environ Res Public Health 2022, 19, 9961. [Google Scholar] [CrossRef]
- Kuang, Y.-S.; Lu, J.-H.; Li, S.-H.; Li, J.-H.; Yuan, M.-Y.; He, J.-R.; Chen, N.-N.; Xiao, W.-Q.; Shen, S.-Y.; Qiu, L.; et al. Connections between the Human Gut Microbiome and Gestational Diabetes Mellitus. Gigascience 2017, 6. [Google Scholar] [CrossRef]
- Lou, Y.C.; Olm, M.R.; Diamond, S.; Crits-Christoph, A.; Firek, B.A.; Baker, R.; Morowitz, M.J.; Banfield, J.F. Infant Gut Strain Persistence Is Associated with Maternal Origin, Phylogeny, and Traits Including Surface Adhesion and Iron Acquisition. Cell Rep Med 2021, 2, 100393. [Google Scholar] [CrossRef]
- Sugino, K.Y.; Hernandez, T.L.; Barbour, L.A.; Kofonow, J.M.; Frank, D.N.; Friedman, J.E. A Maternal Higher-Complex Carbohydrate Diet Increases Bifidobacteria and Alters Early Life Acquisition of the Infant Microbiome in Women with Gestational Diabetes Mellitus. Front Endocrinol (Lausanne) 2022, 13, 921464. [Google Scholar] [CrossRef]
- Sugino, K.Y.; Hernandez, T.L.; Barbour, L.A.; Kofonow, J.M.; Frank, D.N.; Friedman, J.E. A Maternal Higher-Complex Carbohydrate Diet Increases Bifidobacteria and Alters Early Life Acquisition of the Infant Microbiome in Women with Gestational Diabetes Mellitus. Front Endocrinol (Lausanne) 2022, 13, 921464. [Google Scholar] [CrossRef]
- Hernandez, T.L.; Farabi, S.S.; Fosdick, B.K.; Hirsch, N.; Dunn, E.Z.; Rolloff, K.; Corbett, J.P.; Haugen, E.; Marden, T.; Higgins, J.; et al. Randomization to a Provided Higher-Complex-Carbohydrate Versus Conventional Diet in Gestational Diabetes Mellitus Results in Similar Newborn Adiposity. Diabetes Care 2023, 46, 1931–1940. [Google Scholar] [CrossRef]
- ACOG Practice Bulletin, No. 190: Gestational Diabetes Mellitus. Obstetrics and gynecology 2018, 131, e49–e64. [Google Scholar] [CrossRef]
- Hernandez, T.L.; Farabi, S.S.; Fosdick, B.K.; Hirsch, N.; Dunn, E.Z.; Rolloff, K.; Corbett, J.P.; Haugen, E.; Marden, T.; Higgins, J.; et al. Randomization to a Provided Higher-Complex-Carbohydrate Versus Conventional Diet in Gestational Diabetes Mellitus Results in Similar Newborn Adiposity. Diabetes Care 2023, 46, 1931–1940. [Google Scholar] [CrossRef]
- Matsuda, M.; DeFronzo, R.A. Insulin Sensitivity Indices Obtained from Oral Glucose Tolerance Testing: Comparison with the Euglycemic Insulin Clamp. Diabetes Care 1999, 22, 1462–1470. [Google Scholar] [CrossRef]
- Abdul-Ghani, M.A.; Matsuda, M.; Balas, B.; DeFronzo, R.A. Muscle and Liver Insulin Resistance Indexes Derived from the Oral Glucose Tolerance Test. Diabetes Care 2007, 30, 89–94. [Google Scholar] [CrossRef]
- Bushnell, B. BBMap: A Fast, Accurate, Splice-Aware Aligner. undefined 2014. [Google Scholar]
- Truong, D.T.; Franzosa, E.A.; Tickle, T.L.; Scholz, M.; Weingart, G.; Pasolli, E.; Tett, A.; Huttenhower, C.; Segata, N. MetaPhlAn2 for Enhanced Metagenomic Taxonomic Profiling. Nature Methods 2015 12:10 2015, 12, 902–903. [Google Scholar] [CrossRef]
- Li, D.; Luo, R.; Liu, C.M.; Leung, C.M.; Ting, H.F.; Sadakane, K.; Yamashita, H.; Lam, T.W. MEGAHIT v1.0: A Fast and Scalable Metagenome Assembler Driven by Advanced Methodologies and Community Practices. Methods 2016. [CrossRef]
- Langmead, B.; Trapnell, C.; Pop, M.; Salzberg, S.L. Ultrafast and Memory-Efficient Alignment of Short DNA Sequences to the Human Genome. Genome Biol 2009, 10, 1–10. [Google Scholar] [CrossRef]
- D, H.; GL, C.; PF, L.; ML, L.; FW, L.; LJ, H.; Hyatt, D.; Chen, G.L.; LoCascio, P.F.; Land, M.L.; et al. Prodigal: Prokaryotic Gene Recognition and Translation Initiation Site Identification. BMC Bioinformatics 2010, 11, 1–11. [Google Scholar] [CrossRef]
- Aramaki, T.; Blanc-Mathieu, R.; Endo, H.; Ohkubo, K.; Kanehisa, M.; Goto, S.; Ogata, H. KofamKOALA: KEGG Ortholog Assignment Based on Profile HMM and Adaptive Score Threshold. Bioinformatics 2020, 36, 2251–2252. [Google Scholar] [CrossRef]
- Pfaffel, O. ClustImpute: An R Package for k-Means Clustering with Build-in Missing Data Imputation. 2020. [CrossRef]
- Rohart, F.; Gautier, B.; Singh, A.; Lê Cao, K.-A. MixOmics: An R Package for ‘omics Feature Selection and Multiple Data Integration. PLoS Comput Biol 2017, 13, e1005752. [Google Scholar] [CrossRef]
- Wu, T.; Hu, E.; Xu, S.; Chen, M.; Guo, P.; Dai, Z.; Feng, T.; Zhou, L.; Tang, W.; Zhan, L.; et al. ClusterProfiler 4.0: A Universal Enrichment Tool for Interpreting Omics Data. The Innovation 2021, 2, 100141. [Google Scholar] [CrossRef]
- Ye, X.; Li, H.; Anjum, K.; Zhong, X.; Miao, S.; Zheng, G.; Liu, W.; Li, L. Dual Role of Indoles Derived From Intestinal Microbiota on Human Health. Front Immunol 2022, 13. [Google Scholar] [CrossRef]
- Sanidad, K.Z.; Rager, S.L.; Carrow, H.C.; Ananthanarayanan, A.; Callaghan, R.; Hart, L.R.; Li, T.; Ravisankar, P.; Brown, J.A.; Amir, M.; et al. Gut Bacteria-Derived Serotonin Promotes Immune Tolerance in Early Life. Sci Immunol 2024, 9, eadj4775. [Google Scholar] [CrossRef]
- Qi, Q.; Li, J.; Yu, B.; Moon, J.-Y.; Chai, J.C.; Merino, J.; Hu, J.; Ruiz-Canela, M.; Rebholz, C.; Wang, Z.; et al. Host and Gut Microbial Tryptophan Metabolism and Type 2 Diabetes: An Integrative Analysis of Host Genetics, Diet, Gut Microbiome and Circulating Metabolites in Cohort Studies. Gut 2022, 71, 1095–1105. [Google Scholar] [CrossRef]
- Jiang, H.; Chen, C.; Gao, J. Extensive Summary of the Important Roles of Indole Propionic Acid, a Gut Microbial Metabolite in Host Health and Disease. Nutrients 2022, 15, 151. [Google Scholar] [CrossRef]
- de Mello, V.D.; Paananen, J.; Lindström, J.; Lankinen, M.A.; Shi, L.; Kuusisto, J.; Pihlajamäki, J.; Auriola, S.; Lehtonen, M.; Rolandsson, O.; et al. Indolepropionic Acid and Novel Lipid Metabolites Are Associated with a Lower Risk of Type 2 Diabetes in the Finnish Diabetes Prevention Study. Sci Rep 2017, 7, 46337. [Google Scholar] [CrossRef]
- Sehgal, R.; de Mello, V.D.; Männistö, V.; Lindström, J.; Tuomilehto, J.; Pihlajamäki, J.; Uusitupa, M. Indolepropionic Acid, a Gut Bacteria-Produced Tryptophan Metabolite and the Risk of Type 2 Diabetes and Non-Alcoholic Fatty Liver Disease. Nutrients 2022, 14, 4695. [Google Scholar] [CrossRef]
- Pessa-Morikawa, T.; Husso, A.; Kärkkäinen, O.; Koistinen, V.; Hanhineva, K.; Iivanainen, A.; Niku, M. Maternal Microbiota-Derived Metabolic Profile in Fetal Murine Intestine, Brain and Placenta. BMC Microbiol 2022, 22, 46. [Google Scholar] [CrossRef]
- de Mello, V.D.; Lankinen, M.A.; Lindström, J.; Puupponen-Pimiä, R.; Laaksonen, D.E.; Pihlajamäki, J.; Lehtonen, M.; Uusitupa, M.; Tuomilehto, J.; Kolehmainen, M.; et al. Fasting Serum Hippuric Acid Is Elevated after Bilberry ( Vaccinium Myrtillus ) Consumption and Associates with Improvement of Fasting Glucose Levels and Insulin Secretion in Persons at High Risk of Developing Type 2 Diabetes. Mol Nutr Food Res 2017, 61, 1700019. [Google Scholar] [CrossRef]
- Szkudelska, K.; Szkudelski, T. The Anti-Diabetic Potential of Betaine. Mechanisms of Action in Rodent Models of Type 2 Diabetes. Biomedicine & Pharmacotherapy 2022, 150, 112946. [Google Scholar] [CrossRef]
- Gatarek, P.; Kaluzna-Czaplinska, J. Trimethylamine N-Oxide (TMAO) in Human Health. EXCLI J 2021, 20, 301–319. [Google Scholar] [CrossRef]
- McArthur, K.L.; Zhang, M.; Hong, X.; Wang, G.; Buckley, J.P.; Wang, X.; Mueller, N.T. Trimethylamine N-Oxide and Its Precursors Are Associated with Gestational Diabetes Mellitus and Pre-Eclampsia in the Boston Birth Cohort. Curr Dev Nutr 2022, 6, nzac108. [Google Scholar] [CrossRef]
- Li, P.; Zhong, C.; Li, S.; Sun, T.; Huang, H.; Chen, X.; Zhu, Y.; Hu, X.; Peng, X.; Zhang, X.; et al. Plasma Concentration of Trimethylamine-N-Oxide and Risk of Gestational Diabetes Mellitus. Am J Clin Nutr 2018, 108, 603–610. [Google Scholar] [CrossRef]
- Svingen, G.F.T.; Schartum-Hansen, H.; Pedersen, E.R.; Ueland, P.M.; Tell, G.S.; Mellgren, G.; Njølstad, P.R.; Seifert, R.; Strand, E.; Karlsson, T.; et al. Prospective Associations of Systemic and Urinary Choline Metabolites with Incident Type 2 Diabetes. Clin Chem 2016, 62, 755–765. [Google Scholar] [CrossRef]
- Diaz, S.O.; Pinto, J.; Graça, G.; Duarte, I.F.; Barros, A.S.; Galhano, E.; Pita, C.; Almeida, M. do C.; Goodfellow, B.J.; Carreira, I.M.; et al. Metabolic Biomarkers of Prenatal Disorders: An Exploratory NMR Metabonomics Study of Second Trimester Maternal Urine and Blood Plasma. J Proteome Res 2011, 10, 3732–3742. [Google Scholar] [CrossRef]
- Barzilay, E.; Moon, A.; Plumptre, L.; Masih, S.P.; Sohn, K.-J.; Visentin, C.E.; Ly, A.; Malysheva, O.; Croxford, R.; Caudill, M.A.; et al. Fetal One-Carbon Nutrient Concentrations May Be Affected by Gestational Diabetes. Nutrition Research 2018, 55, 57–64. [Google Scholar] [CrossRef]
- Huo, X.; Li, J.; Cao, Y.-F.; Li, S.-N.; Shao, P.; Leng, J.; Li, W.; Liu, J.; Yang, K.; Ma, R.C.W.; et al. Trimethylamine N-Oxide Metabolites in Early Pregnancy and Risk of Gestational Diabetes: A Nested Case-Control Study. J Clin Endocrinol Metab 2019, 104, 5529–5539. [Google Scholar] [CrossRef]
- Makki, K.; Deehan, E.C.; Walter, J.; Bäckhed, F. The Impact of Dietary Fiber on Gut Microbiota in Host Health and Disease. Cell Host Microbe 2018, 23, 705–715. [Google Scholar] [CrossRef]
- Sedighi, M.; Razavi, S.; Navab-Moghadam, F.; Khamseh, M.E.; Alaei-Shahmiri, F.; Mehrtash, A.; Amirmozafari, N. Comparison of Gut Microbiota in Adult Patients with Type 2 Diabetes and Healthy Individuals. Microb Pathog 2017, 111, 362–369. [Google Scholar] [CrossRef]
- Chen, J.; Wang, R.; Li, X.-F.; Wang, R.-L. Bifidobacterium Adolescentis Supplementation Ameliorates Visceral Fat Accumulation and Insulin Sensitivity in an Experimental Model of the Metabolic Syndrome. British Journal of Nutrition 2012, 107, 1429–1434. [Google Scholar] [CrossRef]
- Vital, M.; Howe, A.; Bergeron, N.; Krauss, R.M.; Jansson, J.K.; Tiedje, J.M. Metagenomic Insights into the Degradation of Resistant Starch by Human Gut Microbiota. Appl Environ Microbiol 2018, 84. [Google Scholar] [CrossRef]
- Wei, J.; Qing, Y.; Zhou, H.; Liu, J.; Qi, C.; Gao, J. 16S RRNA Gene Amplicon Sequencing of Gut Microbiota in Gestational Diabetes Mellitus and Their Correlation with Disease Risk Factors. J Endocrinol Invest 2021, 45, 279–289. [Google Scholar] [CrossRef]
- Sun, Z.; Pan, X.; Li, X.; Jiang, L.; Hu, P.; Wang, Y.; Ye, Y.; Wu, P.; Zhao, B.; Xu, J.; et al. The Gut Microbiome Dynamically Associates with Host Glucose Metabolism throughout Pregnancy: Longitudinal Findings from a Matched Case-Control Study of Gestational Diabetes Mellitus. Advanced Science 2023, 10. [Google Scholar] [CrossRef]
- Pedersen, H.K.; Gudmundsdottir, V.; Nielsen, H.B.; Hyotylainen, T.; Nielsen, T.; Jensen, B.A.H.; Forslund, K.; Hildebrand, F.; Prifti, E.; Falony, G.; et al. Human Gut Microbes Impact Host Serum Metabolome and Insulin Sensitivity. Nature 2016, 535, 376–381. [Google Scholar] [CrossRef]
- Leite, A.Z.; Rodrigues, N. de C.; Gonzaga, M.I.; Paiolo, J.C.C.; de Souza, C.A.; Stefanutto, N.A.V.; Omori, W.P.; Pinheiro, D.G.; Brisotti, J.L.; Matheucci Junior, E.; et al. Detection of Increased Plasma Interleukin-6 Levels and Prevalence of Prevotella Copri and Bacteroides Vulgatus in the Feces of Type 2 Diabetes Patients. Front Immunol 2017, 8. [Google Scholar] [CrossRef]
- Tsai, C.-Y.; Liu, P.-Y.; Huang, M.-C.; Chang, C.-I.; Chen, H.-Y.; Chou, Y.-H.; Tsai, C.-N.; Lin, C.-H. Abundance of Prevotella Copri in Gut Microbiota Is Inversely Related to a Healthy Diet in Patients with Type 2 Diabetes. J Food Drug Anal 2023, 31. [Google Scholar] [CrossRef]
- De Bandt, J.-P.; Coumoul, X.; Barouki, R. Branched-Chain Amino Acids and Insulin Resistance, from Protein Supply to Diet-Induced Obesity. Nutrients 2022, 15, 68. [Google Scholar] [CrossRef]
- Liang, H.; Hussey, S.E.; Sanchez-Avila, A.; Tantiwong, P.; Musi, N. Effect of Lipopolysaccharide on Inflammation and Insulin Action in Human Muscle. PLoS One 2013, 8, e63983. [Google Scholar] [CrossRef]
- Pedro, M.N.; Magro, D.O.; da Silva, E.U.P.P.; Guadagnini, D.; Santos, A.; de Jesus Pedro, R.; Saad, M.J.A. Plasma Levels of Lipopolysaccharide Correlate with Insulin Resistance in HIV Patients. Diabetol Metab Syndr 2018, 10, 5. [Google Scholar] [CrossRef]
- White, P.J.; Newgard, C.B. Branched-Chain Amino Acids in Disease. Science (1979) 2019, 363, 582–583. [Google Scholar] [CrossRef]
- Wang, J.; Si, Y.; Wu, C.; Sun, L.; Ma, Y.; Ge, A.; Li, B. Lipopolysaccharide Promotes Lipid Accumulation in Human Adventitial Fibroblasts via TLR4-NF-ΚB Pathway. Lipids Health Dis 2012, 11, 139. [Google Scholar] [CrossRef]
- Devlin, A.M.; Singh, R.; Wade, R.E.; Innis, S.M.; Bottiglieri, T.; Lentz, S.R. Hypermethylation of Fads2 and Altered Hepatic Fatty Acid and Phospholipid Metabolism in Mice with Hyperhomocysteinemia. Journal of Biological Chemistry 2007, 282, 37082–37090. [Google Scholar] [CrossRef]
- Leeming, E.R.; Johnson, A.J.; Spector, T.D.; Le Roy, C.I. Effect of Diet on the Gut Microbiota: Rethinking Intervention Duration. Nutrients 2019, 11, 2862. [Google Scholar] [CrossRef]
- David, L.A.; Maurice, C.F.; Carmody, R.N.; Gootenberg, D.B.; Button, J.E.; Wolfe, B.E.; Ling, A. V.; Devlin, A.S.; Varma, Y.; Fischbach, M.A.; et al. Diet Rapidly and Reproducibly Alters the Human Gut Microbiome. Nature 2014, 505, 559–563. [Google Scholar] [CrossRef]
Figure 1.
DIABLO integration of Diet group versus log fold change of gut microbiota species and log fold change of plasma metabolite profile after 7 weeks on diet treatment. (A) sPLS-DA ordination of participant microbiome taxonomy (circles) and plasma metabolomics (triangles) split by CHOICE diet (purple) and CONV diet (green). Arrows are drawn between each participant’s microbiome and metabolome. (B) Loading values for gut microbiota species and metabolites versus diet group along sPLS-DA comp 1. Metabolite names are shown in blue, species are shown in red. (C) MetaboINDICATOR-transformed metabolomics data describing log-fold change metabolomics measurements compared by diet group (all p>0.05).
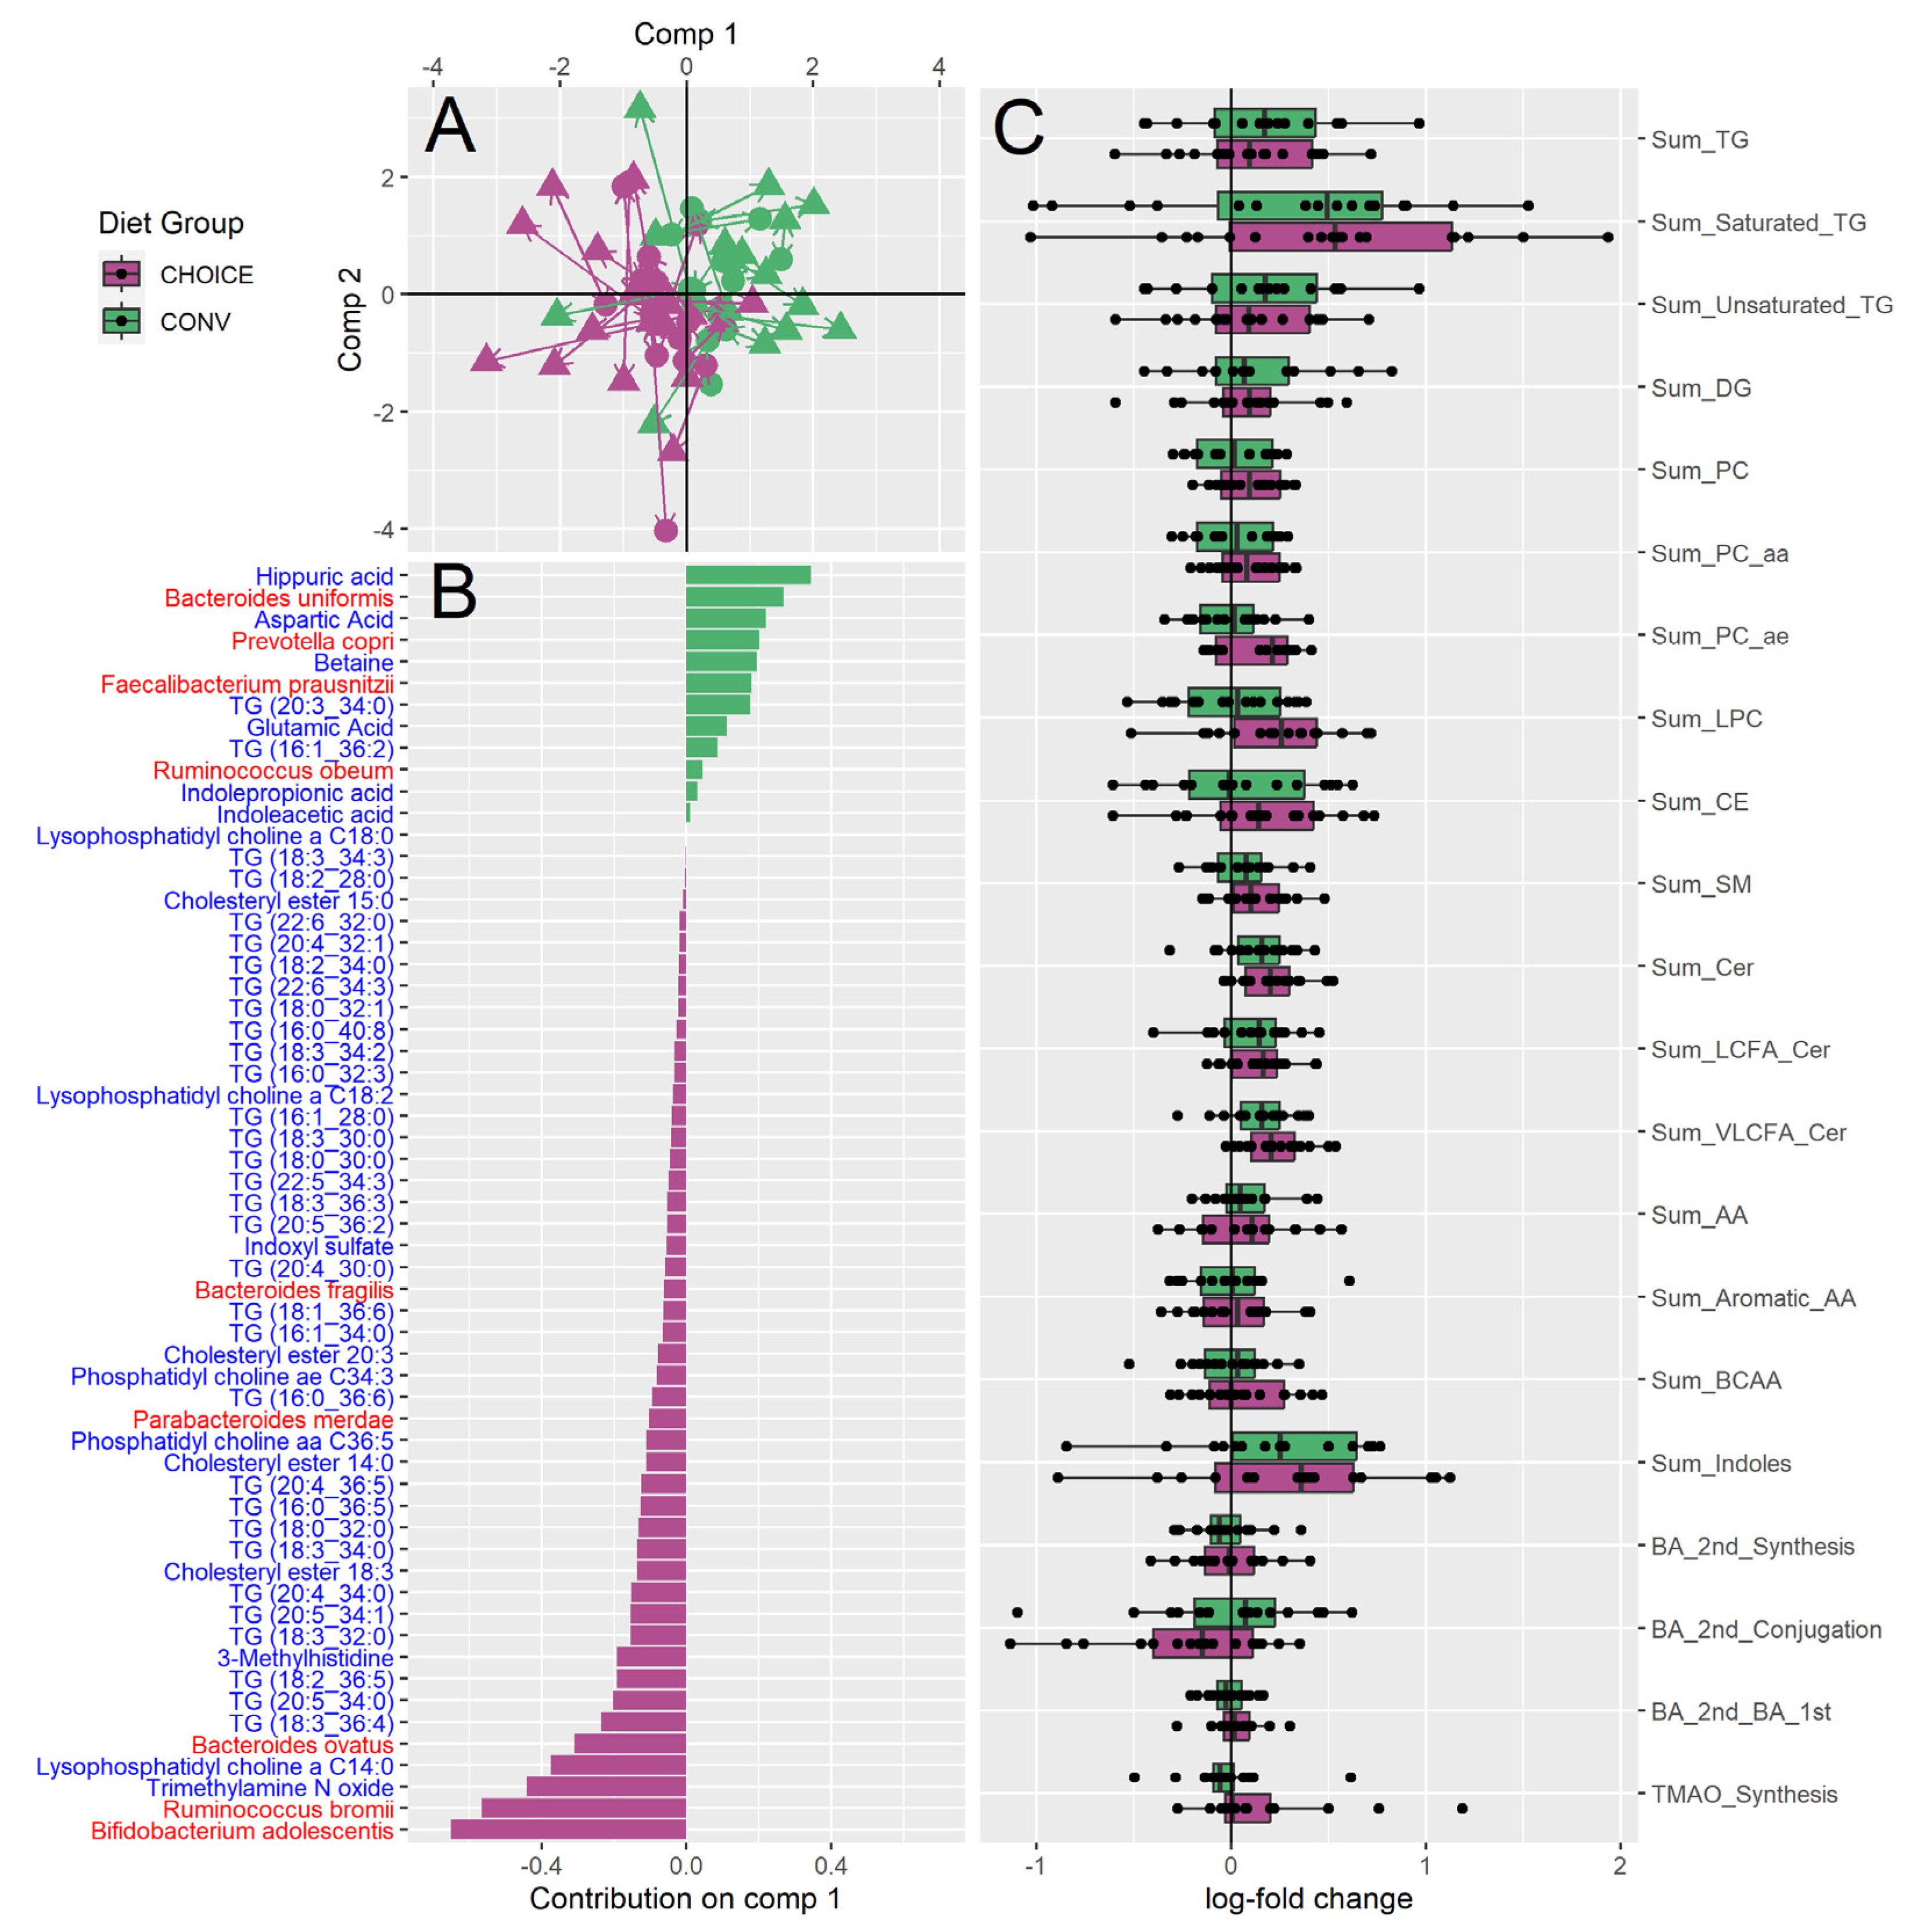
Figure 2.
DIABLO integration of diet group versus log fold change of gut microbiome KEGG annotations and log fold change of plasma metabolite profile. (A) sPLS-DA ordination of participant KEGG genes (circles) and plasma metabolomics (triangles) split by CHOICE diet (purple) and CONV diet (green). Arrows are drawn between the KEGG-annotated microbiome and metabolome for each participant. (B) Loading values for gut microbiota functional genes and metabolites versus diet group along sPLS-DA comp 1. Metabolite names are shown in blue, KEG annotations are shown in red. (C) Loading values for gut microbiota functional genes and metabolites versus diet group along sPLS-DA comp 2. Metabolite names are shown in blue, KEG annotations are shown in red. (D) Pathways identified by over-representation analysis of the diet associated KEGG genes identified in panels A and C. Pathways significant after FDR correction are shown as yellow ribbons, while pathways not significant after FDR are shown as grey ribbons. Ribbon width represents the number of KEGG genes identified within the pathway.
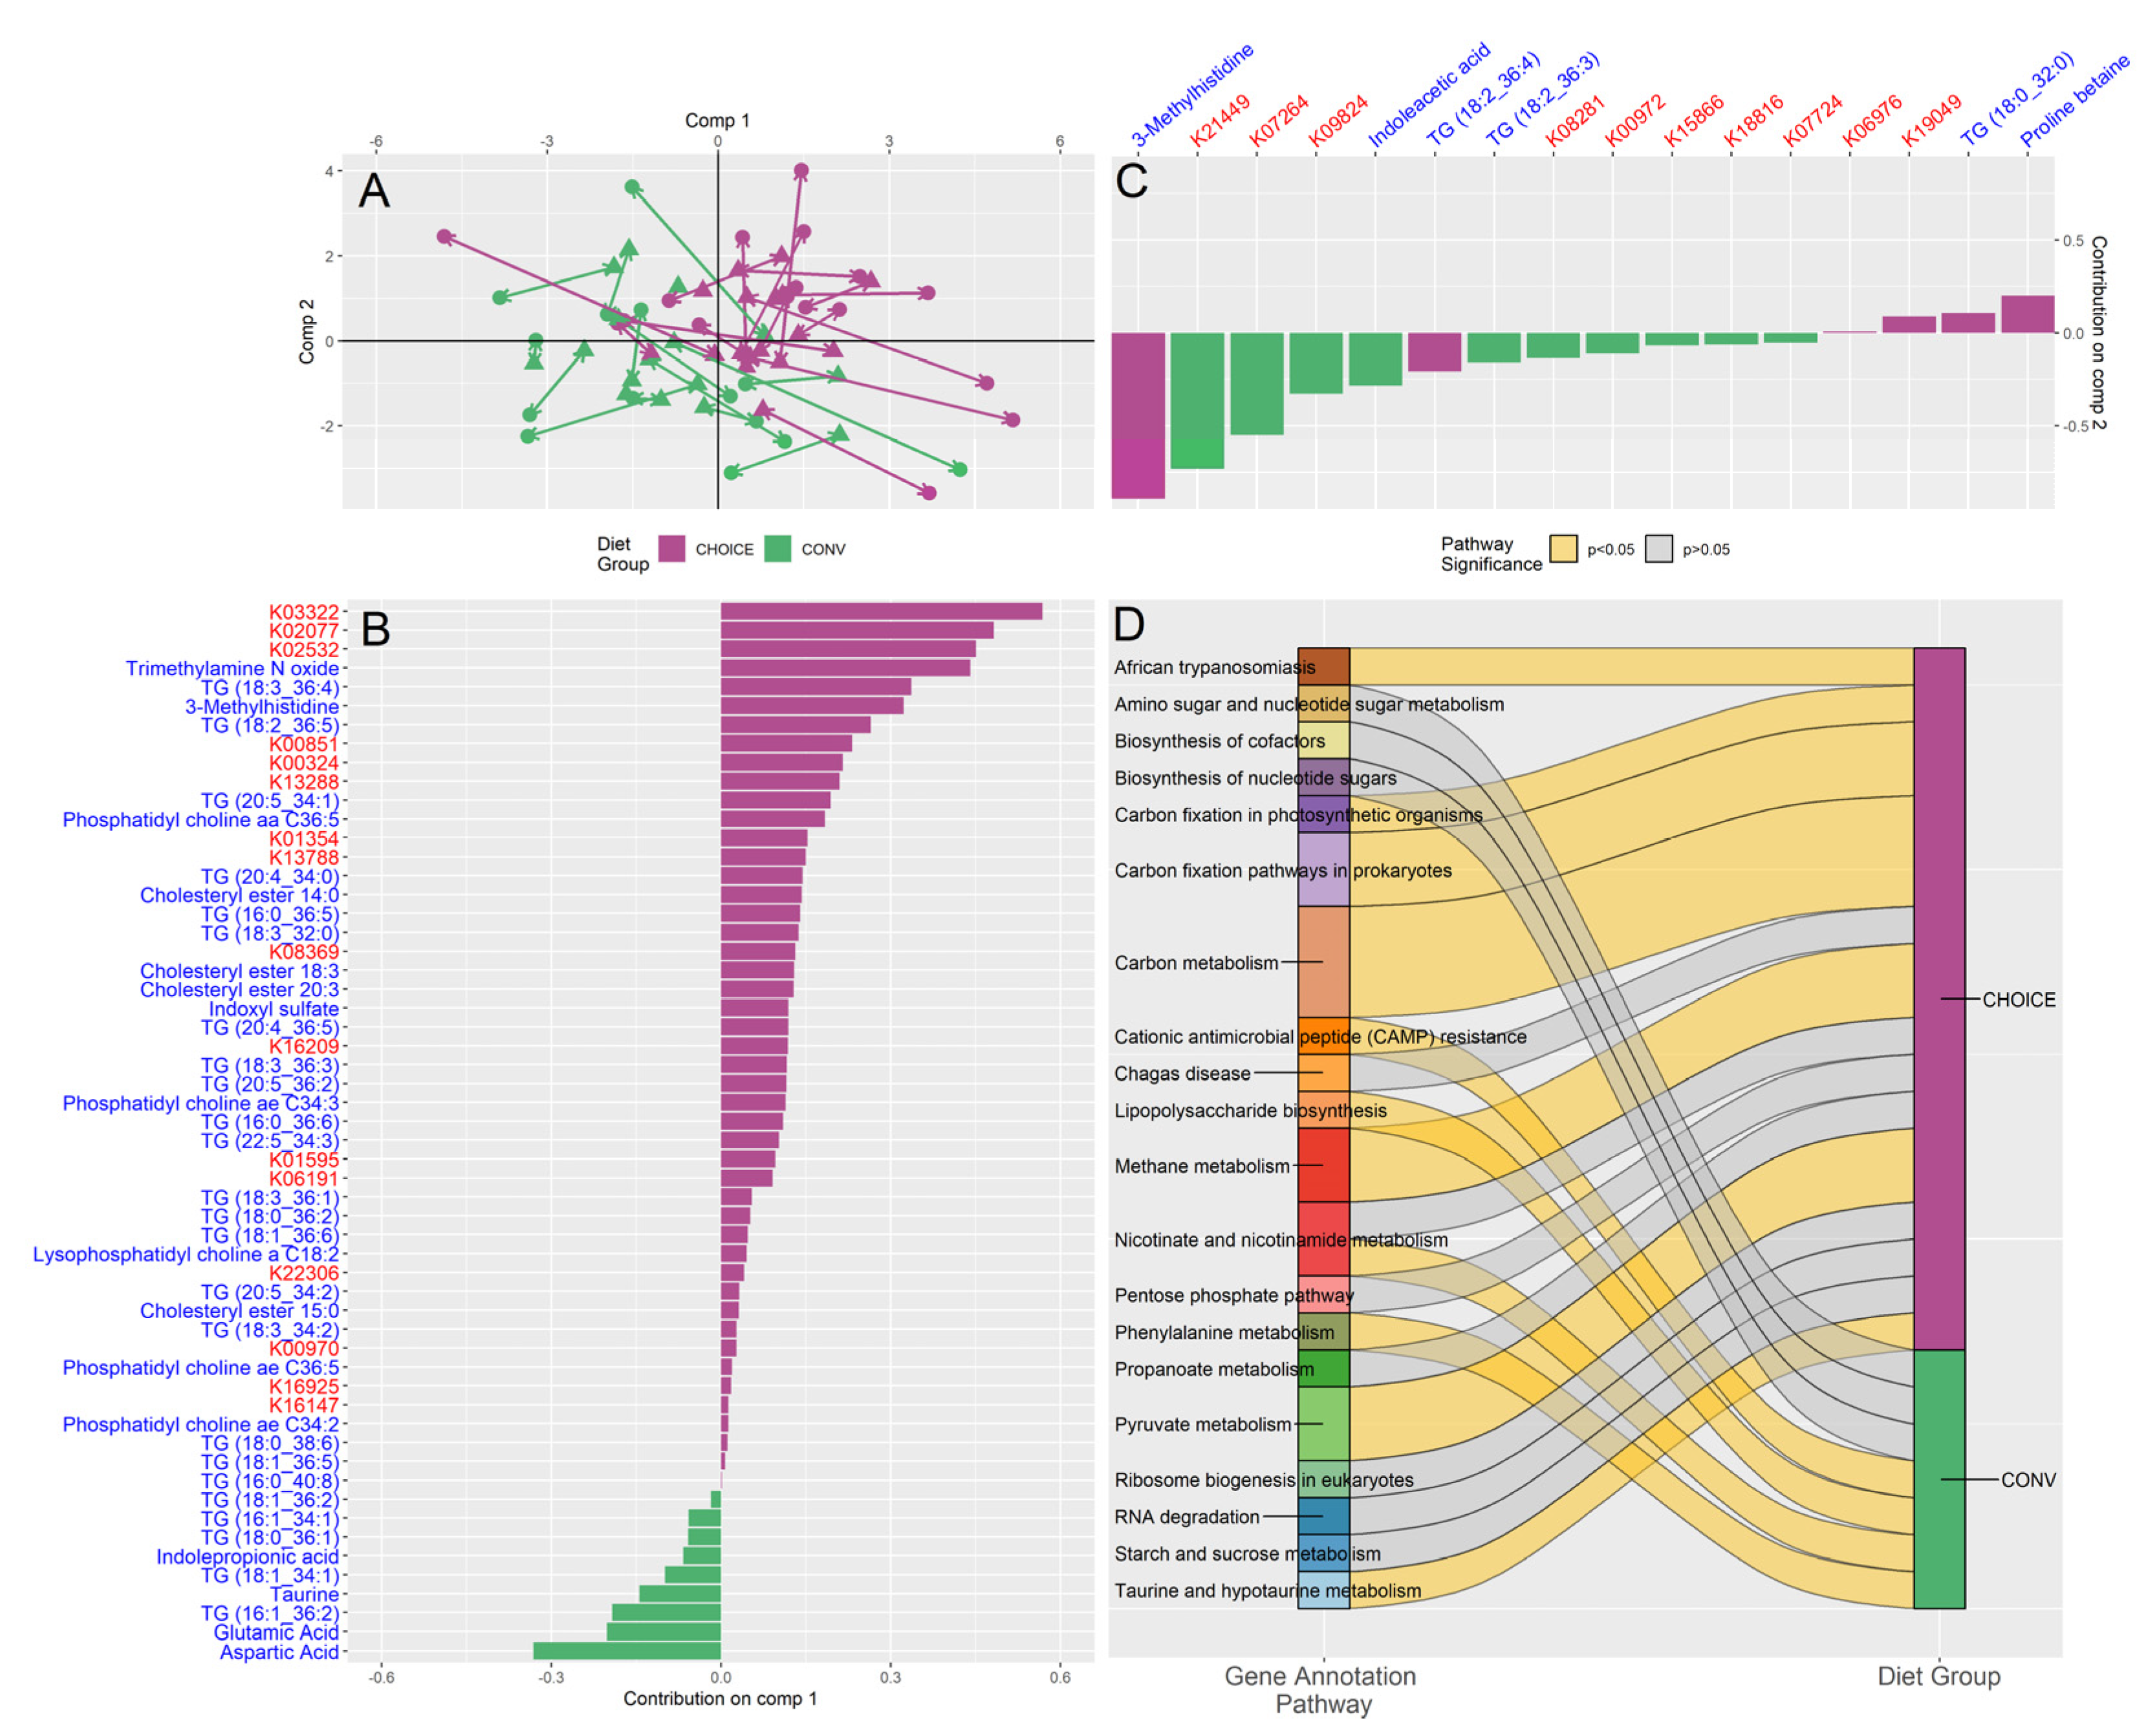
Figure 3.
Participants responded to GDM diet intervention with either relatively higher fasting triglycerides or relatively higher fasting glucose after 7 weeks on either diet. (A) K-means clustering of the metabolomics revealed two metabolic groups: KTG, which was associate with relatively increased fasting TGs (measured by enzymatic method), and KGL, which was associated with relatively increased fasting glucose (measured by OGTT) after 7 weeks on diet intervention. Participant diet group is overlaid on the boxplot, with CHOICE in purple and CONV in green. Diet was not associated with K-means groupings. (B) MetaboINDICATOR-transformed metabolomics data of log-fold change metabolomics measurements compared by K-means groups (* p < 0.05). (C) Taxa found to be associated with K-means groups by LASSO regression (all p > 0.05). (D) Summary of pathways identified by over-representation analysis of diet-associated KEGG genes identified by LASSO regression. Pathways significant after FDR correction are shown as yellow ribbons, while pathways not significant after FDR are shown as grey ribbons. Ribbon width represents the number of KEGG genes identified within the pathway.
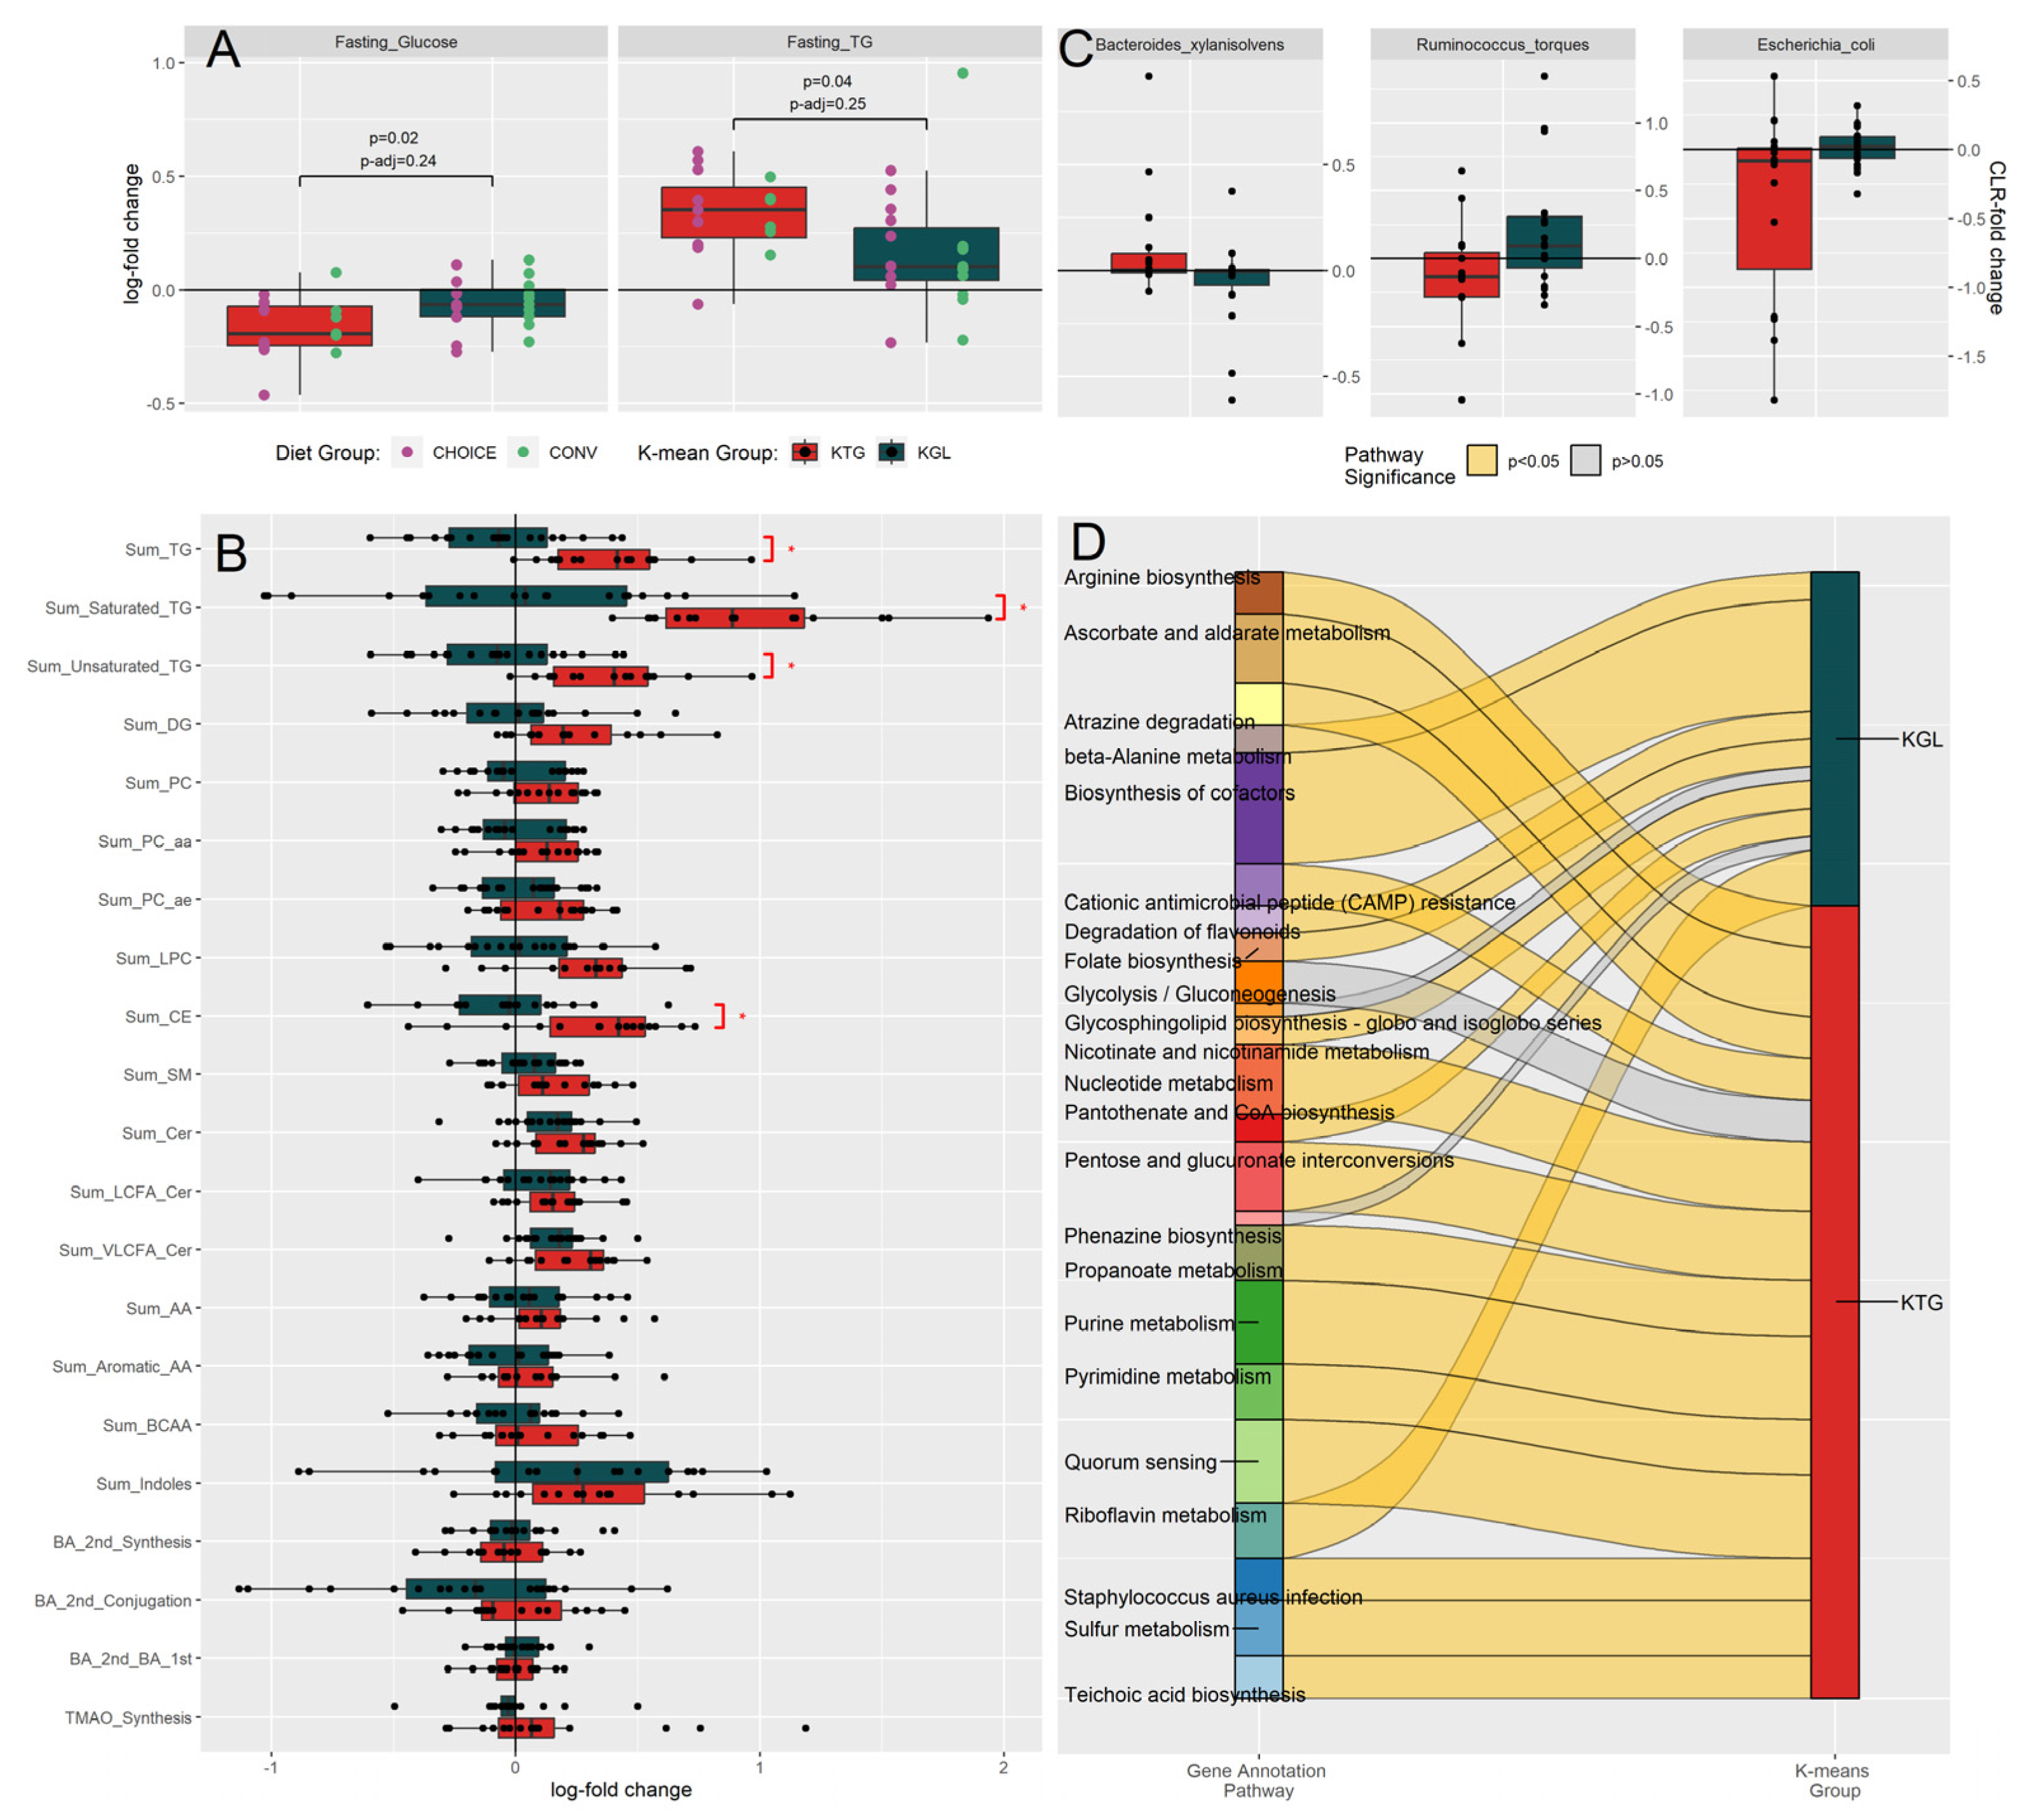
Figure 4.
Network of pathways associated with diet group, K-means clusters, and metabolomic profile. Microbiome KEGG gene annotations associated with diet group (purple and green nodes) were determined using DIABLO, while KEGG genes associated with K-means groups (red and dark green nodes) and plasma metabolites (grey nodes) were determined using LASSO regression, followed by ANVOA and FDR correction. Over-representation analysis was then used to summarize the KEGG genes into their respective pathways (light purple nodes). Blue edges connect nodes with a positive association, while pink edges connect nodes with a negative association.
Disclaimer/Publisher’s Note: The statements, opinions and data contained in all publications are solely those of the individual author(s) and contributor(s) and not of MDPI and/or the editor(s). MDPI and/or the editor(s) disclaim responsibility for any injury to people or property resulting from any ideas, methods, instructions or products referred to in the content. |
© 2024 by the authors. Licensee MDPI, Basel, Switzerland. This article is an open access article distributed under the terms and conditions of the Creative Commons Attribution (CC BY) license (http://creativecommons.org/licenses/by/4.0/).
Copyright: This open access article is published under a Creative Commons CC BY 4.0 license, which permit the free download, distribution, and reuse, provided that the author and preprint are cited in any reuse.


