Submitted:
10 June 2024
Posted:
12 June 2024
You are already at the latest version
Abstract
The optimization of photovoltaic (PV) systems is vital for enhancing efficiency and economic viability, especially under Partial Shading Conditions (PSCs). This study focuses on the development and comparison of traditional and advanced algorithms, including Perturb and Observe (P&O), Incremental Conductance (IC), Fuzzy Logic Control (FLC), Grey Wolf Optimization (GWO), Particle Swarm Optimization (PSO), and Artificial Neural Networks (ANN), for efficient Maximum Power Point Tracking (MPPT). Simulations conducted in MATLAB/SIMULINK evaluated these algorithms’ performance under various shading scenarios. The results indicate that while traditional methods like P&O and IC are effective under uniform conditions, advanced techniques, particularly ANN-based MPPT, exhibit superior efficiency and faster convergence under PSCs. The study concludes that integrating AI and ML into MPPT algorithms significantly enhances the reliability and efficiency of PV systems, paving the way for broader adoption of solar energy technologies in diverse environmental conditions. These findings contribute to advancing renewable energy technology and support the green energy transition.
Keywords:
Photovoltaic Systems
; Partial Shading Conditions
; Maximum Power Point Tracking
; 14 Artificial Neural Networks
; Fuzzy Logic Control
; GreyWolf Optimization
; Particle Swarm 15 Optimization
1. Introduction
The transition towards Renewable Energy Sources (RES) is crucial for addressing climate change and achieving zero carbon emissions. Among renewable technologies, photovoltaic (PV) systems have emerged as a leading solution due to their ability to convert solar energy into electricity [1]. PV power generation is associated with emissions solely during the production of its components. Once installed, PV panels harness solar irradiation to generate electricity without emitting greenhouse gases. Over their estimated lifespan of 25 years, PV panels are designed to yield more energy than consumed during their production [2]. In 2022, the PV industry celebrated a significant milestone, surpassing a total global capacity of 1 terawatt (TW), reaching 1,183 gigawatts (GWs) of PV installations. Over half of this capacity was added in the last four years alone. The year 2022 also saw a record-setting annual growth, with 236 GW of new PV capacity installed worldwide, a 35% increase from the previous years [3].
Three primary factors influence the performance of a PV plant: the efficiency of the PV panels, the conversion efficiency of the converters, and the effectiveness of the Maximum Power Point Tracking (MPPT) algorithm. Enhancing the efficiency of the PV panels and the converter is a complex task that relies on the current state of technology and may necessitate the use of superior components, potentially elevating the system cost significantly. However, optimizing the MPPT by implementing new control algorithms is a more feasible approach. This improvement is cost-effective and can be readily applied to existing plants through a control algorithm update, promptly boosting the efficiency of PV power generation and reducing costs. However, the efficiency of MPPT algorithms is significantly affected by Partial Shading Conditions (PSCs), which can occur due to clouds, dust, snow, nearby buildings, trees, the aging effect of the panels [4], and other obstructions. This creates non-uniform irradiance on the PV panels, leading to multiple Local Maximum Power Points (LMPPs) on the Power-Voltage (P-V) curve, posing a challenge for MPPT techniques in finding the Global Maximum Power Point (GMPP). Traditional techniques like Perturb & Observe (P&O) and Incremental Conductance (IC) have been foundational in the development of MPPT methodologies. However, their performance under PSC is often limited by the inability to consistently identify the GMPP, leading to suboptimal power extraction from PV arrays [5,6]. Recent advancements in MPPT technologies have introduced several algorithms to address the complexities introduced by PSCs, including Fuzzy Logic Control (FLC) [7,8], Grey Wolf Optimization (GWO) [9,10], Particle Swarm Optimization (PSO) [11,12,13], and Artificial Neural Networks (ANNs) [14,15,16,17]. While the discussed MPPT algorithms are well-documented in the literature, there is a noticeable lack of diversity in ANN approaches, with many studies following similar methodologies or hybrids. This research investigates a novel ANN approach, aiming to find simpler and more effective ways to implement ANN MPPT algorithms that perform well under PSCs and can be utilized in real-world applications.
The motivation behind this research stems from the increasing prevalence of PV systems in the global energy mix as depicted in Figure 1, with its growing trend shown in Figure 2, and the need for more resilient and efficient MPPT strategies to cope with variable environmental conditions exacerbated by climate change. The exploration of ANNs in this context is not merely an academic pursuit but a step towards advancing a technology that stands at the forefront of innovation. By understanding and contrasting the capabilities and limitations of these MPPT algorithms, this research aims to contribute to the evolution of PV system efficiency and reliability, harnessing the allure of AI and ML to illuminate a path towards a sustainable future.
By exploring the strengths and weaknesses of each MPPT technique, this study seeks to contribute to the ongoing efforts to enhance the reliability and performance of PV systems, paving the way for broader adoption of solar energy as a cornerstone of sustainable development. As the field of PVs continues to evolve with the introduction of new materials (perovskite, thin-film [3], GaAs [18] and innovative applications (building-integrated PV, agrivoltaics and floating PV [3]), the significance of effective MPPT techniques becomes even more pronounced. These developments not only offer the potential for higher efficiency solar cells but also expand the versatility of PV systems in various environmental conditions and architectural designs. Therefore, understanding the implications of partial shading and optimizing MPPT algorithms are crucial steps towards maximizing the potential of solar energy in the pursuit of a cleaner, more sustainable future.
This research significantly advances the body of knowledge in renewable energy technology with a focus on optimizing PV systems under PSCs. The study provides a comprehensive comparative analysis of six different MPPT techniques using the MATLAB/Simulink environment. Through detailed simulations of various partial shading scenarios, it elucidates the performance, efficiency, and reliability of both traditional and advanced MPPT methods, including P&O, IC, FLC, GWO, PSO, and ANN.
The structure of the paper is as follows: Section 2 discusses the PV system modeling, detailing the equivalent circuit models and the impact of partial shading. Section 3 describes the simulation models and scenarios developed for the study. Section 4 provides an overview of the MPPT algorithms evaluated, including their operational principles and implementation. Section 5 presents the results and discussion, focusing on the performance analysis of each MPPT algorithm under various conditions. Section 6 concludes the study with a summary of findings and suggestions for future research.
2. PV System Modelling
PV system modeling is crucial for understanding and predicting solar cell behavior under various conditions. Key methods include single-diode models, double-diode models, empirical models, and electrical circuit models. The single-diode model balances simplicity and accuracy, making it suitable for practical applications, while the double-diode model offers better representation at the cost of complexity. Empirical models fit experimental data but lack physical insight. This paper uses the equivalent circuit-based model (single-diode) for its balance of simplicity and accuracy, particularly under PSCs. This model effectively integrates with system components like MPPT controllers, providing comprehensive system-level analysis. It helps understand losses and real-world conditions on solar cell output, offering insights into PV system behavior under partial shading, crucial for optimizing MPPT techniques. Figure 3 provides an overview of a stand-alone PV system and its key components.
2.1. Equivalent Circuit of a Solar Cell
Ideally, a PV cell lacks parallel and series resistances. However, in practical applications, these resistances are incorporated due to leakage current and ohmic resistances, as demonstrated in Figure 4. The primary cause of the shunt resistance is the suboptimal performance of the p-n junction in the PV diode, while the series resistance stems from the bulk resistance of the semiconductor material and its interconnections [19,20].
When a PV cell is exposed to solar irradiance, the output current can be calculated using Kirchhoff’s law, which is detailed in Equation 1:
where represents the current generated by light, as defined in Equation 2:
where G signifies the solar irradiation, T is the ambient temperature under specific climate conditions, represents the short circuit current of the PV cell, is the temperature coefficient, denotes the temperature of the PV cell under Standard Test Conditions (STC), and is the diode current of the PV, as defined by Equation 3:
where denotes the saturation current of the PV diode, is the terminal voltage across the PV diode, q represents the electrical charge () and k stands for Boltzmann constant (), while n is the ideality factor of the PV diode. The universal formula outlining the Current-Voltage (I–V) characteristics of the PV cell is presented in Equation 4:
where represents the current generated by the PV cell and is the voltage across the PV cell. To achieve the desired voltage and current, PV cells are arranged in a combination of series and parallel configurations to create an optimized PV module. These modules are then connected in different configurations to form the required PV array.
The main performance attributes of a PV panel are typically delineated by the Power-Voltage (P-V) curve, as illustrated in Figure 5, which is generated under STC. At STC, the solar irradiance is set to 1000 W/m and the ambient temperature is maintained at 25C. The power output of the PV is determined by multiplying the voltage (V) by the current (I), the latter of which is a function of the voltage. For optimal performance, it is assumed to be a constant value that is less than the short-circuit current.
2.2. Short-Circuit Current and Open-Circuit Voltage
The short-circuit current () in PV systems is a fundamental parameter indicating the maximum current output of a solar cell under illumination with no external load attached, essentially when the terminals of the solar cell are directly connected (short-circuited). This condition is crucial for evaluating a solar cell’s ability to generate electricity from sunlight. can be visually presented from the Current-Voltage (I-V) curve shown in Figure 6(a). The is intrinsically linked to the generation and collection of light-induced charge carriers within the solar cell. It is described mathematically by considering the light-generated current (), which is a result of photons being absorbed by the semiconductor material, creating electron-hole pairs. The equation for in an ideal scenario, without considering resistive losses, can be simplified and presented in Equation 5:
where is the short-circuit current and is the light-generated current. The actual value of depends on various factors including the intensity and spectrum of incident light, as well as the optical and physical properties of the solar cell. The short-circuit current density (), which normalizes to the area of the solar cell, provides a more standardized comparison across different cells and is presented in Equation 6:
where Area is the surface area of the solar cell. In practical terms, and consequently , are directly influenced by the effective absorption of light, which depends on the material’s bandgap and its ability to convert absorbed photons into electrical current efficiently. The detailed behavior of in real-world applications further involves complex interactions within the solar cell, including recombination mechanisms and the quality of the cell’s junctions and interfaces. For a comprehensive understanding and detailed mathematical modeling of , it is essential to delve into semiconductor physics and the specific characteristics of the PV material in question. These equations serve as foundational understanding, illustrating how reflects the efficiency of light conversion in solar cells.
The open-circuit voltage () represents the peak voltage a solar cell can produce when no current is flowing through the device. This scenario occurs when there is a balance between the cell’s natural forward bias and the electric potential created by light-induced charge carriers. The value of can be visualized on the I-V curve shown in Figure 6(b), marking the point where the curve intersects the voltage axis, indicating no current flow. Essentially, provides a measure of the solar cell’s ability to convert sunlight into electrical energy in an open-circuit condition. Several factors influence the value of the and it can be described through various equations and principles within semiconductor physics. One fundamental equation that helps understand in the context of an ideal solar cell is presented in Equation 7:
where n denotes the ideality factor of the PV diode, k is the Boltzmann constant (), T represents the ambient temperature under specific climate conditions, while q is the electrical charge (). The formula encapsulates the relationship between the thermal energy of the system, the charge of an electron, the natural logarithm (ln) of the ratio of plus one to , and the n. The n adjusts the equation to better fit real-world solar cells, which may not exhibit purely ideal diode behavior due to recombination mechanisms and other effects. The logarithmic term in the equation represents the exponential increase in current with voltage that is characteristic of diode behavior, and the inside the logarithm ensures that the argument is always greater than zero. This equation effectively describes how is influenced by the temperature of the solar cell, the quality of the semiconductor material (as reflected in ), and the amount of light-induced charge generation. This understanding is pivotal for optimizing solar cell designs and enhancing their efficiency, as it provides insight into the fundamental electrical properties of solar cells under open-circuit conditions.
2.3. Irradiance and Temperature Effects
The performance of PVs is directly influenced by the solar irradiance and the ambient temperature. These factors play a crucial role in determining key electrical parameters of PV modules, including the short-circuit current (), open-circuit voltage (), and maximum power () output, all of which can vary significantly. In the context of an ideal model where series and parallel resistances are considered minimal, the is effectively equated to the light-generated current (). This is because, under short-circuit conditions, there is essentially no voltage across the diode, leading to negligible current through it [15]. Consequently, is primarily influenced by and varies linearly with the irradiance and temperature conditions presented in Equation 8:
where represents the nominal light-generated current, T is the temperature of the cell, and stands for the standard or nominal cell temperature set at 298 K. denotes the temperature coefficient of the current, which quantifies how much the current changes with temperature. G signifies the level of solar irradiance received measured in watts per square meter (W/m), and refers to the standard irradiance level established at 1000 W/m. Given that typically represents a minor value, temperature variations have a minimal impact on the light-generated current.
Therefore, the variation in the short-circuit current, which closely approximates the light-generated current, is predominantly influenced by fluctuations in the level of irradiance [15]. Conversely, is significantly influenced by the temperature conditions presented in Equation 9:
where refers to the standard open-circuit voltage, and represents the temperature coefficient for voltage which indicates how the voltage changes with temperature. Given that typically has a negative value, an increase in temperature leads to a decrease in the open-circuit voltage [15].
2.4. Maximum Power Point
The characteristics of PV panels are illustrated through I-V and P-V curves indicating an optimal operating point where power output peaks known as the Maximum Power Point (MPP), also highlighted in Figure 7. In these curves, MPP is crucial because of the panel’s relatively low efficiency, necessitating operation near this point for maximal energy collection [4]. The can be represented as detailed in Equation 10:
2.5. Fill Factor
The Fill Factor (FF) is a crucial indicator of a PV cell’s efficiency, representing the ratio of actual maximum power () output to the theoretical power defined by open-circuit voltage () and short-circuit current (), and can be represented by Equation 11:
A higher FF indicates a more efficient PV cell, as it shows the cell’s ability to convert more sunlight into usable power.
2.6. Partial Shading
Partial shading occurs when an object obstructs sunlight from reaching a portion of a PV cell, module, or array. Unlike full shading, partial shading does not cover the entire surface but affects only part of the PV system as illustrated in Figure 8. This phenomenon is significant in the context of solar power because even small shadows can lead to considerable power losses and efficiency degradation in solar PV systems.
Under uniform sunlight, the peak output power of a PV system equals the aggregate of the peak power outputs from each cell, module, or array. However, shading from clouds, trees, or buildings can severely affect PV systems performance. Shaded modules experience a drop in voltage, leading them to act as loads rather than power generators, which can induce the risk of overheating, known as the "hot spot" issue. To mitigate this, PV modules incorporate bypass diodes, which, while preventing hot spots, introduce multiple peaks in the P–V curve, including one global maximum power point (GMPP) and several local maximum power points (LMPPs). This can be observed in Figure 9, where the effect of partial shading is present as well as the effect of bias diodes.
This complexity poses a challenge for traditional MPPT technologies, which may erroneously lock onto a LMPP, consequently diminishing the overall power yield of the PV array. Hence, it is critical to employ a sophisticated MPPT strategy capable of accurately identifying and following the GMPP, especially under PSCs, to optimize the power output of the solar power system.
If we were to think of three PVs connected in series, we could represent them with use of the single-diode model as in Figure 10.
Here, we could calculate the total current generated by the three series connected PV modules as derived in Equation 12.
Partial shading significantly diminishes the efficiency of PV systems. In order to maximize power output under such varying environmental conditions, implementing strategies specifically designed to mitigate the effects of partial shading is crucial, regardless of whether the PV system operates in a grid-connected or standalone mode. Traditional MPPT methods, which typically employ fixed step sizes, often fall short as they tend to lock onto local maxima instead of the optimal MPP. This limitation hinders their ability to adaptively track the MPP amidst the fluctuating irradiance levels characteristic of partial shading scenarios. The most popular algorithms for MPPT control in PV systems are Perturbation and Observation (P&O), Incremental Conductance (IC) and Constant Voltage (CV). They have the advantage of being very easy to implement and work very well under uniform radiation and temperature conditions. Nevertheless, as all techniques have disadvantages, they are impossible to adapt to constant changes in the environment and fail to find the MPP. From these, several improvements are derived to optimize the MPP calculation, such as those using the variable step principle detecting the area under the MPP curve using the derived dP/dV values and a scaling factor. However, failures were also detected in finding the MPP at different radiation levels [21].
3. Simulation Models and Scenarios Development
This section describes the simulation model developed to evaluate the performance of the MPPT algorithms. It includes explanations of the PV model, boost converter, load configurations, PSC model, and the specifics of each MPPT algorithm simulated. The primary objectives are to present the methodology for simulating the MPPT algorithms and to demonstrate the setup for comparative analysis under controlled PSCs.
3.1. Simulation Enviroment
The simulation model were developed within the MATLAB/Simulink (2023b) software environment, with a schematic representation provided in Figure 11. The stand-alone model comprises PV arrays subjected to PSC, a boost converter with PWM control strategy governed by the different MPPT algorithms for evaluative comparison, and an assigned load profile.
3.2. PV Model
For this study, the SunPower SPR-X20-250-BLK PV panel was chosen, primarily due to its high efficiency and suitability. This panel is characterized by its robust response to low-light conditions and its high power output consistency, making it an ideal candidate for detailed performance analysis in MATLAB/Simulink.
The model of the SunPower SPR-X20-250-BLK used in this study is derived from the Simscape library, a comprehensive set of tools within Simulink that facilitates the modeling of physical systems, including electrical systems such as PV arrays. Simscape provides a physically modeled library, which allows for the simulation of real-world physical phenomena with high accuracy and detailed behavioral analysis.
As seen in Figure 12, the PV model consist of three PV modules connected in series with bias diodes. Each module experienced individual solar irradiance and temperature inputs. The three PV modules were simulated using a PV array block from the Simscape/Electrical/Specialized Power Systems/Sources library in MATLAB Simulink (2023b). The blocks supports both predefined PV modules from the National Renewable Energy Laboratory (NREL) System Advisor Model (2018) and user-defined PV modules.
3.3. Boost Converter and Load
Figure 13(a) illustrates the systematic arrangement of the boost converter’s components, adhering to the conventional boost converter topology. The input voltage, which constitutes the baseline voltage for the step-up process, is stabilized by the input capacitor (). This stabilization is crucial, as it minimizes voltage ripple and ensures consistent operation amidst transient fluctuations. In series with the input, the inductor (L) accumulates energy in its magnetic field when the switch is engaged. The subsequent release of this energy when the switch is disengaged is the mechanism by which voltage elevation is achieved across the output. The switching operation, vital to the converter’s functionality, is executed by a MOSFET (S) regulated by a PWM signal. The duty cycle of the MOSFET, determined by the PWM, is a determinative factor in the output voltage regulation. Additionally, the diode serves to maintain a unidirectional current flow, safeguarding against the output capacitor’s () discharge during the MOSFET’s inactive intervals, thereby fostering the accumulation of charge on the output side. Finally, the output capacitor, connected in parallel to the load, tempers the voltage spikes engendered by the switching action, thereby delivering a more uniform DC voltage to the load.
Figure 13(b) depicts the load circuit interfaced with the boost converters output. This circuit is composed of three resistive elements (R1, R2, R3), each coupled with a controllable switch. These switches facilitate the simulation of a variable load profile by selectively engaging or disengaging the resistors which can be considered as equivalent to a DC load such as battery charging, EV charging, IoT devices etc. Such an arrangement allows the emulation of fluctuating load conditions, thereby providing a tool to assess the responsiveness of the boost converter and associated control mechanisms, including MPPT algorithms, to dynamic load demands. Additionally, this setup is instrumental in investigating the power supply’s stability and its transient behavior under diverse load scenarios.
Table 3 presents the specific parameters of the boost converter and the load utilized within the simulation framework.
3.4. Partial Shading and Scenarios Development
To simulate PSCs in this study, the series-connected PVs were segmented into three groups. Each group was subjected to distinct irradiance levels to facilitate the analysis of different MPPT techniques under PSC. The irradiance levels applied were also segmented into five shading scenarios as denoted in Table 4, where all PVs were maintained at a constant temperature of 25°C, reflecting standard test conditions.
Figure 14 shows the Simulation model used to obtain the MPP, LMPPs, and the GMPP under the various shading scenarios, which was used to validate the performance of the MPPT algorithms chosen for comparison. Shading scenario 1 represents uniform irradiance, where all PVs experience the same maximum solar irradiance (1000 W/m) which serves as a baseline for MPPT performance under ideal conditions. Shading scenarios 2-5 represent partial shading as each PV experiences different irradiance levels.
Figure 15 displays the I-V and P-V characteristics under uniform irradiance (shading scenario 1). The curves demonstrate that the MPP closely corresponds to the theoretical values noted in the datasheet of the SunPower SPR-X20-250-BLK panels, as documented in Table 1. This alignment validates the accuracy of the simulation model in replicating expected electrical behavior under standard operating conditions. The values obtained in Figure 15 were used as comparison for the MPPT algorithms to obtain how they performed under shading scenario 1.
In contrast, Figure 16 displays the I-V and P-V characteristics for shading scenarios 2-5 where each PV is subjected to different irradiance levels. These scenarios are designed to mimic the PSC effects. We can also observe that in these scenarios, we experience multiple MPPs resulting in two LMPPs and one GMPP. The GMPP is highlighted and used for comparison of the performance of the MPPT algorithms where (a) shows the GMPP for shading scenario 2, (b) the GMPP for shading scenario 3, (c) the GMPP for shading scenario 4, and (d) shows the GMPP for shading scenario 5.
4. MPPT Algorithms Development. Modelling Techniques and Performance
This section provides an overview of the MPPT algorithms evaluated in this study, including the traditional P&O and IC, as well as advanced algorithms such as FLC, GWO, PSO, and ANN. Figure 17 shows a block diagram of the inputs and outputs of the algorithms, which are implemented using MATLAB function blocks to operationalize their respective MPPT methods.
4.1. Perturb & Observe (P&O)
The P&O MPPT algorithm operates by periodically perturbing (adjusting) the operating voltage of the PVs and observing the resulting change in power output to track the MPP. The main principle behind the P&O algorithm is that, if an increase in the PV voltage leads to an increase in power, the operating point is moving towards the MPP. Conversely, if an increase in voltage leads to a decrease in power, the operating point is moving away from the MPP. The algorithm starts by measuring the current and voltage of the PVs to calculate the initial power. It then perturbs the voltage by a small increment and measures the new power output. By comparing the new power output with the previous power output, the algorithm determines the direction of the perturbation. If the new power is greater than the previous power, the perturbation continues in the same direction. If the new power is less than the previous power, the direction of the perturbation is reversed. This process is repeated continuously. The algorithm keeps adjusting the voltage in small steps and observing the changes in power output, thereby dynamically tracking the MPP. The perturbation can be either an increase or a decrease in voltage, and the size of the perturbation step can affect the algorithms responsiveness and stability. One of the main advantages of the P&O algorithm is its simplicity and ease of implementation. However, it can oscillate around the MPP under steady-state conditions and may struggle with rapid changes in environmental conditions. This is because the algorithm might continue perturbing even after reaching the MPP, causing the operating point to fluctuate around the optimal value. Despite these limitations, it is widely used due to its straightforward implementation and effectiveness in many scenarios.
4.2. Incremental Conductance (IC)
The core principle of the IC algorithm is based on the fact that the derivative of the power with respect to the voltage () is zero at the MPP, positive on the left of the MPP, and negative on the right. The algorithm uses this principle to track the MPP by measuring the instantaneous conductance () and the incremental conductance () of the PVs. The IC algorithm begins by measuring the PV’s current () and voltage (). It then calculates the incremental changes in current () and voltage () from their previous values. Using these measurements, the algorithm computes the instantaneous conductance () and the incremental conductance (). At each iteration, the algorithm evaluates the condition of the PVs to determine whether it is operating at, to the left of, or to the right of the MPP. If equals , the operating point is at the MPP, and no adjustment to the duty cycle is needed. If is greater than , the operating point is to the left of the MPP, indicating that the voltage should be increased to reach the MPP. Conversely, if is less than , the operating point is to the right of the MPP, indicating that the voltage should be decreased. Based on these evaluations, the algorithm adjusts the duty cycle of the boost converter accordingly. If the operating point is to the left of the MPP, the algorithm increases the duty cycle, which decreases the voltage and increases the current. If the operating point is to the right of the MPP, the algorithm decreases the duty cycle, which increases the voltage and decreases the current. The IC algorithm continues this process iteratively, constantly measuring the current and voltage, recalculating the conductance values, and adjusting the duty cycle to maintain operation at or near the MPP. This method allows the PV system to adapt dynamically to changes in environmental conditions, such as variations in irradiance and temperature, ensuring optimal power extraction from the PV array.
4.3. Fuzzy Logic Controller (FLC)
Figure 20 shows a block diagram of the FLC MPPT used in the simulation model. The core functionality of the model revolves around the FLC, which utilizes a Type-1 Sugeno Fuzzy Inference System (FIS) with Gaussian membership functions, adept at managing the non-linearity and uncertainty inherent in PV systems subject to PSC. The FLC operates by encoding expert knowledge into a set of "if-then" rules, where each input variable is associated with Gaussian functions characterized by their means and spreads. These functions are chosen for their smooth and continuous properties, which allow for effective handling of the gradual transitions in variable states. The (FIS) system is illustrated in Figure 21.
In the simulation model, the solar irradiance values are processed through a calculation system. Here, they input irradiance values are normalized and scaled to generate a "FuzzyIn" signal. This signal feeds into the FLC, where it undergoes several processing stages: fuzzification, where the degree of truth for each input variable is determined against the Gaussian functions; rule-based inference, applying the "prod" and "probor" methods for conjunctions and disjunctions; and defuzzification, which integrates the outputs of all active rules through a weighted average method to produce a duty cycle value for the boost converter.
The fuzzy rules, specified in Table 5, dictate the systems response to different scenarios, ensuring accurate tracking of the MPPT. Inputs are first fuzzified, then processed through the rule-based inference engine, with outputs aggregated and defuzzified to yield a precise duty cycle. This duty cycle subsequently drives the PWM signal controlling the MOSFET in the boost converter, effectively modulating the energy conversion to maintain optimal efficiency and align the PV output with the MPP.
4.4. Grey Wolf Optimization (GWO)
The GWO MPPT algorithm works by mimicking the social hierarchy and hunting behavior of grey wolves in nature to find the optimal duty cycle for a boost converter in the PV system. The goal of the algorithm is to maximize the power output from the PVs by continuously adjusting the duty cycle to operate at the MPP. The GWO algorithm starts by initializing a population of solutions, called grey wolves, which represent different possible duty cycle values. These wolves are divided into three categories: alpha, beta, and delta, corresponding to the best, second-best, and third-best solutions, respectively. The remaining wolves are considered omega and follow the top three wolves in the hierarchy. In each iteration of the algorithm, the positions of the wolves are updated based on the positions of the alpha, beta, and delta wolves. This process involves calculating the distances between each wolf and the alpha, beta, and delta wolves and then updating their positions using specific equations that simulate the encircling, hunting, and attacking strategies observed in grey wolves. The fitness of each wolf is evaluated based on the power output of the PV, which is calculated as the product of the PV voltage and current (). The algorithm compares the power output for each duty cycle value and updates the positions of the alpha, beta, and delta wolves if better solutions are found. This process of position updating and fitness evaluation continues iteratively until a stopping criterion is met, such as reaching a maximum number of iterations or achieving a convergence threshold. The position of the alpha wolf at the end of the iterations represents the optimal duty cycle for the boost converter. The optimal duty cycle is then sent to the PWM generator which adjusts the duty cycle of the boost converter accordingly. By doing so, the GWO MPPT algorithm ensures that the PV operates at or near its MPP, continuously adapting to changes in environmental conditions such as irradiance and temperature.
4.5. Particle Swarm Optimization (PSO)
The PSO MPPT algorithm is a technique that mimics the social behavior of birds flocking or fish schooling to find the optimal solution in a search space. In the context of this PV system, the PSO algorithm aims to find the optimal duty cycle for the boost converter to ensure that the PVs operates at its MPP. The algorithm begins by initializing a swarm of particles, where each particle represents a potential solution, which in this case is a possible duty cycle for the boost converter. These particles are distributed randomly across the search space. Each particle has a position, which corresponds to a duty cycle value, and a velocity, which determines the direction and magnitude of the particles movement through the search space. At each iteration, the particles update their positions and velocities based on two primary factors: their personal best position and the global best position. The personal best position is the highest power output a particle has achieved so far, while the global best position is the highest power output achieved by any particle in the swarm. The particles adjust their velocities by considering their current velocity, the distance to their personal best position, and the distance to the global best position. The influence of these distances is moderated by random coefficients, which introduce a stochastic element to the algorithm, helping the particles explore the search space more thoroughly. Once the velocities are updated, the particles move to new positions in the search space. The power output at these new positions is evaluated by calculating the product of the PV voltage and current. If a particles new position yields a higher power output than its previous best position, the personal best is updated. Similarly, if any particle achieves a power output higher than the current global best, the global best is updated. This process of updating velocities, moving particles, and evaluating power outputs continues iteratively. Over time, the swarm of particles converges towards the optimal duty cycle that maximizes the power output of the PVs. The particle at the global best position represents the optimal duty cycle, which is then used to control the boost converter. The PSO algorithm is particularly effective because it combines exploration and exploitation. The particles explore the search space to find the global optimum, and they exploit the best solutions found by guiding the swarm towards these solutions. This balance helps the PSO algorithm avoid local maxima and ensures that it finds the true MPP.
4.6. Artificial Neural Networks (ANNs)
Two ANN MPPT’s were developed, each with a different approach. After the successful training of each ANN, the optimized model was exported into the Simulink environment as depicted in Figure 24. This was accomplished by creating a dedicated Simulink block that encapsulates the functionality of the ANN. Named the “Function Fitting Neural Network”, this block clearly delineates inputs and outputs, providing a streamlined interface for simulation tasks.
Delving deeper into the structure of this ANN block, Figure 25 outlines the sequential arrangement of its processing elements. The “Process Input 1” block first conditions the input data, preparing it for processing through the neural layers. The data then passes through “Layer 1”, which consists of neurons equipped with sigmoid activation functions to introduce necessary non-linearity for effective pattern recognition. Following this, “Layer 2” acts as the output layer, applying a linear transformation to produce the final predictions.
Figure 26 shows the structures of ANN(1) (a) and ANN(2) (b), both employing a two-layer feedforward network with sigmoidal activation functions in the hidden layers and a linear function in the output neuron, suitable for regression tasks. The ANN development, training, validation, and testing processes were conducted using MATLAB’s Deep Learning Toolbox, with the dataset split into 70% for training, 15% for validation, and 15% for testing, ensuring comprehensive evaluation of the models’ performance. Both networks were trained using the Levenberg-Marquardt backpropagation algorithm, known for its effectiveness in minimizing the Mean Squared Error (MSE) by precisely adjusting the weights (w) and biases (b) across the network, enhancing the models’ ability to predict continuous voltage values accurately.
ANN(1) features a twenty-neuron hidden layer, which allows the network to capture nonlinear relationships between the inputs and the output more effectively. ANN(2) on the other hand, processes three solar irradiance inputs through a ten-neuron hidden layer, each computing a weighted sum followed by a sigmoid activation function. The output layer consists of a single neuron for continuous voltage prediction.
The ANN(1) model was designed to predict the maximum voltage output of the PV system. Using historical real-world data, the network is trained to estimate this maximum voltage based on the irradiance and temperature of each PV module. Consequently, the neural network has six inputs: the irradiance and temperature for each PV as shown in the block diagram depicted in Figure 27
The ANN(2) MPPT model illustrated in Figure 28 was designed to predict the maximum voltage output from the PV system based on variable solar irradiance inputs and was specifically trained for PSCs. In this ANN, the inputs are the irradiance values from each of the PVs, and the output is the maximum voltage level of the PV system. This approach is not commonly found in the literature and will be investigated in this study as an possibly simpler ANN algorithm than using real historical data for training.
Figure 29 shows the real-world solar irradiance (a) and temperature data (b), (obtained from NASA Power [22]) which were used for training the ANN(1) MPPT. This data is presumably structured in a way that each entry corresponds to hourly observations from Fredrikstad, Norway, covering the period from March to August 2023.
To create the dataset for training the ANN(2) to handle MPPT under PSCs, 1000 samples were generated, simulating various irradiance levels (0 to 1000 W/m2) on three PV panels. The voltage at the maximum power point (Vmpp) was calculated for each set of irradiance values. The minimum irradiance value among the panels determined the overall performance, with Vmpp scaled proportionally. For instance, half sunlight (500 W/m2) resulted in half of the maximum Vmpp (42.8 V). This method ensured the dataset accurately reflected varying conditions for effective MPPT management under PSCs. A snippet of the training data is shown in Table 6.
Figure 30 presents the regression plots for ANN(1) (a) and ANN(2) (b), demonstrating a strong fit between the models’ predictions and actual target values for both ANNs. In both cases, the training dataset (top left) aligns closely with the Y = T line, indicating excellent model fit and no significant bias. The validation dataset (top right) also aligns well with the Y = T line, suggesting good generalization capabilities. For the test datasets (bottom left), both ANN(1) and ANN(2) show slight deviations at the higher end but maintain a strong correlation overall. The combined performance plots (bottom right) for both ANNs confirm their robustness and high accuracy across training, validation, and test datasets, indicating their reliable predictive performance under various conditions.
Figure 31 shows the performance plots for ANN(1) (a) and ANN(2) (b) during training, with MSE for training (blue), validation (green), and test (red) datasets plotted over epochs. Both ANNs demonstrate a sharp decline in MSE within the first 100 epochs, indicating rapid learning. By around 600 epochs, the MSE stabilizes, indicating optimal learning. For ANN(1), the MSE stabilizes around 600 epochs, and the close tracking of the validation and test lines with the training line suggests good generalization and robustness, with no significant overfitting. For ANN(2), as the epochs increase, the MSE converges, suggesting stabilization around the optimal solution. The final MSE values for ANN(2) are very low, showing high accuracy. The validation and test lines closely track the training line, indicating good generalization and a low risk of overfitting. The best validation performance (1.3166e-07) occurs at epoch 1000, with no significant improvement beyond this point. Both models demonstrate excellent learning speed, accuracy, and generalization capabilities, with no signs of overfitting.
Figure 32 presents the error histogram plots for ANN(1) (a) and ANN(2) (b). For both ANNs, the majority of prediction errors are centered around the "Zero Error" line, indicating high accuracy and precision in the models’ predictions. For ANN(1), the errors for the training data (blue) cluster around zero, confirming a good fit. Validation and test errors (green and red) follow a similar pattern, suggesting good generalization. The close alignment of validation and test errors with the training errors indicates that the model is not overfitting. The uniform error distribution across datasets, with most errors near zero, demonstrates the model’s robustness and consistent performance without significant bias. ANN(2) shows a large number of instances (errors) concentrated around the zero-error bin. This concentration suggests that the ANN predictions are very accurate for a significant portion of the dataset. The distribution of errors for ANN(2) also indicates that the model generalizes well and maintains high accuracy across different datasets. Both ANNs demonstrate robust performance with minimal prediction errors and consistent accuracy across training, validation, and test datasets.
5. Results & Discussion
In this section, the outcomes of the simulations are presented and analyzed, focusing on the effectiveness of the MPPT algorithms in maximizing power output under PSCs. The objectives are to interpret the simulation results, compare the efficiency of each MPPT technique, and discuss the findings.
5.1. Shading Scenario 1
Figure 33(a) presents the maximum power outputs of the MPPT algorithms under uniform irradiance. P&O achieved 749.3 W, IC 749.4 W, FLC 749.7 W, and GWO 749.4 W. PSO showed a lower performance at 735.3 W. ANN (1) and ANN (2) demonstrated exceptional performance with outputs of 749.6 W. The P&O, IC, FLC, GWO, and both ANN models exhibited superior performance, each achieving around 749 W. PSO falled behind, indicating the need for further optimization. These results highlight the robustness and potential of ANN-based MPPT techniques in PV systems.
Further, Figure 33 (b) compares the average power output of the MPPT algorithms. P&O achieved 747.9 W, IC 735.7 W, and FLC 744.9 W. GWO stands out with 748.9 W. PSO had the lowest output at 734.7 W. ANN (1) excelled with 749.6 W, closely followed by ANN (2) at 747.2 W. The P&O, GWO, and both ANN models performed best, exceeding 747 W. IC and FLC showed moderate performance, while PSO lagged behind. These results underscore the robustness of ANN-based techniques, especially ANN (1) and ANN (2), under uniform irradiance, with GWO also proving reliable.
Figure 34(a) shows the average power measurements, but also provides a comparison of the settling times for the MPPT algorithms. This comparison is crucial as it reflects how quickly each algorithm can stabilize at the maximum power point after a disturbance or at start-up, which can significantly impact the overall energy capture efficiency.
The bar chart in Figure 34 (b) clearly shows that the P&O algorithm had the longest settling time at 0.374 seconds, indicating slower response to changing conditions. The IC algorithm had a shorter settling time of 0.087 seconds, balancing speed and accuracy. FLC performed well with a settling time of 0.055 seconds, demonstrating quick adaptability. GWO also showed efficiency with a settling time of 0.062 seconds. PSO, while faster than P&O, had a settling time of 0.116 seconds, still lagging behind more sophisticated algorithms. ANN (1) and ANN (2) models exhibited the fastest settling times at 0.055 seconds, combining high accuracy with swift adaptation. The ANN (1), ANN (2), FLC, and GWO were the most efficient in terms of settling time, with IC showed moderate performance. PSO showed longer settling times than most but was faster than P&O. This analysis highlights the importance of selecting MPPT algorithms based on response times, with ANN-based models being highly effective for applications requiring rapid stabilization.
Figure 35 provides a comparative analysis of the MPPT efficiencies. The P&O algorithm showed a high MPPT efficiency of 99.81%, indicating effective energy capture despite longer settling time. The IC algorithm had a lower efficiency of 98.18%, suggesting compromised accuracy. FLC exhibited an efficiency of 99.40%, balancing quick response and accurate tracking. GWO achieved one of the highest efficiencies at 99.93%, demonstrating superior capability. PSO showed a lower efficiency of 98.04%, indicating less effectiveness in tracking the MPP. ANN (1) performed exceptionally well with an efficiency of 99.99%, the highest among the algorithms, indicating superior adaptability. ANN (2) also performed strongly at 99.70%, reinforcing the robustness of ANN-based approaches.
5.2. Shading Scenario 2-5
Figure 36 presents a comparative analysis of both maximum (a) and average power (b) outputs for the MPPT algorithms under shading scenarios 2 through 5. In scenario 2, IC, FLC, GWO, and ANN (2) achieved the highest maximum power outputs (265.9 W to 266.0 W). ANN (1) had lower average power, and P&O and PSO showed the lowest outputs. In scenario 3, IC, FLC, GWO, and both ANN models performed well, achieving maximum power around 367 W. ANN (2) and GWO maintained the highest average power. In scenario 4, IC, FLC, and ANN (2) achieved the highest outputs around 328 W, with ANN (1) showing variability in average power. PSO continued to struggle with lower average power. In scenario 5, ANN (2), IC, and FLC performed strongly with maximum outputs around 317 W, while ANN (1) showed lower average power. P&O and PSO exhibited the lowest outputs. The IC, FLC, GWO, and ANN (2) demonstrated high power outputs and robust performance, while ANN (1), P&O, and PSO showed variability and lower performance, indicating a need for optimization.
Figure 37 compares the settling times of the MPPT algorithms under shading scenarios 2 to 5, assessing responsiveness and adaptation speed. In scenario 2, P&O and IC had longer settling times, with P&O at 0.170 seconds and IC slightly lower. FLC and GWO showed significantly shorter settling times, while PSO was slightly higher than FLC and GWO. ANN (1) and ANN (2) had the fastest response times, at 0.009 and 0.065 seconds, respectively. In scenario 3, P&O and IC again showed higher settling times, with IC at 0.315 seconds. FLC, GWO, and ANN models maintained low settling times, with PSO showing moderate performance. In scenario 4, IC and P&O had the longest settling times at 0.315 seconds, while FLC, GWO, and ANN models maintained low settling times. In scenario 5, characterized by severe shading, P&O had a higher settling time, IC performed better but still lags behind, and FLC, GWO, and ANN models maintained low settling times, with ANN (1) and ANN (2) demonstrating the fastest responses. The ANN (1) and ANN (2) showed superior rapid stabilization, FLC and GWO performed consistently well, and IC and P&O exhibited longer settling times. PSO showed moderate performance. ANN-based models were the most efficient under varying irradiance conditions, significantly enhancing energy capture and yield.
Figure 38 compares the MPPT efficiencies of the algorithms under shading scenarios 2 to 5. In scenario 2, IC, FLC, GWO, and ANN (2) exceeded 99% efficiency, while ANN (1) showed 35.75%, P&O 90.31%, and PSO struggled with 41.46%. In scenario 3, IC, FLC, GWO, and ANN (2) maintained around 99% efficiency, ANN (1) achieves 41.46%, and P&O and PSO showed efficiencies of 65.39% and 97.28%, respectively. In scenario 4, IC and ANN (2) were near 99.99%, with GWO and FLC performing well, and ANN (1) improved to 96.60%. In scenario 5, IC, FLC, and ANN (2) maintained around 99% efficiency, and ANN (1) improved to 74.94%. The IC, FLC, GWO, and ANN (2) showed high efficiency across scenarios, while ANN (1) showed variability. P&O and PSO exhibited lower efficiencies, indicating a need for optimization. Advanced algorithms like ANN (2) and GWO handled variability well, while simpler algorithms like P&O and PSO may not perform consistently under complex conditions.
The ANN(2) model demonstrated not only superior efficiency but also significantly faster response times when compared to other MPPT algorithms under various PSCs. The settling times for the different algorithms were recorded and analyzed, providing insights into their adaptability and speed in stabilizing at the GMPP. In shading scenario 2, the ANN(2) algorithm achieved a settling time of 0.070 seconds, while the PSO algorithm had a settling time of 0.105 seconds and the P&O algorithm took 0.170 seconds. This indicates that ANN(2) was approximately 33% faster than PSO and 59% faster than P&O. In shading scenario 3, the ANN(2) algorithm maintained a settling time of 0.065 seconds, significantly outperforming the IC algorithm, which had the highest settling time of 0.315 seconds. ANN(2) was thus about 79% faster than IC in stabilizing under these conditions. In shading scenario 4, ANN(2) achieved a settling time of 0.038 seconds, while the IC algorithm again showed a longer settling time of 0.315 seconds. This represents an impressive improvement, with ANN(2) being approximately 88% faster than IC. In shading scenario 5, ANN(2) demonstrated a settling time of 0.044 seconds, outperforming PSO with a settling time of 0.054 seconds and P&O with 0.171 seconds. ANN(2) was about 19% faster than PSO and 74% faster than P&O. Based on these findings, the performance of the MPPT algorithms can be evaluated as in Table 7.
The ANN(2) model proved to be highly effective in not only maximizing power output and efficiency but also in significantly reducing the settling times compared to other traditional and advanced MPPT algorithms. Its rapid response and ability to quickly stabilize under various PSCs make it an ideal choice for PV system applications, where dynamic environmental changes are common. These findings reinforce the potential of ANN-based approaches to enhance the performance and reliability of solar energy systems, contributing to more efficient and adaptable renewable energy solutions and support the green energy transition. The results indicate that while ANN(1) performed exceptionally well under uniform solar conditions, it requires further training with more data or the integration of a hybrid approach to ensure robust performance under PSCs. Although ANN(1) was marginally the most efficient algorithm in stable environments, it exhibited poor performance under certain PSC scenarios. In contrast, ANN(2) demonstrated superior performance across various PSCs, highlighting its effectiveness and reliability. Due to its lack of temperature input, it is not considered to be relevant for applications such as BIPV unless it could be further developed but could be interesting for locations and applications that experience stable temperature environments. Such as cold climates or possibly applications such as FPVs which ensures good and sufficient cooling.
6. Conclusions
This paper presented a comprehensive analysis and evaluation of various Maximum Power Point Tracking (MPPT) algorithms under Partial Shading Conditions (PSCs) for photovoltaic (PV) systems. The study focused on traditional methods such as Perturb and Observe (P&O) and Incremental Conductance (IC), as well as advanced techniques including Fuzzy Logic Control (FLC), Grey Wolf Optimization (GWO), Particle Swarm Optimization (PSO), and two Artificial Neural Network (ANN) models (ANN(1) and ANN(2)). The simulations were conducted in a controlled MATLAB/Simulink environment to ensure accurate and reliable comparisons. The findings indicate that while ANN(1) performed exceptionally well under uniform solar conditions, it struggled with PSCs due to its reliance on stable environmental inputs. On the other hand, ANN(2) demonstrated superior performance across various PSC scenarios, outperforming traditional and advanced MPPT techniques in terms of efficiency and convergence speed. Specifically, ANN(2) was on average 72% faster than P&O, 83% faster than IC, and 26% faster than PSO. ANN(2) also showed significant advantages over GWO and FLC in complex scenarios. The efficiency improvements were notable as well, with ANN(2) being on average 23.41% more efficient than P&O, 0.61% more efficient than IC, 4.28% more efficient than FLC, 1.68% more efficient than GWO, 24.61% more efficient than PSO, and 29.76% more efficient than ANN(1). These results underscore the potential of ANN-based approaches to enhance the performance and reliability of solar energy systems under dynamic shading conditions. The study also highlights the importance of integrating more adaptive and intelligent systems like AI and ML into PV optimization processes. The ANN(2) model, which used only irradiance as an input, simplified the MPPT process, reduced the complexity and potential cost of implementation while maintaining high performance. This makes it interesting to further investigate it as a practical solution for real-world PV systems, especially in environments with frequent and complex shading patterns with stable temperature environments.
Funding
This research received no external funding.
Data Availability Statement
Data will be made available on the request.
Conflicts of Interest
The authors declare no conflicts of interest.
References
- Kabeyi, M.J.B.; Olanrewaju, O.A. Sustainable Energy Transition for Renewable and Low Carbon Grid Electricity Generation and Supply. 9. [CrossRef]
- MacKay, D.J.C. Sustainable energy–without the hot air; Cambridge, England : UIT, ©2009.
- Trends in PV Applications 2023. https://iea-pvps.org/trends_reports/trends-2023/. IEA-PVPS.
- Bhukya, L.; Kedika, N.R.; Salkuti, S.R. Enhanced Maximum Power Point Techniques for Solar Photovoltaic System under Uniform Insolation and Partial Shading Conditions: A Review. 15, 365. [CrossRef]
- El Iysaouy, L.; Lahbabi, M.; Bhagat, K.; Azeroual, M.; Boujoudar, Y.; Saad El Imanni, H.; Aljarbouh, A.; Pupkov, A.; Rele, M.; Ness, S. Performance enhancements and modelling of photovoltaic panel configurations during partial shading conditions. [CrossRef]
- Youssef, A.R.; Hefny, M.M.; Ali, A.I.M. Investigation of single and multiple MPPT structures of solar PV-system under partial shading conditions considering direct duty-cycle controller. 13, 19051. [CrossRef]
- Rajavel, A.; Rathina Prabha, N. Fuzzy logic controller-based boost and buck-boost converter for maximum power point tracking in solar system. 43. [CrossRef]
- Zou, Y.; Yan, F.; Wang, X.; Zhang, J. An efficient fuzzy logic control algorithm for photovoltaic maximum power point tracking under partial shading condition. 357, 3135–3149. [CrossRef]
- Janandra Krishna Kishore, D.; Mohamed, M.R.; Sudhakar, K.; Peddakapu, K. Grey wolf optimization and differential evolution-based maximum power point tracking controller for photovoltaic systems under partial shading conditions. 44, 6286–6302. [CrossRef]
- Motahhir, S.; Chtita, S.; Chouder, A.; El Hammoumi, A. Enhanced energy output from a PV system under partial shaded conditions through grey wolf optimizer. 9, 100533. [CrossRef]
- Xu, L.; Cheng, R.; Xia, Z.; Shen, Z. Improved Particle Swarm Optimization (PSO)-based MPPT Method for PV String under Partially Shading and Uniform Irradiance Condition. 2020 Asia Energy and Electrical Engineering Symposium (AEEES), pp. 771–775. [CrossRef]
- Eltamaly, A.M.; Al-Saud, M.S.; Abo-Khalil, A.G. Performance Improvement of PV Systems’ Maximum Power Point Tracker Based on a Scanning PSO Particle Strategy. 12, 1185. [CrossRef]
- Obukhov, S.; Ibrahim, A.; Zaki Diab, A.A.; Al-Sumaiti, A.S.; Aboelsaud, R. Optimal Performance of Dynamic Particle Swarm Optimization Based Maximum Power Trackers for Stand-Alone PV System Under Partial Shading Conditions. 8, 20770–20785. [CrossRef]
- Olabi, A.G.; Abdelkareem, M.A.; Semeraro, C.; Radi, M.A.; Rezk, H.; Muhaisen, O.; Al-Isawi, O.A.; Sayed, E.T. Artificial neural networks applications in partially shaded PV systems. 37, 101612. [CrossRef]
- Allahabadi, S.; Iman-Eini, H.; Farhangi, S. Fast Artificial Neural Network Based Method for Estimation of the Global Maximum Power Point in Photovoltaic Systems. 69, 5879–5888. [CrossRef]
- Adi Kurniawan.; Eiji Shintaku. A Neural Network-Based Rapid Maximum Power Point Tracking Method for Photovoltaic Systems in Partial Shading Conditions. 56, 157–167. [CrossRef]
- Villegas-Mier, C.G.; Rodriguez-Resendiz, J.; Álvarez Alvarado, J.M.; Rodriguez-Resendiz, H.; Herrera-Navarro, A.M.; Rodríguez-Abreo, O. Artificial Neural Networks in MPPT Algorithms for Optimization of Photovoltaic Power Systems: A Review. 12, 1260. [CrossRef]
- Al-Ezzi, A.S.; Ansari, M.N.M. Photovoltaic Solar Cells: A Review. 5, 67. [CrossRef]
- Al-Majidi, S.D.; Abbod, M.F.; Al-Raweshidy, H.S. A novel maximum power point tracking technique based on fuzzy logic for photovoltaic systems. 43, 14158–14171. [CrossRef]
- Al-Majidi, S.D.; Abbod, M.F.; Al-Raweshidy, H.S. Design of an Efficient Maximum Power Point Tracker Based on ANFIS Using an Experimental Photovoltaic System Data. 8, 858. [CrossRef]
- Villegas-Mier, C.G.; Rodriguez-Resendiz, J.; Álvarez Alvarado, J.M.; Rodriguez-Resendiz, H.; Herrera-Navarro, A.M.; Rodríguez-Abreo, O. Artificial Neural Networks in MPPT Algorithms for Optimization of Photovoltaic Power Systems: A Review. 12, 1260. [CrossRef]
- POWER | Data Access Viewer. https://power.larc.nasa.gov/data-access-viewer/. NASA.
Figure 1.
Global Energy Production 2022 [3].
Figure 1.
Global Energy Production 2022 [3].
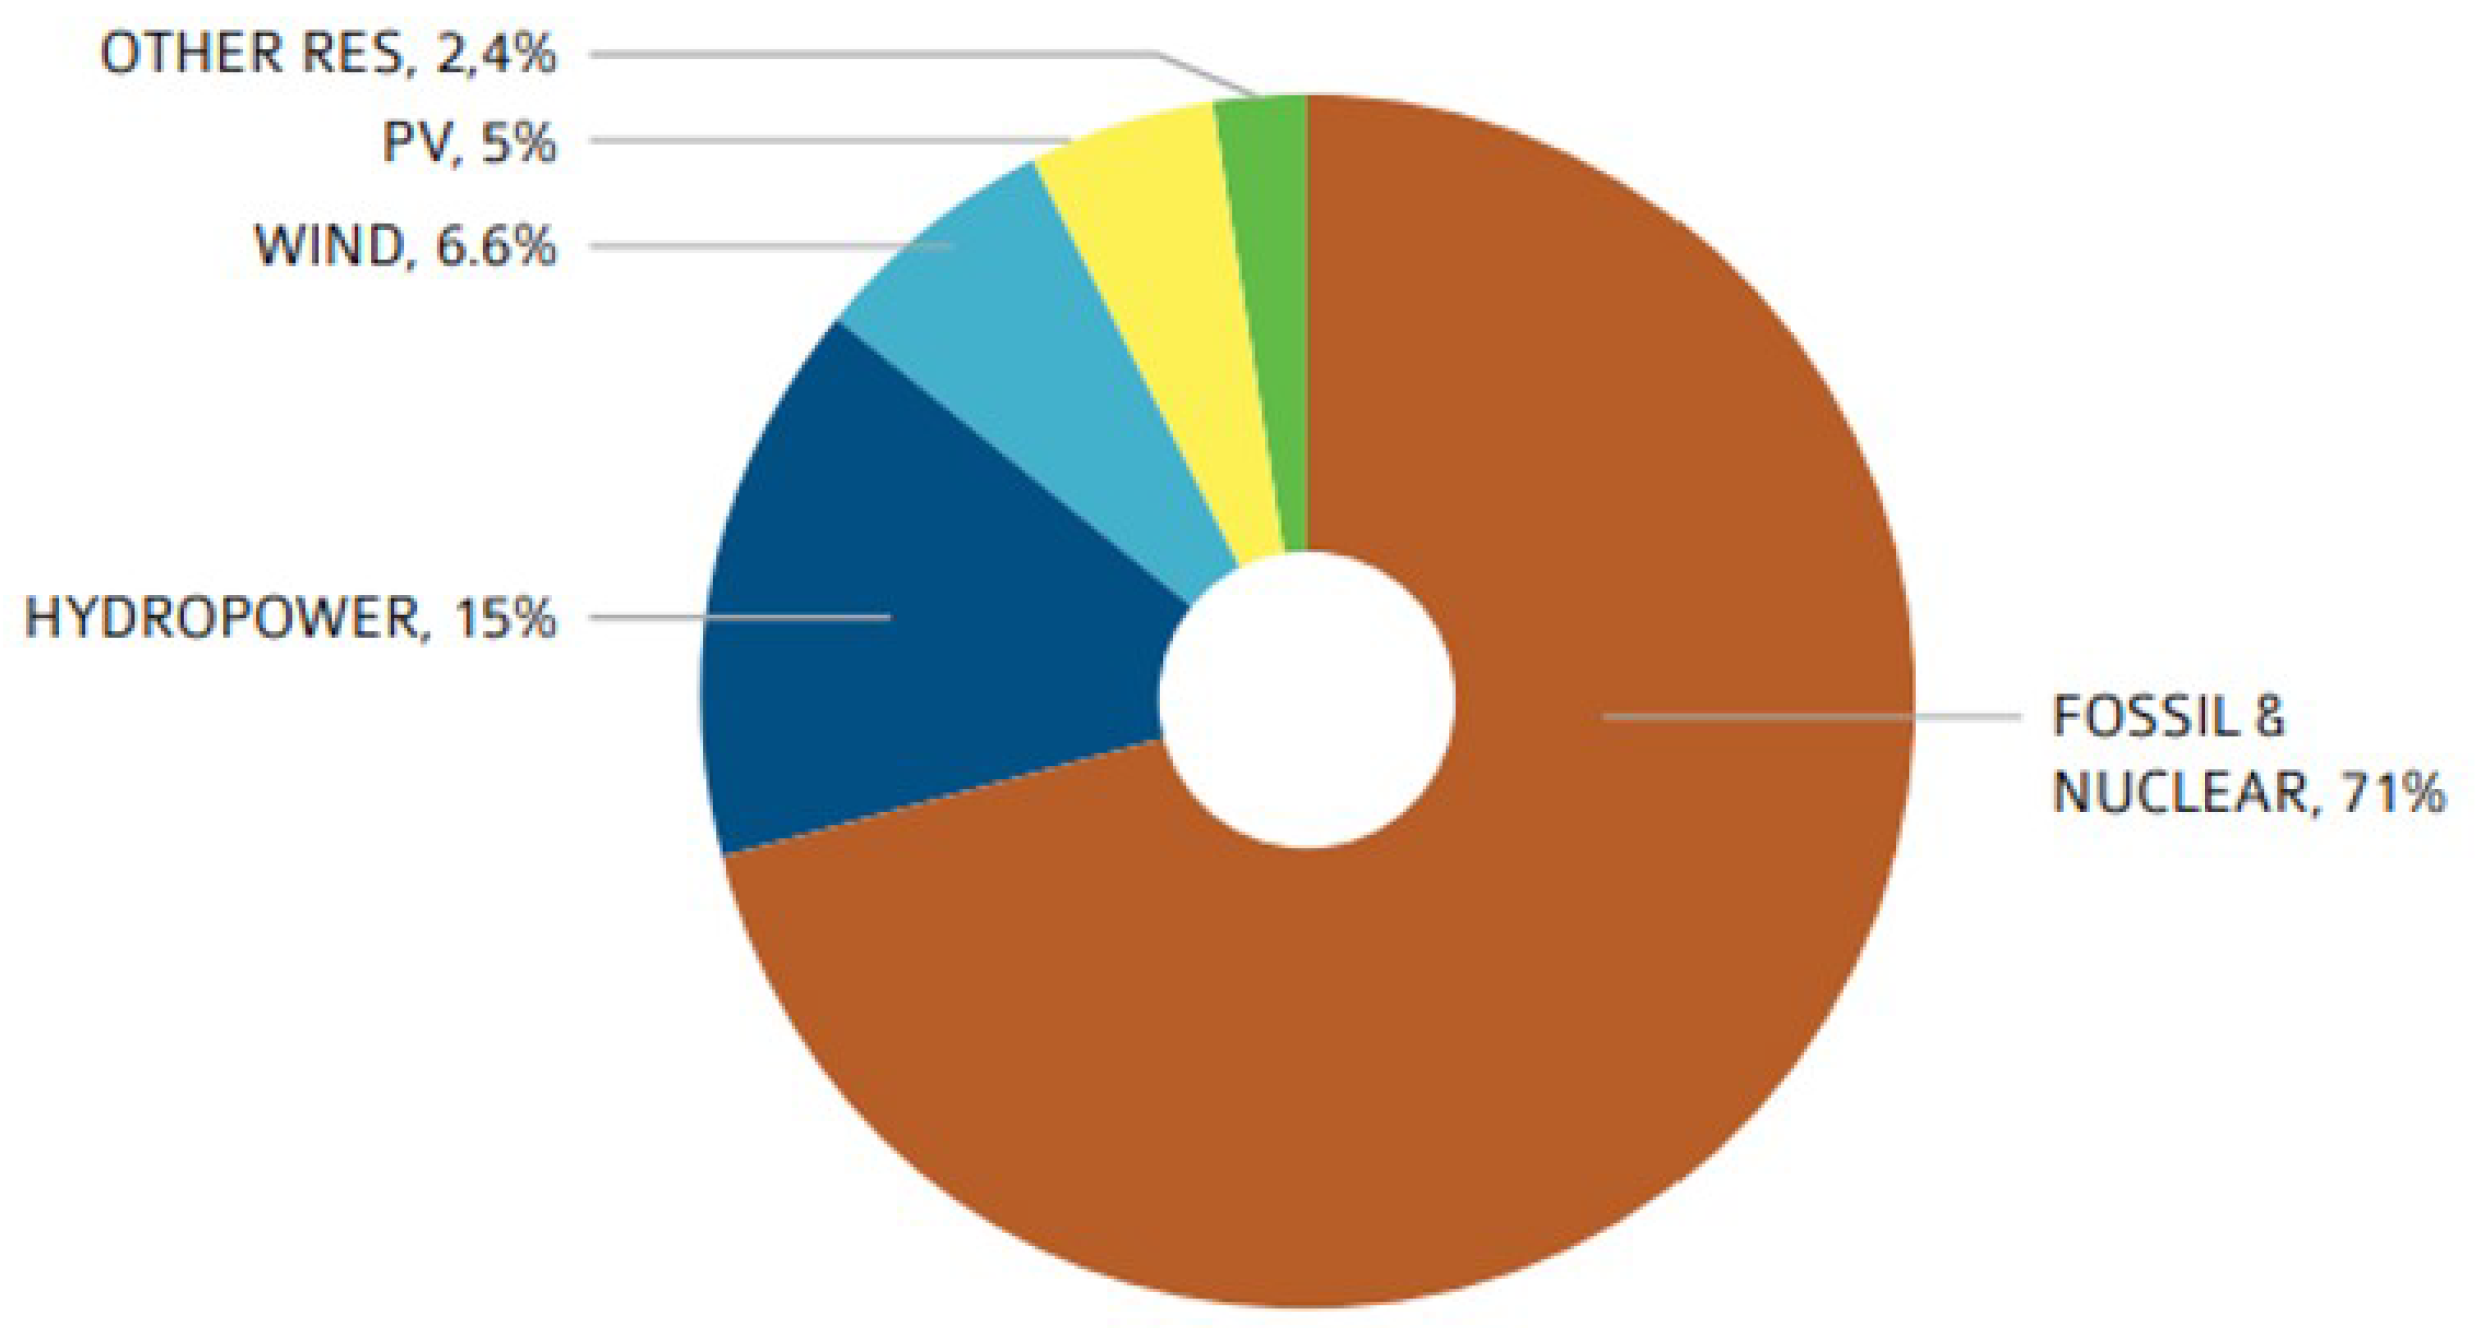
Figure 2.
Yearly PV installation, module PV production and module production capacity 2012 - 2022 (GW) [3].
Figure 2.
Yearly PV installation, module PV production and module production capacity 2012 - 2022 (GW) [3].
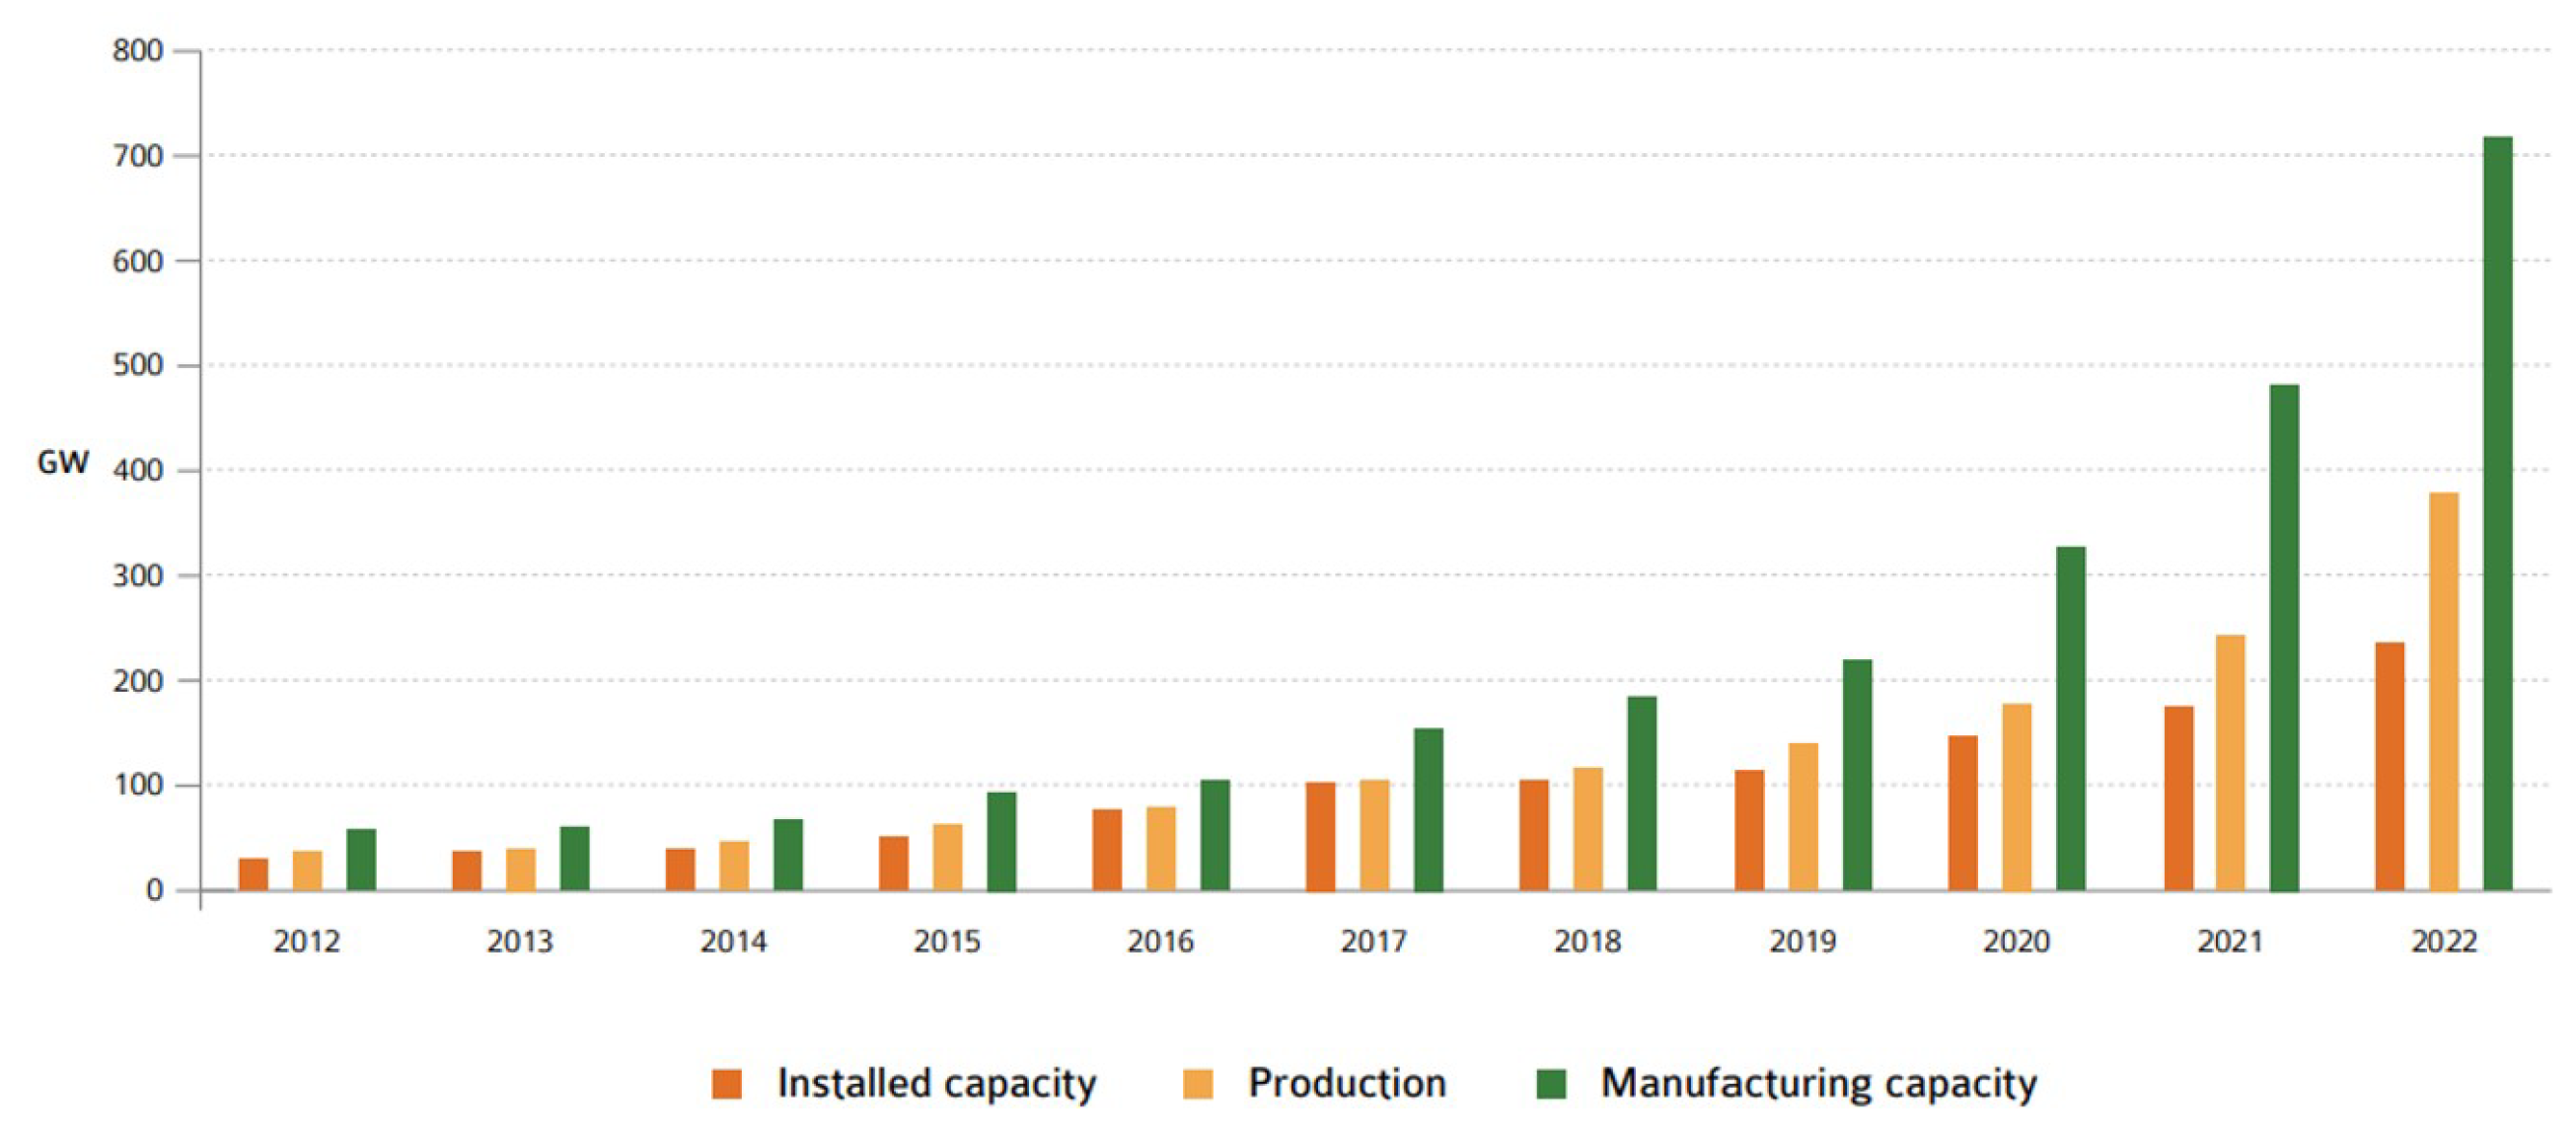
Figure 3.
Block diagram of the PV system components.
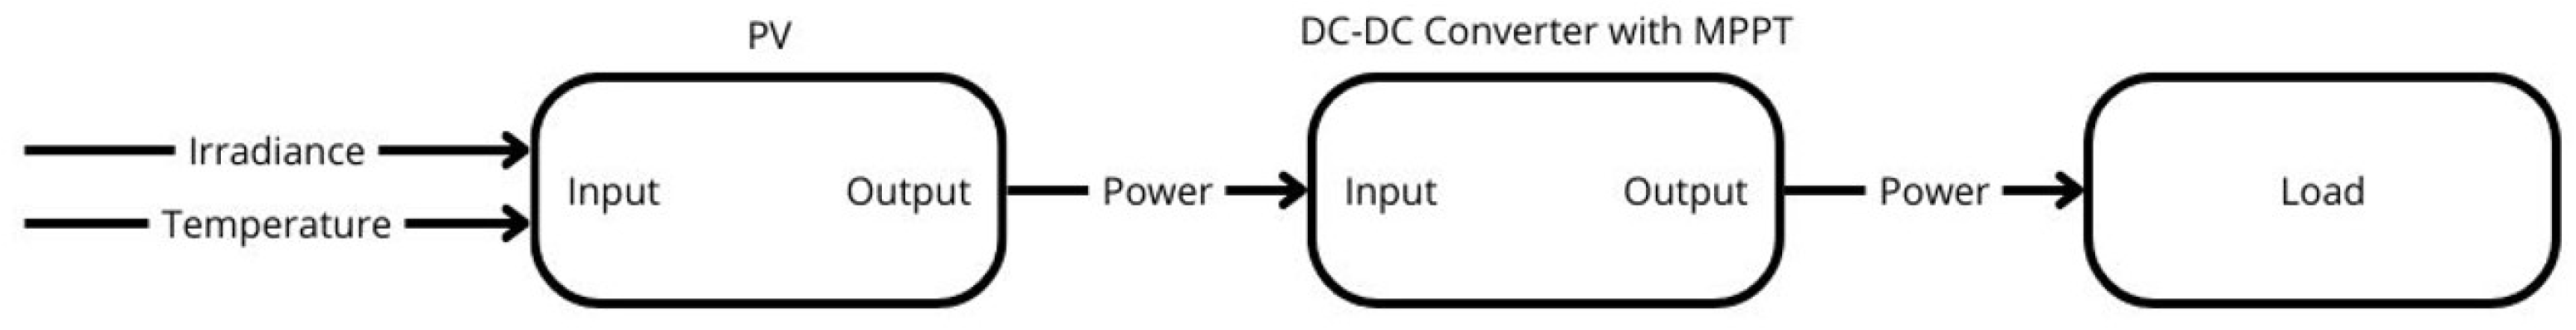
Figure 4.
Equivalent circuit of PV cell [20].
Figure 4.
Equivalent circuit of PV cell [20].
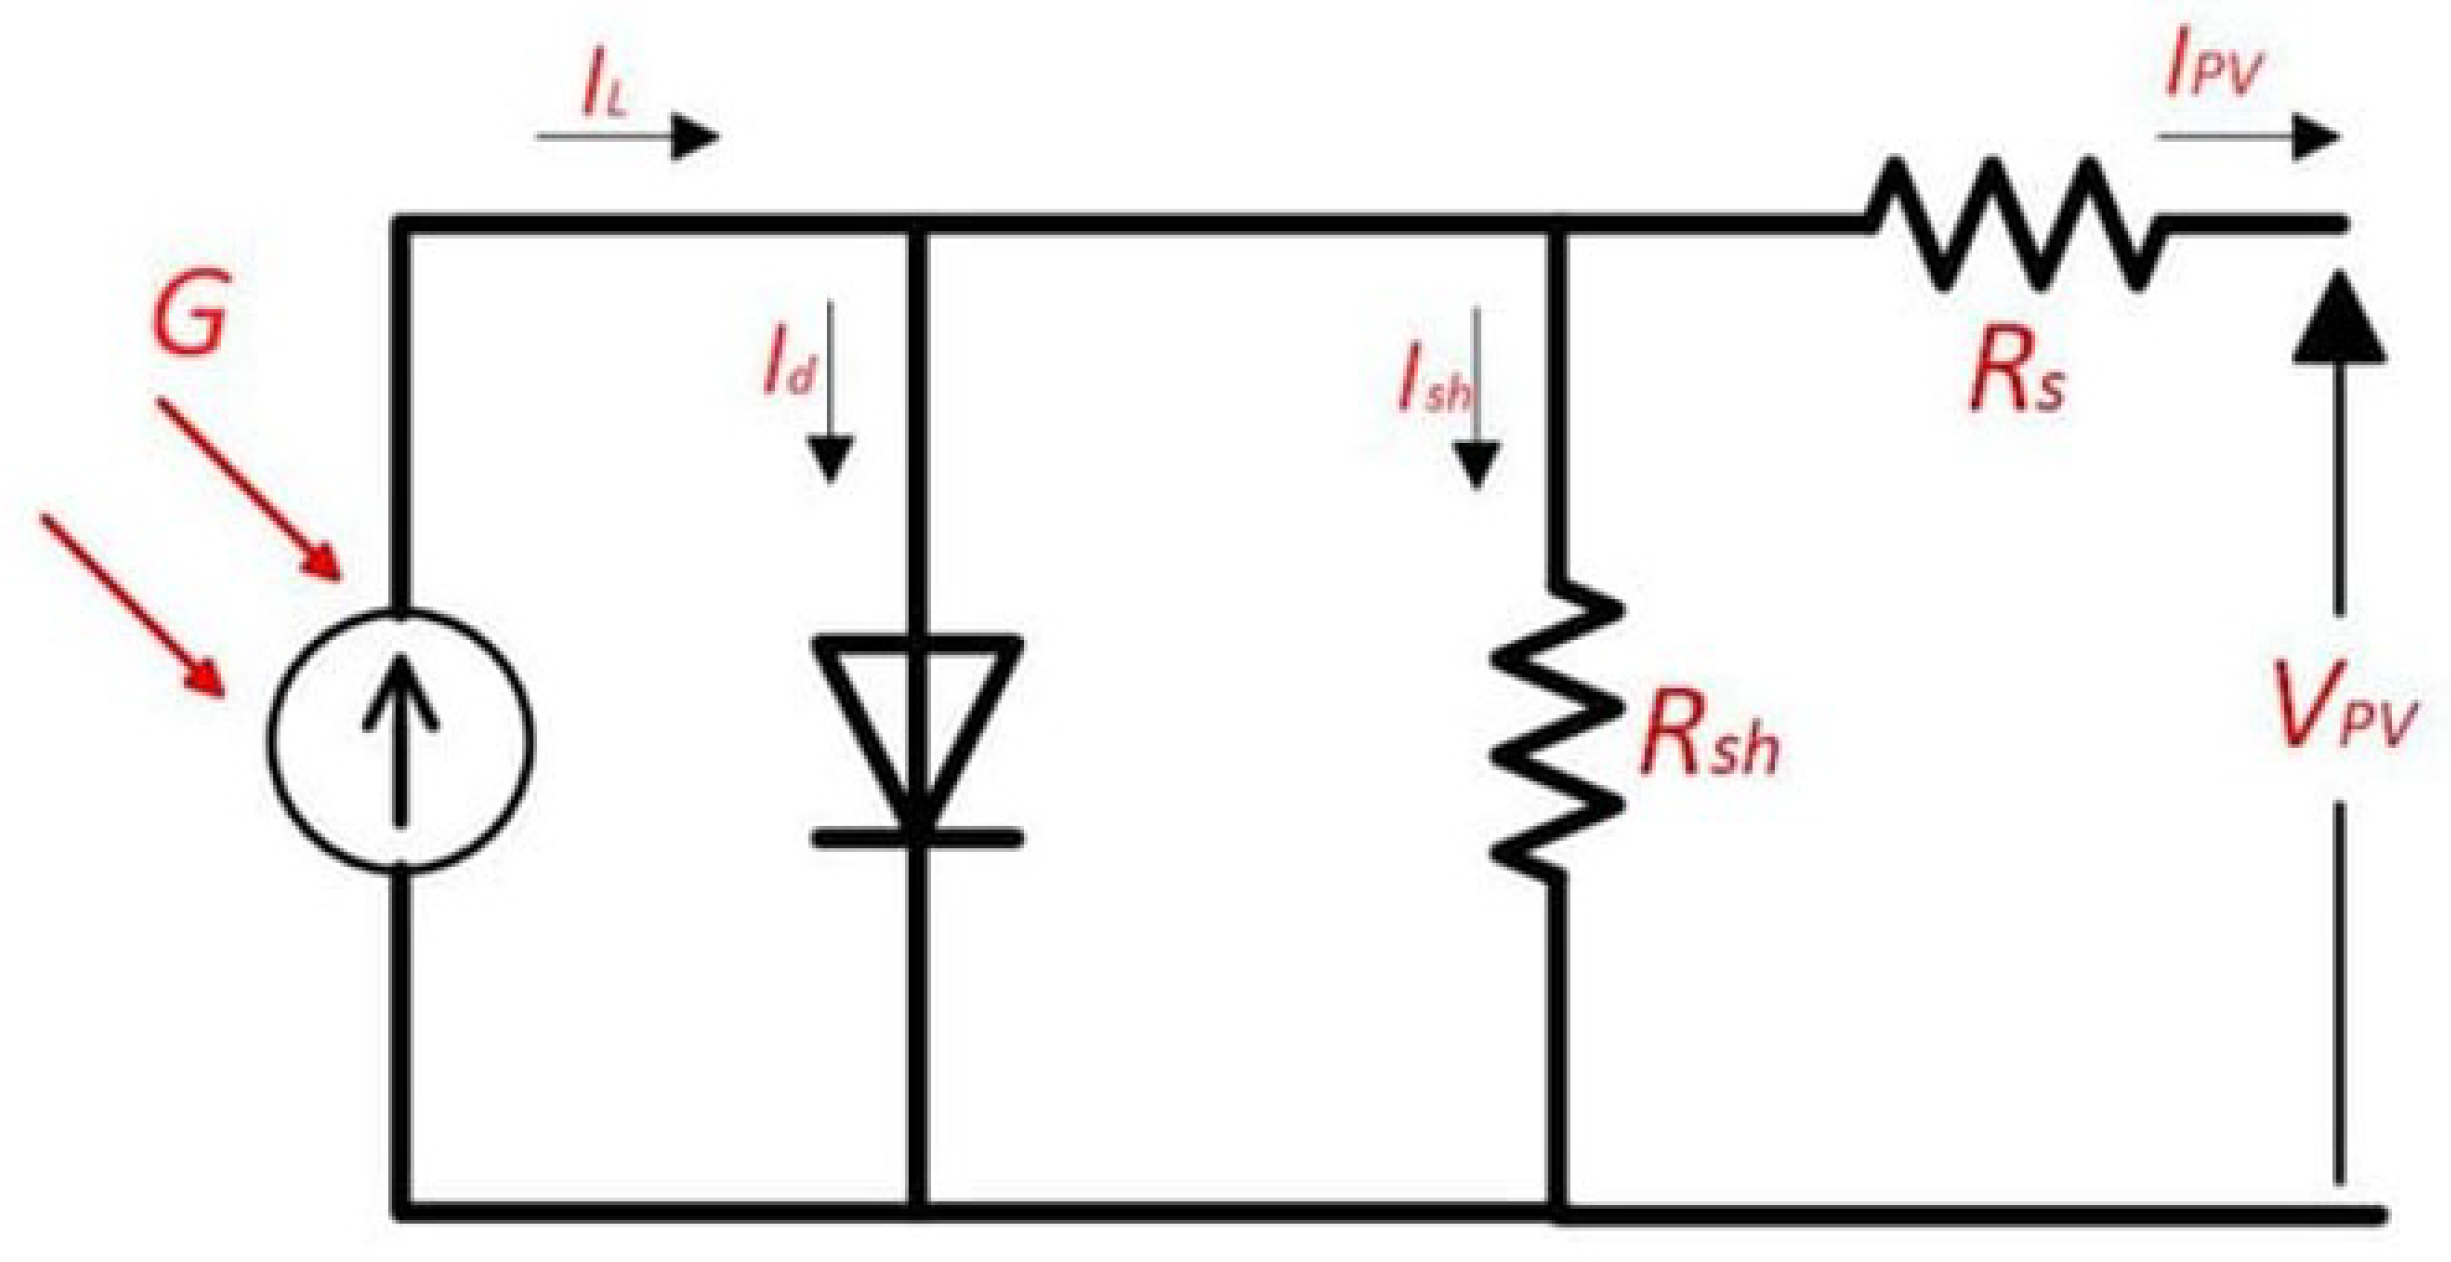
Figure 5.
Performance Characteristics of a PV cell or module, represented by the Current-Voltage (I-V) curve and the Power-Voltage (P-V) curve.
Figure 5.
Performance Characteristics of a PV cell or module, represented by the Current-Voltage (I-V) curve and the Power-Voltage (P-V) curve.
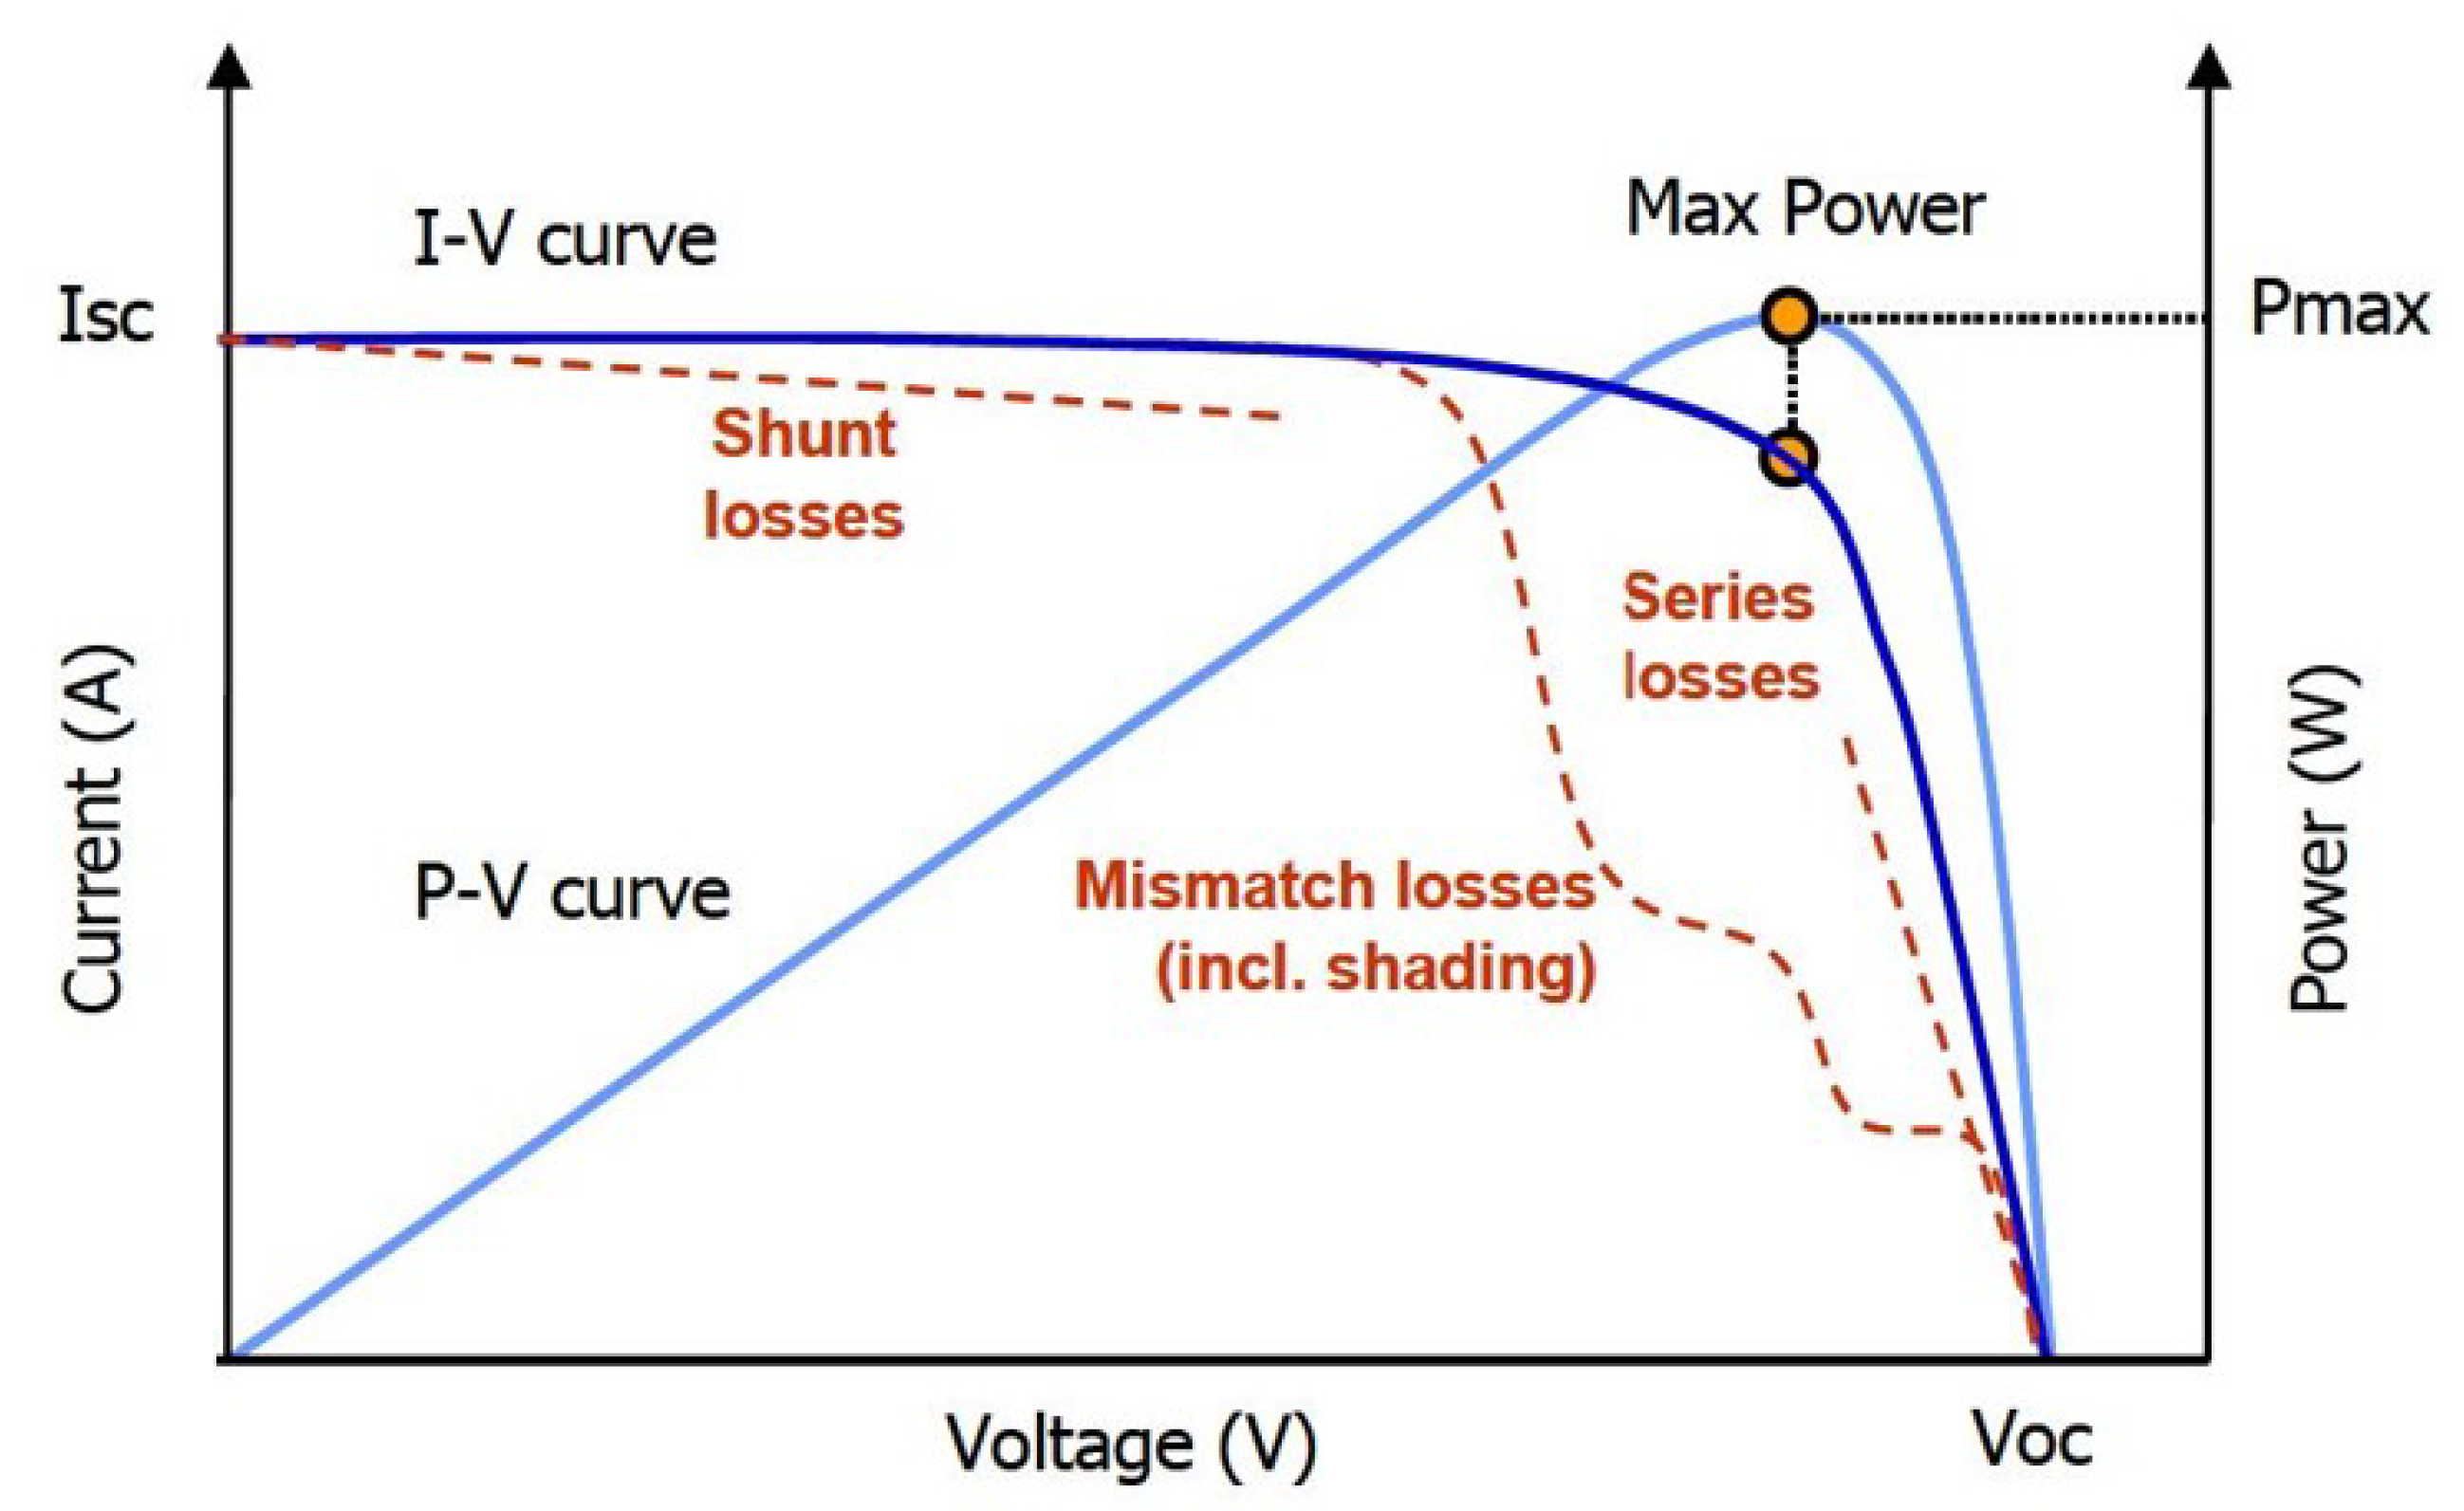
Figure 6.
I-V curve of a PV cell where (a) is illustrating the short-circuit current, and (b) is showing the open-circuit voltage.
Figure 6.
I-V curve of a PV cell where (a) is illustrating the short-circuit current, and (b) is showing the open-circuit voltage.
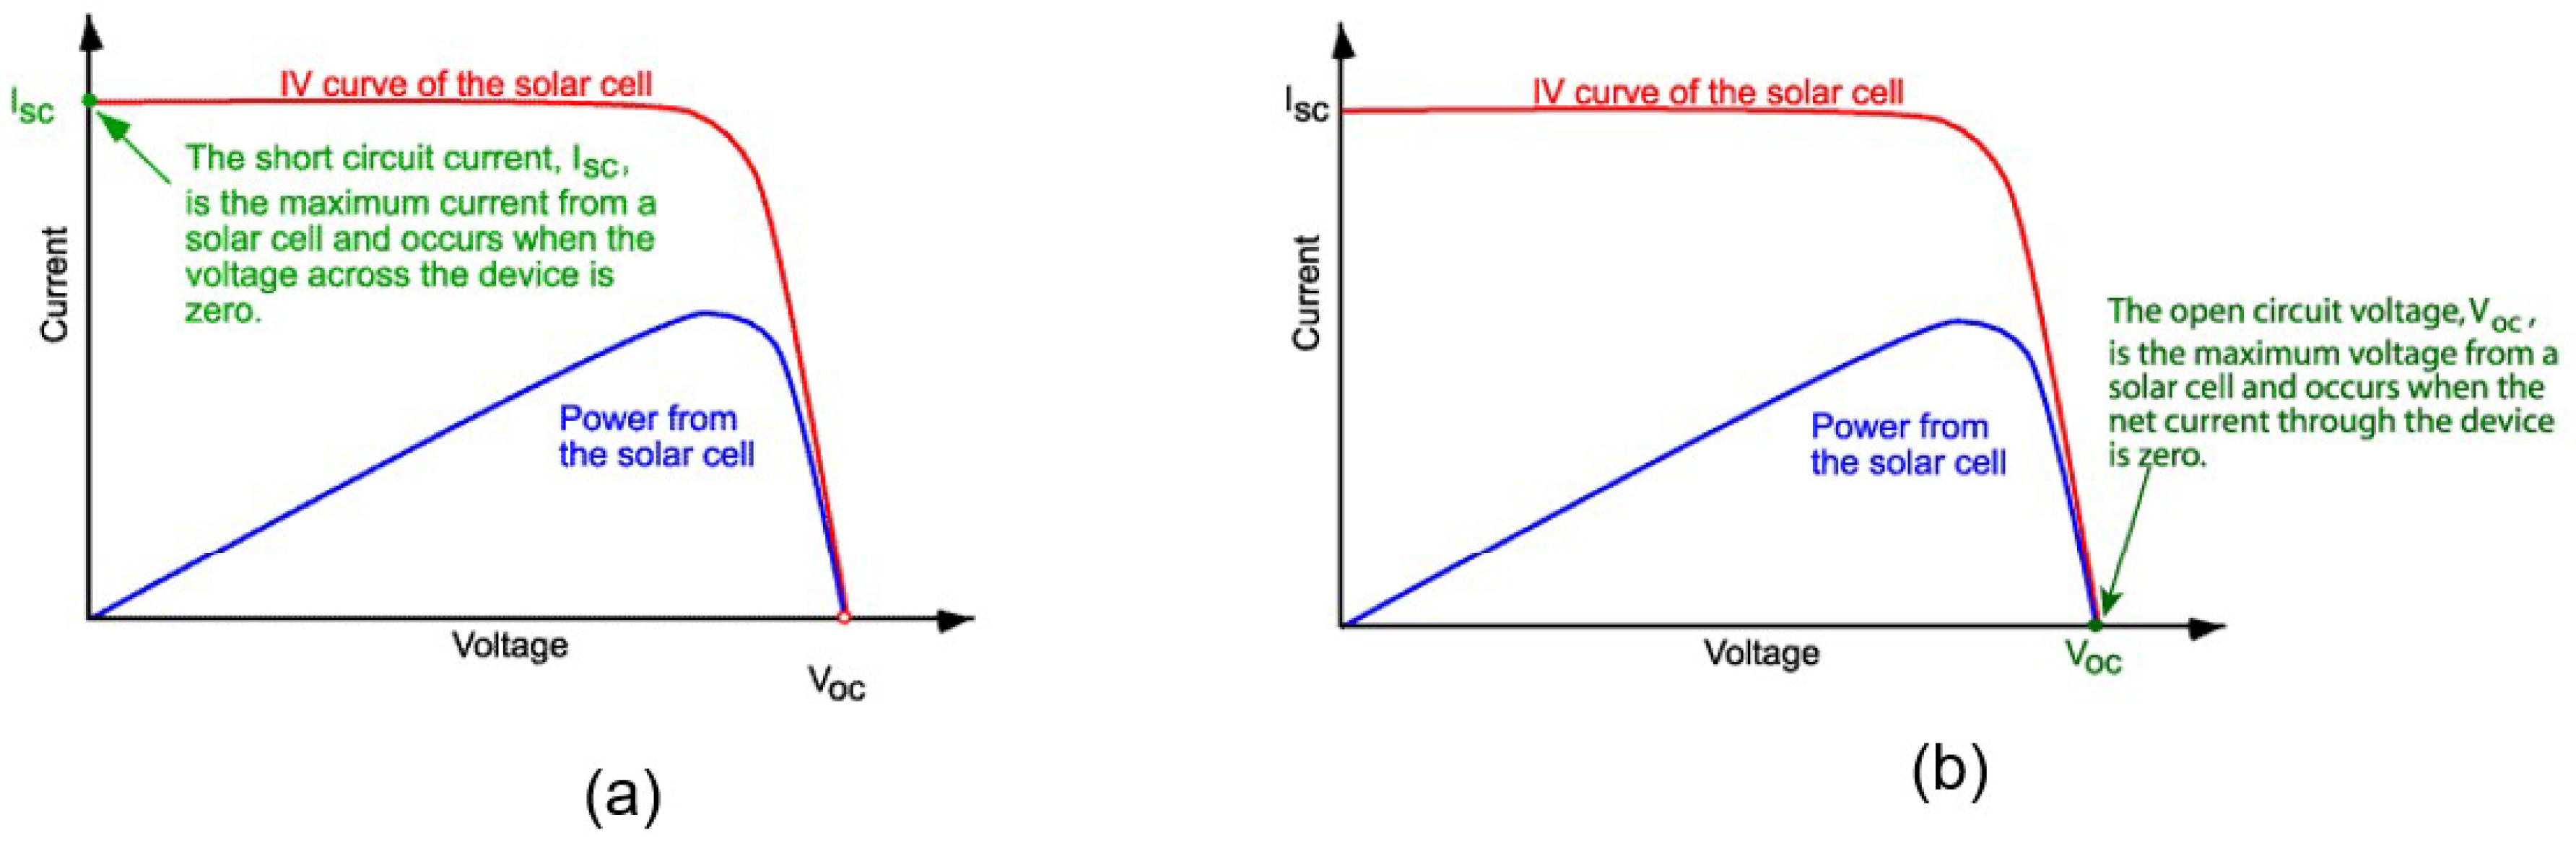
Figure 7.
I-V curve, P-V curve, and MPP [4].
Figure 7.
I-V curve, P-V curve, and MPP [4].
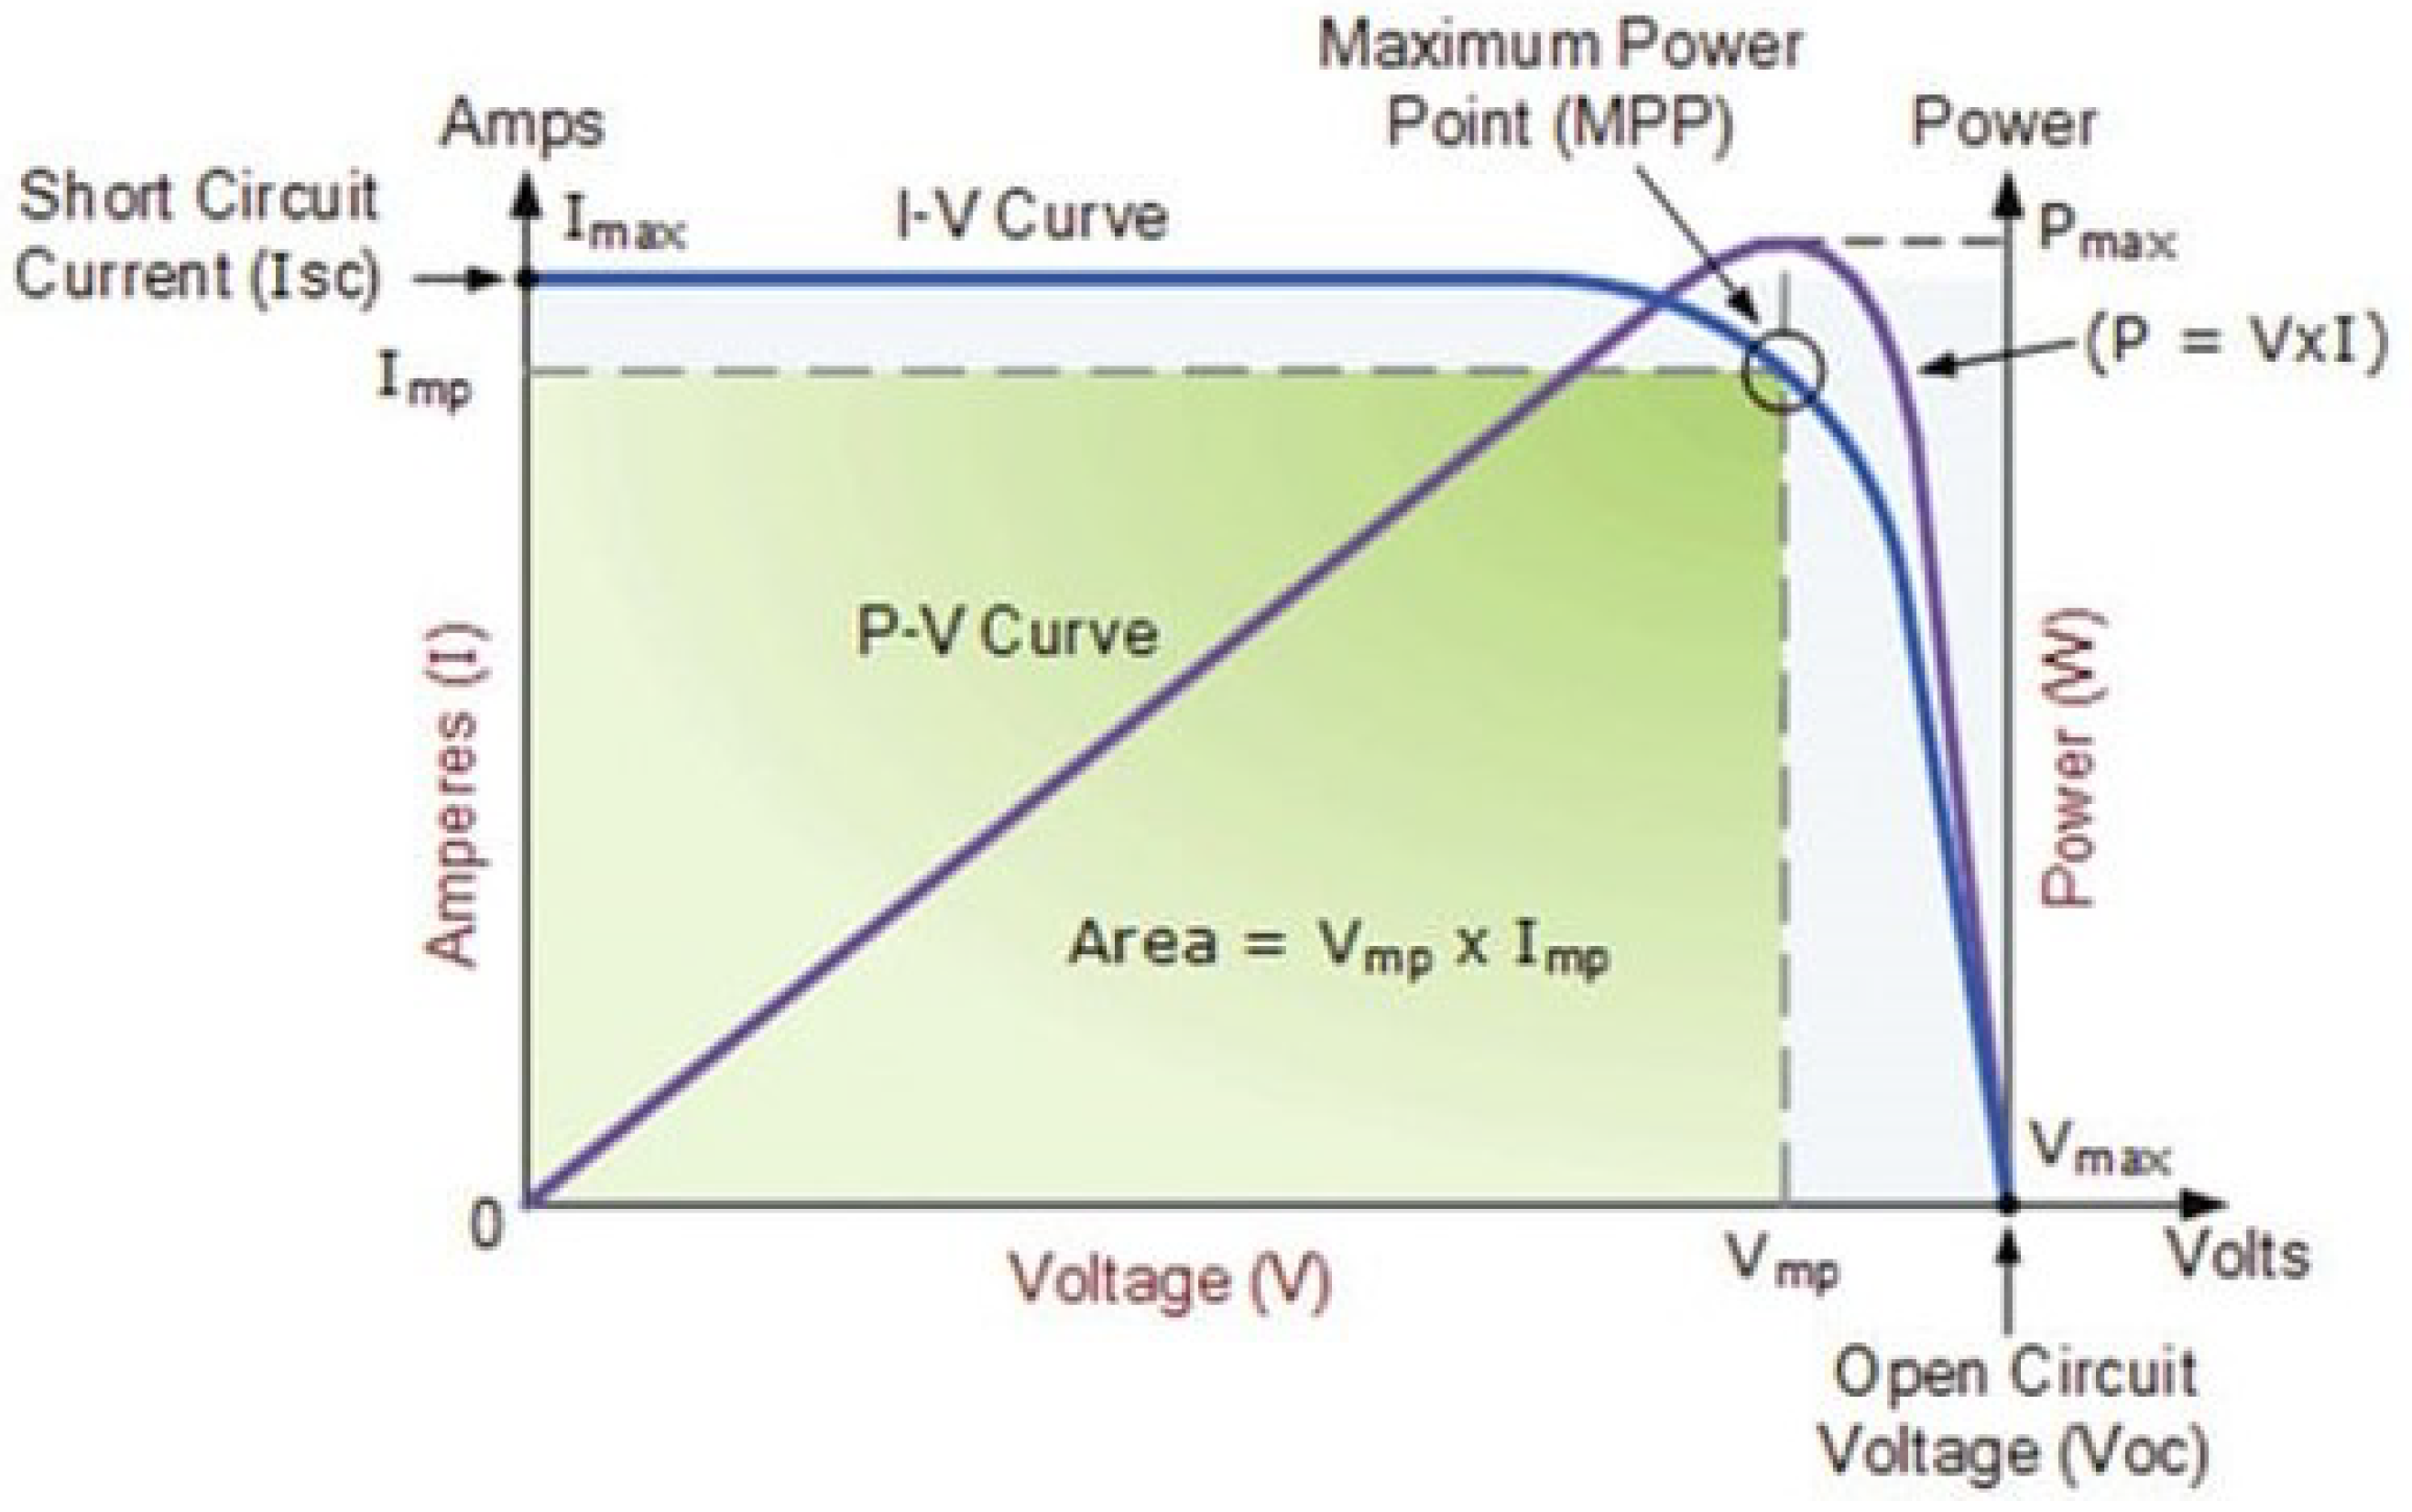
Figure 8.
Illustration of three series PVs with bias diodes under PSC.
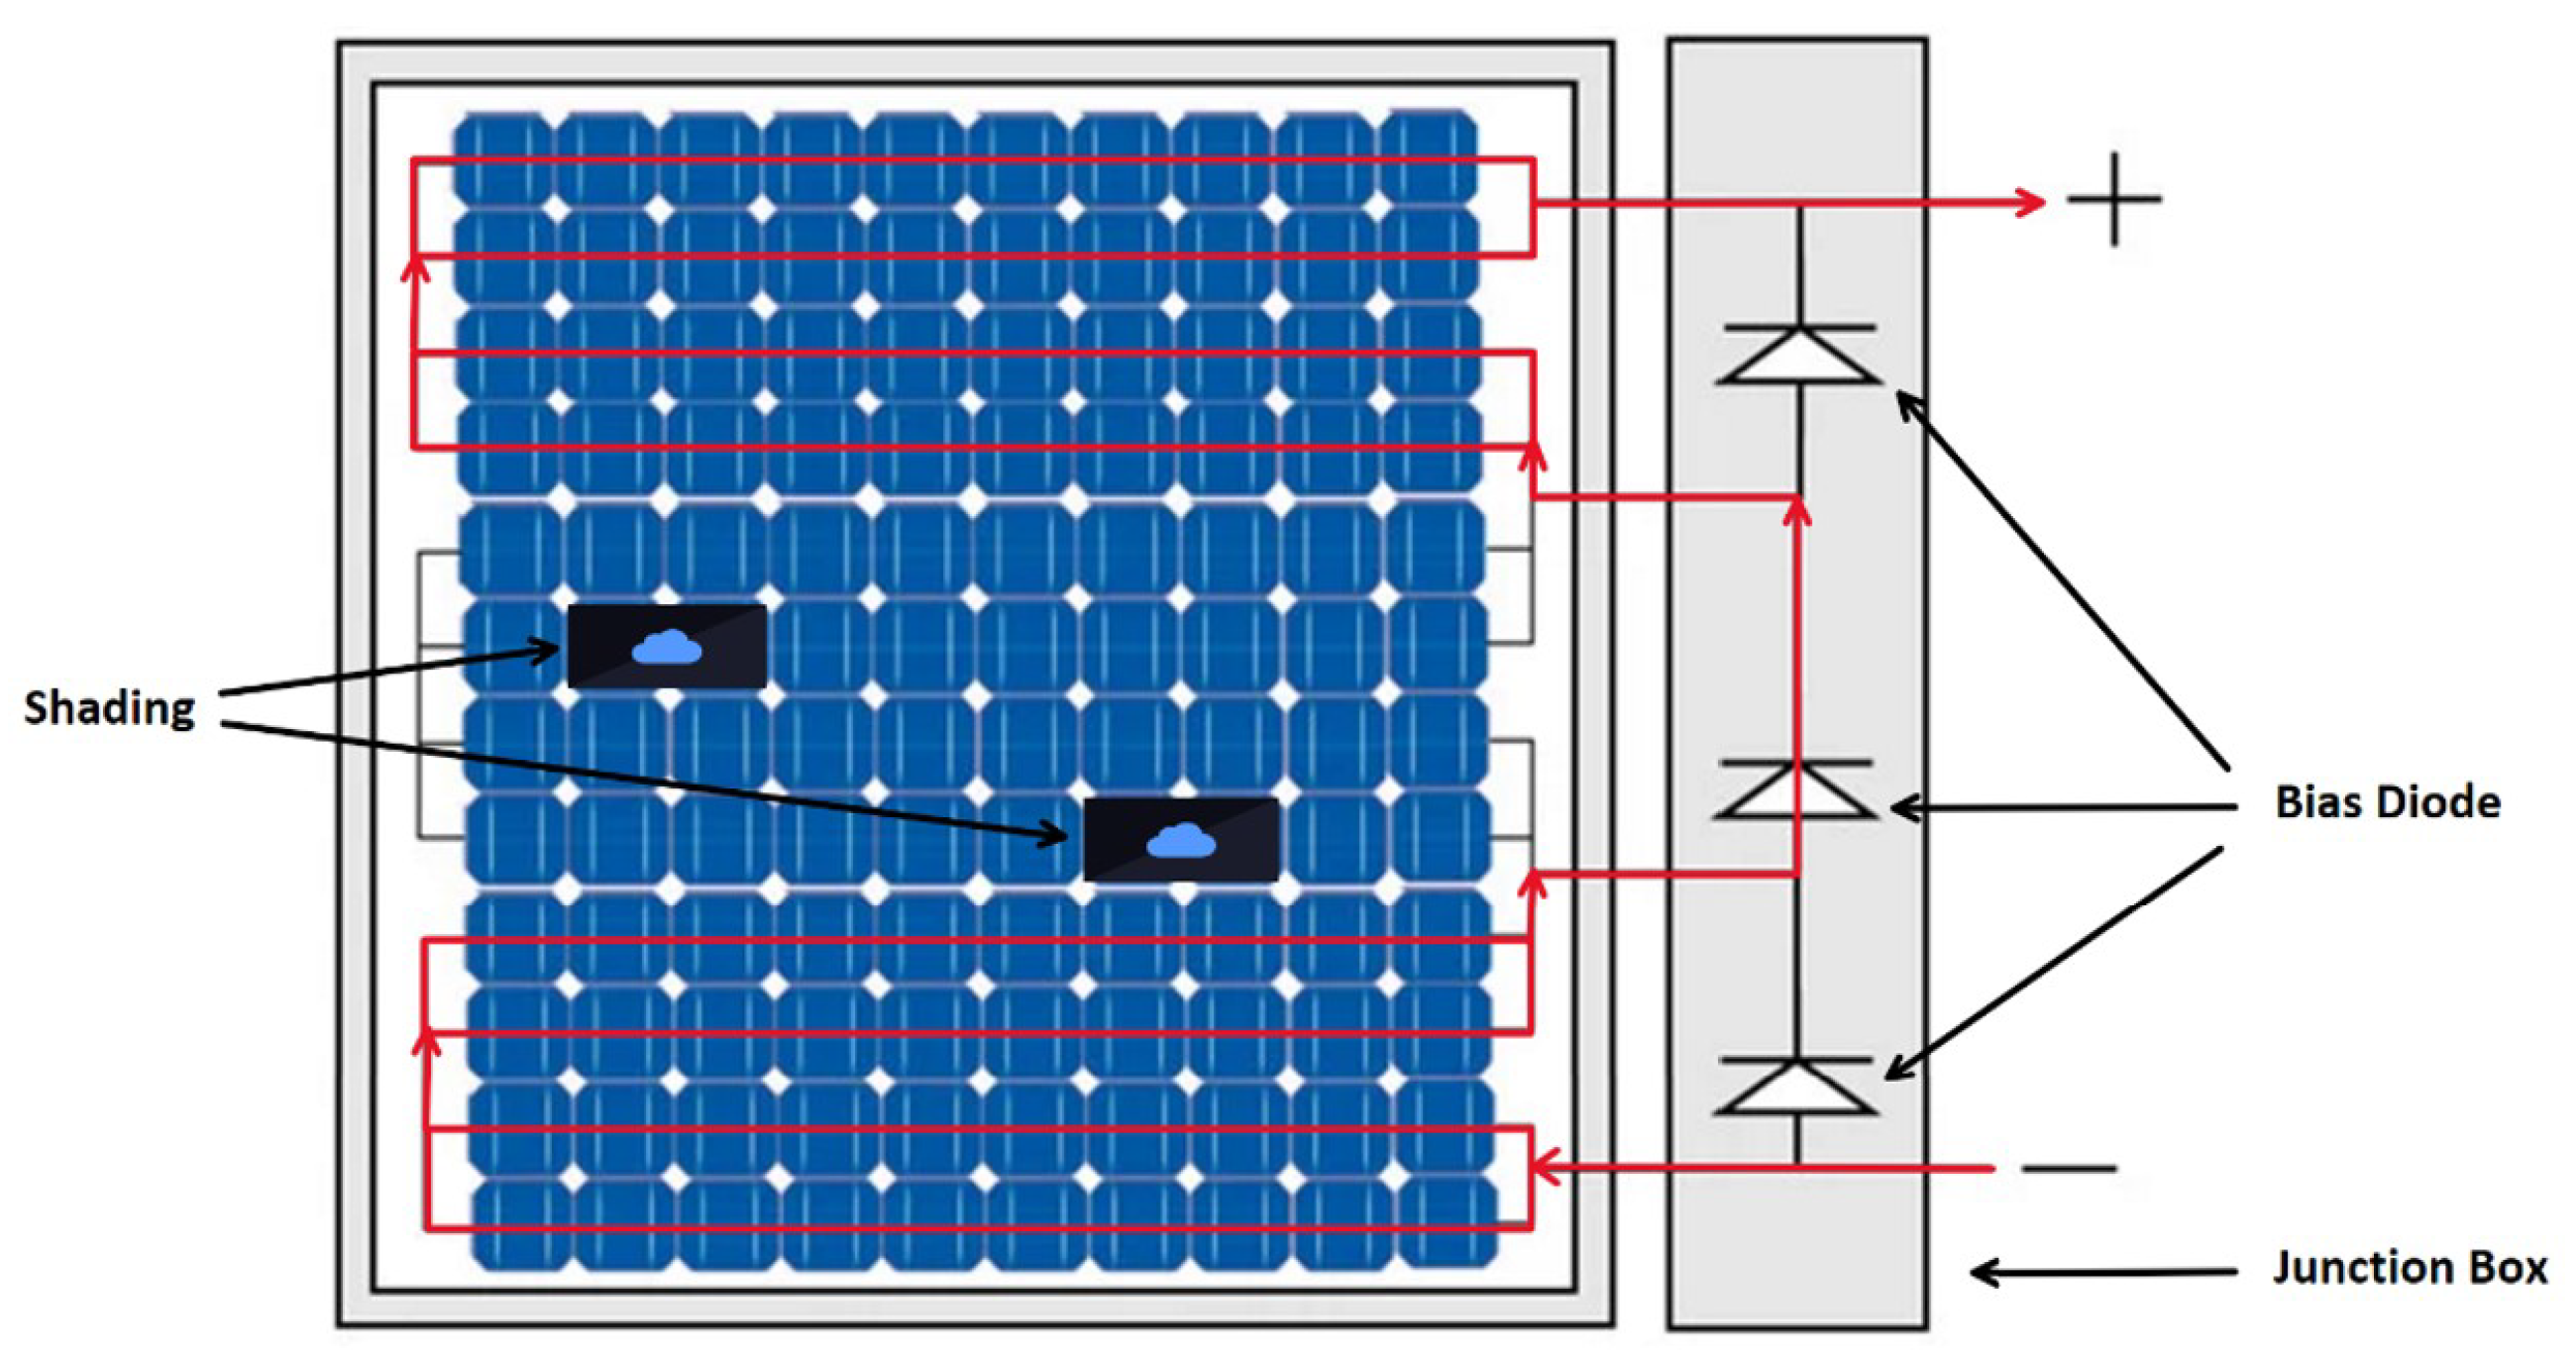
Figure 9.
P-V curve for PV under PSC with LMPP and GMPP showing the effect of bias diode.
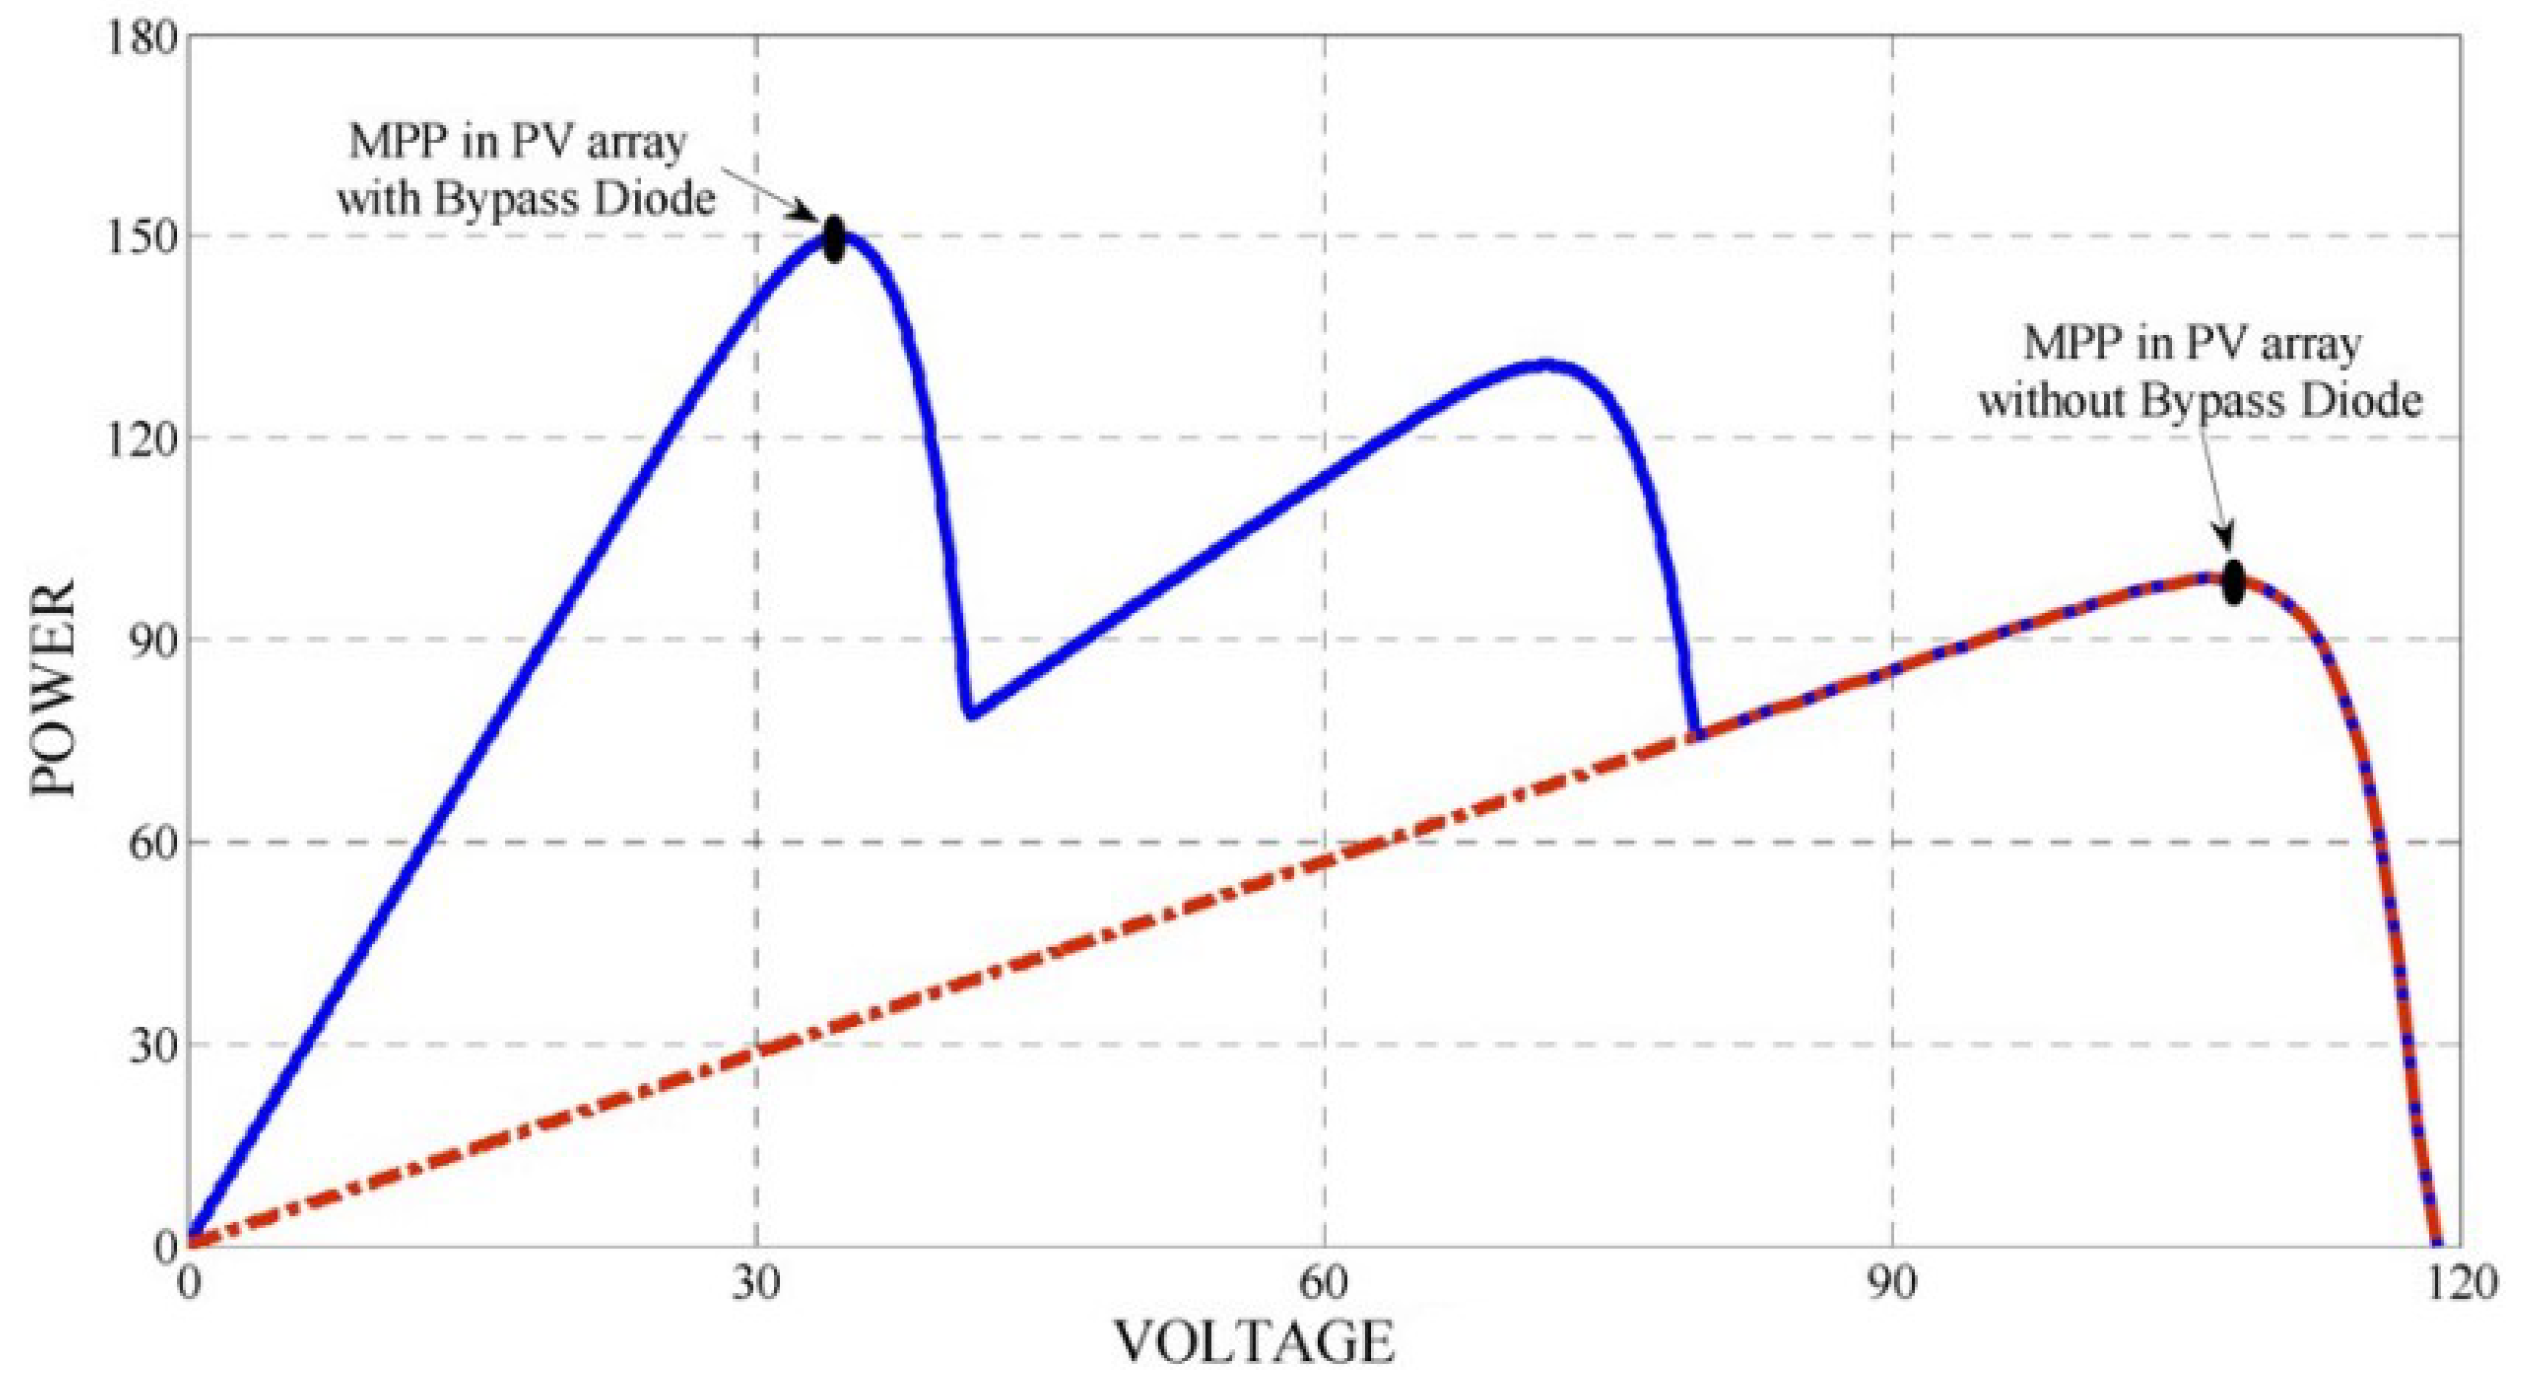
Figure 10.
Equivalent of three series connected PV with bias diodes.
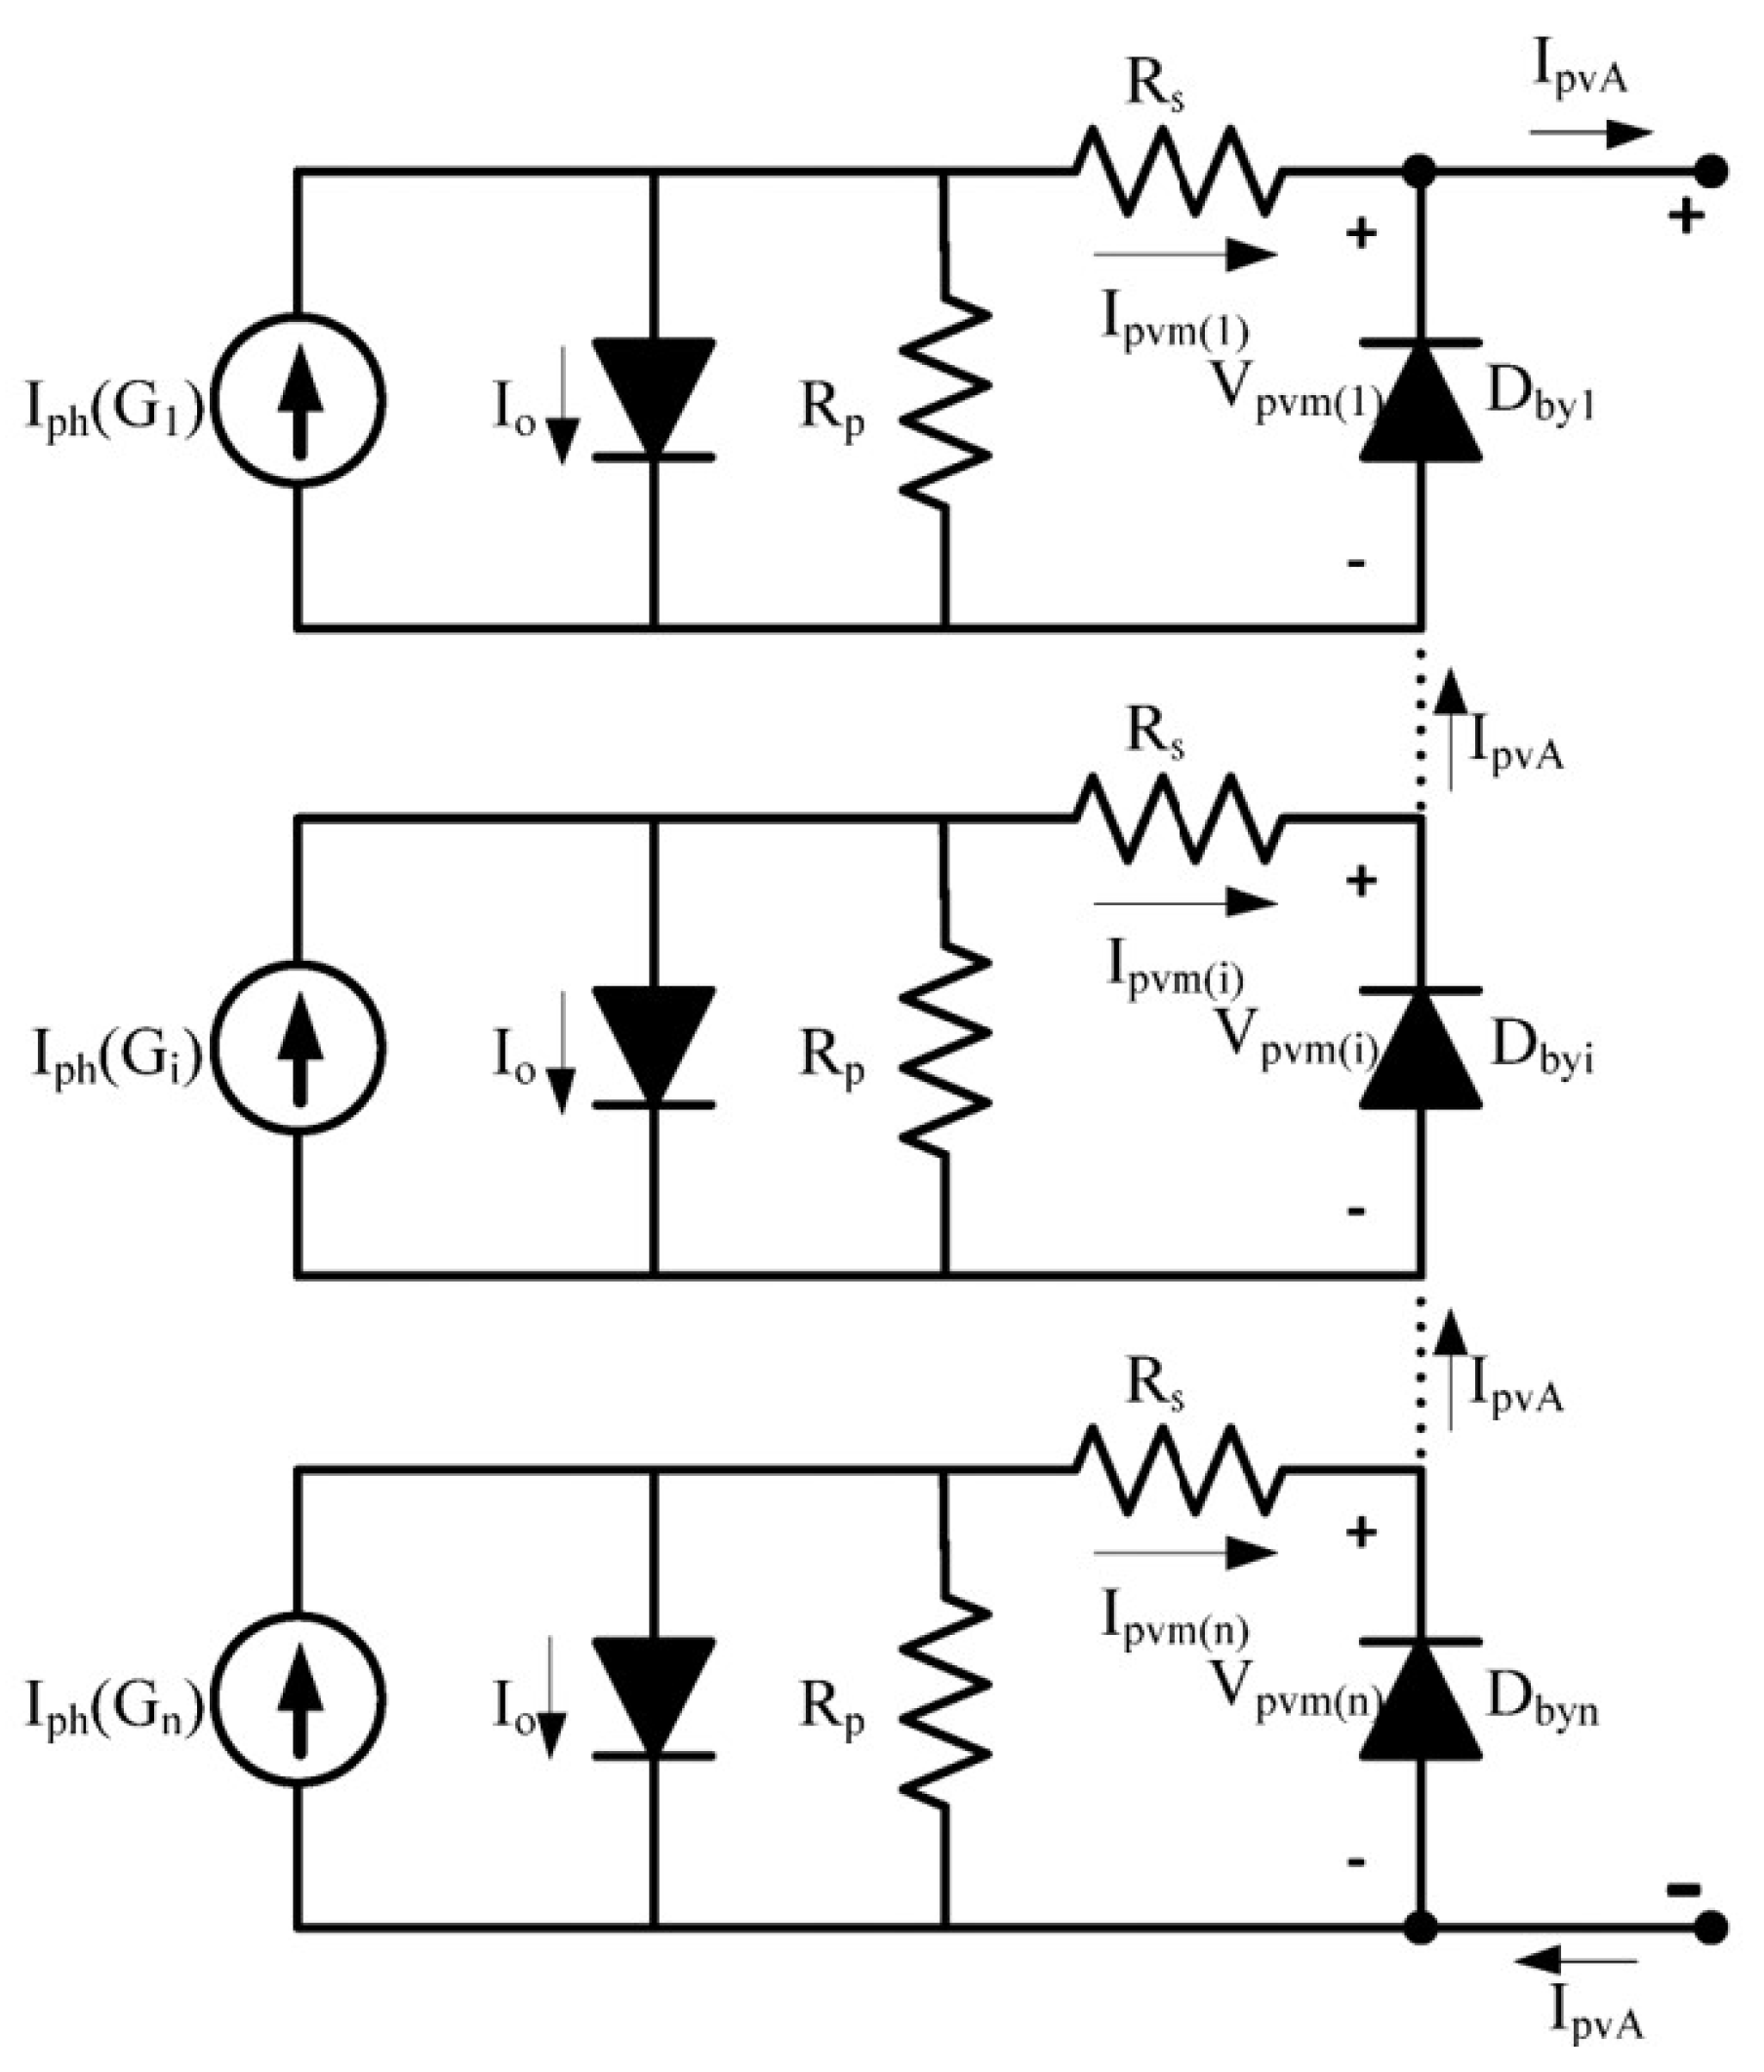
Figure 11.
Block diagram of the simulation model
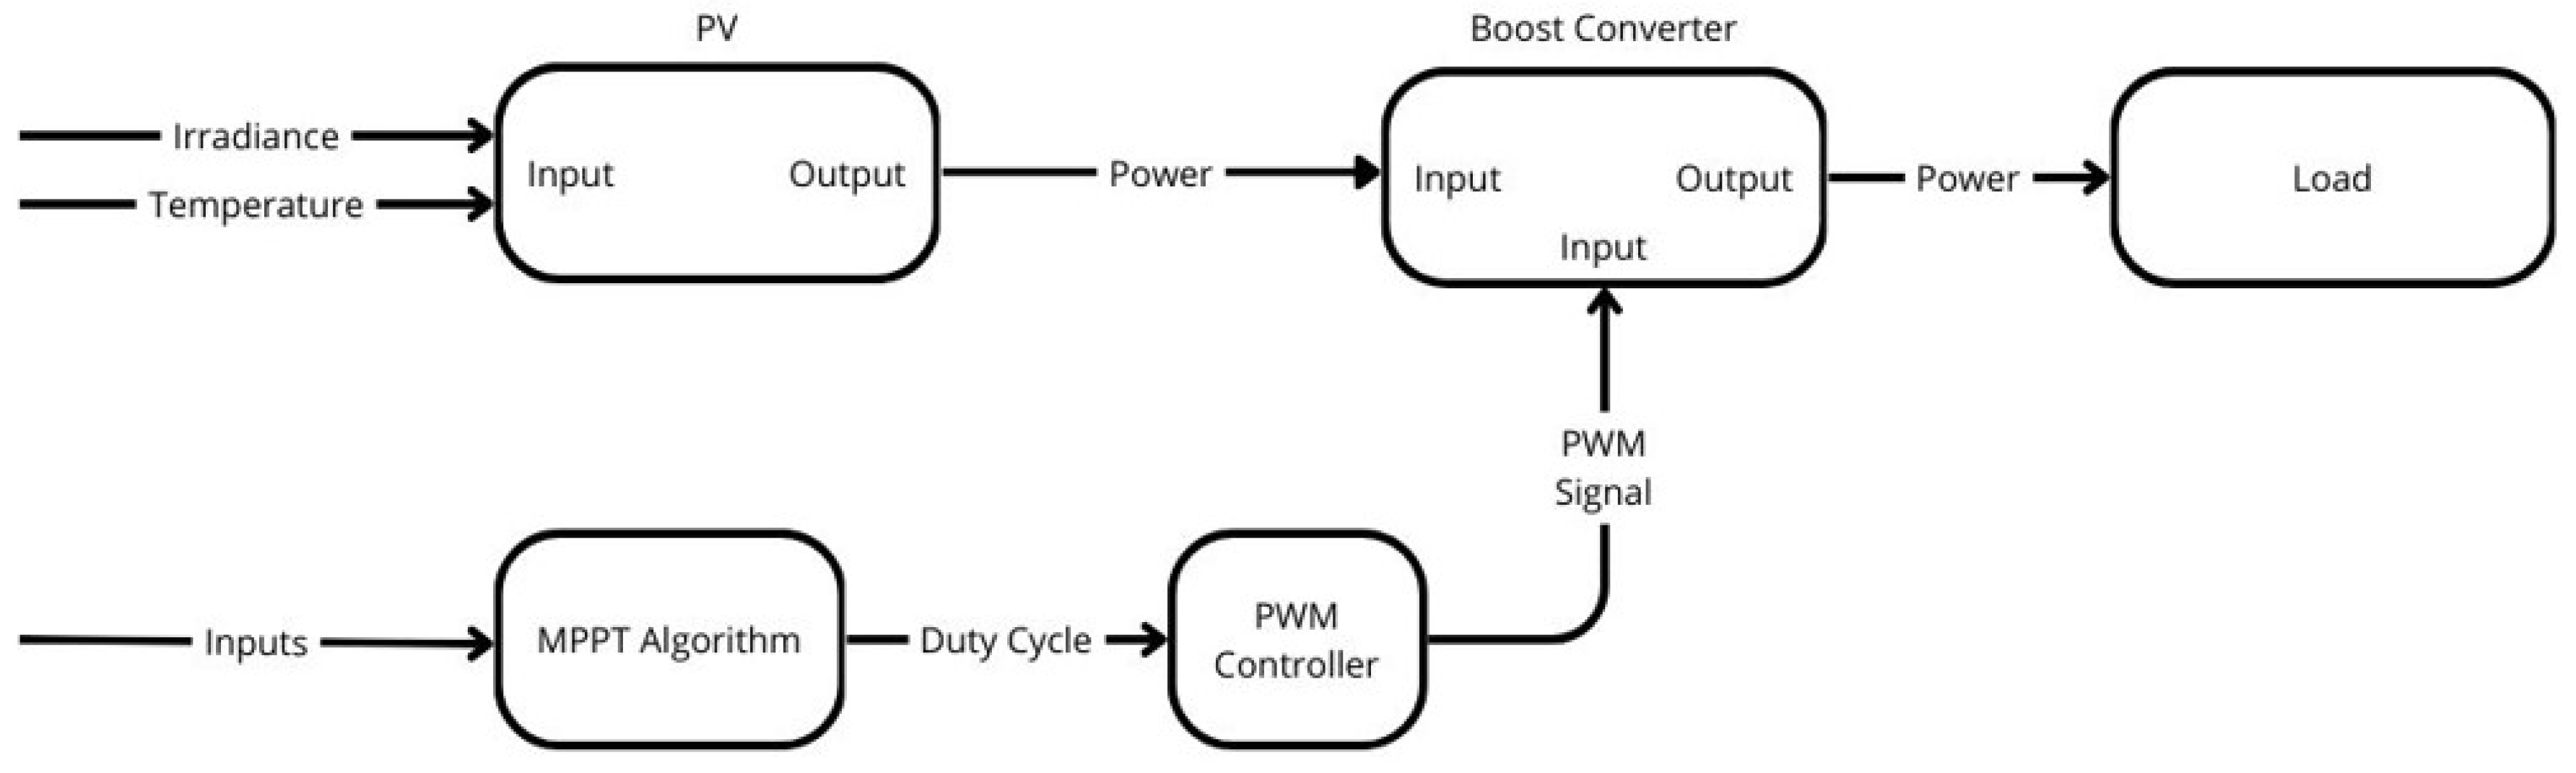
Figure 12.
Three Series Connected PVs with bias Diodes Connected to a Converter.
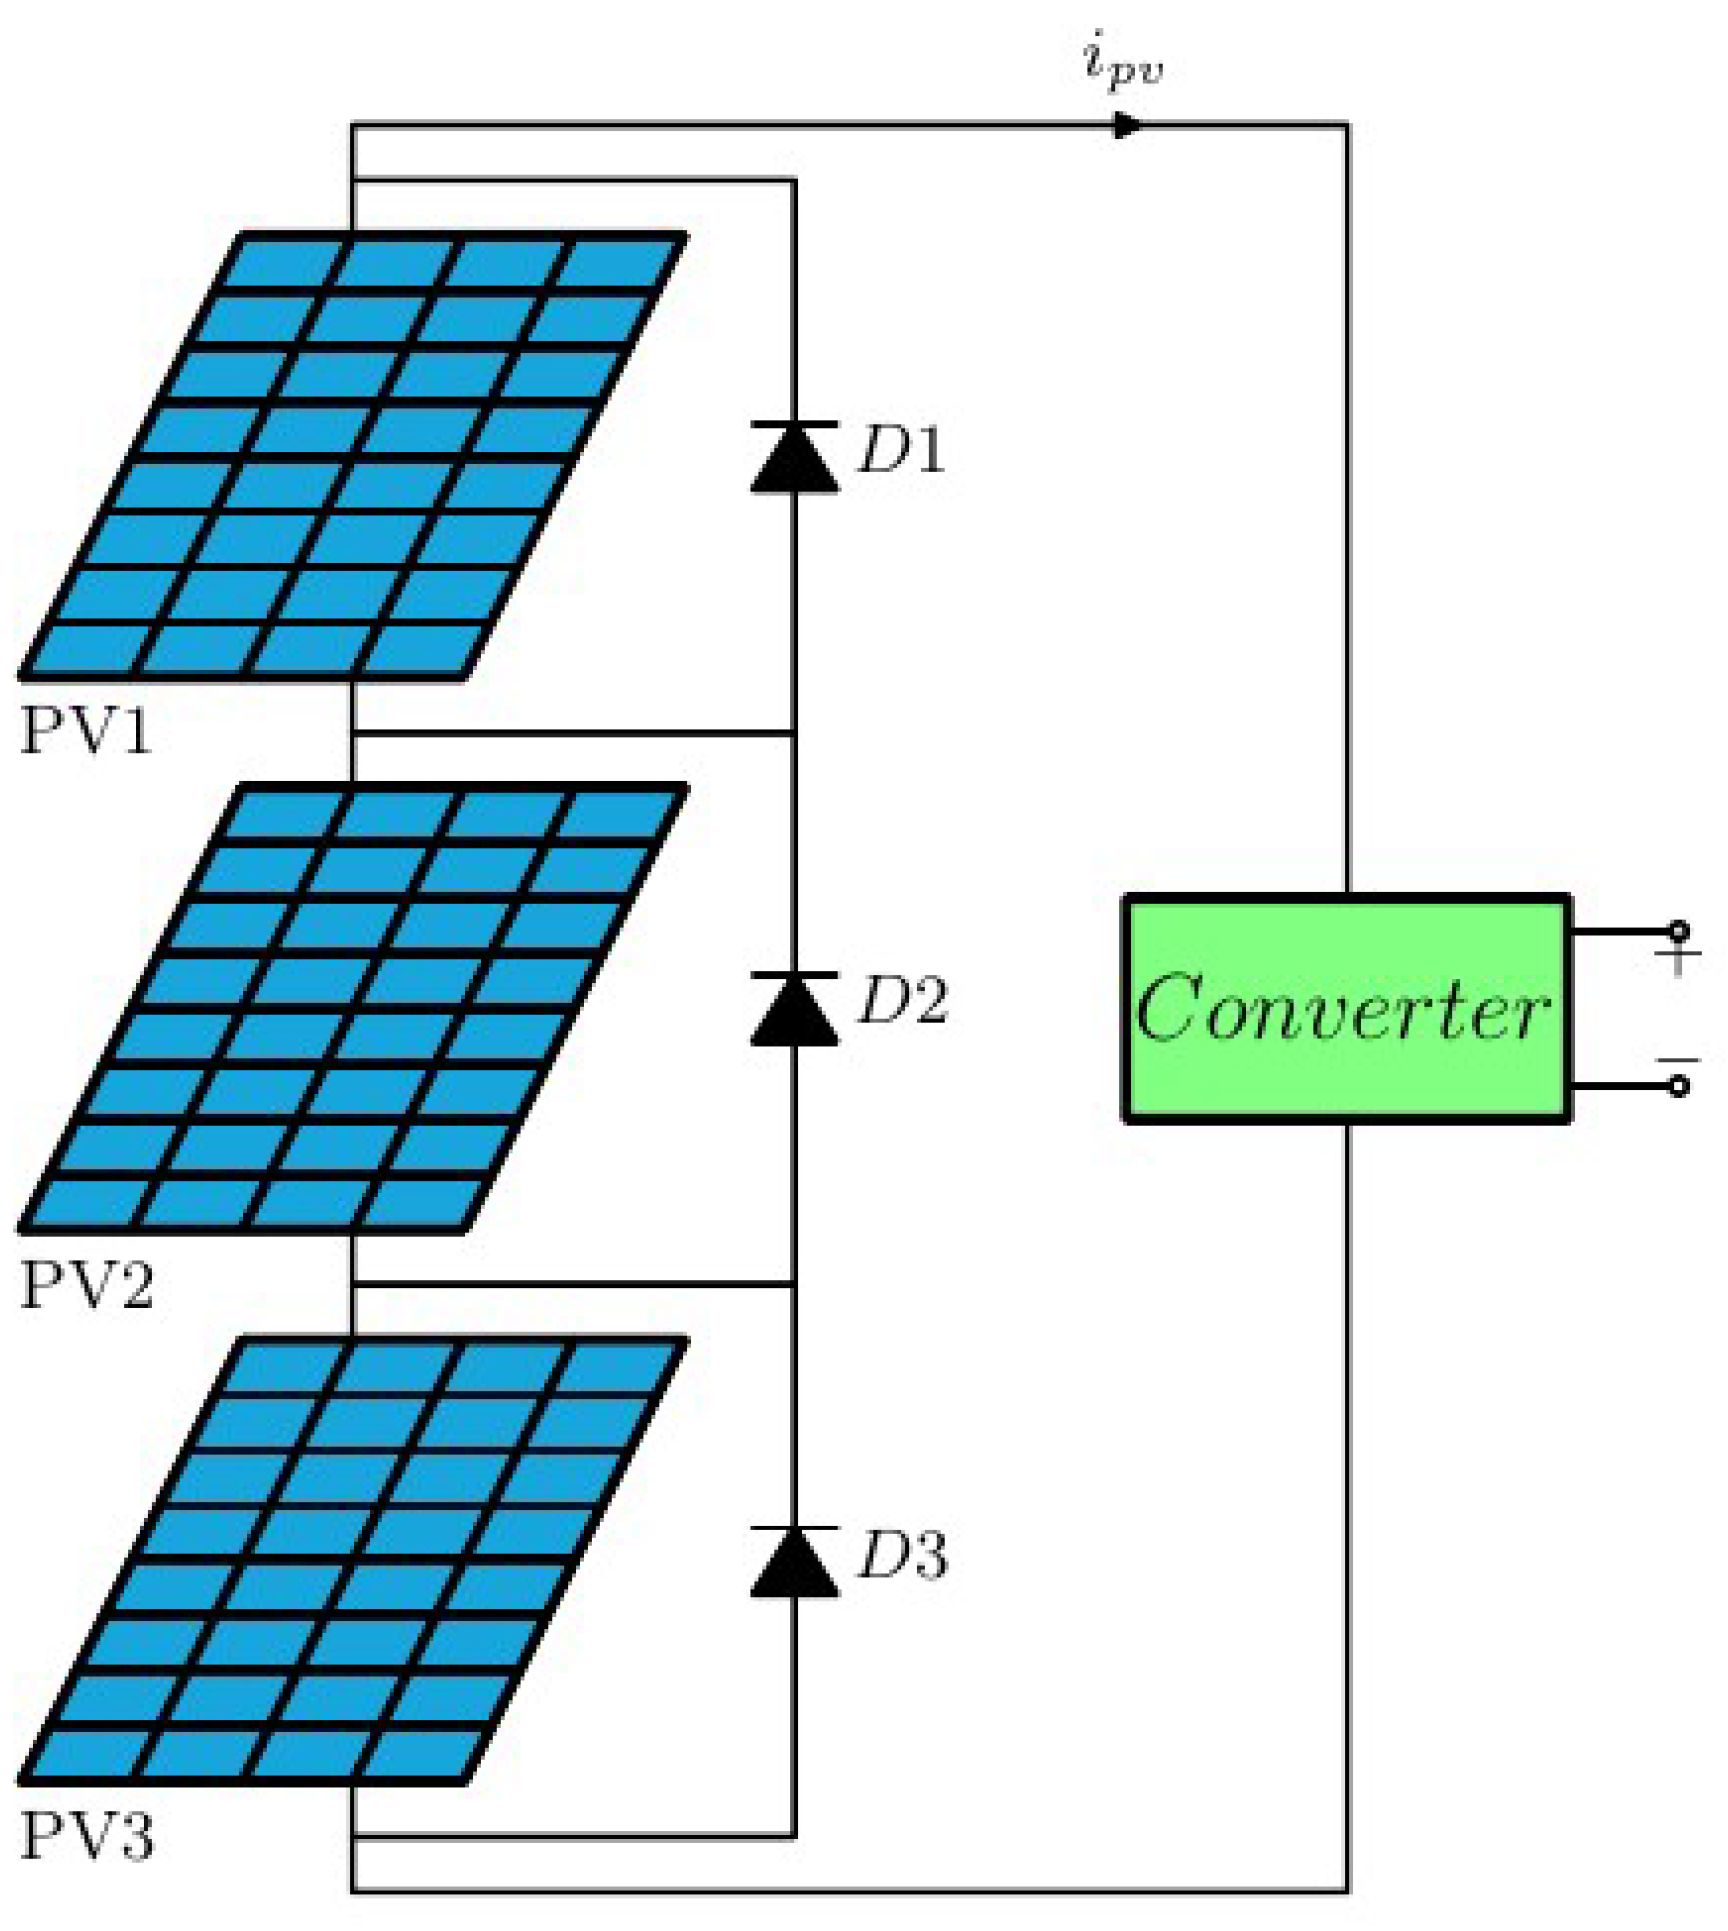
Figure 13.
Simulation model of the boost converter (a), and load (b).
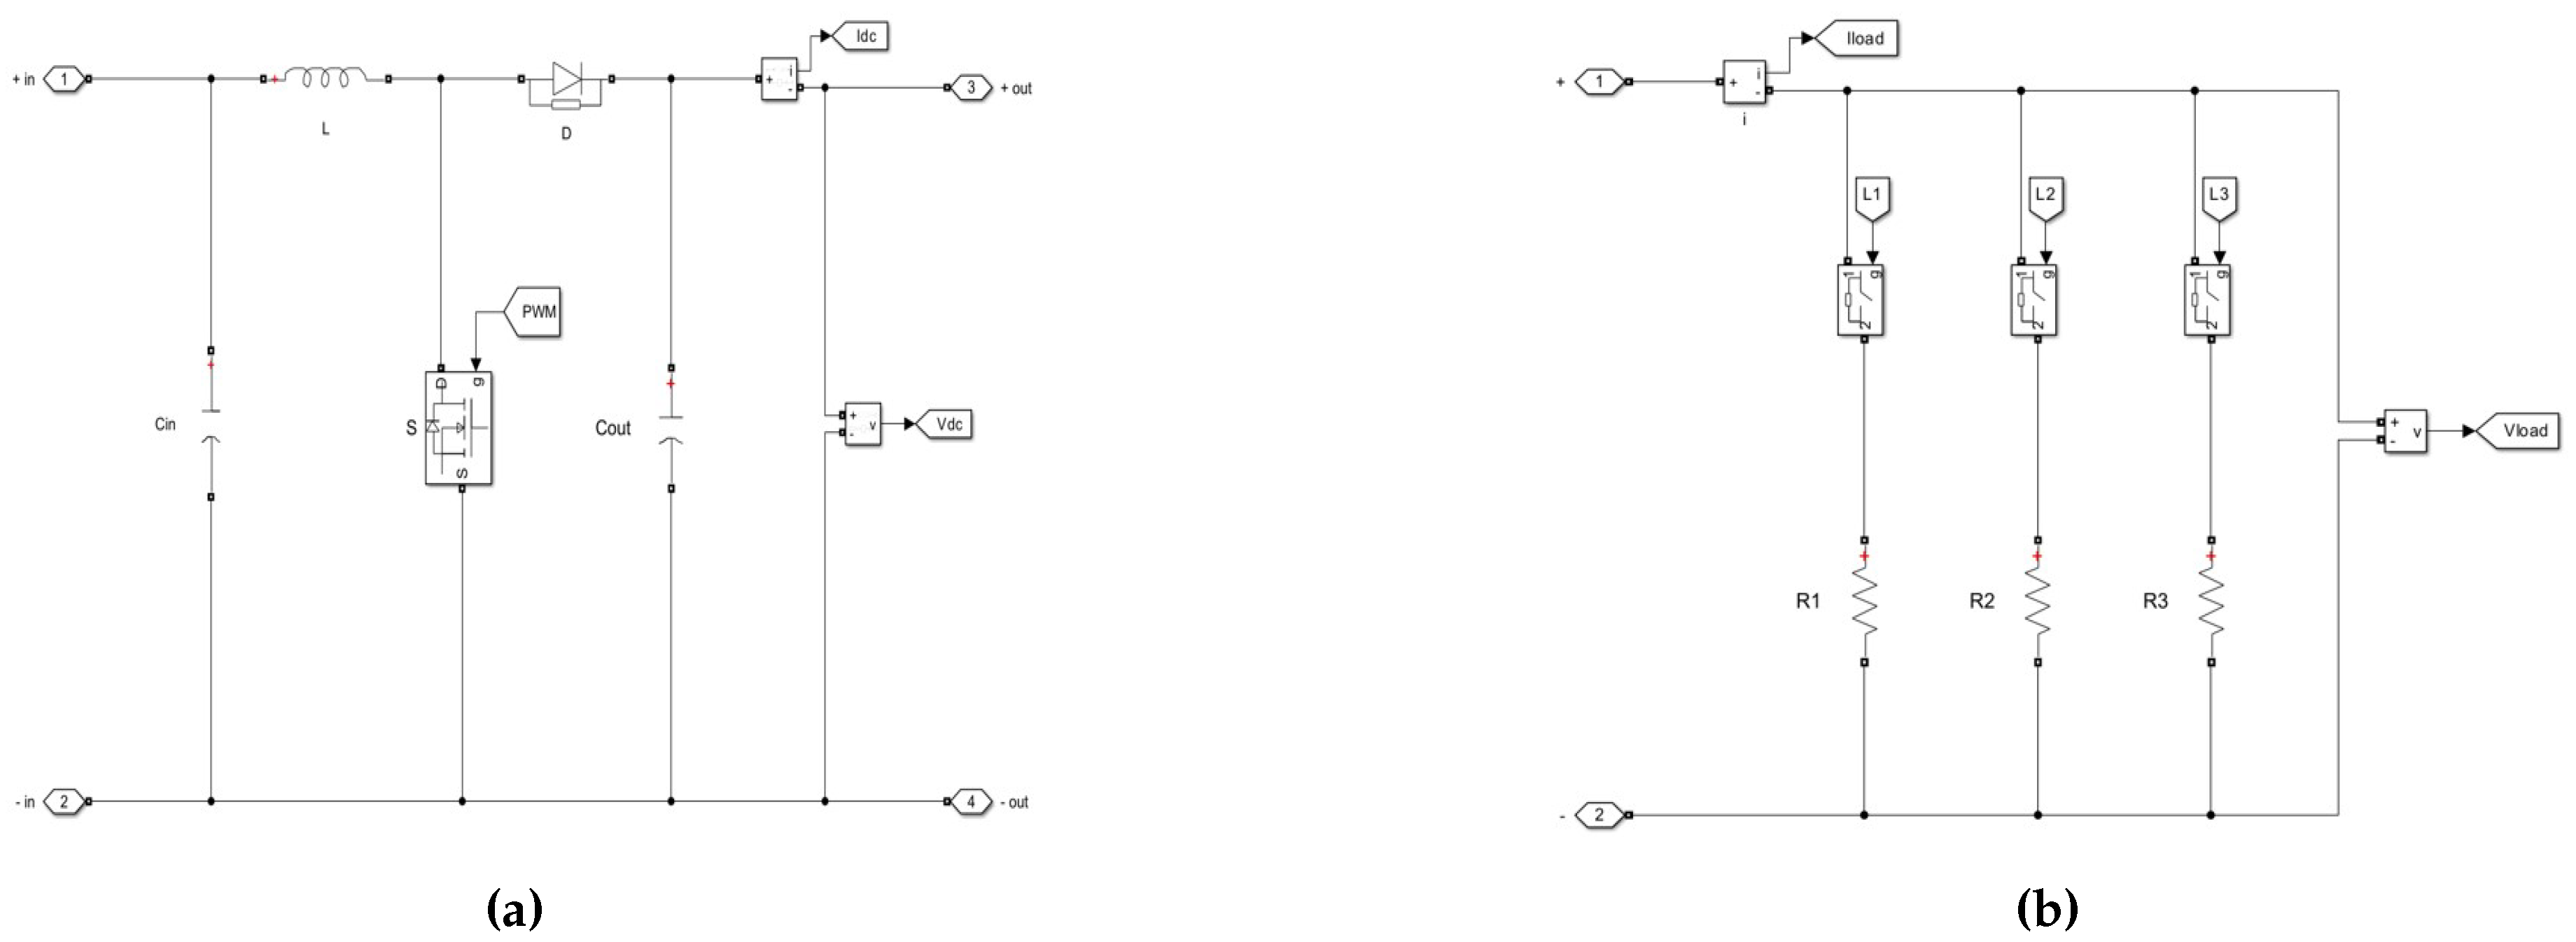
Figure 14.
Simulink Model used to obtain I-V and P-V characteristics to locate MPP.
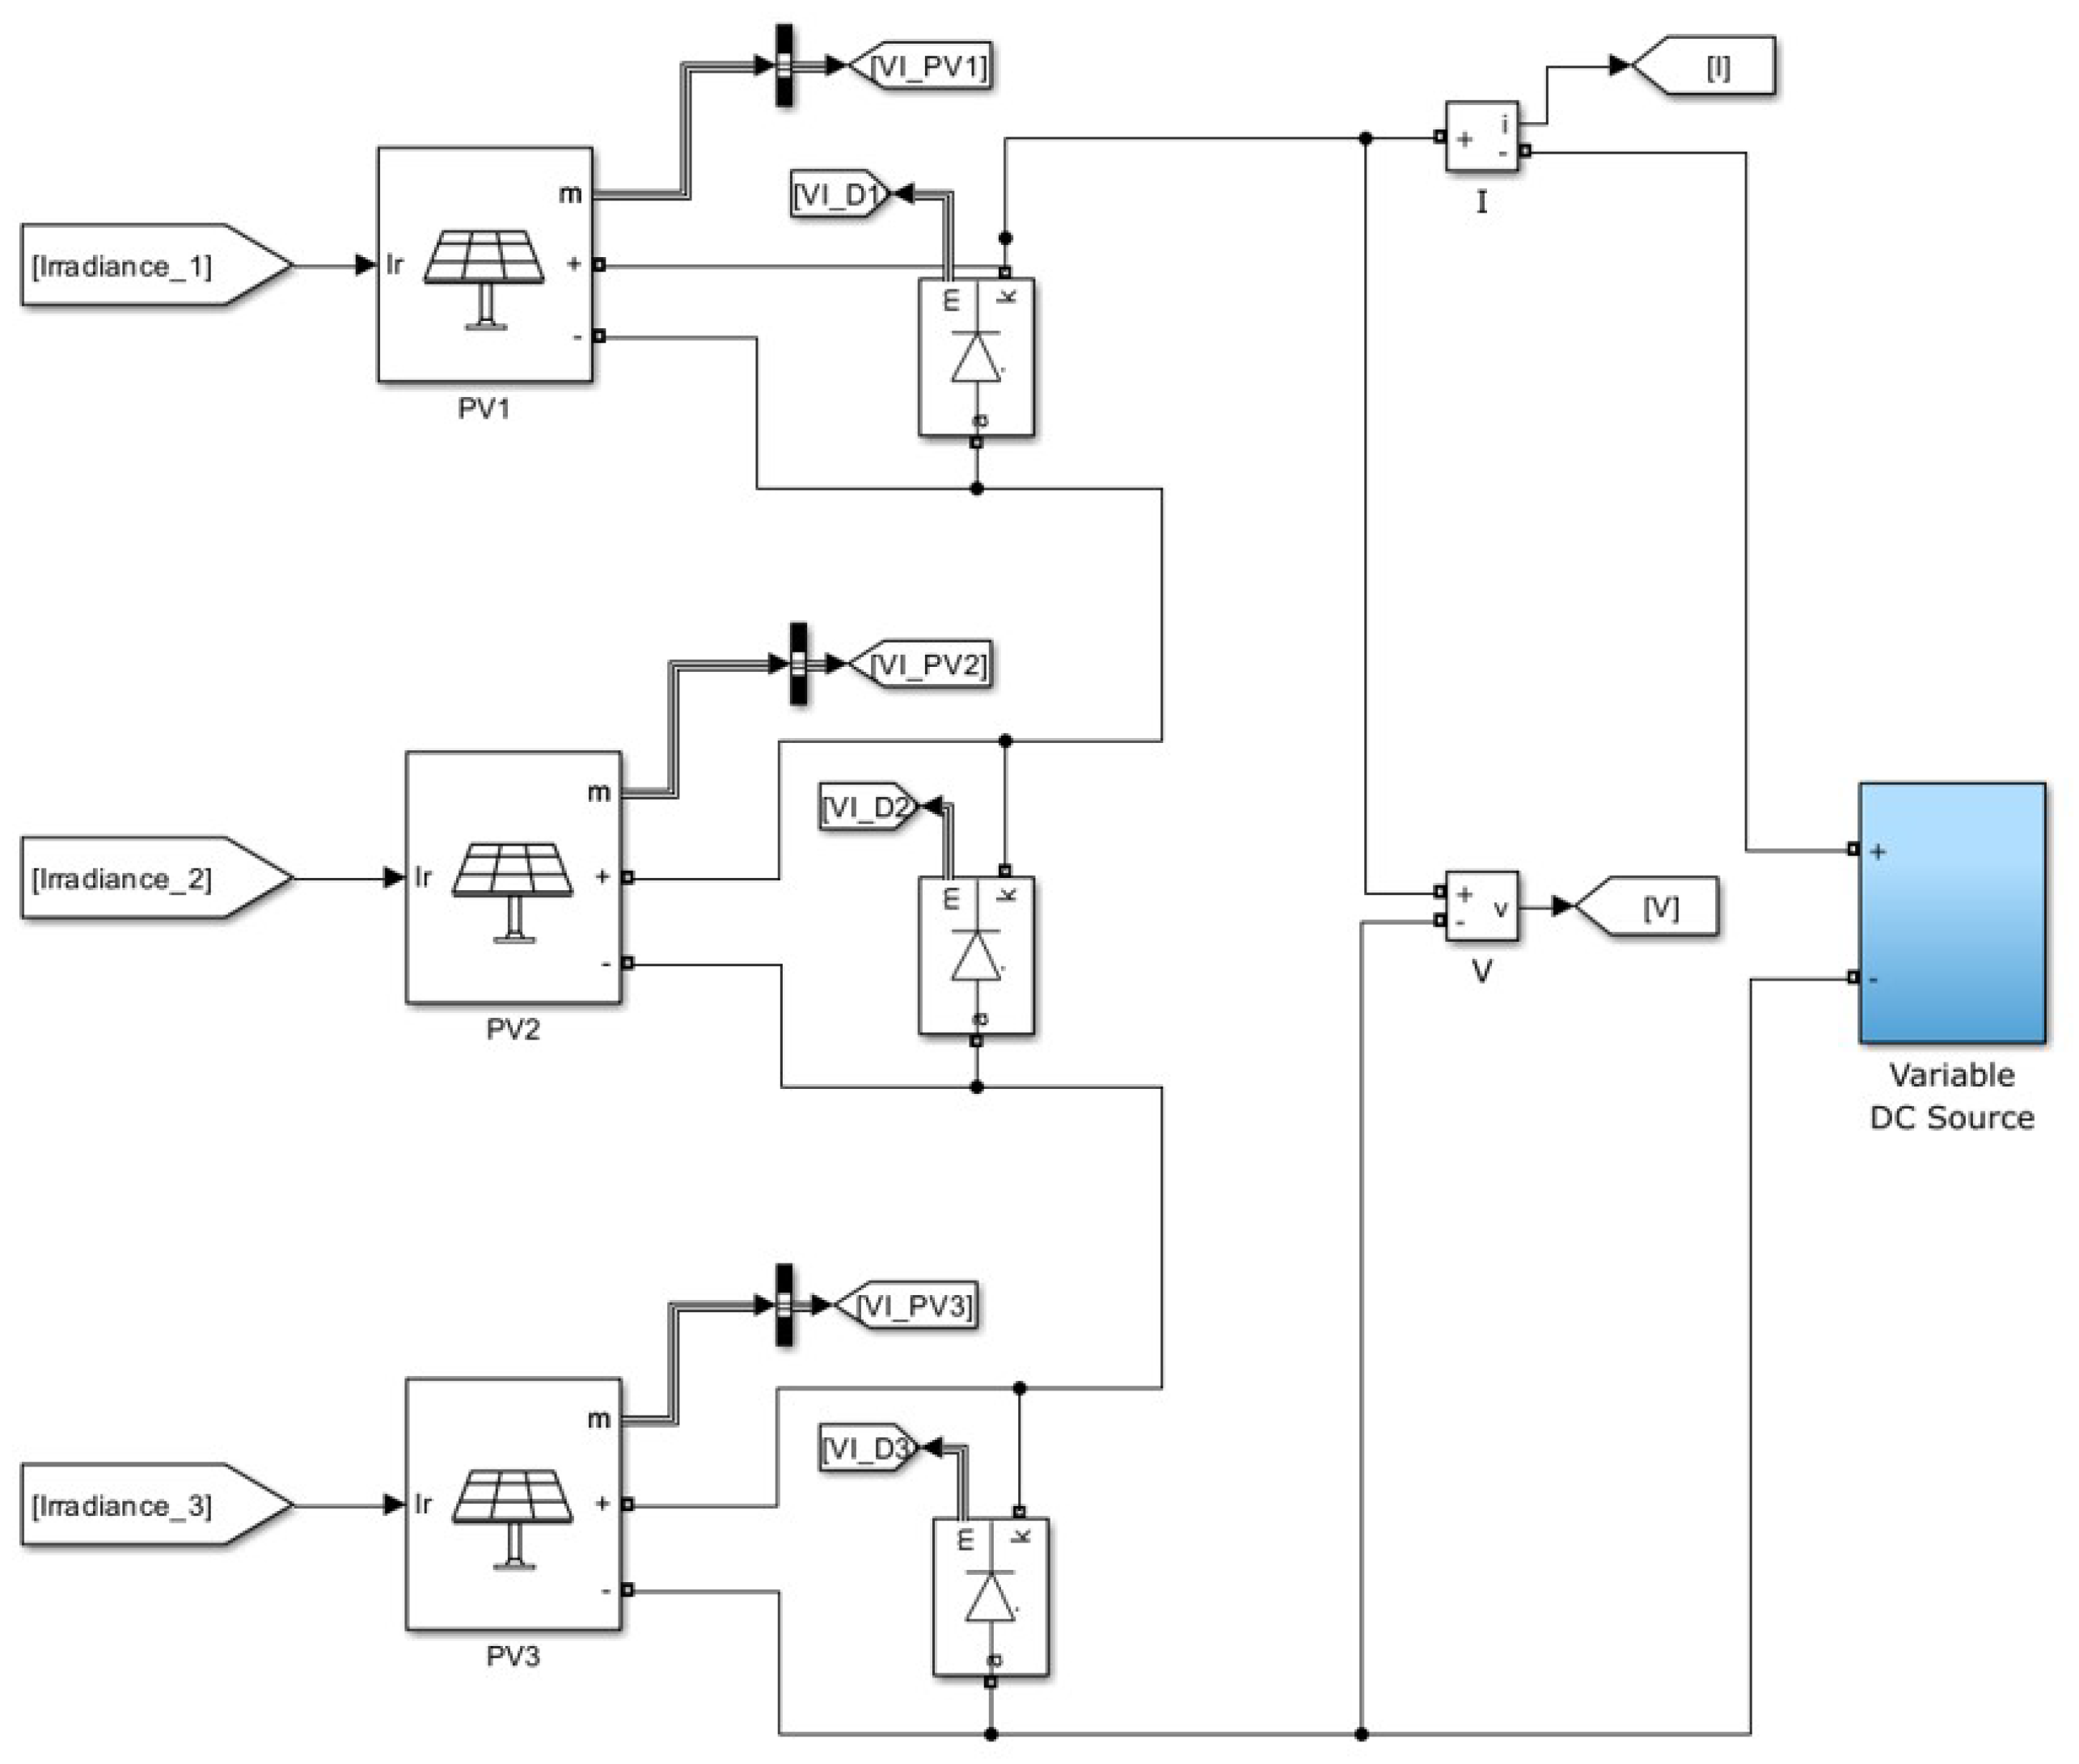
Figure 15.
I-V and P-V characteristics for the PV system illustrating the MPP under full solar irradiance.
Figure 15.
I-V and P-V characteristics for the PV system illustrating the MPP under full solar irradiance.
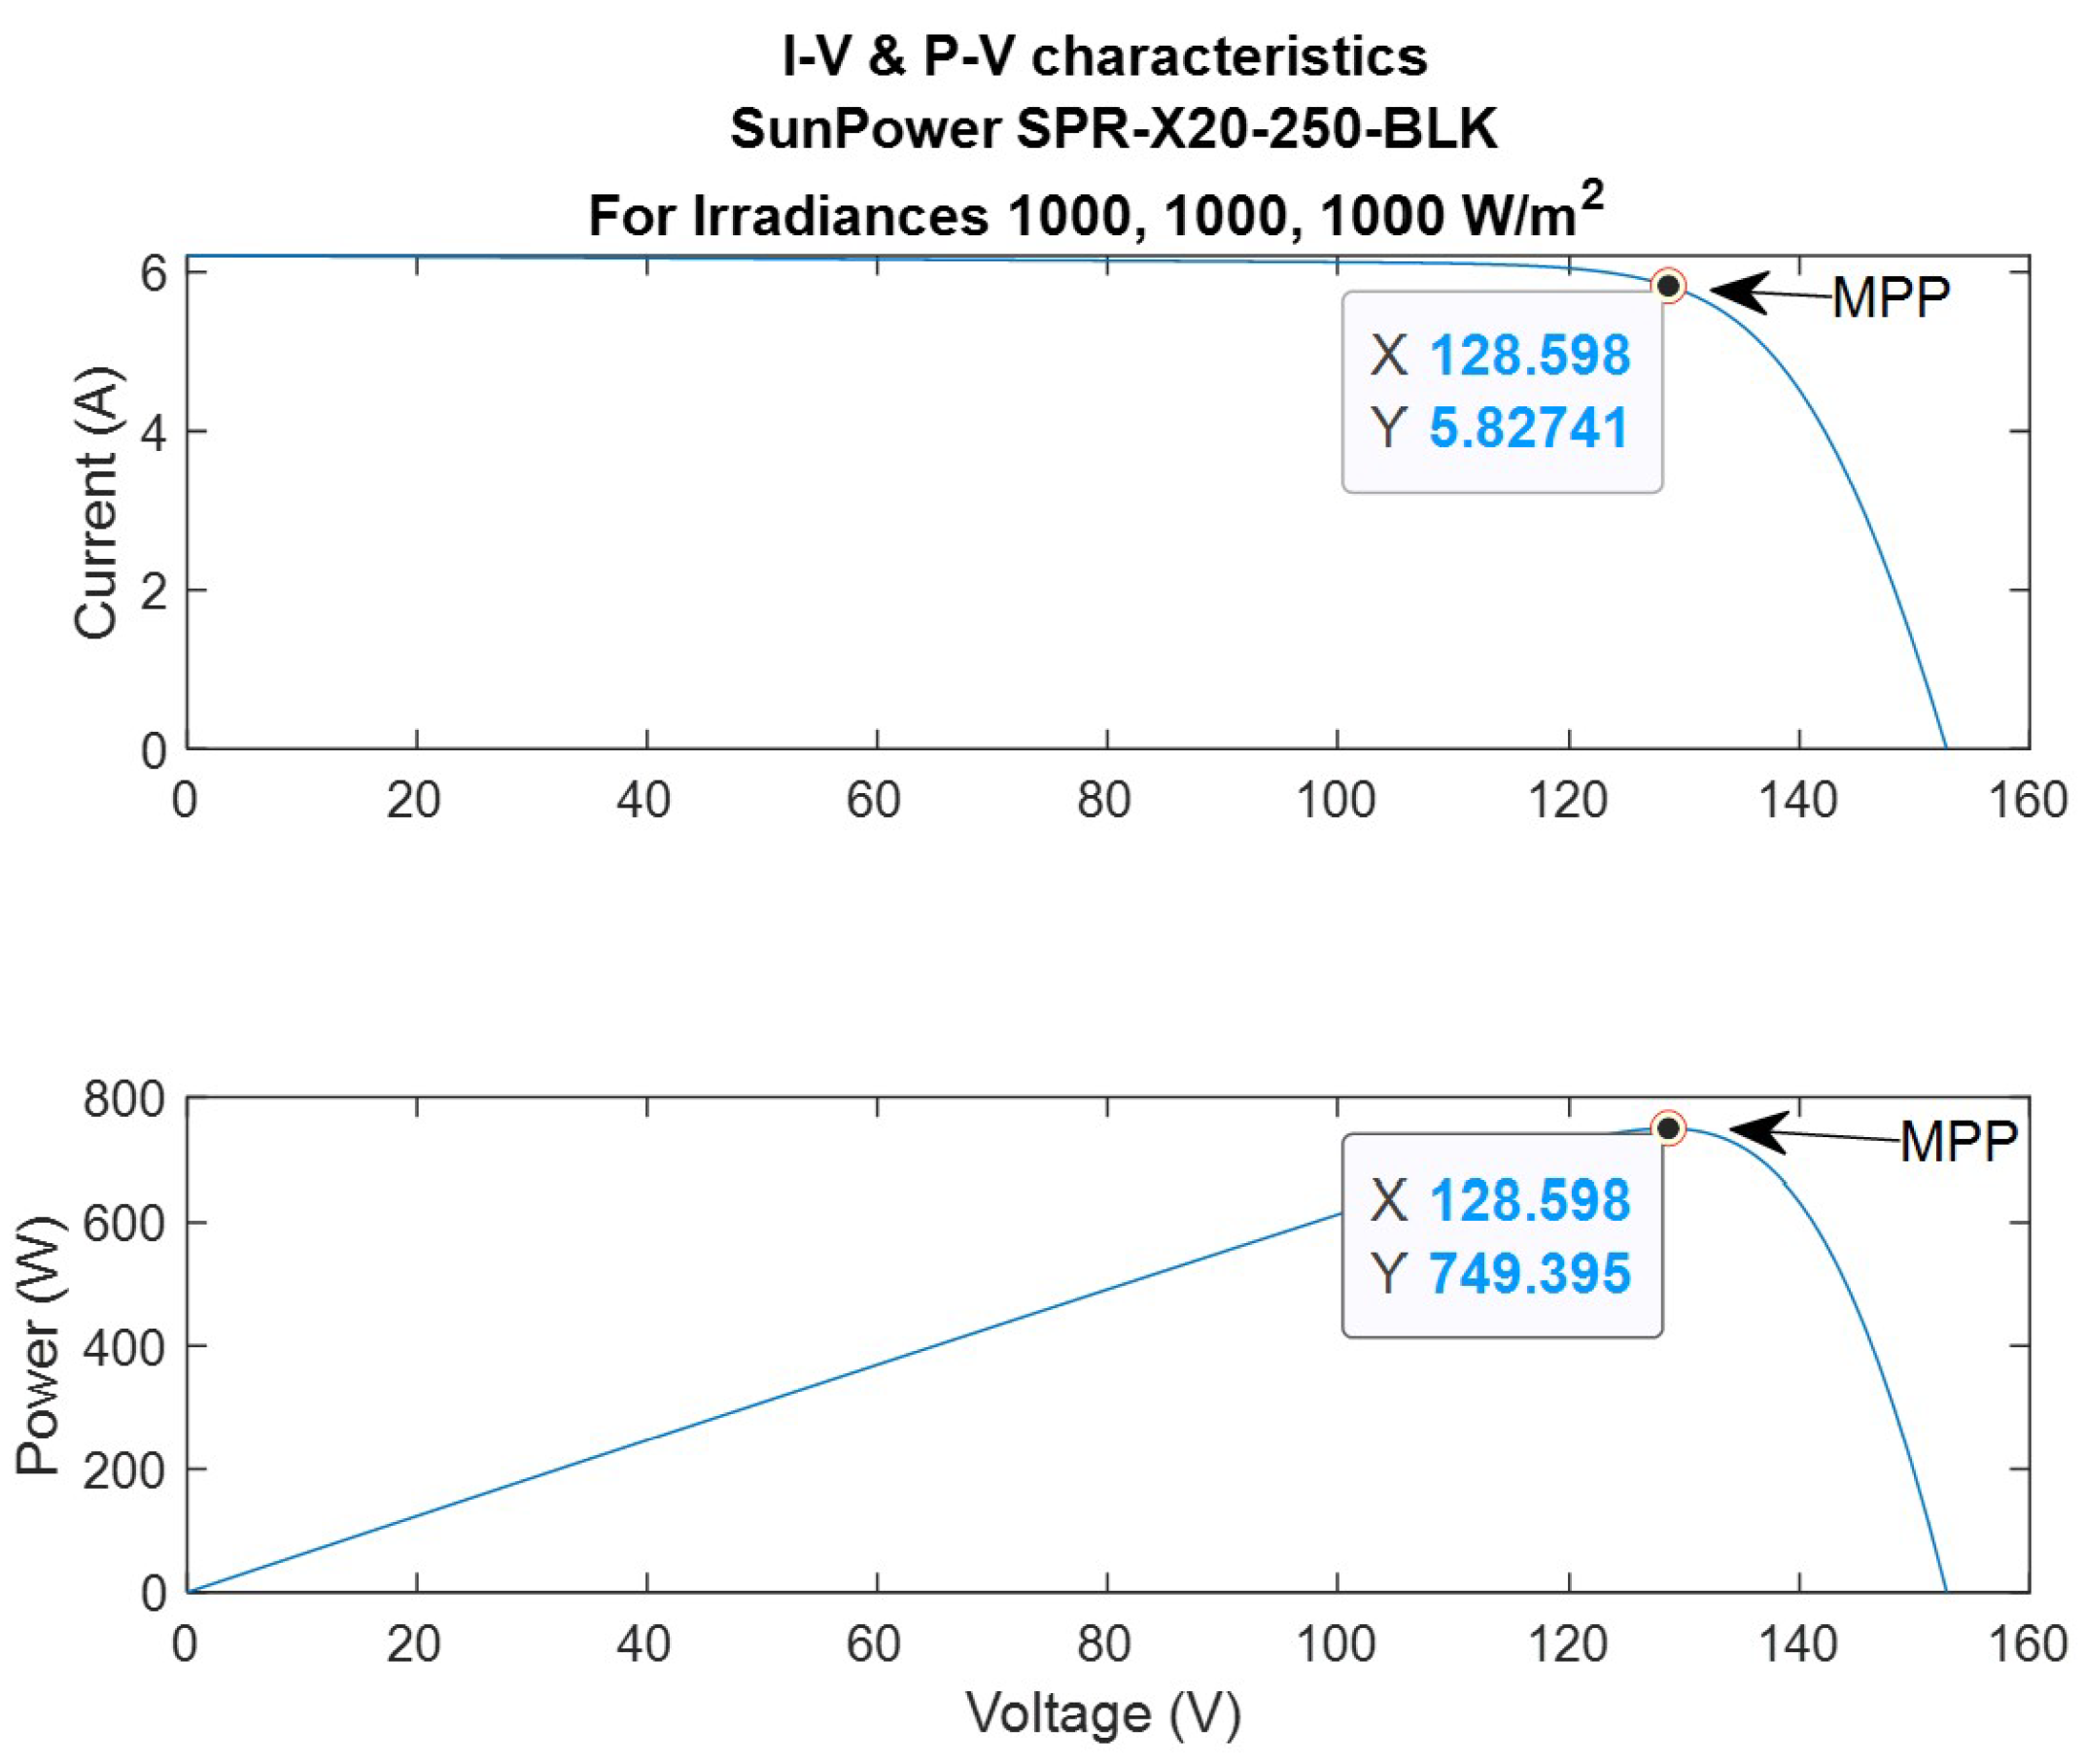
Figure 16.
I-V- and P-V characteristics illustrating the GMPP for the PV system under shading scenario 2 (a), 3 (b), 4 (c), and 5 (d).
Figure 16.
I-V- and P-V characteristics illustrating the GMPP for the PV system under shading scenario 2 (a), 3 (b), 4 (c), and 5 (d).
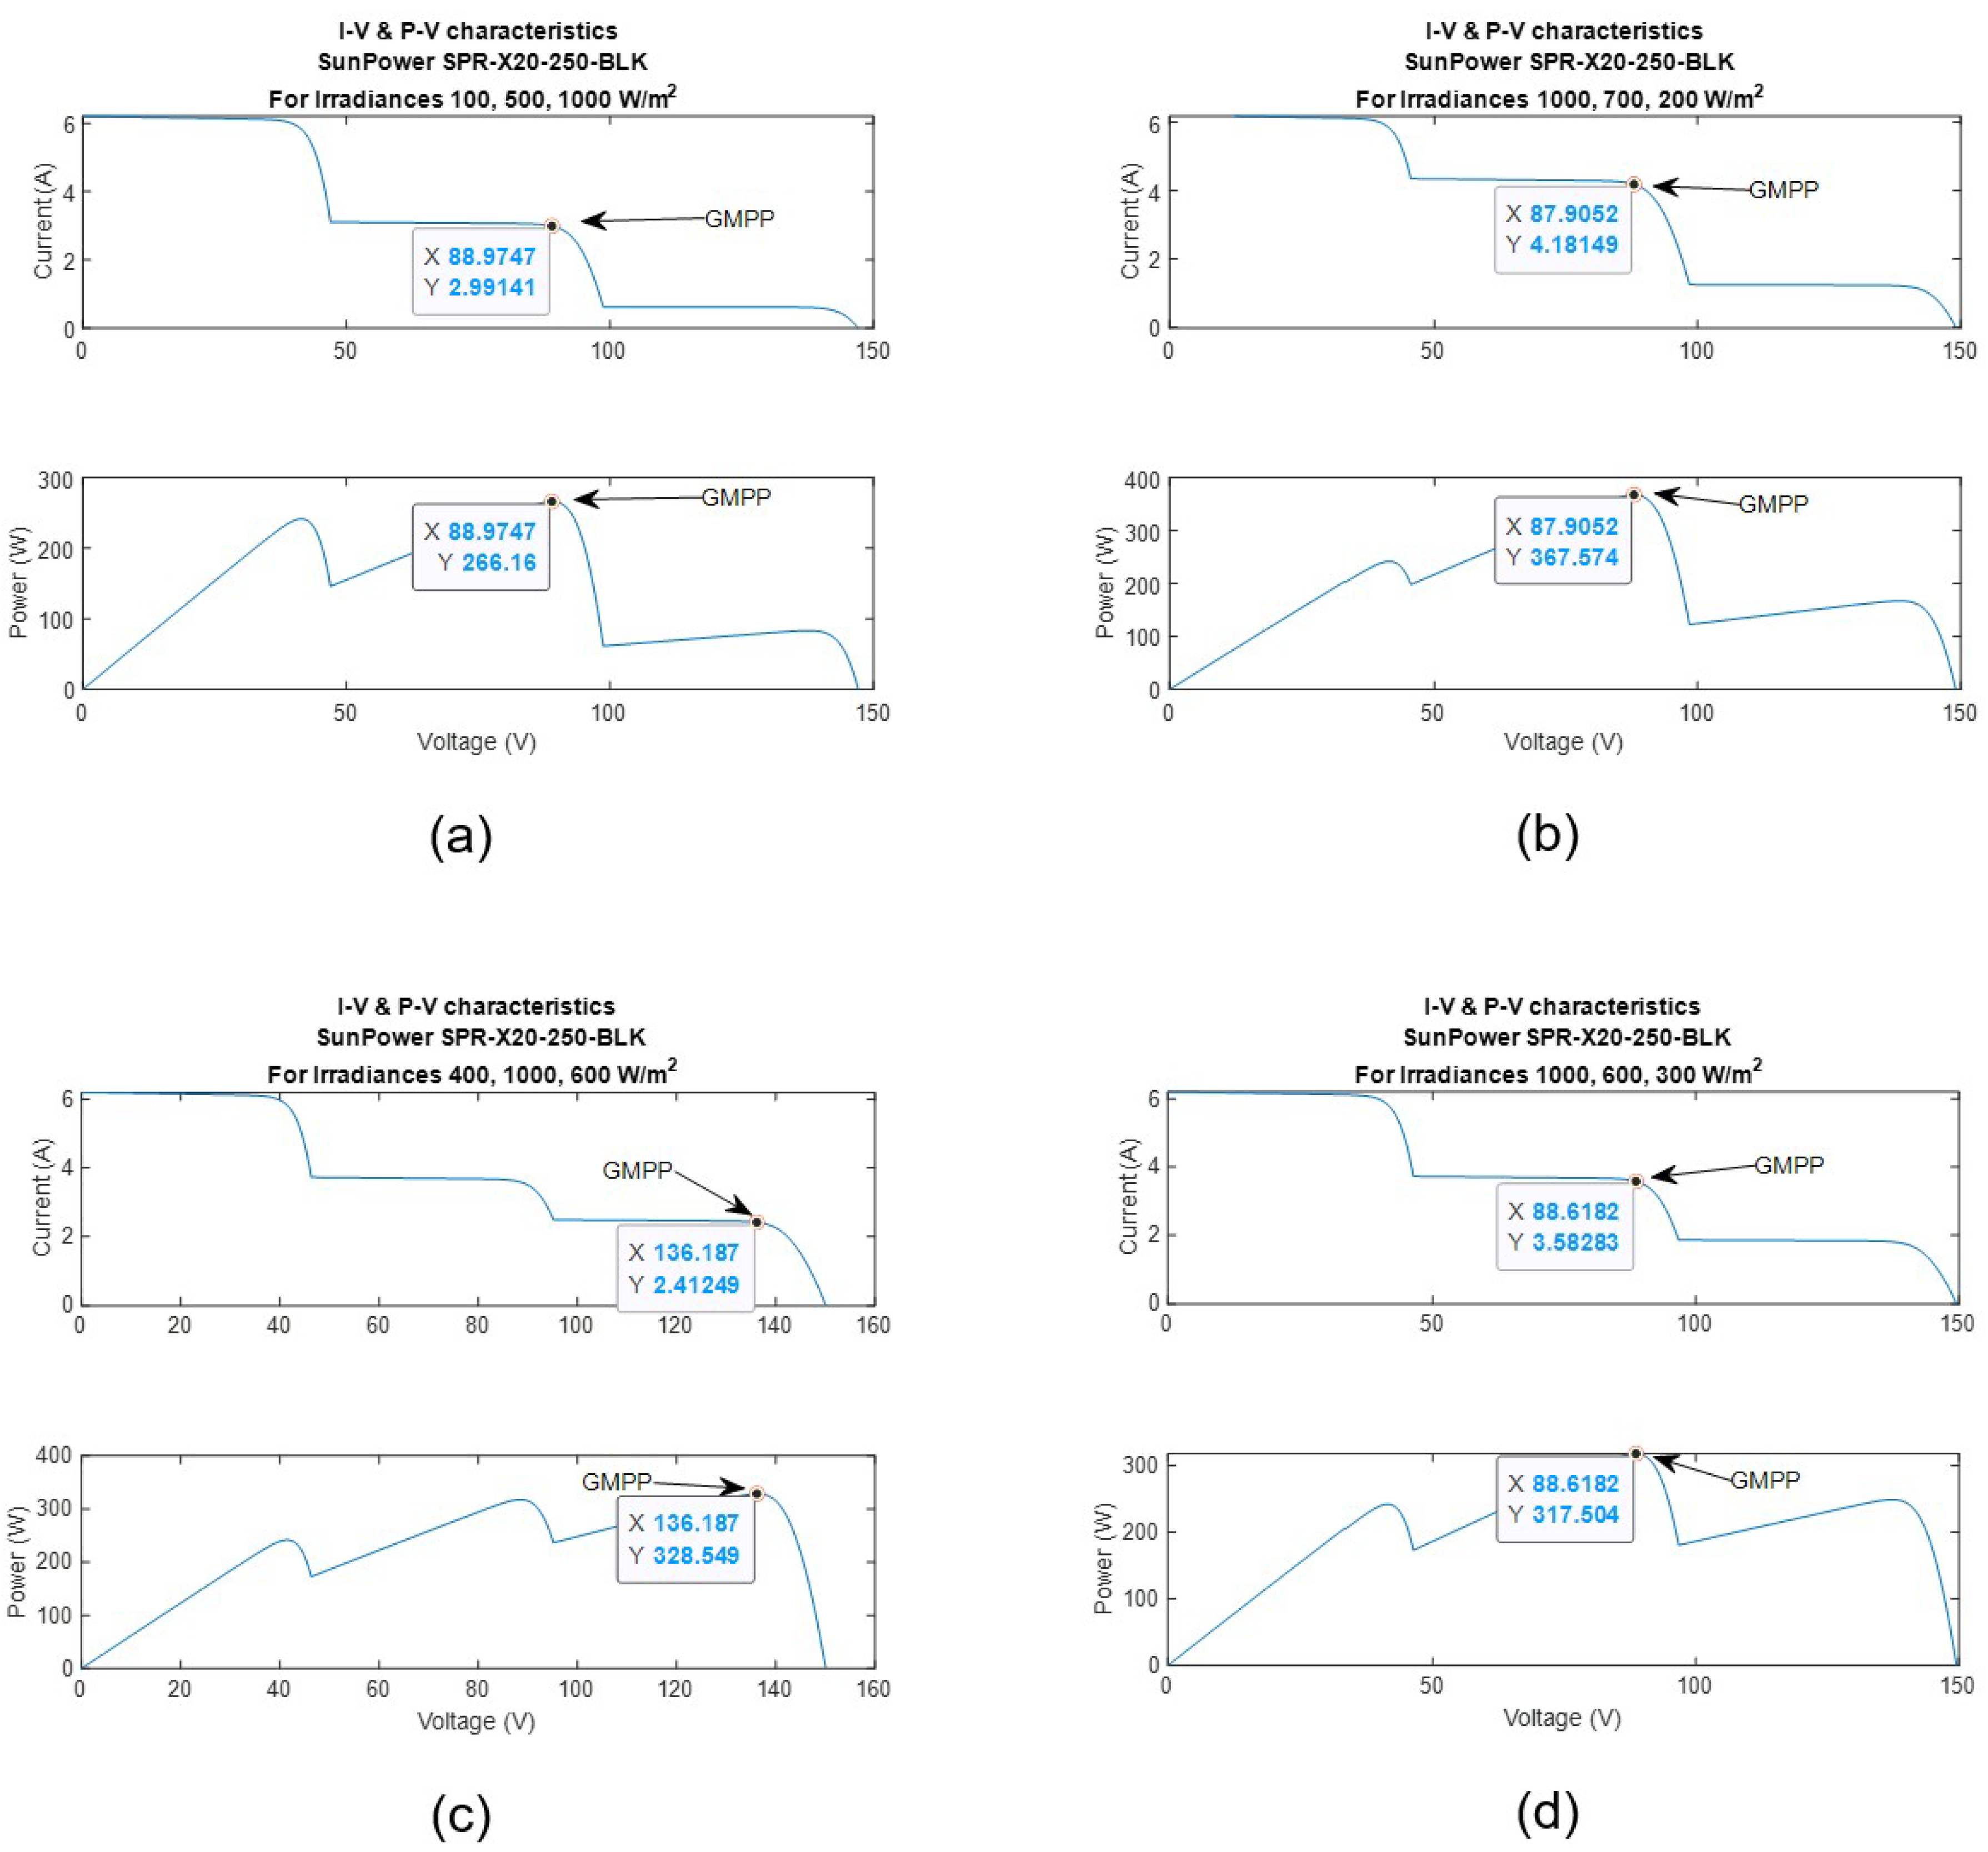
Figure 17.
Block diagram of the MPPT algorithms using MATLAB function blocks.
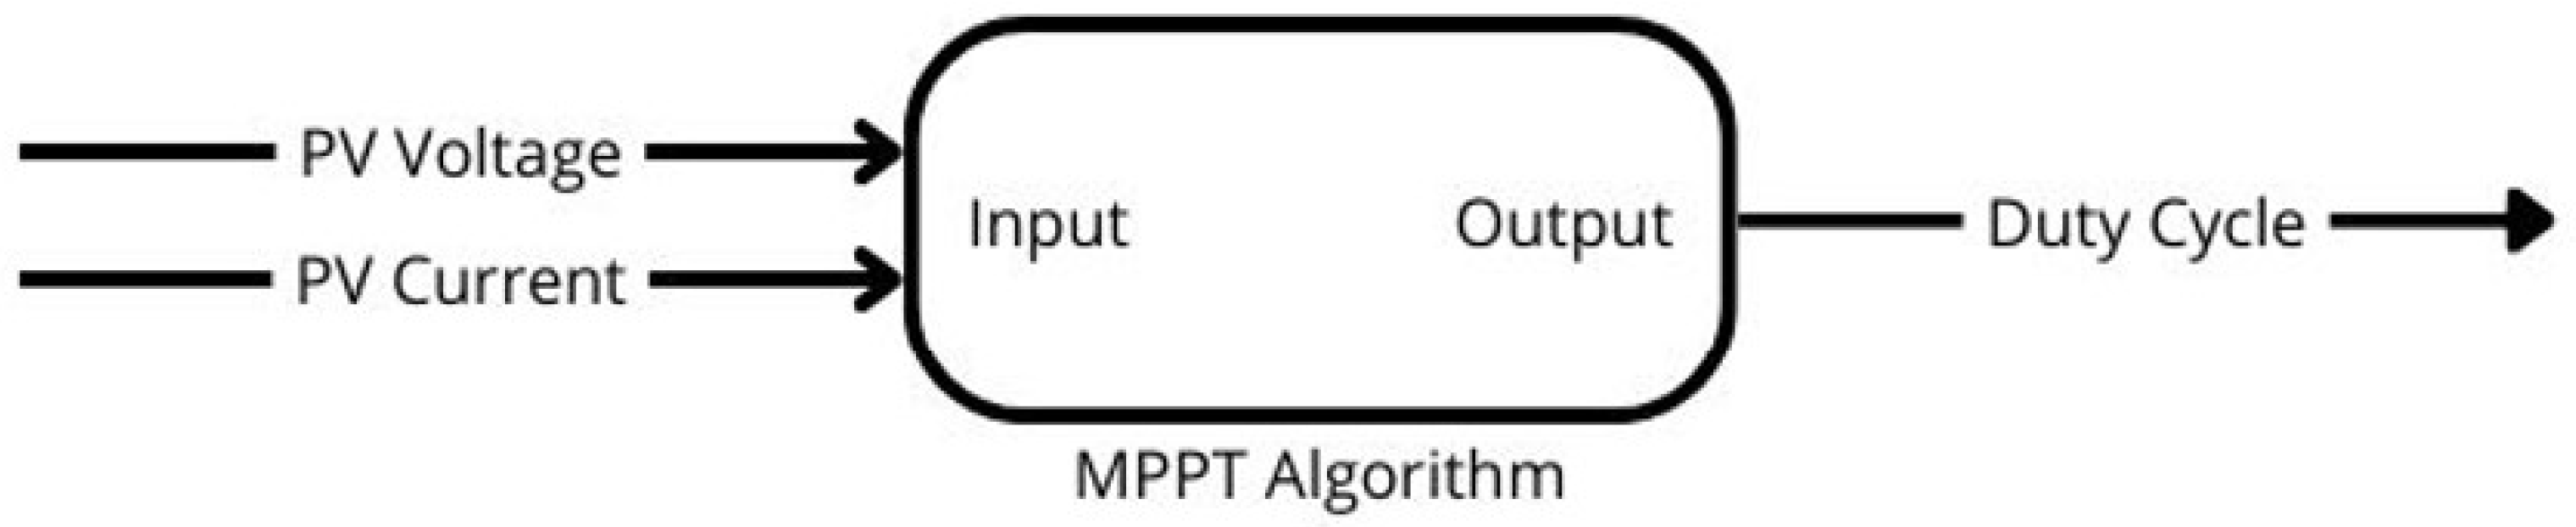
Figure 18.
Flowchart of the P&O algorithm.
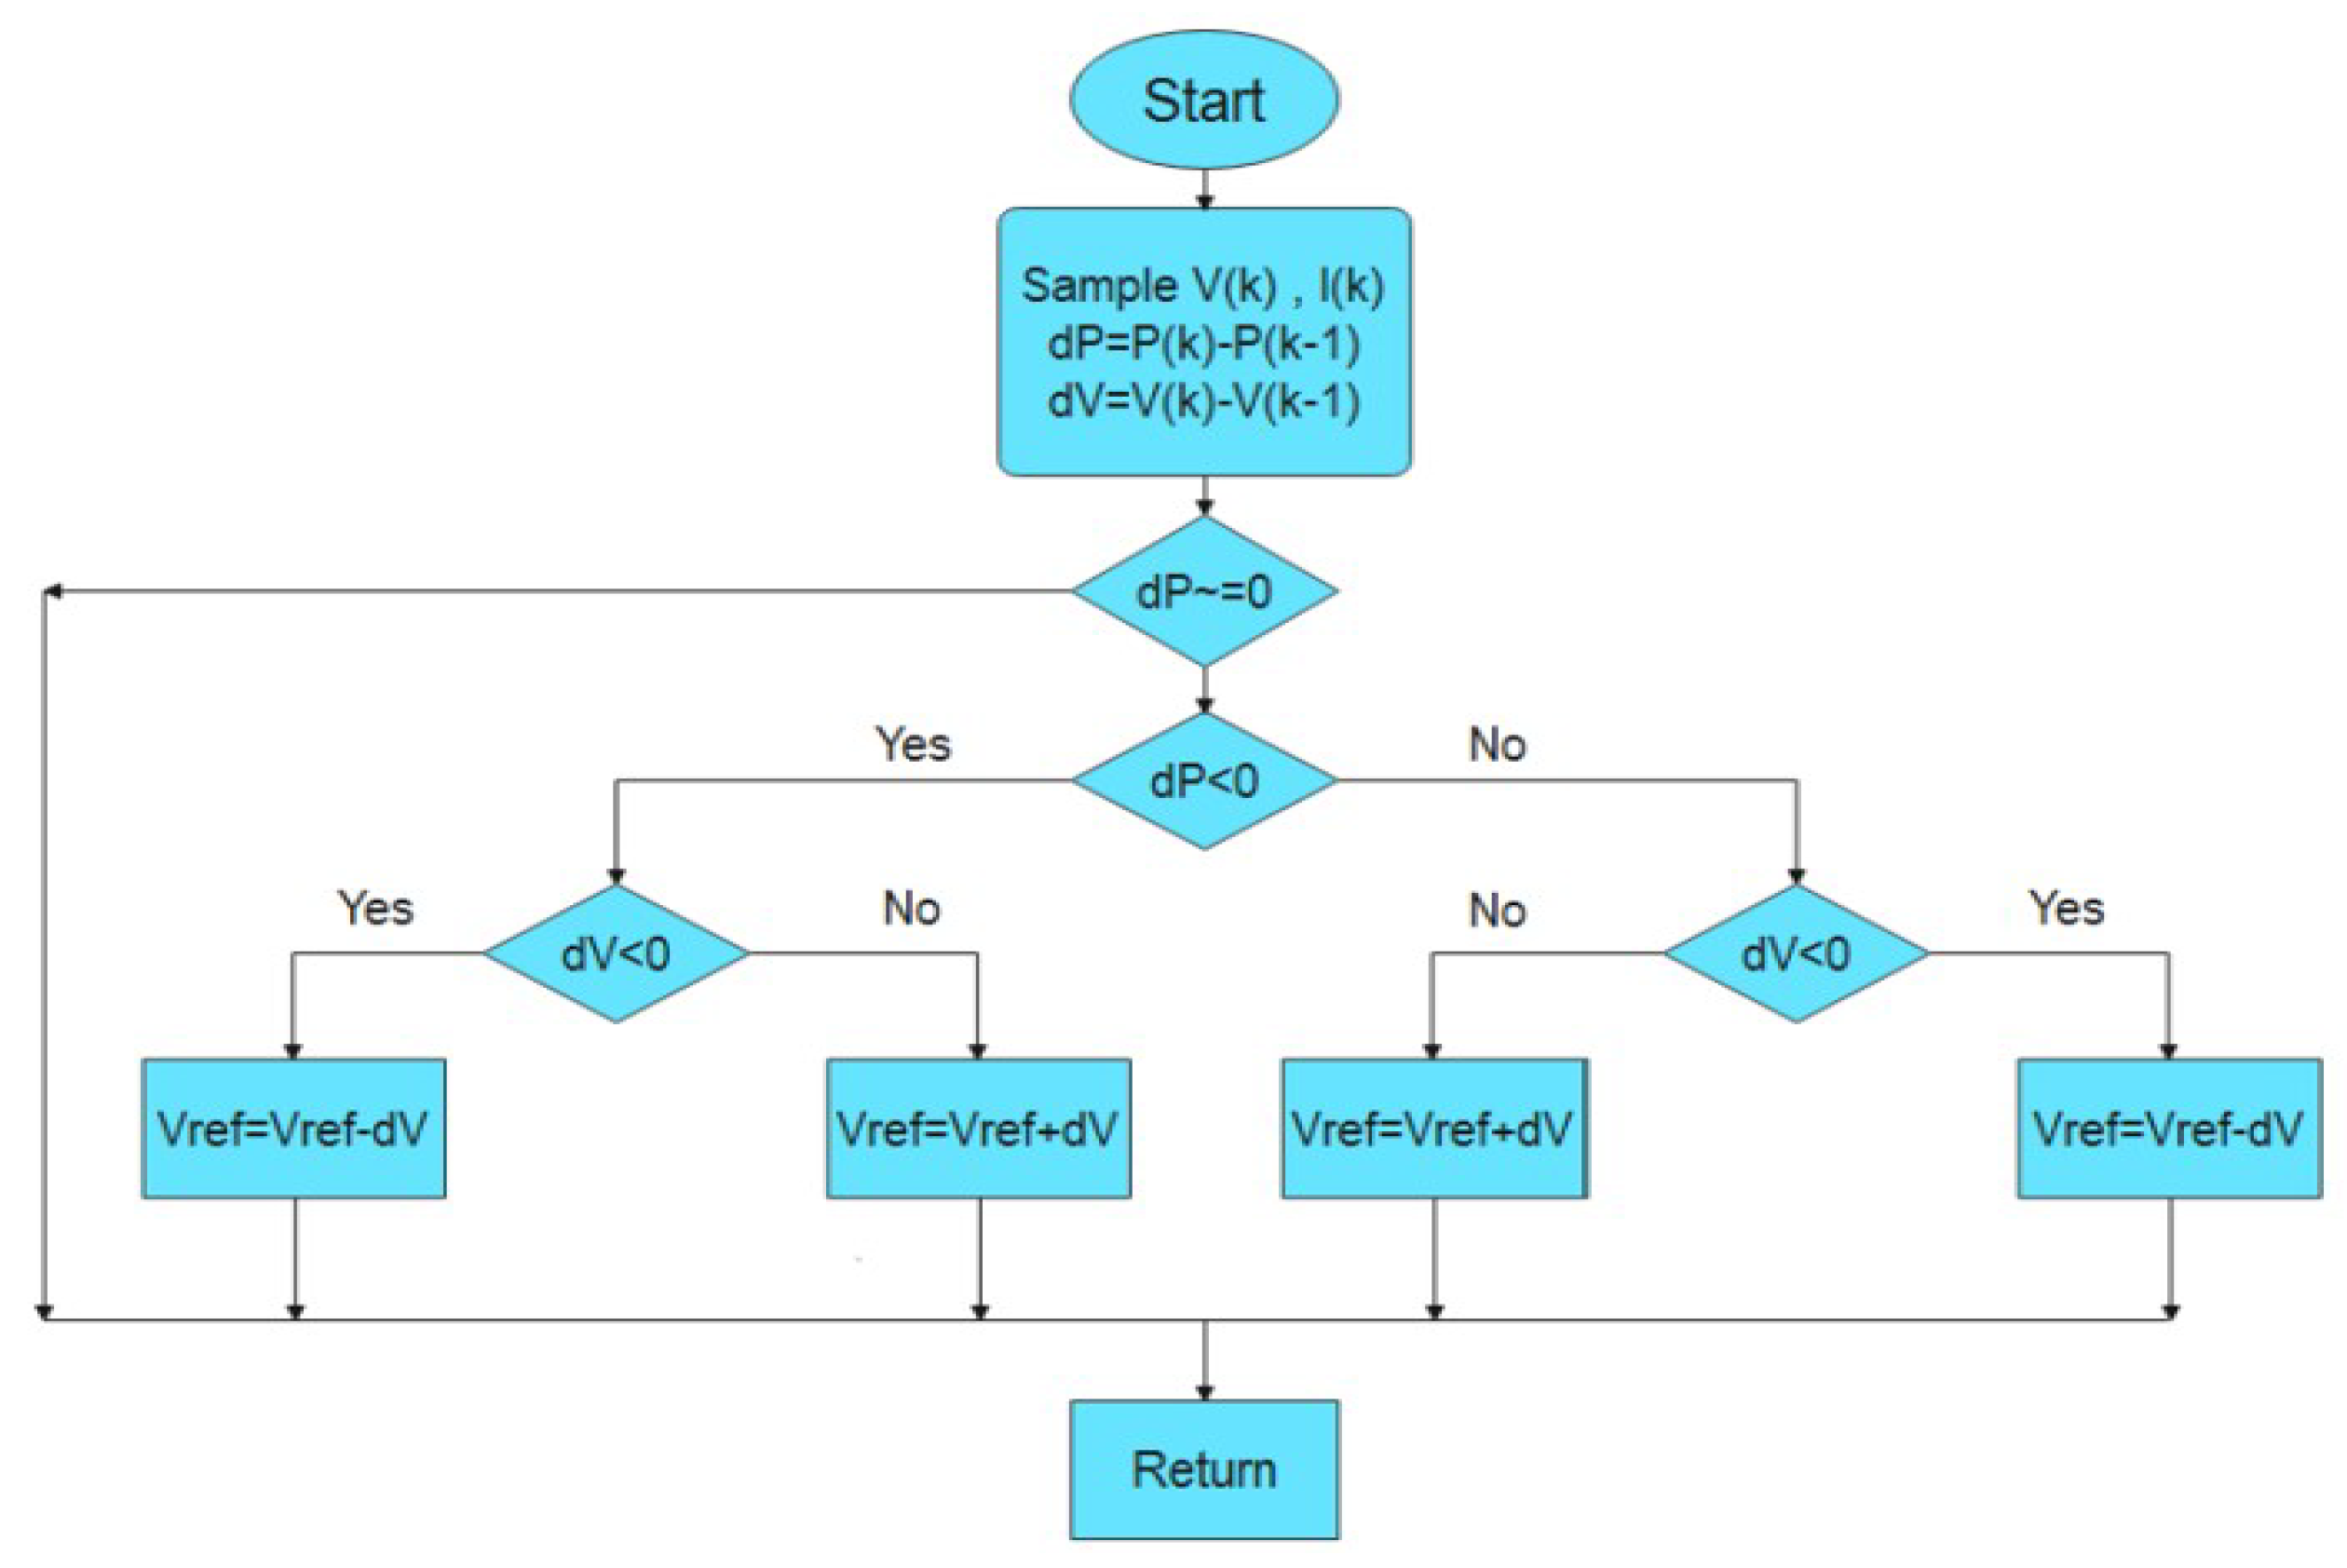
Figure 19.
Flowchart of the IC algorithm.
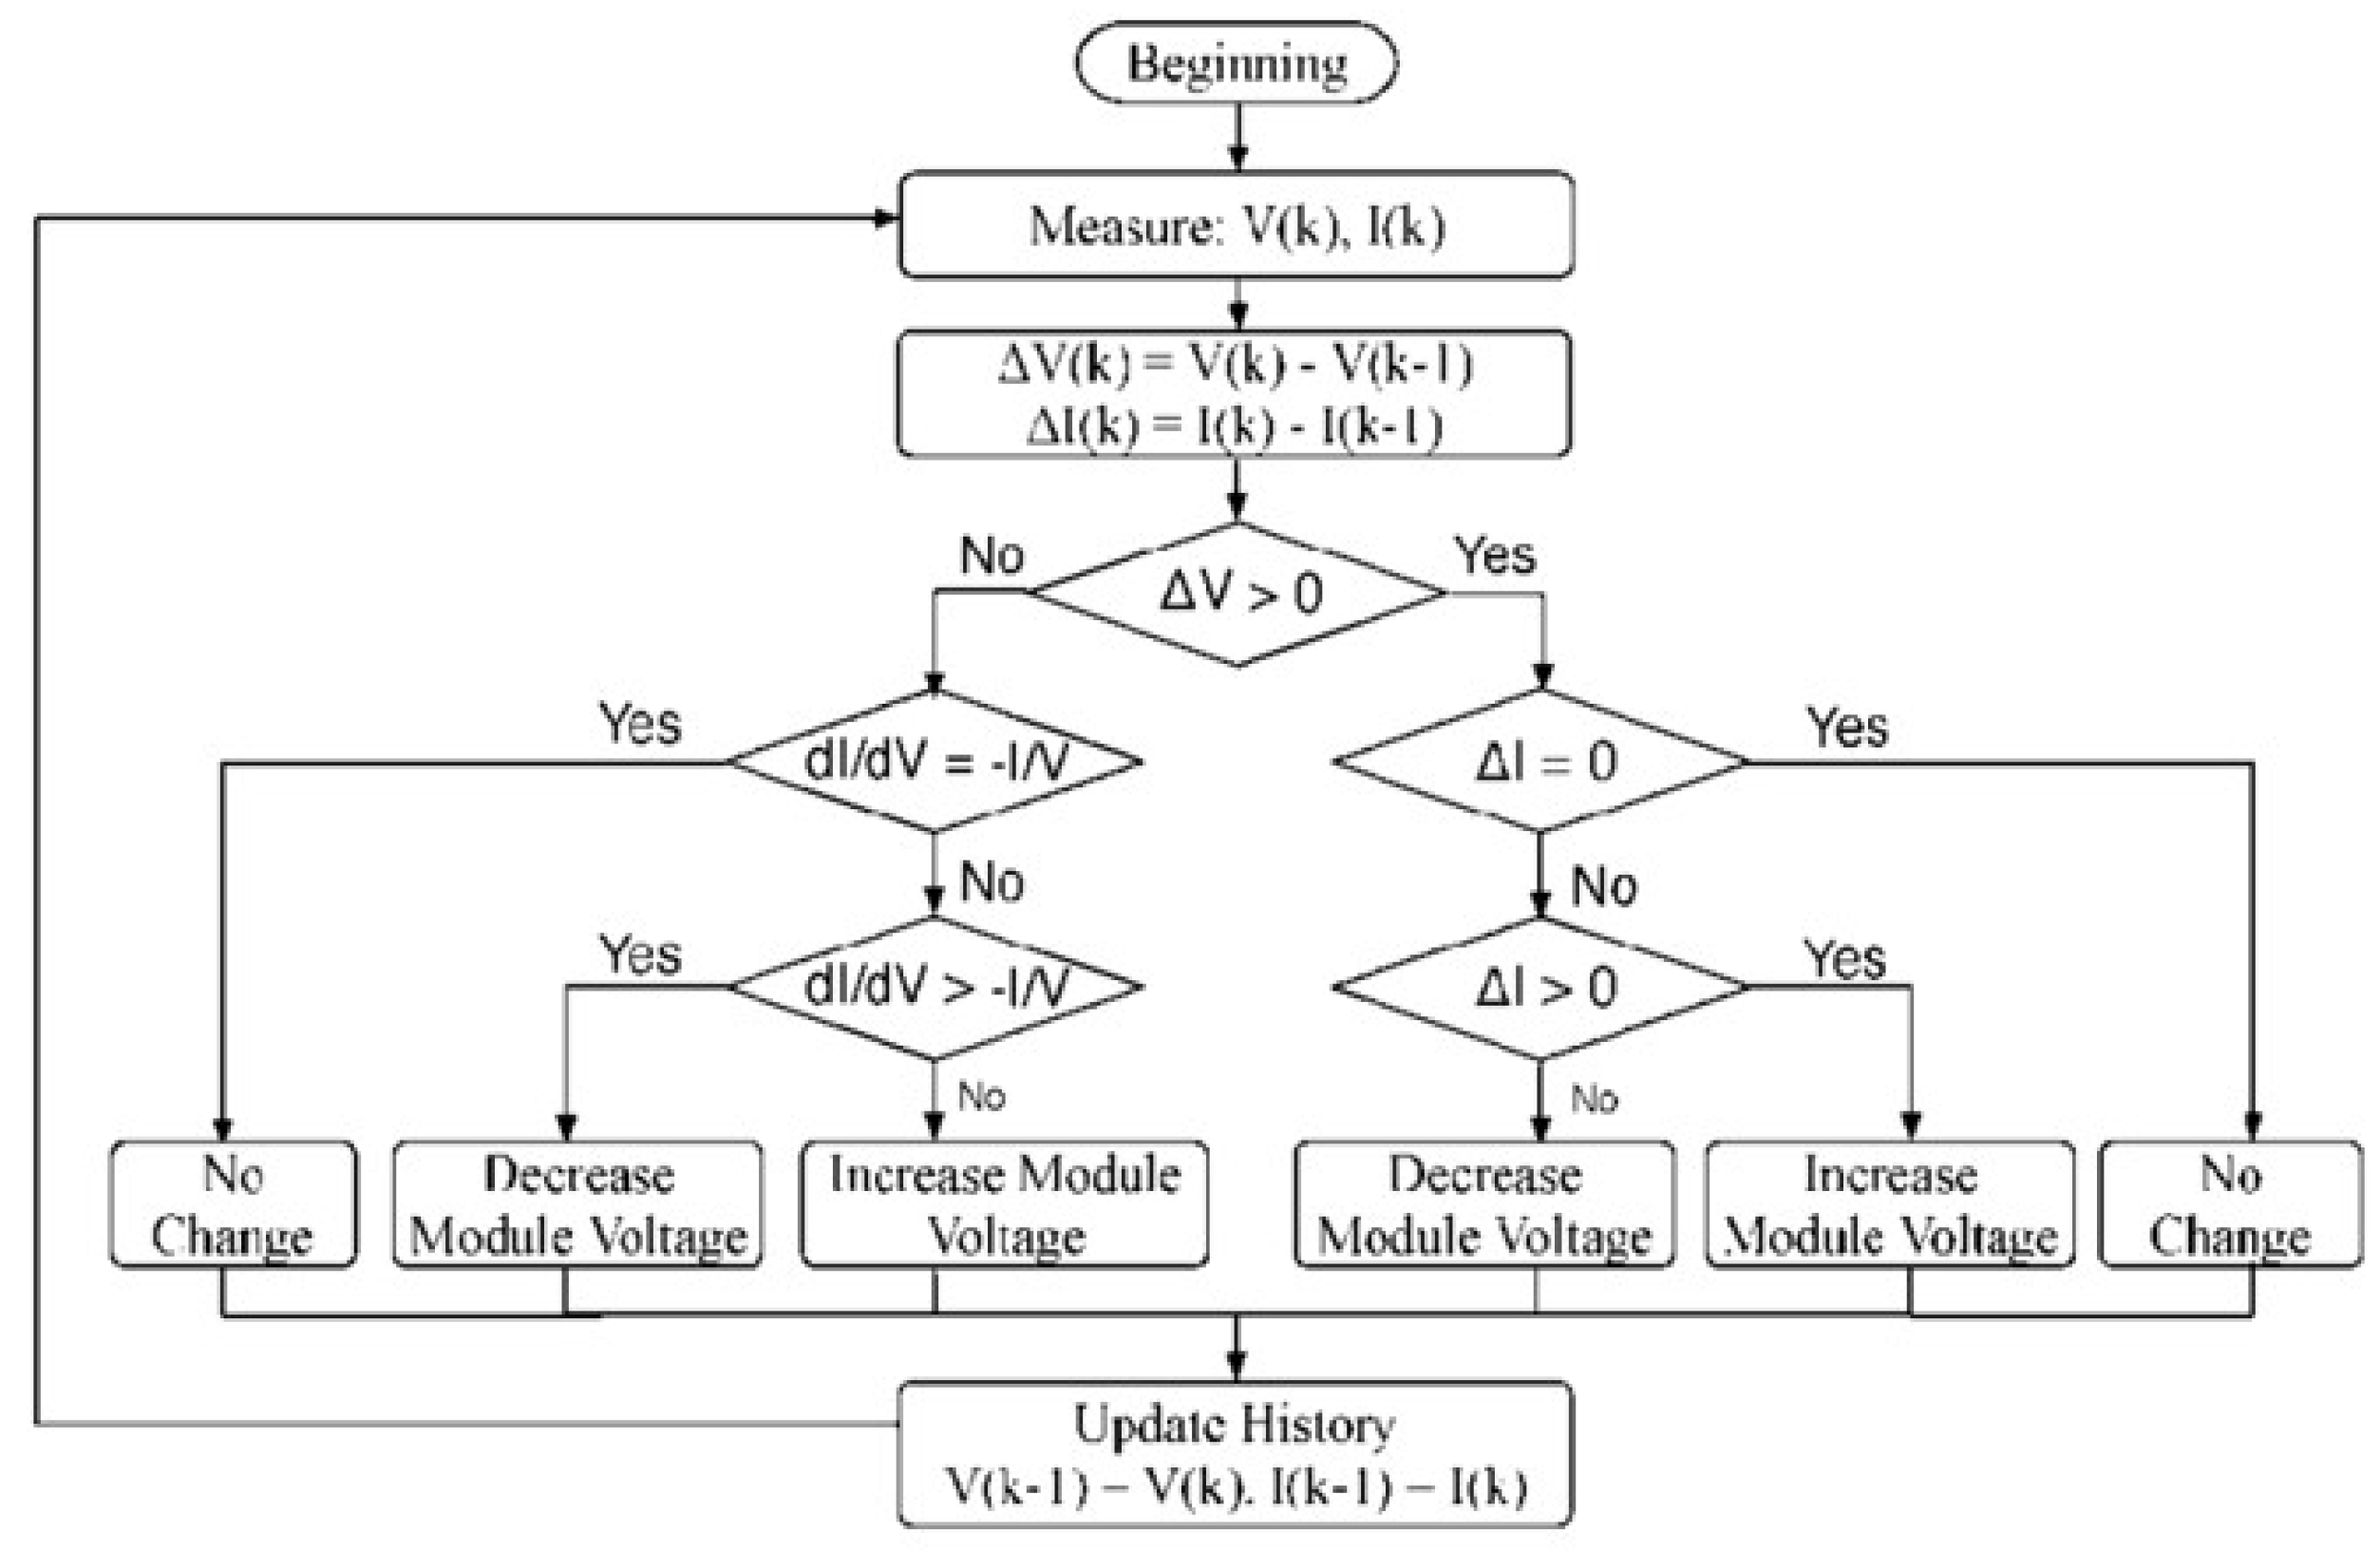
Figure 20.
Block diagram of the FLC algorithm
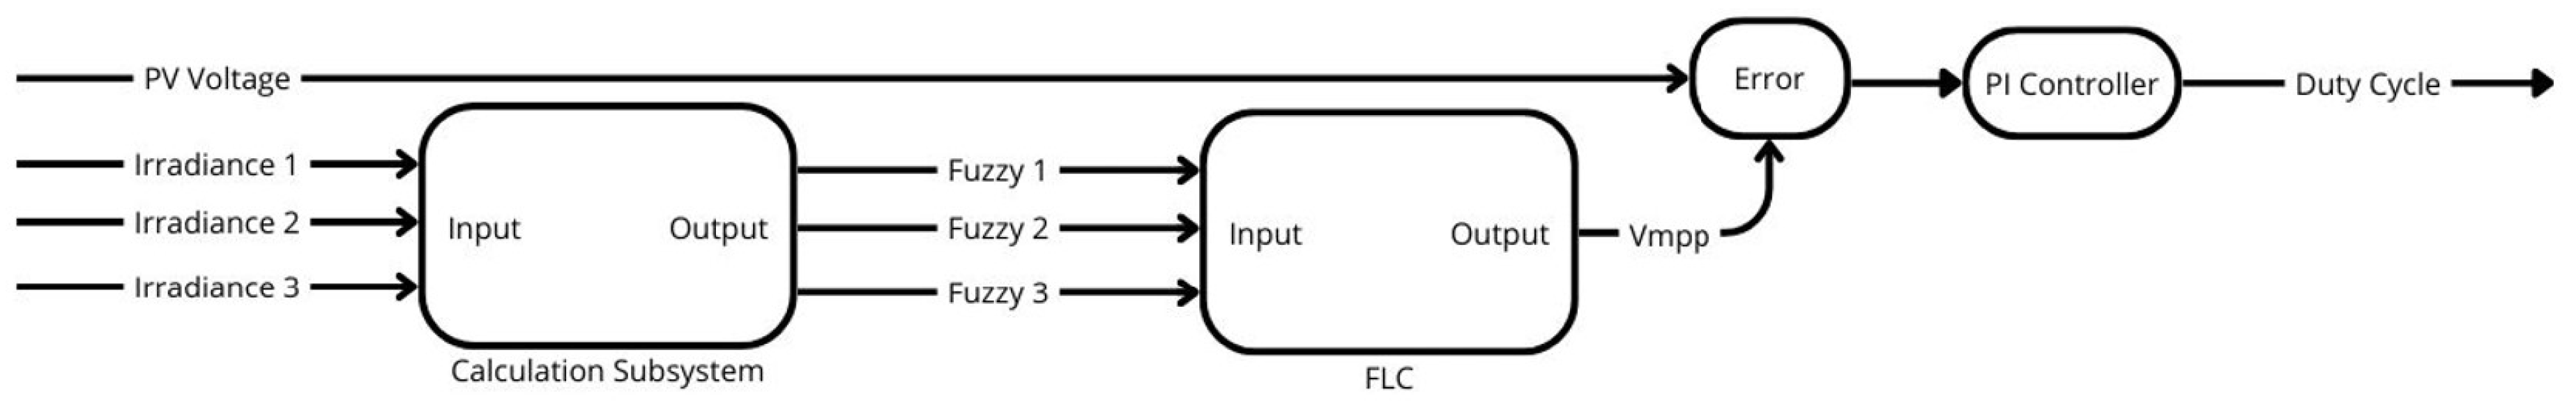
Figure 21.
Fuzzy Inference System (FIS) Plot.
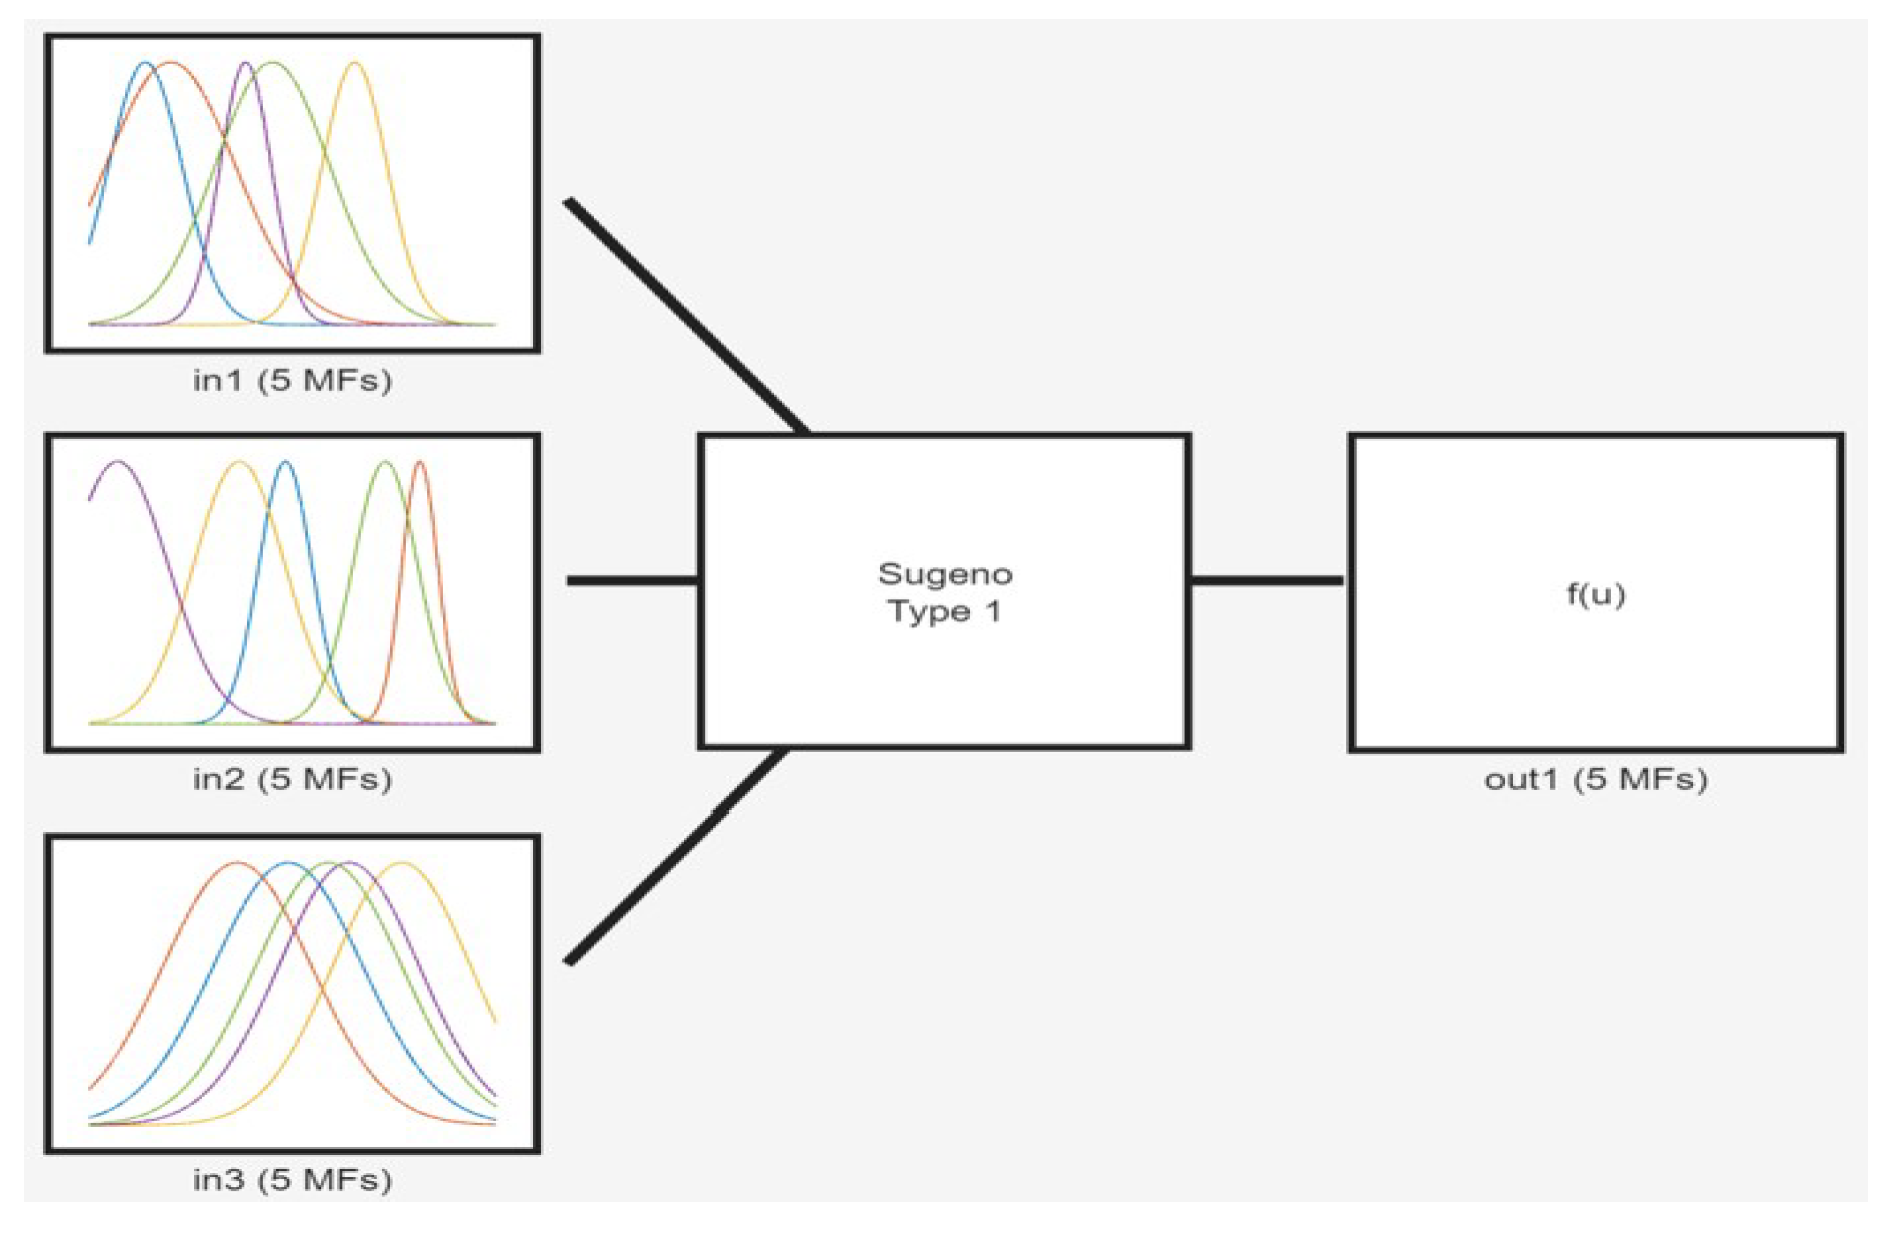
Figure 22.
Simplified flowchart of the GWO algorithm.
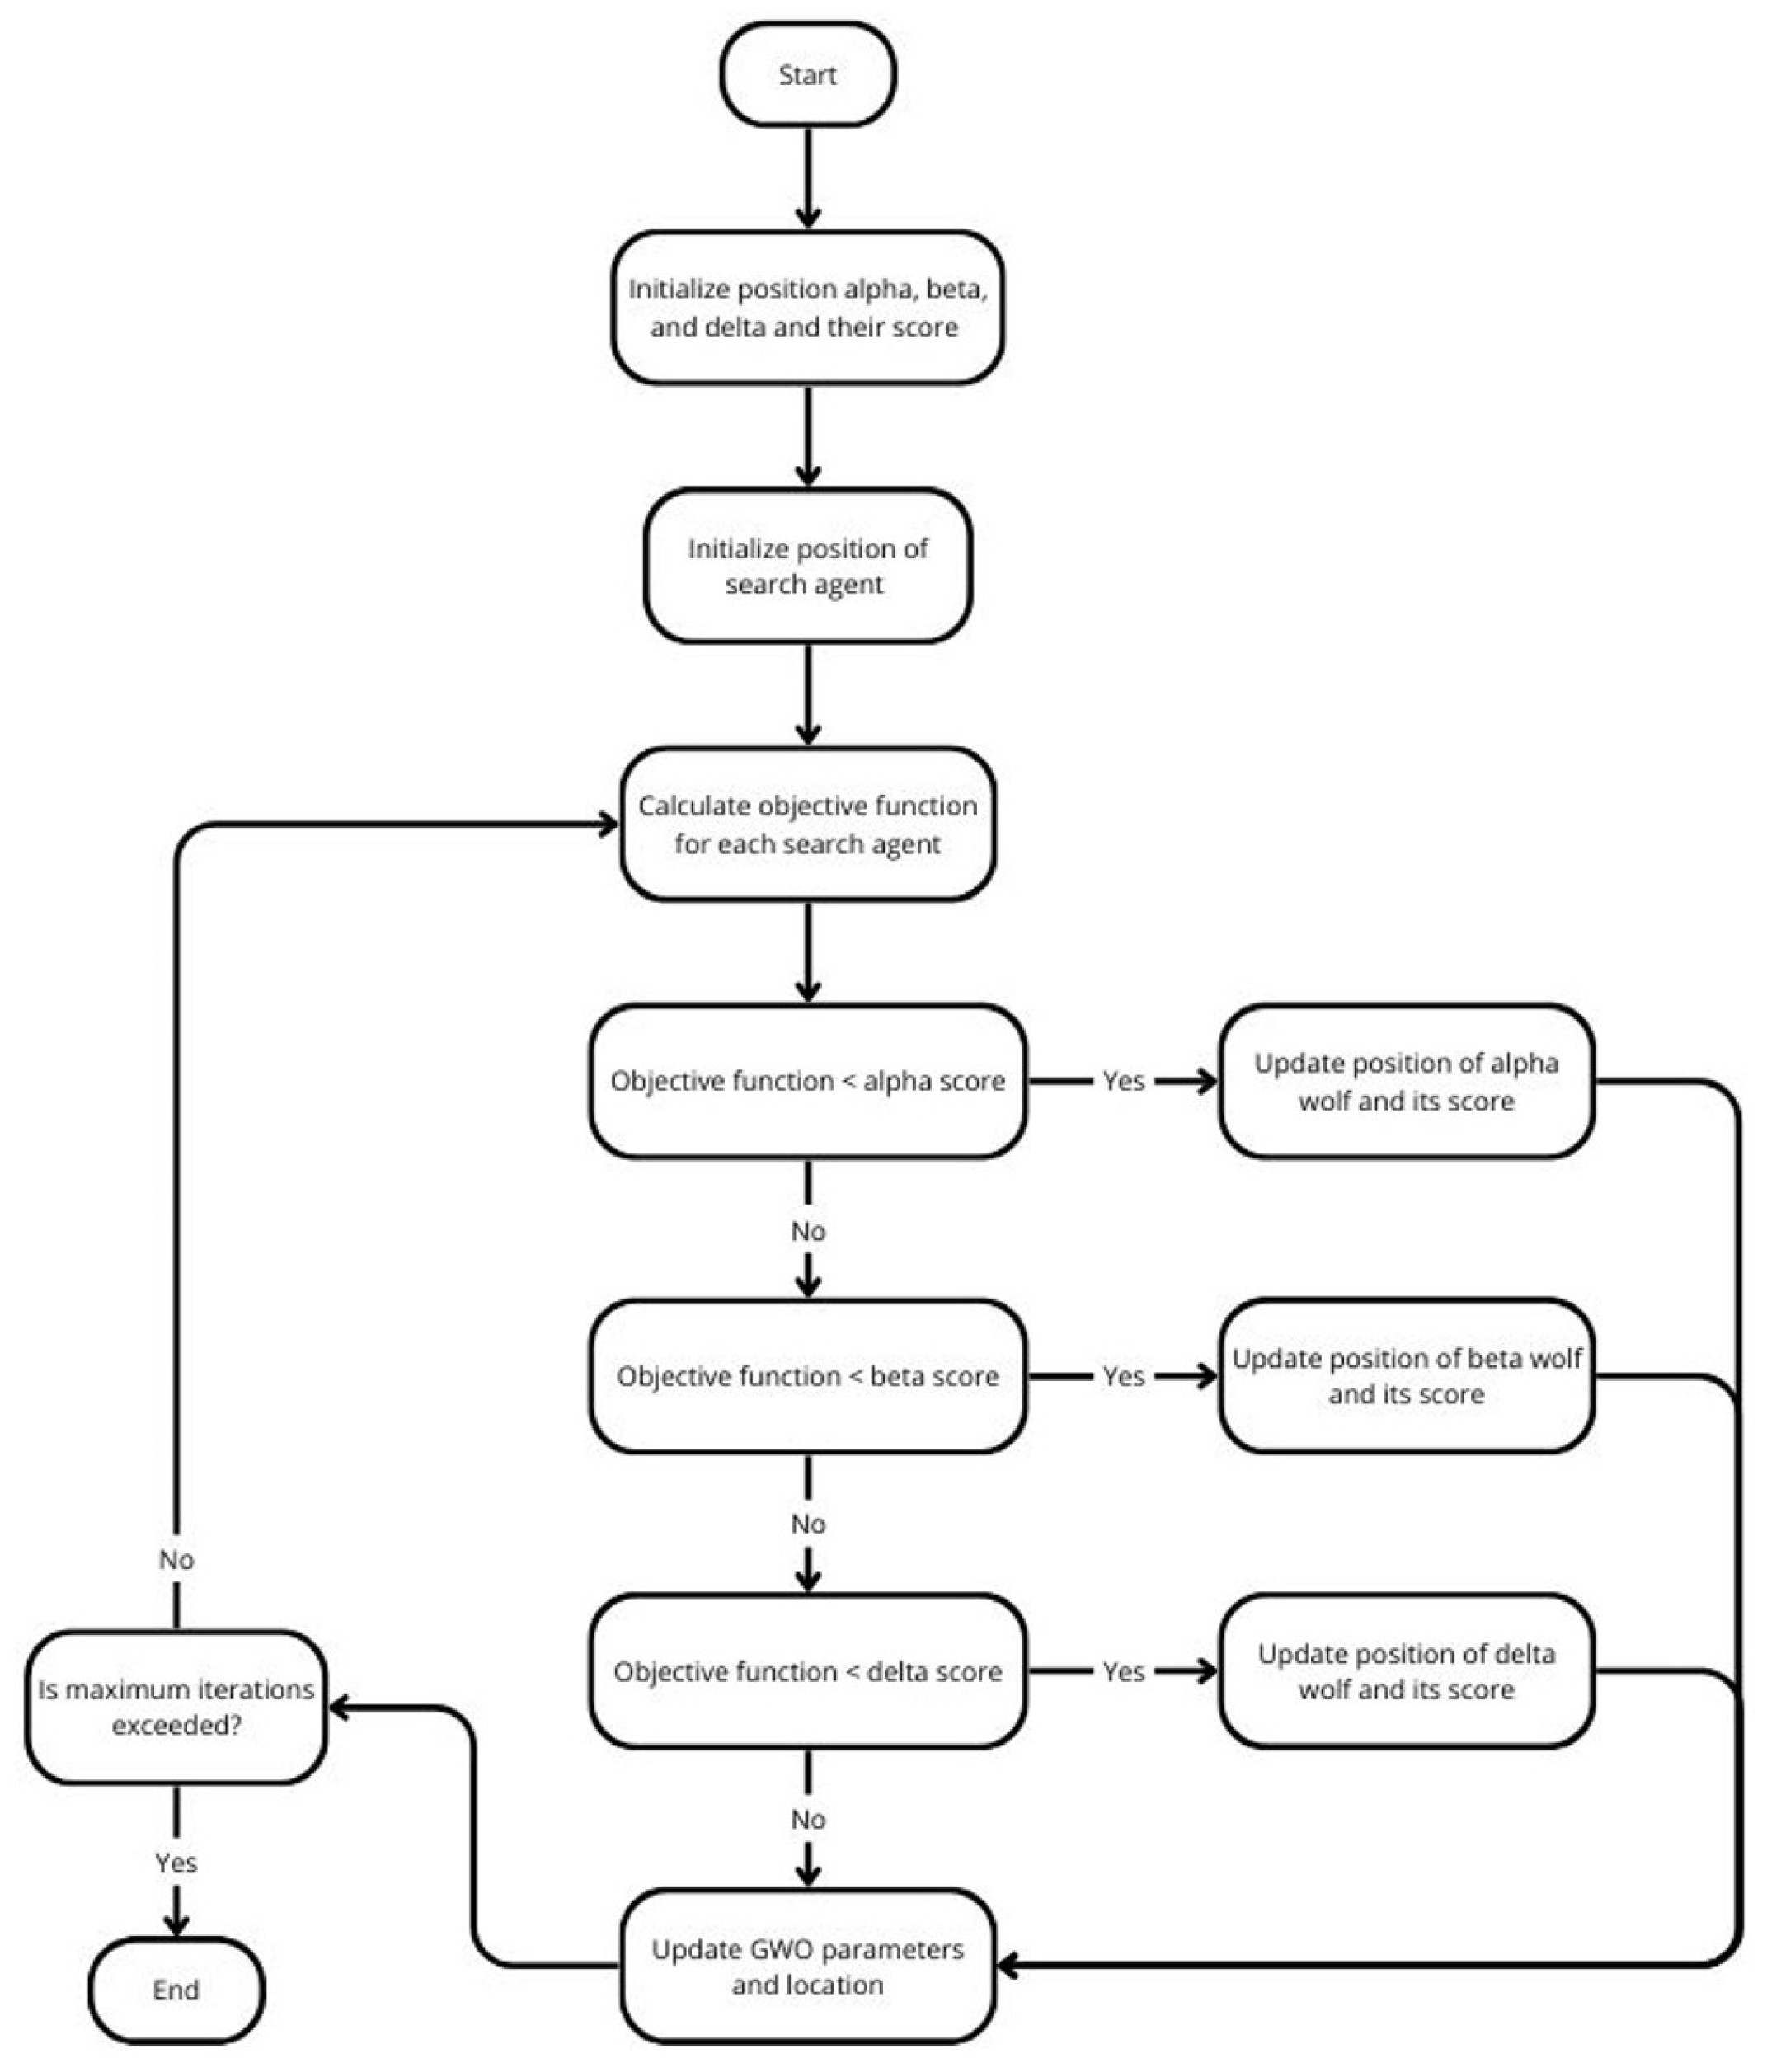
Figure 23.
Simplified flowchart of the PSO algorithm.
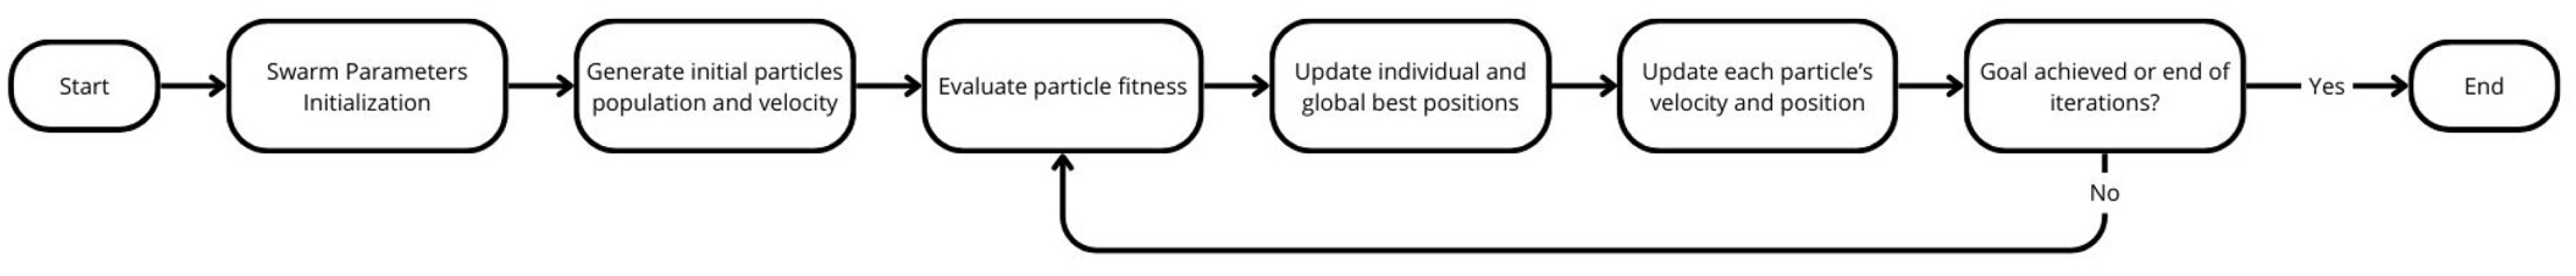
Figure 24.
Generated ANN Simulink block.
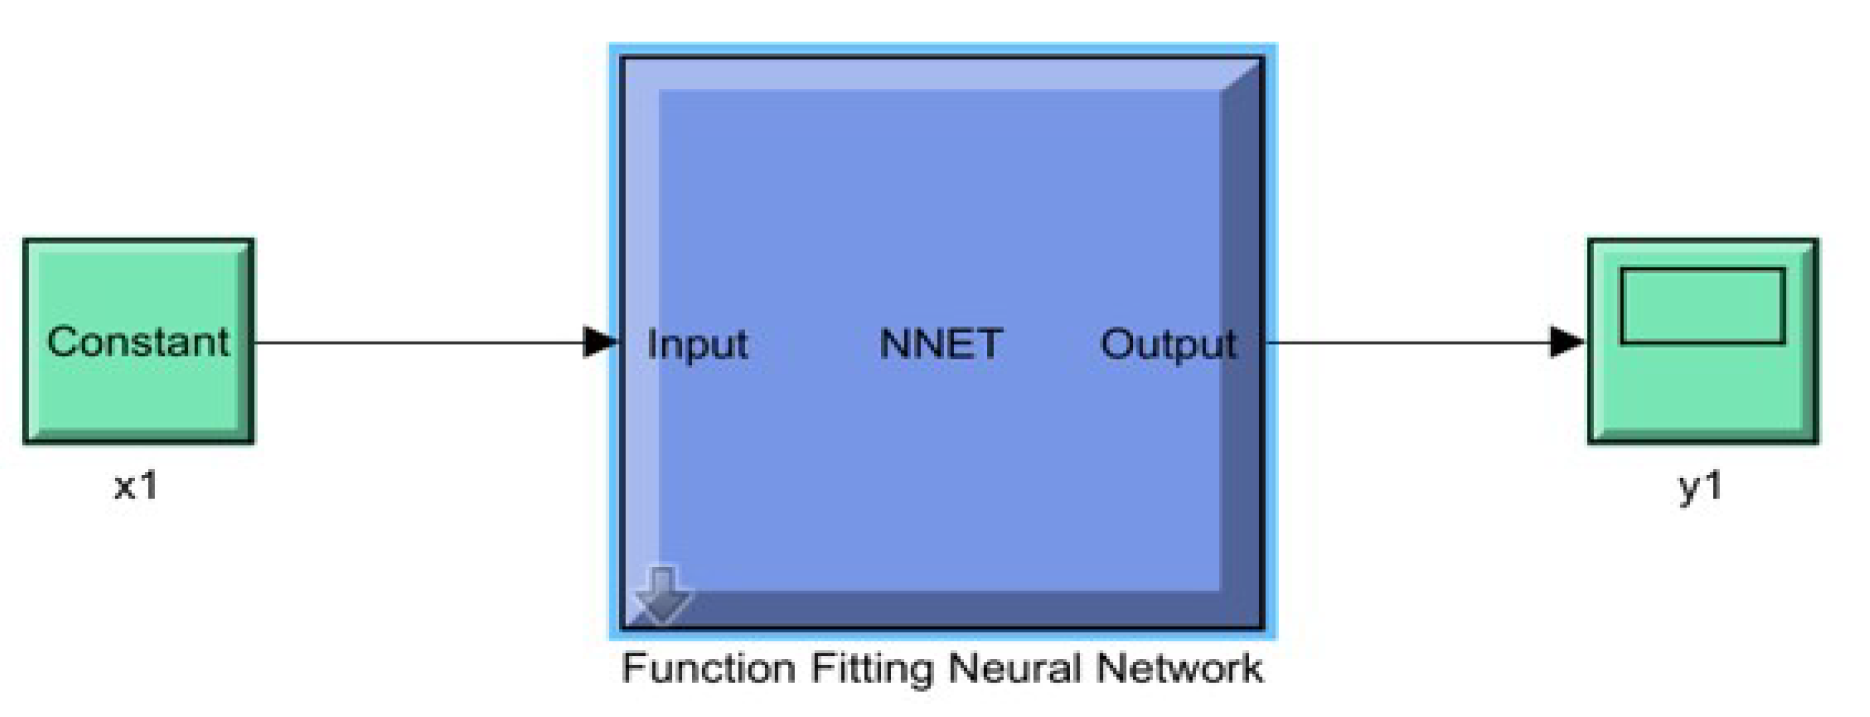
Figure 25.
Layers inside the ANN Simulink block.
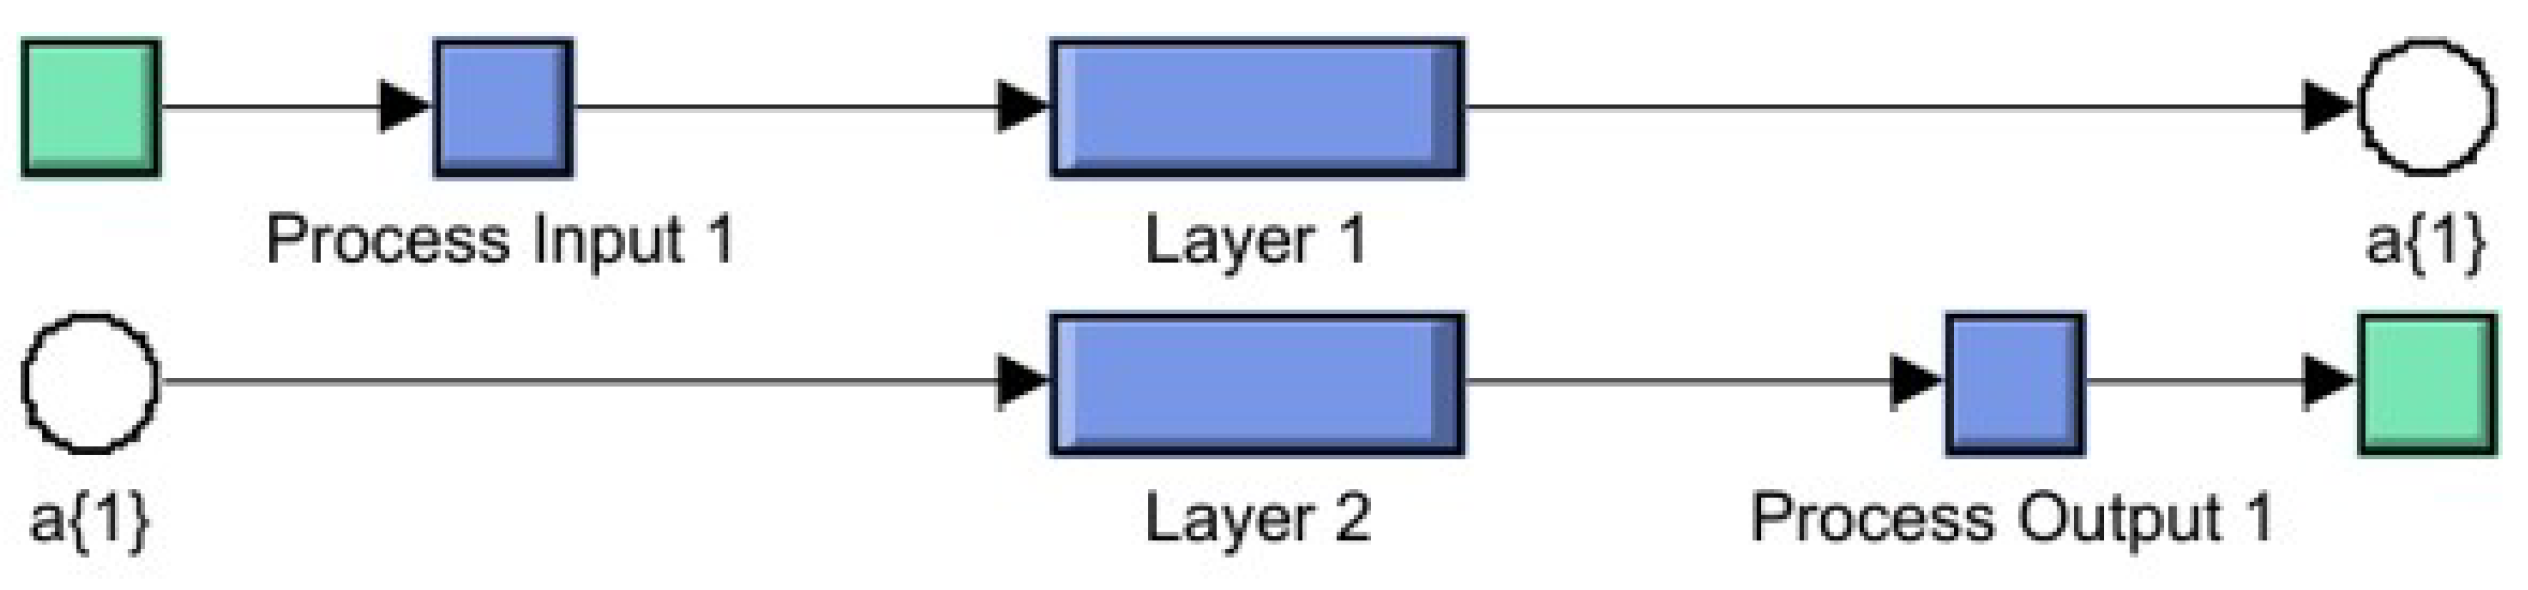
Figure 26.
The ANN structure of ANN(1) (a), and ANN(2) (b).
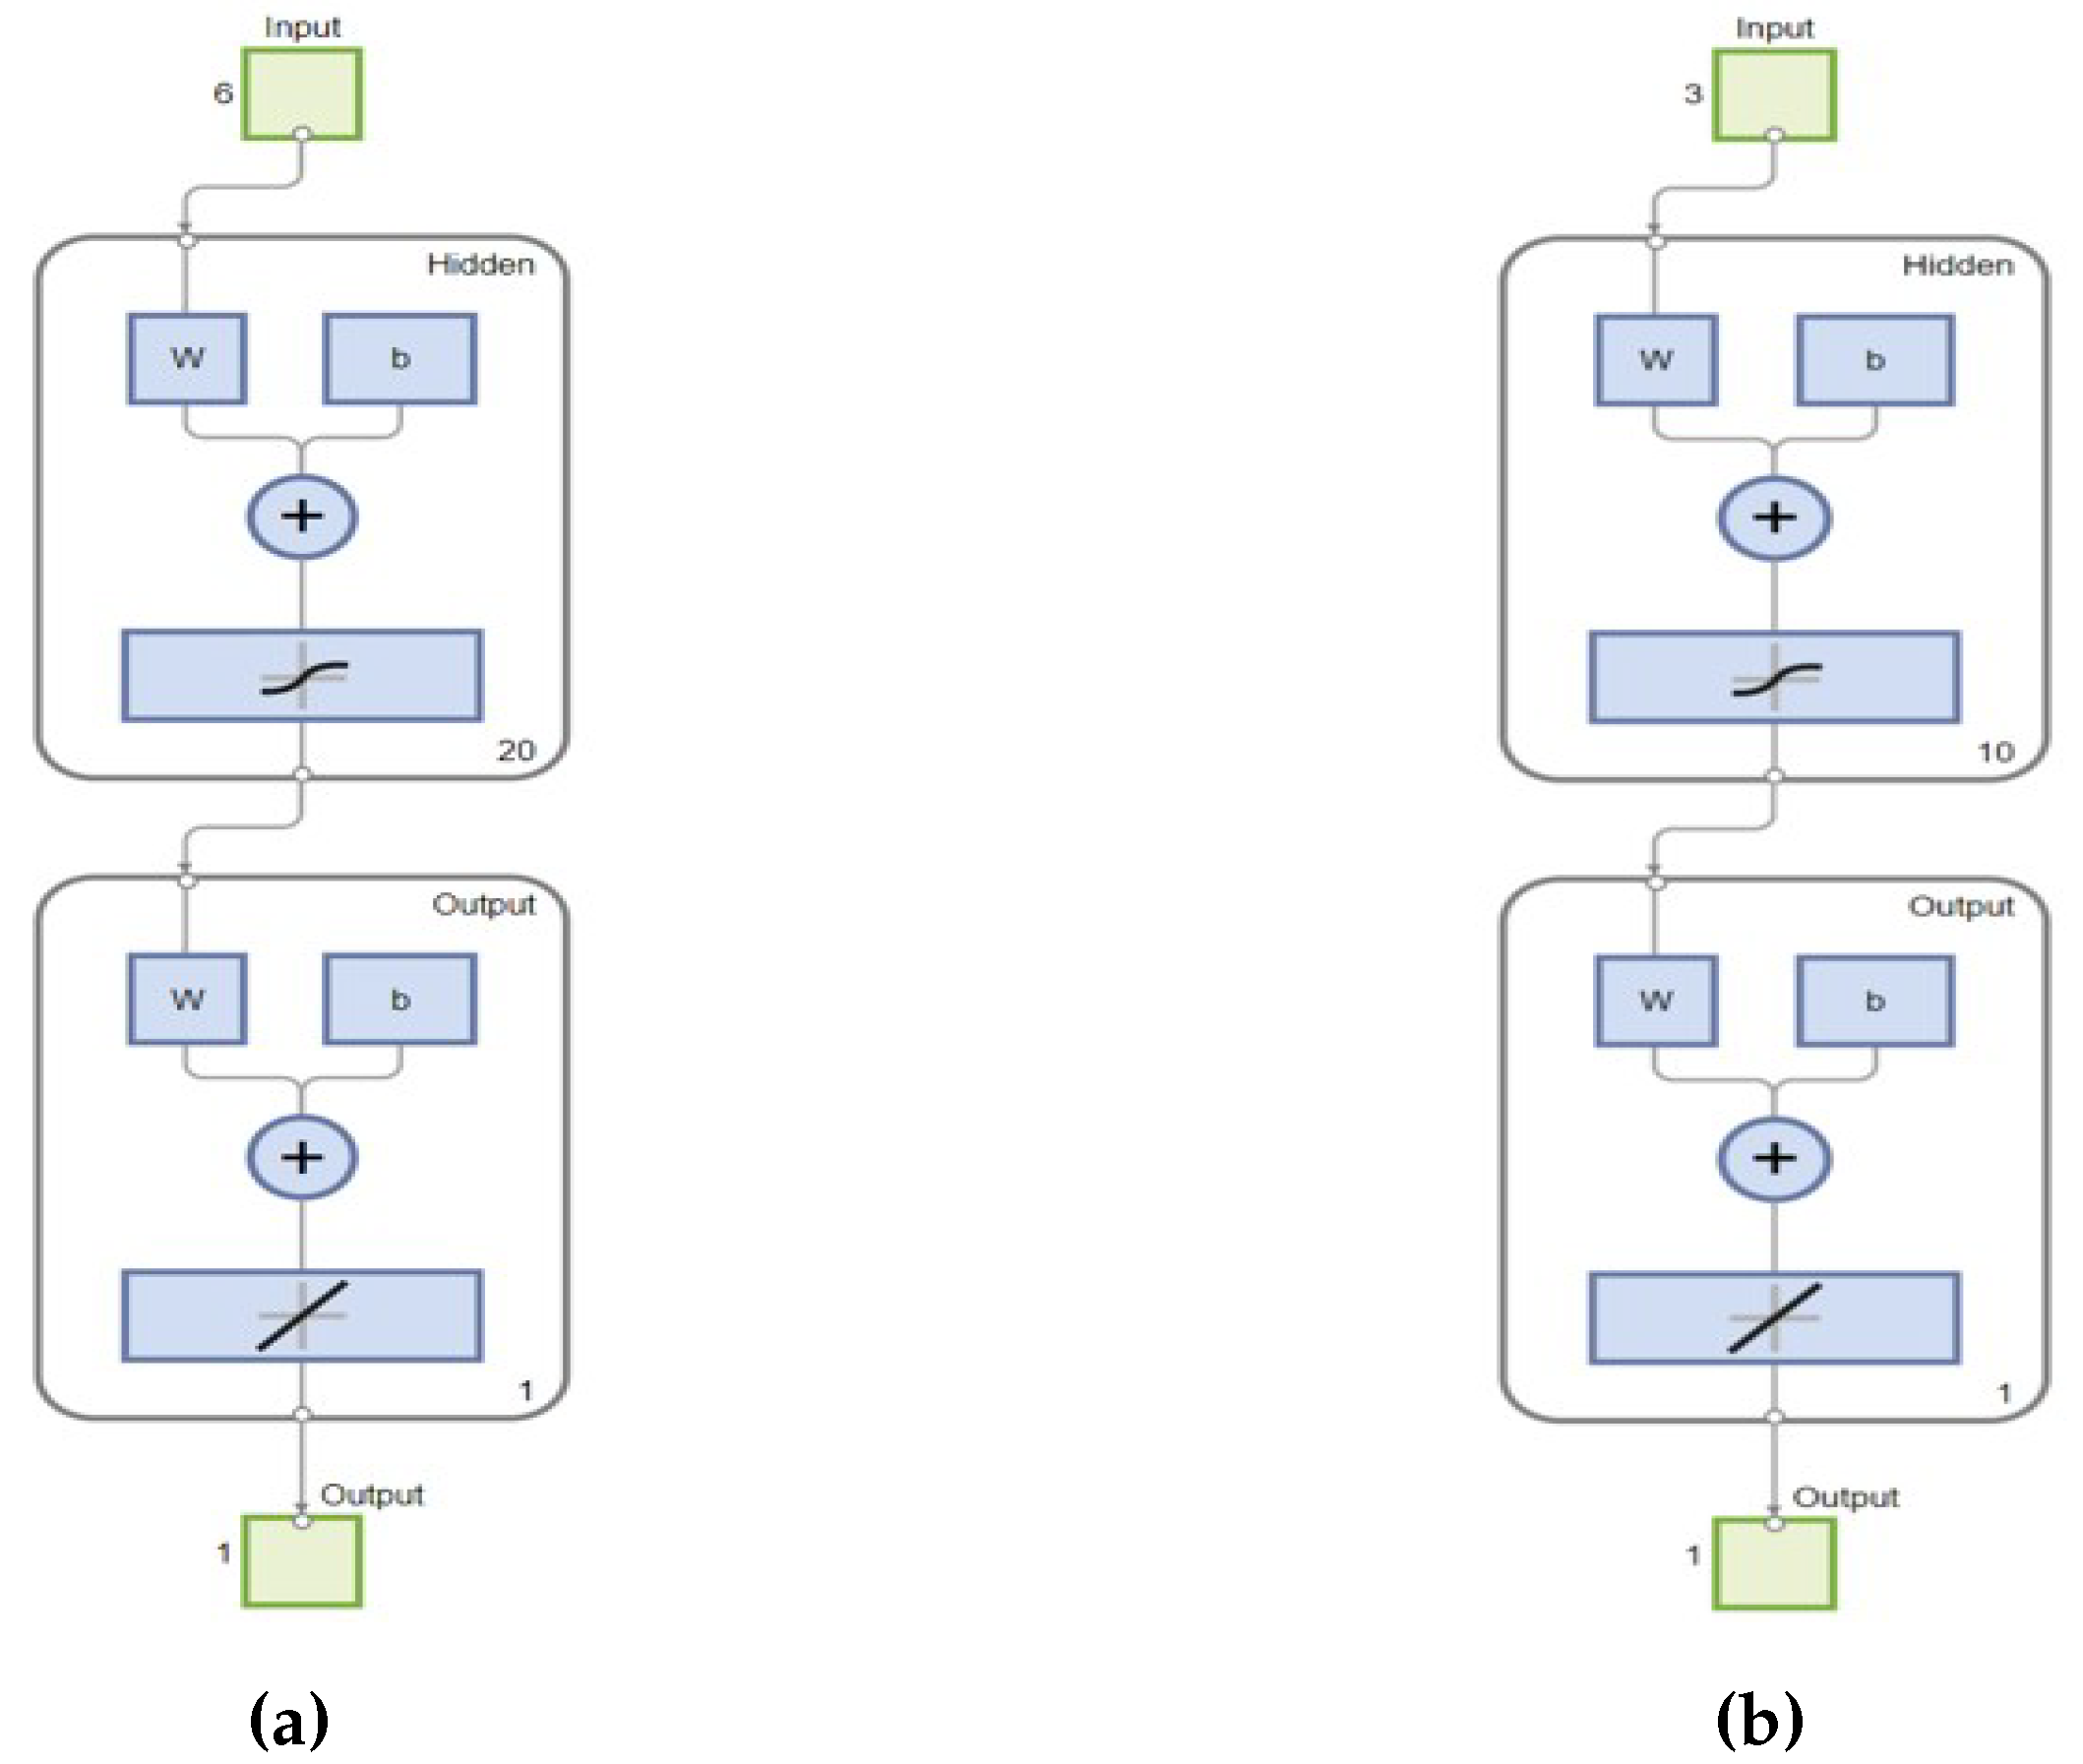
Figure 27.
Block diagram of the ANN(1) MPPT
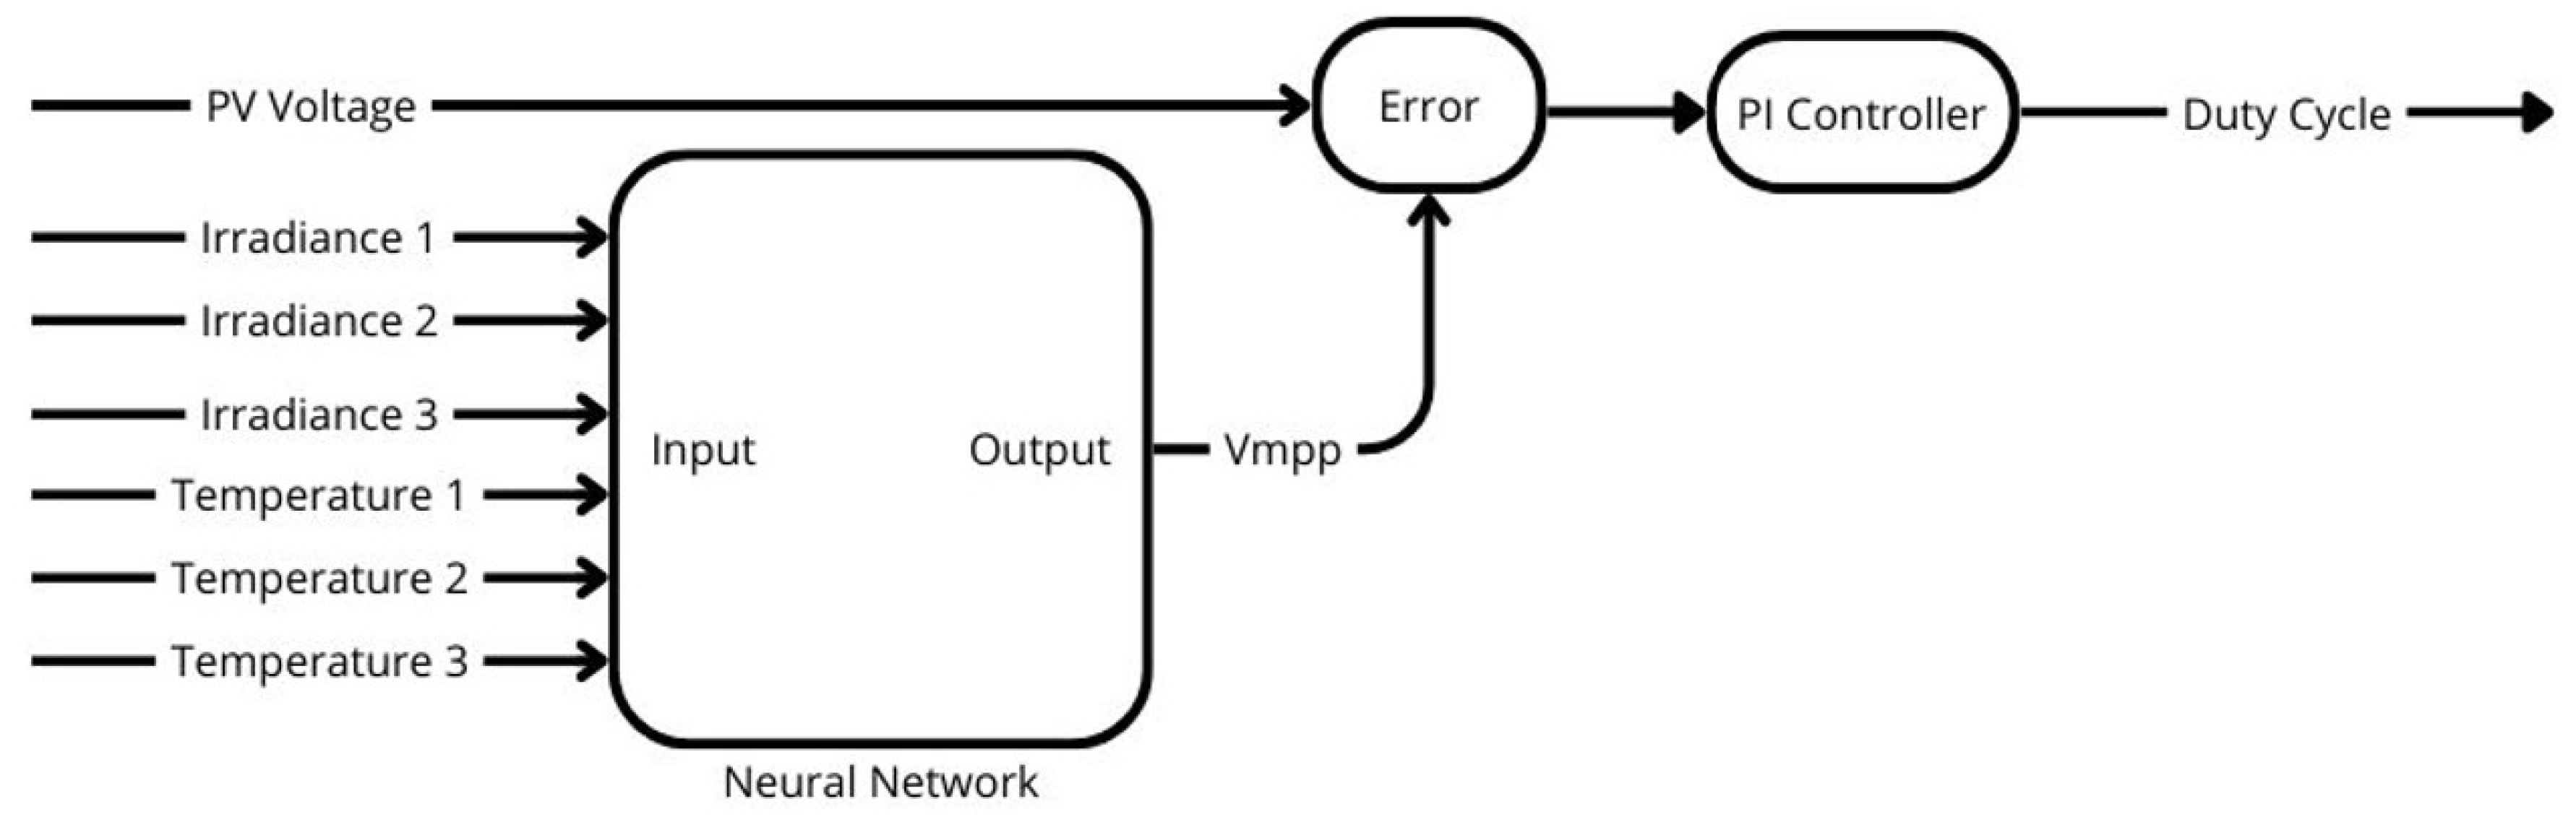
Figure 28.
Block diagram of the ANN(2) MPPT
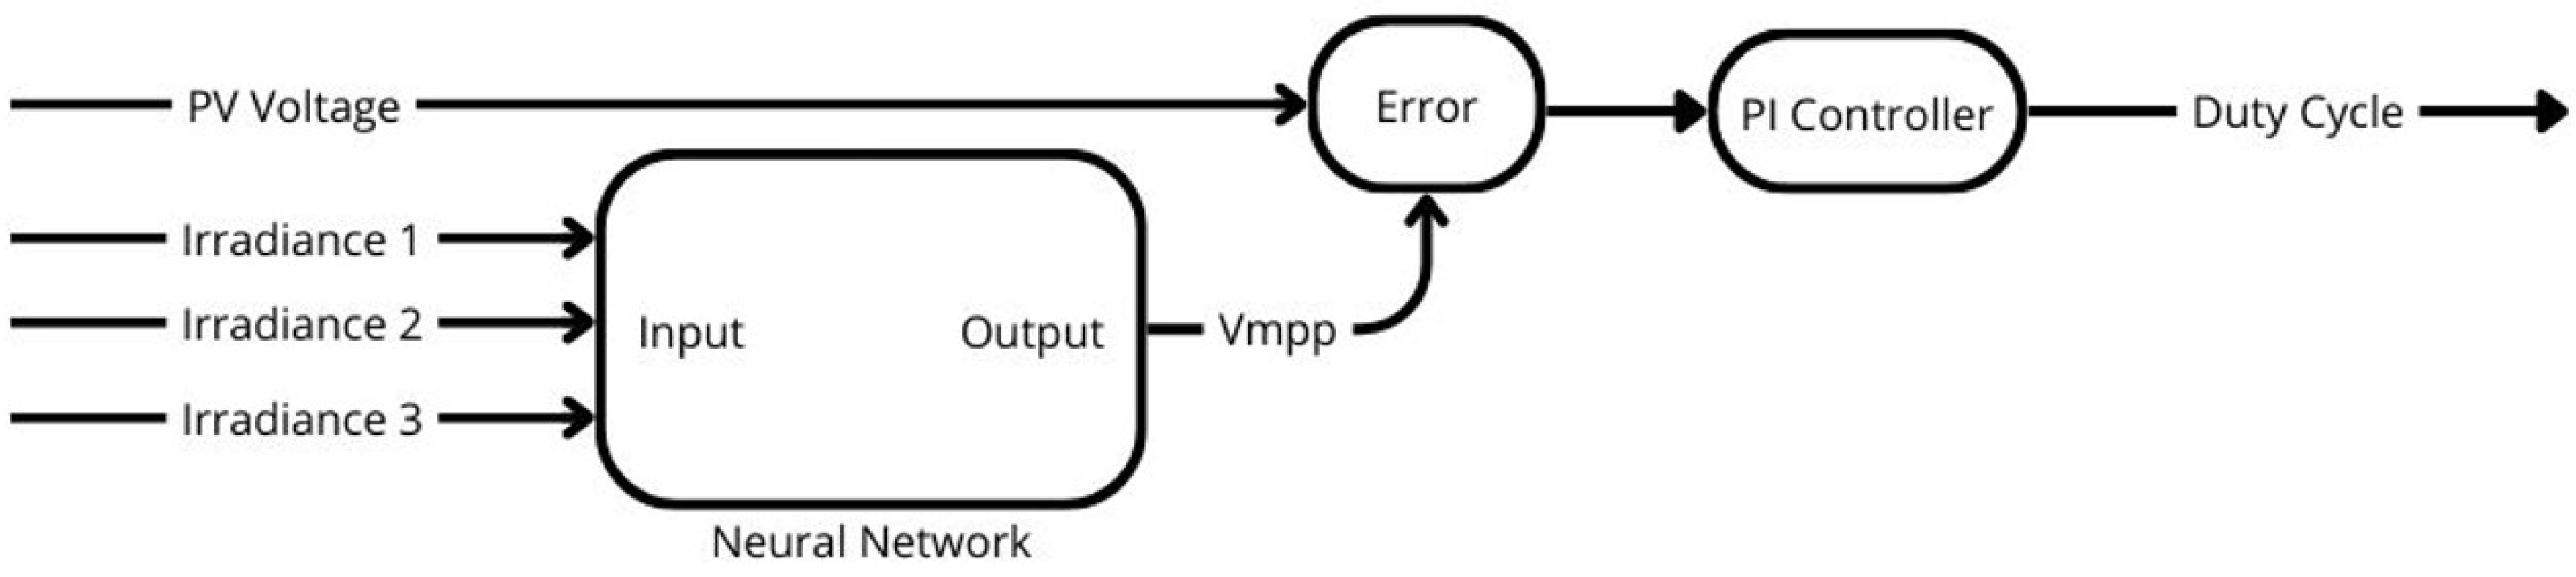
Figure 29.
Solar Irradiance (a) and Temperature (b) data used for training
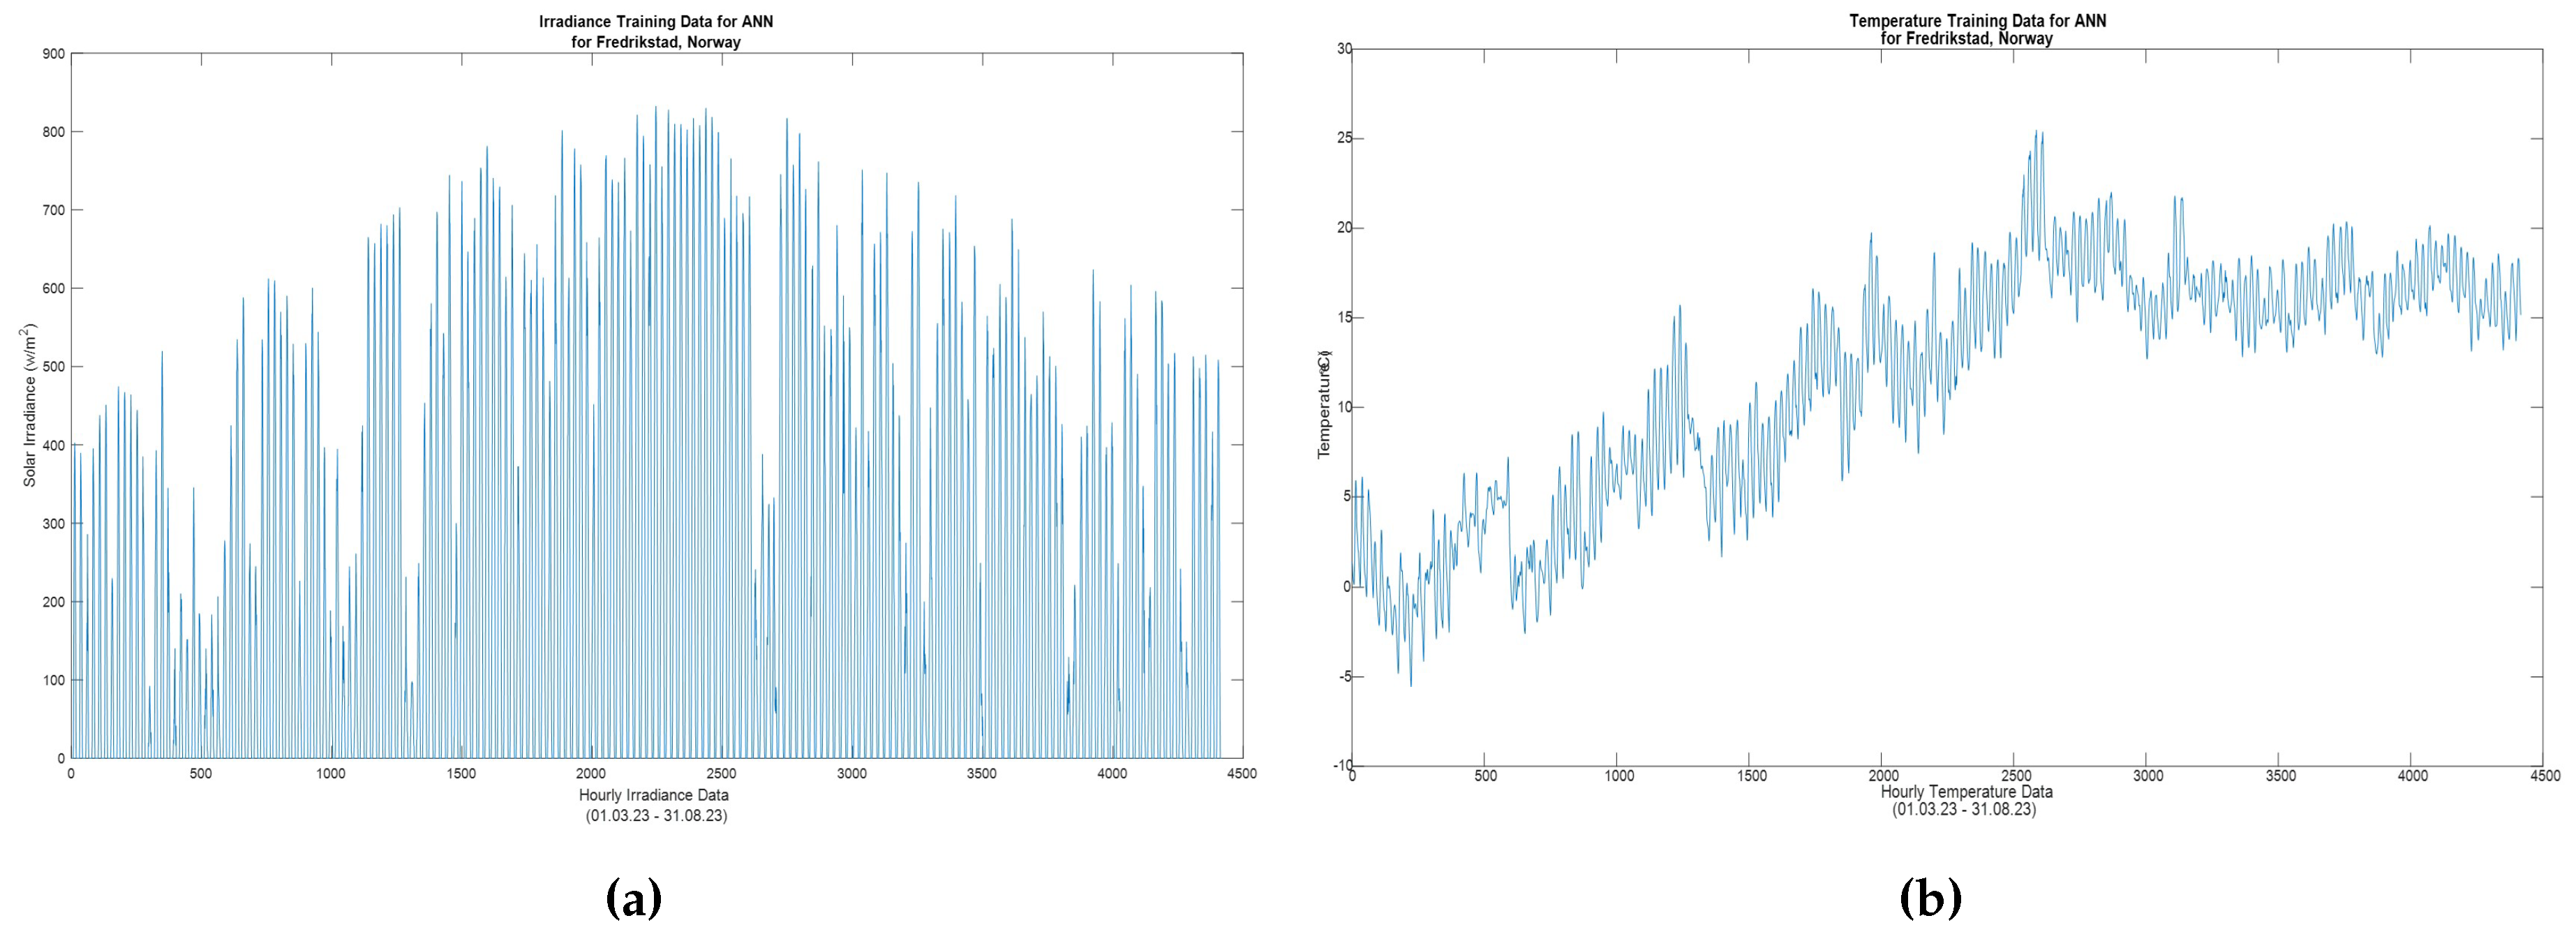
Figure 30.
Regression Plots for ANN(1) (a), and ANN(2) (b).
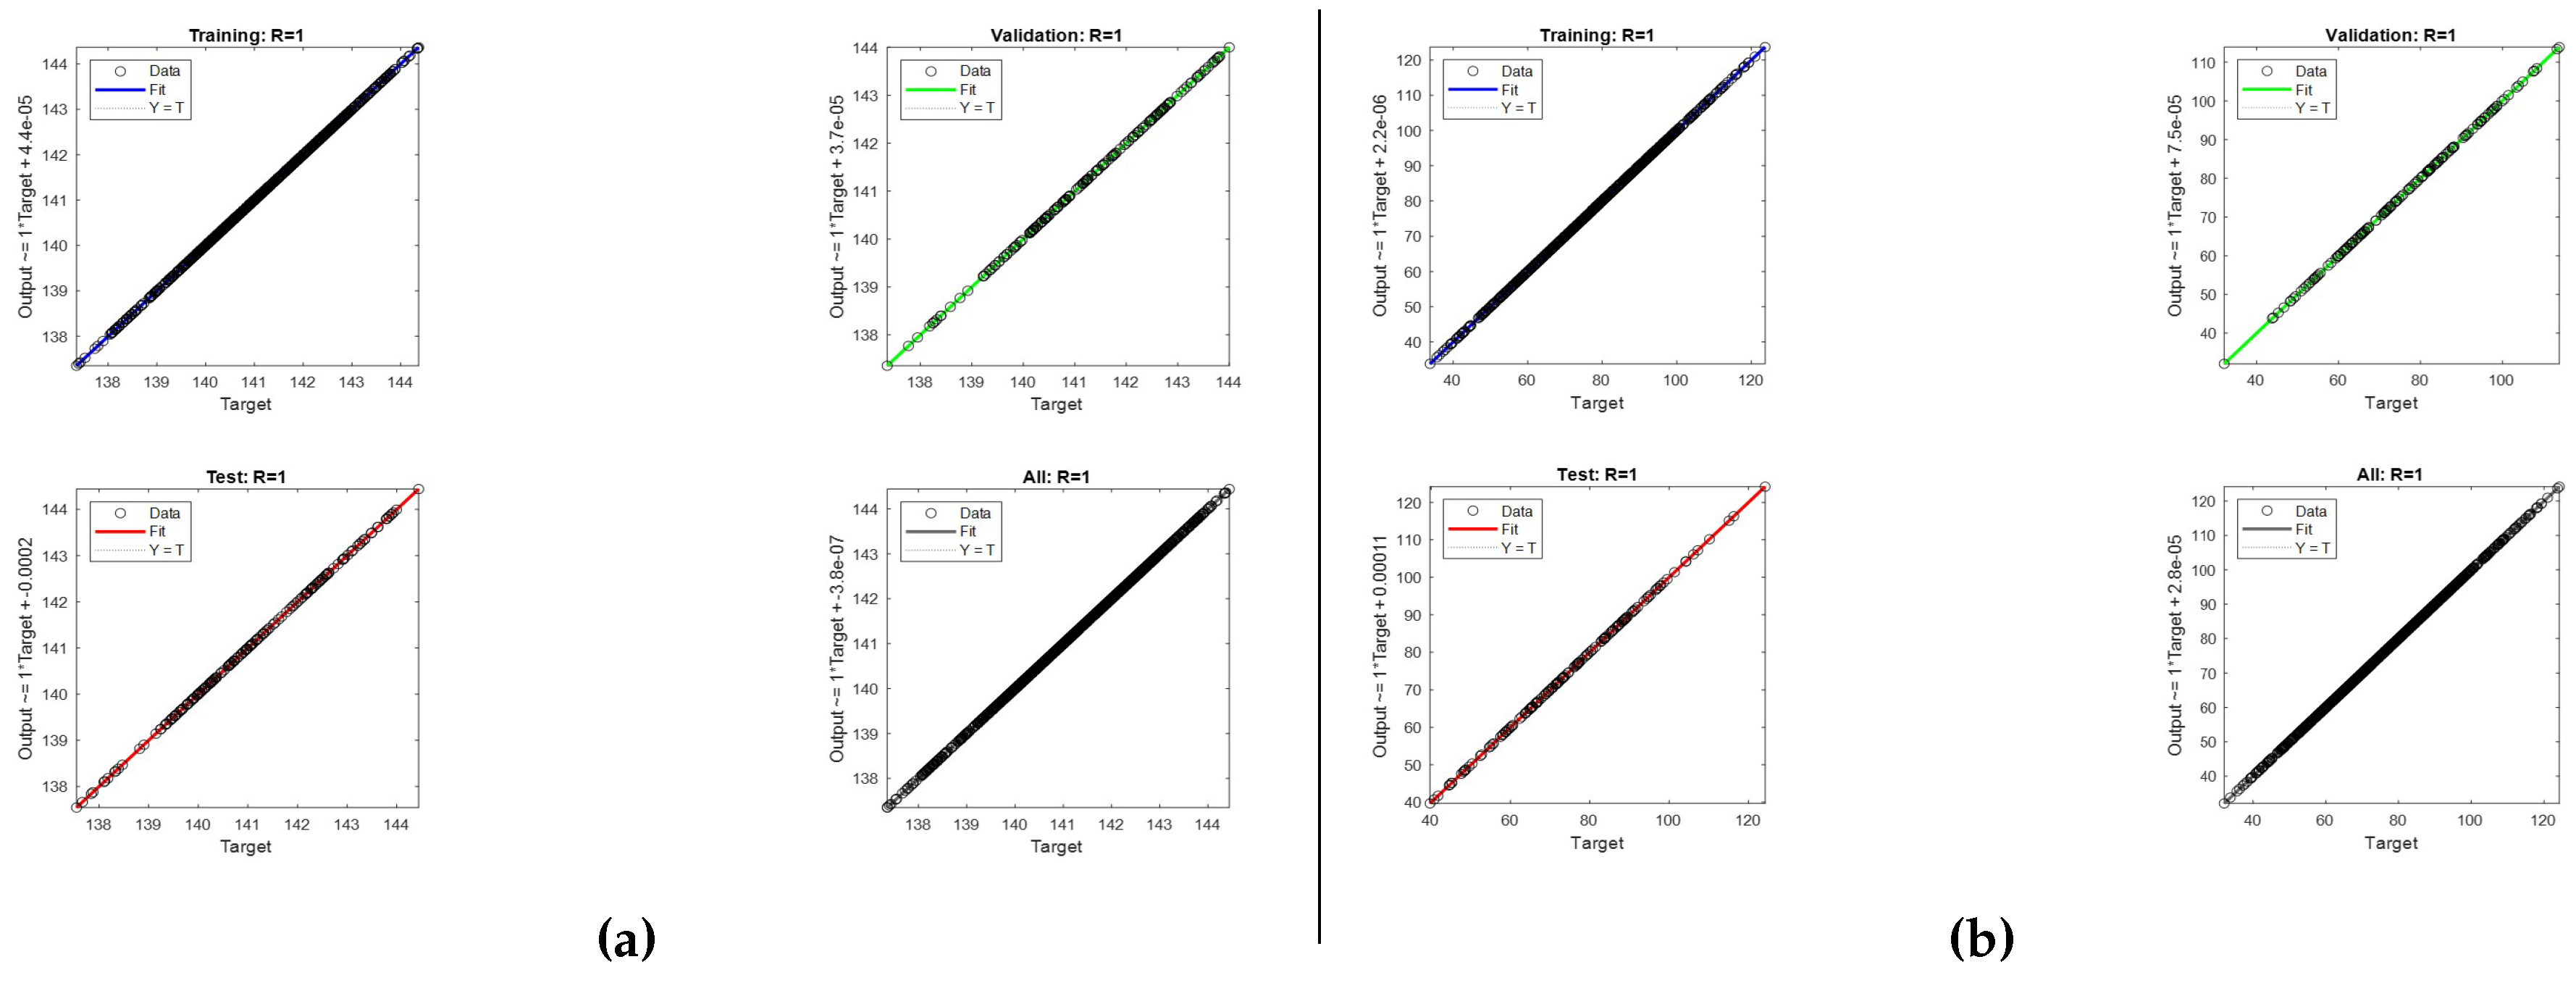
Figure 31.
Performance Plots for ANN(1) (a), and ANN(2) (b).
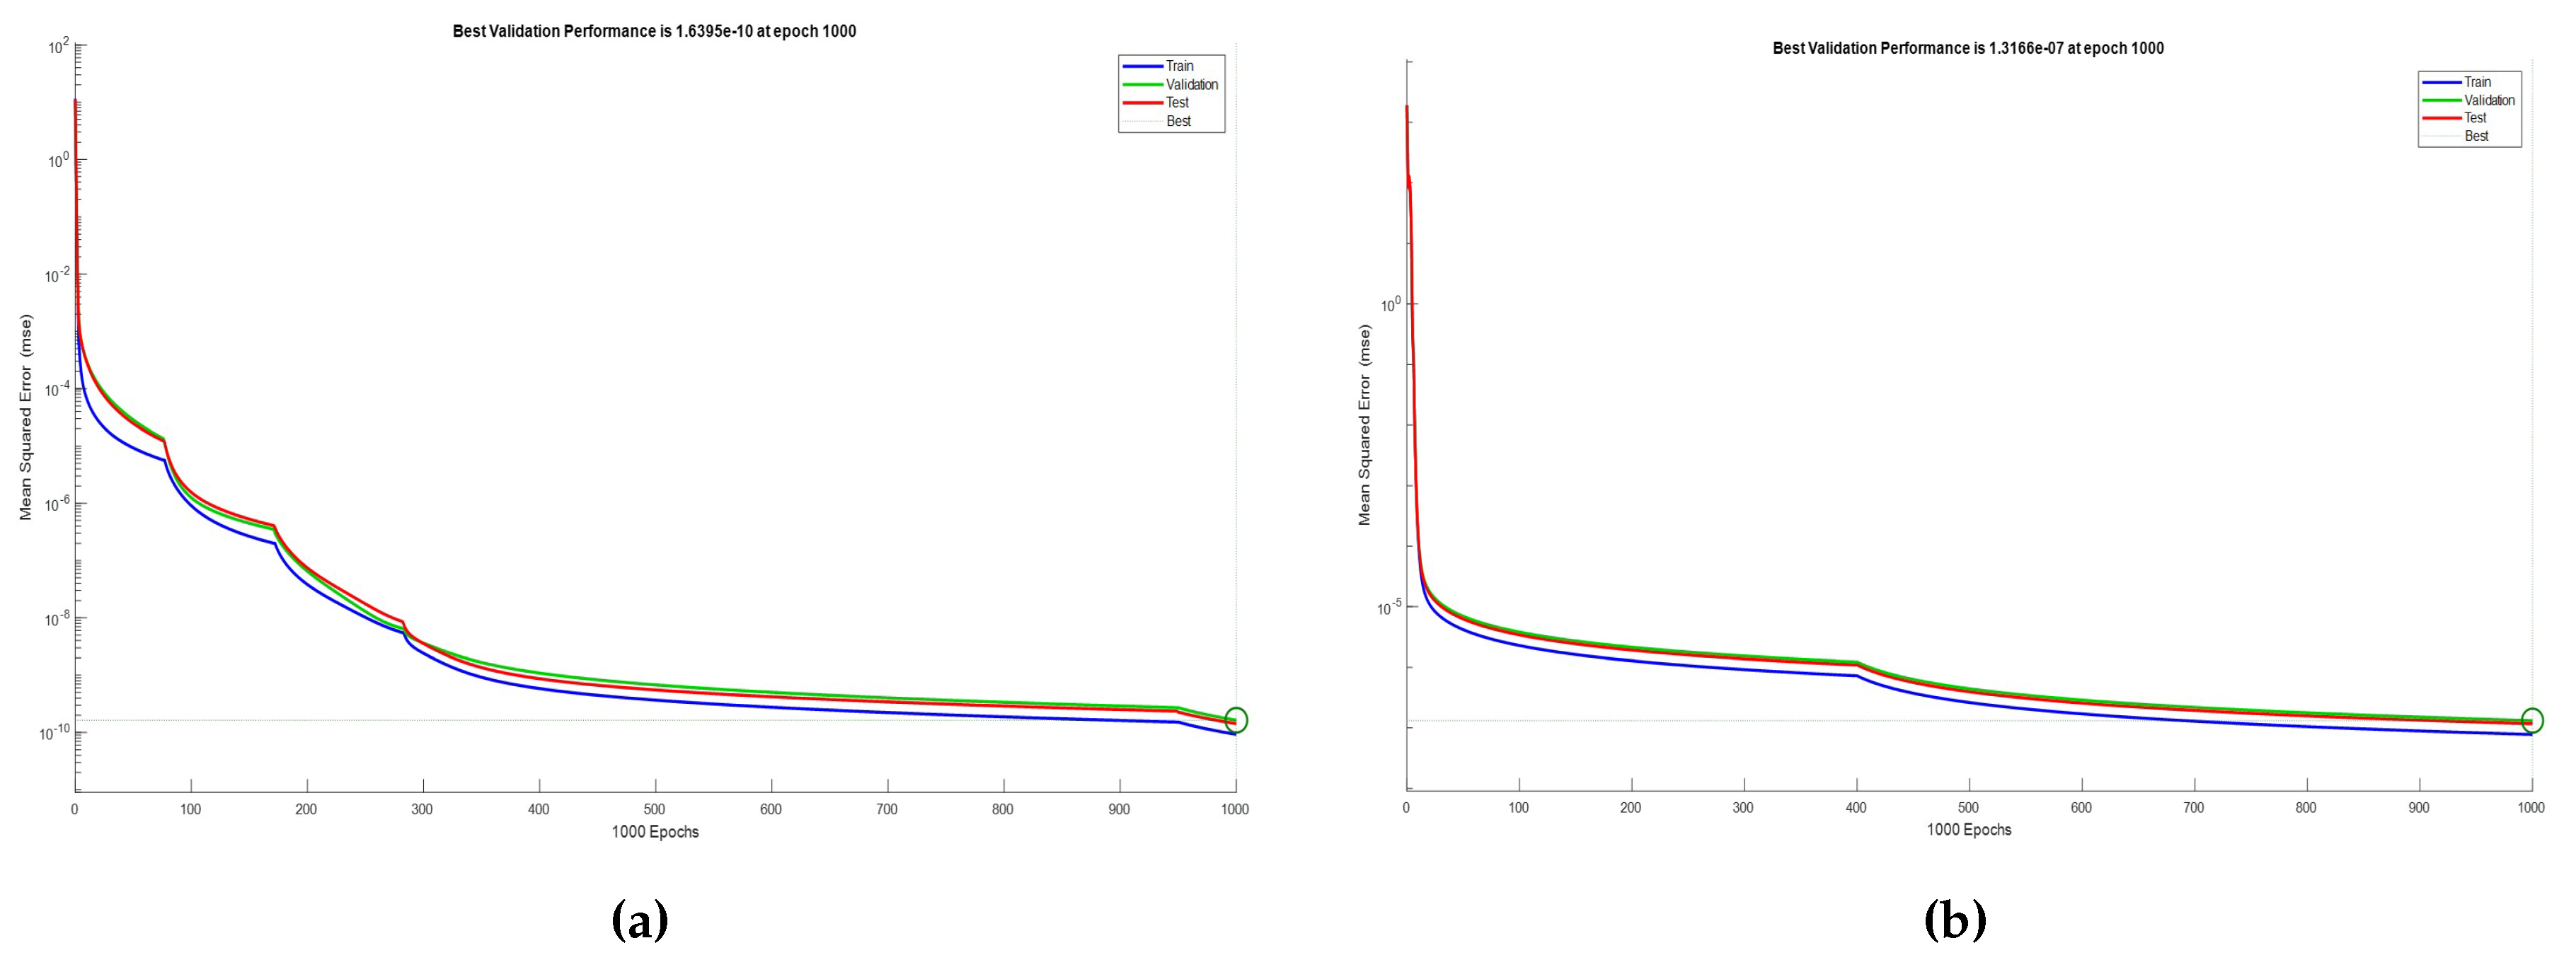
Figure 32.
Error Histogram Plots for ANN(1) (a), and ANN(2) (b).
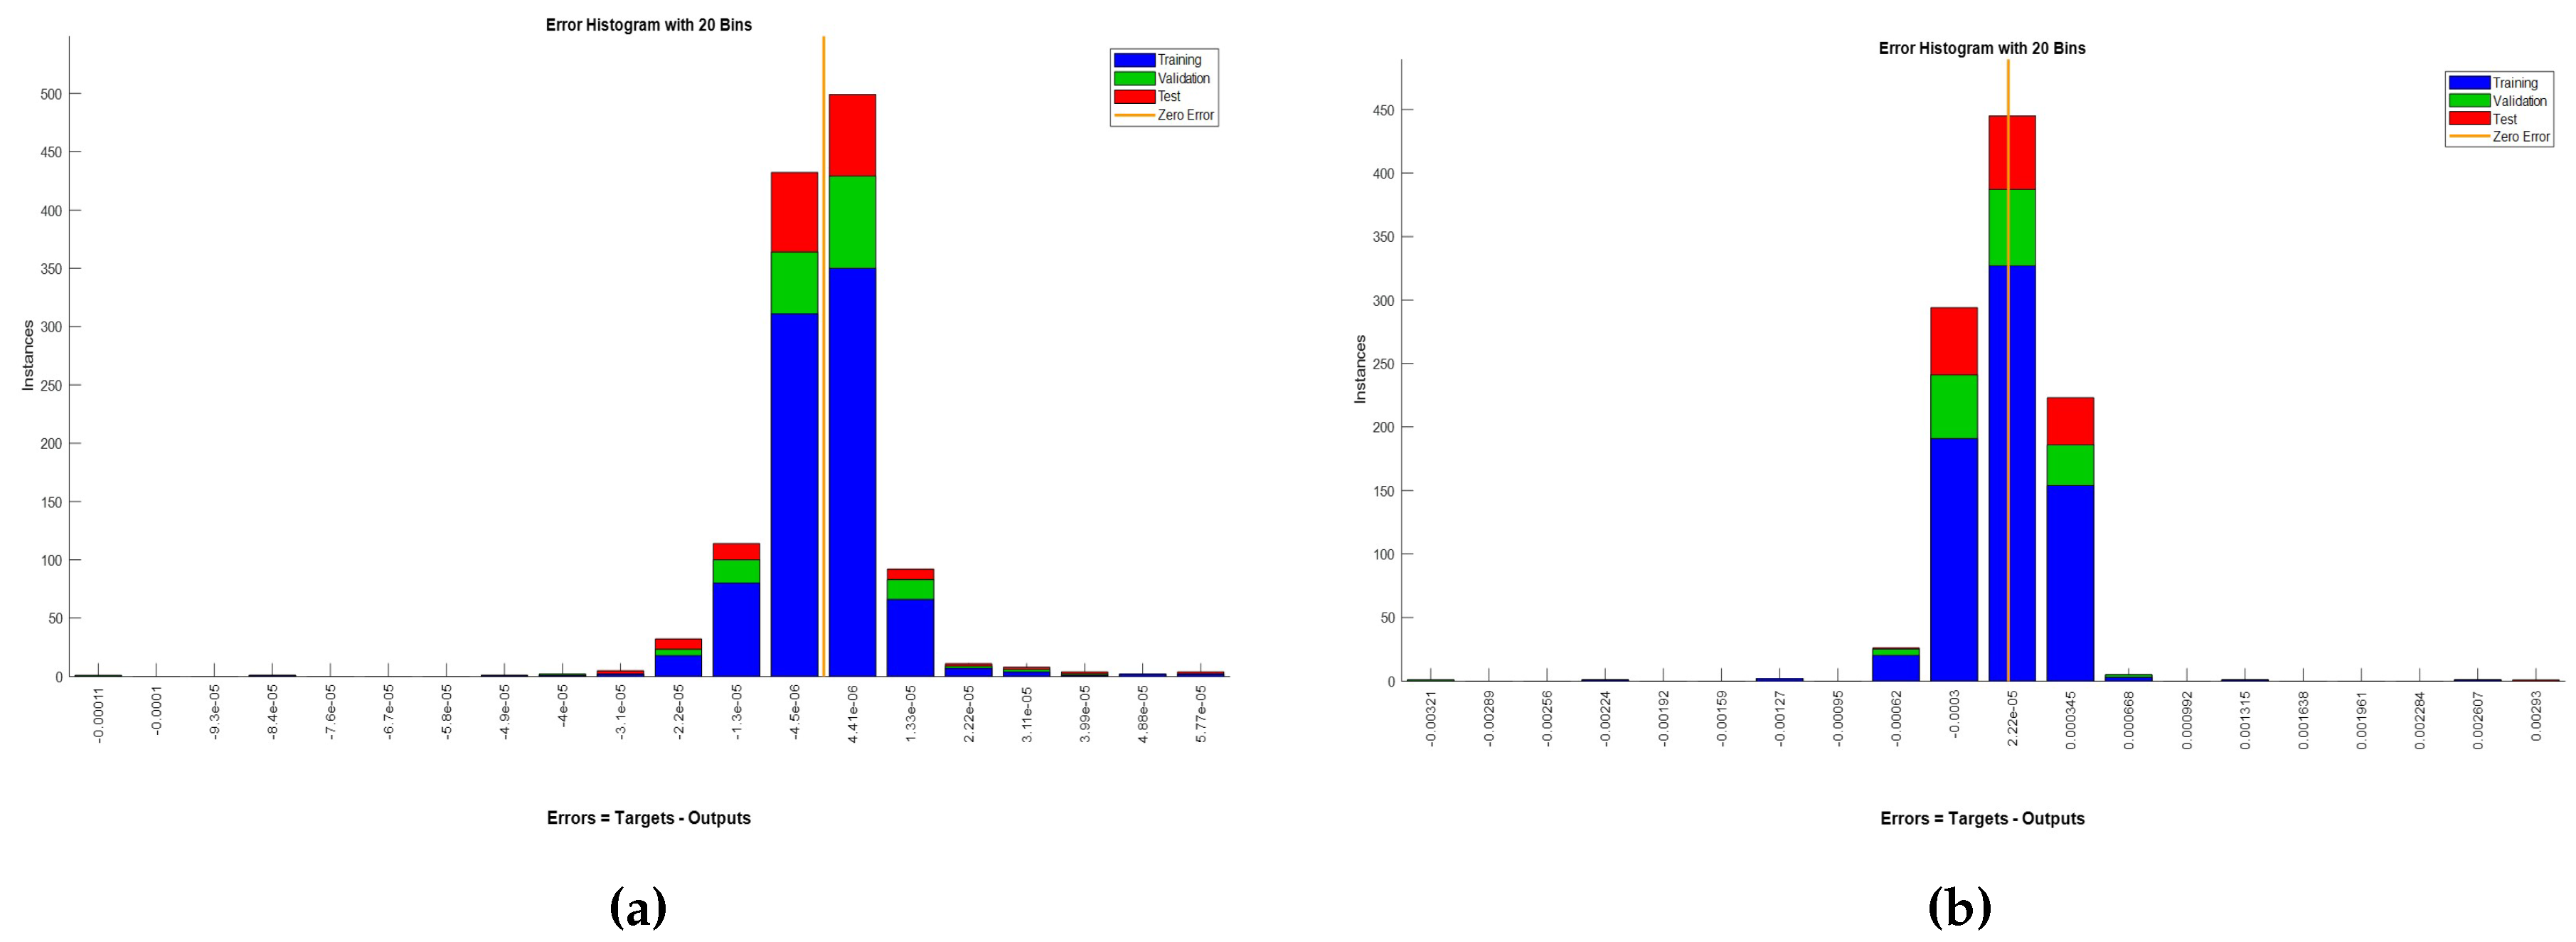
Figure 33.
Comparison of the maximum (a) and the average (b) power for shading scenario 1.
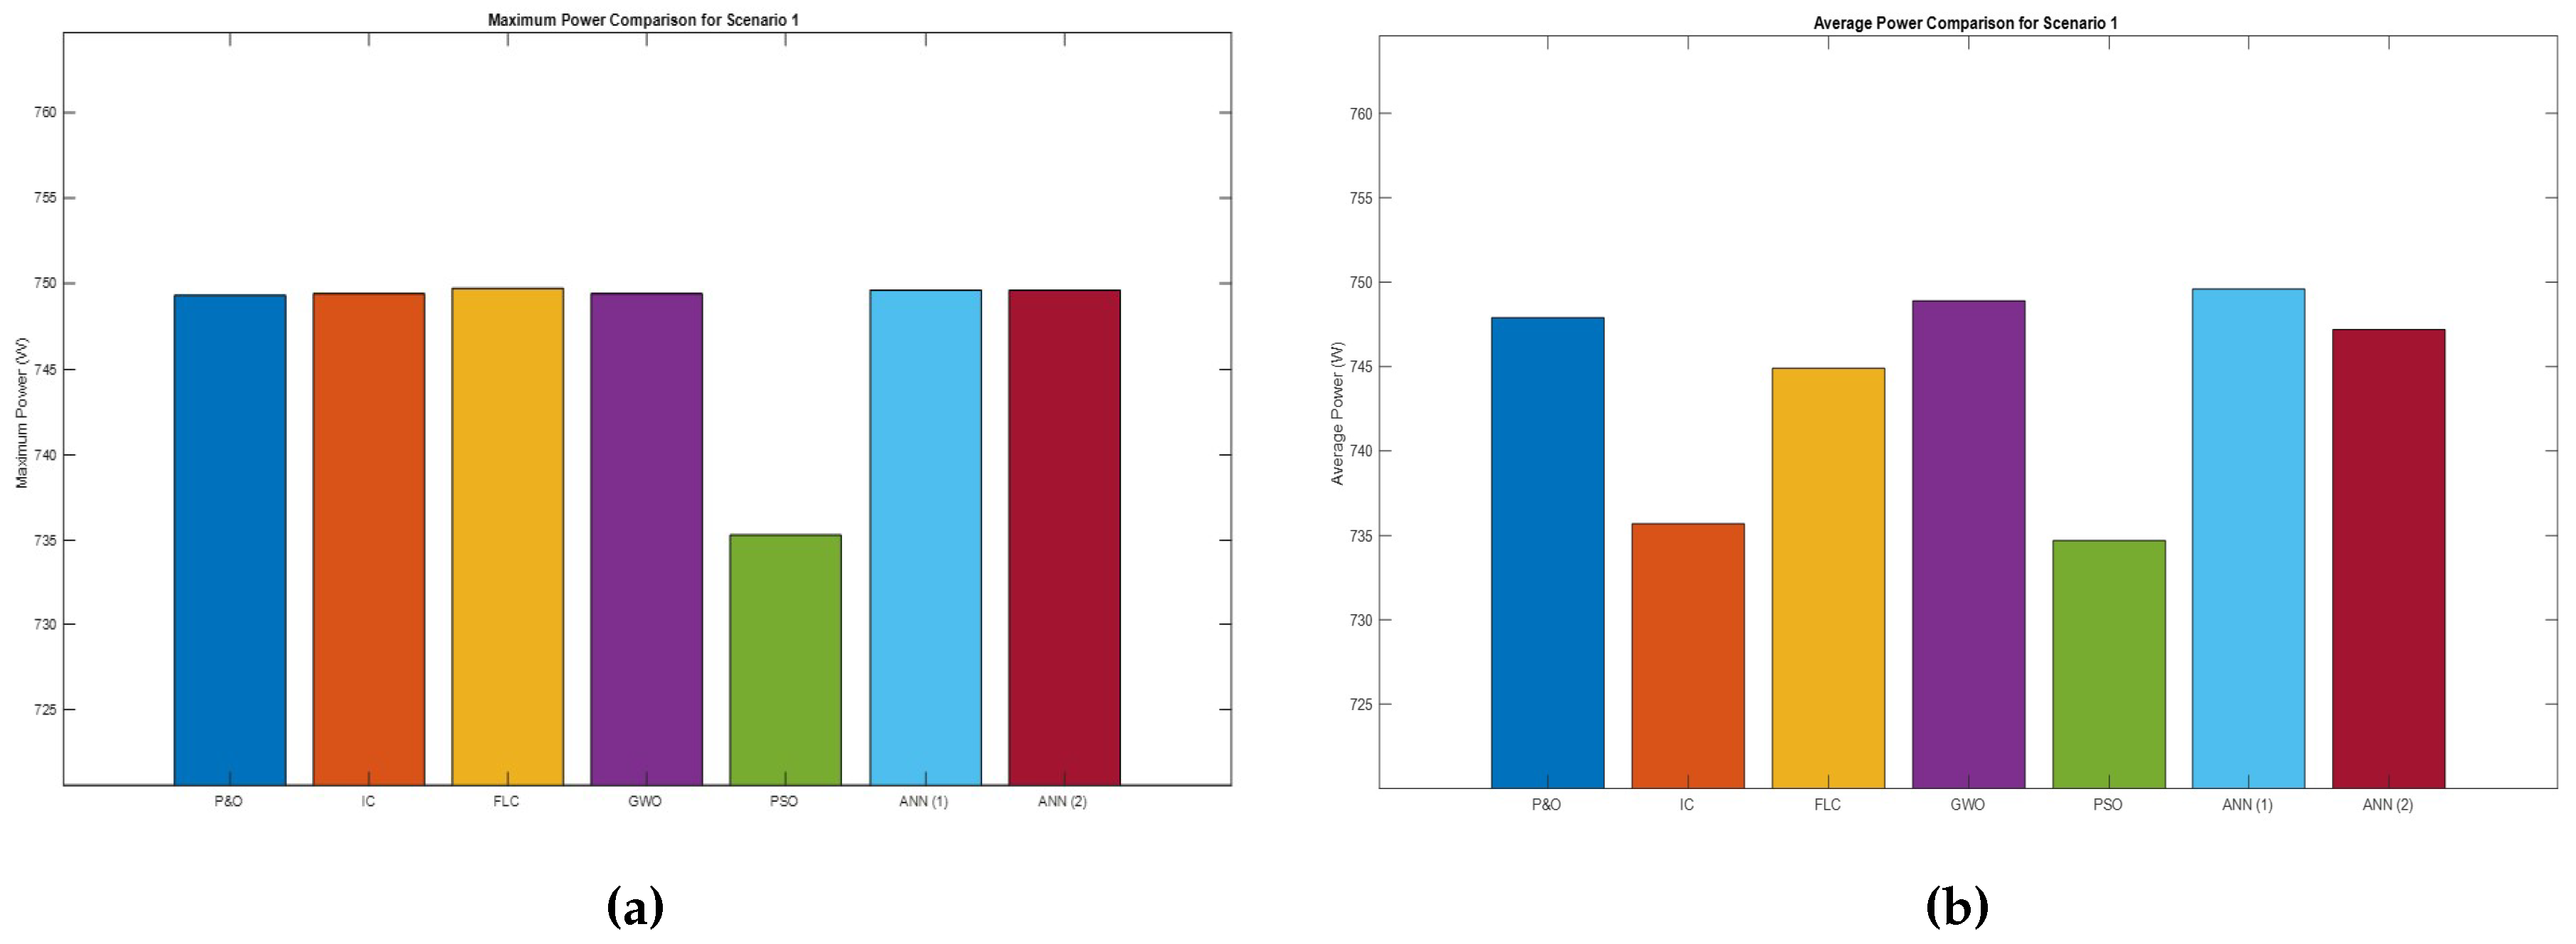
Figure 34.
Comparison of the average power (a) and the settling time (b) for shading scenario 1.
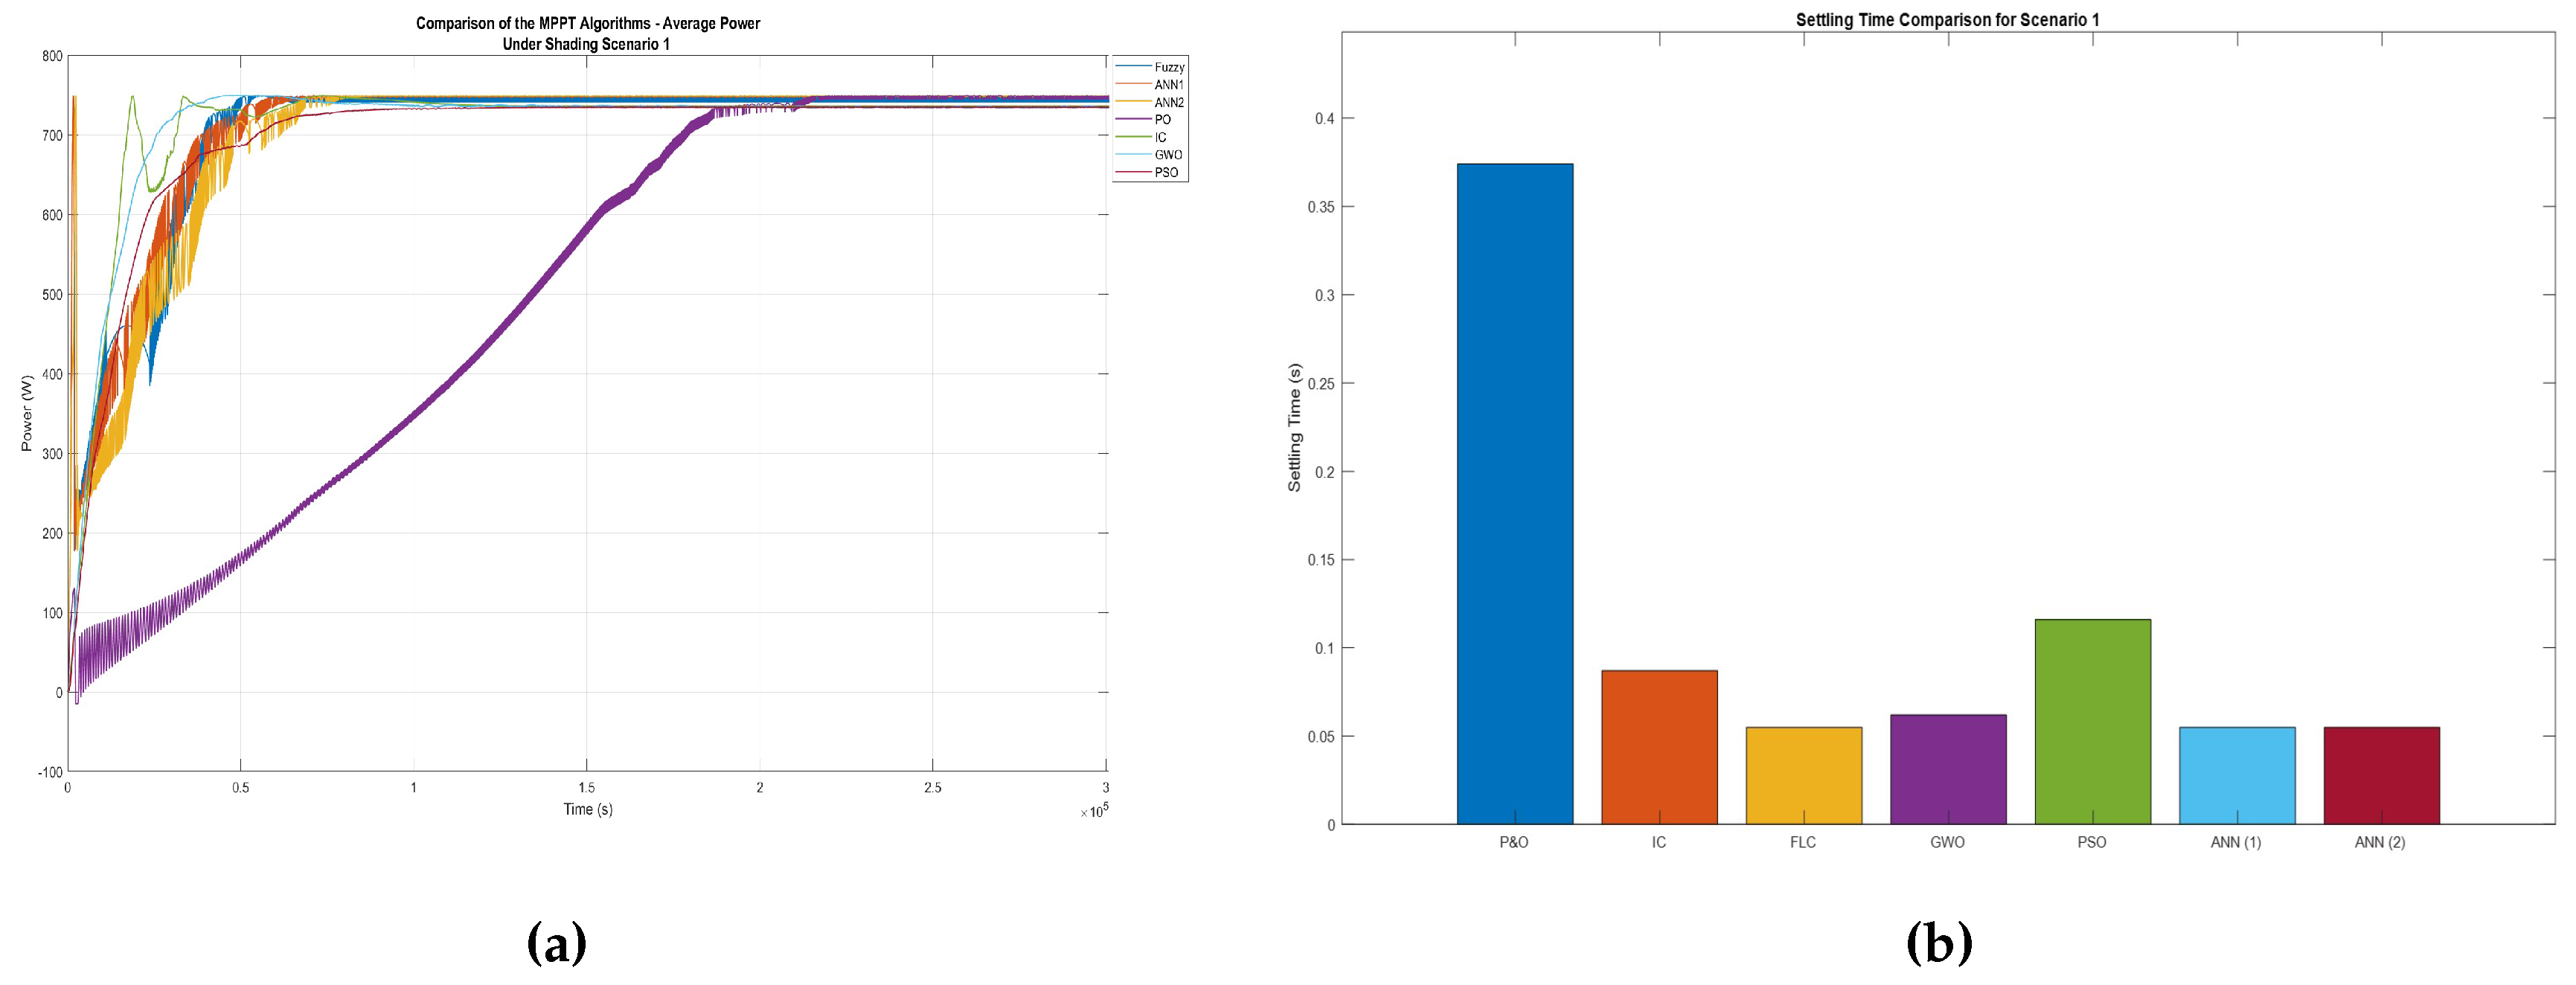
Figure 35.
Comparison of the MPPT efficiencies for shading scenario 1.
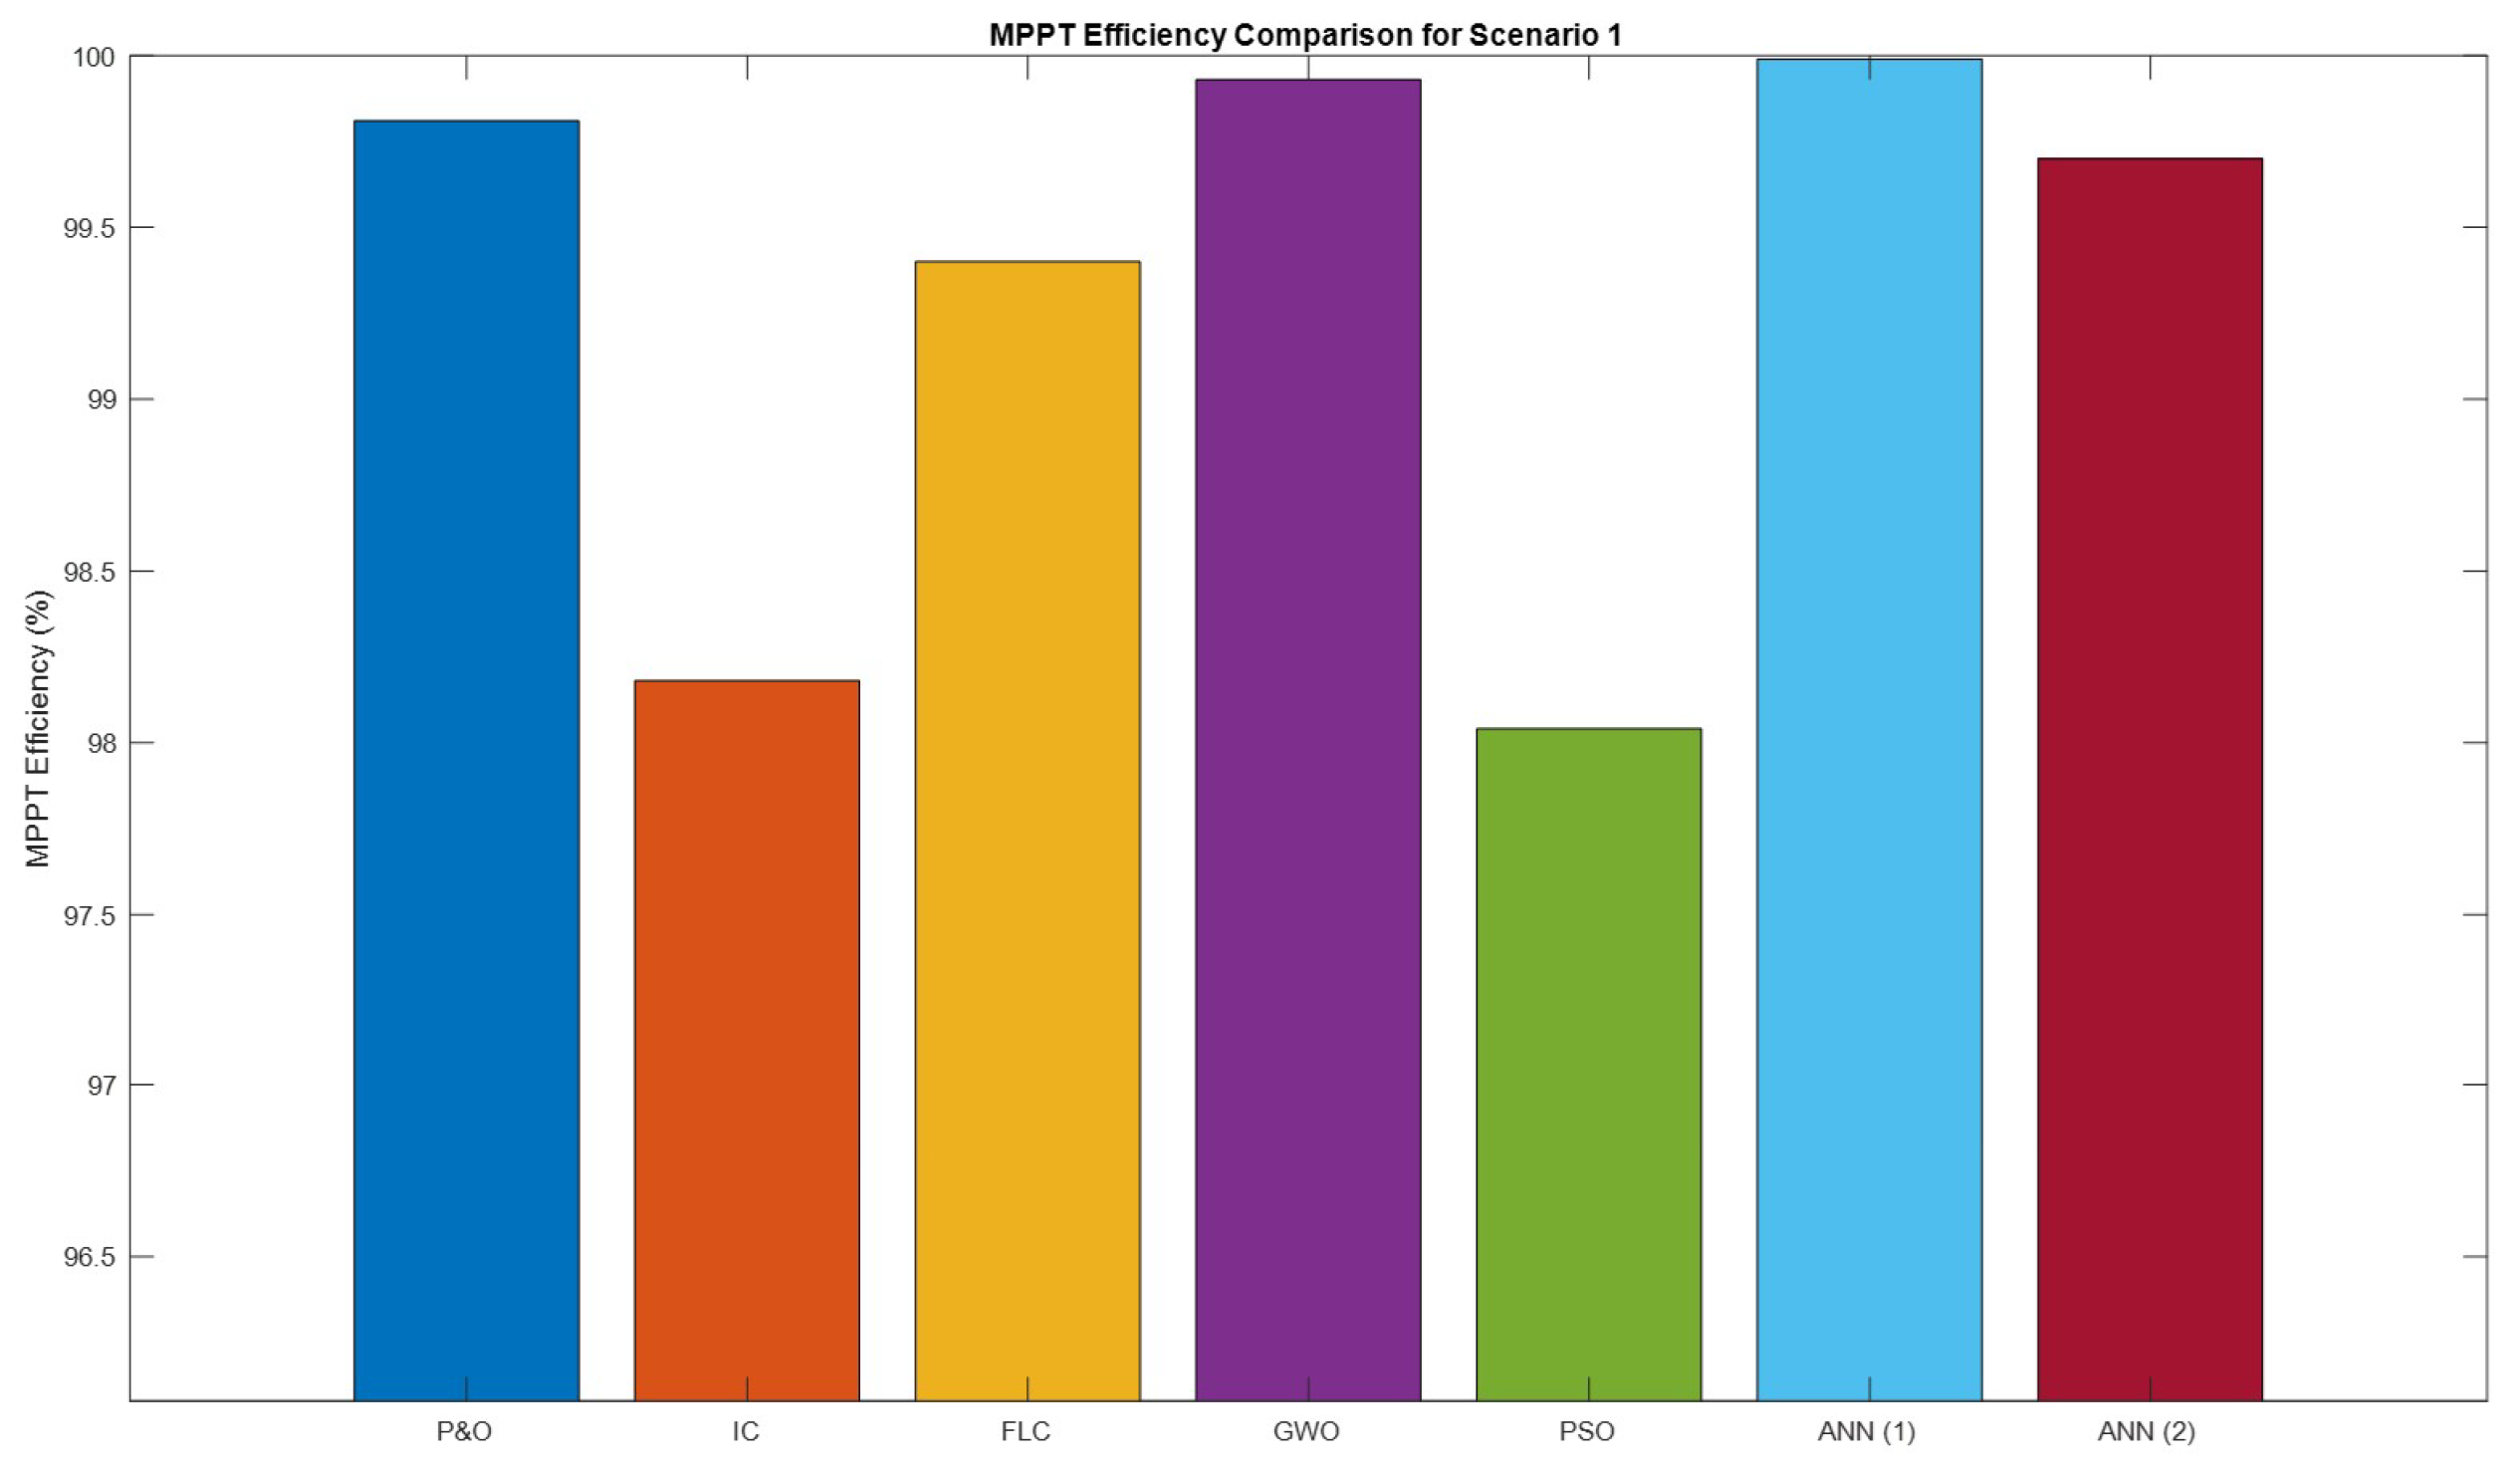
Figure 36.
Comparison of the maximum power (a) and the average power (b) for shading scenario 2-5.
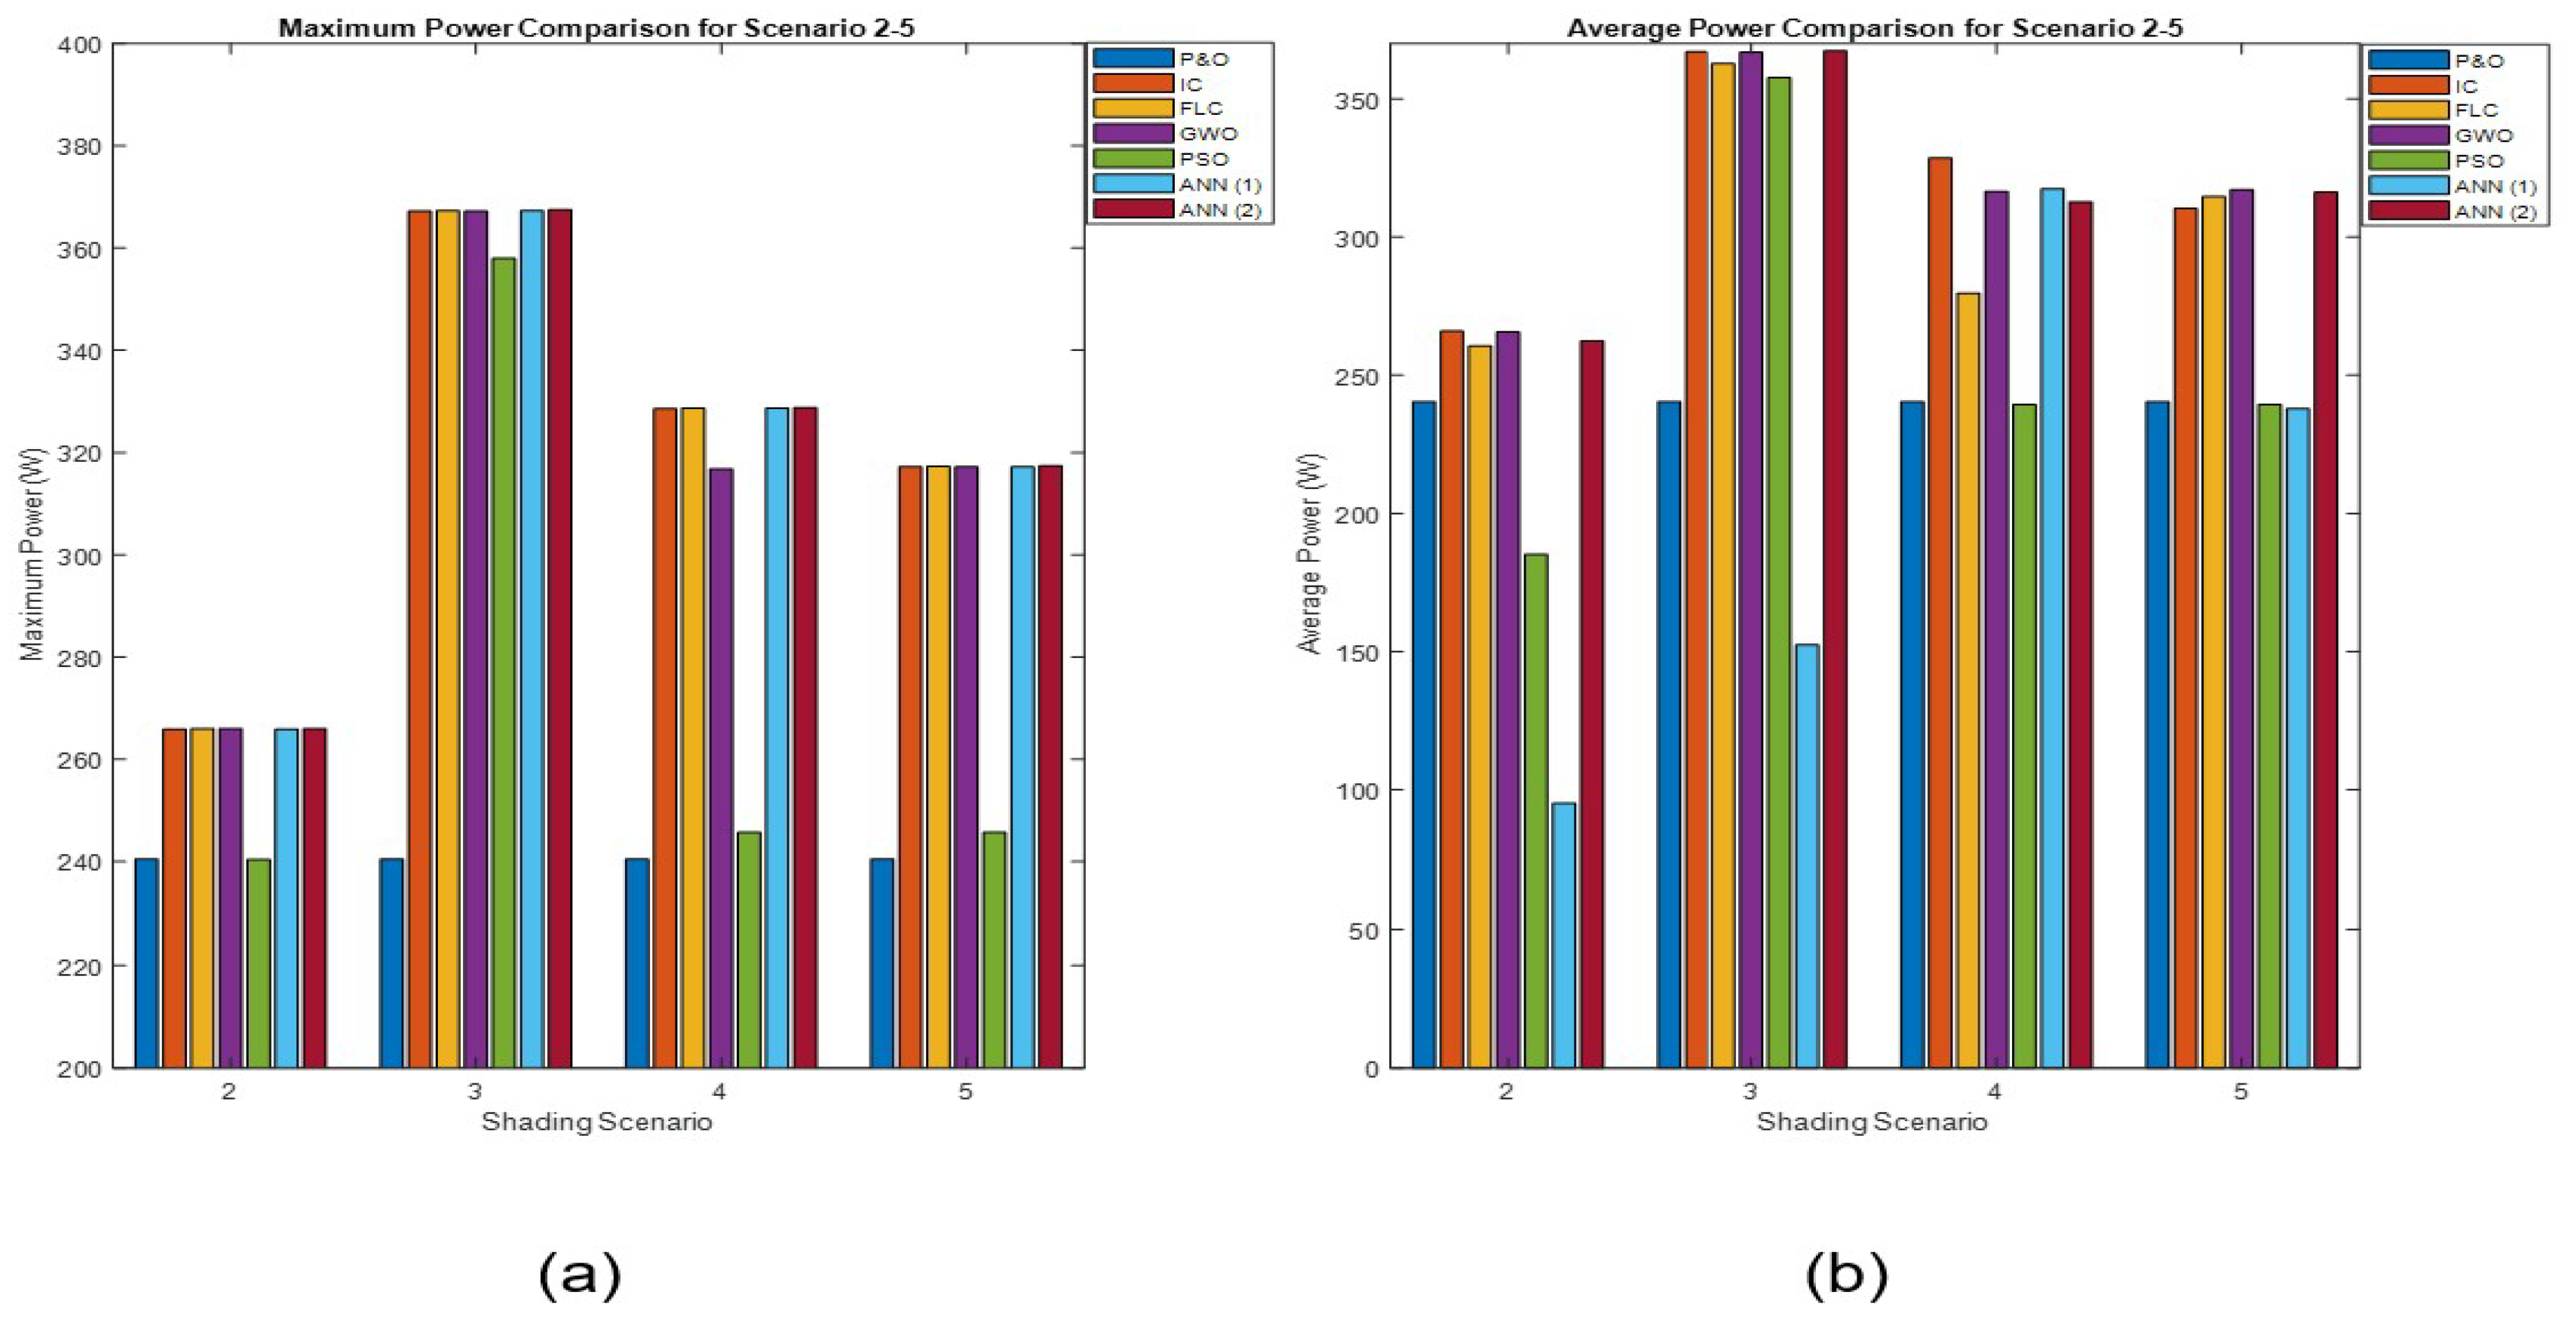
Figure 37.
Comparison of the settling time for shading scenario 2-5.
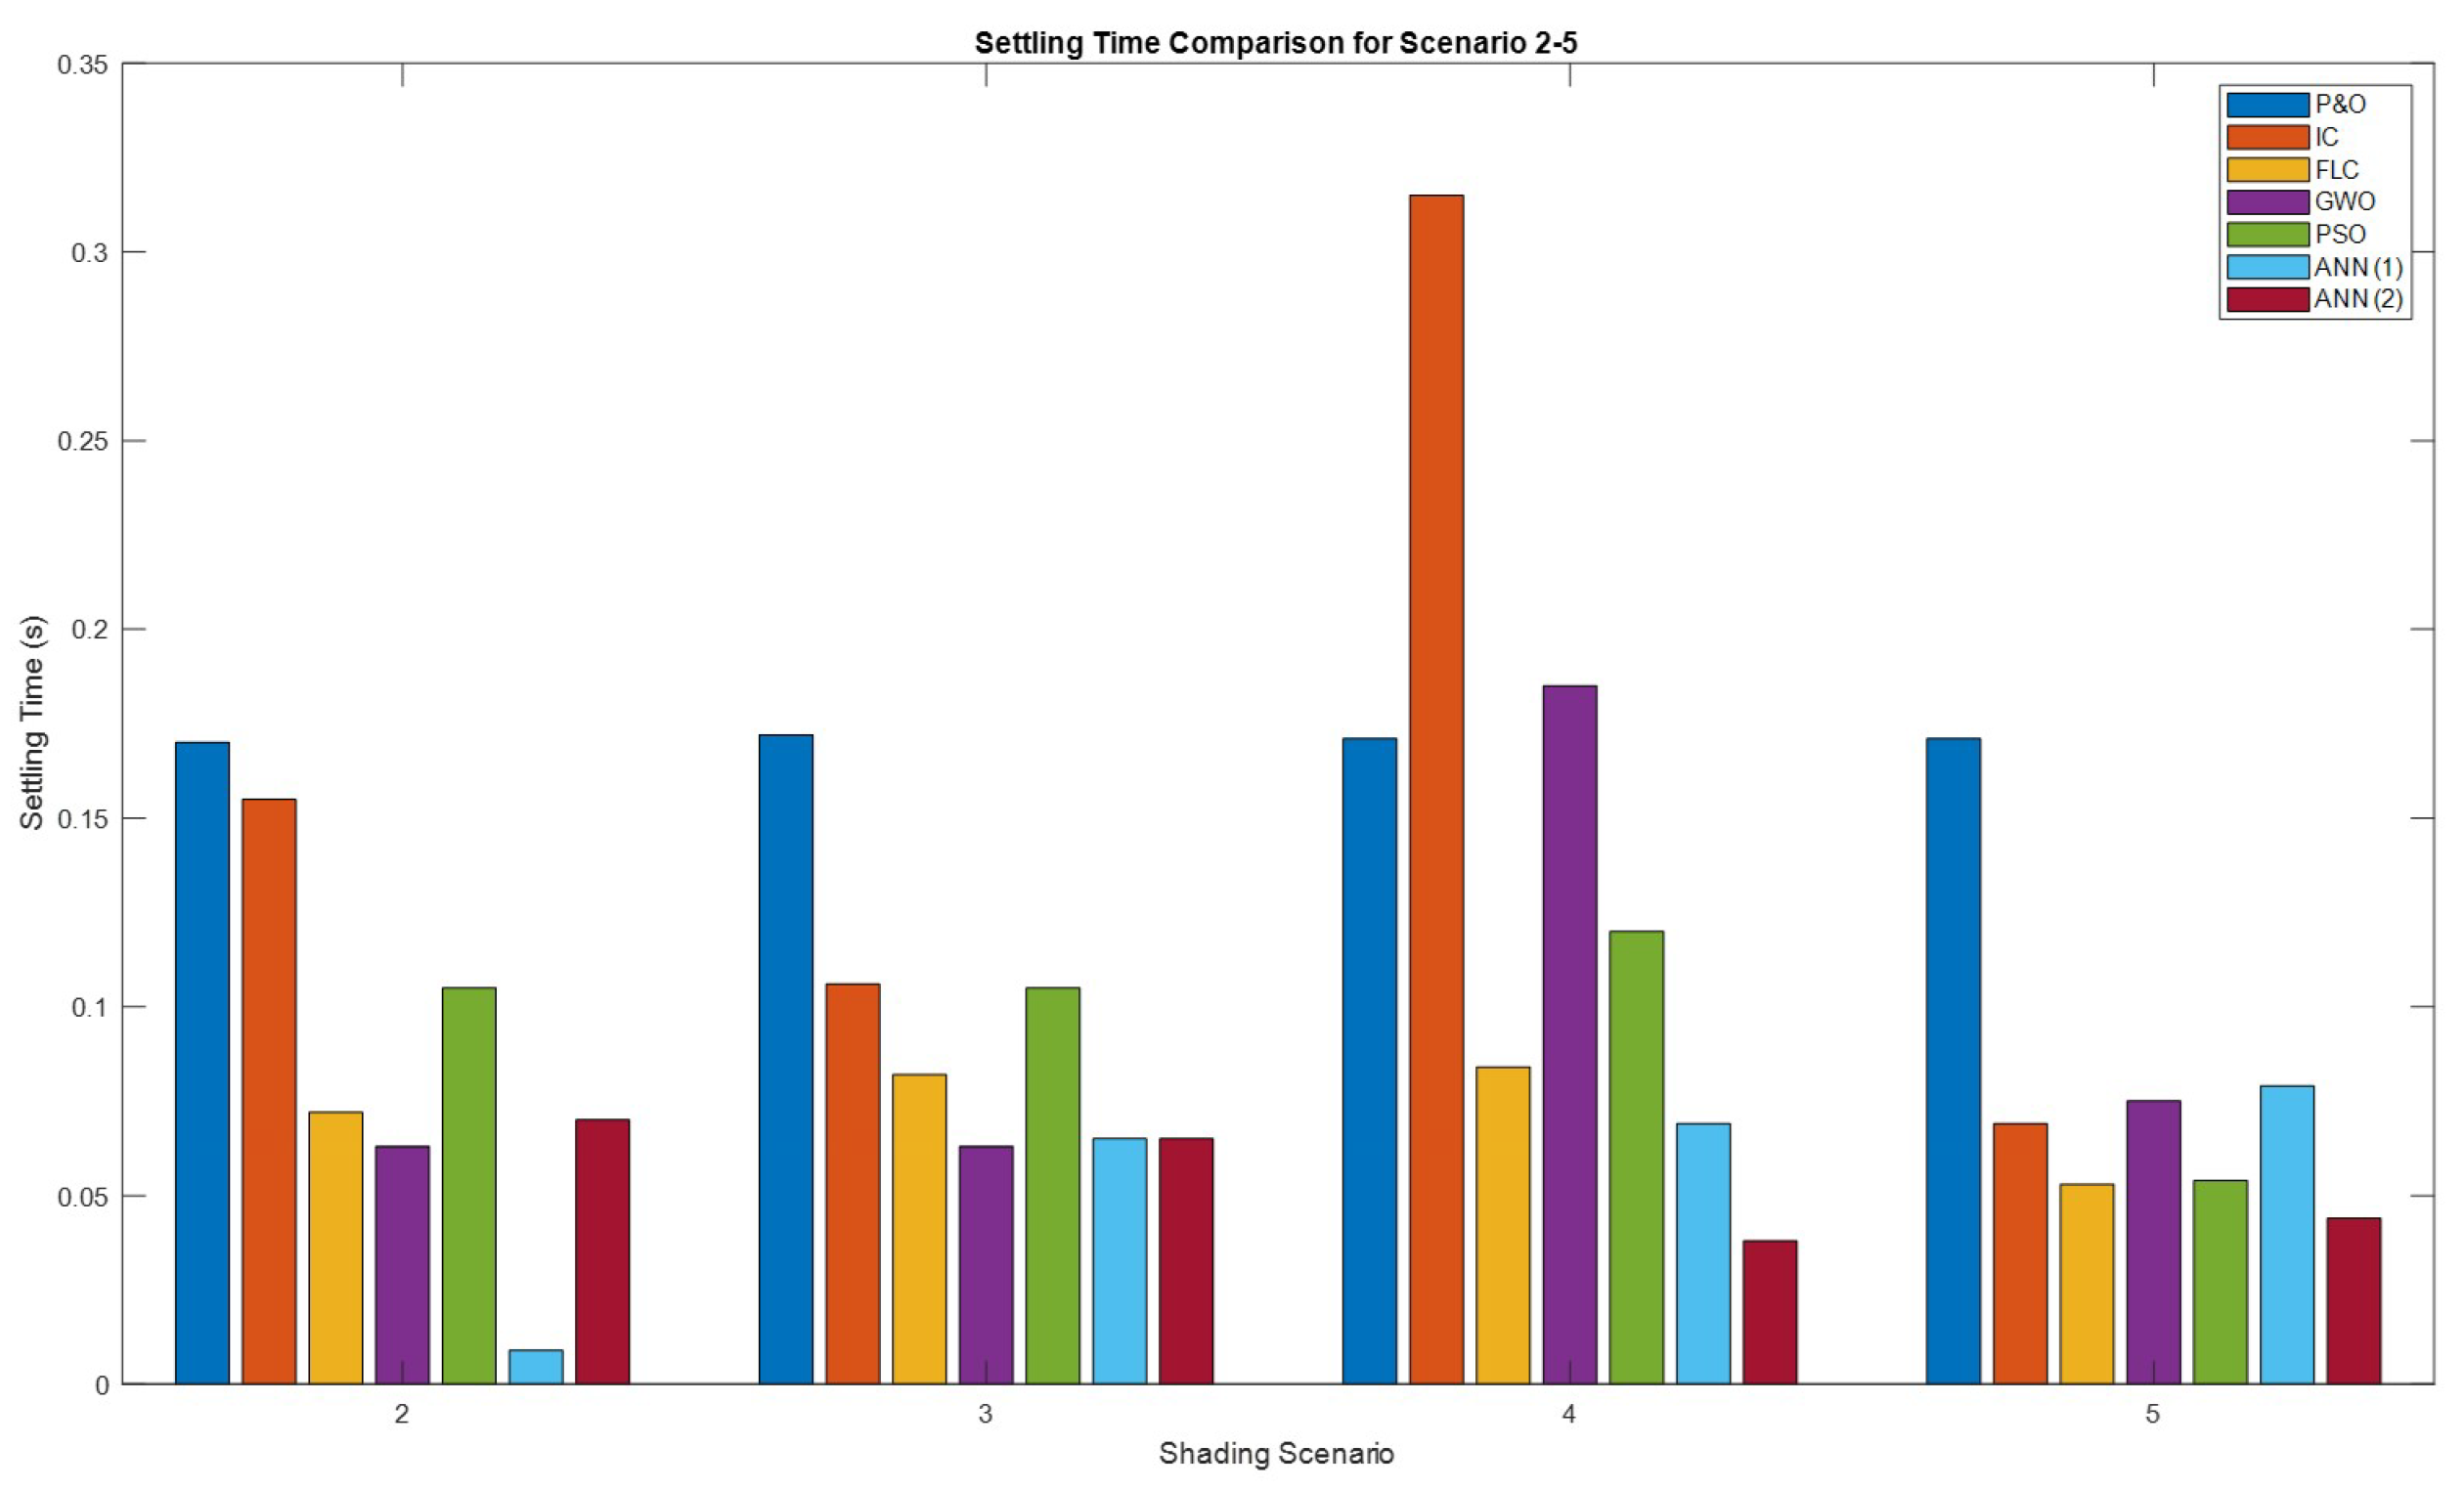
Figure 38.
Comparison of the MPPT efficiencies for shading scenario 2-5.
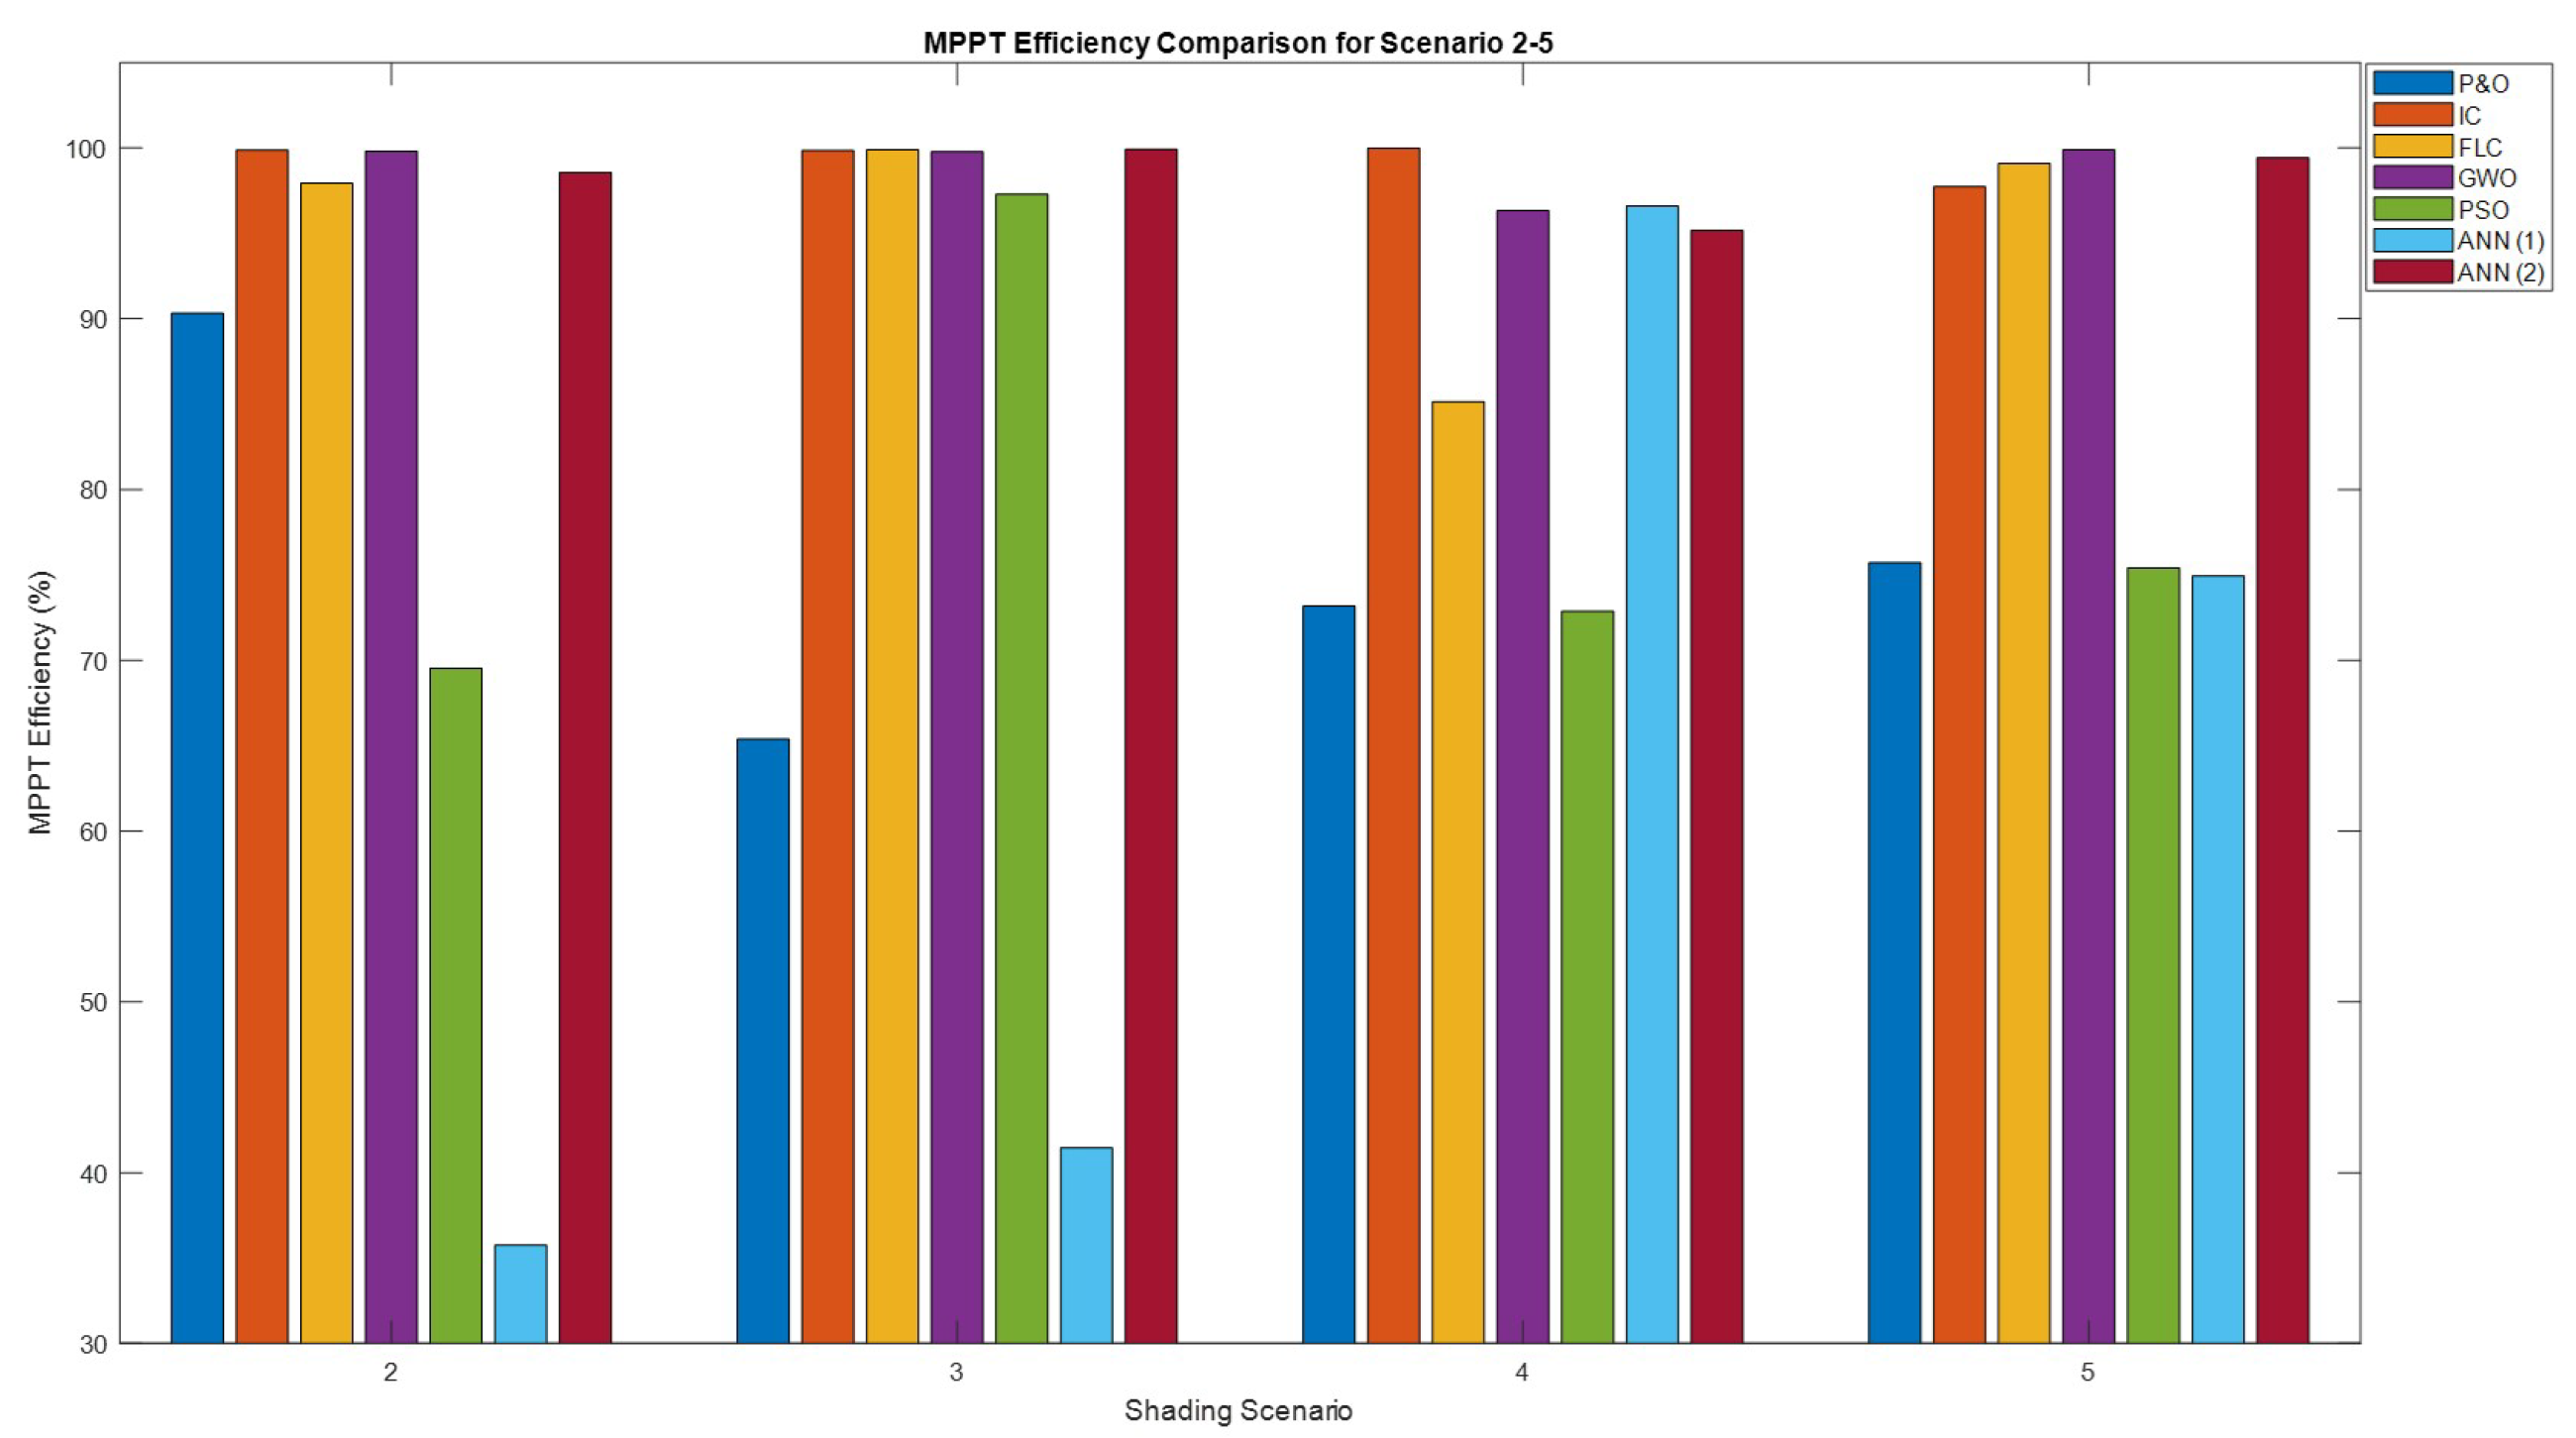

Table 1.
Module data for Sunpower SPR-X20-250-BLK.
| Parameters | Symbols | Values |
|---|---|---|
| Maximum Power (W) | PMPP | 249.952 |
| Cells Per Module | Ncell | 72 |
| Open Circuit Voltage (V) | VOC | 50.93 |
| Short-Circuit Current (A) | ISC | 6.2 |
| Voltage at Maximum Power Point (V) | VMP | 42.8 |
| Current at Maximum Power Point (A) | IMP | 5.84 |
| Temperature Coefficient of VOC (%/C) | KOC | -0.291 |
| Temperature Coefficient of ISC (%/C) | KSC | 0.013306 |
Table 2.
Model parameters for Sunpower SPR-X20-250-BLK.
| Parameters | Symbols | Values |
|---|---|---|
| Light-Generated Current (A) | IL | 6.2119 |
| Diode Saturation Current (A) | I0 | 1.3593e-11 |
| Diode Ideality Factor | n | 1.0262 |
| Shunt Resistance () | Rsh | 420.5449 |
| Series Resistance () | Rs | 0.37748 |
Table 3.
Model parameters for Boost Converter and Load.
| Parameters | Symbols | Values |
|---|---|---|
| Input Filter Capacitor (mF) | 1 | |
| Output Filter Capacitor (µF) | 32.27 | |
| Boost Inductor (mH) | L | 1.1478 |
| Switching Frequency (kHz) | 5 | |
| Resistive Load () | R | 100 |
Table 4.
Solar Irradiance Scenarios.
| Shading Scenario | Irradiance 1 (W/m) | Irradiance 2 (W/m) | Irradiance 3 (W/m) |
|---|---|---|---|
| 1 | 1000 | 1000 | 1000 |
| 2 | 100 | 500 | 1000 |
| 3 | 1000 | 700 | 200 |
| 4 | 400 | 1000 | 600 |
| 5 | 1000 | 600 | 300 |
Table 5.
Rules Table.
| Rule Number | Rule | Weight | Name |
|---|---|---|---|
| 1 | If in1 is in1cluster1 and in2 is in2cluster1 and in3 is in3cluster1 then out1 is out1cluster1 | 1 | rule1 |
| 2 | If in1 is in1cluster2 and in2 is in2cluster2 and in3 is in3cluster2 then out1 is out1cluster2 | 1 | rule2 |
| 3 | If in1 is in1cluster3 and in2 is in2cluster3 and in3 is in3cluster3 then out1 is out1cluster3 | 1 | rule3 |
| 4 | If in1 is in1cluster4 and in2 is in2cluster4 and in3 is in3cluster4 then out1 is out1cluster4 | 1 | rule4 |
| 5 | If in1 is in1cluster5 and in2 is in2cluster5 and in3 is in3cluster5 then out1 is out1cluster5 | 1 | rule5 |
Table 6.
Training data for the ANN(2) model.
| Irradiance Panel 1 (W/m) | Irradiance Panel 2 (W/m) | Irradiance Panel 3 (W/m) | Maximum Voltage Output (V) |
|---|---|---|---|
| 723.4451 | 979.4541 | 258.5401 | 83.9496 |
| 264.0207 | 213.7384 | 271.5827 | 32.0705 |
| 393.8638 | 958.1213 | 721.5790 | 88.7485 |
| 818.9435 | 494.9419 | 589.5526 | 81.4671 |
| 622.9487 | 208.0732 | 82.3322 | 71.1911 |
| 942.3752 | 751.3258 | 933.0167 | 112.4235 |
| 543.0011 | 984.4322 | 510.6935 | 87.2318 |
| 895.8498 | 972.5006 | 117.2215 | 108.3409 |
| 559.1643 | 328.7496 | 600.5573 | 63.7066 |
| 983.3986 | 344.9982 | 985.2885 | 99.0257 |
| 967.8675 | 652.4311 | 687.5626 | 106.3631 |
| 463.3094 | 709.8439 | 329.9017 | 99.9889 |
| 908.7390 | 791.5343 | 403.4721 | 90.0403 |
| 878.0810 | 344.8405 | 883.5706 | 74.8037 |
| 386.5441 | 967.2057 | 412.3786 | 87.8199 |
| 699.4323 | 710.9914 | 366.9940 | 76.0735 |
| 258.1459 | 877.6753 | 89.5023 | 89.5043 |
| 869.3686 | 632.0528 | 215.4435 | 73.4818 |
Table 7.
Performance evaluation of the MPPT algorithms.
| MPPT Algorithm | Settling Time | Response Time | Efficiency |
|---|---|---|---|
| P&O | Slow | Moderate | Low |
| IC | Very Slow | Moderate | High |
| FLC | Fast | Fast | High |
| GWO | Fast | Fast | High |
| PSO | Moderate | Moderate | Moderate |
| ANN(1) | Fast | Fast | Variable |
| ANN(2) | Fast | Very Fast | Very High |
Disclaimer/Publisher’s Note: The statements, opinions and data contained in all publications are solely those of the individual author(s) and contributor(s) and not of MDPI and/or the editor(s). MDPI and/or the editor(s) disclaim responsibility for any injury to people or property resulting from any ideas, methods, instructions or products referred to in the content. |
© 2024 by the authors. Licensee MDPI, Basel, Switzerland. This article is an open access article distributed under the terms and conditions of the Creative Commons Attribution (CC BY) license (http://creativecommons.org/licenses/by/4.0/).
Copyright: This open access article is published under a Creative Commons CC BY 4.0 license, which permit the free download, distribution, and reuse, provided that the author and preprint are cited in any reuse.


