Submitted:
10 June 2024
Posted:
11 June 2024
You are already at the latest version
Abstract
One of the main challenges in the treatment of industrial wastewater is the removal of oil-in-water emulsions, which are stable and therefore difficult to treat. Bacterial cellulose (BC) has structural characteristics that make it an ideal filtration membrane. The present study investigated the effectiveness of a BC membrane filtration system for the treatment of oily industrial wastewaters. The results demonstrated that BC is highly effective at removing oily contaminants (~99%), reducing the colour and particulate matter of wastewater, as well as eliminating nearly the entire microbiological load (~99%). SEM, MEV, FTIR, XRD, and TGA demonstrated the presence of oil in the interior of the membrane after filtration, characteristic peaks of its chemical composition, and a 40% reduction in crystallinity. TGA revealed an increase from three (pre-filtration) to five (post-filtration) stages of thermal degradation, indicating the retention of the contaminant in the BC. The mechanical tests demonstrated that the membrane has tensile strength of 72.13 ± 8.22 MPa and tolerated elongation of up to 21.11 ± 4.81% prior to tearing. The BC membrane also exhibited excellent flexibility, as it could be folded > 100 times at the same point without exhibiting signs of tearing. The BC surpasses traditional methods, such as activated charcoal and effluent treatment stations, in the removal of emulsified oils. The findings demonstrate that BC is promising for the treatment of industrial wastewaters, which is a field that requires continual technological innovations to mitigate the environmental impacts of the oil industry.
Keywords:
microbial cellulose
; water analysis
; biopolymer
; oil industry
1. Introduction
Pollution from the oil industry has always caused short-, medium-, and long-term environmental impacts, such as the contamination of water, air, and soil, with adverse effects on both fauna and flora [1,2,3,4,5], as well as economic impacts, mainly affecting fisheries, tourism, and coastal areas. All complications generated by the oil industry can be mitigated by a combination of rigorous regulations, advances in clean technologies, and a global commitment to the transition to renewable energy sources [6,7].
Oil in wastewater poses specific challenges in terms of removal and adequate treatment. Different types of oil may be present and the effectiveness of separation methods depends on the nature of the different forms of oil [1]. Emulsions pose a particular challenge, as these water-in-oil or oil-in-water mixtures are stable and resistant to decomposition. Moreover, the presence of antifoaming and emulsifying agents makes the separation task more complex [8,9].
Medeiros et al. (2022) [1] specify different methods currently employed by the oil industry for the treatment of emulsified wastewater. Such methods are generally combined, depending on the type of emulsion (oil-in-water or water-in-oil), type of oil present, and percentage of oil in the mixture. The combination of methods is required due to the low efficiency of individual methods at removing all types of oily molecules, which range in size from 20 to 150 μm [10].
Another important point is the care required when the water is to be reused in other processes, as the accumulation of oil can damage equipment, generating expenditures on maintenance and the loss of operating time. Oil content in reused water can also exert a negative impact heat exchange processes or lead to fines if disposal in waterbodies is not performed in compliance with the standards required by regulatory agencies [8,11].
To address this issue, companies and governments of various countries have allocated resources in search of more effective, faster, less expensive treatment processes that cause less secondary harm to the environment [1]. Moreover, the optimisation of established processes can be achieved with the use of novel biotechnological materials that assist in the agglutination of oily molecules or can replace conventional membranes derived from petroleum in filtration processes [12,13,14].
Among these novel biomaterials, bacterial cellulose (BC) is a biopolymer described as a revolutionary tool with vast applicability in various industrial sectors, such as wastewater treatment [1,3,12,15]. BC can be produced through the action of various microorganisms, such as the genera Komagataeibacter and Agrobacterium [16,17,18]. Its unique characteristics, such as the reticular structure, high porosity, large number of fibres, hydrophilicity, and oleophobicity, make BC ideal for use as a filtration membrane in separation processes [16,19,20,21].
Therefore, the aim of the present study was to treat emulsified oily water using a filtration module previously described by Medeiros et al. (2023) [16] to determine its effectiveness as well as suggest possible improvements to the module through tests involving different pressures. As assessment of the membrane was also performed by testing its ability to filter oil, suspended solids, colour, and the microbiological load from real industrial wastewater.
2. Materials and Methods
2.1. Membrane Production
2.1.1. Microorganism and Means of Maintenance
The microorganism used for the production of BC was the bacterium Komagataeibacter hansenii UCP1619, which is deposited in the Culture Bank of the Environmental Science Research Centre of Universidade Católica de Pernambuco, Brazil. The strain was cultivated in synthetic Hestrin-Shramm (HS) medium composed of 20.00 g/L of glucose, 5.00 g/L of peptone, 5.00 g/L of yeast extract, 1.15 g/L of citric acid, 2.70 g/L of disodium phosphate, and 2.00 g/L of agar, and adjusted to pH 6. Cultivation was performed at a temperature of 30 °C, as described by Hestrin and Schramm in 1954 [22].
2.1.2. Culture Conditions, Purification, and Production Yield of BC
A pre-inoculum (100 mL) was prepared for the adaptation of the microorganism to the liquid HS medium, which was left resting at 30 °C for 48 hours. The K. hansenii inoculum was established at 3% v/v of the pre-inoculum and stored in rectangular glass recipients containing 1000 mL of standard culture medium and incubated at 30 °C without agitation for 14 days. The membranes were rinsed in running water, followed by purification in boiling water for 30 minutes for the removal of retained cells. The membranes were then weighed and the yield (g/L) was calculated using Equation 1.
2.2. Assembly of Filtration Module
The filtration module used during the experiments was assembled following the specifications described by Medeiros et al. (2023) [16] (Figure 1). The module was fabricated piece by piece to facilitate the packing of the BC membranes used in the filtering process and assist in the exchange of membranes after saturation as well as the maintenance of the module.
2.3. Area of Filtration Module
Two different filtration areas were investigated – one with 19.24 cm² and another with 76.97 cm², with holes measuring 5 mm and 10 mm in diameter, respectively. The filtration module used in this experiment had two sections with holes – each approximately 14 cm in length, with a total of 49 holes in each section. The pressure range analysed was 1 to 3 bar for each area tested.
The tests involved the measure of flow volume and pressure during the treatment of the wastewater. The effluent used in all tests was from a treatment station of the partner company located in the SUAPE Industrial Port Complex in the municipality of Ipojuca, Brazil.
After the assembly of the system, flow volumes were recorded at five-minute intervals for 60 minutes, resulting in the collection of 12 flow points for each test. This detailed method enables a comprehensive understanding of the performance of the filtration module in the removal of impurities, contributing to the overall effectiveness of the treatment process.
2.4. Analysis of BC Membrane
2.4.1. Water Retention Capacity
The moisture content in a biomaterial is linked to its water retention capacity (WRC), the determination of which enables the assessment of the water absorption capacity and permeability of the membrane. BC samples were weighed and submitted to a drying process in a laboratory oven at 40 °C until reaching a constant weight, ensuring the complete removal of water. The yield was then determined and the WRC was calculated using Equation 2:
2.4.2. Determination of Water Contact Angle, Sorption Index, and Swelling Ratio
BC membranes were cut into rectangles (10 mm X 5 mm). The water contact angle was determined using the sessile drop method. For such, the samples were placed on a flat surface and a drop of water was carefully deposited on the surface of the membrane. The contact angle was measured after one second of spreading [23] with the aid of a goniometer and digital camera without a mirror (XT10, Fujifilm, Japan). The drop was also observed for 10 min until complete absorption and the average time was calculated to determine the sorption index [24].
For the calculation of the swelling ratio, water was removed from BC membranes (10 mm X 5 mm) in a laboratory oven at 50 °C until reaching a constant weight. The samples were then weighed and immersed in distilled water at 25 °C for 24 horas. Next, the excess surface water was removed and the samples were weighed. The swelling ratio (SR) was determined from the change in weight after immersion using Equation 3:
2.4.3. Fourier Transform Infrared (FTIR) Spectroscopy
This method is based on the vibrations of the atoms of a molecule when a sample is submitted to electromagnetic radiation in the infrared range and is used to furnish evidence of the presence of functional groups in the organic structure [25]. The result is a graph denominated an interferogram, with axes corresponding to the response of the detector and difference in the optical path [26].
Dried BC membranes were maintained in a desiccator with silica gel at a temperature of 25 °C. The spectra of the samples were recorded at room temperature in adsorption mode from the accumulation of 32 scans at 4 cm-1 in the wavenumber range of 4000 to 400 cm-1, using the Alpha II spectrometer (Bruker, Germany) with an attenuated total reflection (ATR) diamond sensor.
2.4.4. Thermogravimetric Analysis (TGA)
The thermal stability of the BC was analysed using a TGA-50 thermogravimetric analyser (Shimadzu, Kyoto, Japan). Approximately 8 mg of dried sample were loaded onto an aluminium pan and heated from 25 to 800 °C at a rate of 10 °C/min under a nitrogen atmosphere (50 mL/min). Maximum thermal degradation temperature (Tmax) was determined from the peak of the derived thermogravimetric (DTG) curve. All tests were performed in triplicate under these experimental conditions.
2.4.5. X-Ray Diffractometry (XRD)
The crystallinity index and dimensions of BC crystallites were studied by XRD using a D8 Advance ECO analytical diffractometer (Bruker, Germany) with Cu Kα1 radiation generated at 45 kV and 25 mA. The data were recorded in reflection mode at a rate of 5° min−1 from 4° to 90°. The degree of crystallinity was determined using Equation 4.
in which
Ac = Area of the peaks corresponding to the crystalline regions;
Aam = Area of the halo corresponding to the amorphous regions.
The areas were determined following the method described by Canevarolo Jr. [26] with the aid of the X’Pert HighScore Plus PANanalytical, version 3.0 (2009) and OriginPro 9 software programs.
2.4.6. Optical Microscopy
A basic achromatic binocular optical microscope (Olen®, ProWay Optics & Electronics LTD.) was used to analyse the membranes after filtration for the determination of the material retained in three specific pores, denominated “A”, “B”, and “C”, which had different quantities of the impurities.
2.4.7. Scanning Electron Microscopy (SEM) and Energy Dispersive Spectroscopy (EDS)
The dried BC was mounted on a copper stub using conductive double-sided adhesive carbon tape and gold-coated by cathode sputtering for 30 seconds (SC-701 Quick Coater, Tokyo, Japan). The qualitative identification of the elements of the sample were performed using an energy dispersive spectroscope coupled to a scanning electron microscope (FEI INSPECT S50, Midland, ON, Canada). EDS assists in the characterisation of the elements of a sample rather than the compounds, with a viable detection limit of 0.1% of mass concentration.
2.4.8. Flexibility
The flexibility of the BC used for the filtration of oily wastewater was investigated by repeated folding 100 times along the same line of the sample, as described by Chen et al. (2013) [27]. The classification of flexibility was based on the number of times the sample could be folded at the same point prior to tearing: < 20 times = poor; 20-49 times = fair; 50-99 times = good; and ≥ 100 times = excellent.
2.4.9. Mechanical Tests
Tensile strength to the point of tearing (MPa) and maximum deformation (%) were investigated to assess the mechanical properties of the pre-treatment membrane. Samples were cut into five rectangular strips measuring 2.0 x 7.0 cm. Tensile strength was tested at room temperature (approximately 25 °C) and a velocity of 0.5 m/min using a 1-kN load cell in a universal testing machine (Instron 5969, USA), following the ASTM D882 method.
2.5. Analysis of Water before and after Filtration
The analysis of the physicochemical and microbiological characteristics of the water before and after filtration with the BC membrane was performed following the Standard Methods for the Examination of Water and Wastewater - 24th Edition (2023) [28]. The aim of these analyses was to determine whether filtration was effective. Total oils and greases, turbidity, apparent colour, total hardness, biochemical oxygen demand (BOD), chemical oxygen demand (COD), total alkalinity, and conductivity were measured. Microbiological tests were also conducted to identify total coliforms, thermotolerant coliforms, and Escherichia coli.
3. Results and Discussion
3.1. Analysis of Treatment System
The experimental data of flow volume as a function of time obtained using the filtration module with an area of 19.24 cm2 at three different pressures are shown in Figure 2.
No significant increase in the flow rate was found with the increase in pressure. The drop-off behaviour was similar with the three pressures. An increase in the flow rate was expected with the increase in pressure. The lack of a significant difference may have been related to the compression of the bacterial cellulose. When submitted to higher pressure, a reduction in its porosity occurs, as the fibres are forced against each other, impeding greater permeabilization. Total flow volumes are displayed in Figure 3.
The flow throughout the experiment was 727, 755, and 770 mL for pressures of 1, 2, and 3 bar, respectively, with no significant increase in total volume of the filtered effluent as a function of pressure. Linear interpolation enabled the creation of a three-dimensional graph for better visualisation of flow volume as a function of time, as shown in Figure 4.
Based on these data, a mathematical model was created to predict instantaneous flow as a function of time and pressure within the limits of the present study. The model is described in Equation 5 and had a coefficient of determination of 0.98.
in which Q1 (p, t) is flow in mL as a function of pressure (p) in bar and time (t) in minutes. To obtain the total volume of wastewater filtered, this function is divided by 5 (Equation 6), which was the time interval used in the data collection that gave rise to the model.
For the experimental results using the filtration module with an area of 76.97 cm2, flow volume as a function of pressure and time is shown in Figure 5.
Following the same behaviour as that found for the filtration module with a smaller area, the increase in pressure did not lead to a significant increase in the flow volume of the filtered effluent and the drop-off behaviour was quite similar in the three cases studied. Total flow volume in 60 minutes at the three pressures is displayed in Figure 6.
Total flow volume in sixty minutes was 3.76, 3.67, and 3.76 L at pressures of 1, 2, and 3 bar, respectively. As the filtration area exerted a considerable impact on the volume of effluent filtered, this aspect should be the focus of improving the design of future filtration modules. Flow volumes through the module with the larger area were approximately five times the volumes found for the module with the smaller area. For comparison purposes, total flow volumes through the modules with different areas are displayed in Figure 7.
Using the same linear interpolator, we obtained a response surface of the flow behaviour as a function of time and pressure, as shown in Figure 8.
The mathematical model for the filtration module with an area of 76.97 cm2 is presented in Equation 7, which had a coefficient of determination of 0.99.
in which Q2 (p, t) is flow in mL as a function of pressure (p) in bar and time (t) in minutes. To obtain the total volume of wastewater filtered, this function is divided by 5 (Equation 5), as established for the previous model.
Selecting the pressure of 2 bar for the modules with the two different areas, the response surface shows the effect of the increase in area on the flow volume of the filtered effluent over time (Figure 9).
All data obtained thus far can be mathematically interpolated, generating an equation whose representation would be a graph with four dimensions. This mathematical model had a coefficient of determination of 0.98 and is capable of providing instantaneous flow based on the independent variables of time (t), pressure (p), and area (A), as shown in Equation 8.
Equation 8 can satisfactorily model the filter with the variables analysed in this study. With this information, it is possible to optimise the design of the filter and predict the expected flow volume based on surface area, pressure, and operating time of the system.
The module and filtration system analysed in this study enabled adequate data collection, which gave rise to a mathematical model capable of furnishing the flow volume over time as a function of area and pressure. The filtration area exerts a significantly greater influence on the flow volume compared to the different pressures used.
3.2. Comparative Analysis of Membrane before and after Filtration
3.2.1. Water Retention Capacity (WRC)
The BC membrane had a WRC of more than 97% (Table 1). Hydrophilicity is one of the fundamental properties of the filtration process. The cellulose fibres form a three-dimensional hydrophilic structure, which gives BC high porosity and oleophobicity. The water in the membrane plays a crucial role in the filtration capacity, permeating the spaces between the cellulose fibres and retaining the oil on the surface of the membrane without compromising its structural integrity. Silva Júnior et al. (2022) [29] and Medeiros et al. (2023) [16] also reported BC membranes with a high WRC (%).
3.2.2. Water Contact Angle and Swelling Ratio
The filtration capacity of BC membranes is largely affected by its wetting capacity, which plays a crucial role in the movement of the fluid. This results in the retention of oil molecules while also enabling the passage of water. The water contact angle in the present study was (34.12 ± 1.39°), which is compatible with what the literature describes as hydrophilic, thus facilitating its use as a filtering membrane for the efficient treatment of oily wastewater [16]. Moreover, the time necessary for the absorption of a drop of water was 11.53 ± 1.34 seconds, which indicates high water absorption capacity, further confirming the hydrophilic nature of the BC membrane.
The capacity for the membrane to rehydrate after complete drying was also assessed. This test enables understanding the properties of the membrane after extensive use, storage for long periods of time, or accidental dehydration [24]. The tests revealed a high rehydration capacity, with an average swelling ratio of 64.12 ± 4.12%, demonstrating the capacity to absorb water even after complete drying.
3.2.3. Fourier Transform Infrared (FTIR) Spectroscopy
This analysis was performed for the precise determination of the chemical structure of the bacterial cellulose. The FTIR spectrum was analysed between 4000 and 400 cm-1. The results are shown in Figure 10 and Table 2. Characteristic peaks of bacterial cellulose were found. The peak at 3344 cm-1 corresponds to OH deformation. The peaks at 2922 cm-1, 2854 cm-1, and 1425 cm-1 correspond to the asymmetrical, angular deformation of CH2. The peak at 1745 cm-1 corresponds to the axial deformation of C=O. The peaks at 1649 cm-1 and 1543 cm-1 respectively correspond to C-O-H and C=C. The peaks at 1314 cm-1 and 1206 cm-1 correspond to CH. The range from 1159 cm-1 to 1002 cm-1 corresponds to C-O bonds.
Comparing these data to those of other researchers that analysed BC without the presence of oil [16,30,31,32], several similarities and very few differences were evident. This is due to the fact that the emulsion submitted to filtration was prepared using OCB2, which is an oil with chemical bonds similar to the bonds found in the BC membrane. The quantity of oil in the membrane can only be precisely determined using thermogravimetric analysis (TGA), x-ray diffractometry (XRD), and energy dispersive spectrometry (EDS), which enable the identification of elements and their quantities, as well as visual analysis (microscopy).
3.2.4. Thermogravimetric Analysis (TGA)
TGA was used to investigate the thermal stability of the BC membrane before and after the filtration of the wastewater contaminated with oil. The results are displayed in Figure 11.
Three major stages of mass loss were found in the BC sample prior to filtration, whereas five were found after filtration. The first degradation stage in both samples occurred between 22 and 242 °C, with an average loss of 4.3% to 5.7% of mass related to the evaporation of residual moisture from the samples.
The second stage occurred at around 180 to 398 °C in both samples. In this stage, the greatest loss of mass occurred (52% prior to filtration and 62% after filtration). This loss is related to the degradation of the cellulose, which is characterised by the decomposition of glucose units and, subsequently, depolymerisation. The main pyrolysis step of the cellulose occurred in the temperature range from 300 to 380 °C. High temperatures break down the structure of the cellulose. The thermal behaviour is fundamental to understanding the behaviour of cellulose under different heating conditions and determining its applications in different industrial processes. These present results indicate that the membrane can be applied in fields where the thermal stability is important [29,33]. This was also the stage in which the peak DTG value was found, which indicates maximum mass loss rate (%) at around 300 °C, which is in agreement with data published in the literature [34,35].
The third stage prior to filtration occurred between 398 and 800 °C, with an average loss of approximately 15%. This was the fifth stage of degradation of the sample after filtration, which occurred between 600 and 800 °C and resulted in a 4.2% loss of mass. In both samples, pyrolysis of the polymer has already taken place in this state and the loss of mass is related to the degradation of residual carbon molecules.
The figure also shows two additional degradation stages for the BC sample after filtration (third and fourth stages in second graph). These additional stages are related to the oil retained after filtration and correspond to an approximately 31% loss of mass in the temperature range of 370 to 600 °C. A comparison of the two graphs reveals a part of the impurities (the oil) was retained in the BC membrane. This indicates the need for further studies for the possible recovery of these membranes for reutilisation or to determine the appropriate disposal of the membrane, which now contains a contaminant in its composition.
3.2.5. X-Ray Diffractometry (XRD)
The diffractogram shows typical peaks of cellulose (blue lines in Figure 12), with diffraction angles of 14.8°, 16.1°, and 23.0° attributed to (100), (010), and (110) crystalline planes of Iα cellulose (Table 3) [36]. Galdino Jr. et al. [12] produced a similar membrane in HS medium for use in a filtration system, but the pure membrane had a crystallinity index of 78.8%, whereas the membrane in the present study had a post-filtration crystallinity index of 40 %.
The loss of crystallinity is due to the filling of spaces (pores) by oil molecules. The peaks highlighted in red correspond to the oil retained in the filtration process, with diffraction angles of 14.4°, 18.0°, 20.0°, 20.5°, 21.8°, and 23.2°. Crystallinity is related to the capacity of cellulose to bind to water molecules, consequently improving the flow of water [37]. However, the reduction in spaces due to pores being filled with oil also affects water flow.
The production conditions exert an influence on the properties of membranes. For instance, Medeiros et al. [16] produced BC from a symbiotic culture of bacteria and yeasts (SCOBY) in a green tea medium with the aim of using it in an oily effluent filtration system and obtained a membrane with characteristic diffraction angles of 14.2°, 16.8°, and 22.3° and crystallinity of 66%.
3.2.6. Optical Microscopy
After the analysis of the industrial wastewater treatment system, the BC was removed from the filtration system and inspected with regards to deformation, water loss, and tensile strength. For such, three specific pores that macroscopically exhibited different concentrations of the retained material were selected and denominated “A”, “B”, and “C” (Figure 13). These pores corresponded to a visually determined lower to greater quantity of retained contaminant after filtration.
Practically no macroscopically observable residues were retained in pore “A”. This occurred due to the fact that this pore was in a specific position of the filtering bed, with part of the other extremity of the membrane overlapping the pore. The microscopic analysis (Figure 14), however, revealed that smaller solid particles in the wastewater were able to pass through the overlying portion of membrane and reach the second layer.
The certain quantity of retained particles in pore A can be seen at lower magnification. With the increase in magnification, these clusters become more translucent, demonstrating that the clusters are not free or dispersed oil particles of larger sizes, but rather part of what composes the initial turbidity of the effluent [38]. Magnifications of 40 and 100 times reveal part of the surface fibres of the membrane, which are close together due to compression caused by the filtration process. Although compressed, these fibres still enabled the passage of liquid, as some impurities were clustered precisely on top of these fibre “veins”.
The first microscopic image of pore B (Figure 15) reveals greater action of the pressure used in the filtration as well as much more accumulated colour and surface clusters of impurities.
The fibres of the membrane are less visible in this pore due to the quantity of accumulated impurities. The images confirm that the spaces between the compressed fibre still enable a path for the flow of the liquid, as those that are apparent have a characteristic dark colour and have apparent clusters of molecules near them. Due to compression that occurred during filtration, the membrane lost a large part of its retained water. The image at magnification of 100 times is clearer, as the free water in the BC give it volume and opacity [39].
Pore C was one of the “most soiled” (Figure 13) and was selected due to the greater visual perception of how the particles were deposited in different ways depending on the position during packing in the filtration system and the concentration of particles at specific points of the membrane. The microscopic images of this pore (Figure 16) show that the spaces between the fibres are filled more with dark particles and the clusters of molecules are larger. The same density in the shape of a spider is seen with the increase in magnification. This specific point can be characterised as a cluster of oil molecules, as a certain dilution or emulsification is seen in the lower portion of the image [40].
The images demonstrate the considerable retention capacity of the BC membrane of particles of different sizes, shapes, and types. Even with the application of increased pressure, the membrane did not break at any of the grooves formed by the entrance of part of the membrane in the holes of the shaft and proved effective for the treatment of wastewaters.
3.2.7. Scanning Electron Microscopy (SEM) and Energy Dispersive Spectroscopy (EDS)
SEM was performed to observe the surface morphology of the BC membrane with and without the presence of retained oil and impurities following filtration and to gain a better understanding of the saturation and permeation process of these substances through the BC nanofibers. Figure 17 (a-c) shows that the membranes had a uniform appearance prior to filtration when observed at lower magnifications (100, 500, and 1000x). This occurs due to the positioning and quantity of fibres in the bacterial cellulose, which give the biopolymer a wrinkled appearance [41].
The images at greater magnification (Figure 17d–f) show a lack of uniformity in the production of the fibres. Produced by microorganisms to reduce the passage of air and light, the fibres do not have an organised pattern. This nano-porosity gives BC membranes the capacity to retain molecules of various sizes [12,16,37,42].
Energy dispersive spectroscopy (EDS) also demonstrated that the membrane purification process was effective at removing any microorganisms that may be present on the innermost fibres of the membrane, but was unable to achieve the complete removal of the elements in the culture medium, specifically the phosphorus in the disodium phosphate (Table 4). Carbon and oxygen accounted for approximately 98% of the composition of the membranes analysed. These elements are present in the organic chain of cellulose [16].
Analysing the BC membranes after the filtration process, some macroscopic and microscopic (at low magnification) differences are seen. The first images in Figure 18a,d are at a magnification of 200 times, which is twice the highest magnification achieved with the optical microscope, revealing a groove shape as well as a pressed wavy appearance formed from the pressure of the water on the holes of the internal shaft of the module.
In a comparative analysis of images at magnification 1000 times (Figure 17c and Figure 18b,e), some similarities are evident, such as the undulating surface of the membrane. However, the characteristics that stand out are in Figure 18b,e, which clearly show the deformations caused by the pressure applied and removed as well as the smaller spaces between fibres. This is due to the high quantity of impurities and oil molecules in the sample, which are visible in the images.
The most significant differences were seen with the increase in magnification to 3000 times (Figure 17d) and 5000 times (Figure 18c,f). However, we are able to see more spaces between the fibres and greater details of the interior of the membrane at lower magnification. This shows that the physical action of compression, together with the presence of impurities (particulate matter and oil) contributed to the partial closing of the pore, demonstrating saturation and, consequently, the loss of filtering capacity.
The EDS results after filtration (Table 5) demonstrate the significant presence of other elements that are not components of the organic molecule of the cellulose. This gives us an approximation of the type of particulate matter in the wastewater samples and corroborates some of the results of the physicochemical analysis of the water before and after passing through the BC filter, such as a reduction in total hardness, alkalinity, and the quantity of oils and greases.
3.2.8. Flexibility and Mechanical Tests
Flexibility is an essential characteristic for filtering membranes due to the capacity to adapt to a variety of operational conditions. Flexible membranes withstand mechanical deformation, such as expansion and contraction, avoiding premature tearing and ensuring a longer useful life. Flexibility also contributes to better filtration efficiency, enabling conformation to irregular surfaces and the effective retention of particles of different shapes and sizes. Moreover, the capacity to integrate easily into complex systems and the simple handling during installation make membranes more versatile and suitable for various industrial applications [43].
The BC membrane produced in the present study exhibited excellent flexibility, remaining intact after being folded more than 100 times at the same point. This indicates that the membrane can withstand repeated mechanical strain without compromising its structural integrity. The capacity to withstand repeated folding also suggests that the membrane can be easily adapted to different configurations of filtration devices or systems, further expanding its application potential in different industrial and environmental contexts. Moreover, the result of the mechanical tests (Figure 19) demonstrate that the BC membrane has a tensile strength of 72.13 ± 8.22 MPa and withstood elongation of up to 21.11 ± 4.81% prior to tearing.
The values found are explained by the characteristics of BC, which are flexible, have a good elongation rate, and can withstand high forces before breaking or tearing. Moreover, BC naturally has a combination of properties, such as a higher degree of polymerisation and water retention capacity higher than 98%. Based on the results obtained and the filtration efficiency demonstrated in the present study, it is reasonable to state that the BC membrane can perform effectively as a filtration membrane.
3.3. Comparative Analysis of Pre- and Post-Filtration Water
The partner company employs some oily water treatment procedures, such as separation tanks for the removal of free oil, an effluent treatment station, and charcoal activated filtering. The initial effluent was filtered using different processes (effluent treatment station, activated charcoal filtering, and BC filtration system analysed in the present study) to enable a comparison of treatment quality (Figure 20). The physicochemical and microbiological characteristics of the water after each of the different types of treatment are displayed in Table 6 and Table 7.
The comparison of the types of filtering brings up important issues with regards to the initial and final state of the effluent. All physicochemical aspects of the effluents, with the exception of turbidity, were reduced after activated charcoal filtering, but a much more significant reduction was found in the effluent submitted to the BC membrane filtration system. The only characteristic that increased after passing through any of the filters was turbidity, with a significant increase after activated charcoal filtering and a negligible increase after BC filtration. This aspect is not macroscopically visible in Figure 20 due to the significant reduction in the apparent colour after BC filtration.
The analyses demonstrate that activated charcoal filtering is effective at oil removal, but did not exert a sufficient effect on the physicochemical and microbiological aspects, as only minimal reductions were found in comparison to the specific characteristics of the initial effluent. However, the BC filter achieved excellent results, with the reduction of practically all characteristics of the initial effluent, demonstrating considerable effectiveness in reducing the quantity of oils and greases as well as the microbiological load to the minimum detection limit of the equipment used.
After demonstrating that the BC filter could completely remove oils and greases, filtration was performed again with a synthetic oily effluent, which is shown in Figure 21 before and after filtration with the BC membrane. Filtration took place more slowly due to the high concentration of larger molecules and the nanometric nature of the membrane.
The effluent was produced with a high concentration of fuel oil (OCB2), distilled water, and 3 mg/L of a chemical surfactant. The effluent was submitted to the characterisation of oils and greases, revealing 68.0 mg/L prior to filtration. Activated charcoal filtration was only able to remove part of the oily content, reducing the value to 13.7 mg/L, whereas BC filtration reduced the oily content to below the minimum detection limit of the equipment (< 10.0 mg/L), demonstrating its capacity for the efficient separation of emulsified effluents with high oil content.
4. Conclusions
The tests conducted in this work demonstrated that the filtration system created with the BC membrane was highly effective at retaining contaminants, resulting in significant reductions in colour, turbidity, and particulate matter in the initial effluent. The membrane proved to be extremely flexible as well as easy to manage and use, exhibiting the mechanical properties necessary for use as a filtering membrane.
The main objective of treatment, which is the complete removal of emulsified oil from wastewater, was achieved. Moreover, the membrane was capable of removing the entire microbiological load as a result of its nanometric structure. Due to the large quantity of oily and non-oily contaminants, the FTIR, XRD, and EDS characterisations of the membrane indicated a high rate of other components. The treatment system developed proved to be highly effective at filtration, surpassing the results of activated carbon and effluent treatment stations. To further improve the performance of the filtration system in the treatment of wastewater, further studies are needed to increase the flow volume of the equipment.
Author Contributions
Conceptualisation, L.A.S. and A.D.M.d.M.; validation, L.A.S., A.D.M.d.M., C.J.G.d.S.J., I.J.B.D., T.d.S.C., Y.d.F.C. and A.F.d.S.C.; writing—original draft preparation, A.D.M.d.M. and C.J.G.d.S.J.; writing—review and editing, A.D.M.d.M., C.J.G.d.S.J., I.J.B.D., T.d.S.C., Y.d.F.C. and A.F.d.S.C.; visualisation, A.D.M.d.M. and L.A.S.; supervision, L.A.S.; project administration, L.A.S.; funding acquisition, L.A.S. All authors have read and agreed to the version of the manuscript to be published.
Funding
This study was funded by the Programa de Pesquisa e Desenvolvimento da Agência Nacional de Energia Elétrica (ANEEL)/Thermoelectric EPESA (Centrais Elétricas de Pernambuco S.A.)/SUAPE Ambiental and by the Brazilian fostering agencies Fundação de Apoio à Ciência e Tecnologia do Estado de Pernambuco (FACEPE), Conselho Nacional de Desenvolvimento Científico e Tecnológico (CNPq) and Coordenação de Aperfeiçoamento de Pessoal de Nível Superior (CAPES) (Grant n. Finance Code 001).
Data Availability Statement
No new data were created.
Acknowledgments
The authors are grateful to Centro de Ciências e Tecnologia of Universidade Católica de Pernambuco (UNICAP) and Instituto Avançado de Tecnologia e Inovação (IATI), Brazil.
Conflicts of Interest
The authors declare no conflicts of interest.
References
- Medeiros, A.D.M.; Silva Junior, C.J.G.; Amorim, J.D.P.; Durval, I.J.B.; Costa, A.F.S.; Sarubbo, L.A. Oily Wastewater Treatment: Methods, Challenges, and Trends. Processes 2022, 10, 743. [Google Scholar] [CrossRef]
- Lázaro-mass, S.; Gómez-Cornelio, S.; Castillo-Vidal, M.; Alvarez-Villagomez, C.S.; Quintana, P.; Larosa-García, S.D. Bio-degradation of hydrocarbons from contaminated soils by microbial consortia: a laboratory microcosm study. Electron. J. Biotechnol. 2023, 61, 24–32. [Google Scholar] [CrossRef]
- Medeiros, A.D.L.M.; Silva Junior, C.J.G.; de Amorim, J.D.P.; do Nascimento, H.A.; Converti, A.; Costa, A.F.S.; Sarubbo, L.A. Bacterial cellulose for Treatment of Wastewaters Generated by Energy Consuming Industries: A Review. Energies 2021, 14, 5066. [Google Scholar] [CrossRef]
- Dell’anno, F.; Van Zyl, L.J.; Trindade, M.; Buschi, E.; Cannavacciuolo, A.; Pepi, M.; Sansone, C.; Brunet, C.; Ianora, A.; Pascale, D.D. Microbiome enrichment from contaminated marine sediments unveils novel bacterial strains for petroleum hydro-carbon and heavy metal bioremediation. Environ. Pollut. 2023, 317, 120772. [Google Scholar] [CrossRef] [PubMed]
- Abuhasel, K.; Kchaou, M.; Alquraish, M.; Munusamy, Y.; Jeng, Y.T. Oily Wastewater Treatment: overview of conventional and modern methods, challenges, and future opportunities. Water 2021, 13, 980. [Google Scholar] [CrossRef]
- Agaton, C.B.; Guno, C.S.; Labog, R.A.; Collera, A.A. Immediate Socioeconomic Impacts of Mindoro Oil Spill on Fisherfolk of Naujan, Philippines. Resources 2023, 12, 102. [Google Scholar] [CrossRef]
- Afenyo, M.; Jiang, C.; Ng, A.K.Y. A Bayesian-loss function-based method in assessing loss caused by ship-source oil spills in the arctic area. Risk Anal. 2023, 43, 8, 1557-1571. [CrossRef]
- Pothula, G.K.; Vij, R.K.; Bera, A. An overview of chemical enhanced oil recovery and its status in India. Pet. Sci. 2023, 20, 4, 2305-2323. [CrossRef]
- Niu, H.; Wang, W.; Dou, Z.; Chen, X.; Chen, X.; Chen,H.; Fu, X. Multiscale combined techniques for evaluating emulsion stability: A critical review. Adv. Colloid Interface Sci. 2023 311, 102813. [CrossRef]
- El-Gawad, H.S.A. Oil and grease removal from industrial wastewater using new utility approach. Adv. Environ. Chem. 2014, 2014, 916878. [Google Scholar] [CrossRef]
- Xia, X.; Ma, J.; Geng, S.; Liu, F.; Yao, M. A review of Oil–Solid Separation and Oil–Water Separation in Unconventional Heavy Oil Production Process. Int. J. Mol. Sci. 2022, 24, 74. [Google Scholar] [CrossRef] [PubMed]
- Galdino, C.J.S.; Maia, A.D.M.; Meira, H.M.; Souza, T.C.; Amorim, J.D.P.; Almeida, F.C.G.; Costa, A.F.S.; Sarubbo, L.A. Use of a bacterial cellulose filter for the removal of oil from wastewater. Process Biochem. 2020, 91, 288–296. [Google Scholar] [CrossRef]
- Lehtonen, J.; Chen, X.; Beaumont, M.; Hassinen, J.; Orelma, H.; Dumée, L.F.; Tardy, B.L.; Rojas, O.J. Impact of incubation conditions and post-treatment on the properties of bacterial cellulose membranes for pressure-driven filtration. Carbohydr. Polym. 2021, 251, 117073–117082. [Google Scholar] [CrossRef] [PubMed]
- Adetunji, A.I.; Olaniran, A.O. Treatment of industrial oily wastewater by advanced technologies: A review. Appl. Water Sci. 2021, 11, 98. [Google Scholar] [CrossRef]
- Galdino, C.J.S.; Medeiros, A.D.M.; Amorim, J.D.P.; o Nascimento, H.A.; Converti, A.; Costa, A.F.S.; Sarubbo, L.A. Bacterial Cellulose Biotextile and the Future of Sustainable Fashion: A Review. Environ. Chem. Lett. 2021, 19, 2967–2980. [Google Scholar] [CrossRef]
- Medeiros, A.D.M.d.; Silva Junior, C.J.G.d.; Amorim, J.D.P.d.; Durval, I.J.B.; Damian, R.B.; Cavalcanti, Y.d.F.; Costa, A.F.d.S.; Sarubbo, L.A. Design and Modeling of a Biotechnological Nanofiltration Module Using Bacterial Cellulose Membranes for the Separation of Oily Mixtures. Water 2023, 15, 2025. [Google Scholar] [CrossRef]
- Girard, V.D.; Chaussé, J.; Vermette, P. Bacterial cellulose: A comprehensive review. J. Appl. Polym. Sci. 2024, 141, 15. [Google Scholar] [CrossRef]
- Yang, L.; Zhu, X.; Chen, Y.; Wang, J. Enhanced bacterial cellulose production in Gluconacetobacter xylinus by overexpression of two genes (bscC and bcsD) and a modified static culture. Int. J. Biol. Macromol. 2024, 260, 129552. [Google Scholar] [CrossRef] [PubMed]
- Rodrigues, F.; Faria, M.; Mendonça, I.; Sousa, E.; Ferreira, A.; Cordeiro, N. Efficacy of bacterial cellulose hydrogel in microfiber removal from contaminated waters: A sustainable approach to wastewater treatment. Sci. Total. Environ. 2024, 919, 170846. [Google Scholar] [CrossRef] [PubMed]
- Sai, H.; Fu, R.; Xing, L.; Xiang, J.; Li, Z.; Li, F.; Zhang, T. Surface modification of bacterial cellulose aerogels’ web-like skeleton for oil/water separation. ACS Appl. Mater. Interfaces. 2015, 7, 7373–7738. [Google Scholar] [CrossRef] [PubMed]
- Carpenter, A.W.; Lannoy, S.-F.; Wiesner, M.R. Cellulose nanomaterials in water treatment technologies. Environ. Sci. Technol. 2015, 49, 9. 5277–5287. [Google Scholar] [CrossRef] [PubMed]
- Hestrin, S.; Schramm, M. Synthesis of cellulose by Acetobacter xylinum. Preparation of freeze-dried cells capable of polymerizing glucose to cellulose, Biochem. J. 1954, 58, 345–352. [Google Scholar] [CrossRef] [PubMed]
- Marin, E.; Rojas, J. Preparation and characterization of crosslinked poly (vinyl) alcohol films with waterproof properties. Int. J. Pharm. Pharm. Sci. 2015, 7, 242–248. [Google Scholar]
- Kamiński, K.; Jarosz, M.; Grudzień, J.; Pawlik, J.; Zastawnik, F.; Pandyra, P.; Kołodziejczyk, A.M. Hydrogel bacterial cellulose: a path to improved materials for new eco-friendly textiles. Cellulose, 2020, 27, 9, 5353–5365. [CrossRef]
- Constantino, M.G. Espectroscopia no Infravermelho, 3rd ed.; LTC: Rio de Janeiro, Brazil, 2016. [Google Scholar]
- Canevarolo, S.J. Técnicas de Caracterização de Polímeros; Artliber: Sao Paulo, Brazil, 2003. [Google Scholar]
- Chen, G.; Zhang, B.; Zhao, J.; Chen, H. Improved process for the production of cellulose sulfate using sulfuric acid/ethanol solution. Carbohydr. Polym. 2013, 95, 1, 332-337. [CrossRef]
- American Public Health Association; American Water Works Association; Water Environment Federation. Standard Methods for the Examination of Water and Wastewater, 24th ed.; Lipps, W.C., Braun-Howland, E.B., Baxter, T.E., Eds.; APHA Press: Washington DC, USA, 2023; ISBN 978-0875532998.
- Silva Junior, C.J.G.; Amorim, J.D.P.; Medeiros, A.D.M.; Holanda Cavalcanti, A.K.L.; Nascimento, H.A.; Henrique, M.A.; Nascimento Maranhão, L.J.C.; Vinhas, G.M.; Oliveira Souto Silva, K.K.; Santana Costa, A.F.; Sarubbo, L.A. Design of a Naturally Dyed and Waterproof Biotechnological Leather from Reconstituted Cellulose. J. Funct. Biomater. 2022, 13, 49. [CrossRef]
- Revin, V.V.; Dolganov, A.V.; Liyaskina, E.V.; Nazarova, N.B.; Balandina, A.V.; Devyataeva, A.A.; Revin, V.D. Characterizing Bacterial Cellulose Produced by Komagataeibacter sucrofermentans H-110 on Molasses Medium and Obtaining a Biocomposite Based on It for the Adsorption of Fluoride. Polymers. 2021, 13, 1422. [Google Scholar] [CrossRef] [PubMed]
- Chaussé, J.; Girard, V-D.; Perron, T.; Challut, T.; Vermette, P. Characterization of bacterial cellulose produced by the KomEt strain isolated from a kombucha SCOBY. Biocatal. Agric. Biotechnol. 2024. 58, 103172. [CrossRef]
- Cleveland, D.; Nayak, R.; Joseph, F. Characterization of Bacterial Cellulose fabricated with Vietnamese ingredients for potential textile applications. Research Square, 2024. [Google Scholar] [CrossRef]
- Xu, K.; Li, Q.; Xie, L.; Shi, Z.; Su, G.; Harper, D.; Tang, Z.; Zhou, J.; Du, G.; Wang, S. Novel flexible, strong, thermal-stable, and high-barrier switchgrass-based lignin-containing cellulose nanofibrils/chitosan biocomposites for food packaging. Ind. Crop. Prod. 2022, 179, 114661. [Google Scholar] [CrossRef]
- Kumar, V.; Sharma, D.K.; Bansal, V.; Mehta, D.; Sangwan, R.S.; Yadav, S.K. Efficient and economic process for the production of bacterial cellulose from isolated strain of Acetobacter pasteurianus of RSV-4 bacterium. Bioresour. Technol. 2019, 275, 430–433. [Google Scholar] [CrossRef] [PubMed]
- Gea, S.; Reynolds, C.T.; Roohpour, N.; Wirjosentono, B.; Soykeabkaew, N.; Bilotti, E.; Peijs, T. Investigation into the structural, morphological, mechanical and thermal behaviour of bacterial cellulose after a two-step purification process. Bioresour. Technol. 2011, 102, 9105–9110. [Google Scholar] [CrossRef] [PubMed]
- Leonarski, E.; Cesca, K.; Zanella, E.; Stambuk, B.U.; Oliveira, D.; Poletto, P. Production of kombucha-like beverage and bacterial cellulose by acerola byproduct as raw material. Lwt. 2021, 135, 110075. [Google Scholar] [CrossRef]
- Li, Z.; Wang, M.; Li. Y.; Ren, J.; Pei, C. Effect of cellulose nanocrystals on bacterial cellulose hydrogel for oil-water separation. Sep. Purif. Technol. 2023, 304, 122349. [CrossRef]
- Wang, C.; Han, L.; Zhang, Y.; Jiang, A.; Niu, X. Impact of wave action on the entrainment rate and droplet size of oil. Appl. Ocean Res. 2024, 149, 104051. [Google Scholar] [CrossRef]
- Deng, L.; Li, F.; Han, Z.; Qu, X.; Li, J.; Zhou, Z.; Chen, S.; Wang, H.; Lv, X. Bacterial cellulose-based hydrogel with regulated rehydration and enhanced antibacterial activity for wound healing. Int. J. Biol. Macromol. 2024, 267, 13129. [Google Scholar] [CrossRef] [PubMed]
- Liu, J.; Sun, C.; Lun, Z.; Li, Y.; Tang, X.; Zhang, Q.; Yang, P. Study on the kinetics of formation process of emulsion of heavy oil and its functional group components. Sci. Rep. 2024, 14, 8916. [Google Scholar] [CrossRef] [PubMed]
- Hamed, D.A.; Maghrawy, H.H.; Kareem, H.A. Biosynthesis of bacterial cellulose nanofibrils in black tea media by a symbiotic culture of bacteria and yeast isolated from commercial kombucha beverage. World J. Microbiol. Biotechnol. 2022, 39, 48. [Google Scholar] [CrossRef] [PubMed]
- Hassan, E.; Hassan, M.; Abou-Zeid, R.; Berglund, L.; Oksman, K. Use of bacterial cellulose and crosslinked cellulose nanofibers membranes for removal of oil from oil-in-water emulsions. Polymers 2017, 9, 388. [Google Scholar] [CrossRef] [PubMed]
- El-Samak, A.A.; Ponnamma, D.; Hassan, M.K.; Ammar, A.; Adham, S.; Al-Maadeed, M.A.A.; Karim, A. Designing Flexible and Porous Fibrous Membranes for Oil Water Separation—A Review of Recent Developments. Polym. Rev. 2020, 4, 60. 671–716. [Google Scholar] [CrossRef]
Figure 1.
Structural model of filtration module with cross-section showing external pressure support tubing and internal shaft in which bacterial cellulose membrane is packed.
Figure 1.
Structural model of filtration module with cross-section showing external pressure support tubing and internal shaft in which bacterial cellulose membrane is packed.
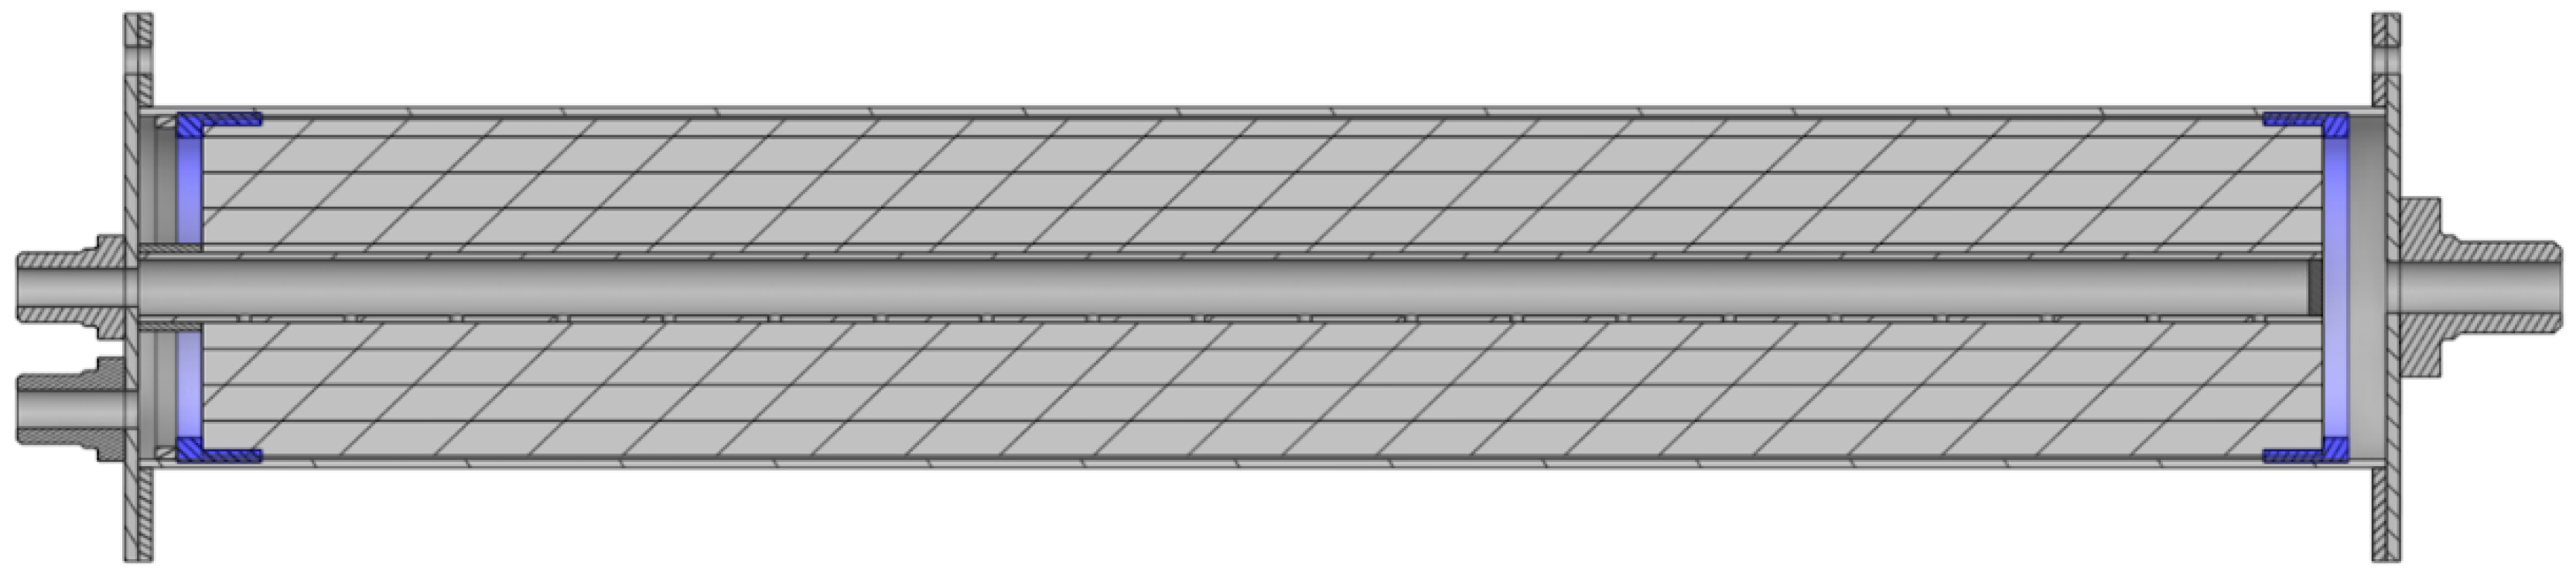
Figure 2.
Flow volume through module with area of 19.24 cm2 as function of time for pressures of 1, 2, and 3 bar.
Figure 2.
Flow volume through module with area of 19.24 cm2 as function of time for pressures of 1, 2, and 3 bar.
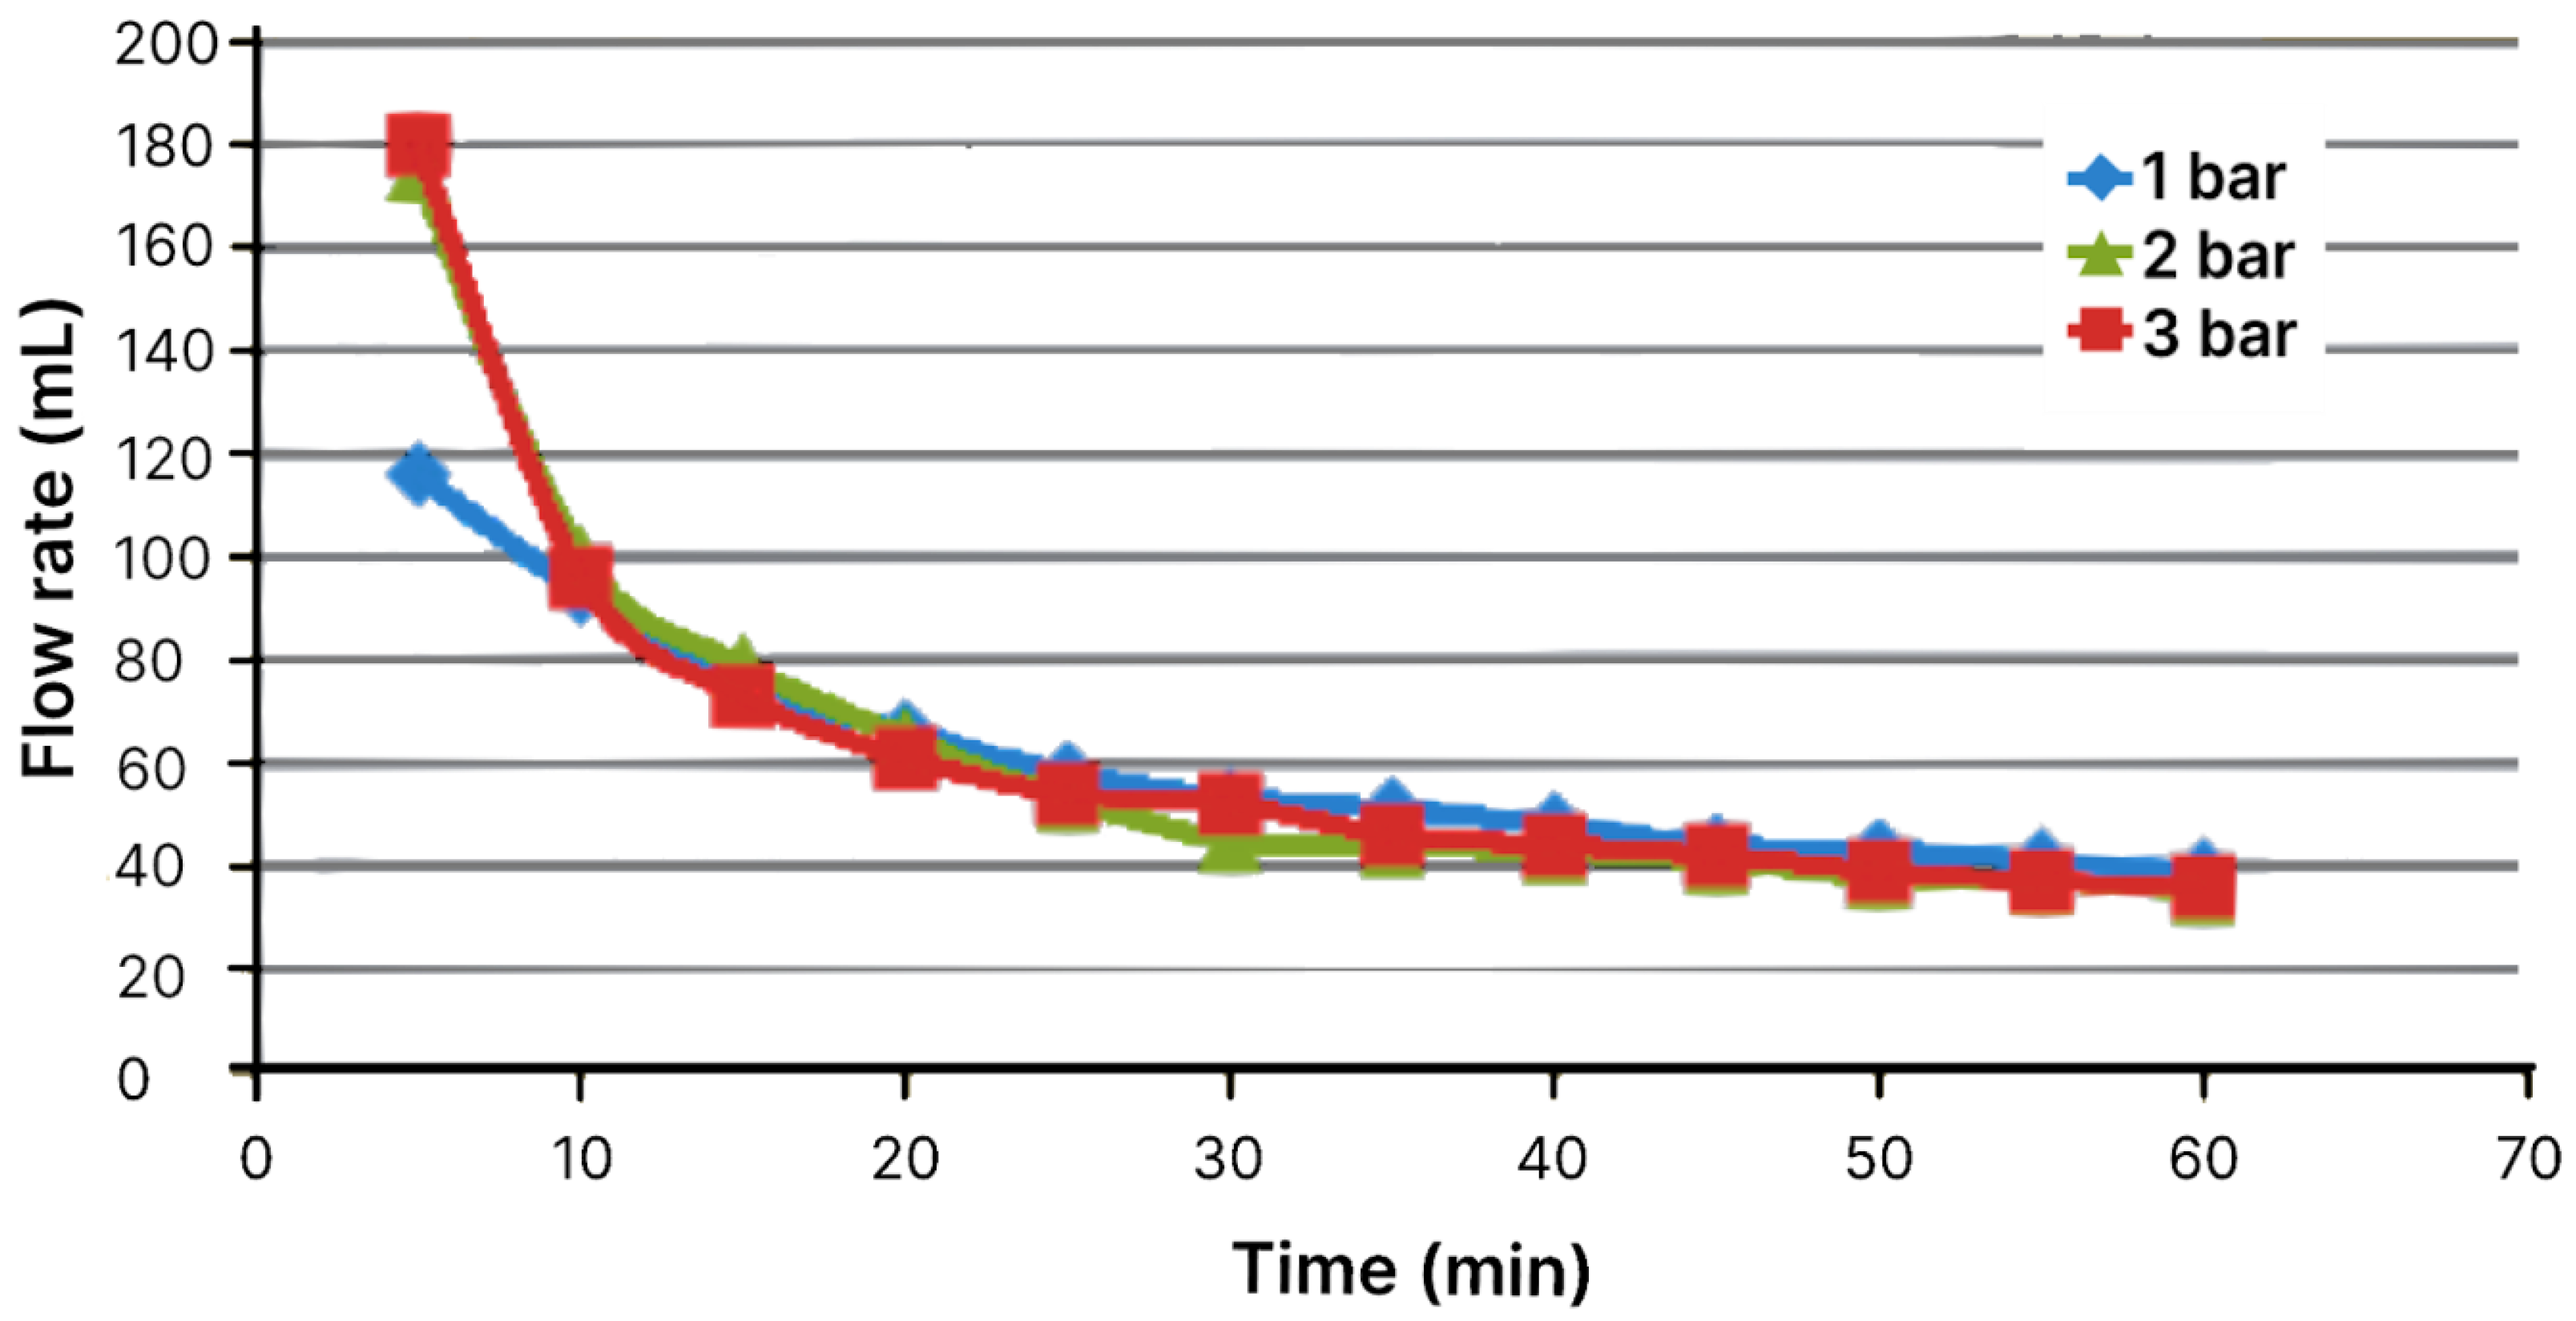
Figure 3.
Total flow volumes through module with area of 19.24 cm2 in 60 minutes.
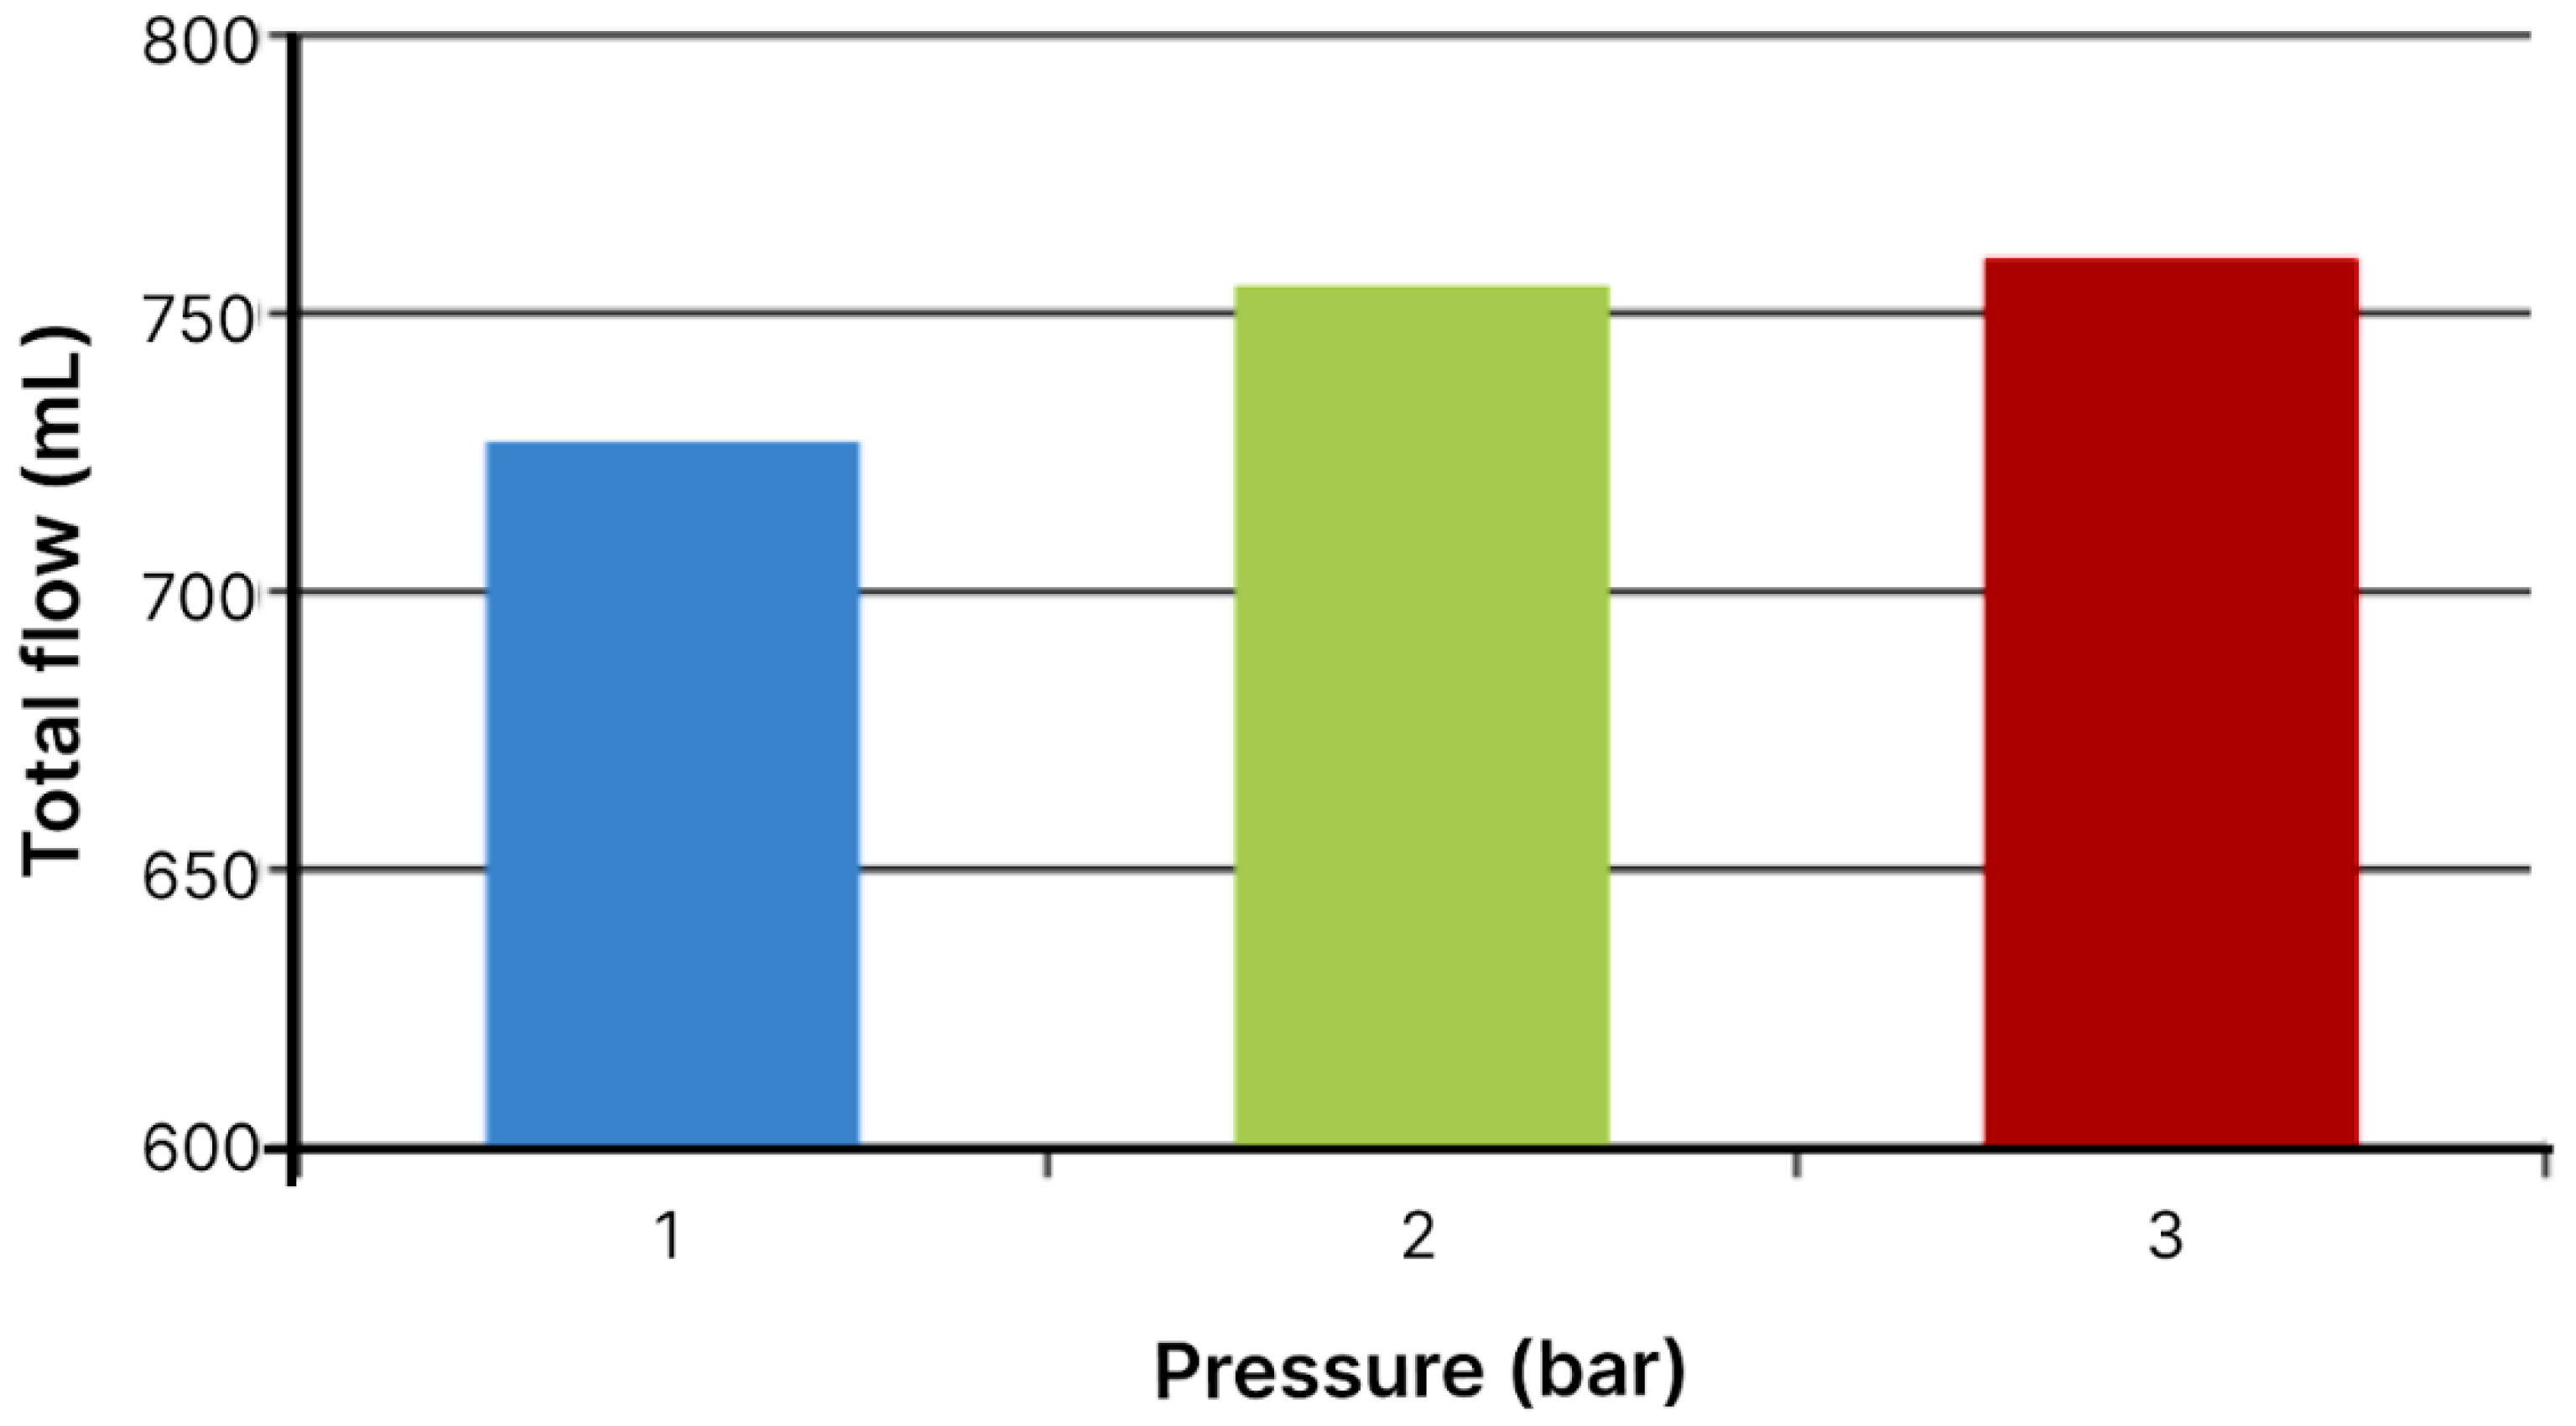
Figure 4.
Response surface of flow volume through filtration module with area of 19.24 cm2 as function of time and pressure.
Figure 4.
Response surface of flow volume through filtration module with area of 19.24 cm2 as function of time and pressure.
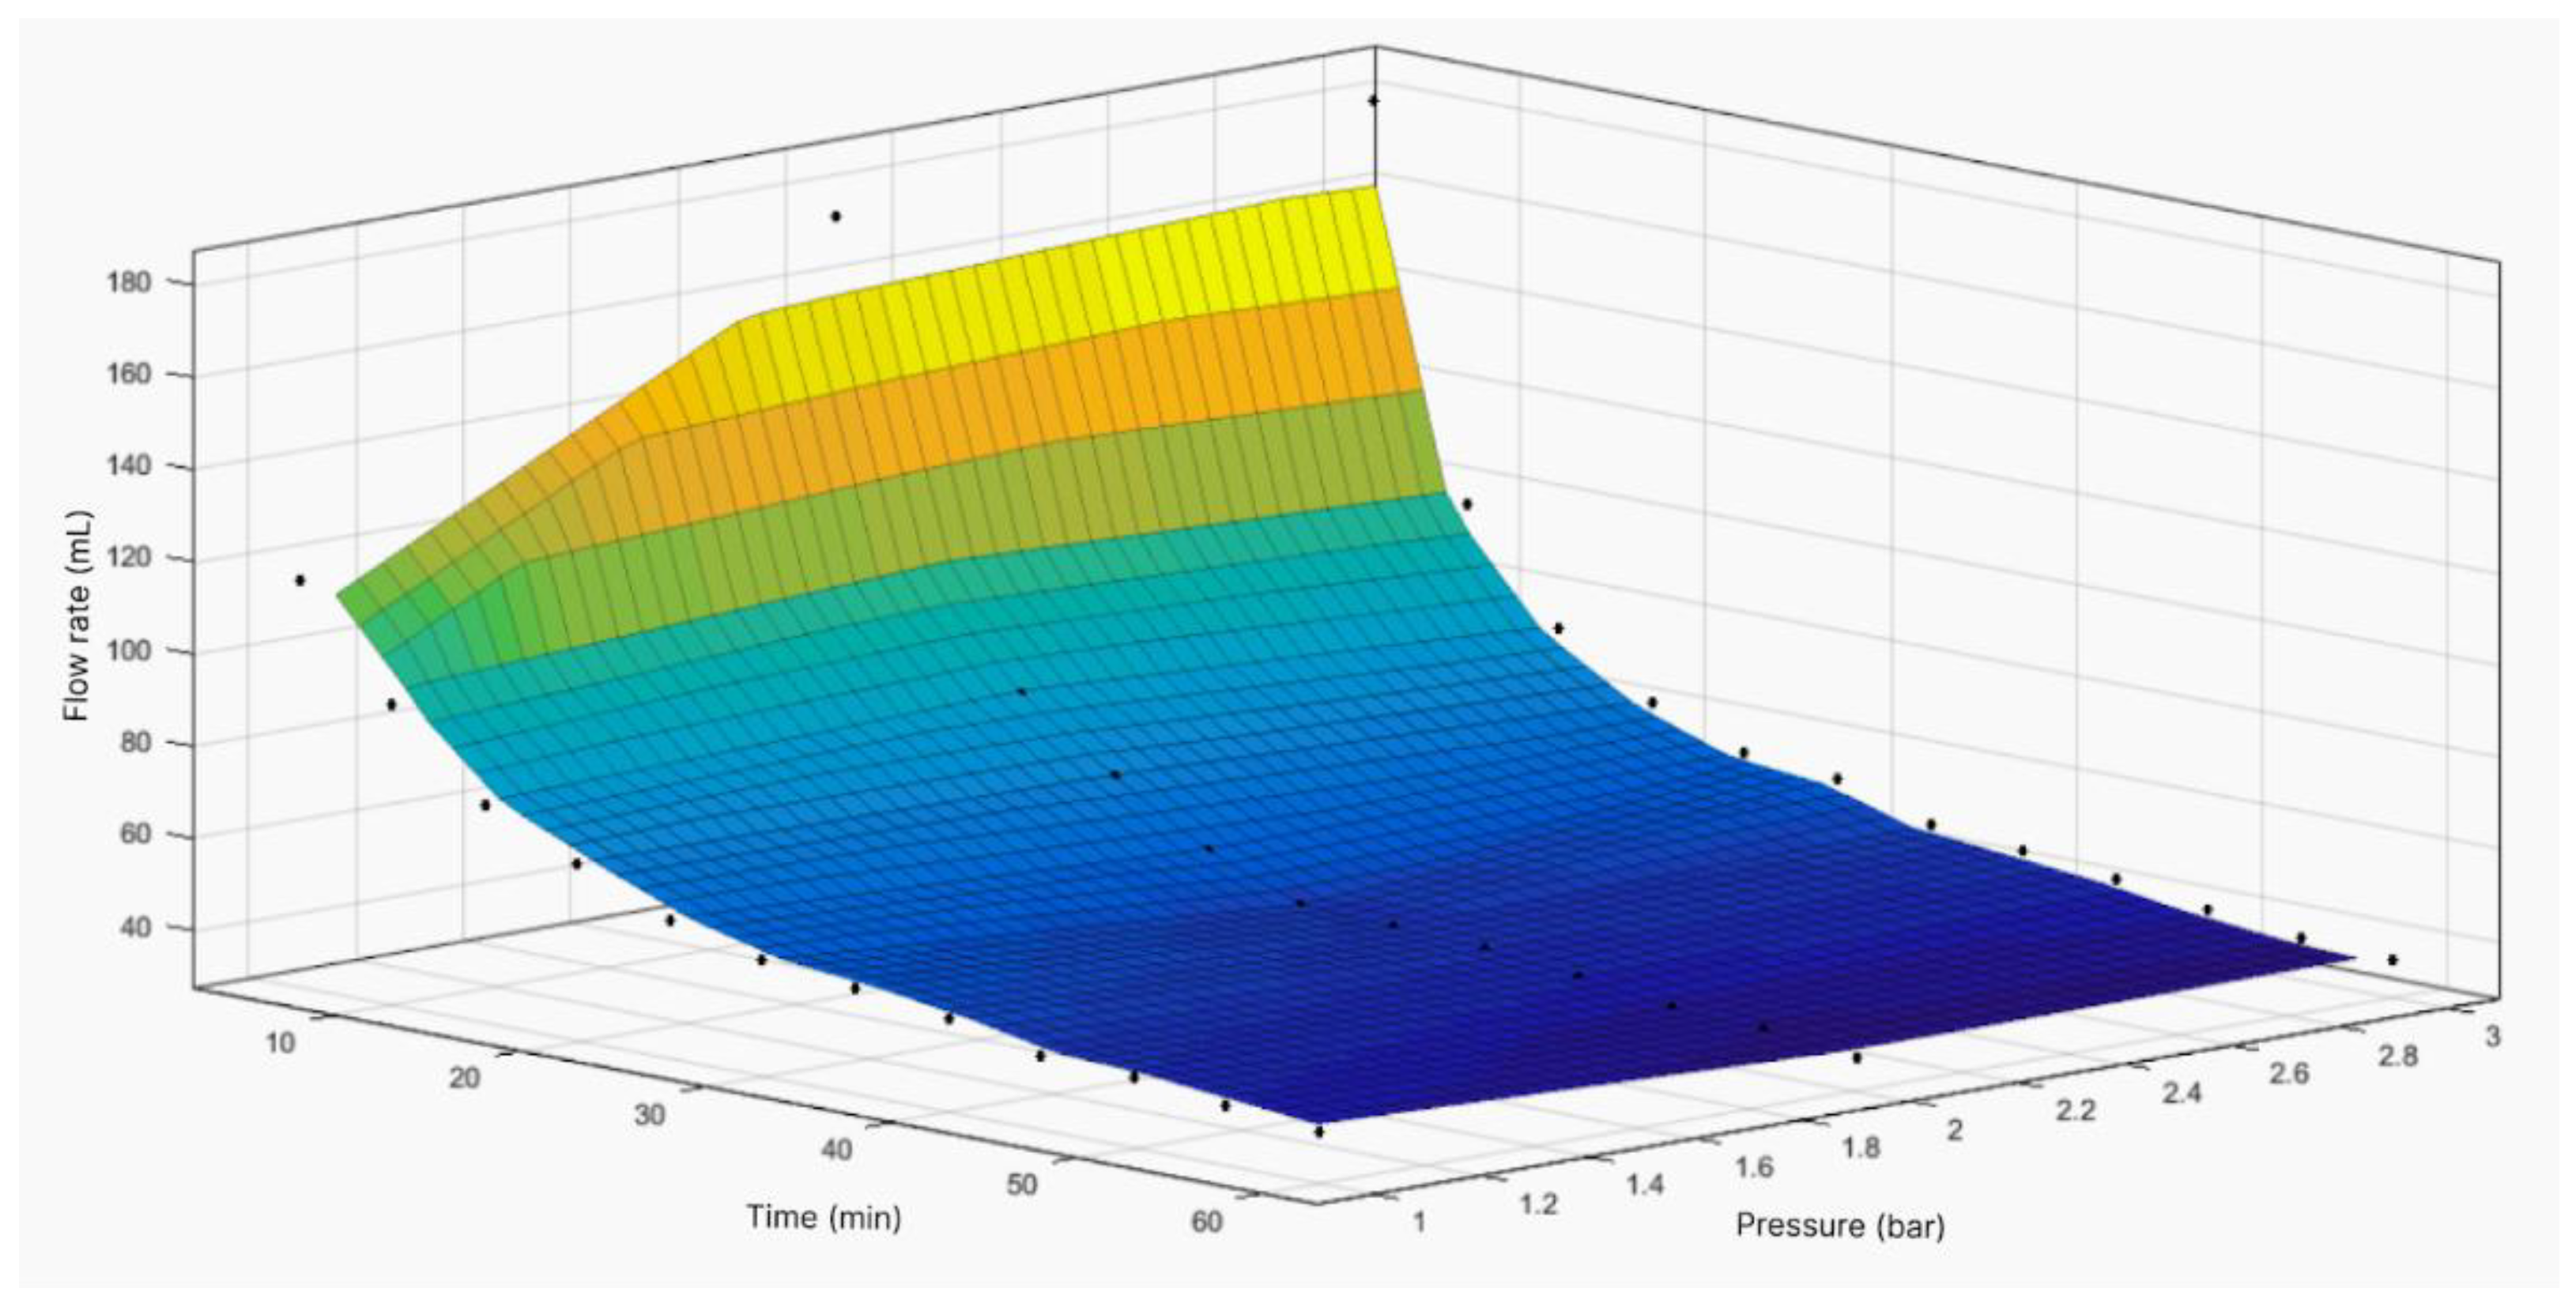
Figure 5.
Flow volume through module with area of 76.97 cm2 as function of time at pressures of 1, 2, and 3 bar.
Figure 5.
Flow volume through module with area of 76.97 cm2 as function of time at pressures of 1, 2, and 3 bar.
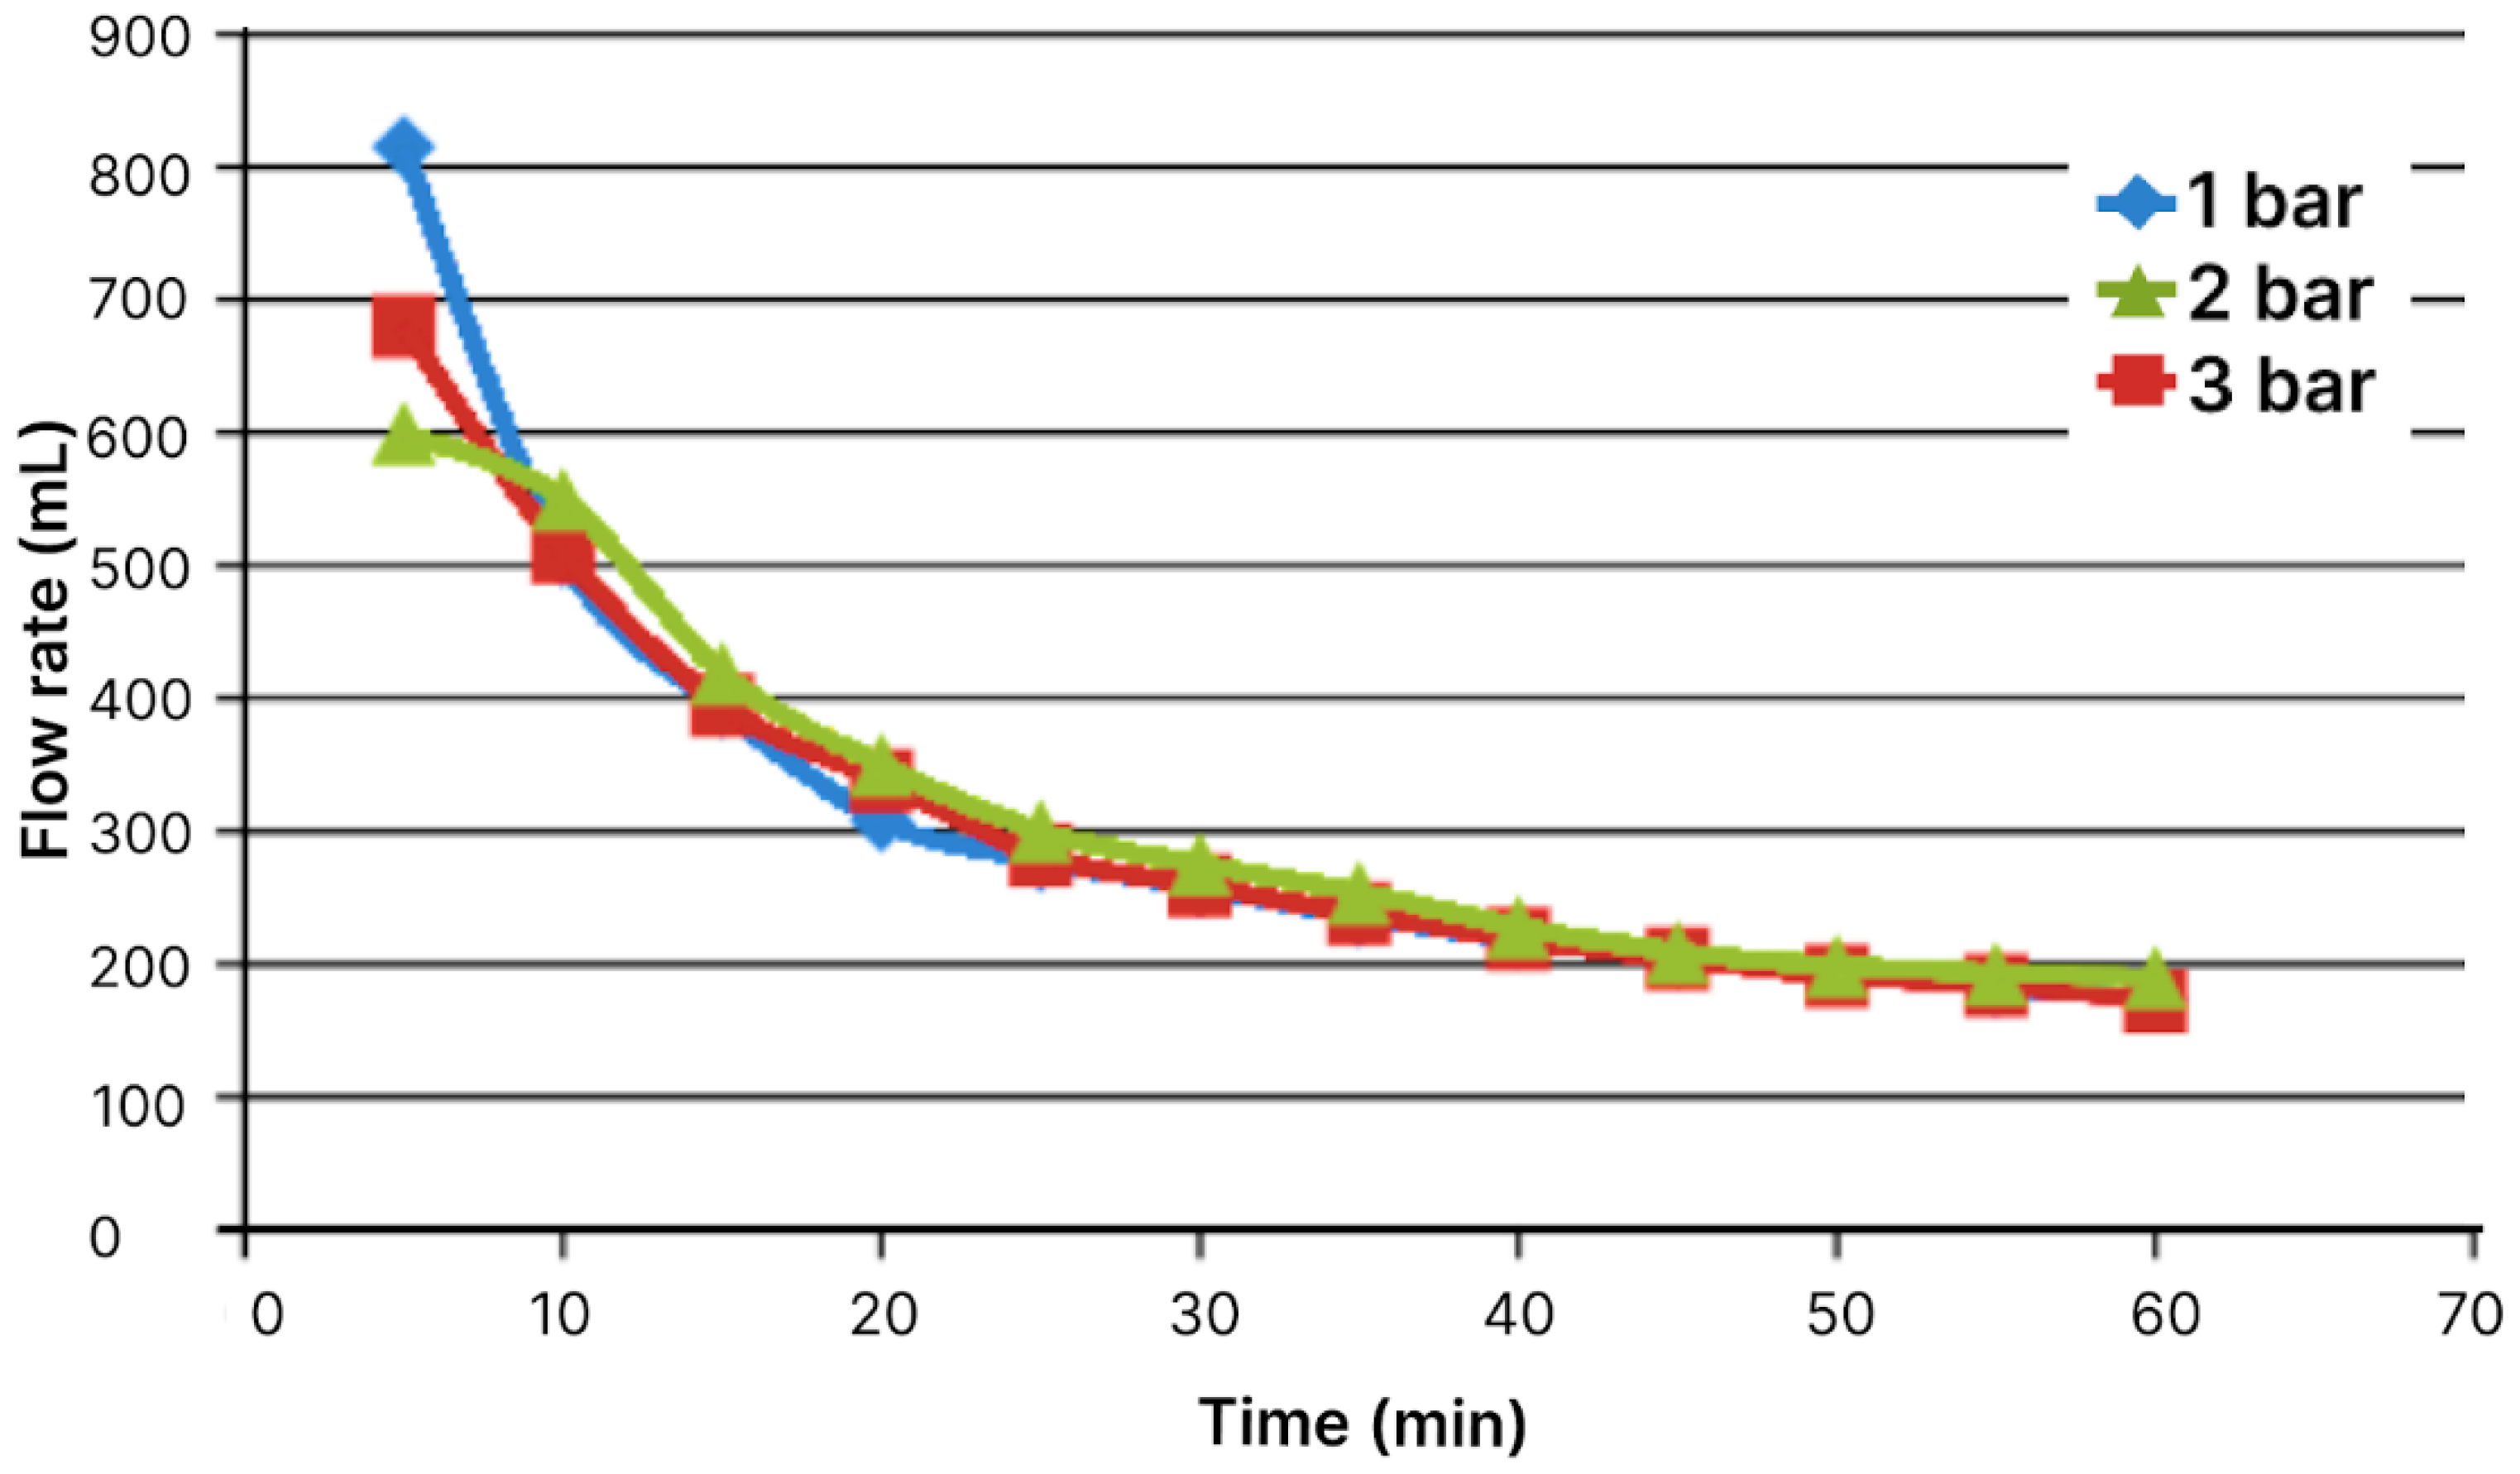
Figure 6.
Total flow volume through module with area of 76.97 cm2 in 60 minutes at pressure of 1, 2, and 3 bar.
Figure 6.
Total flow volume through module with area of 76.97 cm2 in 60 minutes at pressure of 1, 2, and 3 bar.
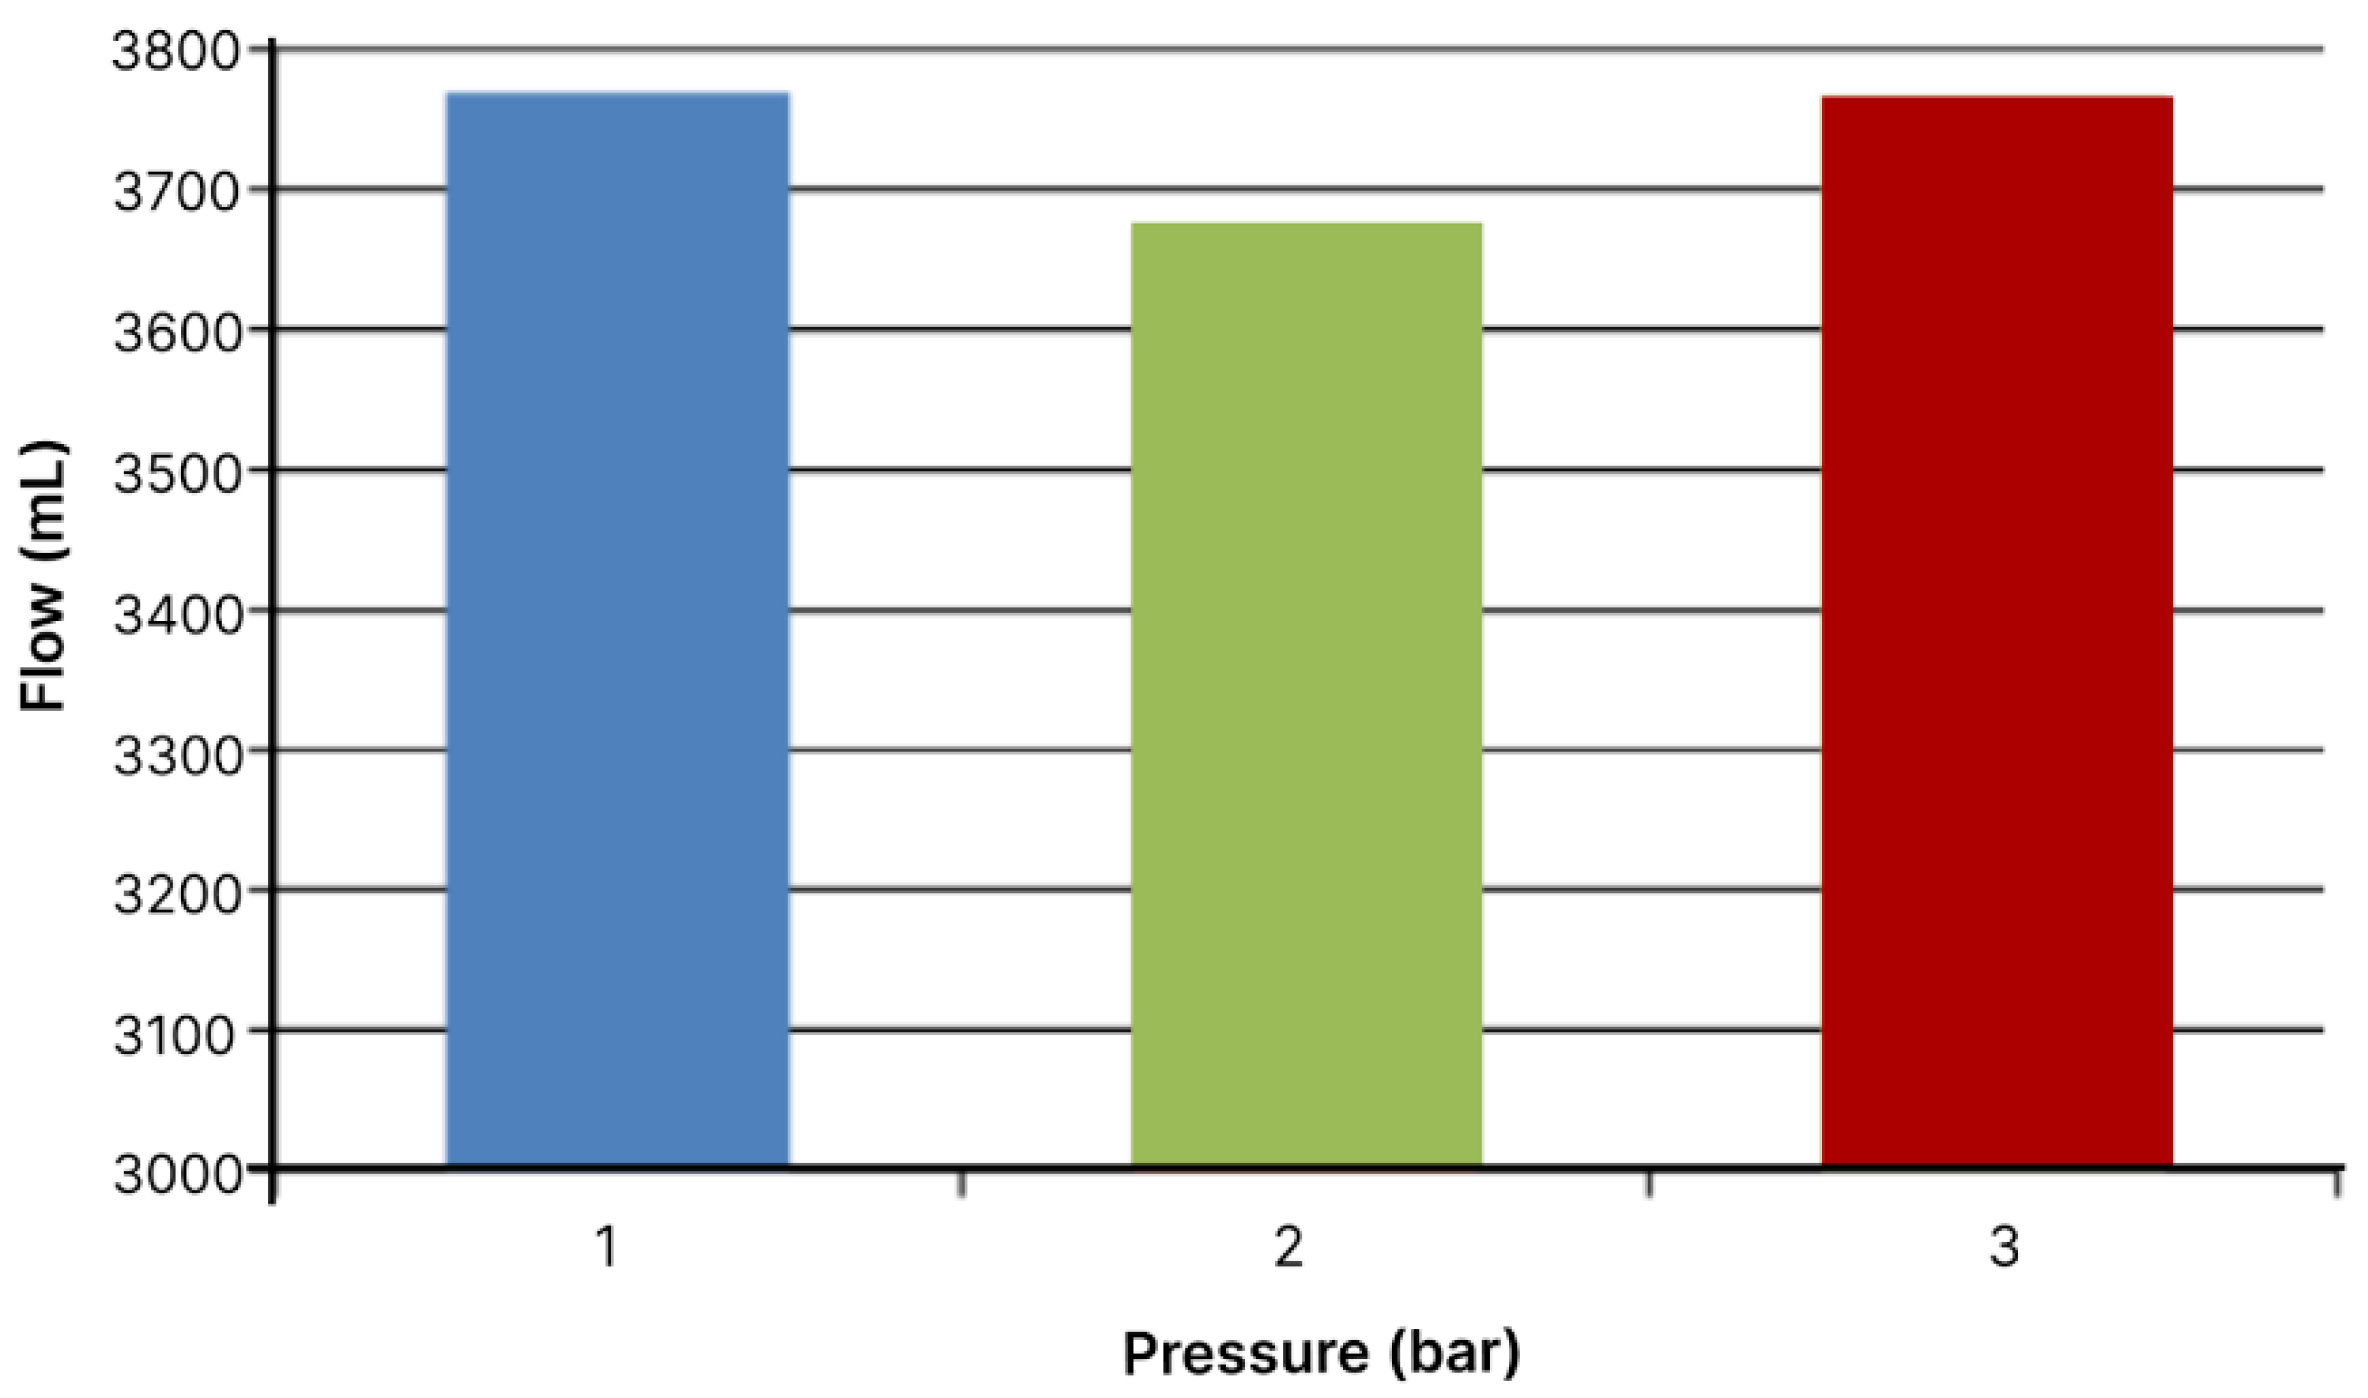
Figure 7.
Comparison of flow volumes at different pressures for the filtration module areas of 19.24 cm2 (left) and 76.97 cm2 (right).
Figure 7.
Comparison of flow volumes at different pressures for the filtration module areas of 19.24 cm2 (left) and 76.97 cm2 (right).
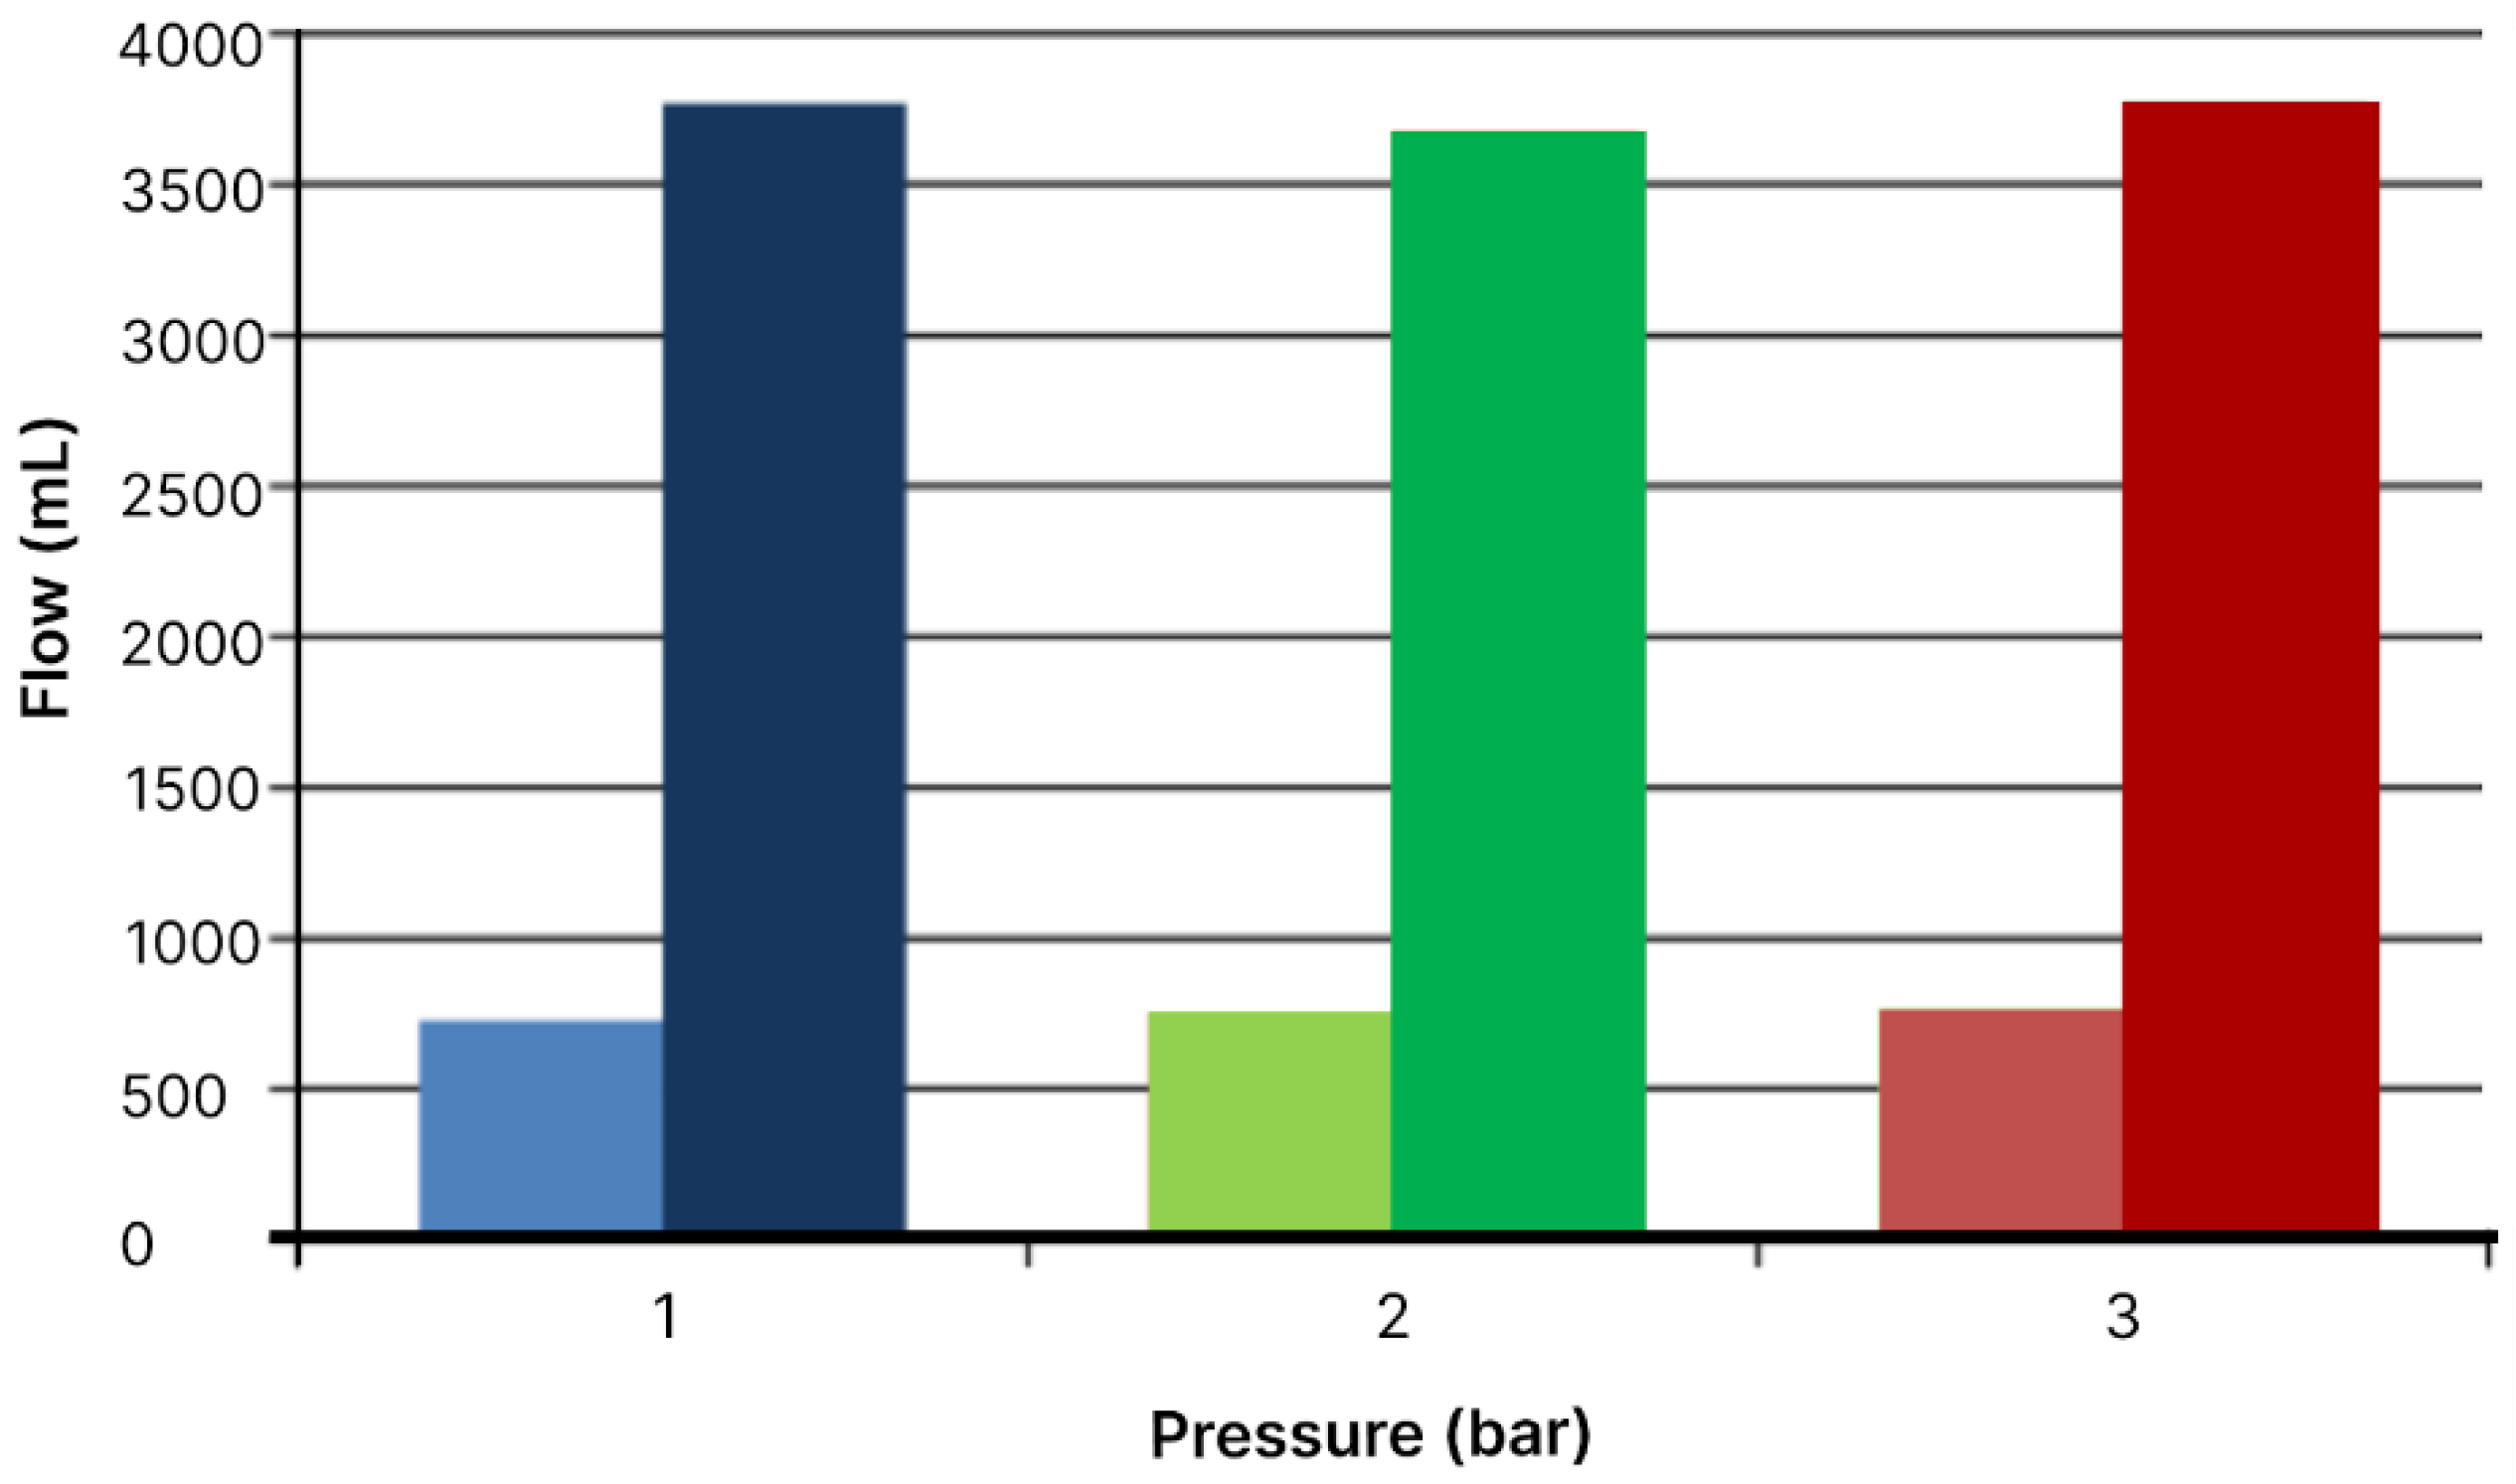
Figure 8.
Response surface of flow volume through module with area of 76.97 cm2 as function of time and pressure.
Figure 8.
Response surface of flow volume through module with area of 76.97 cm2 as function of time and pressure.
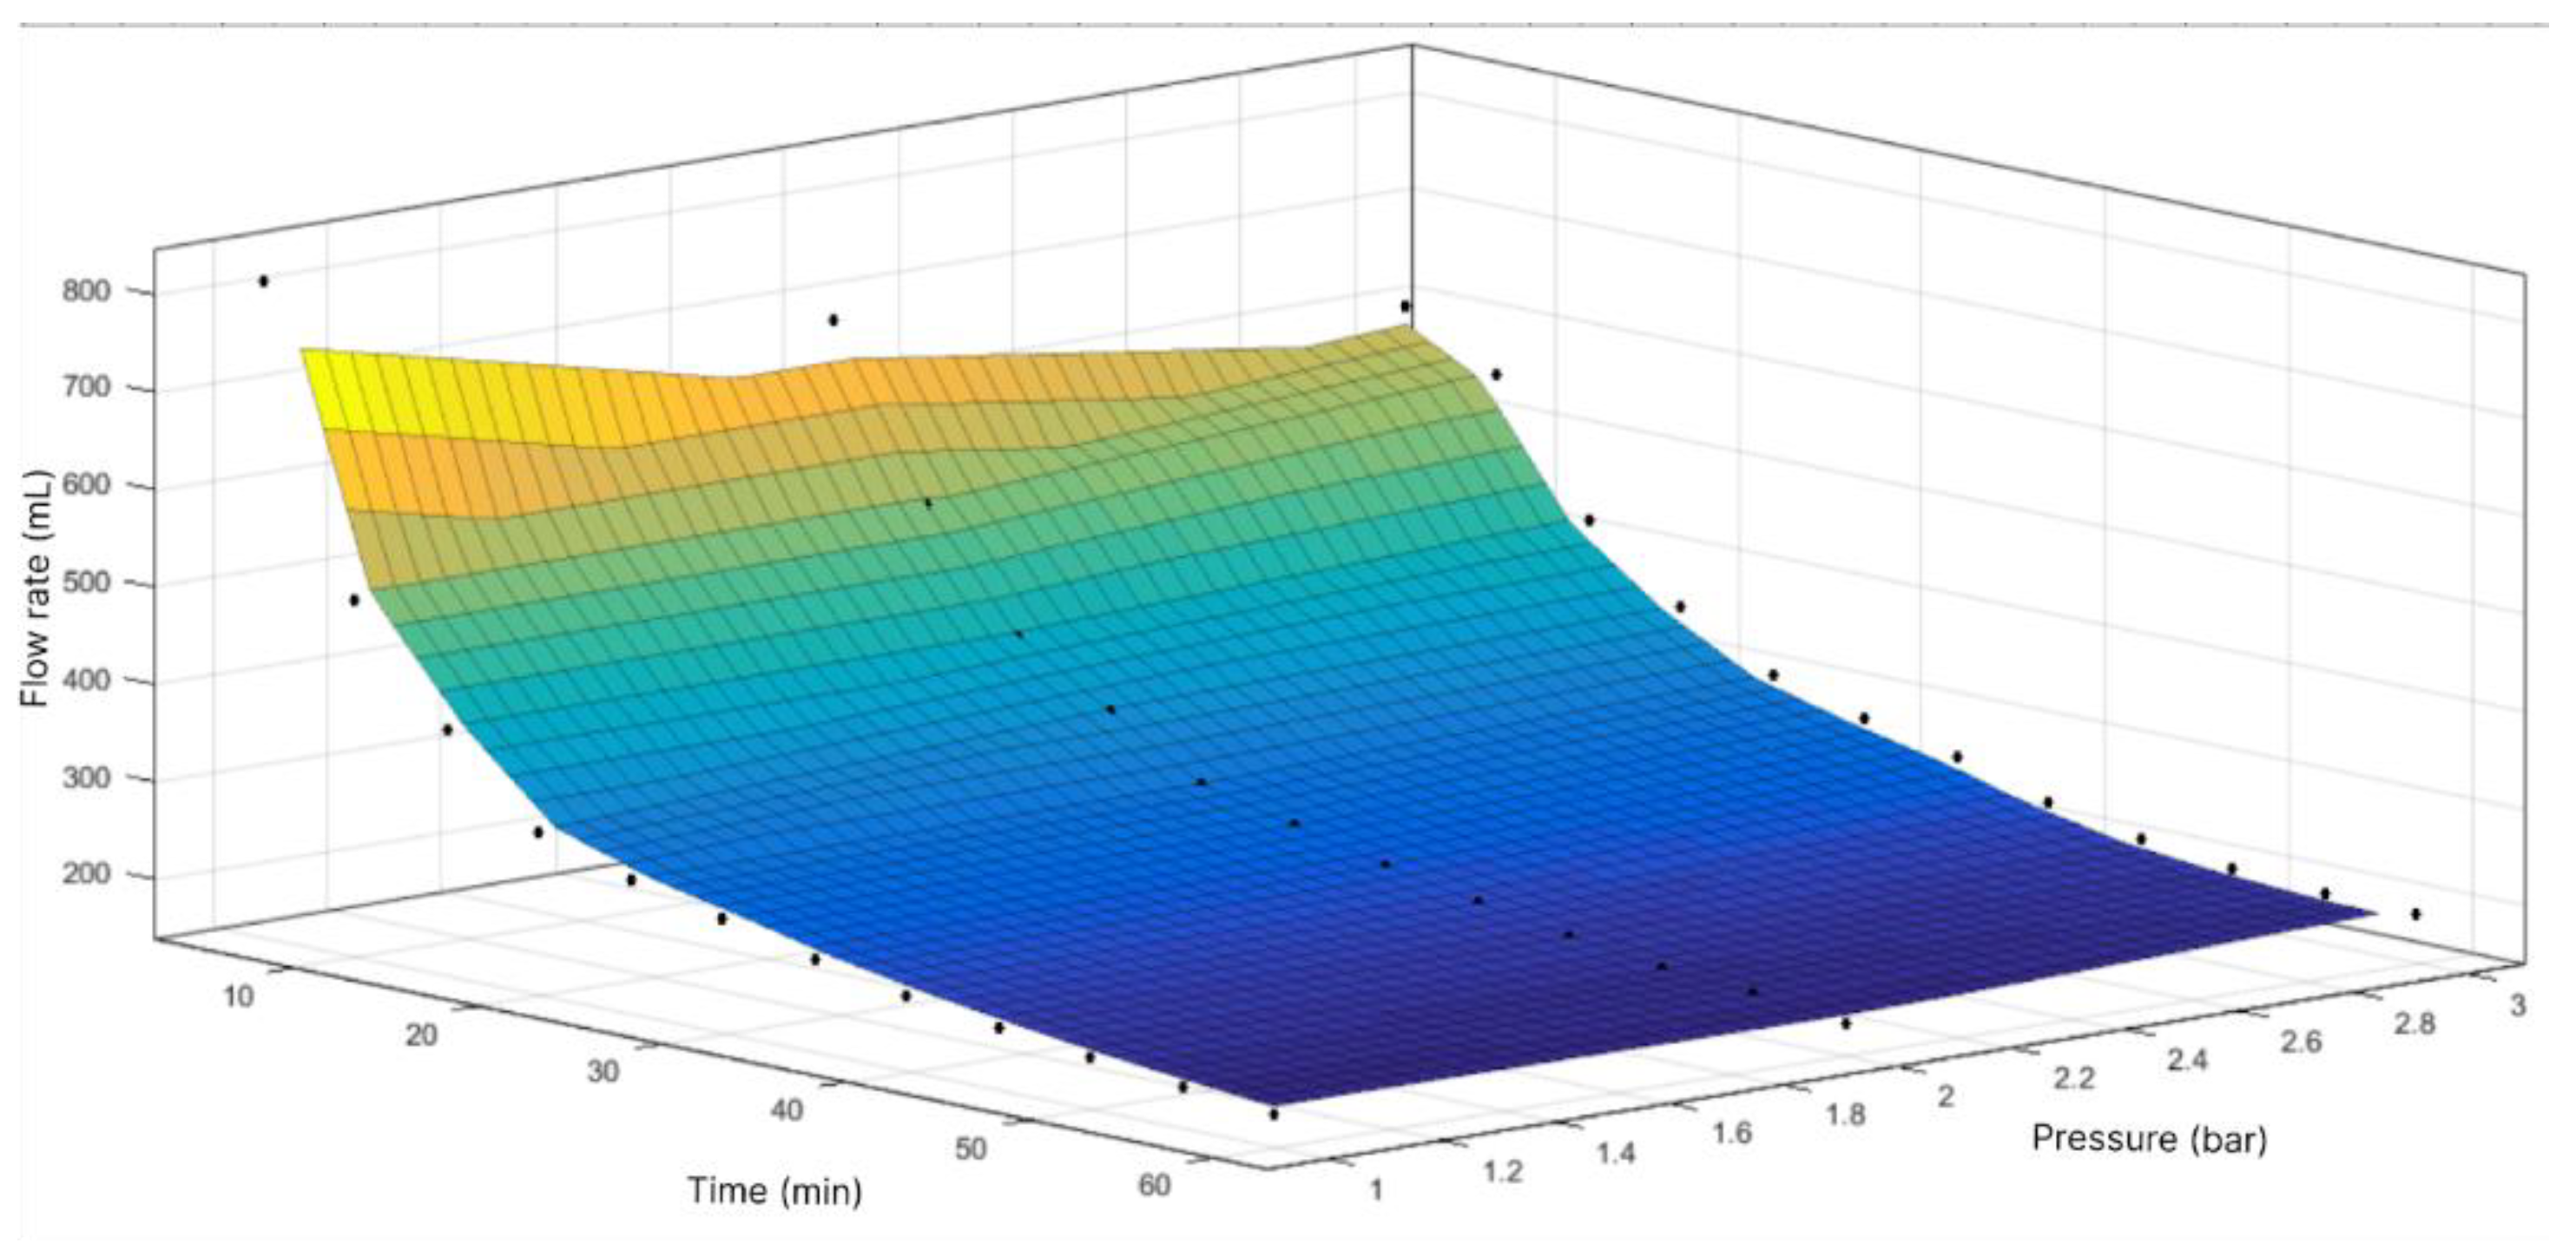
Figure 9.
Response surface of flow volume as function of time and area.
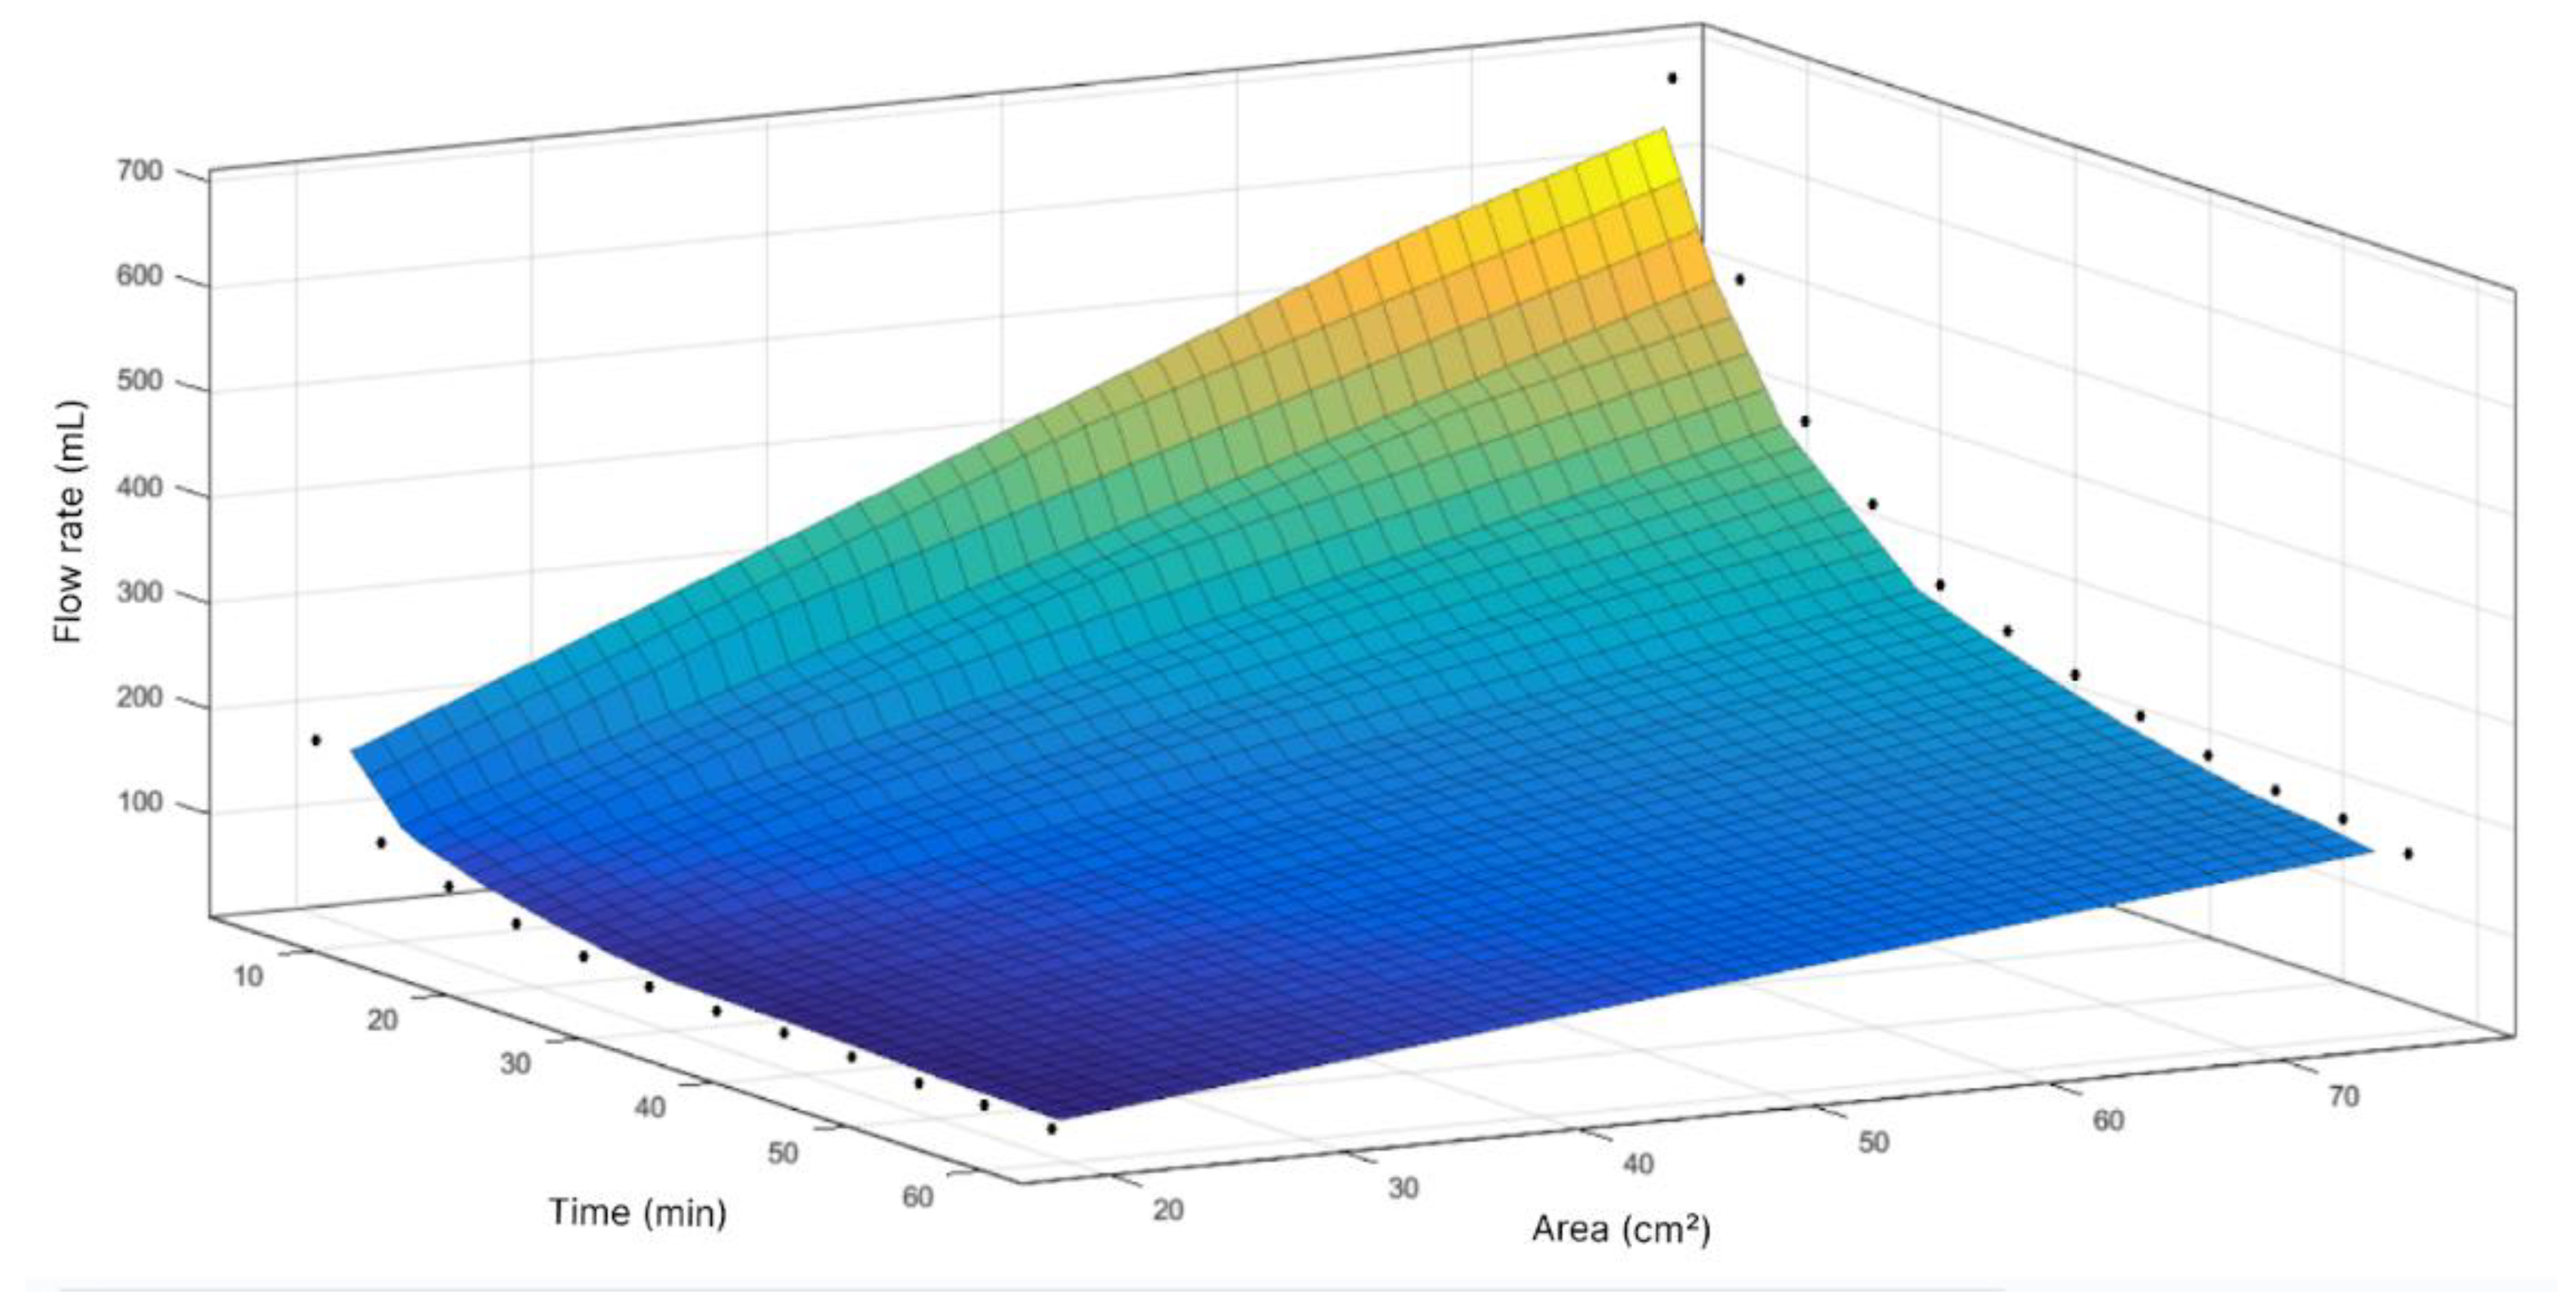
Figure 10.
Infrared spectrum of bacterial cellulose membrane after filtration.
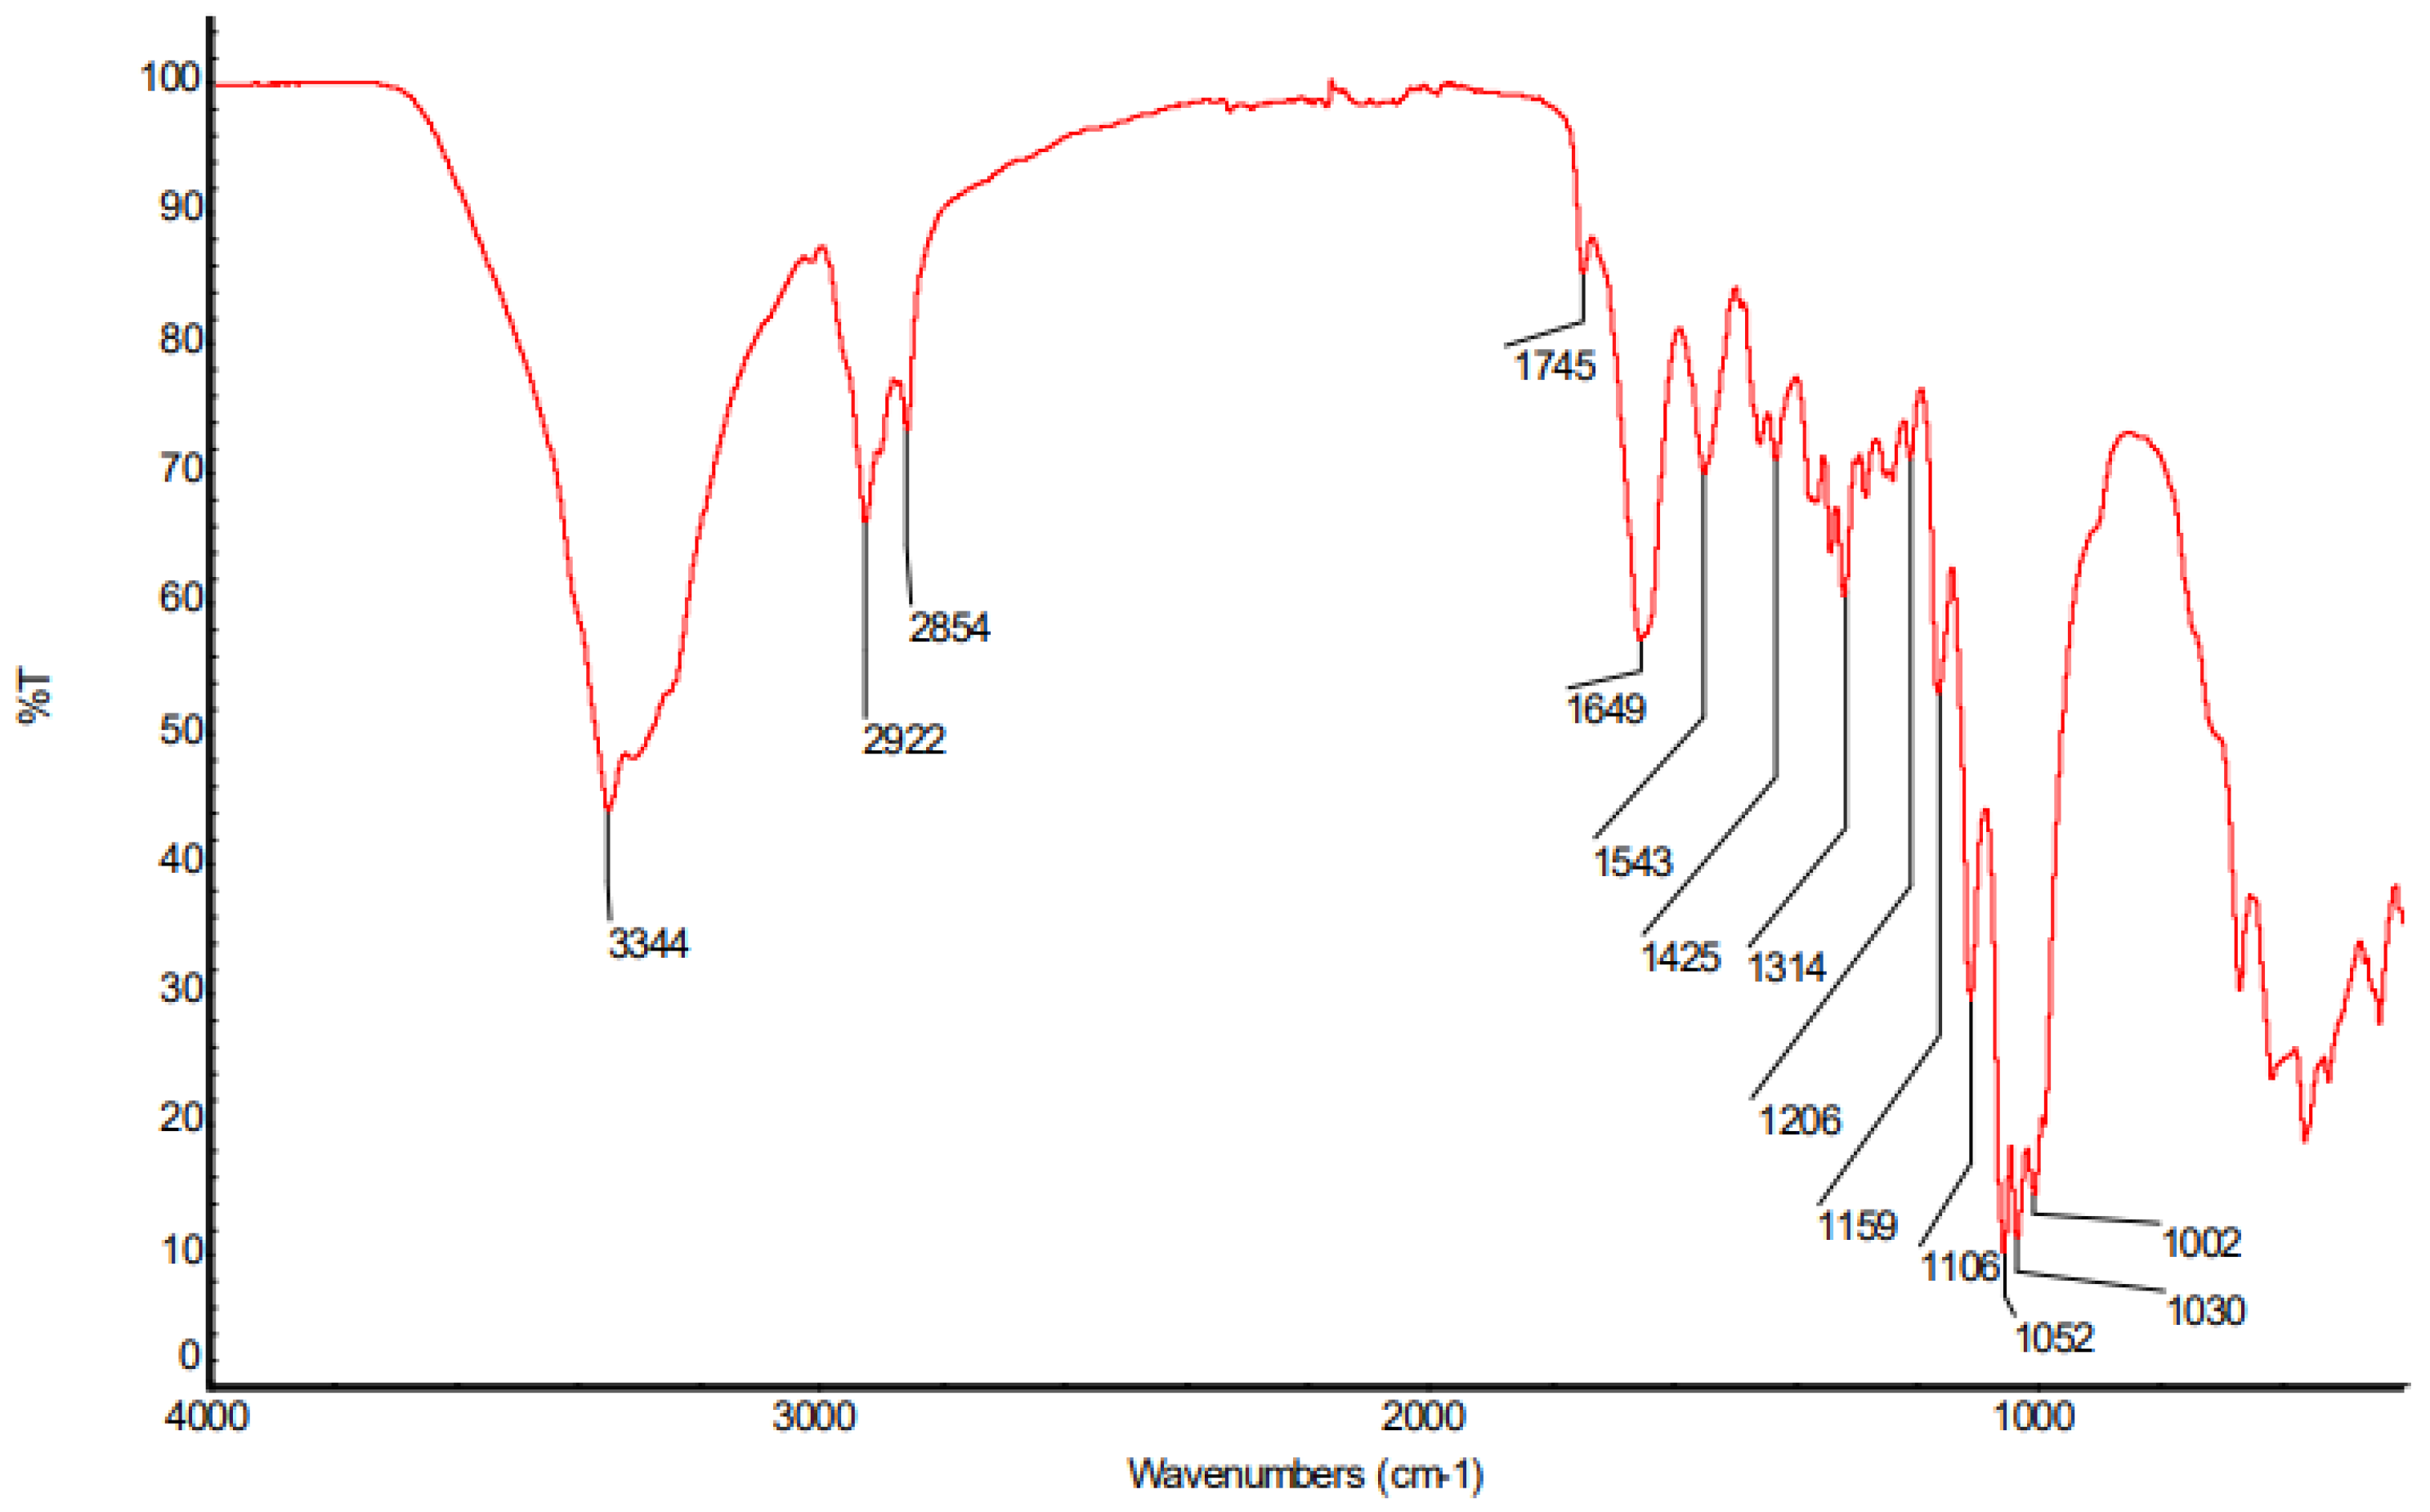
Figure 11.
Results of thermogravimetric analysis of BC samples before and after filtration of wastewater contaminated with oil.
Figure 11.
Results of thermogravimetric analysis of BC samples before and after filtration of wastewater contaminated with oil.
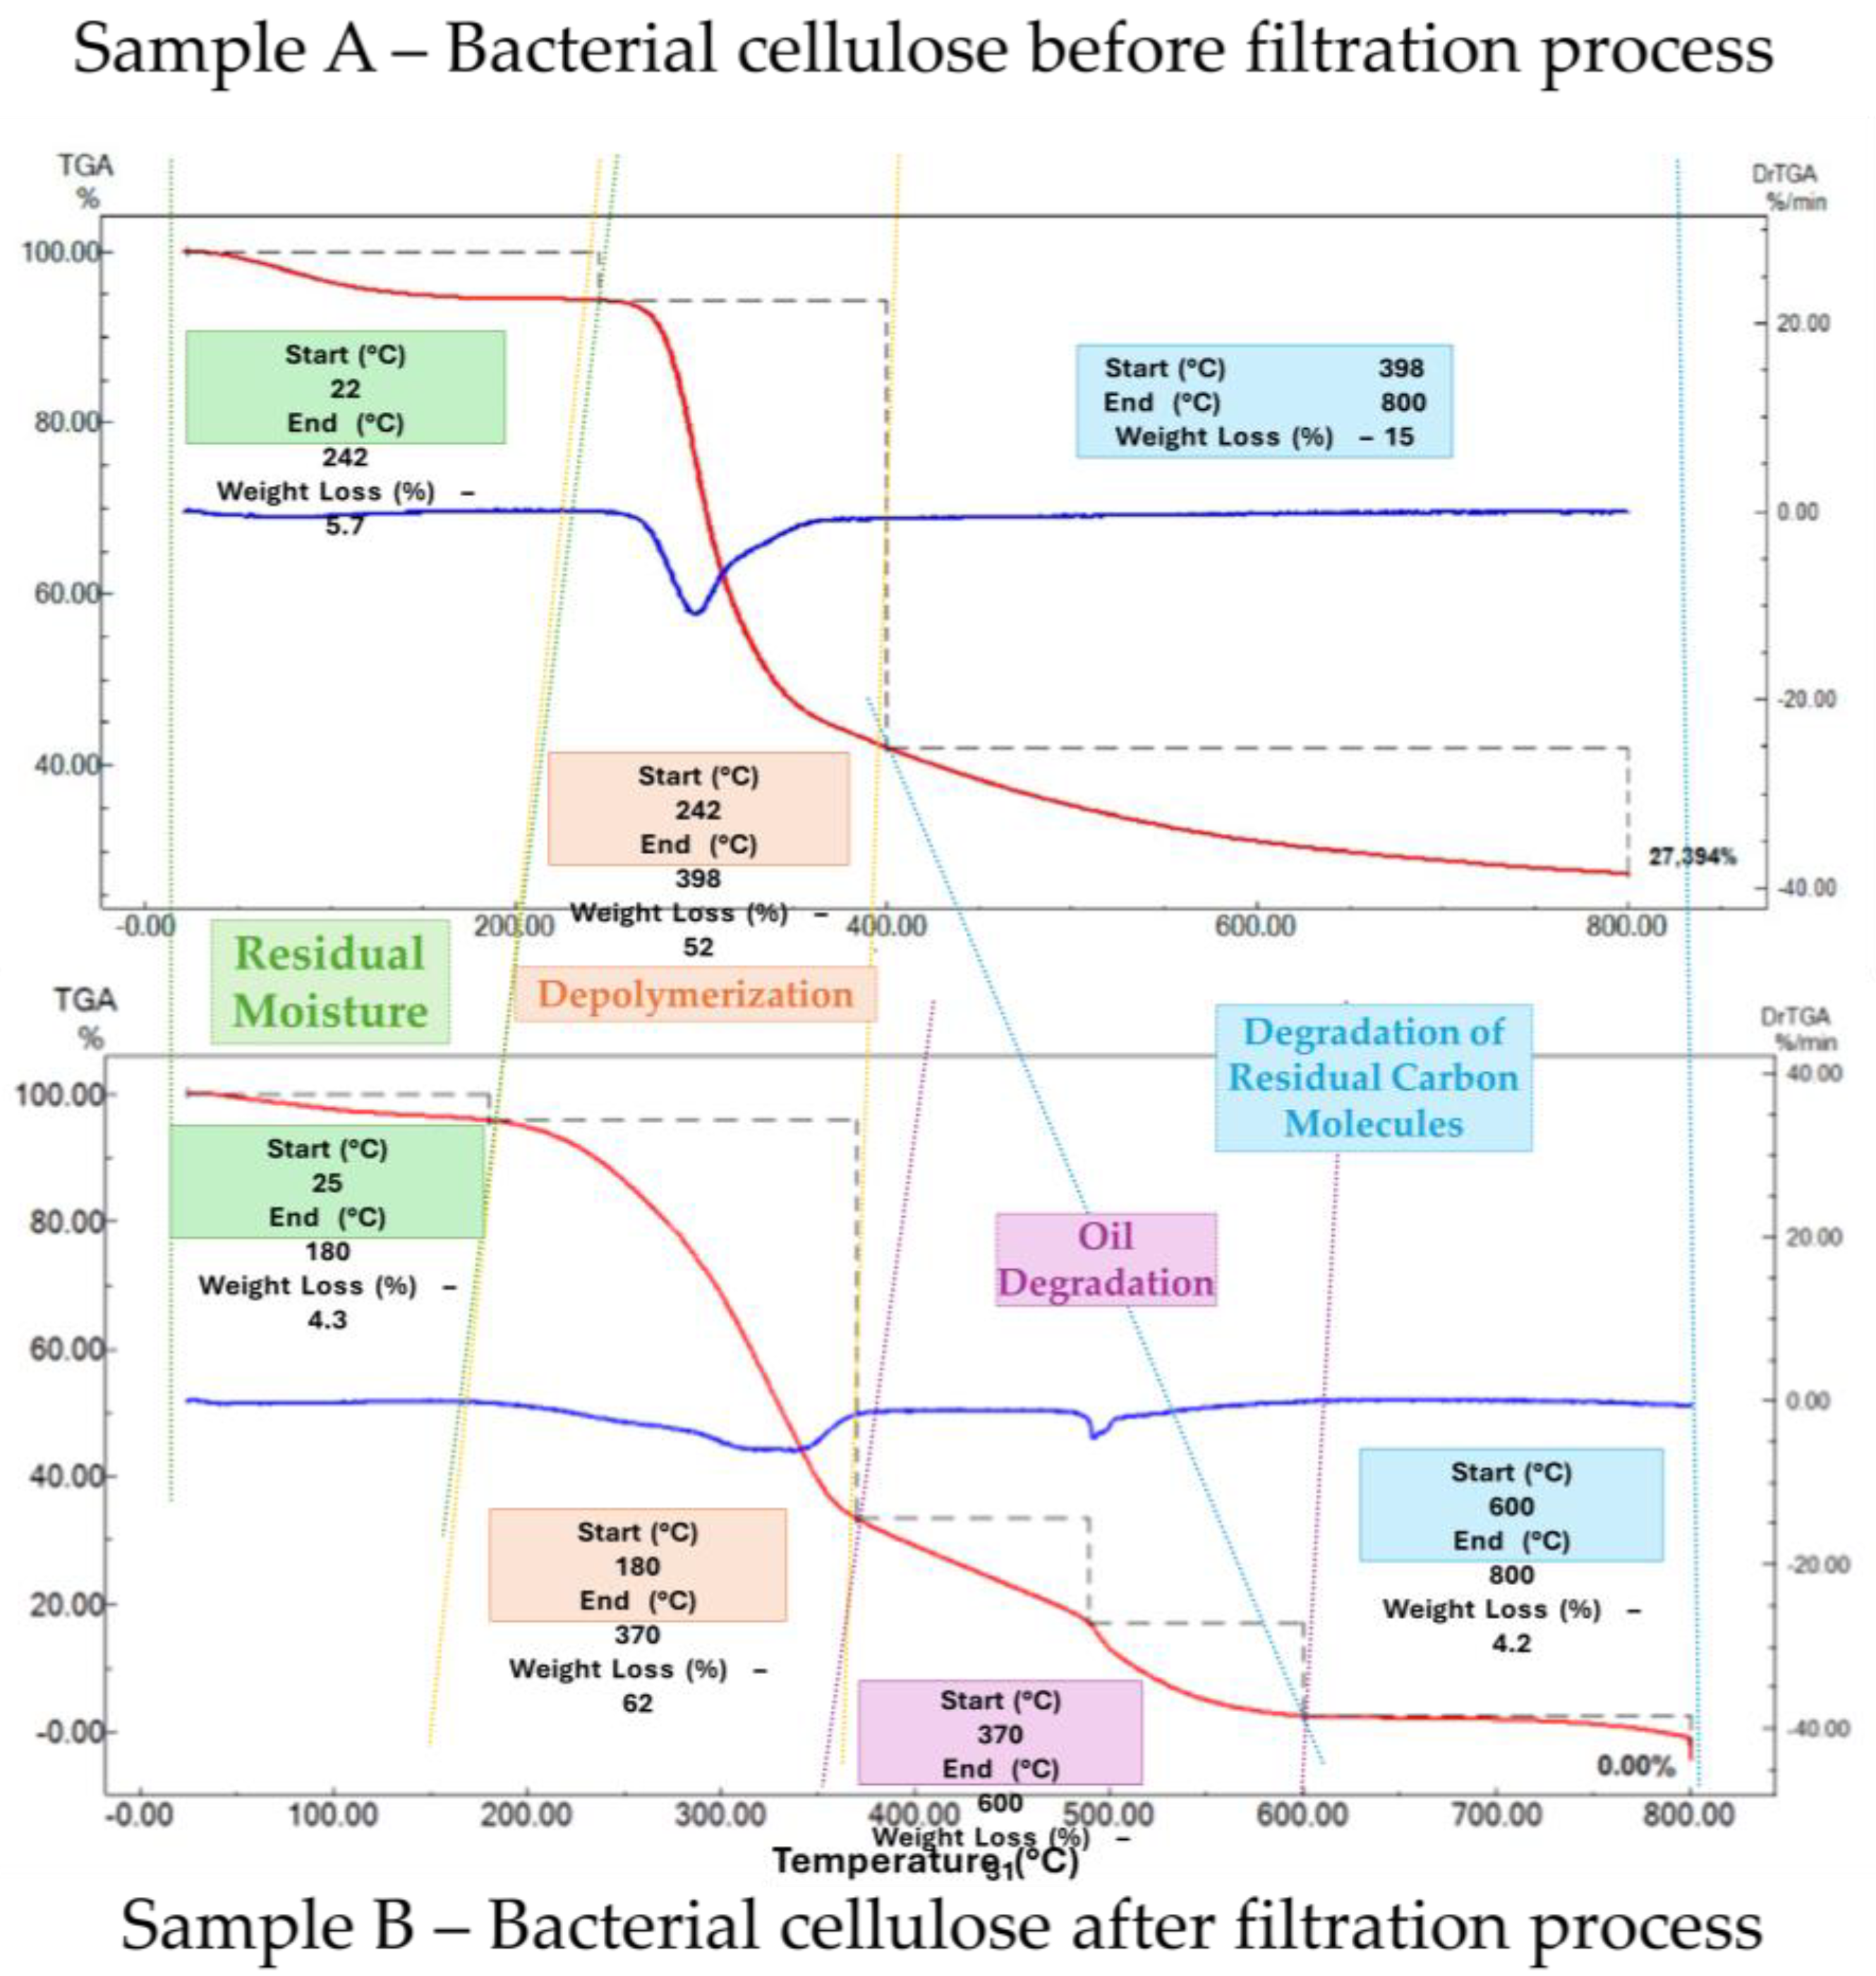
Figure 12.
Diffractogram of bacterial cellulose after filtration.
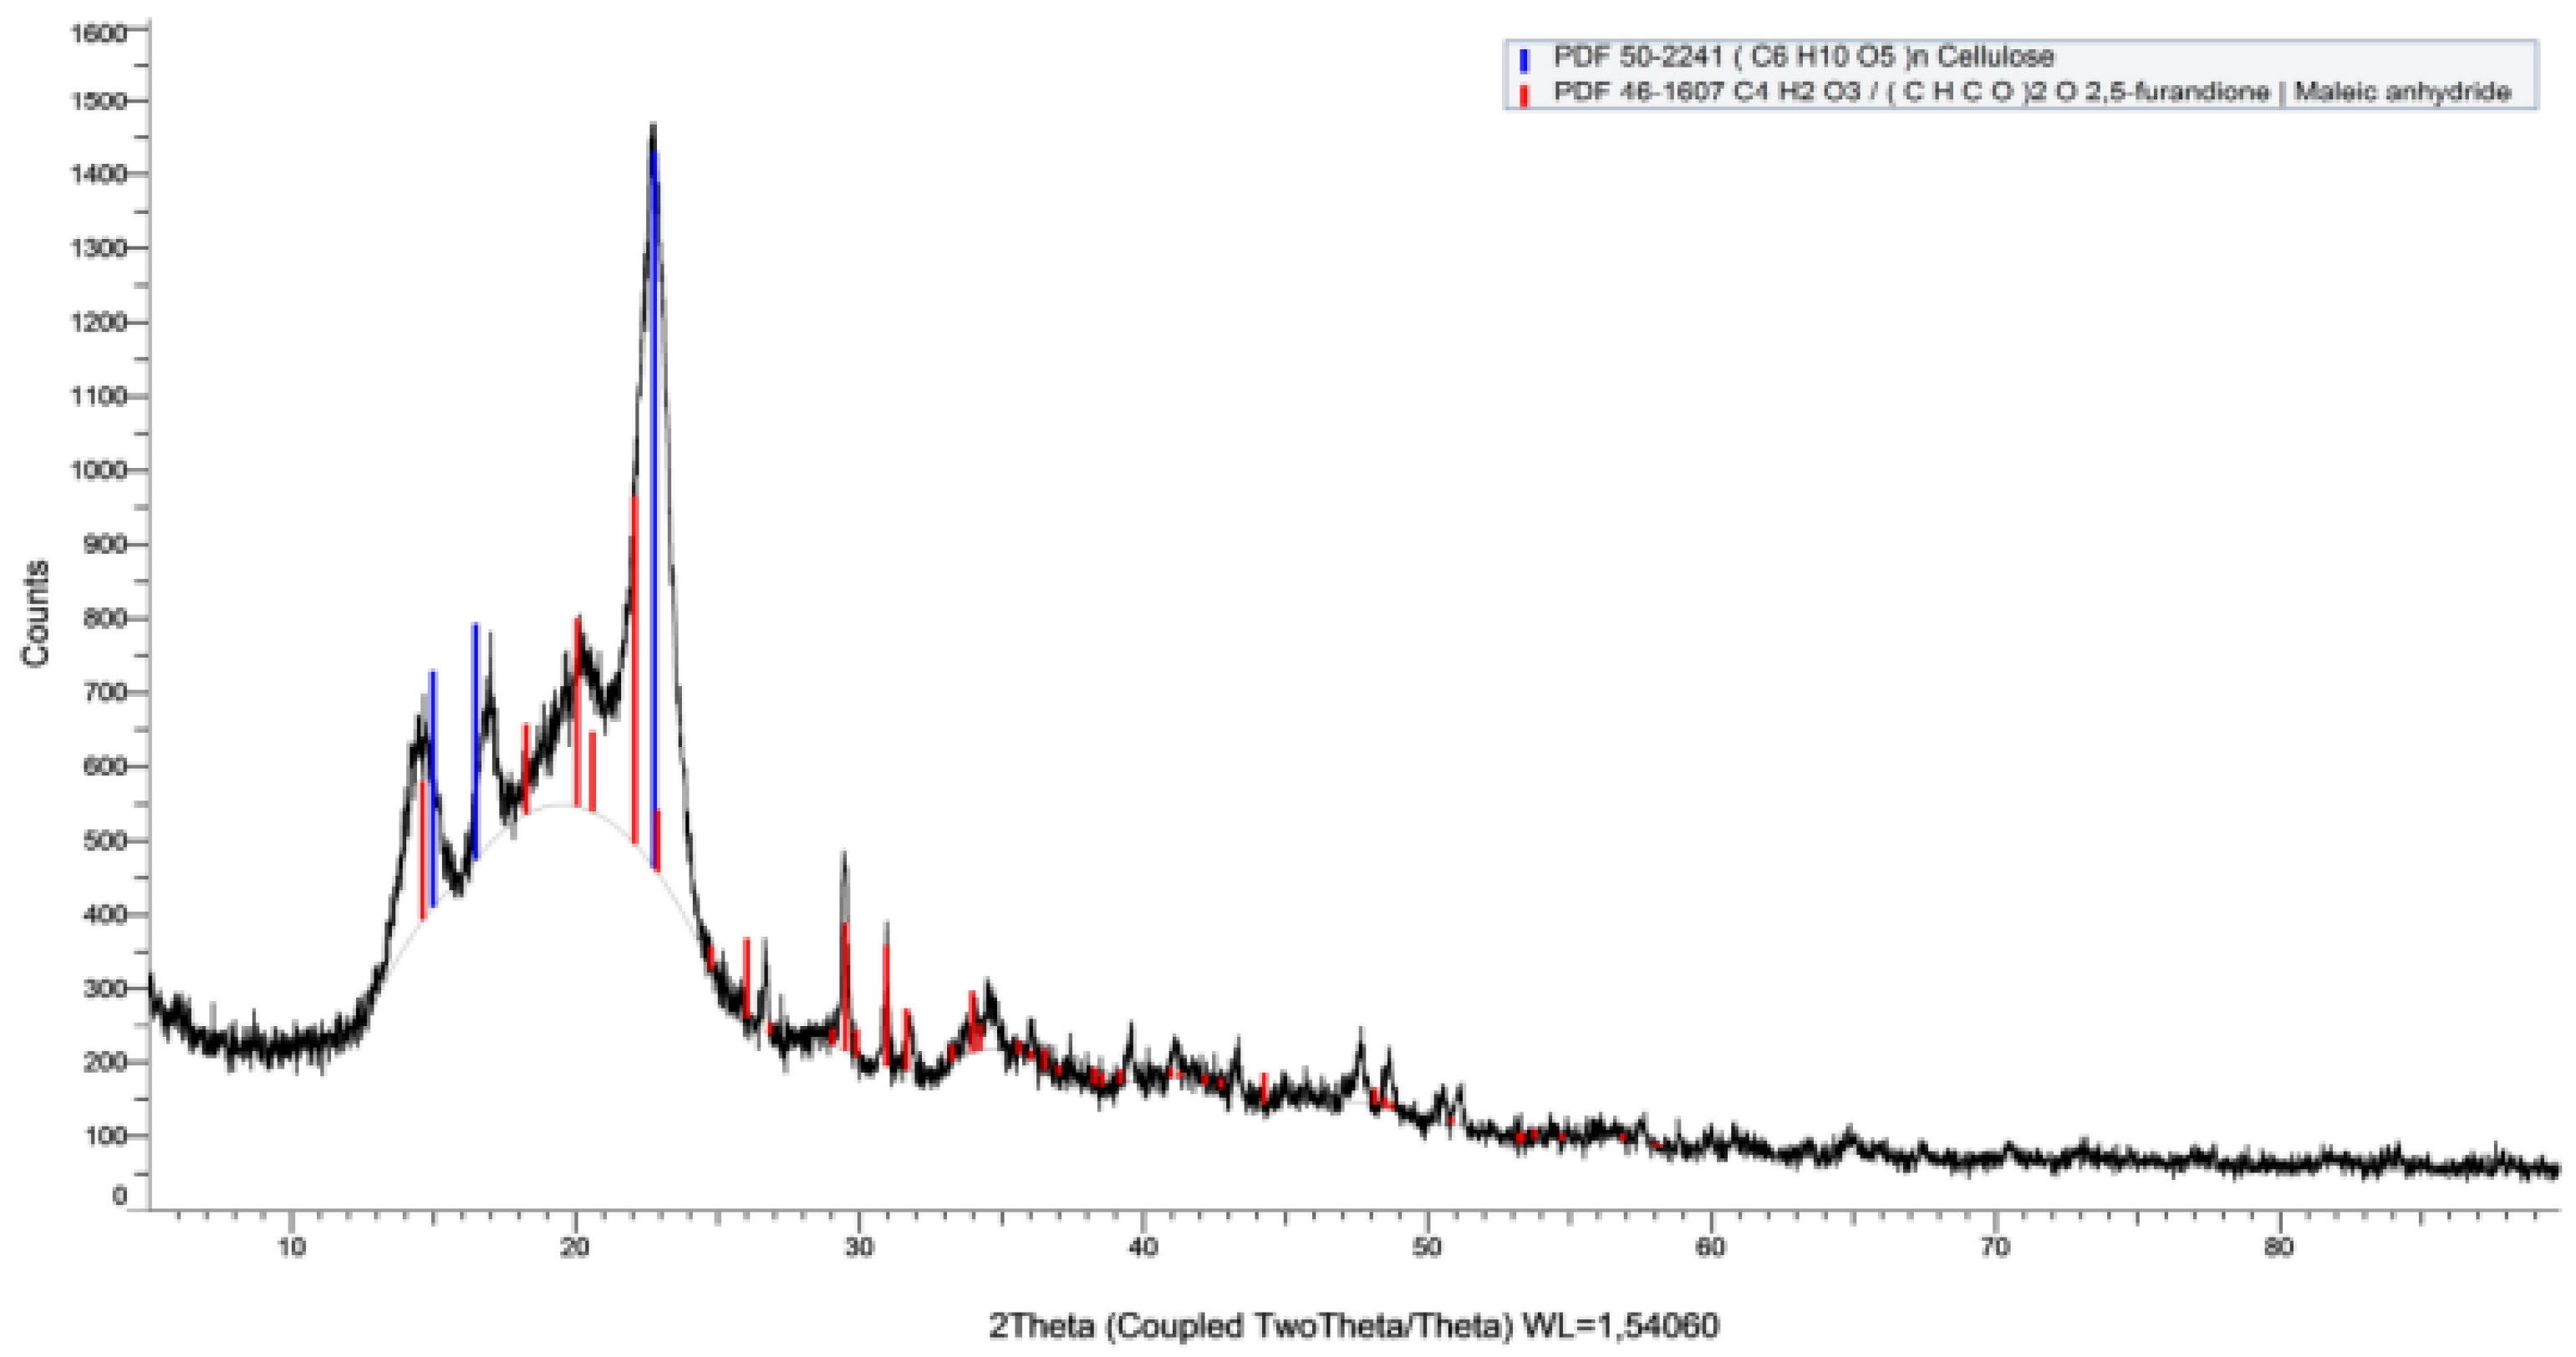
Figure 13.
Bacterial cellulose membrane used in filtration tests with nomenclature of “A”, “B”, to “C” to right of pores analysed.
Figure 13.
Bacterial cellulose membrane used in filtration tests with nomenclature of “A”, “B”, to “C” to right of pores analysed.
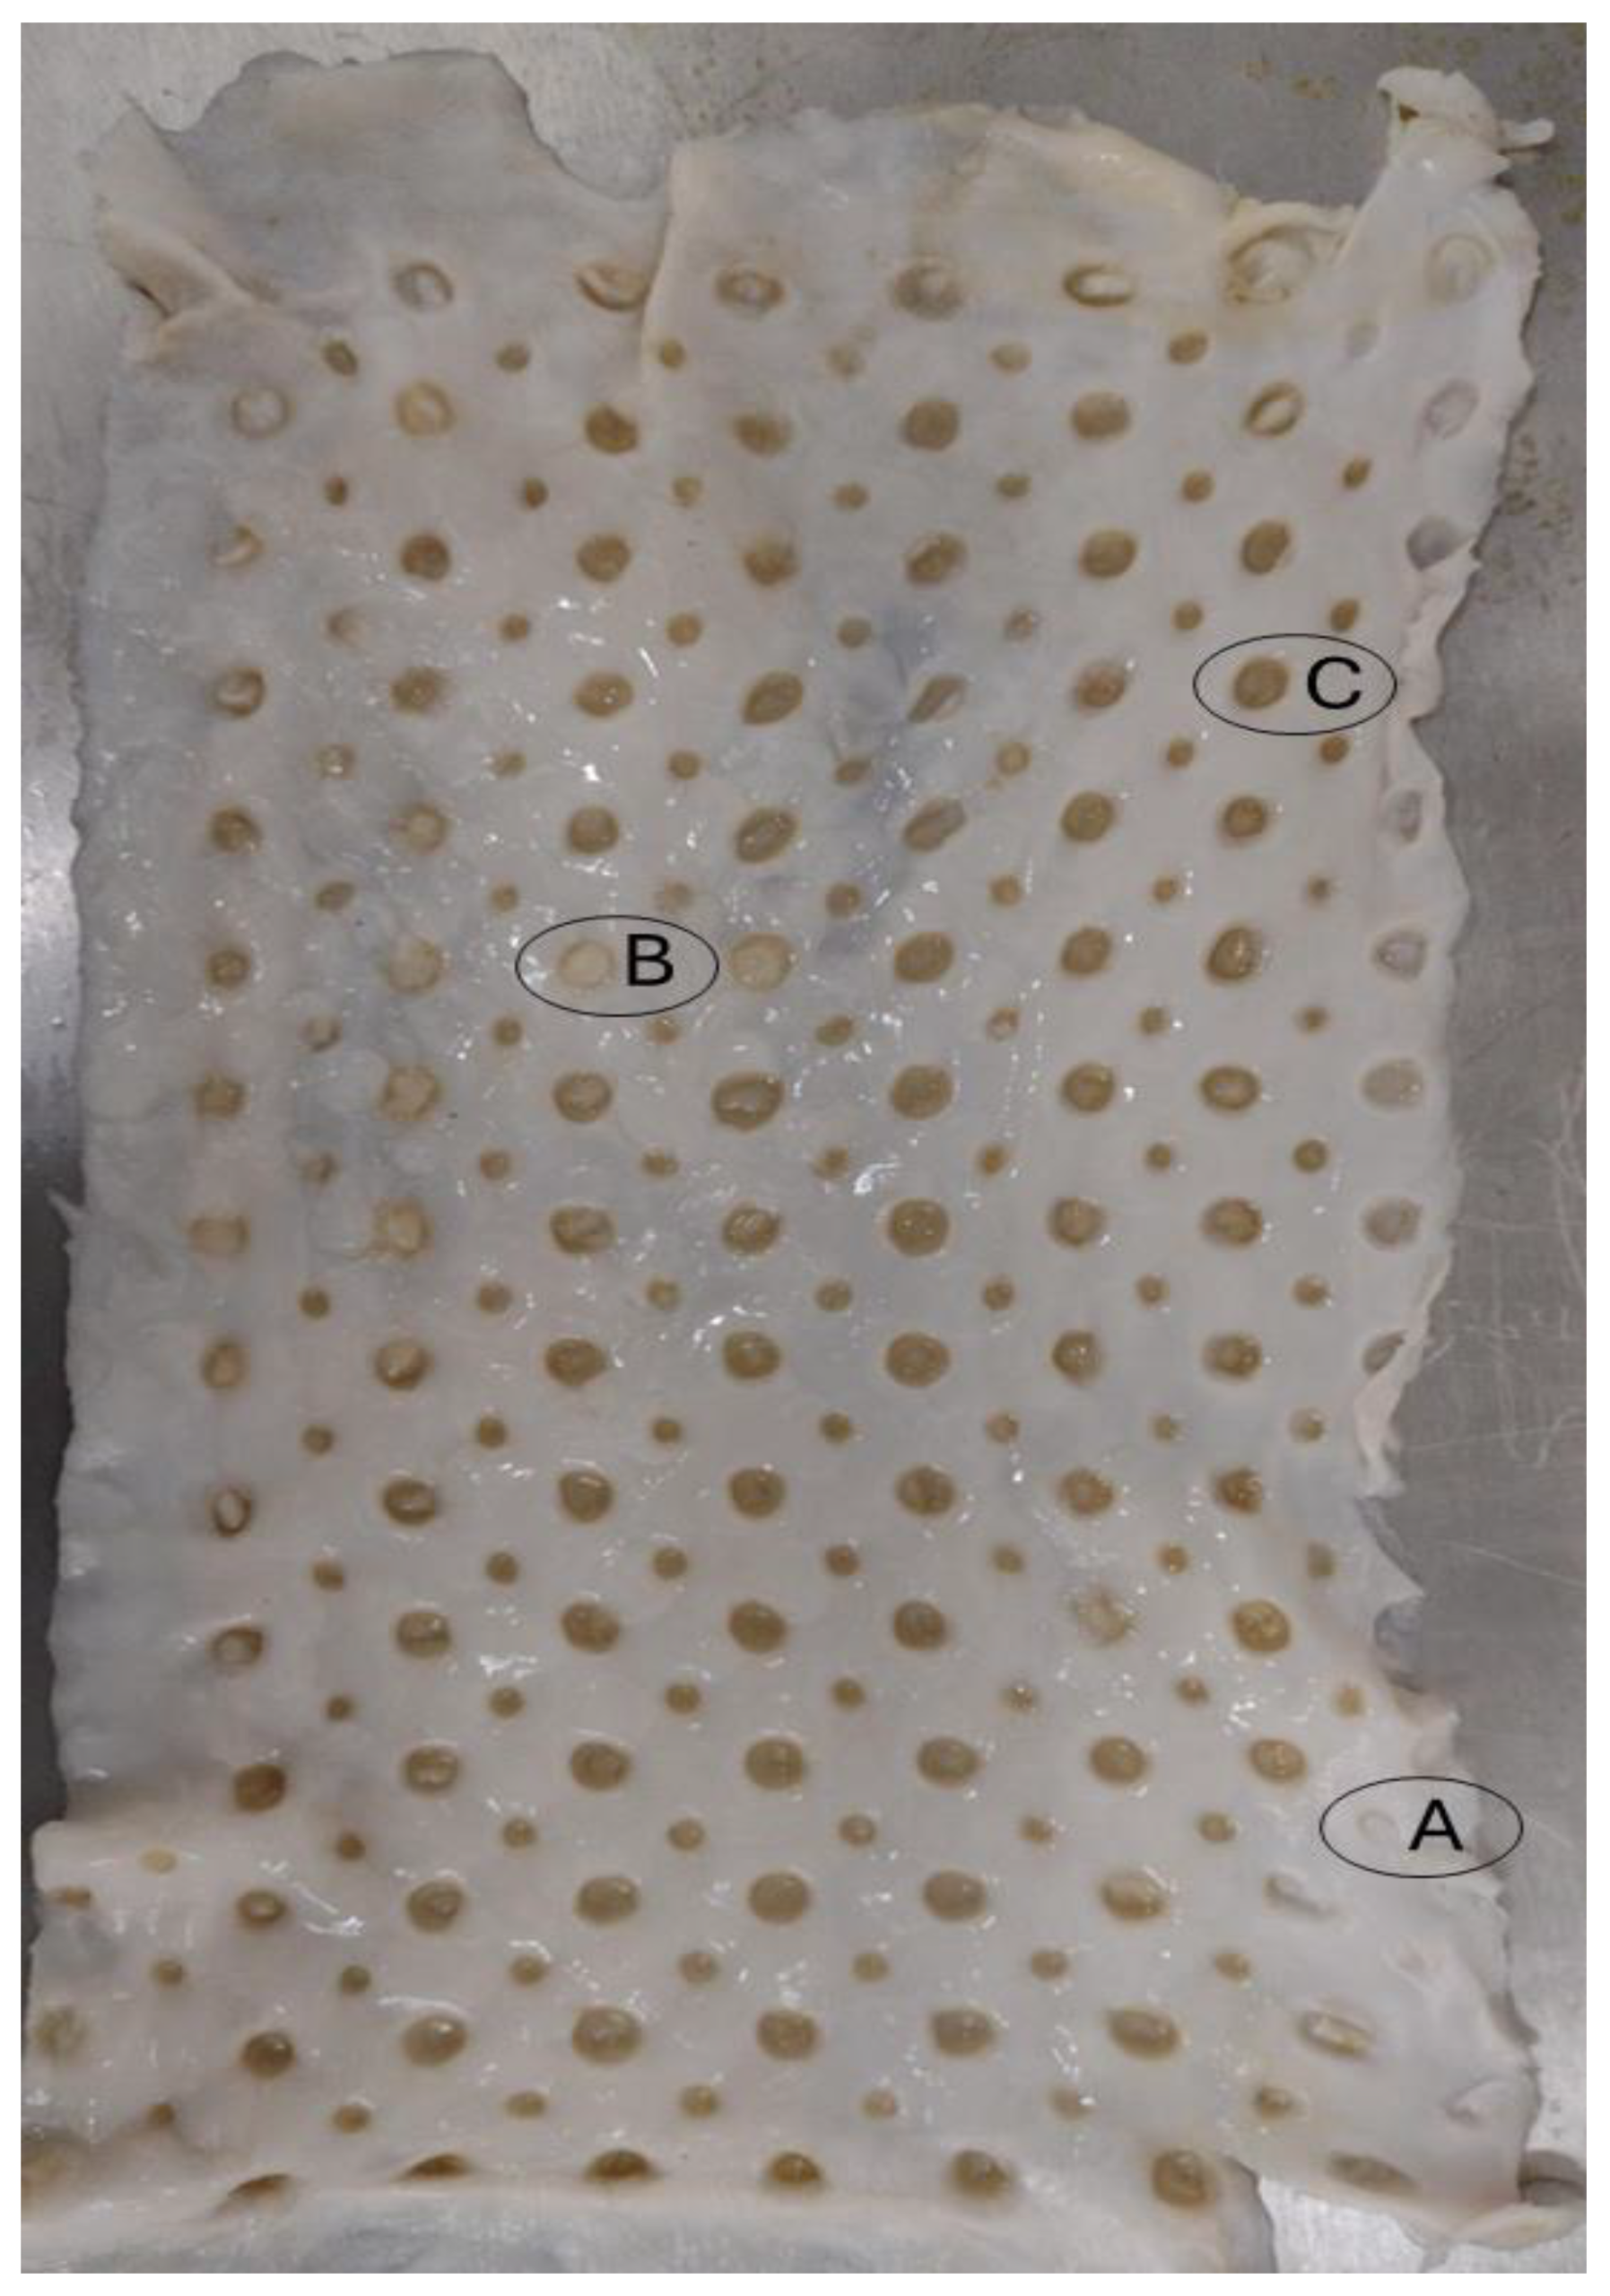
Figure 14.
Optical microscopy of pore A of BC membrane used for filtration (magnification left to right: 4x, 10x, 40x, and 100x).
Figure 14.
Optical microscopy of pore A of BC membrane used for filtration (magnification left to right: 4x, 10x, 40x, and 100x).
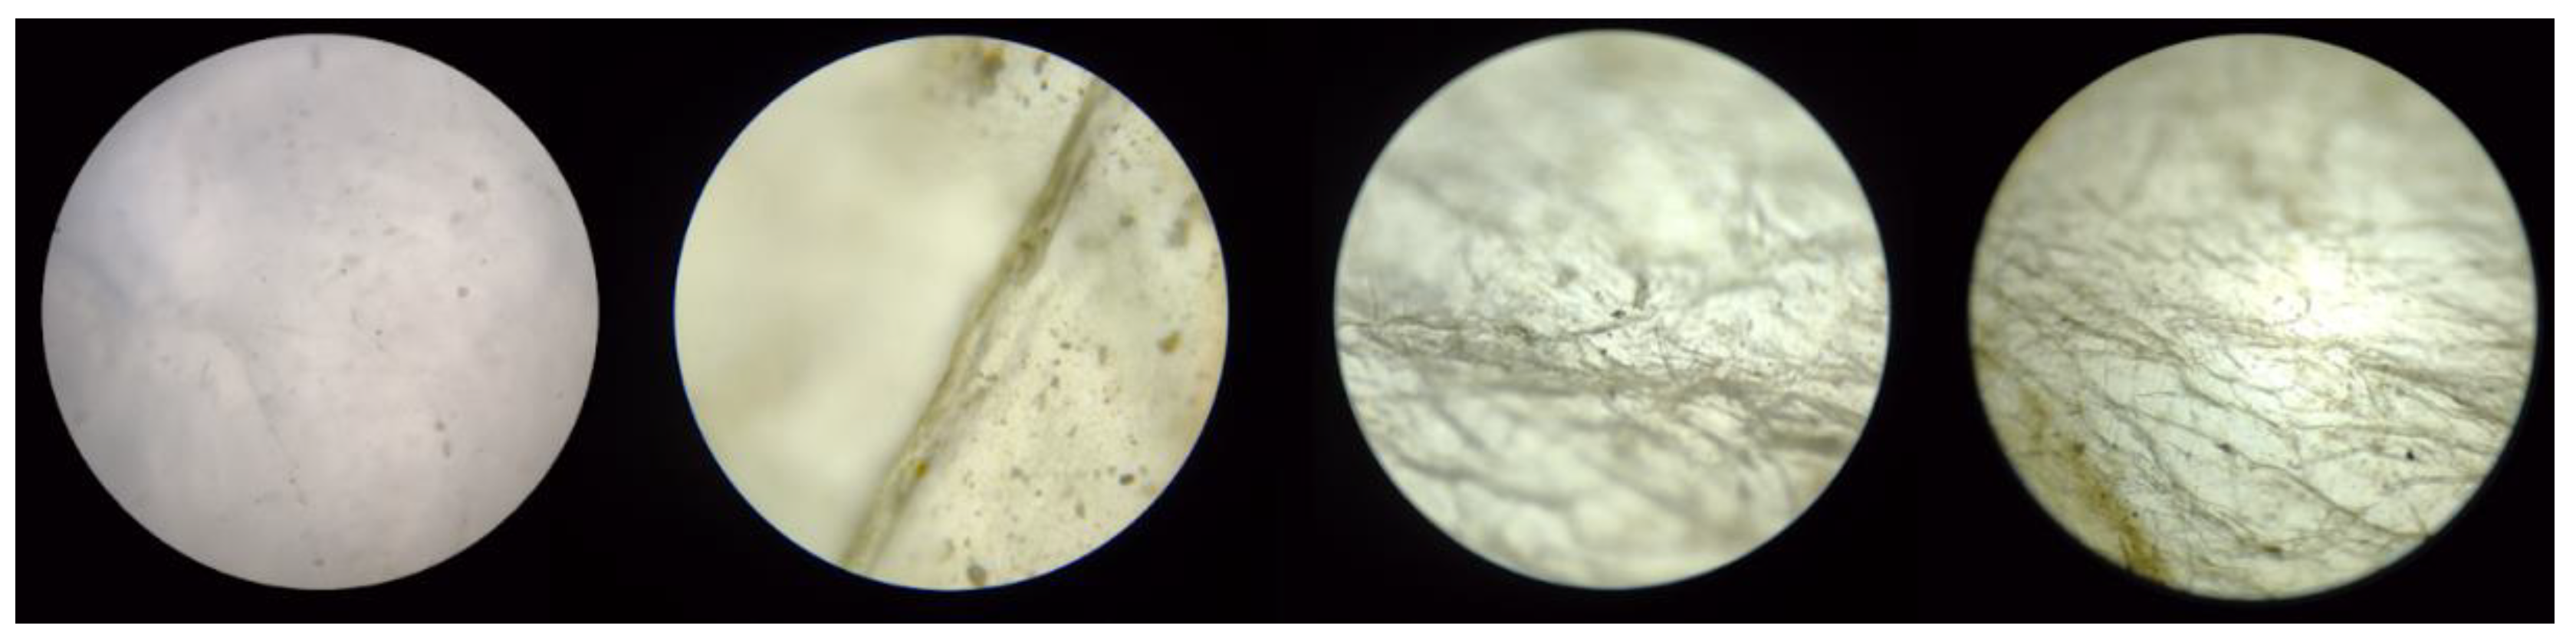
Figure 15.
Optical microscopy of pore B of BC membrane used for filtration (magnification left to right: 4x, 10x, 40x, and 100x).
Figure 15.
Optical microscopy of pore B of BC membrane used for filtration (magnification left to right: 4x, 10x, 40x, and 100x).
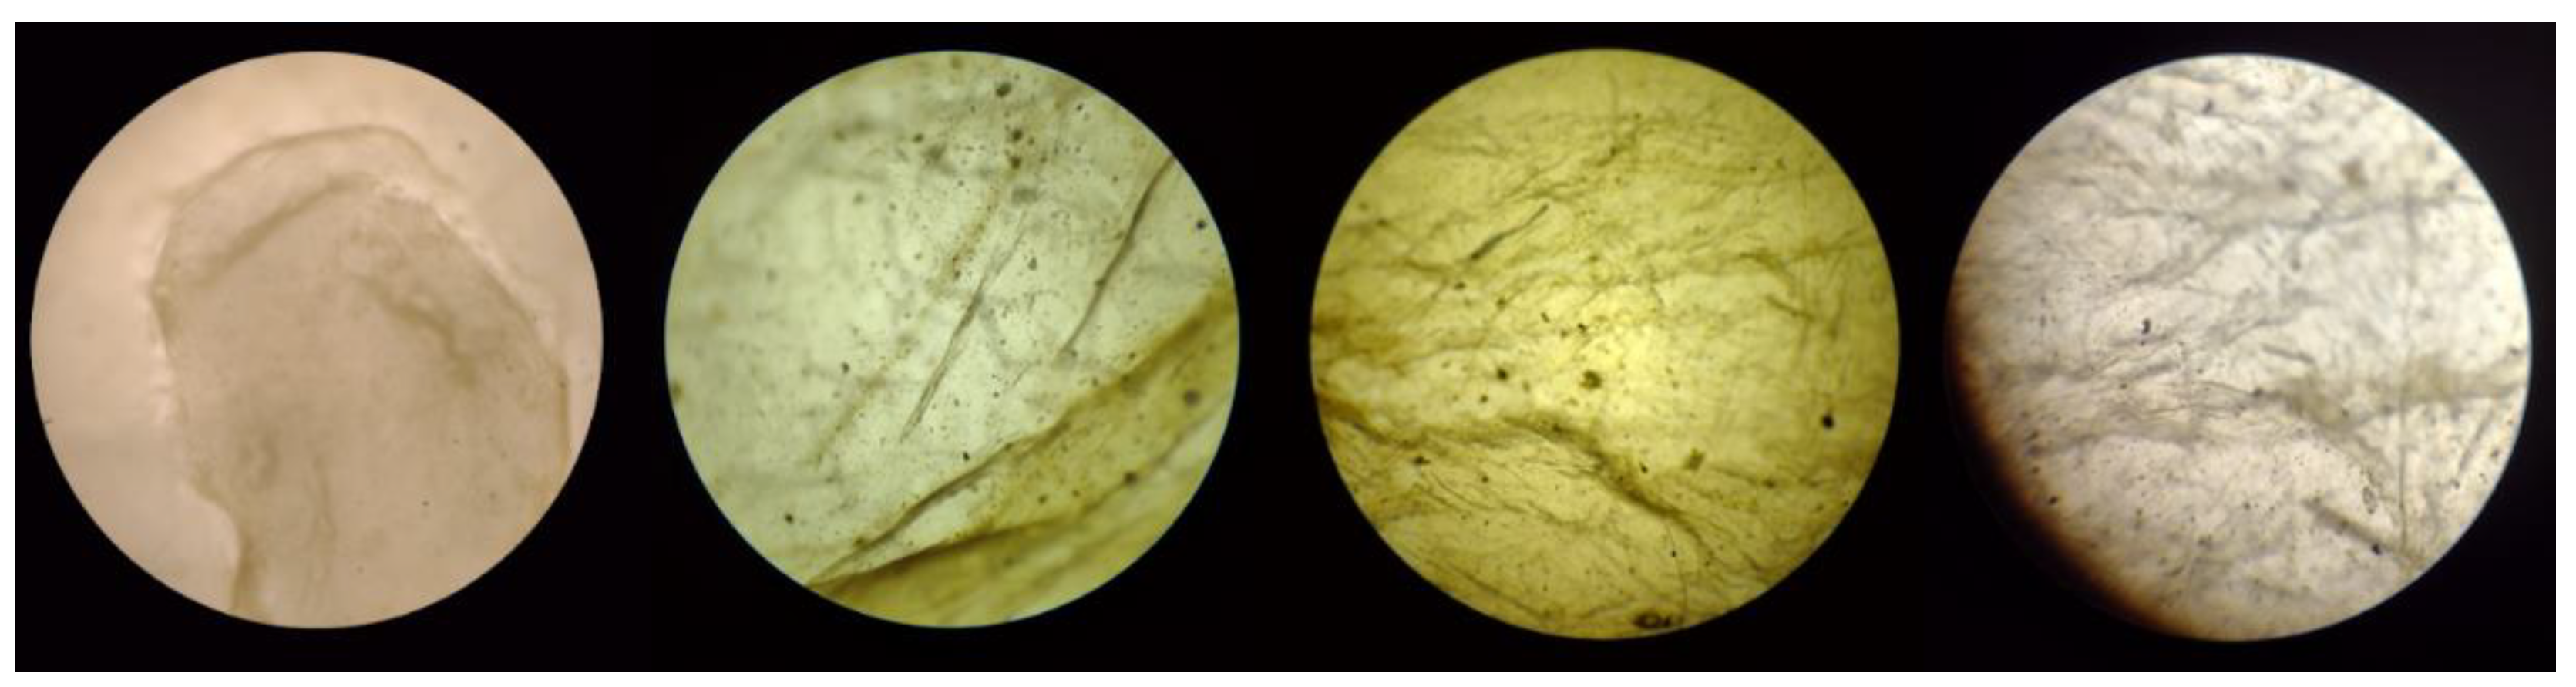
Figure 16.
Optical microscopy of pore C of BC membrane used for filtration (magnification left to right: 4x, 10x, 40x, and 100x).
Figure 16.
Optical microscopy of pore C of BC membrane used for filtration (magnification left to right: 4x, 10x, 40x, and 100x).
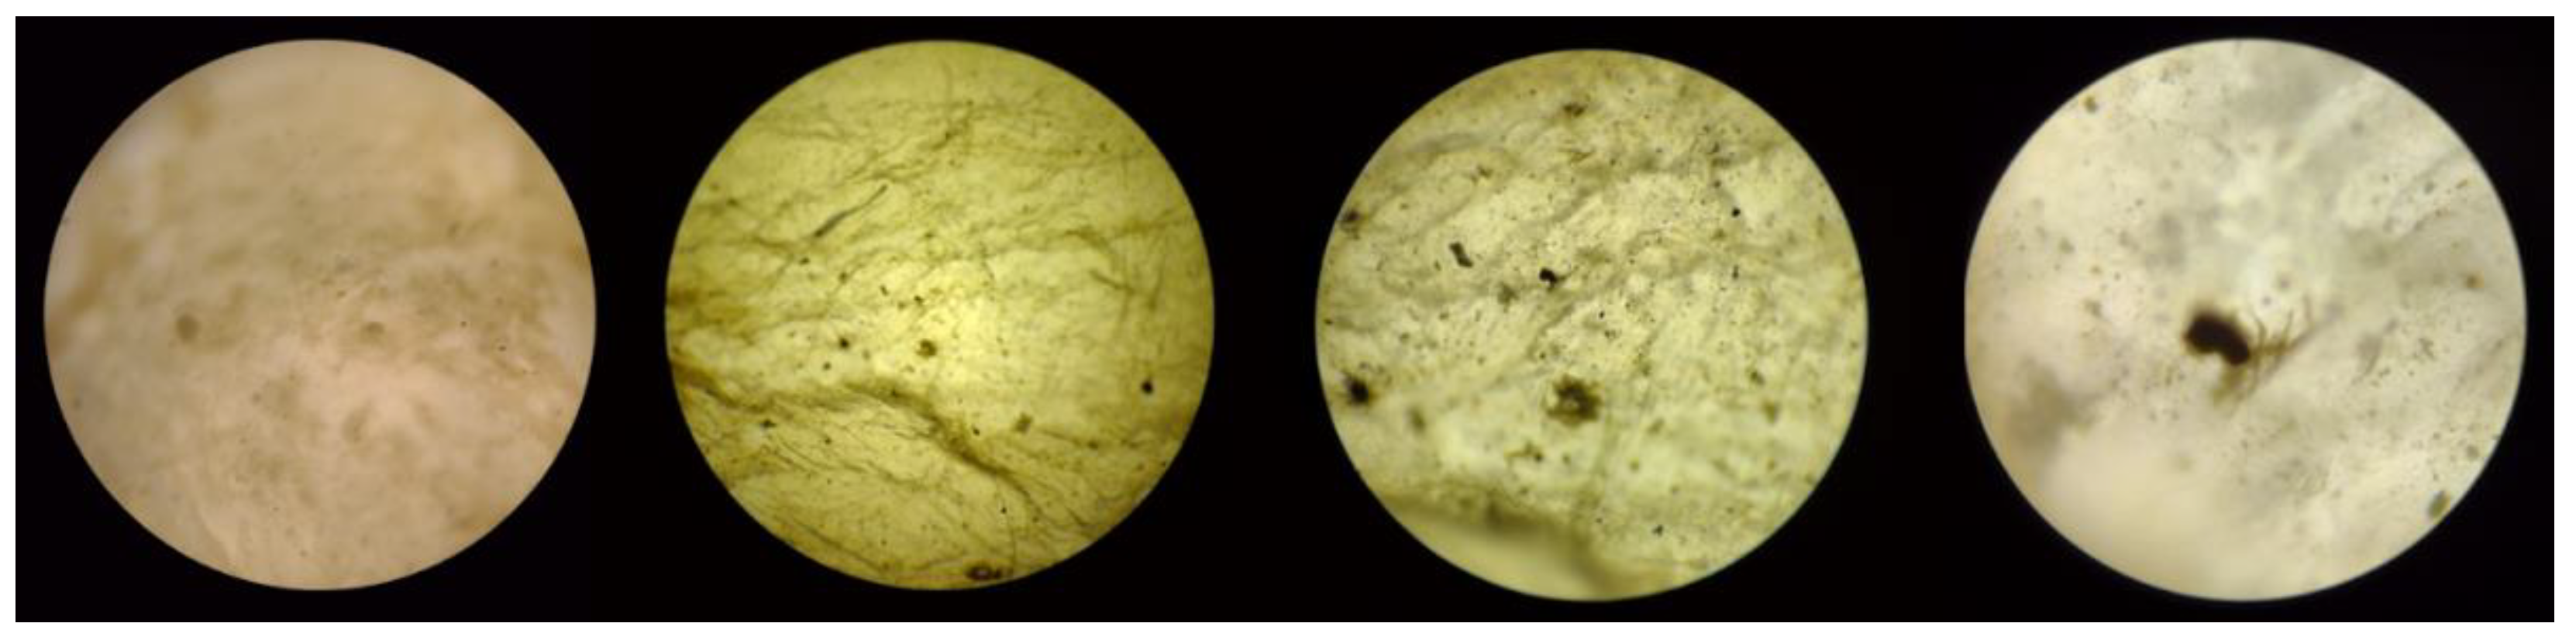
Figure 17.
Microphotographs of bacterial cellulose membrane before filtration process (magnification: 100, 500, 1000, 3000, and 10000 times).
Figure 17.
Microphotographs of bacterial cellulose membrane before filtration process (magnification: 100, 500, 1000, 3000, and 10000 times).
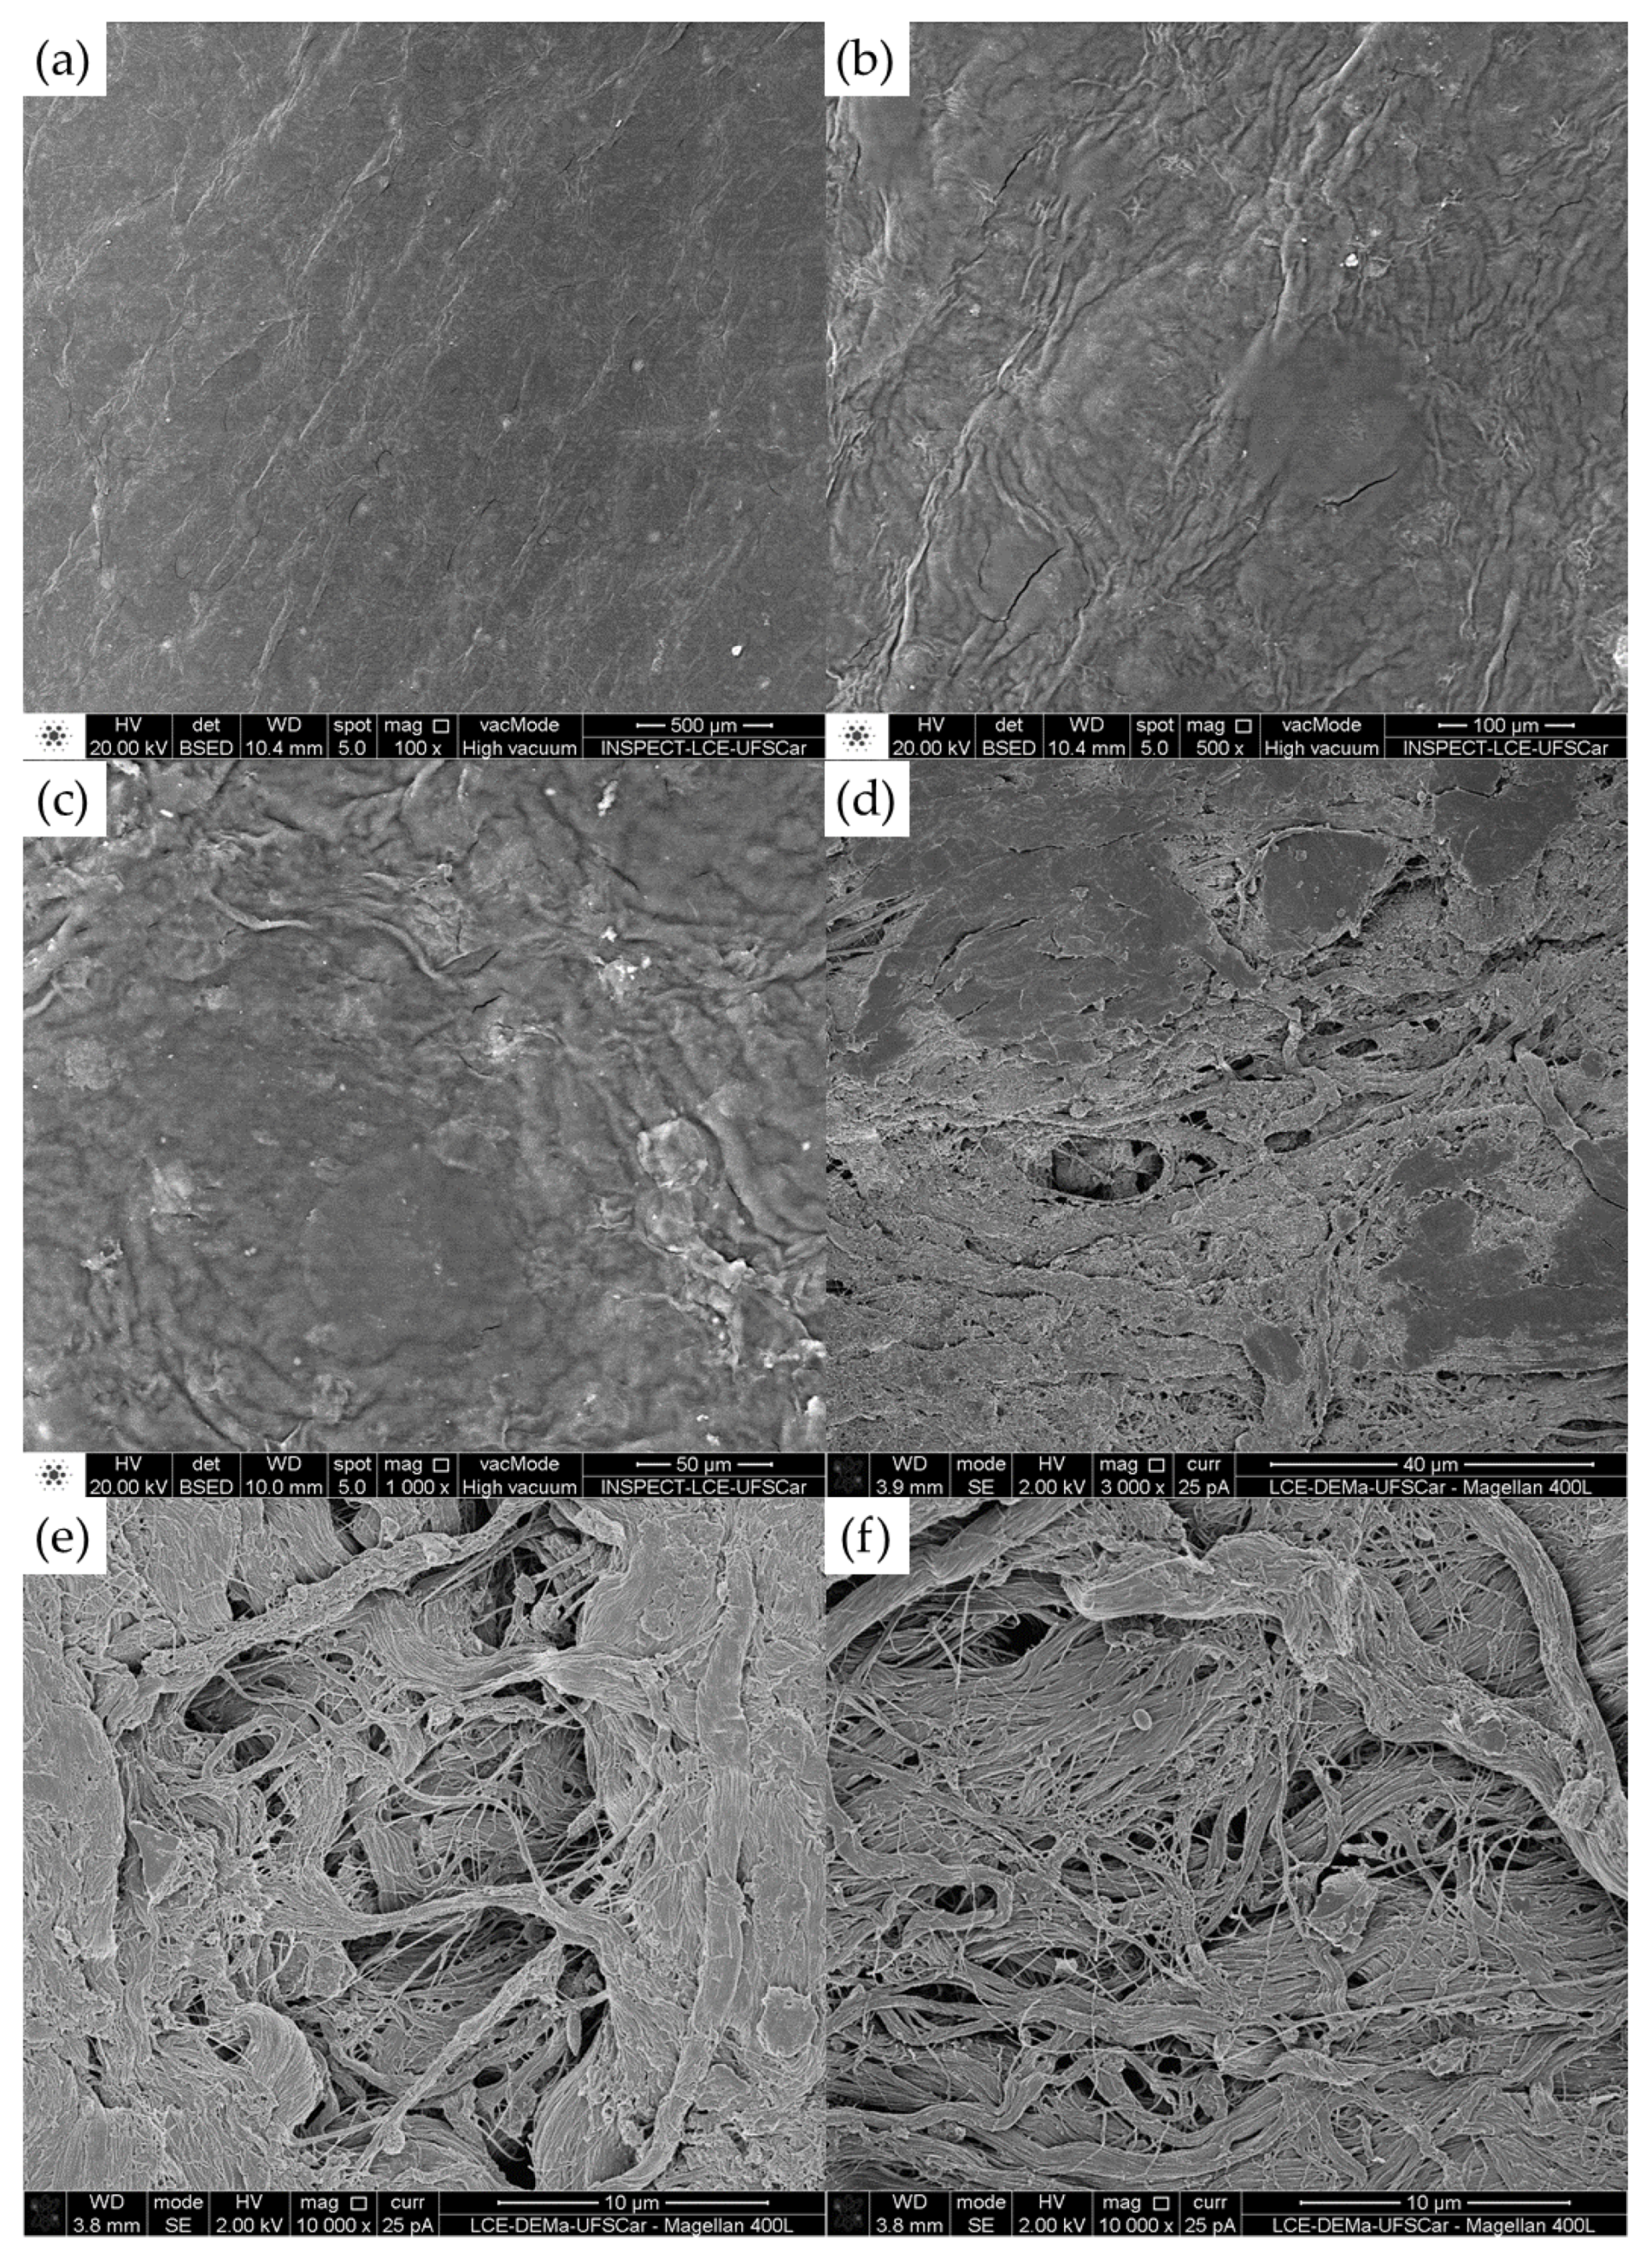
Figure 18.
Microphotographs of bacterial cellulose membrane after filtration process (magnification: 200, 1000, and 5000 times).
Figure 18.
Microphotographs of bacterial cellulose membrane after filtration process (magnification: 200, 1000, and 5000 times).
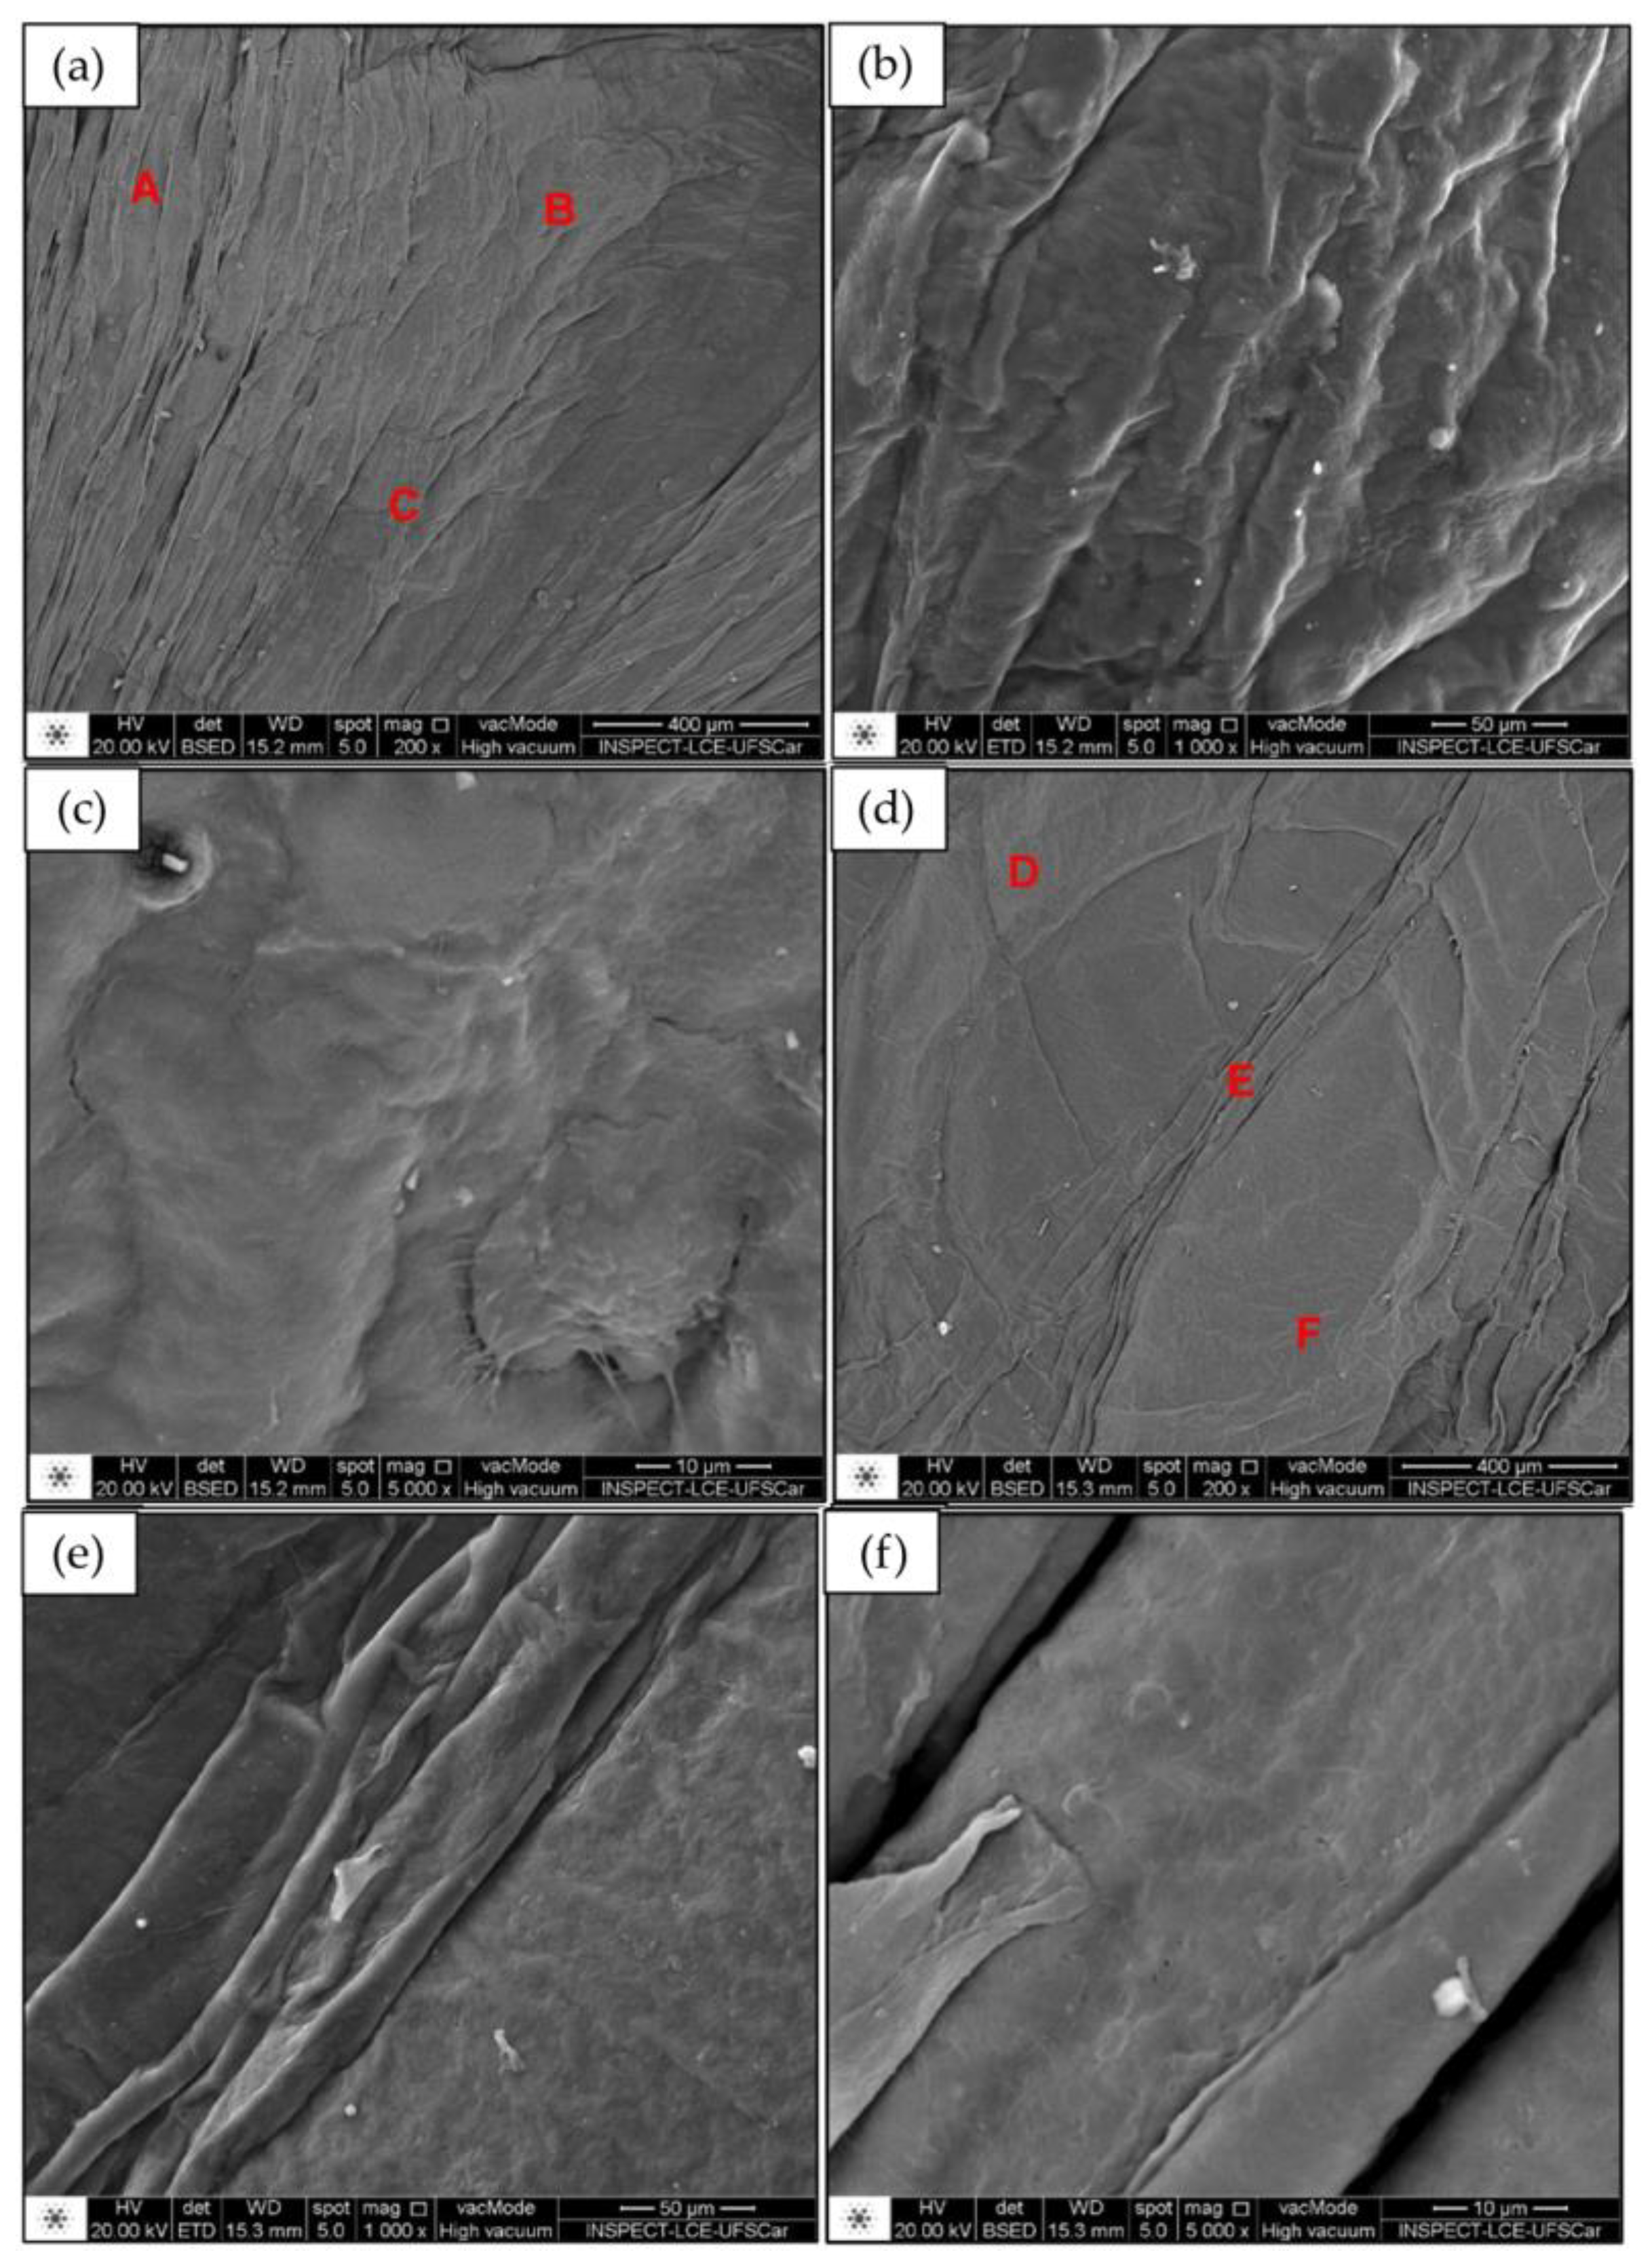
Figure 19.
Results of mechanical tests: Tensile strength (MPa) and elongation at break (%).
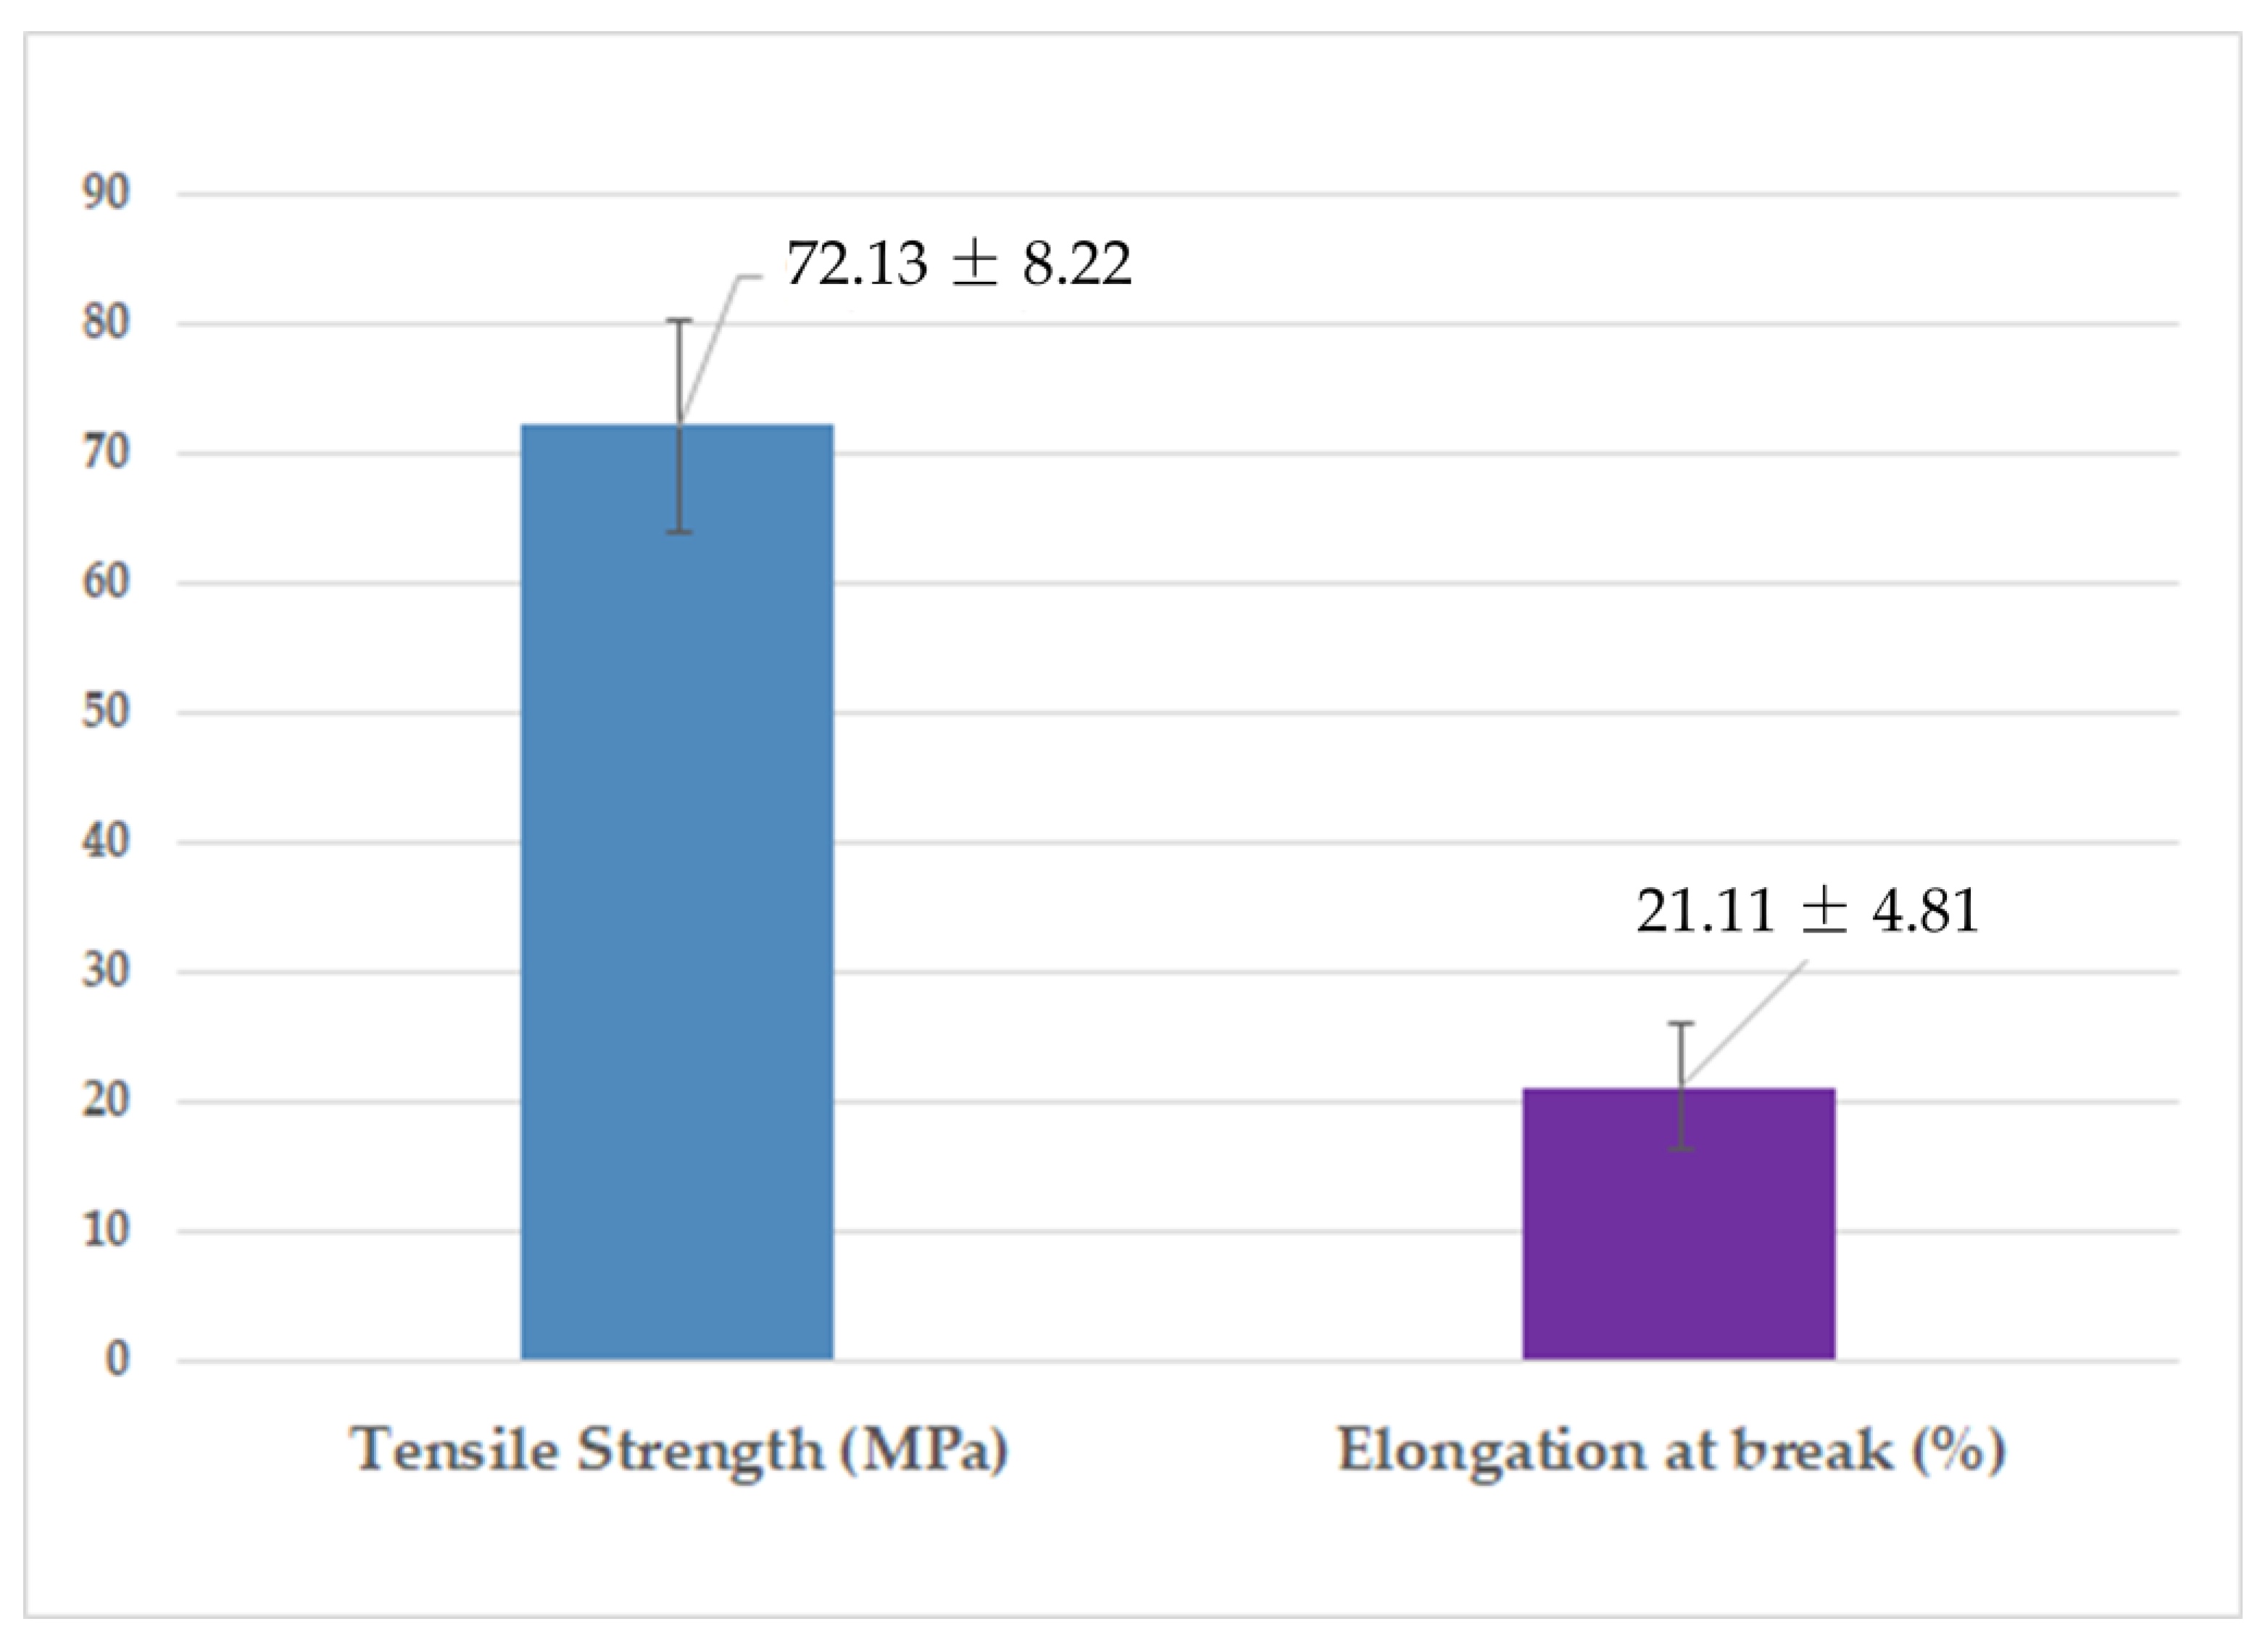
Figure 20.
Effluent (left to right) after treatment station, BC filtration system and activated charcoal filtering.
Figure 20.
Effluent (left to right) after treatment station, BC filtration system and activated charcoal filtering.
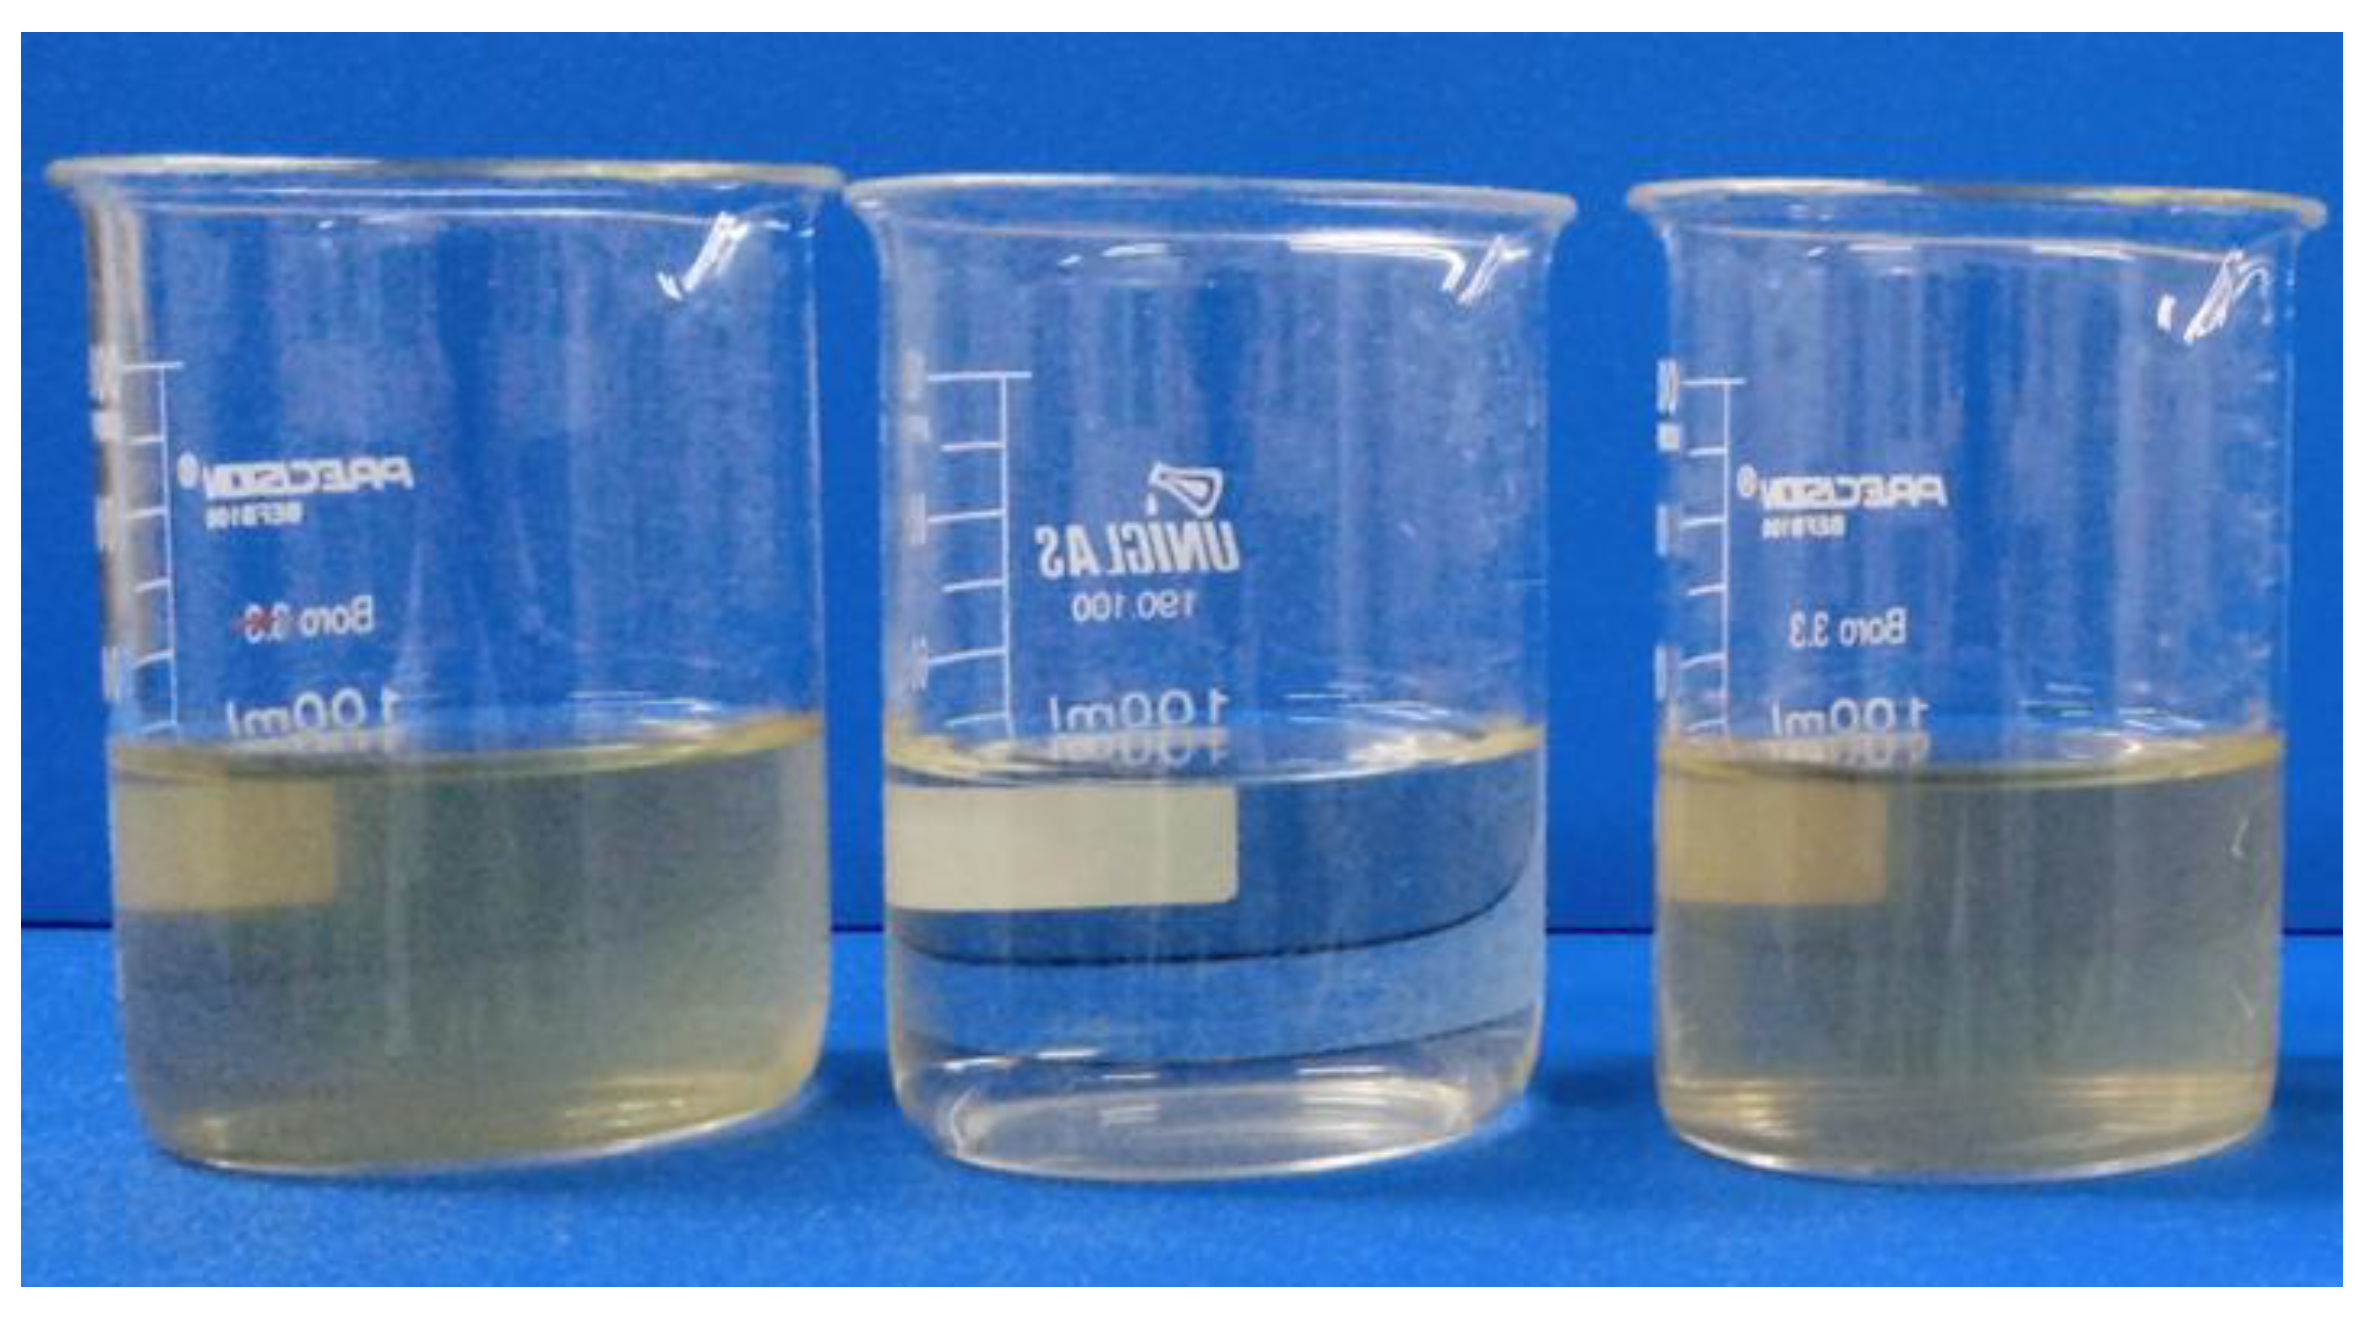
Figure 21.
Synthetic oily effluent before and after filtration with the BC membrane.
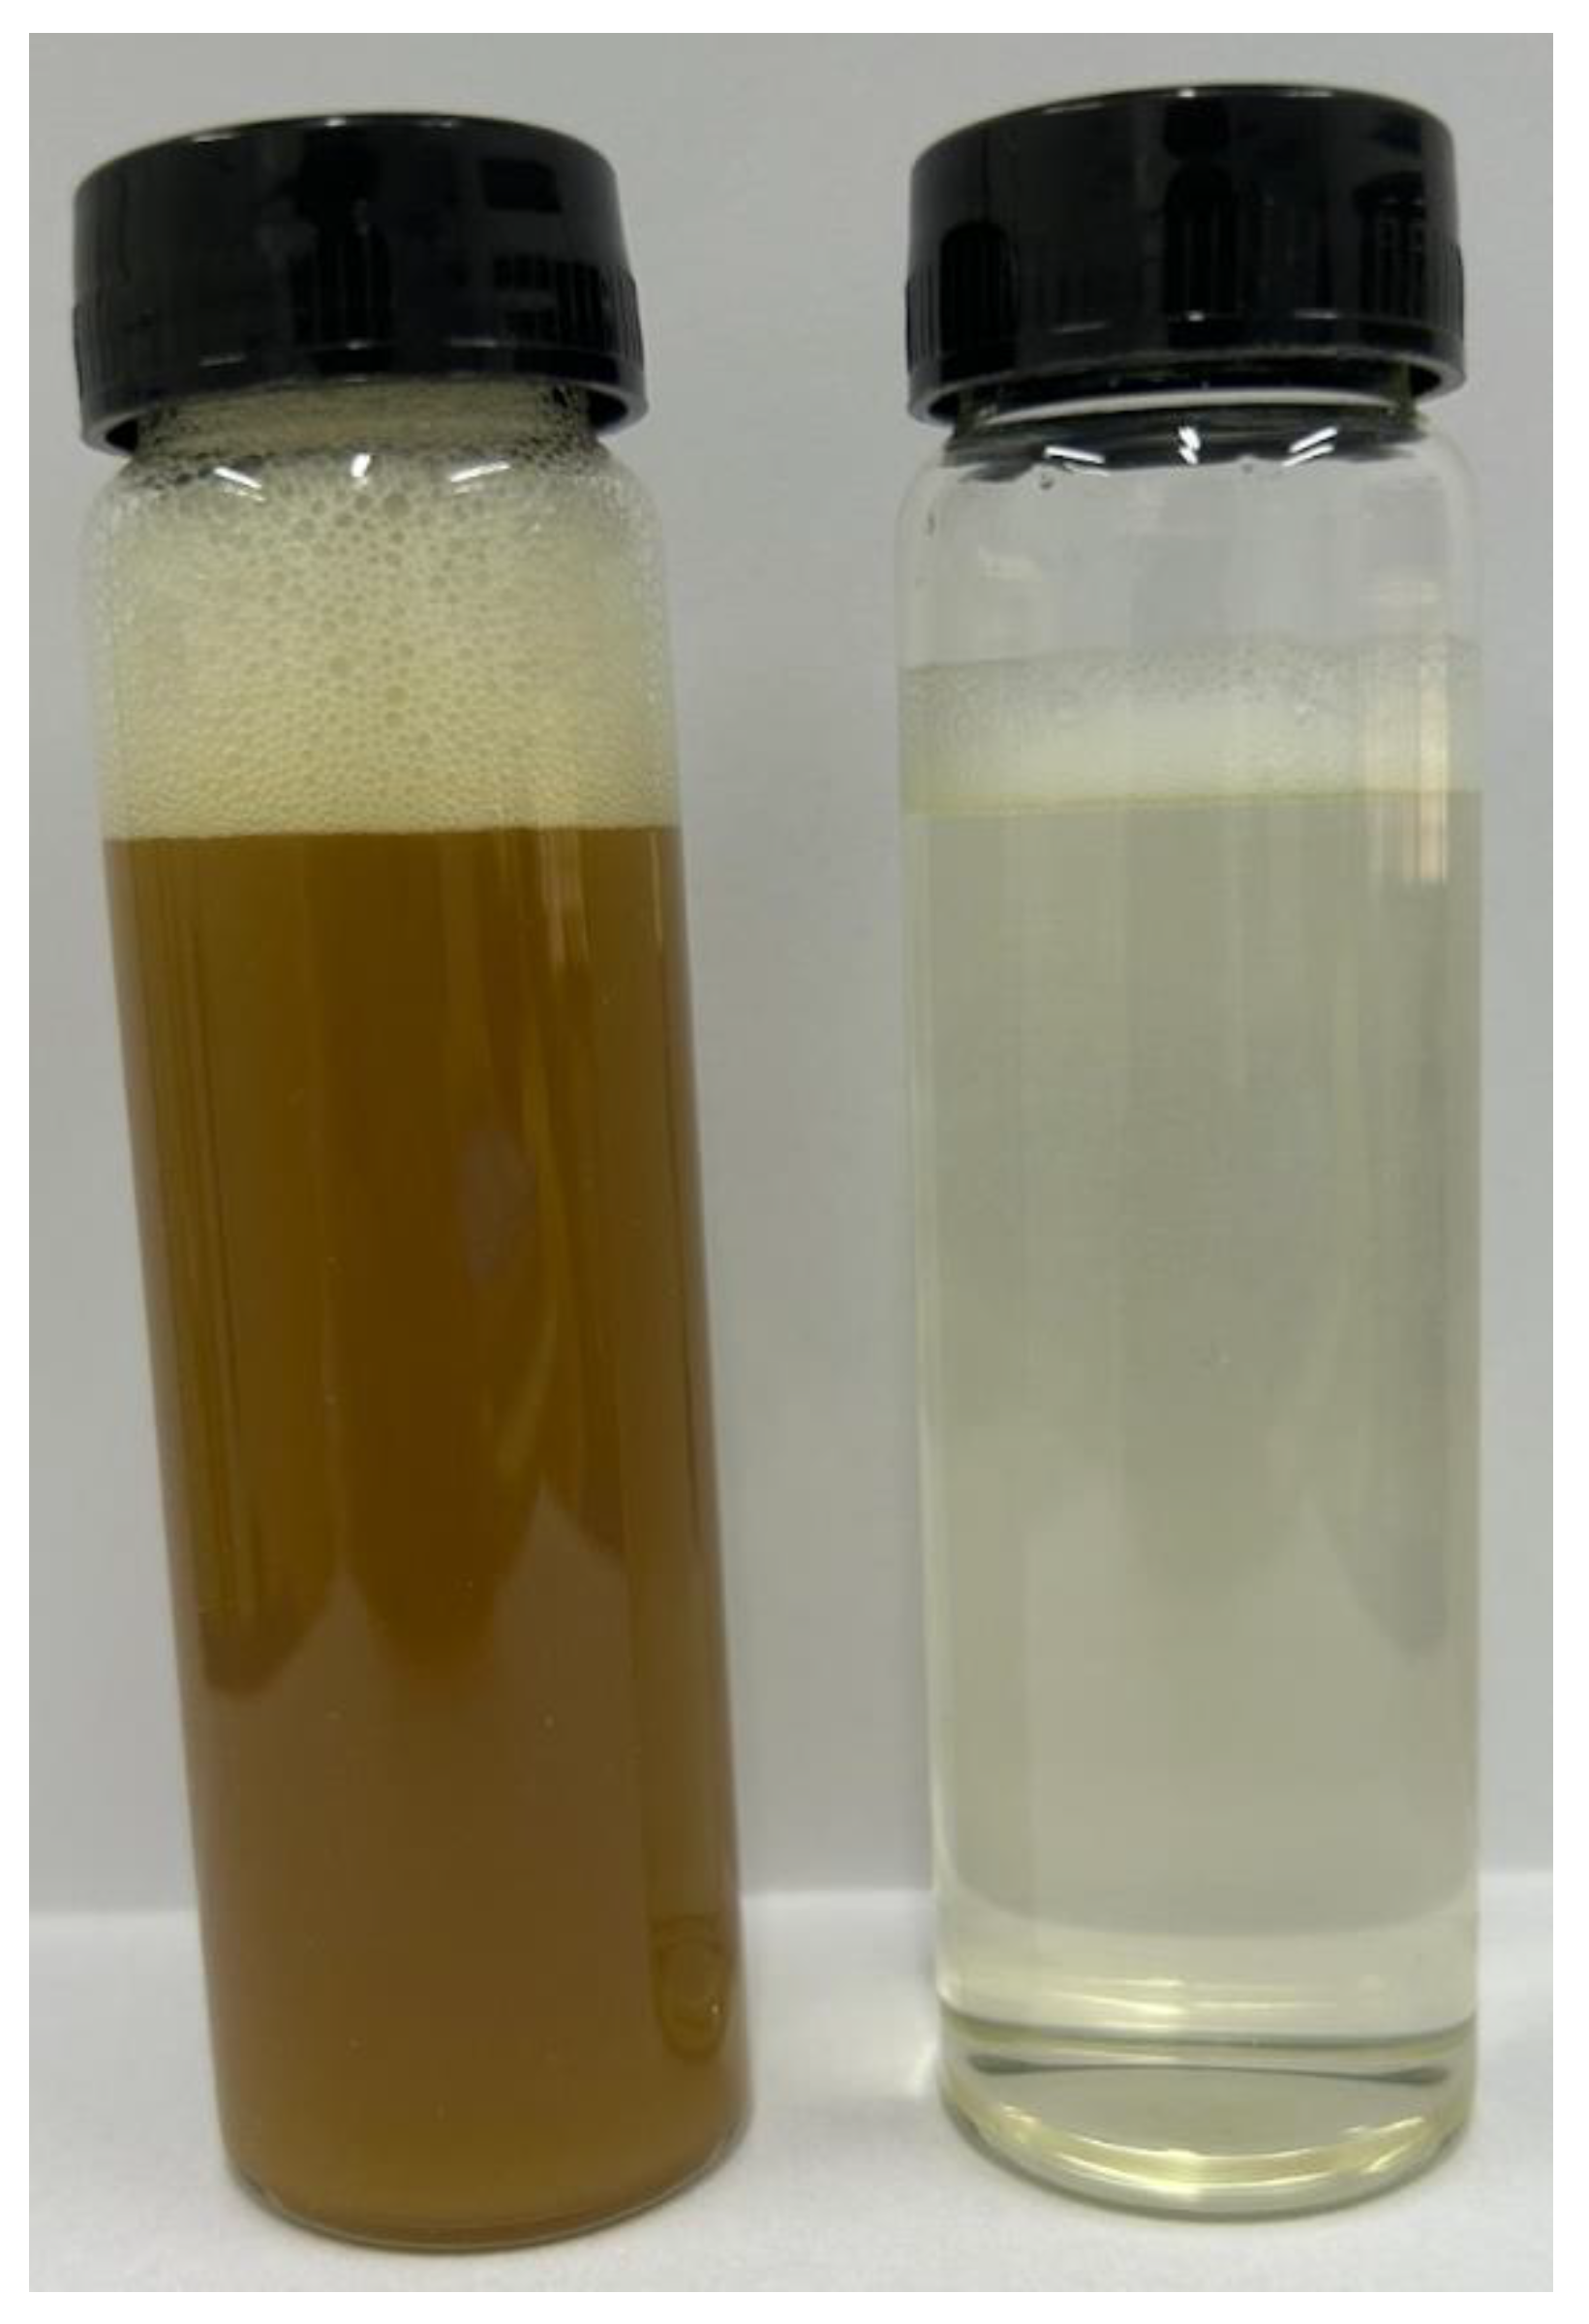

Table 1.
Yield and water retention capacity of bacterial cellulose membrane.
| Average weight (g/L) | WRC (%) | |
|---|---|---|
| Wet | 416.91 ± 16.32 | 97.58 ± 0.33 |
| Dry | 10.05 ± 1.46 | |
Table 2.
Chemical groups in bacterial cellulose membrane.
| Wavenumber (cm-1) | WRC (%) |
|---|---|
| 3344 | Axial deformation of OH |
| 2922 | Asymmetrical axial deformation of CH2 |
| 2854 | Asymmetrical axial deformation of CH2 |
| 1745 | Axial deformation of C=O |
| 1649 | Angular deformation of C-O-H |
| 1543 | Axial deformation of C=C |
| 1425 | Angular deformation of CH2 |
| 1314 | Angular deformation of CH |
| 1206 | Angular deformation of CH |
| 1159 - 1002 | Axial deformation of C-O |
Table 3.
Identification of crystalline phases of sample.
| Sample | Colour | Reference code | Chemical formula | Name of compound |
|---|---|---|---|---|
| AFK239735 | ----- | 46-1607 | C4H2O3/(CHCO)2O | Maleic anhydride |
| ----- | 50-2241 | (C6H10O5)n | Cellulose |
Table 4.
EDS results of bacterial cellulose membrane prior to filtration process.
| lement | Mass of Elements | ||
|---|---|---|---|
| A | B | C | |
| C | 53.59 | 66.42 | 51.73 |
| O | 45.72 | 32.34 | 45.91 |
| P | 0.69 | 1.24 | 2.36 |
Table 5.
EDS results of bacterial cellulose membrane filtration process.
| Element | Mass (%) | |||||
|---|---|---|---|---|---|---|
| A | B | C | D | E | F | |
| C | 55.00 | 55.35 | 55.93 | 57.75 | 55.95 | 53.17 |
| O | 32.63 | 38.21 | 35.24 | 36.58 | 37.70 | 39.88 |
| Na | 5.02 | 2.99 | 3.77 | 2.28 | 2.78 | 3.13 |
| Mg | 0.87 | 0.30 | 0.88 | 0.43 | 0.30 | - |
| Si | 0.97 | 0.33 | 0.56 | - | - | - |
| Cl | 5.30 | 2.29 | 2.79 | 2.96 | 3.27 | 3.17 |
| P | 0.21 | 0.16 | 0.27 | - | - | - |
| Ca | - | 0.37 | 0.58 | - | - | 0.65 |
Table 6.
Physicochemical properties of effluent after treatment station, activated charcoal filtering and bacterial cellulose filtration system.
Table 6.
Physicochemical properties of effluent after treatment station, activated charcoal filtering and bacterial cellulose filtration system.
| Variable | After effluent treatment station | After activated charcoal filtering | After BC filtration system |
|---|---|---|---|
| pH | 6.0 | 6.0 | 5.5 |
| Dissolved oxygen | 2.3 mg/L | 2.7 mg/L | 0.5 mg/L |
| Total oils and greases | 17.1 mg/L | <10.0 mg/L | <10.0 mg/L |
| Turbidity | 5.2 NTU | 26.3 NTU | 5.64 NTU |
| Apparent colour | 283.0 uH | 253.0 uH | 141.0 uH |
| Total hardness | 9200.0 mg/L | 10950.0 mg/L | 1387.0 mg/L |
| BOD5 | 214.0 mg/L | 384.0 mg/L | <5.00 mg/L |
| COD | 750.0 mg/L | 607.0 mg/L | <15.00 mg/L |
| Total alkalinity | 277.2 mg/L | 277.2 mg/L | 71.6 mg/L |
Table 7.
Results of microbiological tests of effluent after treatment station, activated charcoal filtering and bacterial cellulose filtration system.
Table 7.
Results of microbiological tests of effluent after treatment station, activated charcoal filtering and bacterial cellulose filtration system.
| Microorganisms | After effluent treatment station | After activated charcoal filtering | After BC filtration system |
|---|---|---|---|
| Thermotolerant Coliforms | 28000 MPN/100 mL | 28000 MPN/100 mL | <1.8 MPN/100 mL |
| Total coliforms | 28000 MPN/100 mL | 28000 MPN/100 mL | <1.8 MPN/100 mL |
| Escherichia coli | 28000 MPN/100 mL | 28000 MPN/100 mL | <1.8 MPN/100 mL |
Legends: MPN: most probable number.
Disclaimer/Publisher’s Note: The statements, opinions and data contained in all publications are solely those of the individual author(s) and contributor(s) and not of MDPI and/or the editor(s). MDPI and/or the editor(s) disclaim responsibility for any injury to people or property resulting from any ideas, methods, instructions or products referred to in the content. |
© 2024 by the authors. Licensee MDPI, Basel, Switzerland. This article is an open access article distributed under the terms and conditions of the Creative Commons Attribution (CC BY) license (http://creativecommons.org/licenses/by/4.0/).
Copyright: This open access article is published under a Creative Commons CC BY 4.0 license, which permit the free download, distribution, and reuse, provided that the author and preprint are cited in any reuse.


