Submitted:
08 June 2024
Posted:
11 June 2024
You are already at the latest version
Abstract
In the context of rapid urbanization, the spatiotemporal patterns of socio-economic exposed to high seismic hazard in large cities lacks quantitative assessment, thus, it is difficult to understand the evolution of earthquake catastrophe risk there. In this paper, exposure change rate, and absolute and relatively exposure indices were proposed to quantitatively study the changes of spatiotemporal exposure to high seismic hazard in urban areas of large cities (i.e., permanent residents in urban areas more than 1 million) in Chinese mainland, using a set of multi-temporal population, GDP, and built-up datasets and a seismic hazard zoning map. The results show that, 64 out of 78 large cities are entirely or partially located in high seismically hazardous zones. Although the urban areas of large cities in high seismically hazardous zones (HSHUAs) cover only 1.73% (167177 km²) of mainland China, their share of population, GDP, and built-up land amounted to 18.14%, 30.24% and 24.55%, respectively, in 2015. Unprecedented urbanization has led to a dramatic exposure growth in HSHUAs between 1990 and 2015. The population, GDP, and built-up land in HSHUAs increased by 110 million people (with an average annual growth rate of 2.37%), 273.71 trillion USD(average annual growth rate of 11.15%), and 10593 km2 (average annual growth rate of 2.02%), respectively. HSHUAs experienced much faster population and GDP growth than the whole country, while relatively slower growth in built-up land. Exposure growth in HSHUAs also was varied for different types of large cities. Megacities had a higher proportion of increased GDP and population in HSHUAs, induced by industry and population agglomeration. Whereas, Type II large cities had a higher proportion of increased built-up land in HSHUAs, driven mainly by urban sprawl. Our analysis indicates that, for large cities under rapid urbanization, it is an urgent need to strengthen resilient urban planning, renewal and construction.
Keywords:
Earthquake
; Exposure
; High Seismically Hazardous Zone
; Large City
; China
1. Introduction
The risk level of extreme events, like a catastrophic earthquake is dominated more by exposure such as population, assets and economic activities [1]. Higher exposure could cause higher local direct losses, which further trigger wider indirect impacts owing to the increasing interdependence and complexity of socio-economic systems [2]. Growing exposure due to rapid urbanization has become a more dominant driver of seismic risk in large cities, despite rising investments in structural improvements that have reduced the vulnerability to seismic risk with the social-economic development [3,4].
China is one of the countries that most severely struck by earthquakes [5,6,7,8]. Areas with seismic intensity VII or higher account for 58% of China’s land area and hold an urban population of approximately 440 million [9]. 27 provincial capitals and nearly 60% of prefecture-level cities are prone to seismic hazards in China [10,11]. Furthermore, densely populated and economically developed areas in eastern China were once hit by several successive destructive earthquakes, such as the 1966 Xingtai earthquake (Ms=6.8), the 1976 Tangshan earthquake (Ms=7.8) and the 1998 Zhangbei earthquake (Ms=6.2) in Hebei Province.
Since the 1990s, China has embarked upon an accelerated urbanization trajectory [12,13] , in particular in the provincial capitals as well as the core cities of urban agglomerations [14]. Growing population, wealth, and industry concentrate in these large cities at an unprecedented rate, along with the massive construction of buildings, transport networks and critical infrastructures. Once a strong earthquake occurs, the system-wide cascading impacts can be enormous in large cities due to their complex industrial and infrastructure networks. Unprecedented urbanization leads to population, assets dramatically exposed to seismic hazard in large cities, which has become a critical driver of seismic risk [15,16,17,18,19]. Misrepresentation and underestimation of exposure may hinder our understanding of seismic risk [20,21]. Therefore, it is imperative to explore the spatiotemporal patterns of exposure in high seismically hazardous areas of large cities, as well as to assess and manage their seismic risks.
Exposure to seismic hazard has gained much attention in recent years. Based on the distribution of population and built-up land interpreted from Landsat image data, Ehrlich [22]assessed the evolution of population and built-up land exposure in seismic hazard areas on a global scale from 1975 to 2015. Freire and Aubrecht [23]spatialized census data of the main metropolitan areas in Spain to obtain daytime and nighttime population distributions, and further analyzed their exposure. Based on the WorldPop gridded data, Dou [24]analyzed the population at seismic hazard areas in Asia from 2000 to 2015, with a particular focus on vulnerable groups. In China, He [25]assessed changes in population and elderly people in high seismically hazardous zones based on data from the sixth national census. It was found that in these areas, the population and the elder increased by 33.6% and 81.4%, respectively, from 1990 to 2010, both higher than the national levels for the same period. Wu [26]spatialized China’s provincial GDP and fixed assets statistics from 1990 to 2010, and found that 14.1% of GDP and 15.4% of fixed assets were located in high seismically hazardous zones in 2010, with average annual growth rates of 14.4% and 11.3% compared to 1990. Based on 1km gridded built-up land data, He [27]found that developing countries with an urbanization ratio accounted for about two thirds of earthquake-related deaths and more than two thirds of population growth in earthquake-prone areas worldwide between 1990 and 2015.
The estimates from the previous studies vary with datasets and methods used. First, most studies in China (Wu 2018; Lang et al., 2019; He et al., 2021) were based on provincial administrative scales, with a gap of understanding exposure of seismic hazard specifically for large cities. Second, existing studies used the threshold of peak ground acceleration greater than or equal to 0.2g (PGA≥ 0.2g) to define the high seismically hazardous zones, which is corresponding to cover areas above VIII seismic intensity. However, an earthquake with PGA≥ 0.1g (corresponding to the VII seismic intensity) is also likely to cause severe casualties and damages in urban areas compared to those with PGA≥0.2g [28,29]. Examples include the 2011 Crested Butte earthquake in New Zealand, the 2015 Pishan earthquake in China, and the 2016 Perugia earthquake in Italy. Third, previous studies were mostly based on statistics aggregated by administrative units, which was insufficient to describe in detail the spatial heterogeneity of exposure. With the development of spatial disaggregation methods, more gridded population, GDP, and built-up data with high resolution are available, to support spatially explicit exposure and seismic risk analysis. Therefore, based on high seismically hazardous zones with PGA ≥ 0.1g as well as the newly available gridded datasets of population, GDP, and built-up land, this study explored the spatiotemporal patterns of exposure with a focus on China’s 78 large cities (permanent residents in urban areas more than 1 million). It is expected to provide valuable information for the understanding of dynamic seismic risk, and resilience building in large cities under rapid urbanization [30].
The remainder of this study consists of four sections. Section 2 describes the study area, datasets and methods. Section 3 explores the spatiotemporal patterns of seismic hazard exposure of China’s large cities during 1990-2015. Section 4 discusses the drivers of exposure growth and the policy implications for seismic resilience. Section 5 presents the main conclusions of the study.
2. Data and Methods
2.1. Data
The main datasets used in this study included the vector seismic hazard map, the 100 m gridded population data, the 1 km gridded GDP data, the 250 m gridded built-up land data, and the vector administrative division data.
The seismic hazard map adopted the 5th generation of the seismic ground motion parameter zonation map of China (GB18306-2015), which was generated with probabilistic seismic hazard analysis. The map shows the peak ground acceleration (PGA) expected at a 10% probability of exceedance in 50 years.
The gridded population data in 1990, 2000, 2010 and 2015 were obtained from the WorldPop Mainland China dataset (http://www.worldpop.org.uk). The dataset was spatialized from the county-level census data using a random forest regression and dasymetric mapping method [31].
The gridded GDP data in 2000, 2010, and 2015 were obtained from the Chinese Data Center for Resources and Environmental Sciences (https://www.resdc.cn/DOI/doi.aspx?DOIid=33) [32]. The data was spatialized from the county-level GDP data using a multi-factor weight assignment method, considering the factors of land use, night lighting, and settlement density. Due to the lack of available gridded GDP data in 1990, it was estimated by multiplying the per capital GDP of each city with the gridded population for the same period. Taking the urban area of Shanghai as an example, the calculation results are compared with the GDP data of Shanghai in the 1990 statistical yearbook, and the error rate of the results is within 4 %. In addition, for consistency in temporal change analysis, the gridded GDP data in 1990, 2000 and 2010 were normalized to the 2015 prices.
The gridded built-up land data in 1990, 2000 and 2015 were derived from the Global Human Settlement Layers (GHSL) datasets produced by European Commission Joint Research Centre [33].
The administrative boundary data of provinces, cities and districts and counties used in this paper and the three major economic divisions of the East, Central and West are from the Resource and Environmental Science and Data Center (http://www.resdc.cn/Default.aspx) of the Institute of Geographic Sciences and Resources of the Chinese Academy of Sciences. This paper also uses the statistical data of urban resident population in the 2017 China Urban Construction Statistical Yearbook to determine large cities with a population of more than one million.
2.2. Defining Study Area
2.2.1. The Urban Areas of Large Cities (UALCs)
According to the classification standard of city size by the State Council of China (the State Council of China, 2014) [34], A city with permanent residents in urban areas (i.e., municipal istricts) of more than 1 million are classified as a large city, which is further divided into Type I large cities (1-3 million), Type II large cities (3-5 million), Supercities (5-10 million), and Megacities (greater than 10 million). Following this classification, a total of 78 large cities were identified in Chinese mainland (excluding Taiwan, Hong Kong and Macao). The municipal district boundaries of these cities (i.e., the urban areas of large cities, UALCs) were extracted, along with the covered population, GDP, and built-up land grids. The UALCs were calculated to be 313251 km2, accounting for 3.25% of Chinese mainland. In 2015, the population, GDP, and built-up land in UALCs amounted to 345.95 million people, 4.82×10³ billion USD and 35974 km2, accounting for 25.17%, 44.57% and 32.73% of the totals in mainland of China, respectively.
2.2.2. The High Seismically Hazardous Zones
In contrast to the threshold of PGA≥0.2g in previous studies (Huang et al., 2019; Lang et al., 2019), this study used the PGA≥ 0.1g to define the high seismically hazardous zones, which were subdivided into VII-IX degrees according to the national norms (GB 18306-2015) (Table 1).
2.2.3. The Urban Areas of Large Cities in High Seismically Hazardous Zones (HSHUAs)
The HSHUAs can be extracted by overlaying the UALCs with the high seismically hazardous zones. 64 of the 78 large cities were found completely or partially within HSHUAs (Figure 1), including 4 Megacities, 5 Supercities, 10 Type I large cities and 45 Type II large cities (Table 2). In terms of their geographical distribution, 38 cities are located in eastern China, 14 cities in central China and 12 in western China (Figure 2). The HSHUAs cover an area of 167177km2, accounting for 53.4% of the 78 large cities or 1.73% of mainland of China, respectively (Table 2).
2.3. Methods
With the seismic hazard map as well as the gridded population, GDP, and built-up land datasets, this study proposes an absolute exposure index and a relative exposure index, analyzes the spatiotemporal changes of exposure in HSHUAs from 1990 to 2015, and discussed the policy implications for seismic resilience building in large cities (Figure 2).
2.3.1. Exposure Change Rate
A GIS software was used to calculate the exposure by overlaying the HSHUAs with the distributions of population, GDP and built-up land. The annual growth rate () and the percentage change ( were used to measure the changes of population, GDP and built-up land in HSHUAs during 1990-2015.
where Et1 and Et2 refer to the values of population, GDP and built-up land in years t1 and t2, respectively.
In addition, in order to compare the GDP exposure values of different years, this paper uses China ‘s GDP deflator to convert the GDP of 1990,2000 and 2010 into the price level of 2015, which is obtained from the World Development Indicators Database released by the World Bank (https://data.worldbank.org/indicator/NY.GDP.DEFL.ZS?view=chart&locations=CN).
2.3.2. Development of Exposure Indices
- Absolute Exposure Index
The absolute exposure index is constructed by using the absolute value of each exposure indicator within the HSHUAs, the formula is as follows:
where, is the absolute exposure index of the HSHUAs in large cities i ; is the absolute value of the exposure indicators j for city i ; is the absolute exposure value of indicator j for all major cities ; is the weight of indicators j; i is a city in HSHUAs, i = 1, 2,... 64 ; j is the exposure indicators, j = 1, 2, 3.
- 2.
- Relative exposure index
The relative exposure index is constructed by using the ratio of the value of exposure indicators within the HSHUAs to those of the whole urban areas of a large city, reflecting the relative intensity of exposure and the degree of possible impacts on the social economy of a city, the formula is as follows:
where, is the relative exposure index of the HSHUAs in large cities i; is the proportion of the exposed value of the jth indicator to the whole urban areas in large cities i; is the relative exposure ratio of indicators j for all large cities; is the weight of indicators j, and i is a city in HSHUAs, i = 1, 2,... 64 ; j is the relative exposure indictors, j = 1,2,3.
- 3.
- Weight of indicators
Since the socio-economic exposure indicators selected in this paper are three parallel indicators of population, GDP and built-up land, the entropy weight method with high objectivity is used to determine the indicator weights. The calculation formulas are as follows:
where, is the normalized value of the absolute or relative values of the exposed indicators j in large cities; is the absolute or relative values of the exposed indicators in large cities i; is the absolute or relative exposure value of the indicators j in the HSHUAs of all large cities; n is 64 cities; is the entropy value of the indicators j, and is the weight of the indicators j.
3. Results
3.1. Exposure of Population, GDP, and Built-up Land in HSHUAs in 2015
In 2015, approximately 249.3 million people lived in HSHUAs, accounting for 72.06% and 18.14% of the population in UALCs and the country, respectively. Nearly half (43.66%) of these people lived in the Type II large cities (Table 3). The average population density in HSHUAs reached 1522 persons/km2, about 2.26 times higher than that outside HSHUAs (674 persons/km2). The top 10 cities with the largest population in HSHUAs included Shanghai, Beijing, Tianjin, Shenzhen, Nanjing, Guangzhou and Foshan in eastern China, Shenyang in central China, Chengdu and Xi’an in western China (Figure 3). The exposed population of these 10 cities amounted to 113.89 million, accounting for 38.65% of the total population in HSHUAs.
The GDP in HSHUAs was 3.27×10³ billion USD, accounting for more than two-thirds of the GDP in UALCs and one-third of the country’s GDP. The top 10 cities with the highest GDP in HSHUAs were similar to those of population, except for the substitution of Yangzhou for Guangzhou (Figure 4).
The built-up land in HSHUAs amounted to 26987 km2, accounting for 75.02% and 24.55% of the totals in UALCs and the country, respectively. 50.25% of the built-up land were concentrated in Type Ⅱ large cities (Table 3). The top 10 cities with the largest built-up land in HSHUAs included Beijing, Shanghai, Tianjin, Tangshan, Suzhou, Foshan, Shantou and Nanjing in eastern China, Shenyang in central China, and Chengdu in western China. These cities accounted for 46.52% (12554 km²) of built-up land in HSHUAs (Figure 5).
The distribution of population, GDP, and built-up land in HSHUAs show a high spatial heterogeneity (Figure 3, Figure 4 and Figure 5), mainly concentrated in large urban agglomerations such as the Yangtze River Delta region, Beijing-Tianjin-Hebei region, and the Pearl River Delta region in East China.
3.2. Exposure Changes in HSHUAs during 1990-2015
The population in HSHUAs increased from 138.91 million in 1990 to 249.30 million in 2015, with a PC of 79.47% and an AGR of 2.37%, significantly higher than the national average of 20.23% and 0.74% over the same period (Table 4). Meanwhile, the population in HSHUAs rose from 12.15% to 18.14% of the country, with an average population density increasing from 848 people/km² to 1522 people/km². Of the total increased population in UALCs, 82.07% were located in HSHUAs. The top 10 cities accounted for 56.90 million or 51.55% of the increased population in HSHUAs, including Shanghai, Beijing, Shenzhen, Chengdu, Guangzhou, Tianjin, Foshan, Zhengzhou, Changchun, and Nanjing (Figure 6).
The GDP in HSHUAs increased from 0.25×10³ billion USD in 1990 to 3.27×10³ billion USD in 2015, with a PC of 1218.47% and an AGR of 10.87%, higher than the national average of 971.44% and 9.95% (Table 4). HSHUAs rose from 24.58% to 30.24% of the national GDP. Of the GDP growth in UALCs, 67.51% was in HSHUAs. 58.04% (1.75×10³ billion USD) of the GDP growth in HSHUAs was from the top 10 cities, including Shanghai, Beijing, Tianjin, Shenzhen, Chengdu, Yangzhou, Nanjing, Foshan, Shenyang and Xi’an (Figure 7).
The built-up land in HSHUAs increased from 16395 km² in 1990 to 26987 km² in 2015, with a PC of 64.61% and an AGR of 2.01%, slightly lower than the national average of 79.68% and 2.37% (Table 4). Accordingly, HSHUAs decreased from 26.80% to 24.55% of the national built-up land. Of the total increased built-up land in UALCs, 70.69% were located in HSHUAs. 51.23% (5427 km²) of the new built-up land in HSHUAs was attributed to the top 10 cities, including Shanghai, Tianjin, Suzhou, Beijing, Tangshan, Changzhou, Foshan, Nanjing, Shenyang and Linyi (Figure 8).
3.3. Exposure Changes in Different Types of Large Cities
For different types of large cities, their shares of increased population, GDP, and built-up land in HSHUAs between 1990 and 2015 were calculated, respectively (Figure 9). The proportion of increased GDP and population for Megacities was 30.38% and 26.77 %, significantly higher than that of increased built-up land (17.22%). This indicates that the exposure growth of Megacities in HSHUAs was mainly driven by industry and population agglomeration. In contrast, Type II large cities present the highest proportion of increased built-up land in HSHUAs (52.61%), higher than that of the population (38.69%) and GDP (37.51%). This indicates that the exposure growth of Type II large cities in HSHUAs was mainly led by urban spatial expansion. For Supercity and Type I large cities, their proportion of increased population or GDP in HSHUAs was slightly greater than that of built-up land.
3.4. Comprehensive Exposure Changes from 1990 to 2015
The difference of absolute and relative exposure indices between 1990 and 2015 were used to indicate the comprehensive exposure changes in large cities from 1990 to 2015. The growth of absolute exposure index varied greatly among cities (Figure 10) from 1990 to 2015. The absolute exposure index in the HSHUAs increased between 0.01 to 55.75 during 1990-2015, with an average of 7.02. The 10 cities with the most growth are ranked from more to less: Shanghai, Beijing, Tianjin, Shenzhen, Foshan, Chengdu, Nanjing, Suzhou, Yangzhou and Shenyang. Majority of the cities are super-large and mega-cities, and are concentrated in the three major urban agglomerations, which are Beijing-Tianjin-Hebei, Yangtze River Delta and Pearl River Delta (Figure10). These cities, as the focus of China ‘s urbanization strategy, have developed rapidly, and their population, economic assets and built-up land baseline and expansion scale far exceeded other large cities. Under such a development model, social and economic factors inevitably extend to the high seismically hazardous zones, resulting in the largest increase in the absolute exposure index of these cities.
The relative exposure index of the HSHUAs increased from -5.65 to 25.28 during the period from 1990 to 2015, with an average of 17.71. The relative exposure index growth distribution of each city was relatively concentrated, mainly distributed between 21.9 and 22.6 (Figure 11). 10 cities with the largest increase in relative exposure index were ranked from more to less: Ningbo, Huainan, Baoding, Hohhot, Quanzhou, Jilin, Zhengzhou, Shanghai, Datong and Kunming. In contrast to the change of absolute exposure index, the proportion of socio-economic factors exposed to high seismically hazardous zones increased rapidly in urban areas of these large cities, indicating that socio-economic growth in these cities was mainly concentrated in high seismically hazardous zones. The urban area of this type of cities is relatively small, and the high seismically hazardous zones account for a large proportion in the urban areas, resulting in the forced exposure of socio-economic factors during urban development and expansion.
Figure 12 comprehensively shows the degree of exposure growth in each large city and the proportion change of exposure to the social and economic growth of the whole city. The absolute exposure index of super-megacities such as Shanghai, Beijing, Tianjin and Shenzhen increased by 55.75, 38.01, 35.30 and 34.51, while the relative exposure index increased by 22.70, 22.60, 22.29 and 20.47, showing a ‘ double high ‘ model with high absolute value of total exposure growth and high proportion of exposure to socio-economic growth.
Another type of exposure change pattern in large cities included 13 cities such as Huainan, Baoding, Hohhot, Jilin etc. The change in absolute exposure index was relatively low (≤ 3.9), but the change in relative exposure index was significant (≥21.9), showing a “low-high” pattern. The growth of socio-economic factors in the HSHUAs accounted for a very high proportion in the entire city. Many of these cities are located in high seismically hazardous zones, such as Datong, Kunming, Tangshan, etc. Therefore, for cities with a “low-high” pattern, exposure growth has a significant impact on local seismic disaster risk.
4. Discussion
4.1. Drivers of Exposure Growth in HSHUAs
Figure 11 shows the population, GDP, and built-up land in HSHUAs and UALCs as a proportion of the country. From 1990 to 2015, population change in HSHUAs was highly consistent with that in UALCs, as well GDP and built-up land. This suggests that rapid urbanization played an important role in the remarkable exposure growth in HSHUAs.
UALCs and HSHUAs showed an upward trend in the shares of population and GDP (Figure 11a, Figure 11b). This is in line with the principle of agglomeration economies during the urbanization [35] , i.e., large cities are more attractive to people and industries for their benefits of industrial collaboration, skilled human resources, consumer markets, social services, etc. [36,37]. Our results also show that both population and GDP growth rates in UALCs were higher than national levels, especially for mega-cities and super-cities (Table 4). With increasing land-use pressure in these large cities, it is inevitable that population and industry will expand and cluster in HSHUAs.
In contrast, the shares of built-up land in UALCs and HSHUAs showed a decreasing trend (Figure 11c). In earlier stages of urbanization, poorly controlled urban expansion led to a rapid increase of built-up land in large cities [38]. However, with the shortage of available land and the implementation of strict land-use policies, such as the protection of arable land and ecological land [39], the expansion of built-up land in large cities gradually slowed down [40,41,42]. In general, the growth rate of built-up land in UALCs was relatively lower than the national level (Table 4).
Figure 11.
The proportion of population (a), GDP (b), built-up land(c) in UALCs (in blue) and HSHUAs (in orange) to the national total from 1990 to 2015.
Figure 11.
The proportion of population (a), GDP (b), built-up land(c) in UALCs (in blue) and HSHUAs (in orange) to the national total from 1990 to 2015.
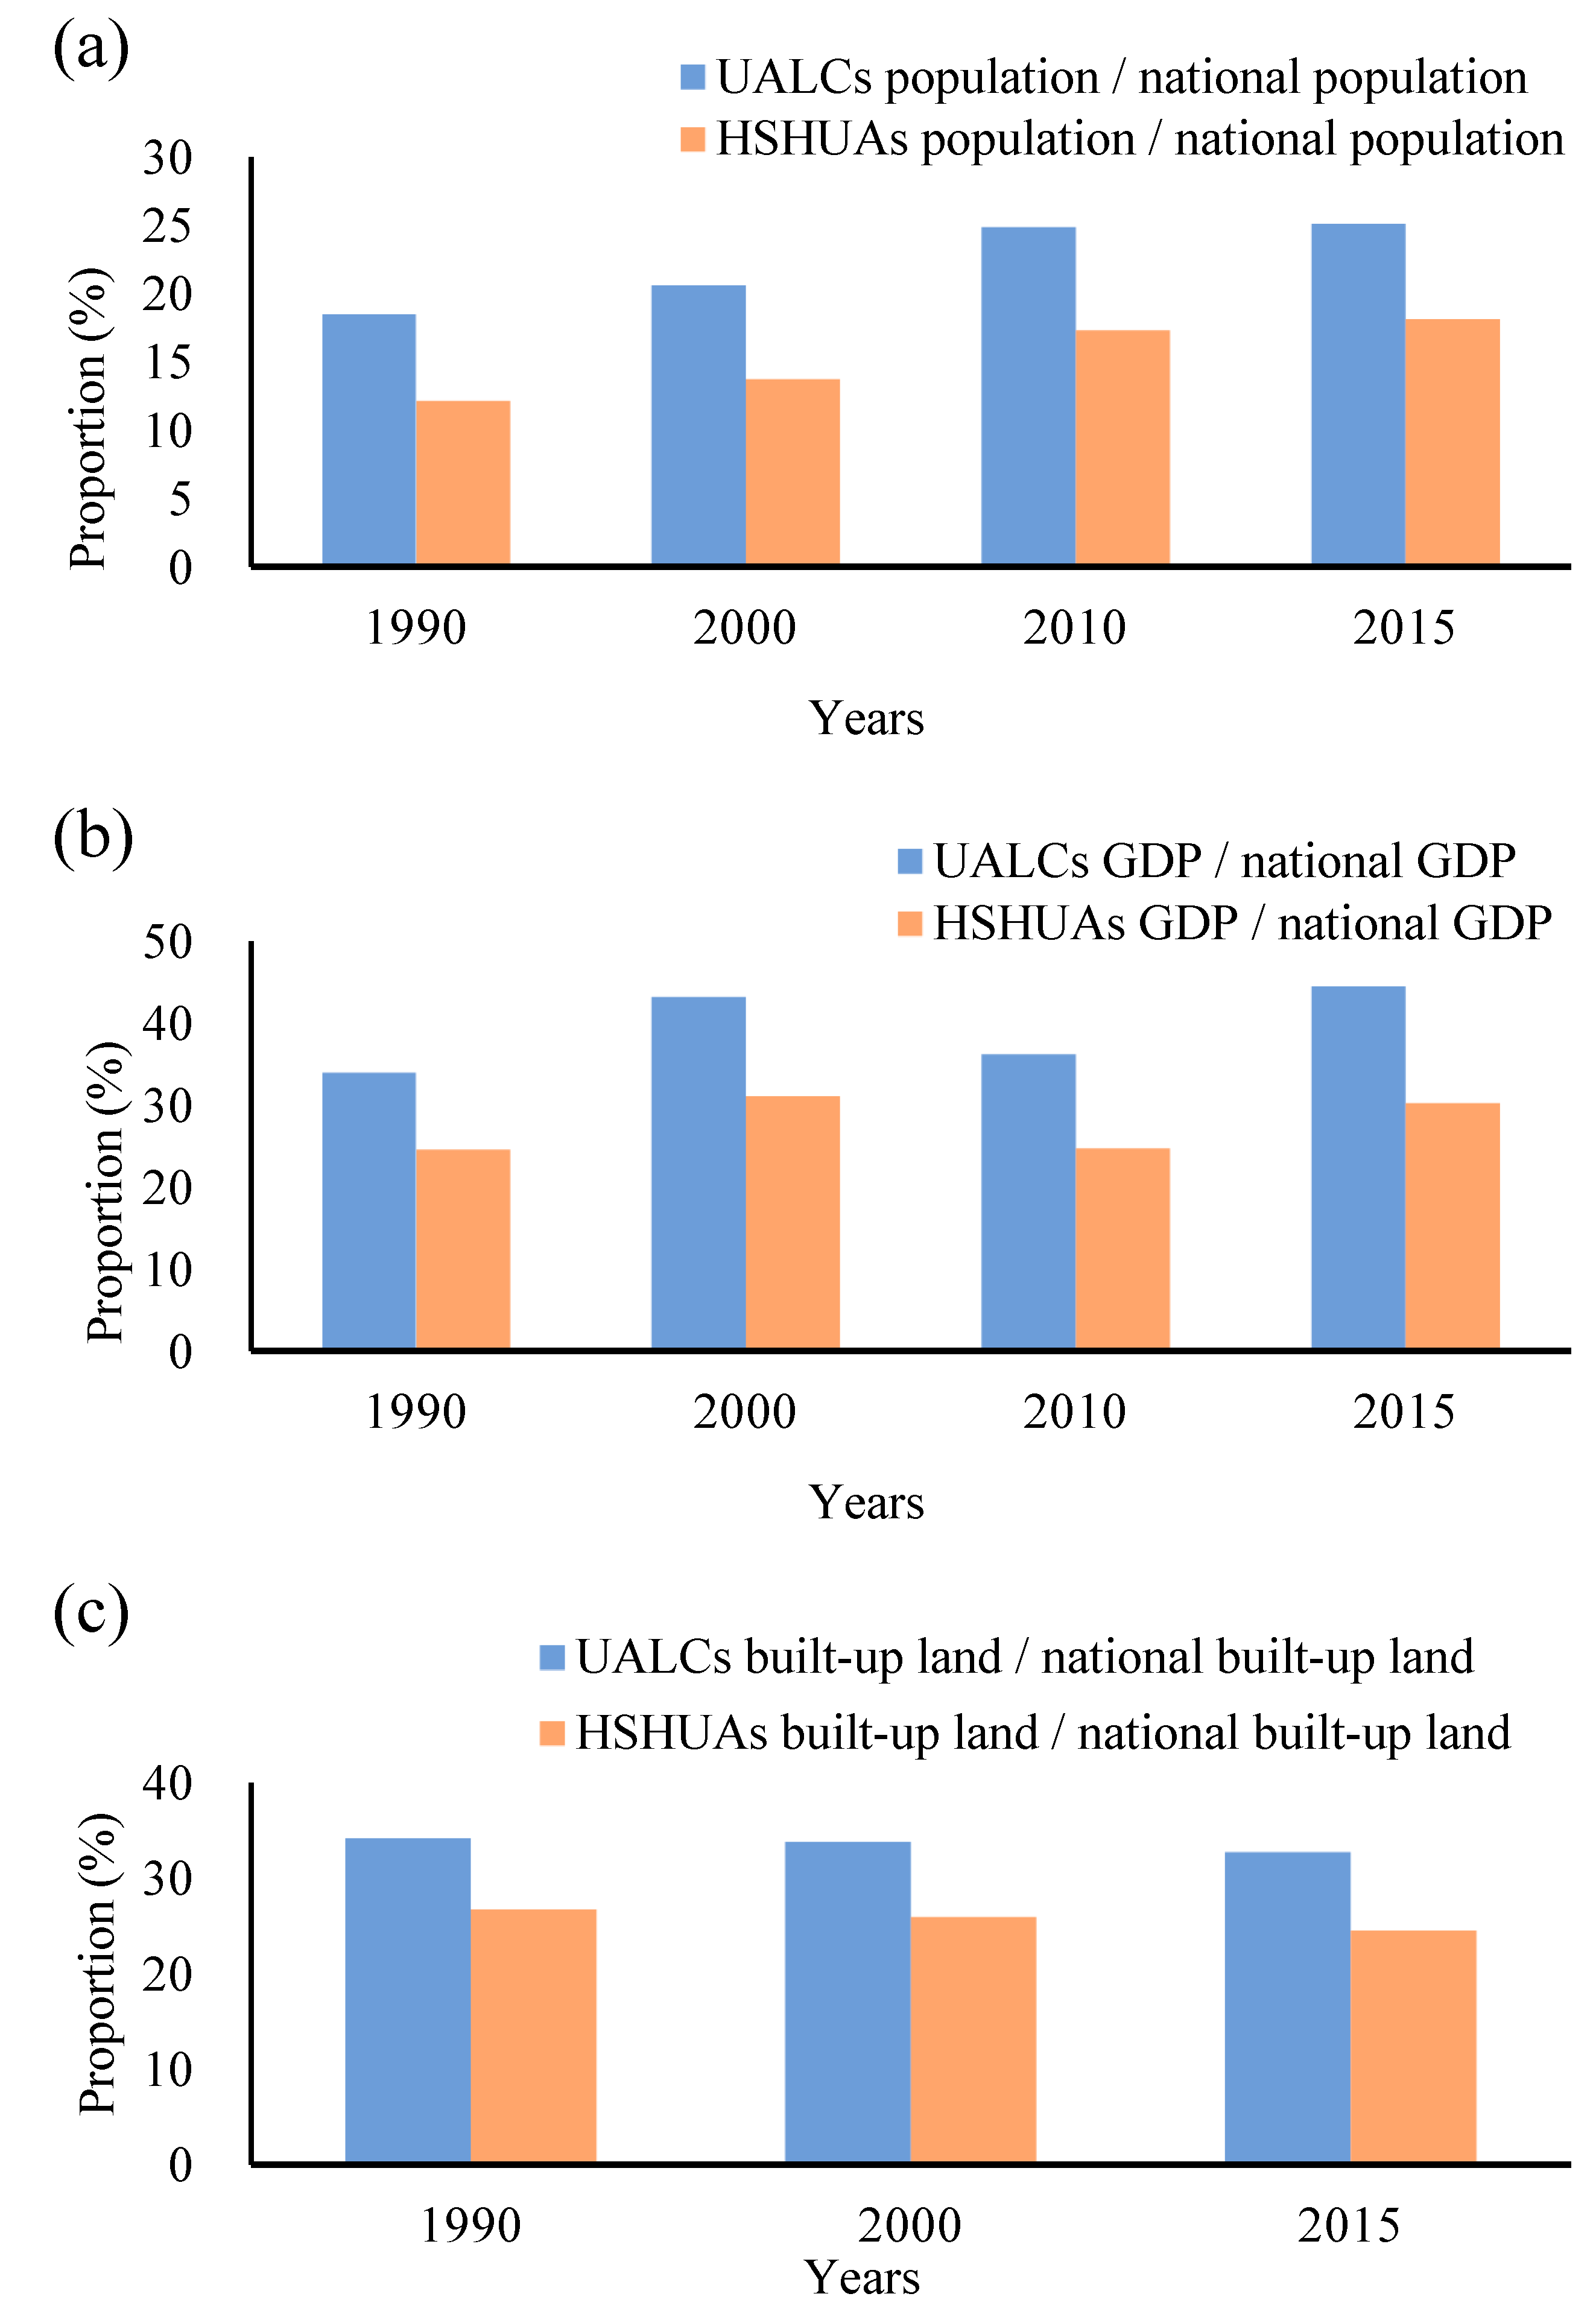
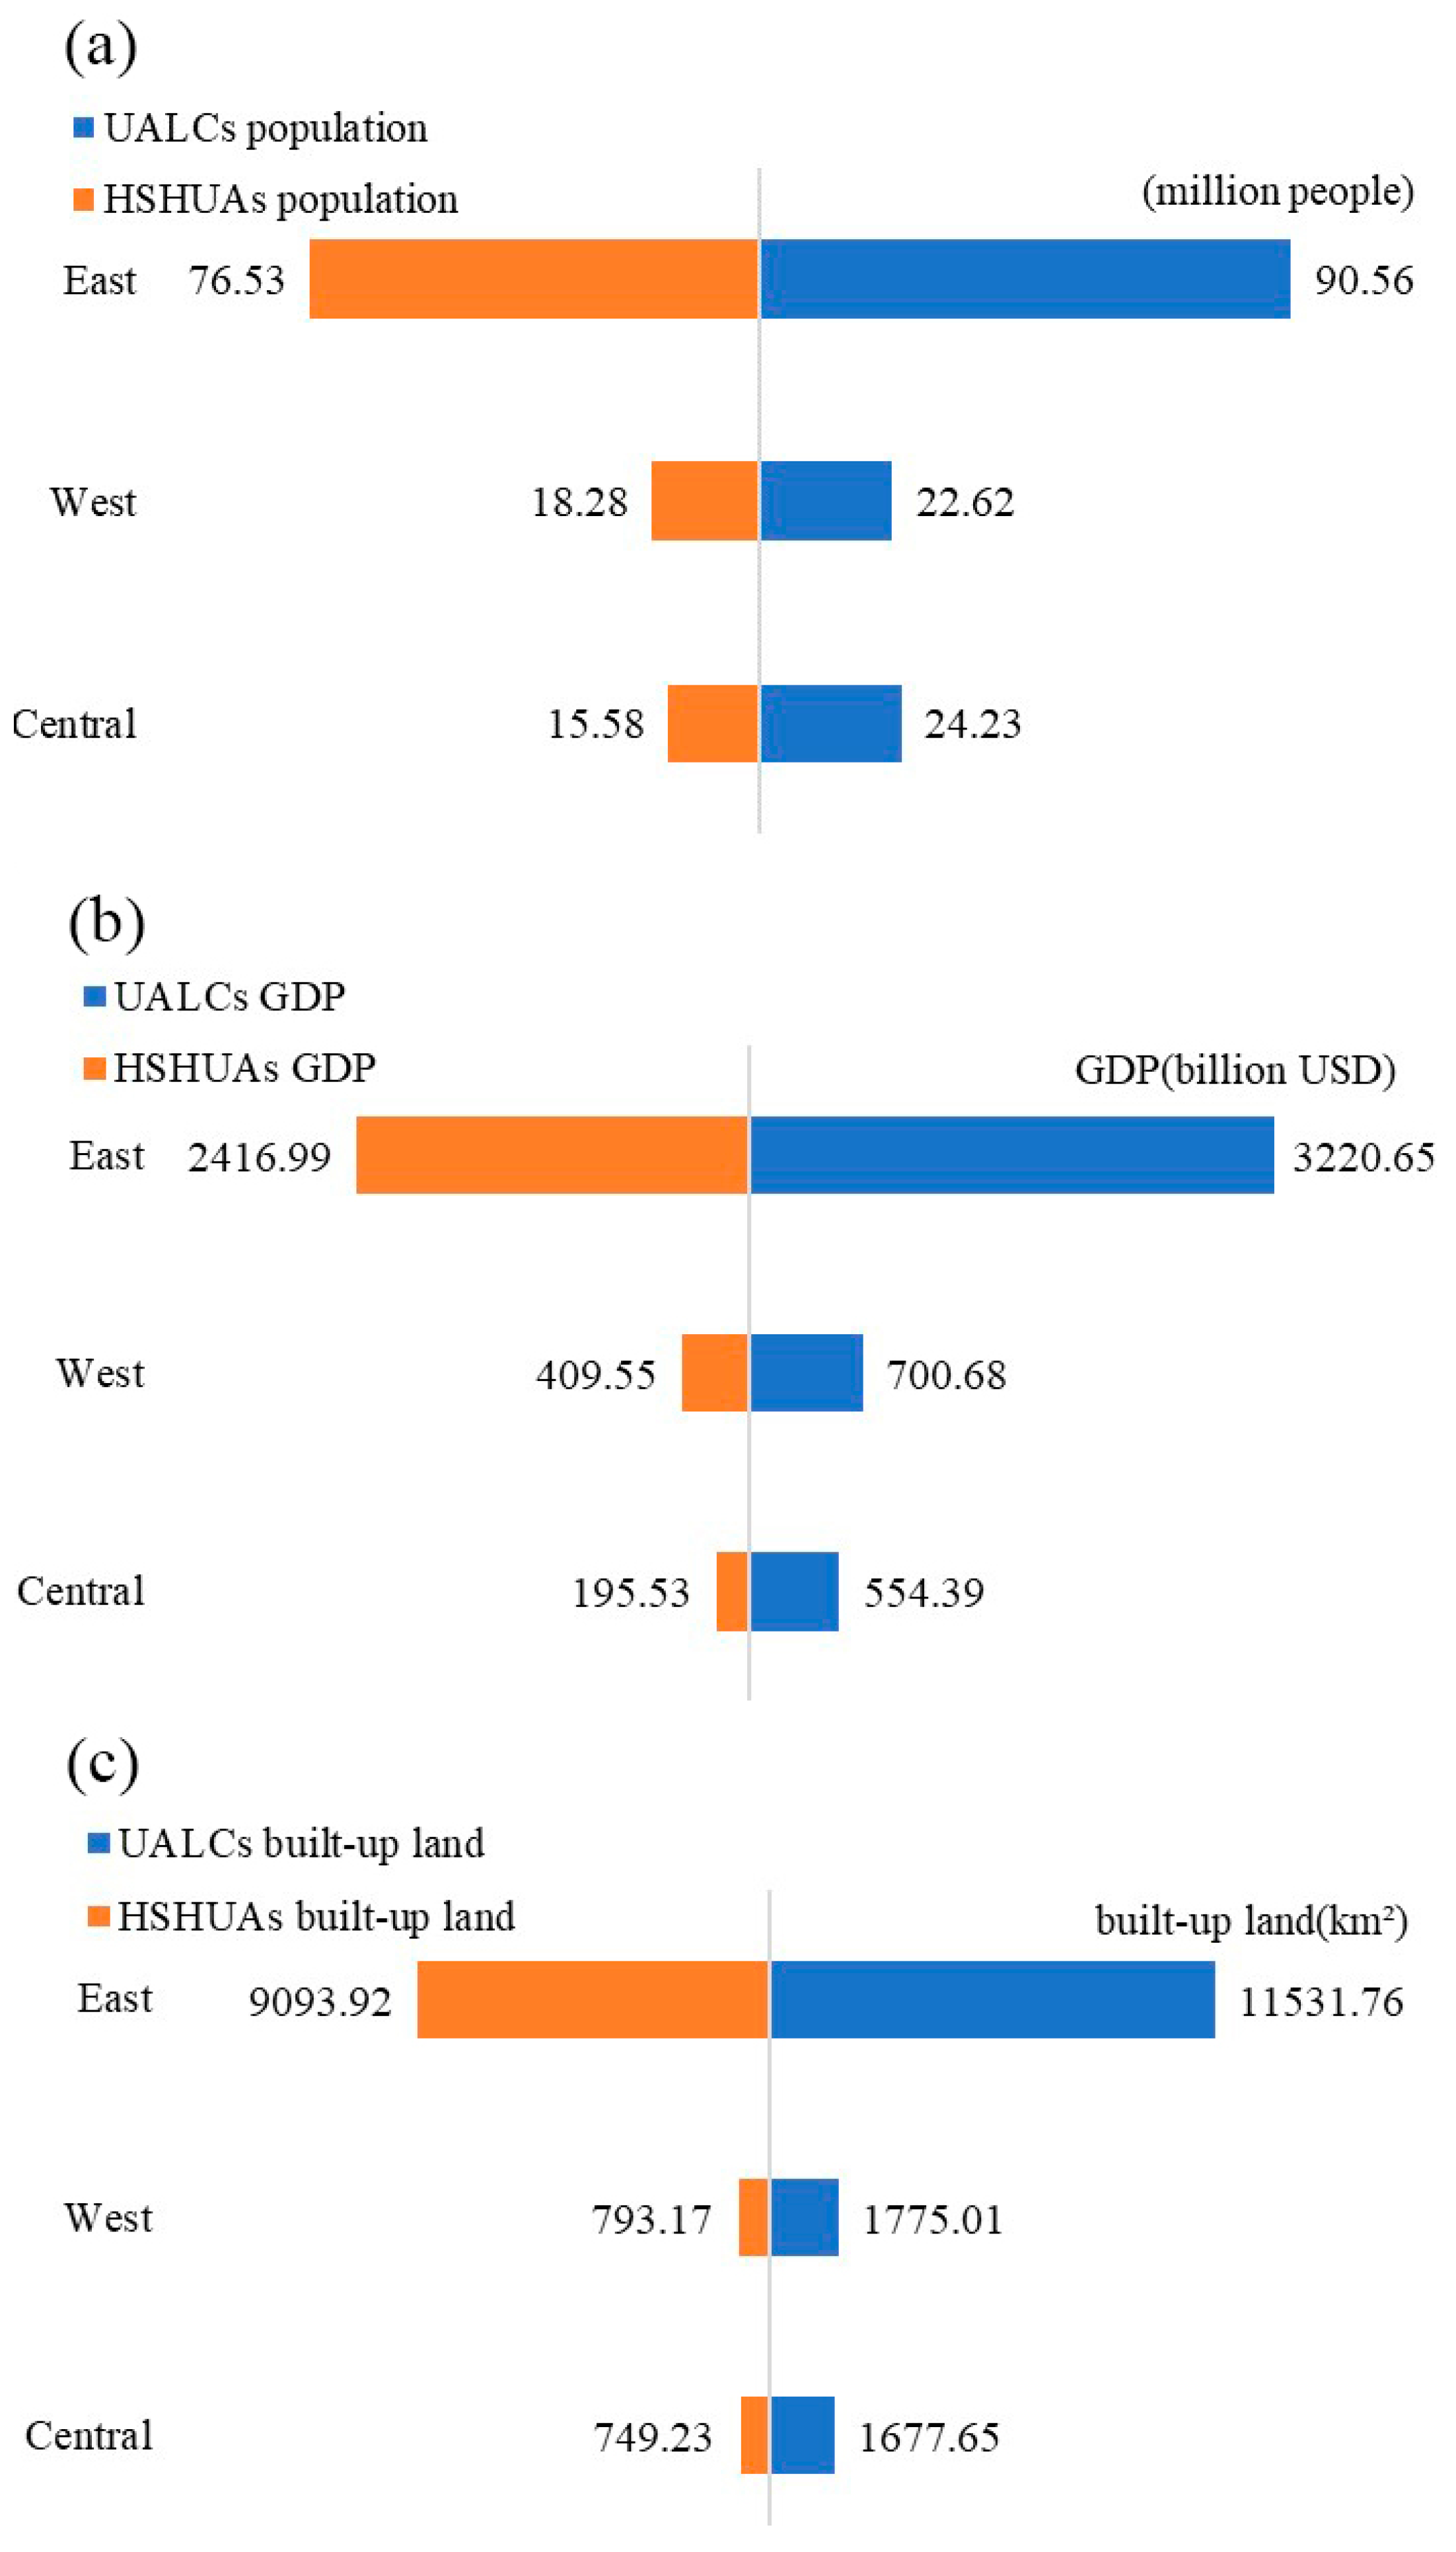
Figure 12 shows the growth of population, GDP, and building land in UALCs and HSHUAs, distinguishing between eastern, central and western China. The increased population, GDP, and built-up land in eastern China were 2.26, 3.99 and 5.90 times greater than the total of the central and west, respectively. This is also consistent with the regional patterns of urbanization in China, population and industry tend to cluster in developed cities in eastern China [43].
Figure 12.
Population (a), GDP (b) and built-up (c) changes in the UALCs and HSHUAs of different regions in China during 1990 to 2015.
Figure 12.
Population (a), GDP (b) and built-up (c) changes in the UALCs and HSHUAs of different regions in China during 1990 to 2015.
4.2. Policy Implications
In 1998, the national law on prevention and mitigation of earthquake disasters proposed a comprehensive earthquake coping strategy in China, including the earthquake monitoring and prediction, protection against earthquake disasters, measures for earthquake emergencies, post-earthquake relief and reconstruction, etc. However, this was a disaster-oriented management approach [44]. Following the Hyogo Framework for Action 2005-2015 and a series of global reports on disaster reduction, the concept of disaster risk management and resilience building is proposed, which was dedicated to risk governance by addressing its exposure, vulnerability and by enhancing resilience [45,46,47]. Therefore, there is a need for a paradigm shift from disaster response to risk management and resilient development [48].
In the 14th Five-Year Plan (2021-2025), China will continue to promote its socio-economic development based on central cities and urban agglomerations. More population and industry are expected to concentrate in large cities, along with the expansion of built-up land. Thus, it is necessary to address the increasing exposure and seismic risk in these large cities and enhance their resilience. First, understanding the rising exposure and seismic risk is essential for risk-based decision making, urban planning and seismic risk reduction. It is necessary to simulate spatially explicit seismic scenarios with different probabilities, and assess their potential impacts on exposure elements [49]. Second, risk-sensitive planning and regulation can restrict the disorderly expansion and concentration of exposure in HSHUAs, thus avoiding potential seismic losses. The latest seismic risk information should be employed for urban planning, especially for the distribution and location of high potential loss facilities, such as nuclear power plants, dams, military facilities, hazardous chemical industrial parks, gasoline storage and other critical facilities. Third, structural measures including constructing new buildings with seismic design codes and retrofitting old buildings are recommended. Prior to 1989, seismic design codes in China had no seismic fortification requirements for the buildings in the VII zone where exposure to seismic hazard increased dramatically [50]. This means that there are still a large number of buildings in this area cannot meet the seismic requirements. Thus, the existing risk can be reduced by urban renewal and building reinforcement, especially in the VII zone. Forth, seismic preparedness is also critical for mitigating losses and resuming operations quickly. Collaborative networks involving multiple stakeholders should be strengthened to increase seismic preparedness. Appropriate prevention and preparation measures should be implemented, such as coordinated seismic early warning systems, contingency plans, alternative mechanisms for critical infrastructure services (i.e., power and communication networks, etc.), risk awareness promotion, and insurance premiums or guarantees.
4.3. Uncertainties
There are some uncertainties in the seismic hazard maps as well as gridded population, GDP and building data used in this study.
The seismic ground motion parameter zonation map is generated with a probabilistic seismic hazard analysis (PSHA). PSHA considers historical seismic events and models their temporal occurrence through a homogeneous Poisson process. Previous studies have argued that the seismic hazard estimation using PSHA might have some uncertainties [51,52,53], mainly because the available historical seismic records are insufficient to guarantee a plausible estimation [54]. However, this study intends to analyze the exposure patterns and dynamics in HSHUAs rather than estimating the exact risk or losses in these areas. Nevertheless, the fifth seismic hazard map is a standard document issued by the Chinese government, and the basis of the building seismic protection, with high credibility and authority.
The WorldPop dataset is developed based on satellite remote sensing data and census data, as well as spatial disaggregation methods. The data accuracy is subject to the results of land use classification from remote sensing images. In some cases, population may be allocated to non-residential areas [55]. The uncertainty is greater in less-developed northern and western China, where settlements are small and sparsely distributed. In addition, the assumption that the population density per land-use type is a fixed value is insufficient to reflect the heterogeneity of the actual population distribution. Despite some uncertainties, the WorldPop dataset has higher spatial resolution and accuracy compared to other population datasets such as the CnPop dataset, the GPWv3, GRUMPv1, and the GRUMP dataset [56]. Regression analysis shows that in China, the fit between the WorldPop population and census population is above 0.98 at both national and city levels [57]. The WorldPop dataset has been widely used in studies on population mapping [58] and hazard exposure estimation [59].
The gridded GDP dataset is disaggregated from the GDP statistics at the county level. The disaggregation method and ancillary variables such as land use, night lighting, and settlement density have an important role in determining data accuracy. In addition, with a lack of ground truth data for GDP, it becomes challenging to deal with the data uncertainty. Therefore, we use the regression analysis to preliminarily validate the data in 2015 against the official statistics in China City Statistical Yearbook. The sample regions include 43 cities randomly selected from 78 large cities. Regression analysis shows that the average relative error (ARE) is 0.09, and the correlation coefficient (R2) is greater than 0.98 (Figure 13).
The GHSL built-up dataset used is generated with Landsat satellite images and symbolic machine learning (SML) classification methods. The data accuracy depends on the interpretation of the built-up land from Landsat images. It is found that areas with small proportions of developed land tend to have lower classification accuracies because of higher proportions of isolated structures that are difficult to detect [60]. In comparison to the building footprint data obtained from the Baidu map in China, GHSL tends to overestimate large cities (high-density areas) as a whole and underestimate small cities (low-density areas) . However, the quality and spatial detail of this dataset is over other global open-source built-up land datasets and has a high consistency with the observed building density distribution of China’s large cities [61].
In summary, this paper used the best existing population, GDP, and built-up datasets, which can be used for hazard exposure analysis with high credibility of the analysis results despite some uncertainties.
5. Conclusions
In this paper, we explored the spatiotemporal changes of population, GDP, and built-up land in HSHUAs in mainland of China from 1990 to 2015. Our results are as follows.
(1) The urban area of large cities with high seismic risk is 167177 km2, covering 60.08 % of the total urban area of 64 large cities in 78 large cities. Although HSHUAs cover only 1.73% of China, in 2015, their share of population (249.3 million), GDP (3.27×10³ billion USD), and built-up land (26987 km2) amounted to 18.14%, 30.24% and 24.55%, respectively.
(2) Rapid urbanization has led to dramatic growth of exposed population, GDP, and built-up land in HSHUAs. From 1990 to 2015, the population in HSHUAs increased by 110.39 million, with a PC of 79.47% and an AGR of 2.37%. The GDP in HSHUAs increased by 3.02×10³ billion USD, with a PC of 1218.47% and an AGR of 10.87%. The built-up land in HSHUAs increased by 10592 km², with a PC of 64.61% and an AGR of 2.01%. Overall, the population and GDP grow faster in HSHUAs than in the country, while the built-up land expanded slightly slower in HSHUAs than in the country.
(3) Exposure growth in HSHUAs varies for different types of cities. The absolute and relative exposure of super-large and mega-cities showed a ‘ double high ‘ model in the three major urban agglomerations of Beijing-Tianjin-Hebei, Yangtze River Delta and Pearl River Delta in eastern China, while the type II large cities with relatively smaller urban areas and slower socio-economic development showed a ‘ low-high ‘ model with less absolute exposure growth but a very high proportion of exposure growth in the whole city. For such ‘ low-high ‘ cities, exposure growth may has a greater impact on local earthquake disaster risk. Megacity had a higher proportion of increased GDP and population, which was driven mainly by industry and population agglomeration. Conversely, Type II large cities had a higher proportion of increased built-up land in HSHUAs, which was driven mainly by urban sprawl.
In the context of rapid urbanization, population, assets and infrastructure will inevitably continue to agglomerate in large cities with greater seismic exposure. There is a need to achieve a paradigm shift from disaster response to seismic risk management and resilient development of large cities.
Author Contributions
Conceptualization, W.J; Methodology, L.W; Software, C.Y.; Formal analysis, W.Q.,L.J.,L.L.; Writing—original draft, W.H.; Writing—review & editing, D.Q. All authors have read and agreed to the published version of the manuscript.
Funding
This study was supported by the National Natural Science Foundation of China (Grants No. 42171080), the National Social Science Foundation of China (Grants No. 19CZS077) and Research on Major Policy Theory and Practical Issues of China Earthquake Administration (Grants No. CEAZY2019JZ10).
Institutional Review Board Statement
Not applicable.
Informed Consent Statement
Not applicable.
Data Availability Statement
Data are contained within the article.
Conflicts of Interest
The authors declare no conflict of interest.
References
- UNISDR, 2015a. United Nations: Sendai Framework for Disaster Risk Reduction 2015—2030. Geneva,Switzerland: United Nations Office for Disaster Risk Reduction (UNISDR).
- Hall M L, Lee A C K, Cartwright C et al., 2017. The 2015 Nepal earthquake disaster: Lessons learned one year on. Public Health, 145(2017): 39-44. [CrossRef]
- Wu, J.; Han, G.; Zhou, H et al. Economic development and declining vulnerability to climate-related disasters in China. Environmental Research Letters, 2018, 13(3), 34013.
- Rivera, F.; Rossetto, T.; Twigg, J. An interdisciplinary study of the seismic exposure dynamics of Santiago de Chile. International Journal of Disaster Risk Reduction, 2020, 48(2020), 101581.
- Zhang, P. Earthquake disasters and earthquake disaster prevention and mitigation in China. Seismology and Geology, 2008, 30(03), 577-583. (in Chinese)
- Yang, J.; Li, D.; Zhai, C et al. Key scientific issues in the urban earthquake resilience. Bulletin of National Natural Science Foundation of China, 2019, 33(05), 525-532. (in Chinese)
- Lang C, Gao M, Wu G et al., 2019. The concentration of population and GDP in high earthquake risk regions in China: temporal–spatial distributions and regional comparisons from 2000 to 2010. Pure and Applied Geophysics, 176(10): 4161-4175. [CrossRef]
- Yin, X.; Shao, Z.; Wang, W et al. Activity characteristics of strong earthquakes in eastern mainland china. Earthquake Research in China, 2020, 36(03), 427-441. (in Chinese)
- Bo J, Li P, Sun Y et al., 2019. The development and practice of the research on city resistance to earthquake disaster in China. Technology for Earthquake Disaster Prevention, 14(02): 259-268. (in Chinese)
- Shi, Z.; Cao, X.; Yan, X. Research on the Earthquakes Occurrence in the Cities of China. Earthquake Research in China, 2002, 18(04), 365-370. (in Chinese)
- Bo J, Li P, Sun Y et al., 2019. The development and practice of the research on city resistance to earthquake disaster in China. Technology for Earthquake Disaster Prevention, 14(02): 259-268. (in Chinese)
- Bai X, Shi P, Liu Y, 2014. Society: Realizing China’s urban dream. Nature, 509(7499): 158-160. [CrossRef]
- Li Y, Liu Y, Jin Y 2017. Complex network modeling spatial pattern and trend of interprovincial migration. Statistical Research, 34(09): 56-64. [CrossRef]
- Chen M, 2015. Research progress and scientific issues in the field of urbanization. Geographical Research, 34(04): 614-630. [CrossRef]
- Chen Si, 2011. The research of the city disaster risk and the construction of disaster reduction system strategies in China. Urban Development Studies, 18(11): 110-114. (in Chinese). [CrossRef]
- Wada, A.; Towhata, I.; Tamura, K et al. Moving toward cities where earthquakes will not cause a grievous disaster. Japan Architectural Review, 2018, 1(4), 410-418.
- Hussain E, Elliott J R, Silva V et al., 2020. Contrasting seismic risk for Santiago, Chile, from near-field and distant earthquake sources. Natural Hazards and Earth System Sciences, 20(5): 1533-1555. [CrossRef]
- Kolathayar S, 2021. Recent seismicity in Delhi and population exposure to seismic hazard. Natural Hazards, 109(2021): 2621-2648. [CrossRef]
- Sun, R.; Gong, Z.; Gao, G.; Shah, A.A. Comparative analysis of Multi-Criteria Decision-Making methods for flood disaster risk in the Yangtze River Delta. International Journal of Disaster Risk Reduction 2020. [Google Scholar] [CrossRef]
- Bandecchi A E, Pazzi V, Morelli S et al., 2019. Geo-hydrological and seismic risk awareness at school: Emergency preparedness and risk perception evaluation. International Journal of Disaster Risk Reduction, 40(2019): 101280. [CrossRef]
- Asio J M R, 2021. Disaster awareness and level of compliance to disaster programs in a highly urbanized city. Aquademia, 1(5): ep21003. [CrossRef]
- Ehrlich D, Melchiorri M, Florczyk A J et al., 2018. Remote sensing derived Built-Up area and population density to quantify global exposure to five natural hazards over time. Remote Sensing, 10(9): 1378. [CrossRef]
- Freire S, Aubrecht C, 2012. Integrating population dynamics into mapping human exposure to seismic hazard. Natural Hazards and Earth System Sciences, 12: 3533-3543. [CrossRef]
- Dou Y, Huang Q, He C et al., 2018. Rapid population growth throughout Asia’s earthquake-prone areas: A multiscale analysis. International Journal of Environmental Research and Public Health, 15(9): 1893. [CrossRef]
- He C, Huang Q, Dou Y et al., 2016. The population in China’s earthquake-prone areas has increased by over 32 million along with rapid urbanization. Environmental Research Letters, 11(7): 74028. [CrossRef]
- Wu, J.; Wang, C.; He, X et al. Spatiotemporal changes in both asset value and GDP associated with seismic exposure in China in the context of rapid economic growth from 1990 to 2010. Environmental Research Letters, 2017, 12(3), 34002.
- Chunyang He, Qingxu Huang, Xuemei Bai, et al., 2021. A Global Analysis of the Relationship Between Urbanization and Fatalities in Earthquake-Prone Areas.International Journal of Disaster Risk Science, (06): 805-820. [CrossRef]
- Gao M, 2003. The characteristics of earthquake disasters and countermeasures for their mitigation in metropolitans. Earthquake Research in China, 17(04): 3-10. [CrossRef]
- Lang C, Gao M, Wu X et al., 2020. Continental earthquakes in China and loss implications: Comparison of the 2014 Ludian Ms 6.5 and the 2008 Wenchuan Ms 8.0 earthquaks. Pure and Applied Geophysics, 177(1): 149-156. [CrossRef]
- Forni M, Haack J, Soden R et al., 2014. Open data for resilience initiative: Planning an open cities mapping project. Washington, D.C.: World Bank Group.
- Fang Y, Du S, Scussolini P et al., 2018. Rapid Population Growth in Chinese Floodplains from 1990 to 2015. International Journal of Environmental Research and Public Health, 15(8): 1602. [CrossRef]
- Xu, X. China GDP spatial distribution km grid dataset. Resource and Environment Science and Data Center. 2017. [Google Scholar]
- Pesaresi, M.; Ehrlich, D.; Thomas, K.; et al. atlas of the human planet 2017: Global exposure to natural hazards. European Commission: Joint Research Centre.2017. the State Council of China, 2014. the State Council of PRC (the People’s Republic of China): China to apply new city classification standards. http://english.www.gov.cn/policies/latest_releases/2014/11/25/content_281475015213546.htm.
- Gu C, Wu L, Ian C, 2012. Progress in research on Chinese urbanization. Frontiers of Architectural Research, 1(2): 101-149. [CrossRef]
- Wang, X.; Hui, E.; Sun, J. Population migration, urbanization and housing prices: Evidence from the cities in China. Habitat International, 2017, 66(2017), 49-56.
- Wang, F.; Tian, M.; Yin, Z. Modern urbanization and industrial upgrading in China: Evidence from panel data. Quality & Quantity, 2021, 55(2), 661-681.
- Wei, H. Spatial expansion effect of urbanization in China. In: Urbanization in China. Research Series on the Chinese Dream and China’s Development Path. Singapore: Springer. 2019.
- Zhang, Y.; Chen, Z.; Cheng, Q et al. Quota restrictions on land use for decelerating urban sprawl of mega city: A case study of shanghai, China. Sustainability, 2016, 8(10), 968-984.
- Gao B, Huang Q, He C et al., 2016. How does sprawl differ across cities in China? A multi-scale investigation using nighttime light and census data. Landscape and Urban Planning, 148 (2016): 89-98. [CrossRef]
- Zhang, C.; Miao, C.; Zhang, W et al. Spatiotemporal patterns of urban sprawl and its relationship with economic development in China during 1990–2010. Habitat International, 2018, 79, 51-60.
- Gao M, 2017. National capacity enhancement and challenges in earthquake disaster prevention and mitigation. City and Disaster Reduction, 2: 1-7. [CrossRef]
- Lin W, Wu M, Zhang Y et al., 2018. Regional differences of urbanization in China and its driving factors. Science China Earth Sciences, 61: 778-791. [CrossRef]
- Zhang, L.; Huang, Q.; Ren, Q et al. Evolution of earthquake disaster management policy in China—A bibliometric analysis based on laws and regulations, 1949-2018. Journal of Natural Disasters, 2020, 29(05), 11-23.
- UNISDR, 2015b. Global Assessment Report on Disaster Risk Reduction. Geneva, Switzerland: United Nations Office for Disaster Risk Reduction (UNISDR).
- UNDRR, 2019. Global Assessment Report on Disaster Risk Reduction. Geneva, Switzerland: United Nations Office for Disaster Risk Reduction (UNDRR).
- UNISDR, 2017. Terminology: Basic terms of disaster risk reduction. Geneva, Switzerland: United Nations Office for Disaster Risk Reduction (UNISDR).
- GFDRR, 2018. A decade of progress in disaster risk management. Washington D.C.: Global Facility for Disaster Reduction and Recovery.
- Pittore, M.; Wieland, M.; Fleming, K. Perspectives on global dynamic exposure modelling for geo-risk assessment. Natural Hazards, 2017, 86(1), 7-30.
- Wang, Y.; Dai, G. Evolution and present update of ‘Code for seismic design of buildings’. Jouranl of Building Structures, 2010, 31(06), 7-16.
- Castaños H, Lomnitz C, 2002. PSHA: Is it science? Engineering Geology, 66(3): 315-317. [CrossRef]
- Wyss, M.; Nekrasova, A.; Kossobokov, V. Errors in expected human losses due to incorrect seismic hazard estimates. Natural Hazards, 2012, 62(3), 927-935.
- Mulargia, F.; Huang, Q.; Stark, P, B.; Geller, R, J. Why is probabilistic seismic hazard analysis (PSHA) still used? Physics of the Earth and Planetary Interiors 2017. 264, 63-75, 264, 63–75.
- Pan, H.; Gao, M.; Xie, F. The earthquake activity model and seismic parameters in the new seismic hazard map of China. Technology for Earthquake Disaster Prevention, 2013, 8(01), 11-23. (in Chinese)
- Stevens, F, R.; Gaughan, A, E.; Linard, C et al. Disaggregating census data for population mapping using random forests with remotely-sensed and ancillary data. Plos One, 2015, 2(10), e107042.
- Bai Z, Wang J, Wang M et al., 2018. Accuracy assessment of multi-source gridded population distribution datasets in China. Sustainability. 10(5): 1363. [CrossRef]
- Ma, J. Sun, Y.; Meng, D et al. Accuracy assessment of two global gridded population dataset: a case study in China. The 4th International Conference on Information Science and Systems, 2021; pp. 120–125.
- Gaughan A E, Stevens F R, Huang Z et al., 2016. Spatiotemporal patterns of population in mainland China, 1990 to 2010. Scientific Data, 3(1): 160005. [CrossRef]
- Mohant, M, P.; Simonovic, S, P. Understanding dynamics of population flood exposure in Canada with multiple high-resolution population datasets. Science of the Total Environment,2021, 759, 143559.
- Liu, F.; Wang, S.; Xu, Y et al. 2020. Accuracy assessment of Global Human Settlement Layer (GHSL) built-up products over China. Plos One. 2020, 5(15): e233164.
- Pesaresi, M.; Ehrlich, D.; Florczyk, A, J et al. The global human settlement layer from landsat imagery. 2016 IEEE International Geoscience and Remote Sensing Symposium (IGARSS), 2016; pp. 7276–7279.
Figure 1.
Distribution of UALCs and high seismically hazardous areas (HSHUAs). (The numbers in the figure correspond to the names of cities:1 Qiqihar; 2 Daqing; 3 Harbin; 4 Changchun; 5 Jilin; 6 Shenyang; 7 Fushun; 8 Anshan; 9 Dalian; 10 Baotou; 11 Hohhot; 12 Shenzhen; 13 Datong; 14 Beijing; 15 Tianjin; 16 Tangshan; 17 Yantai; 18 Urumqi; 19 Yinchuan; 20 Taiyuan; 21 Baoding; 22 Shijiazhuang; 23 Jinan; 24 Zibo; 25 Weifang; 26 Handan; 27 Qingdao; 28 Xining; 29 Lanzhou; 30 Xi’an; 31 Luoyang; 32 Zhengzhou; 33 Jining; 34 Linyi; 35 Suzhou; 36 Huai’an; 37 Yancheng; 38 Nanyang; 39 Huainan; 40 Nanjing; 41 Yangzhou; 42 Nantong; 43Changzhou; 44 Wuxi; 45 Suzhou; 46 Shanghai; 47 Xiangyang; 48 Hefei; 49 Wuhu; 50 Hangzhou; 51 Shaoxing; 52 Ningbo; 53 Chengdu; 54 Nanchong; 55 Chongqing; 56 Wuhan; 57 Nanchang; 58 Wenzhou; 59 Zigong; 60 Luzhou; 61 Zunyi; 62 Changsha; 63 Zhuzhou; 64 Hengyang; 65 Fuzhou; 66 Guiyang; 67 Ganzhou; 68 Yangquan; 69 Kunming; 70 Liuzhou; 71 Foshan; 72 Guangzhou; 73 Dongguan; 74 Huizhou; 75 Xiamen; 76 Shantou; 77 Nanning; 78 Haikou).
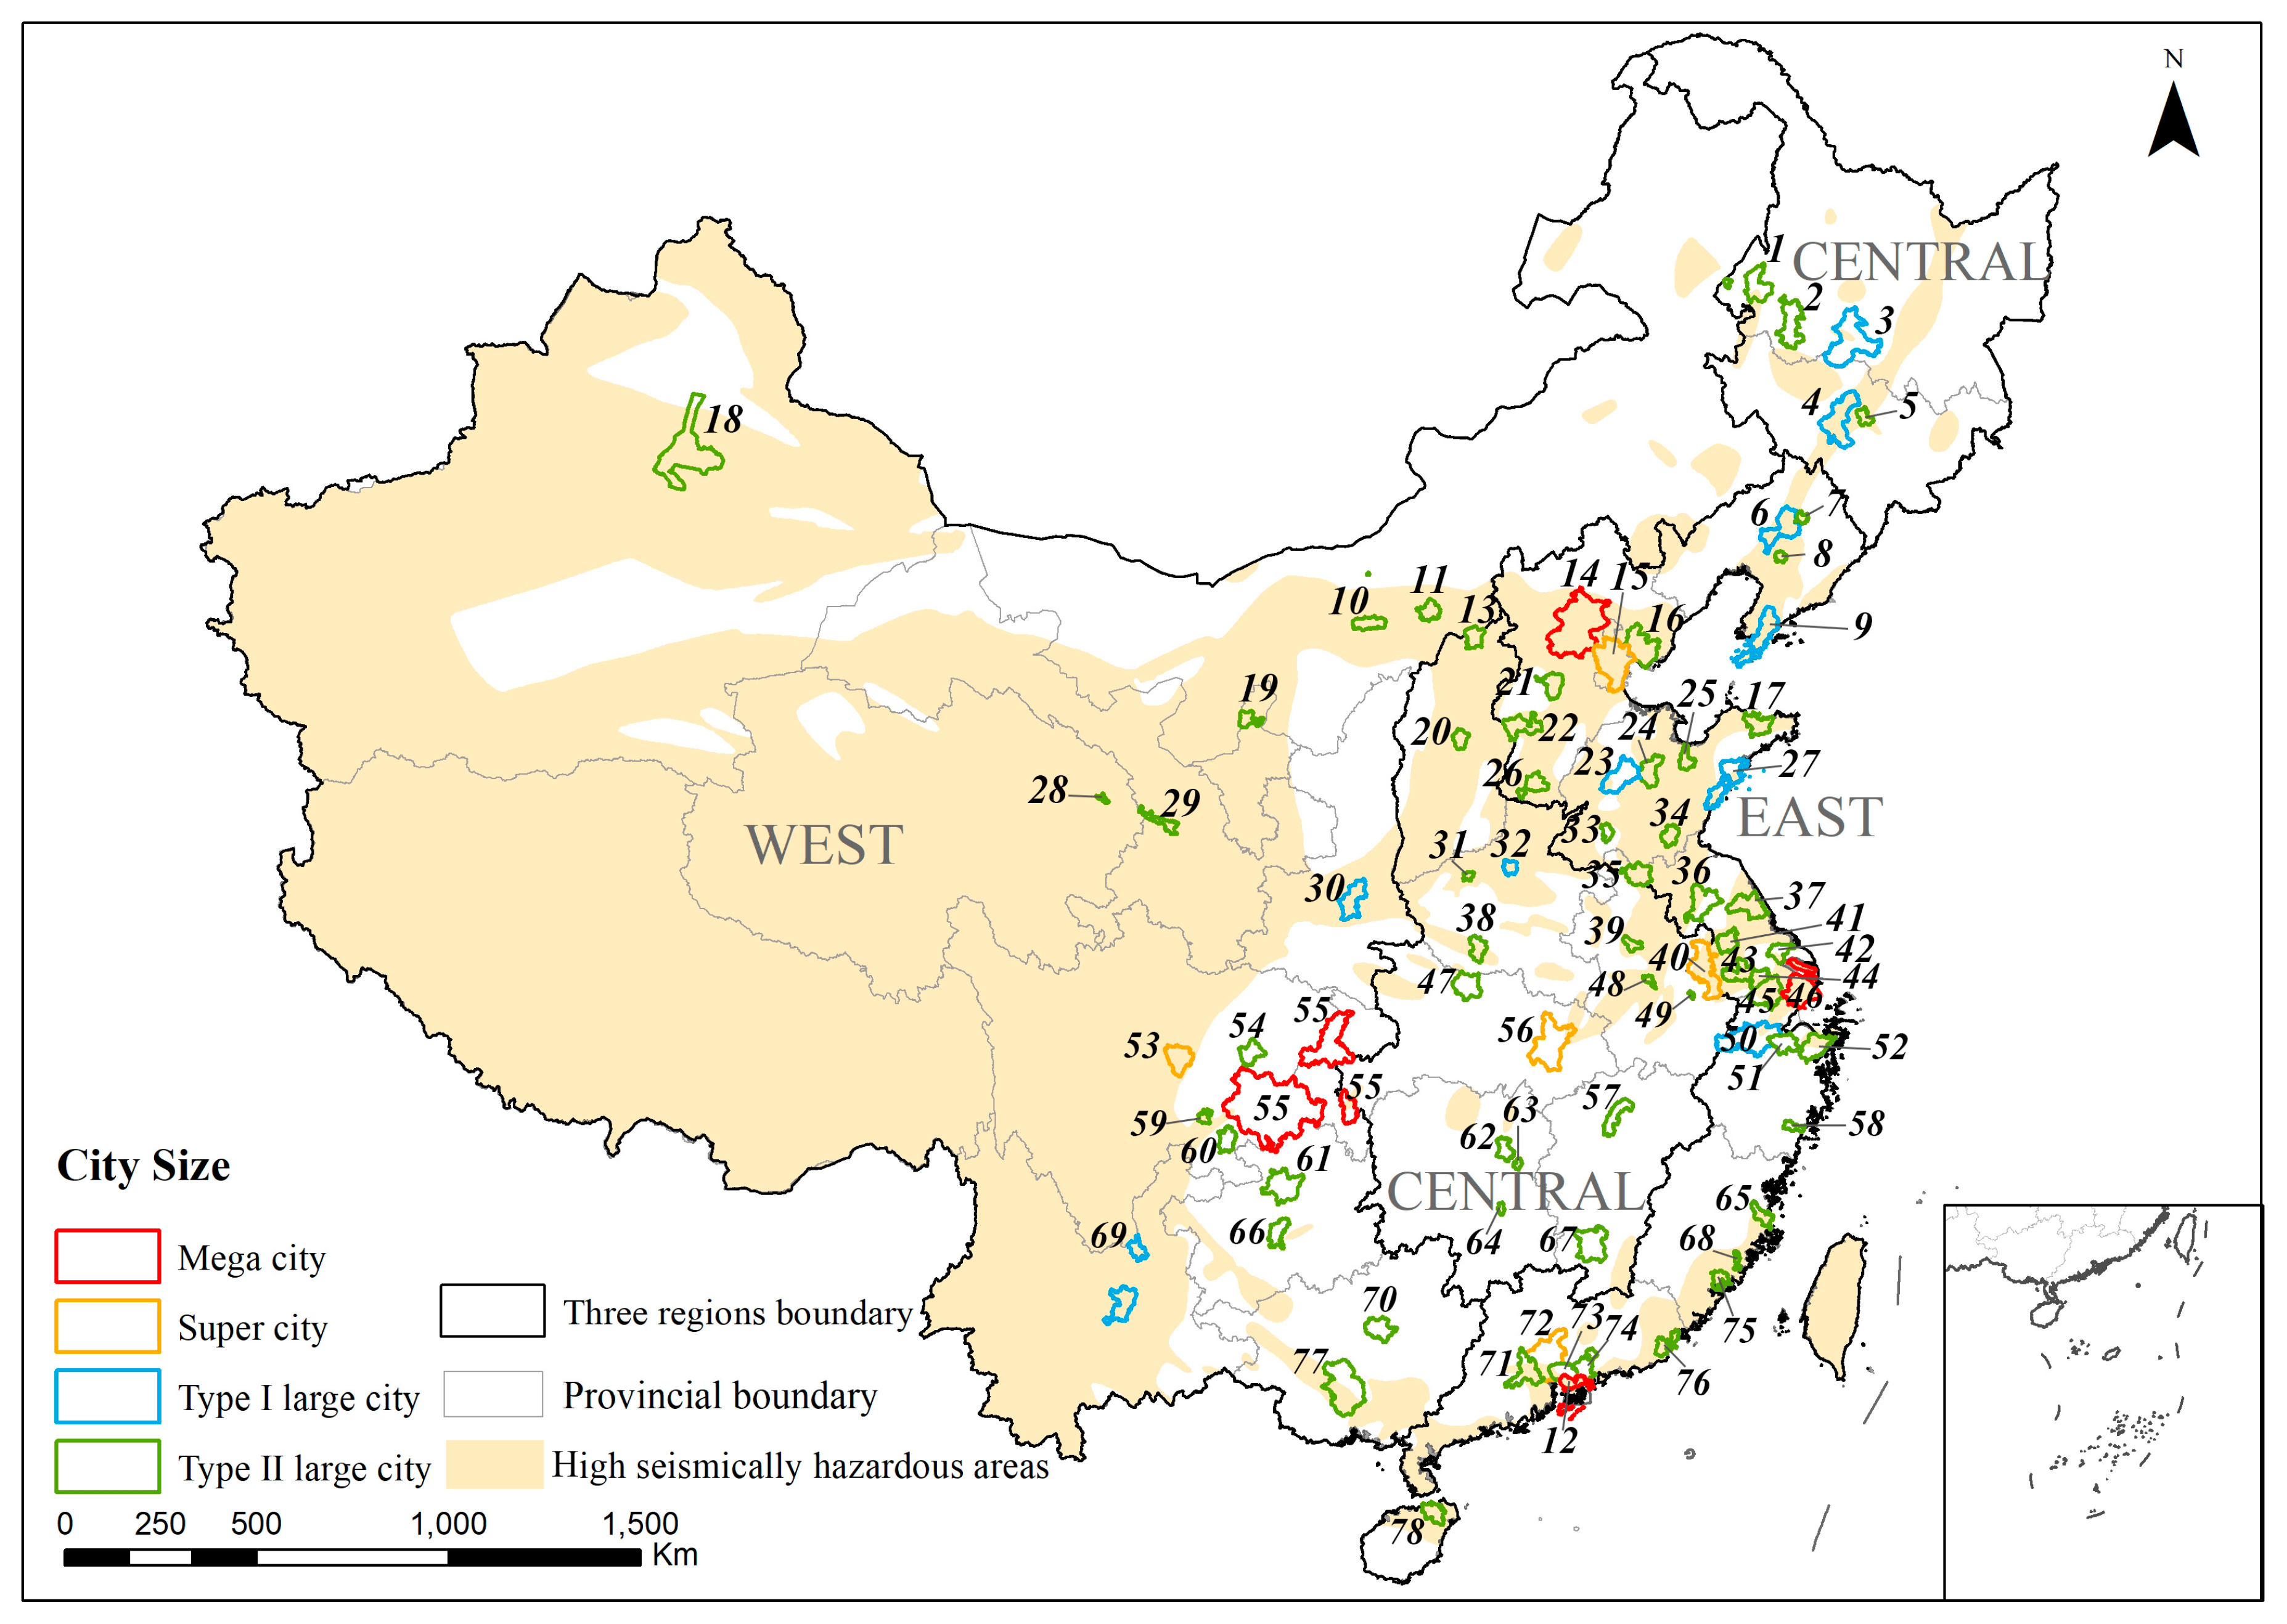
Figure 2.
The research framework.
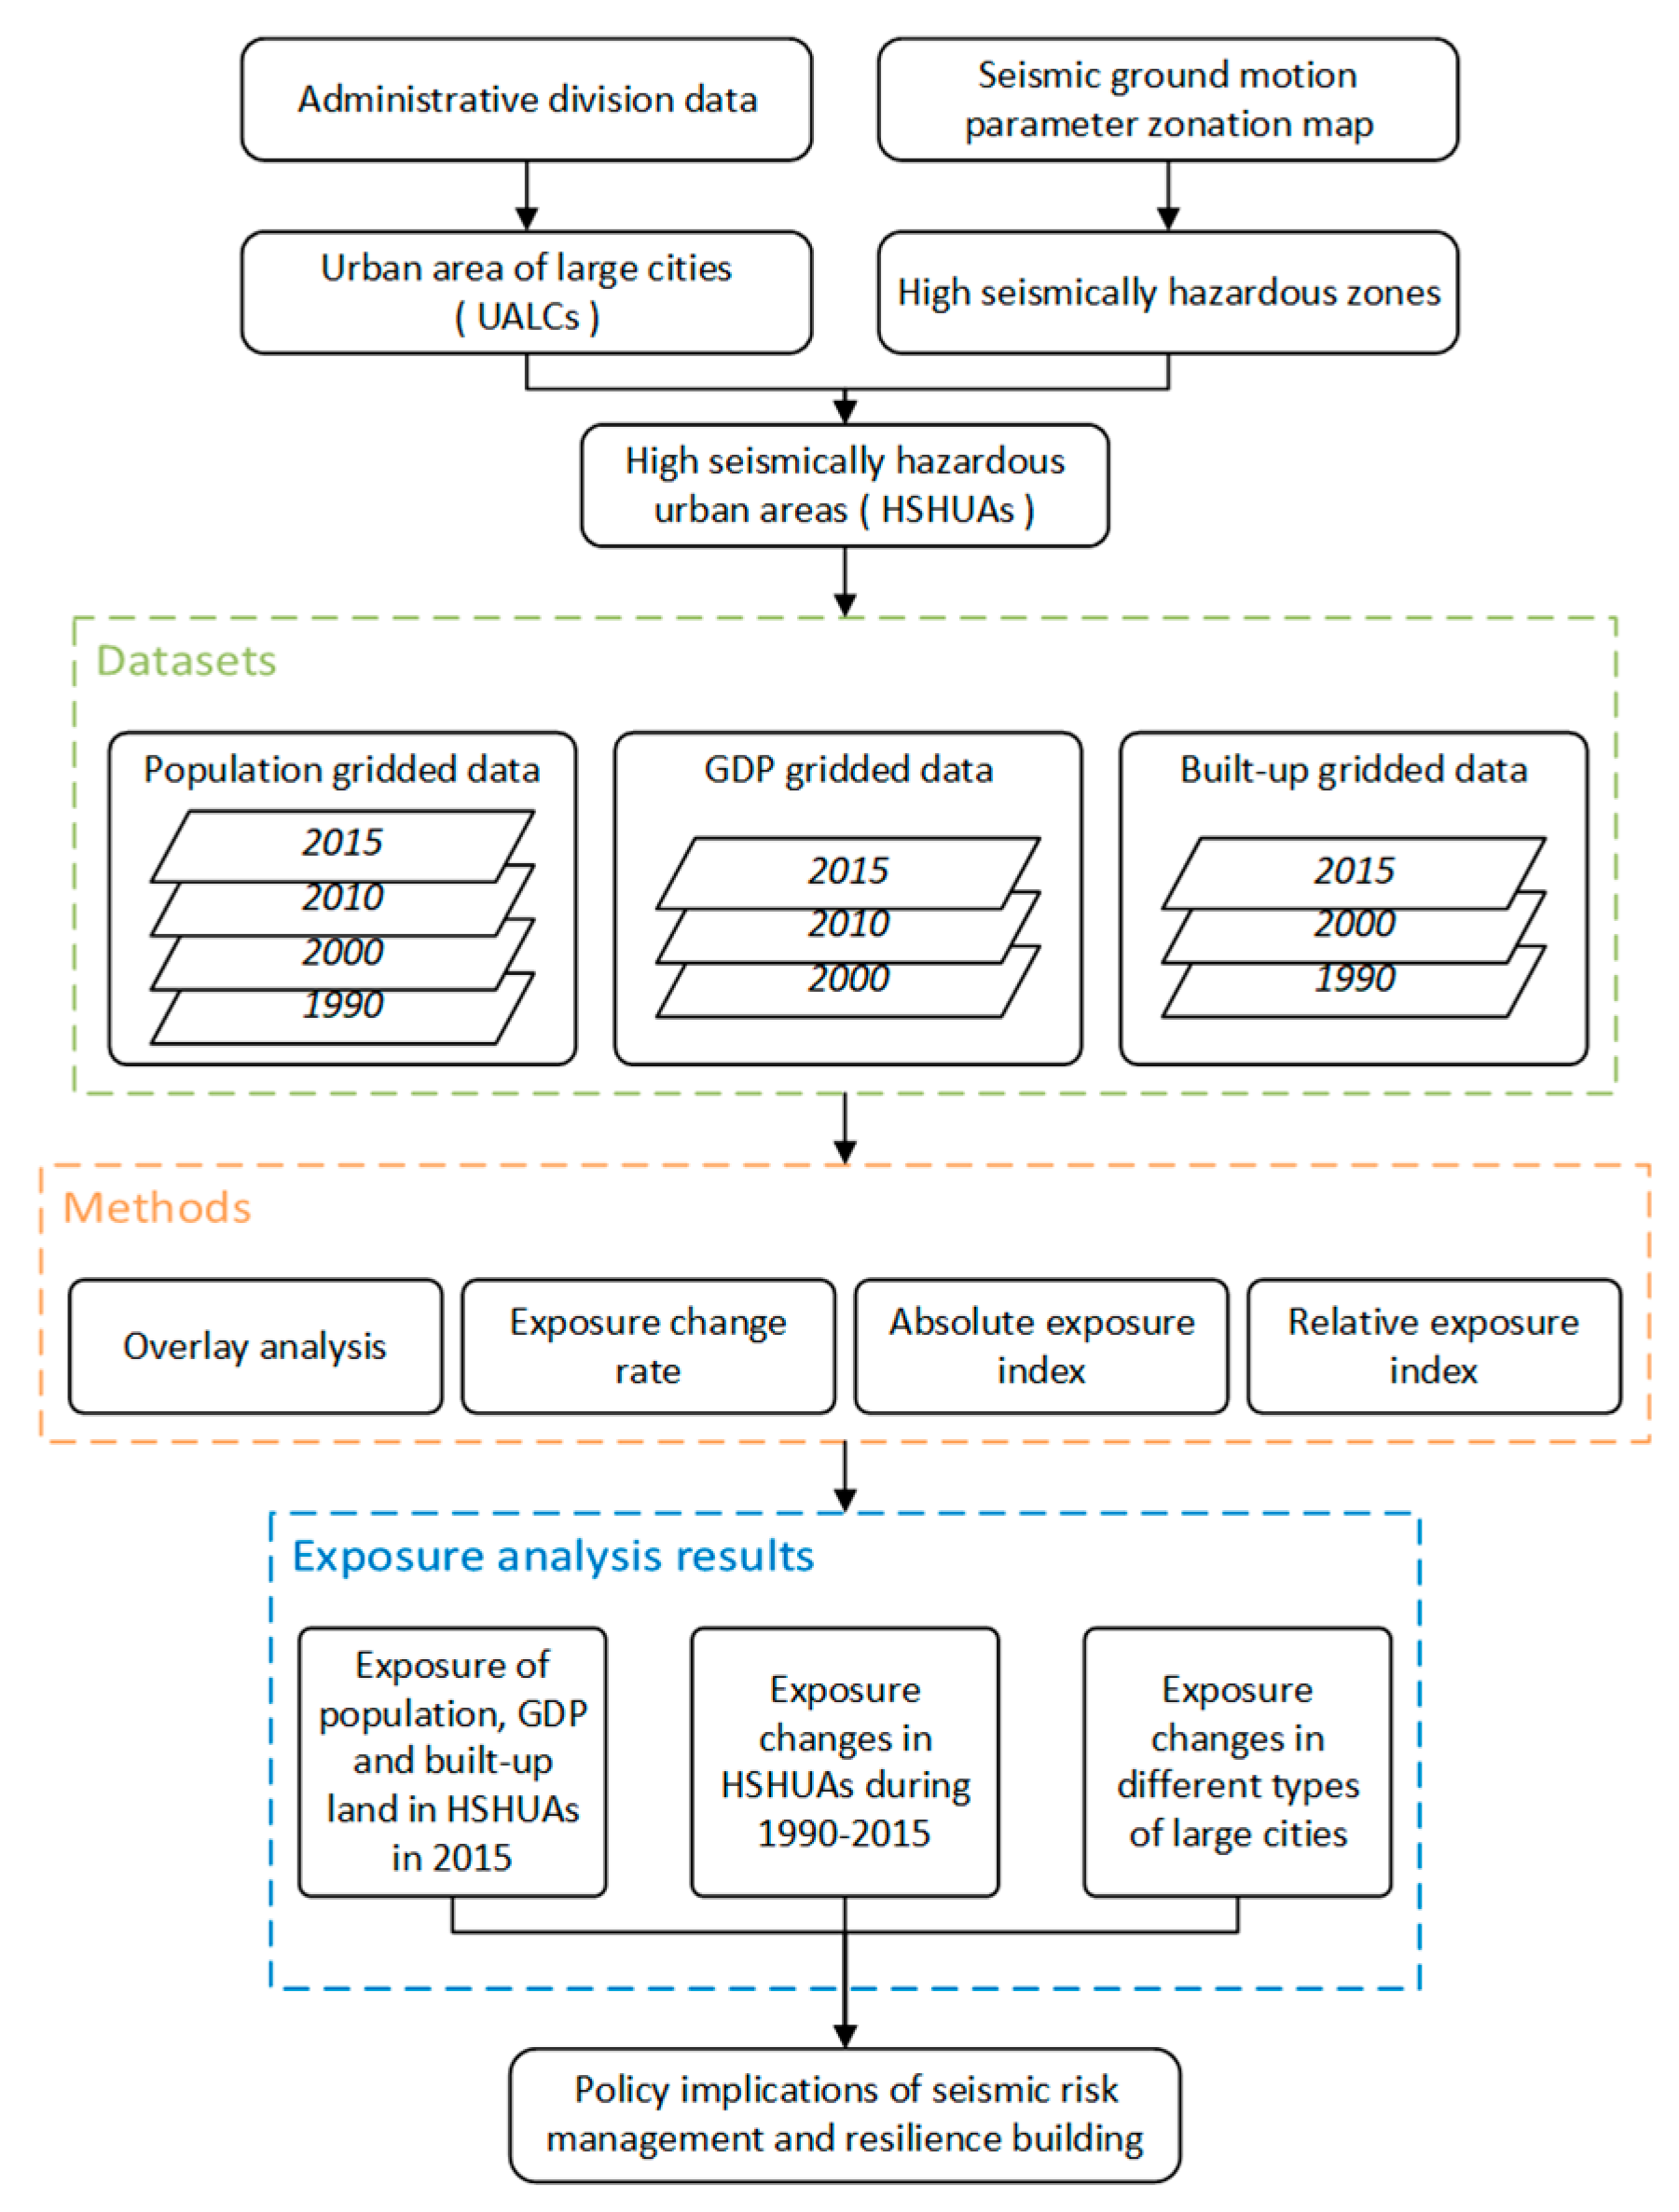
Figure 3.
Population distribution in HSHUAs in 2015.
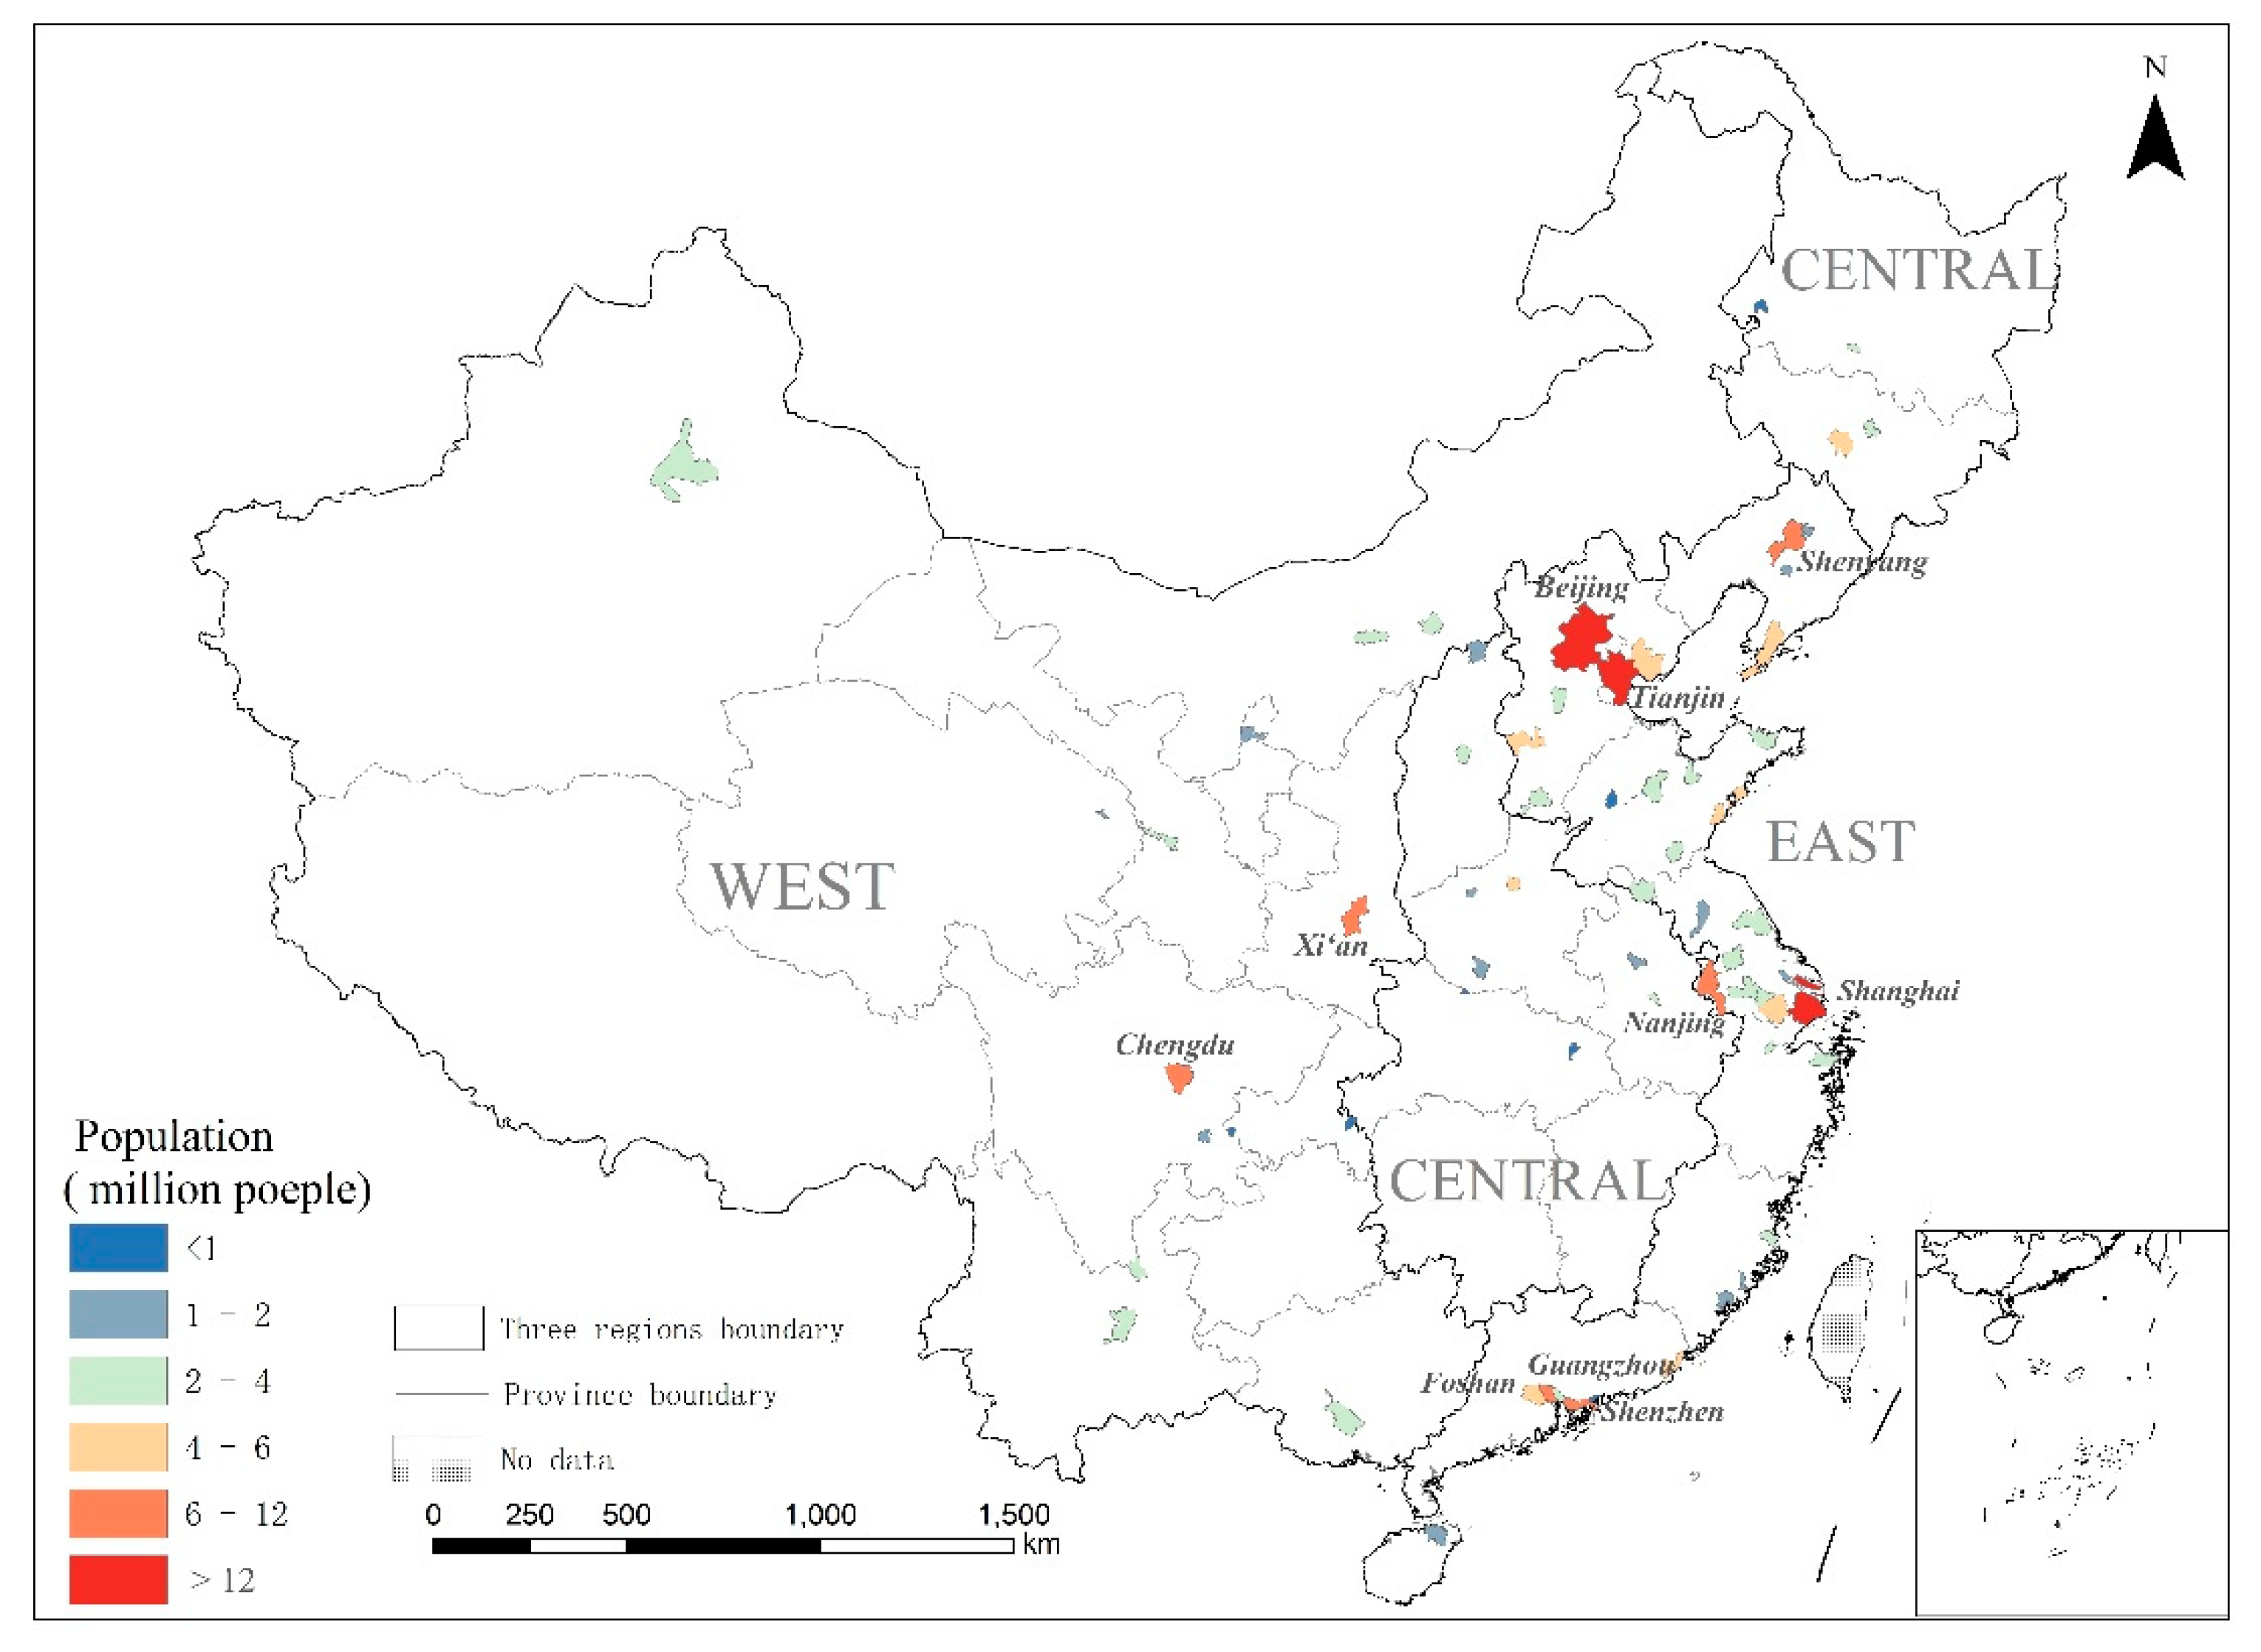
Figure 4.
GDP distribution in the HSHUAs in 2015.
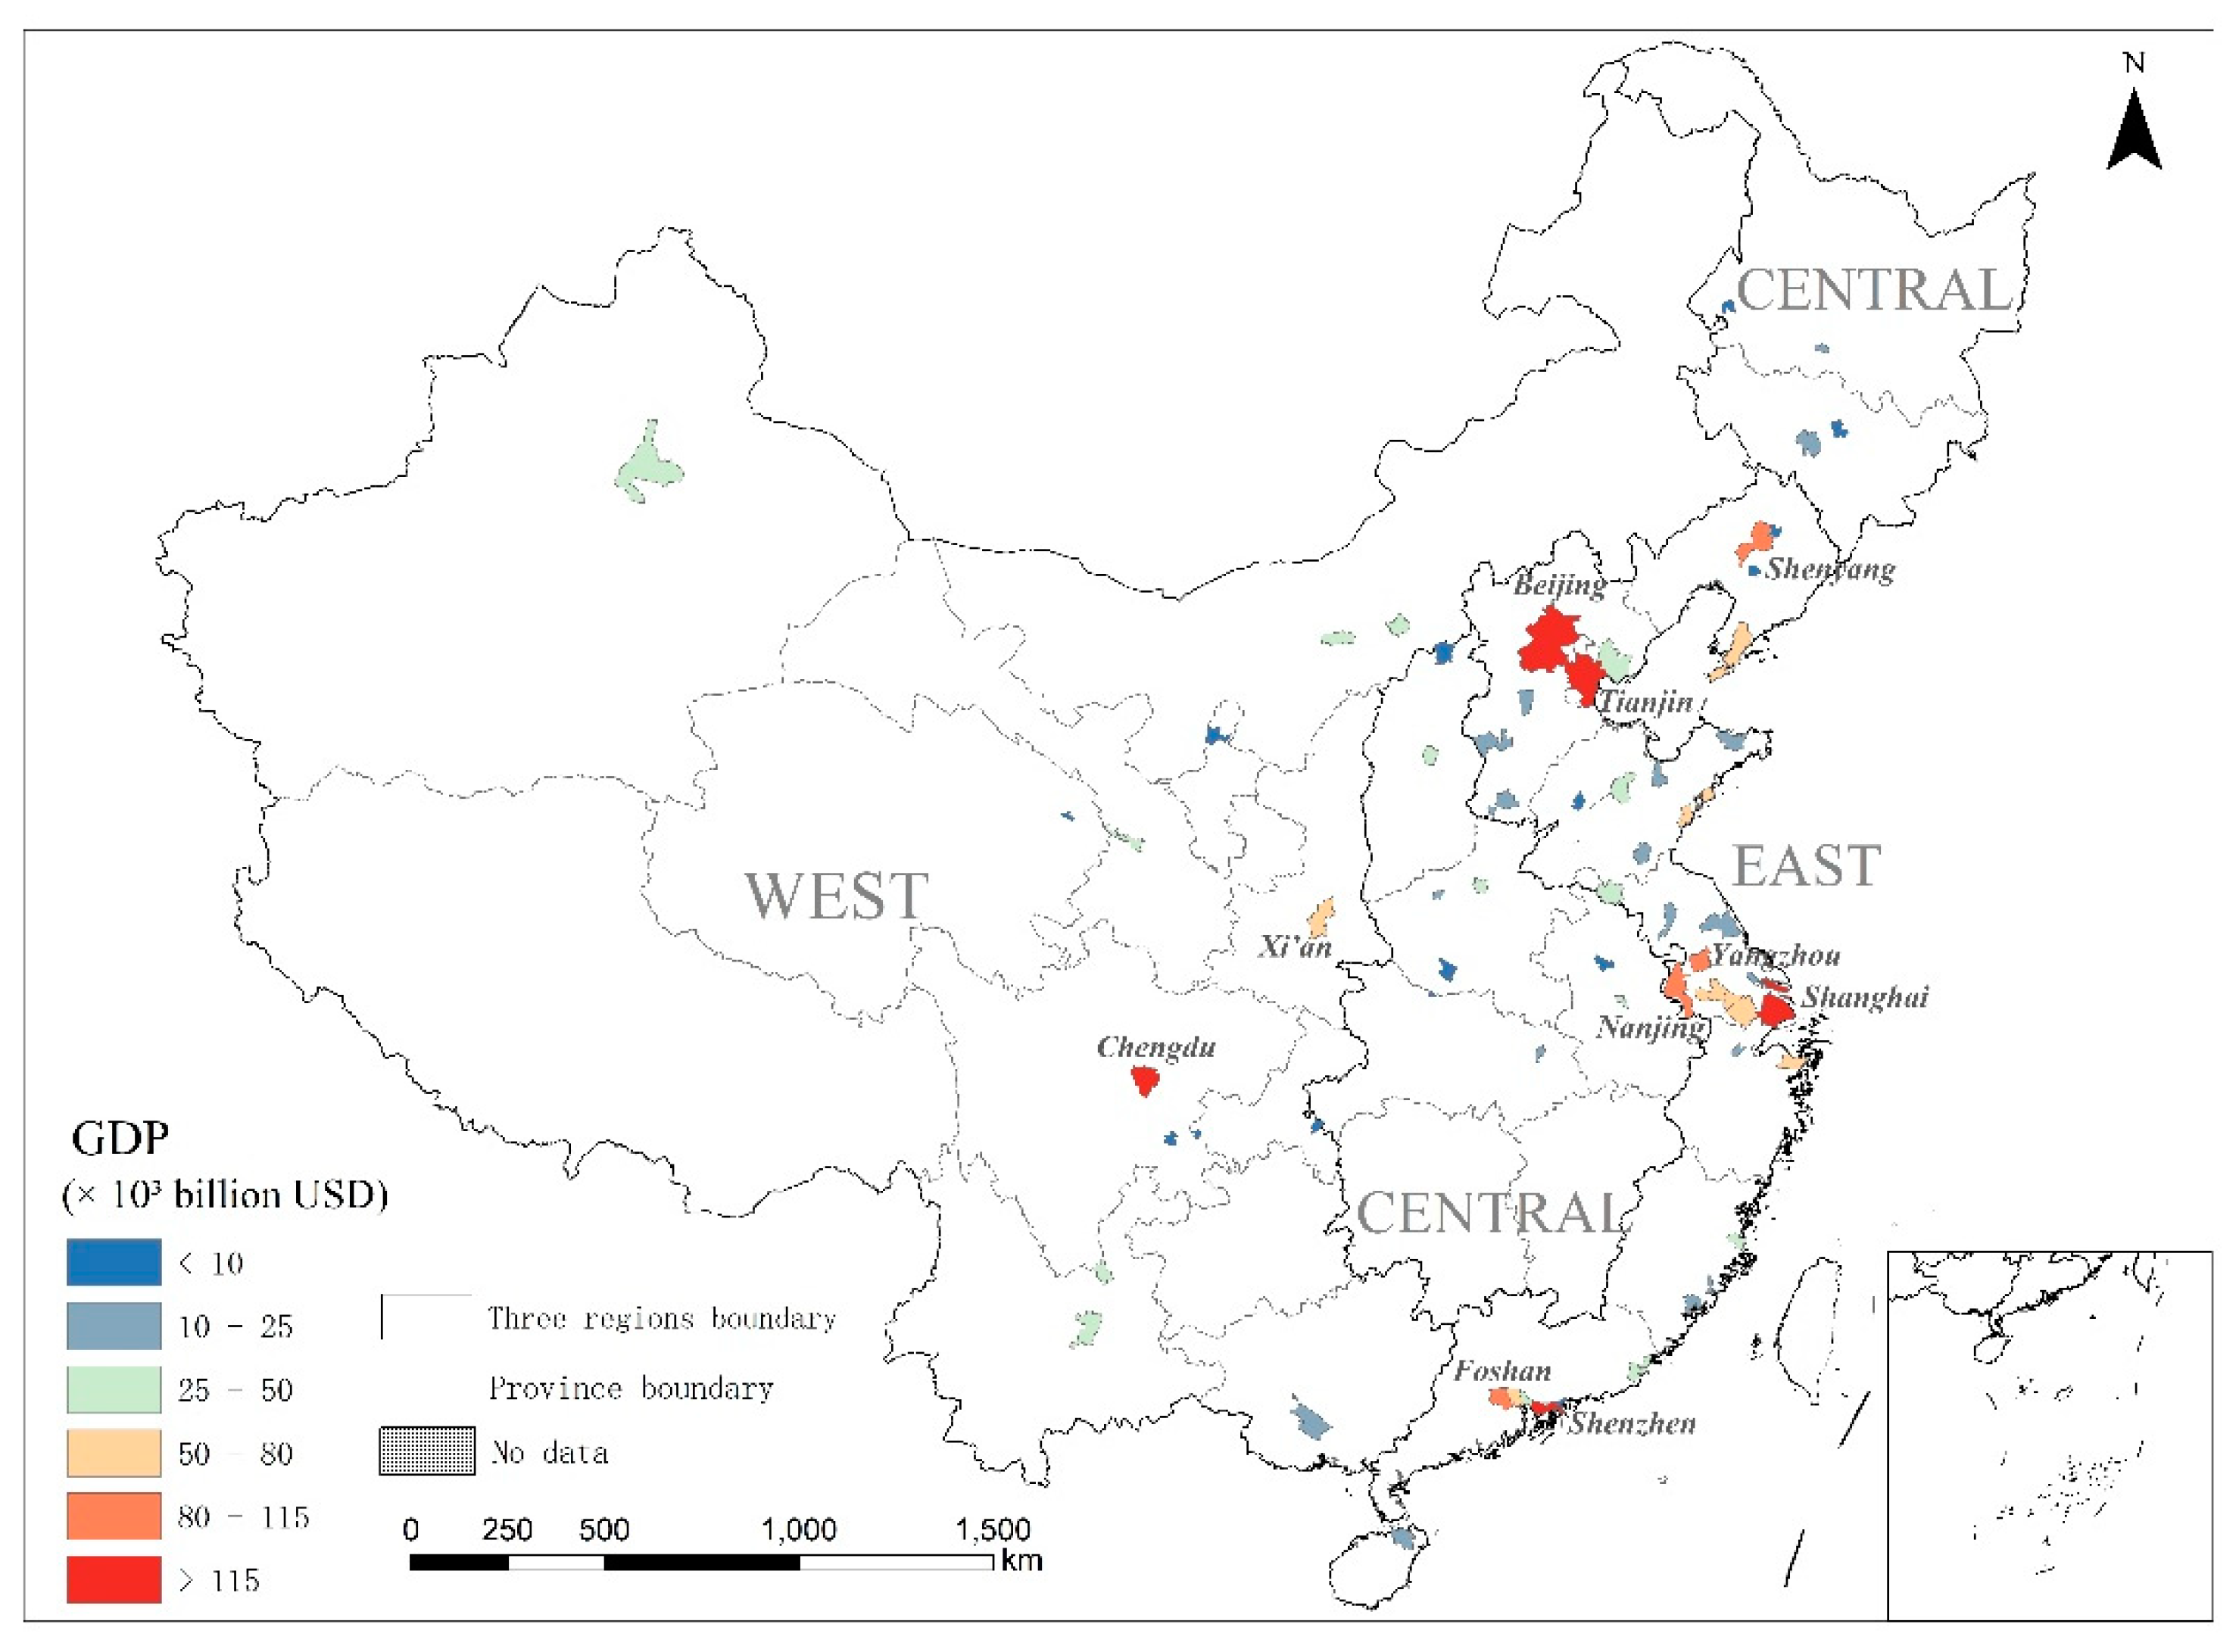
Figure 5.
Built-up land distribution in HSHUAs in 2015.
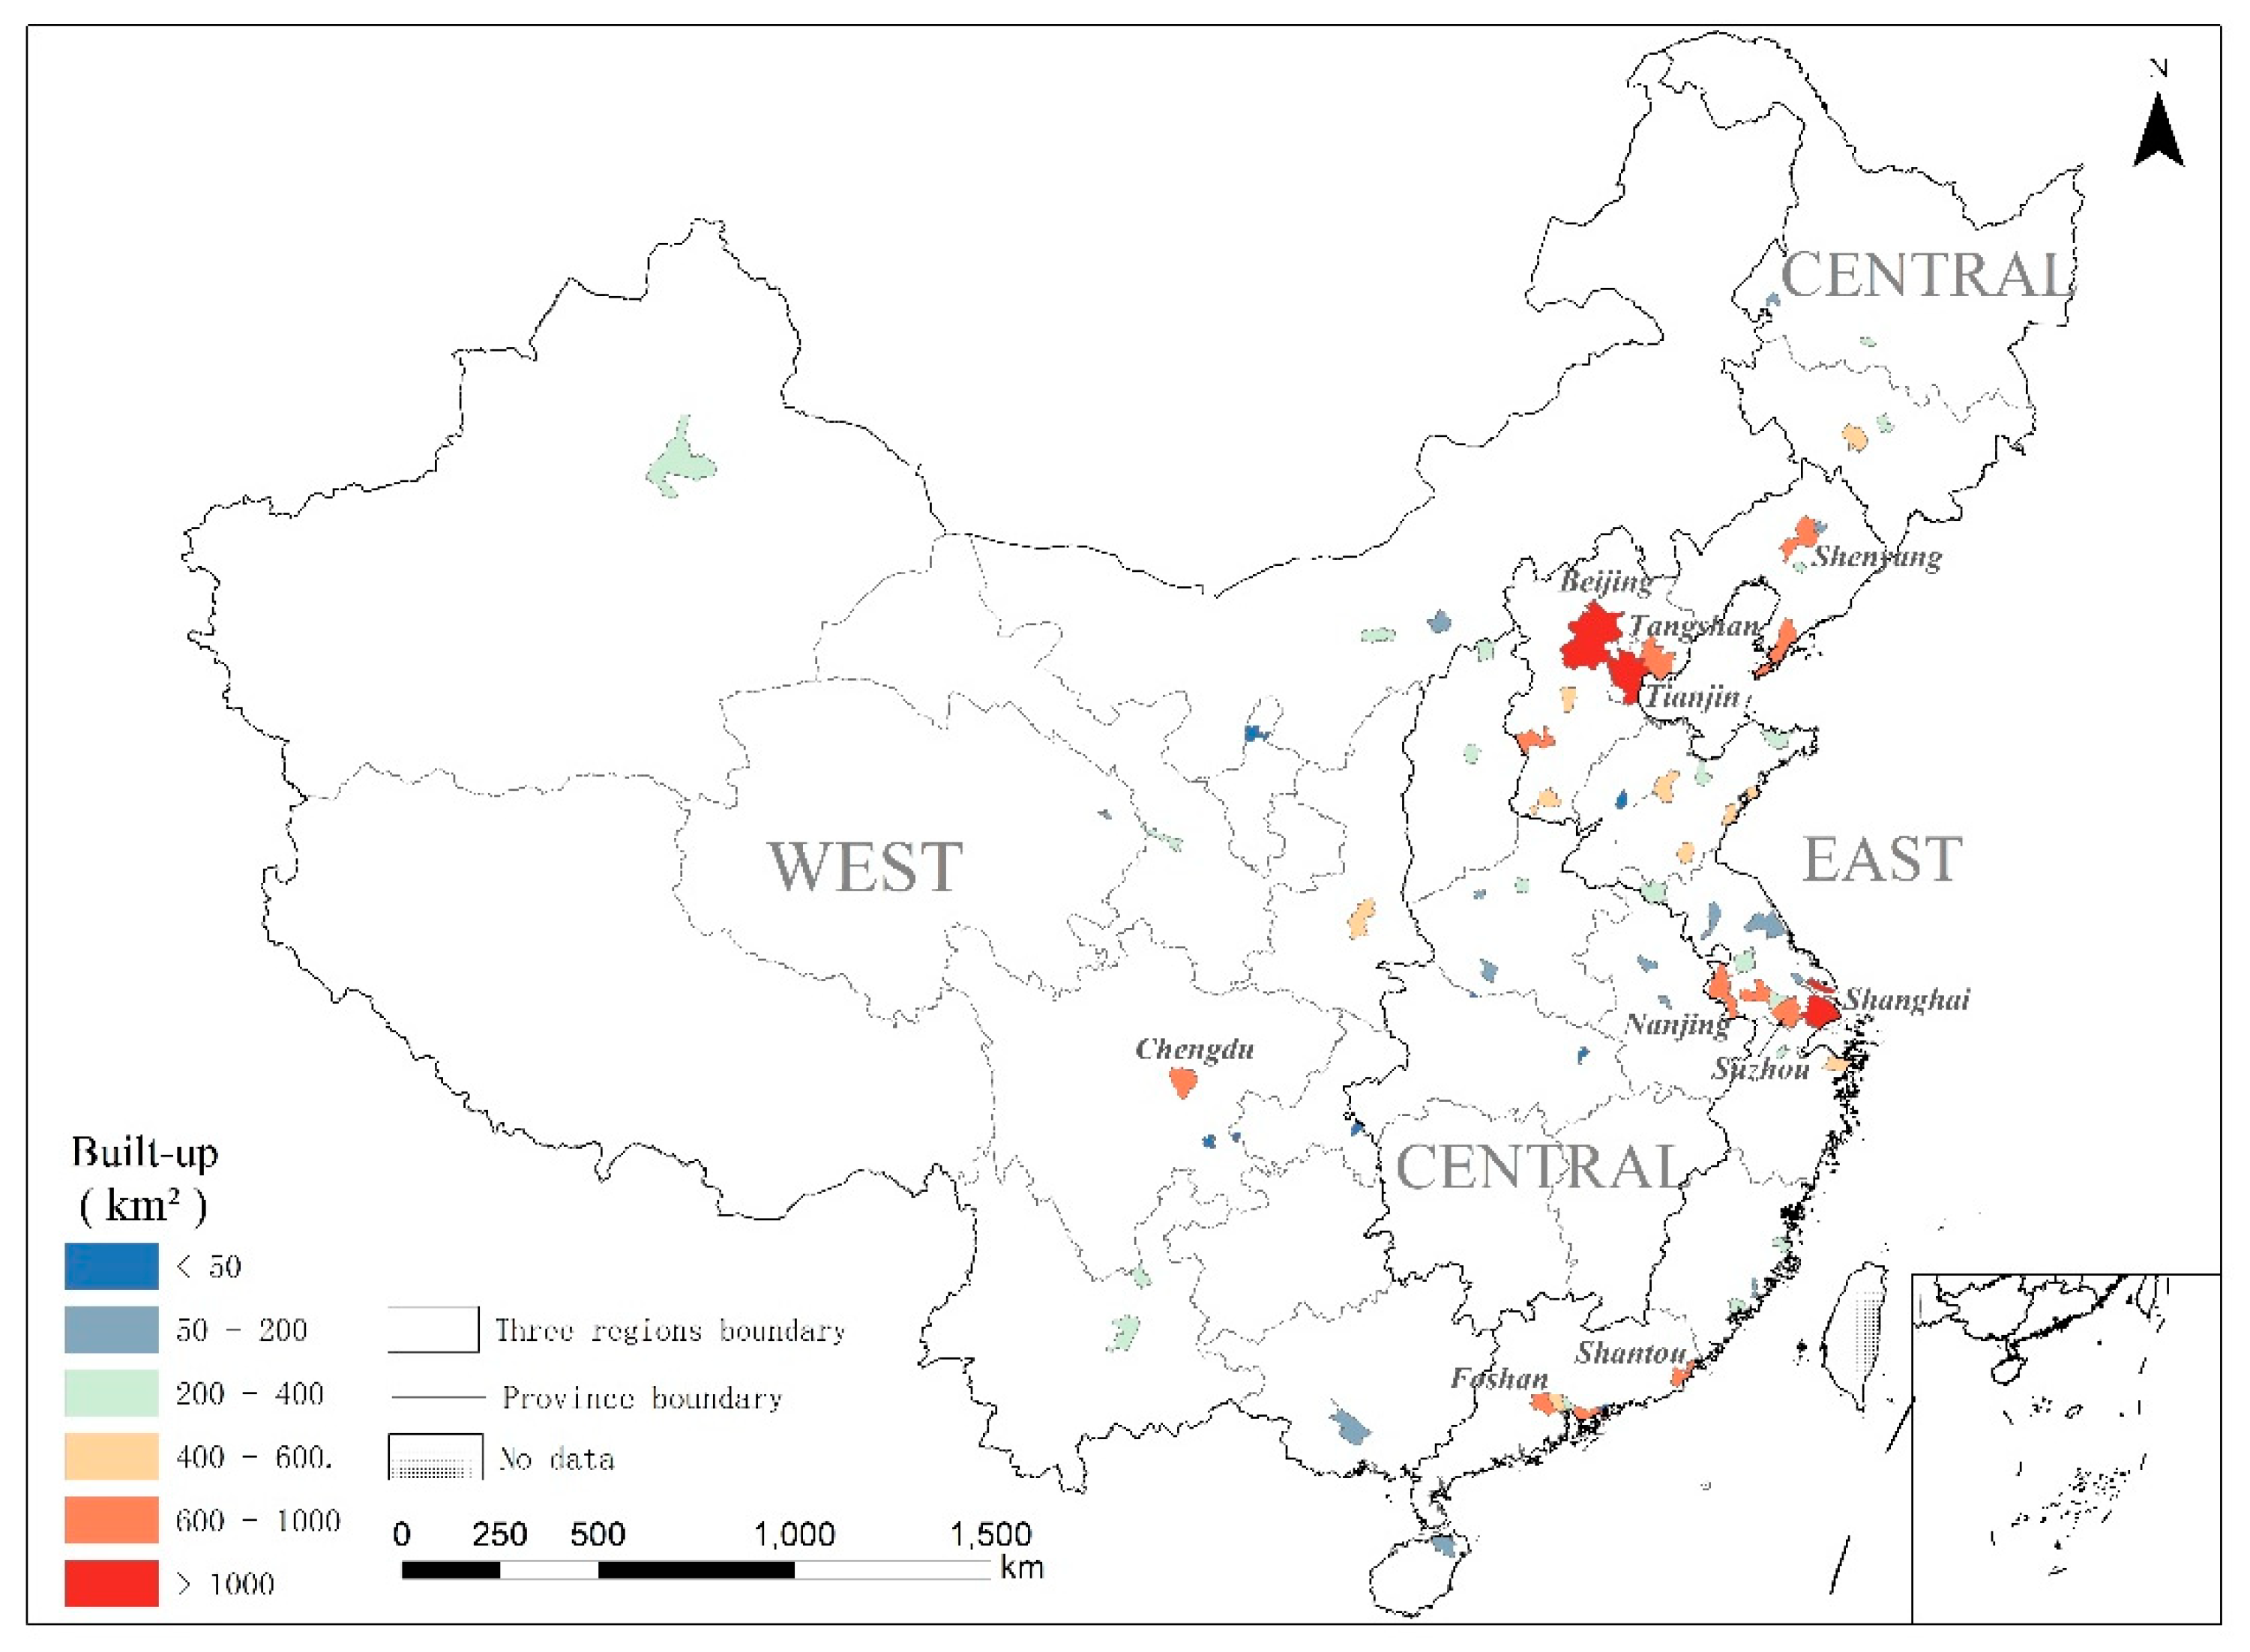
Figure 6.
Growth in population from 1990 to 2015 in HSHUAs.
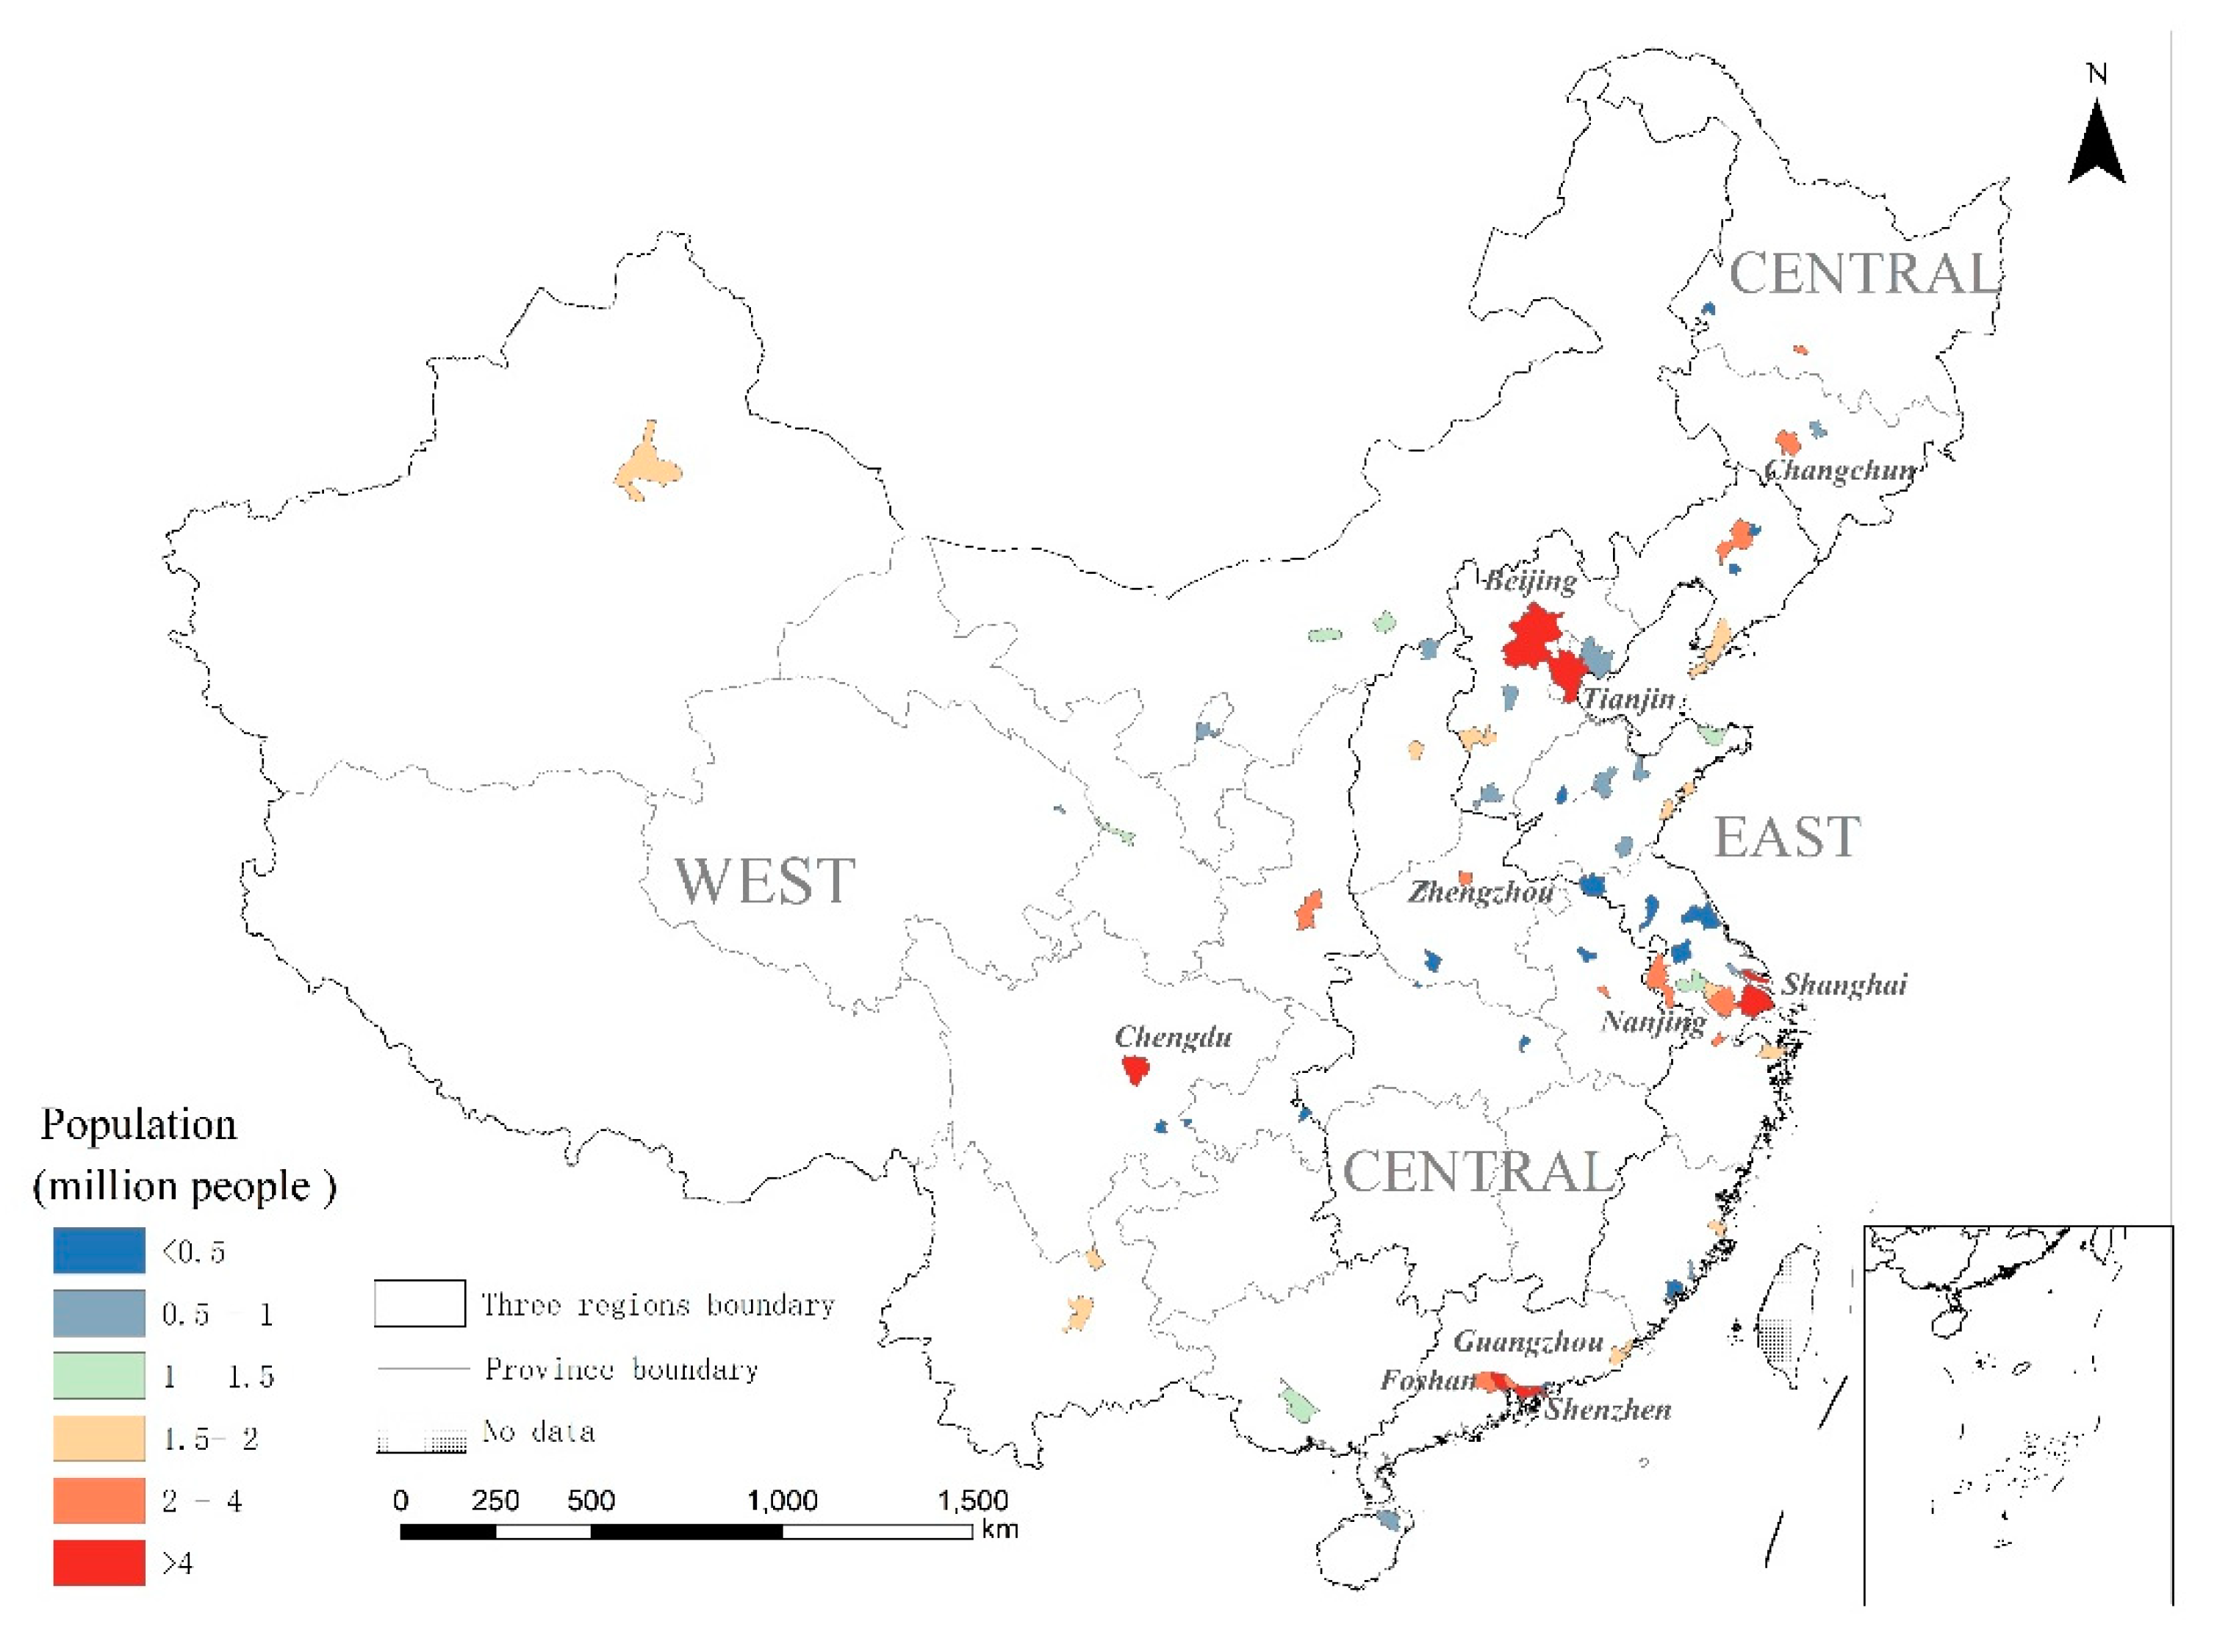
Figure 7.
Growth in GDP from 1990 to 2015 in HSHUAs.
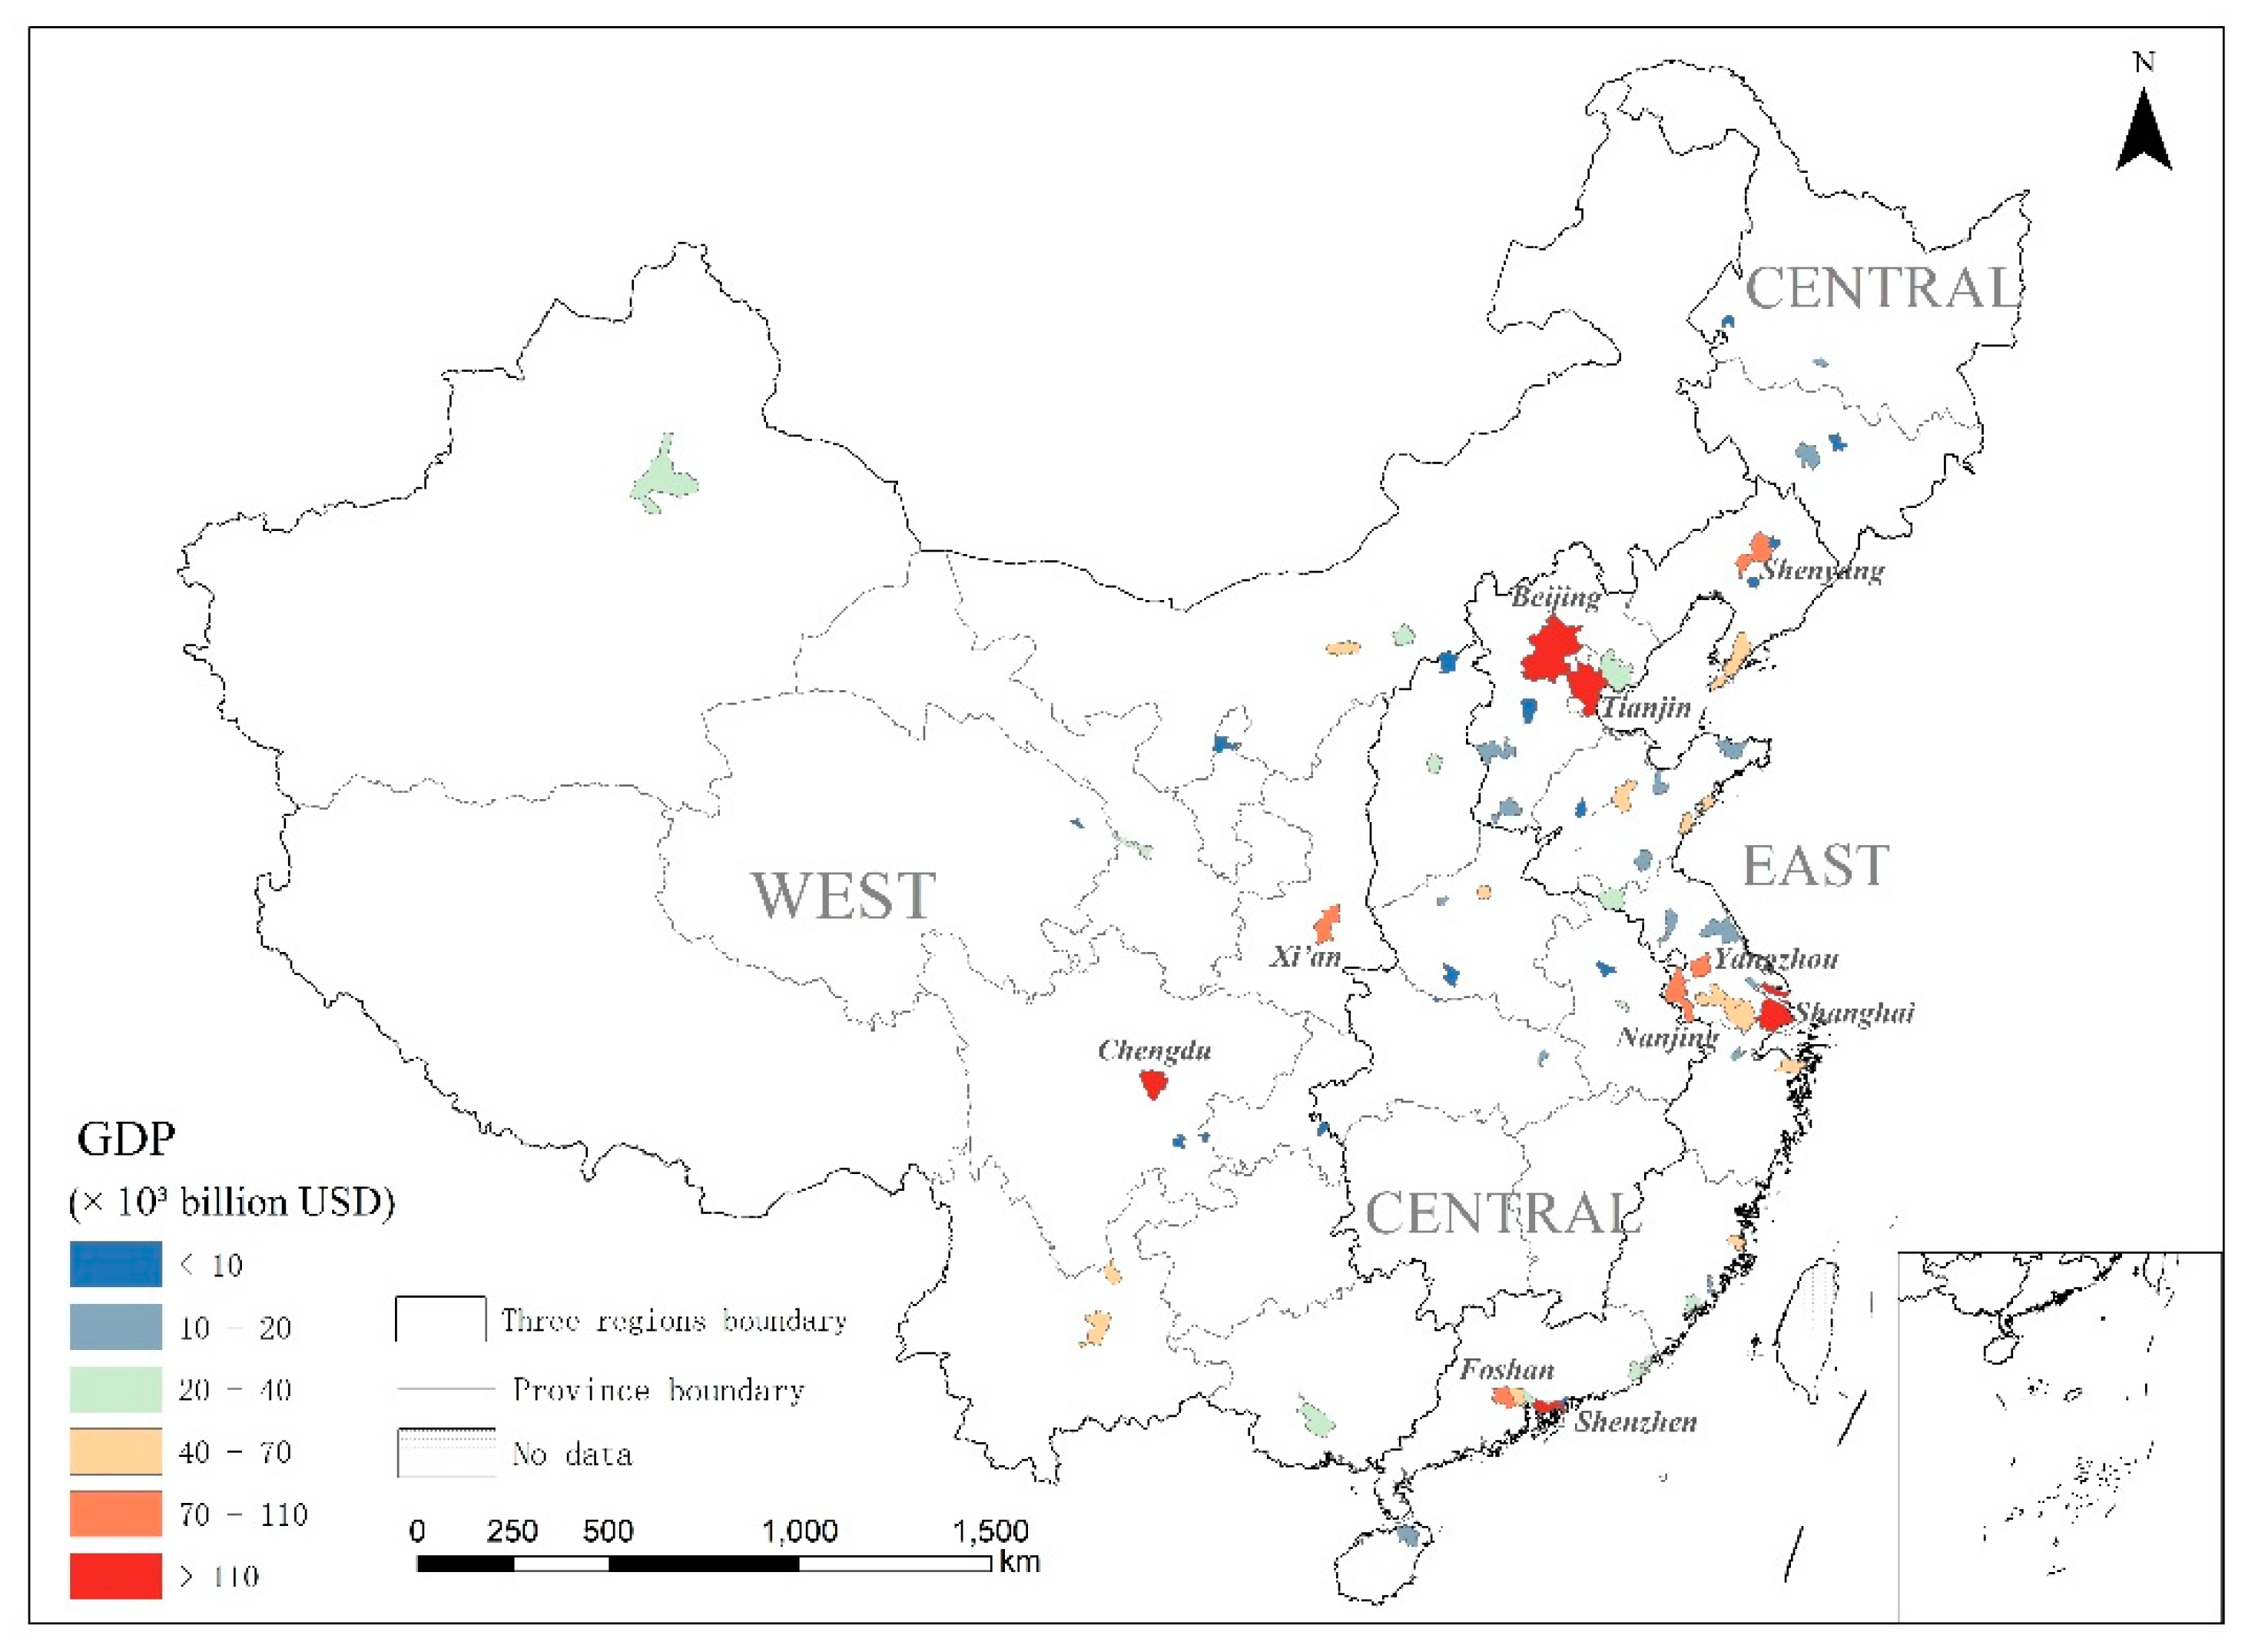
Figure 8.
Growth in built-up land from 1990 to 2015 in HSHUAs.
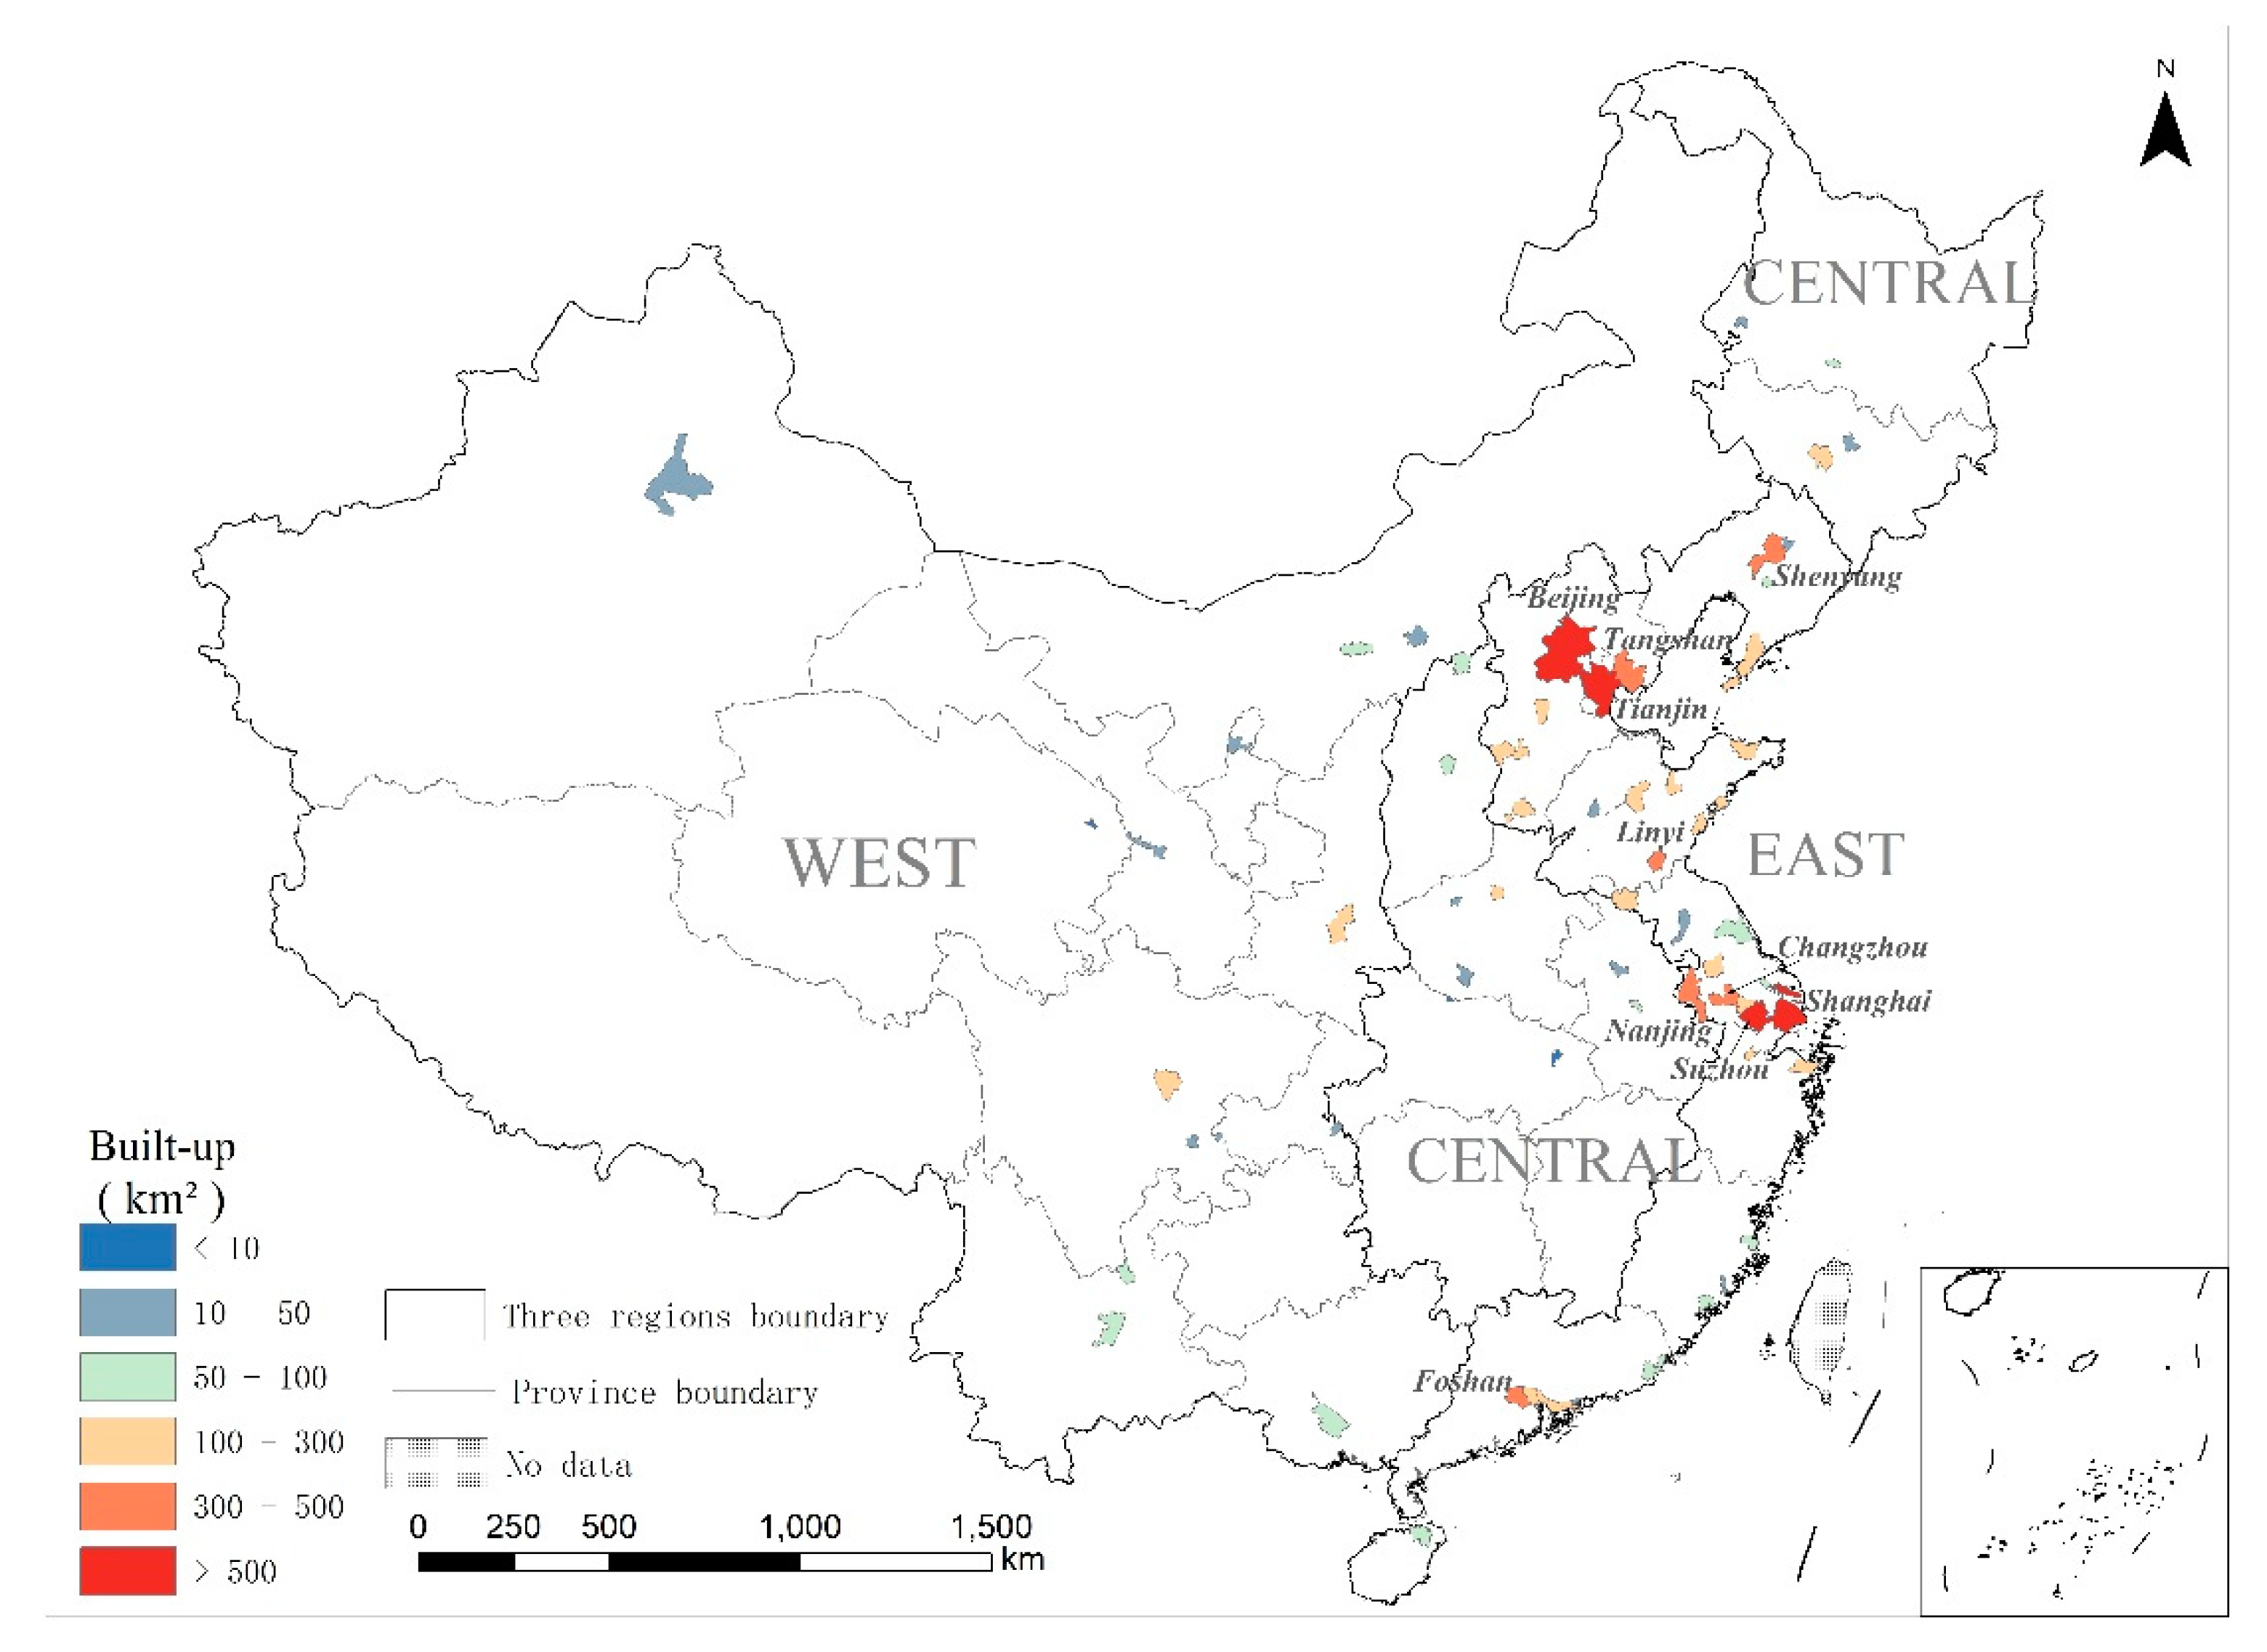
Figure 9.
The proportion of the increased population, GDP, and built-up land of various types of large cities in HSHUAs from 1990 to 2015.
Figure 9.
The proportion of the increased population, GDP, and built-up land of various types of large cities in HSHUAs from 1990 to 2015.
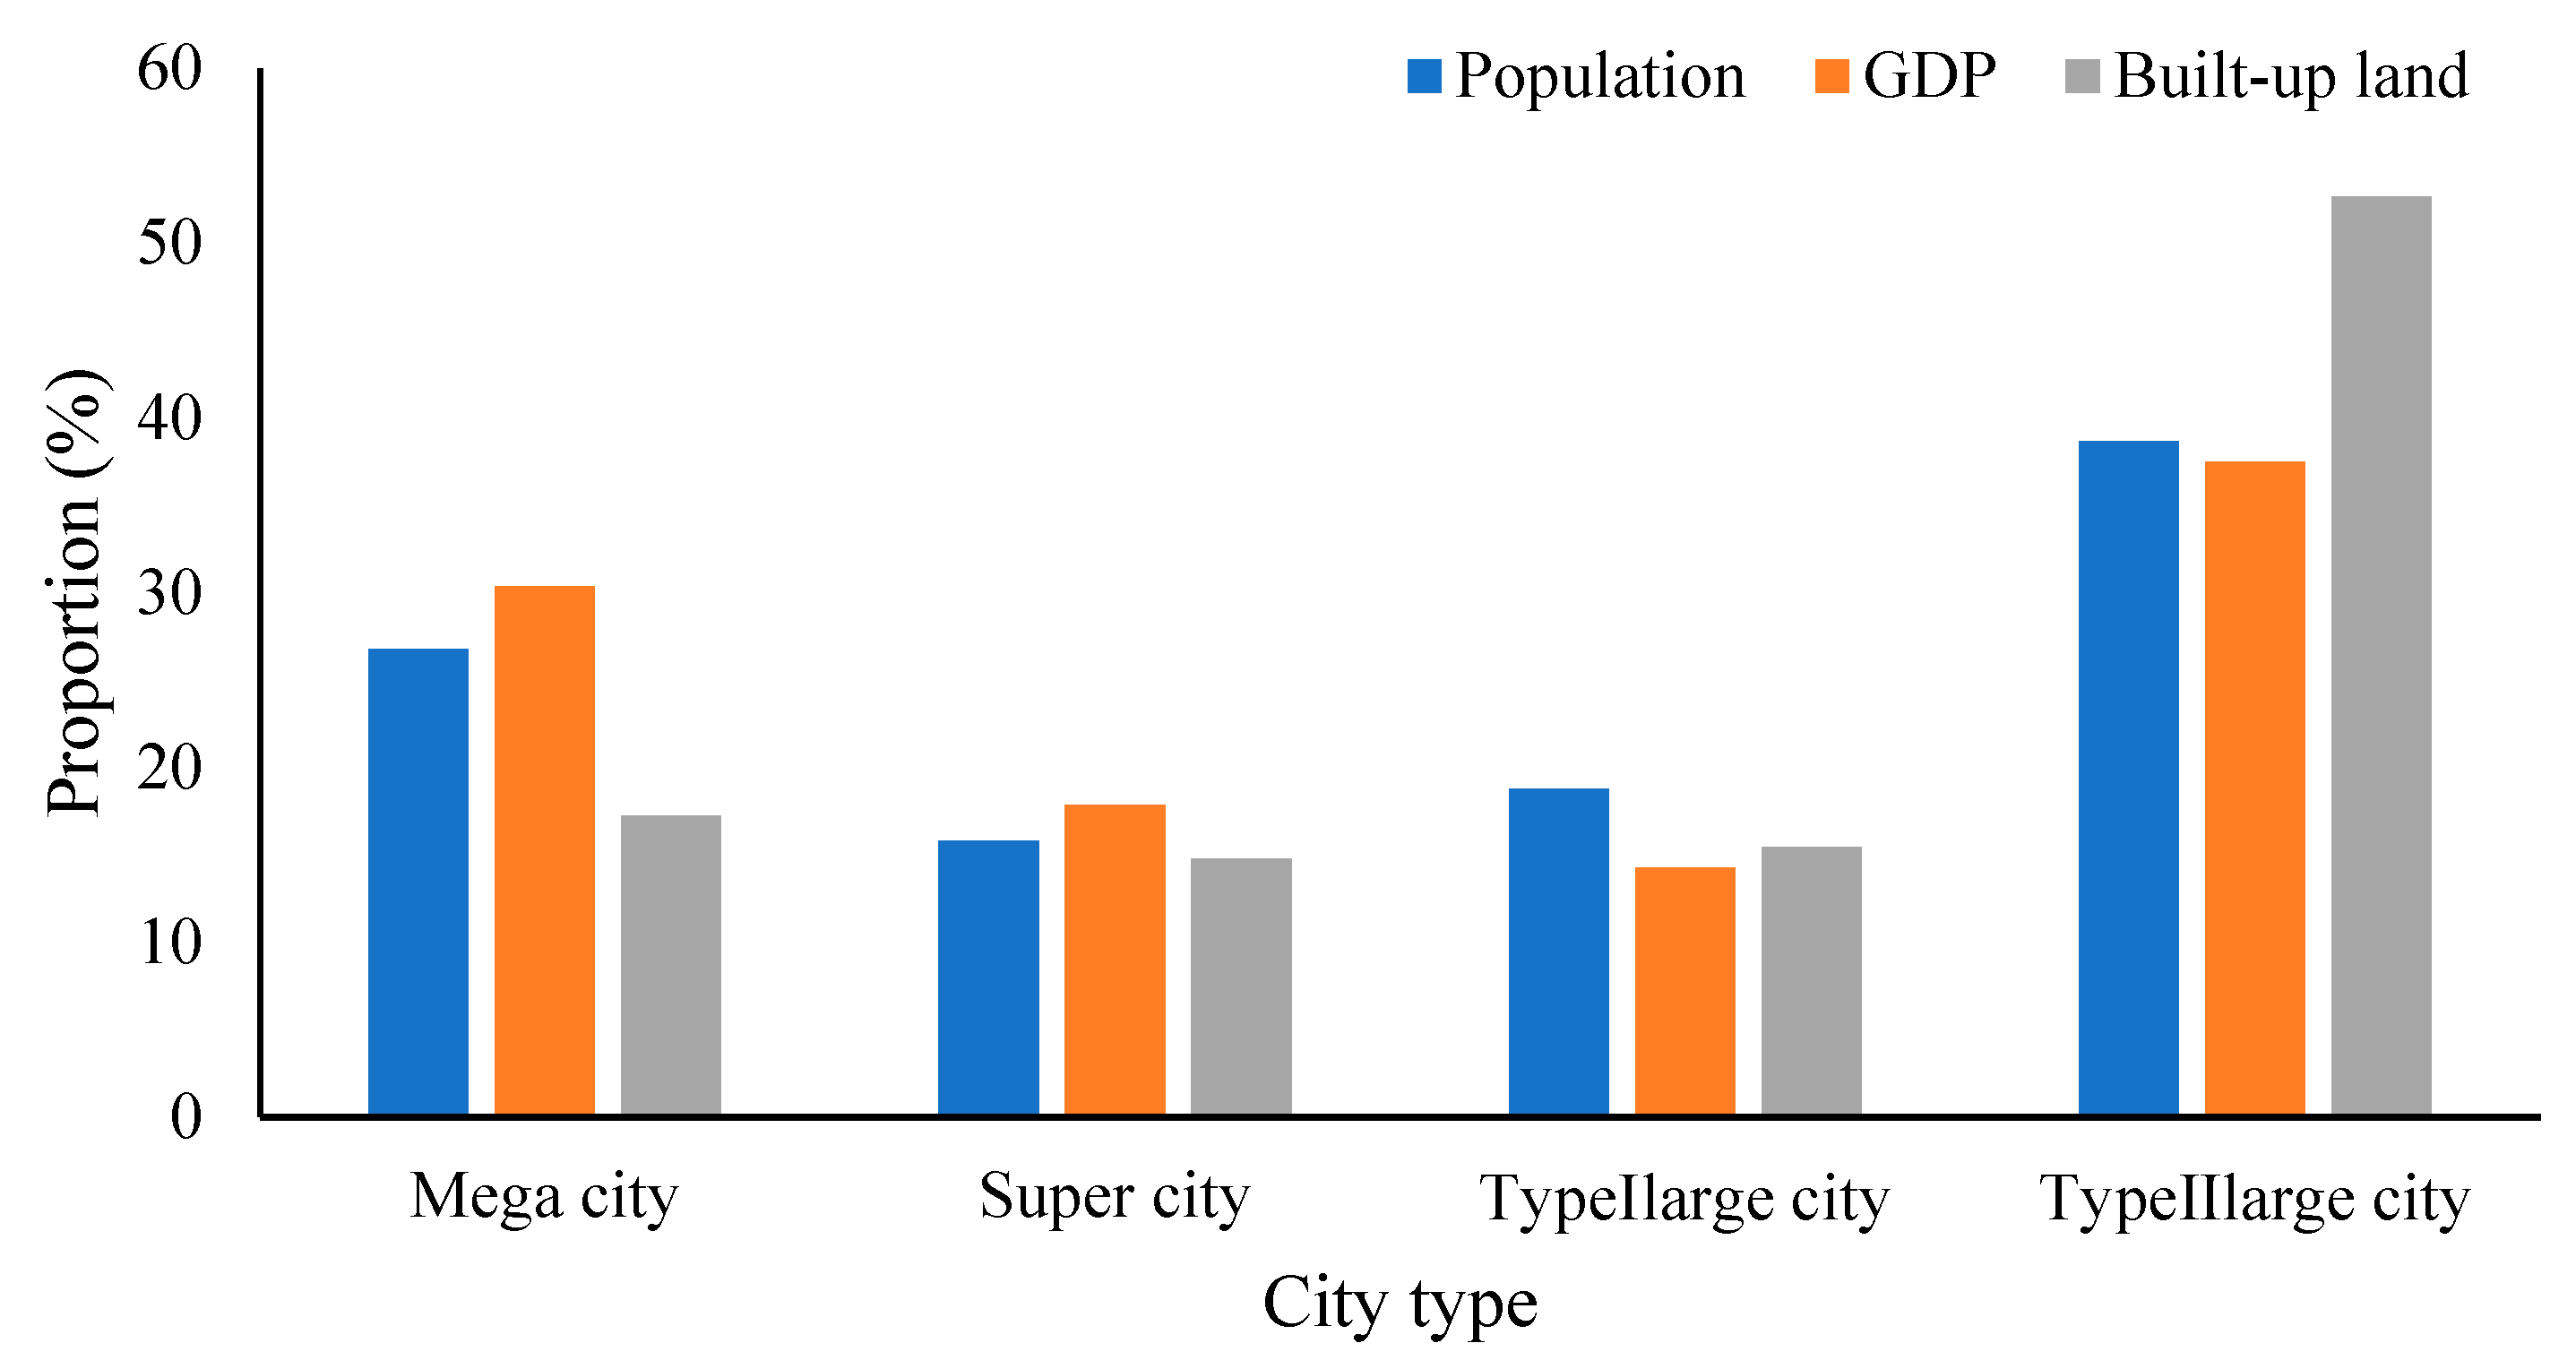
Figure 10.
Distribution of absolute exposure index change in the HSHUAs from 1990 to 2015.
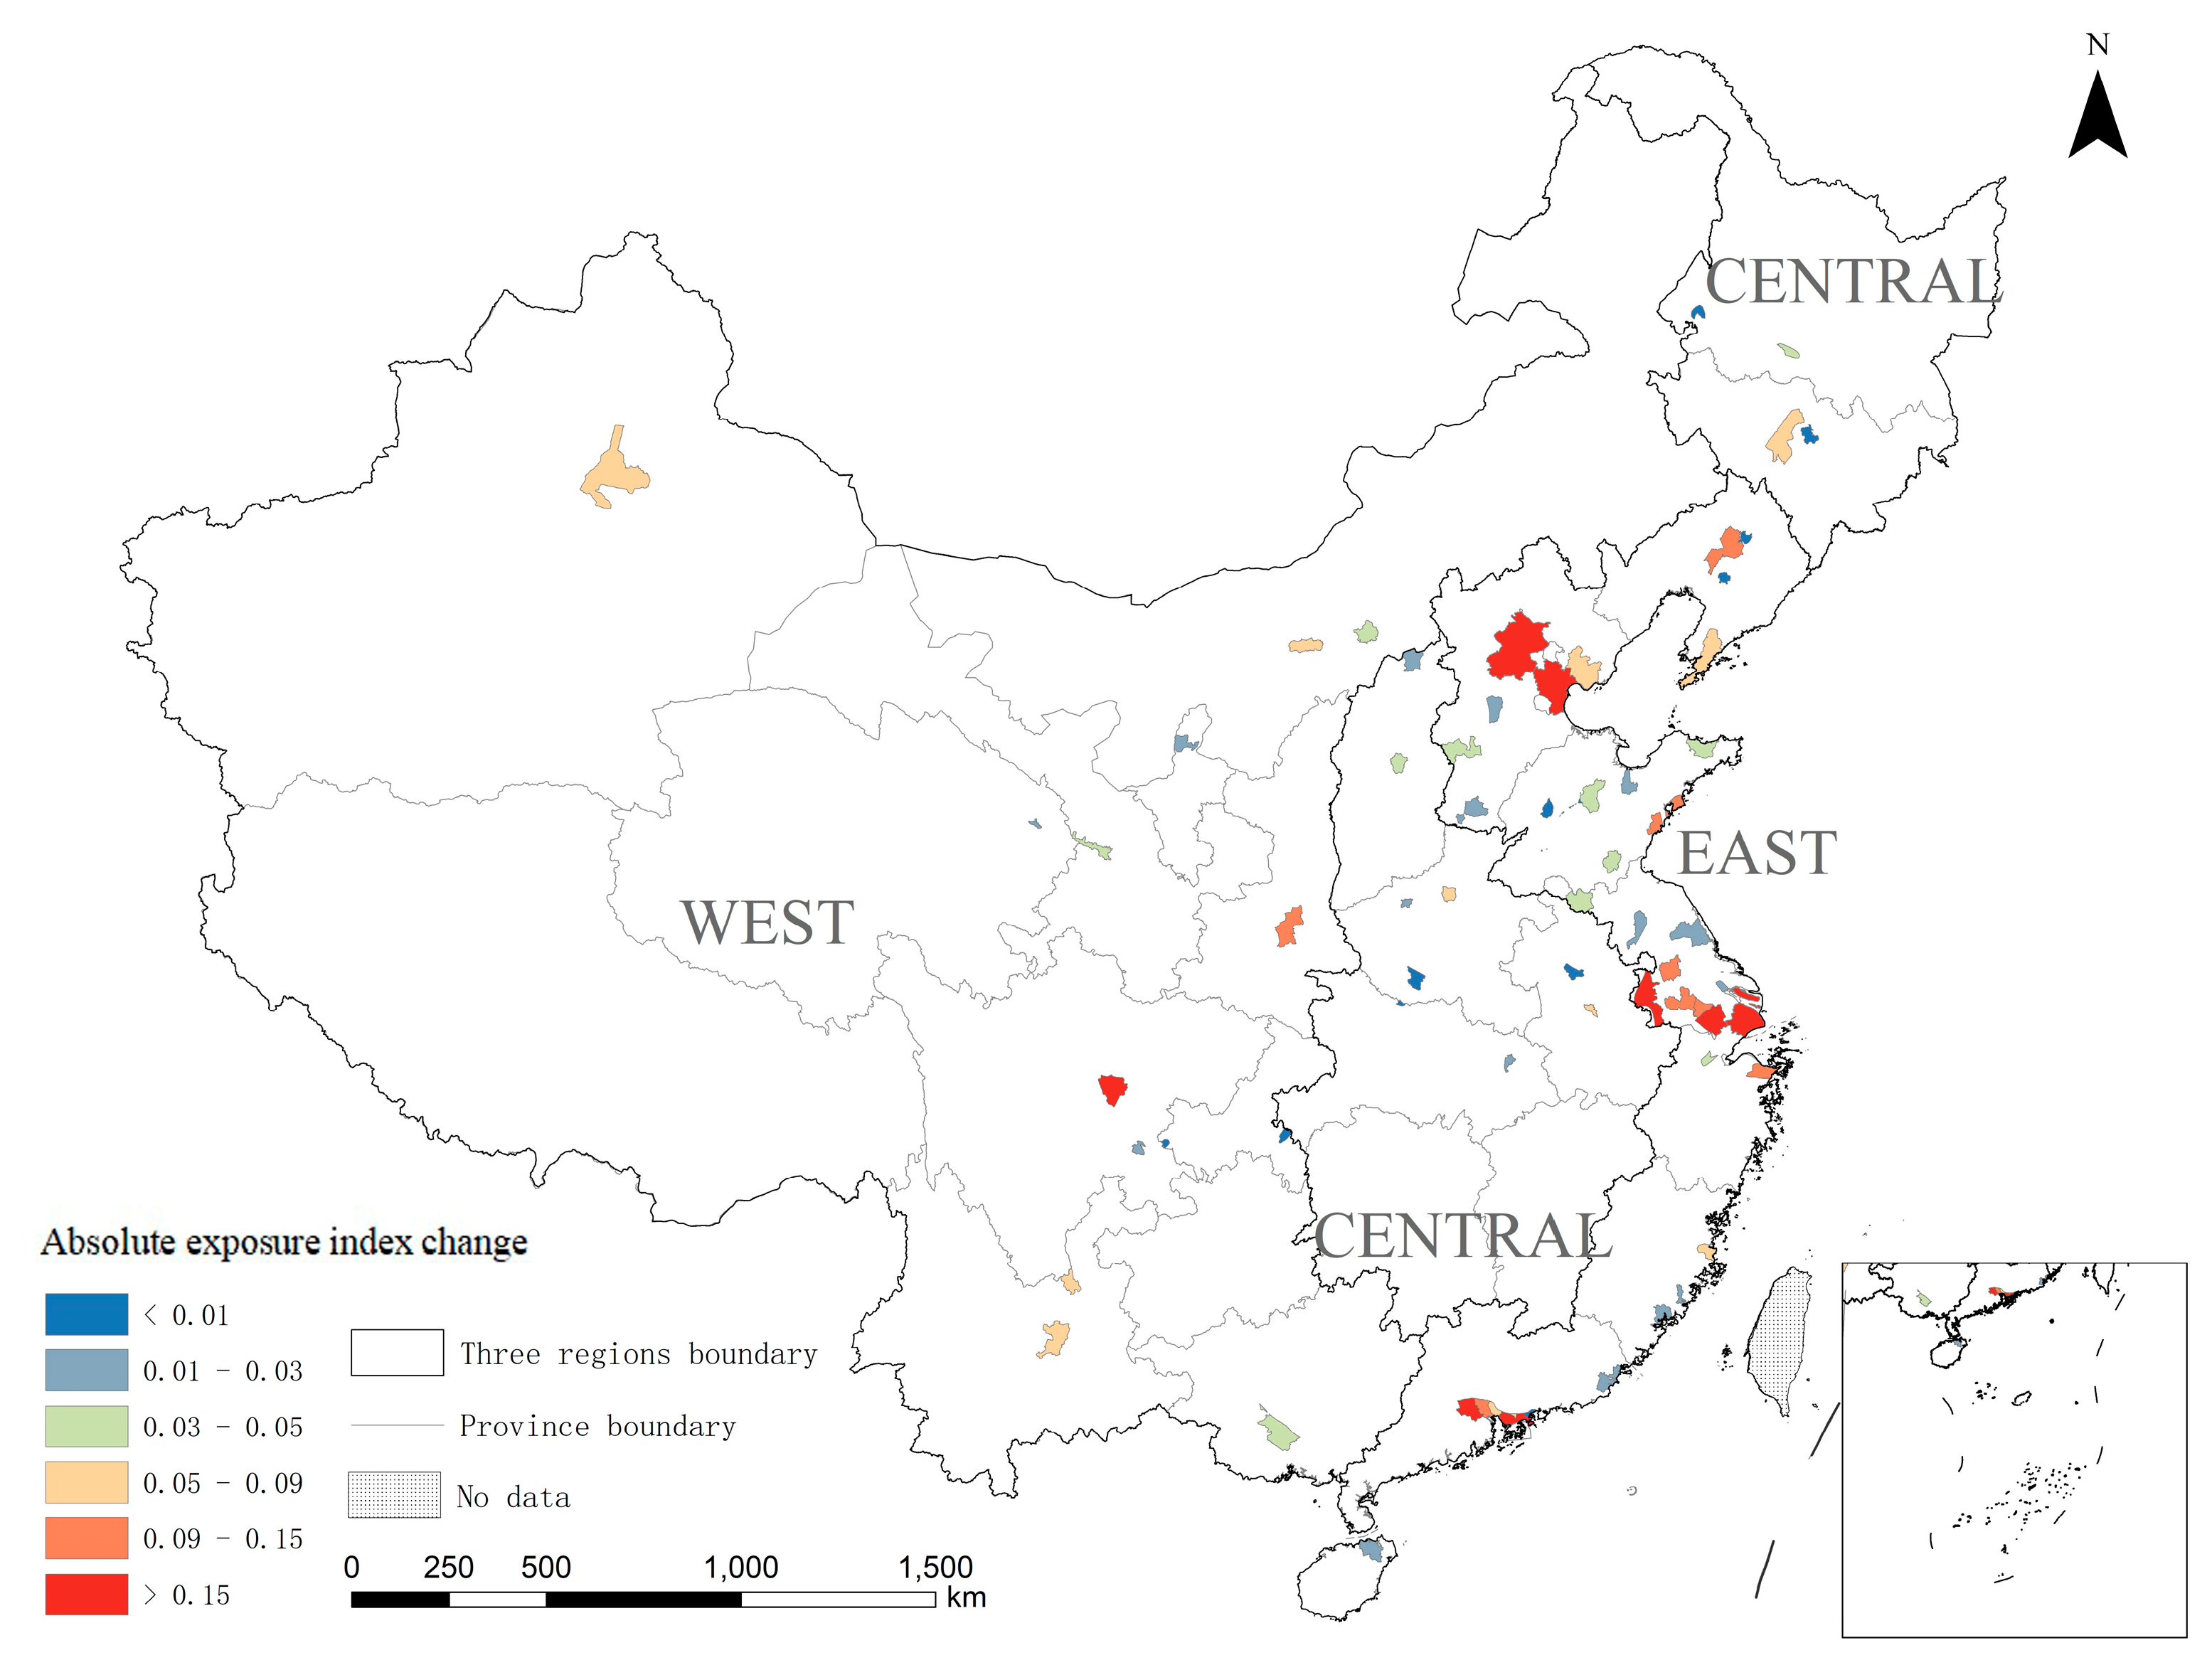
Figure 11.
Distribution of relative exposure index change in the HSHUAs from 1990 to 2015.
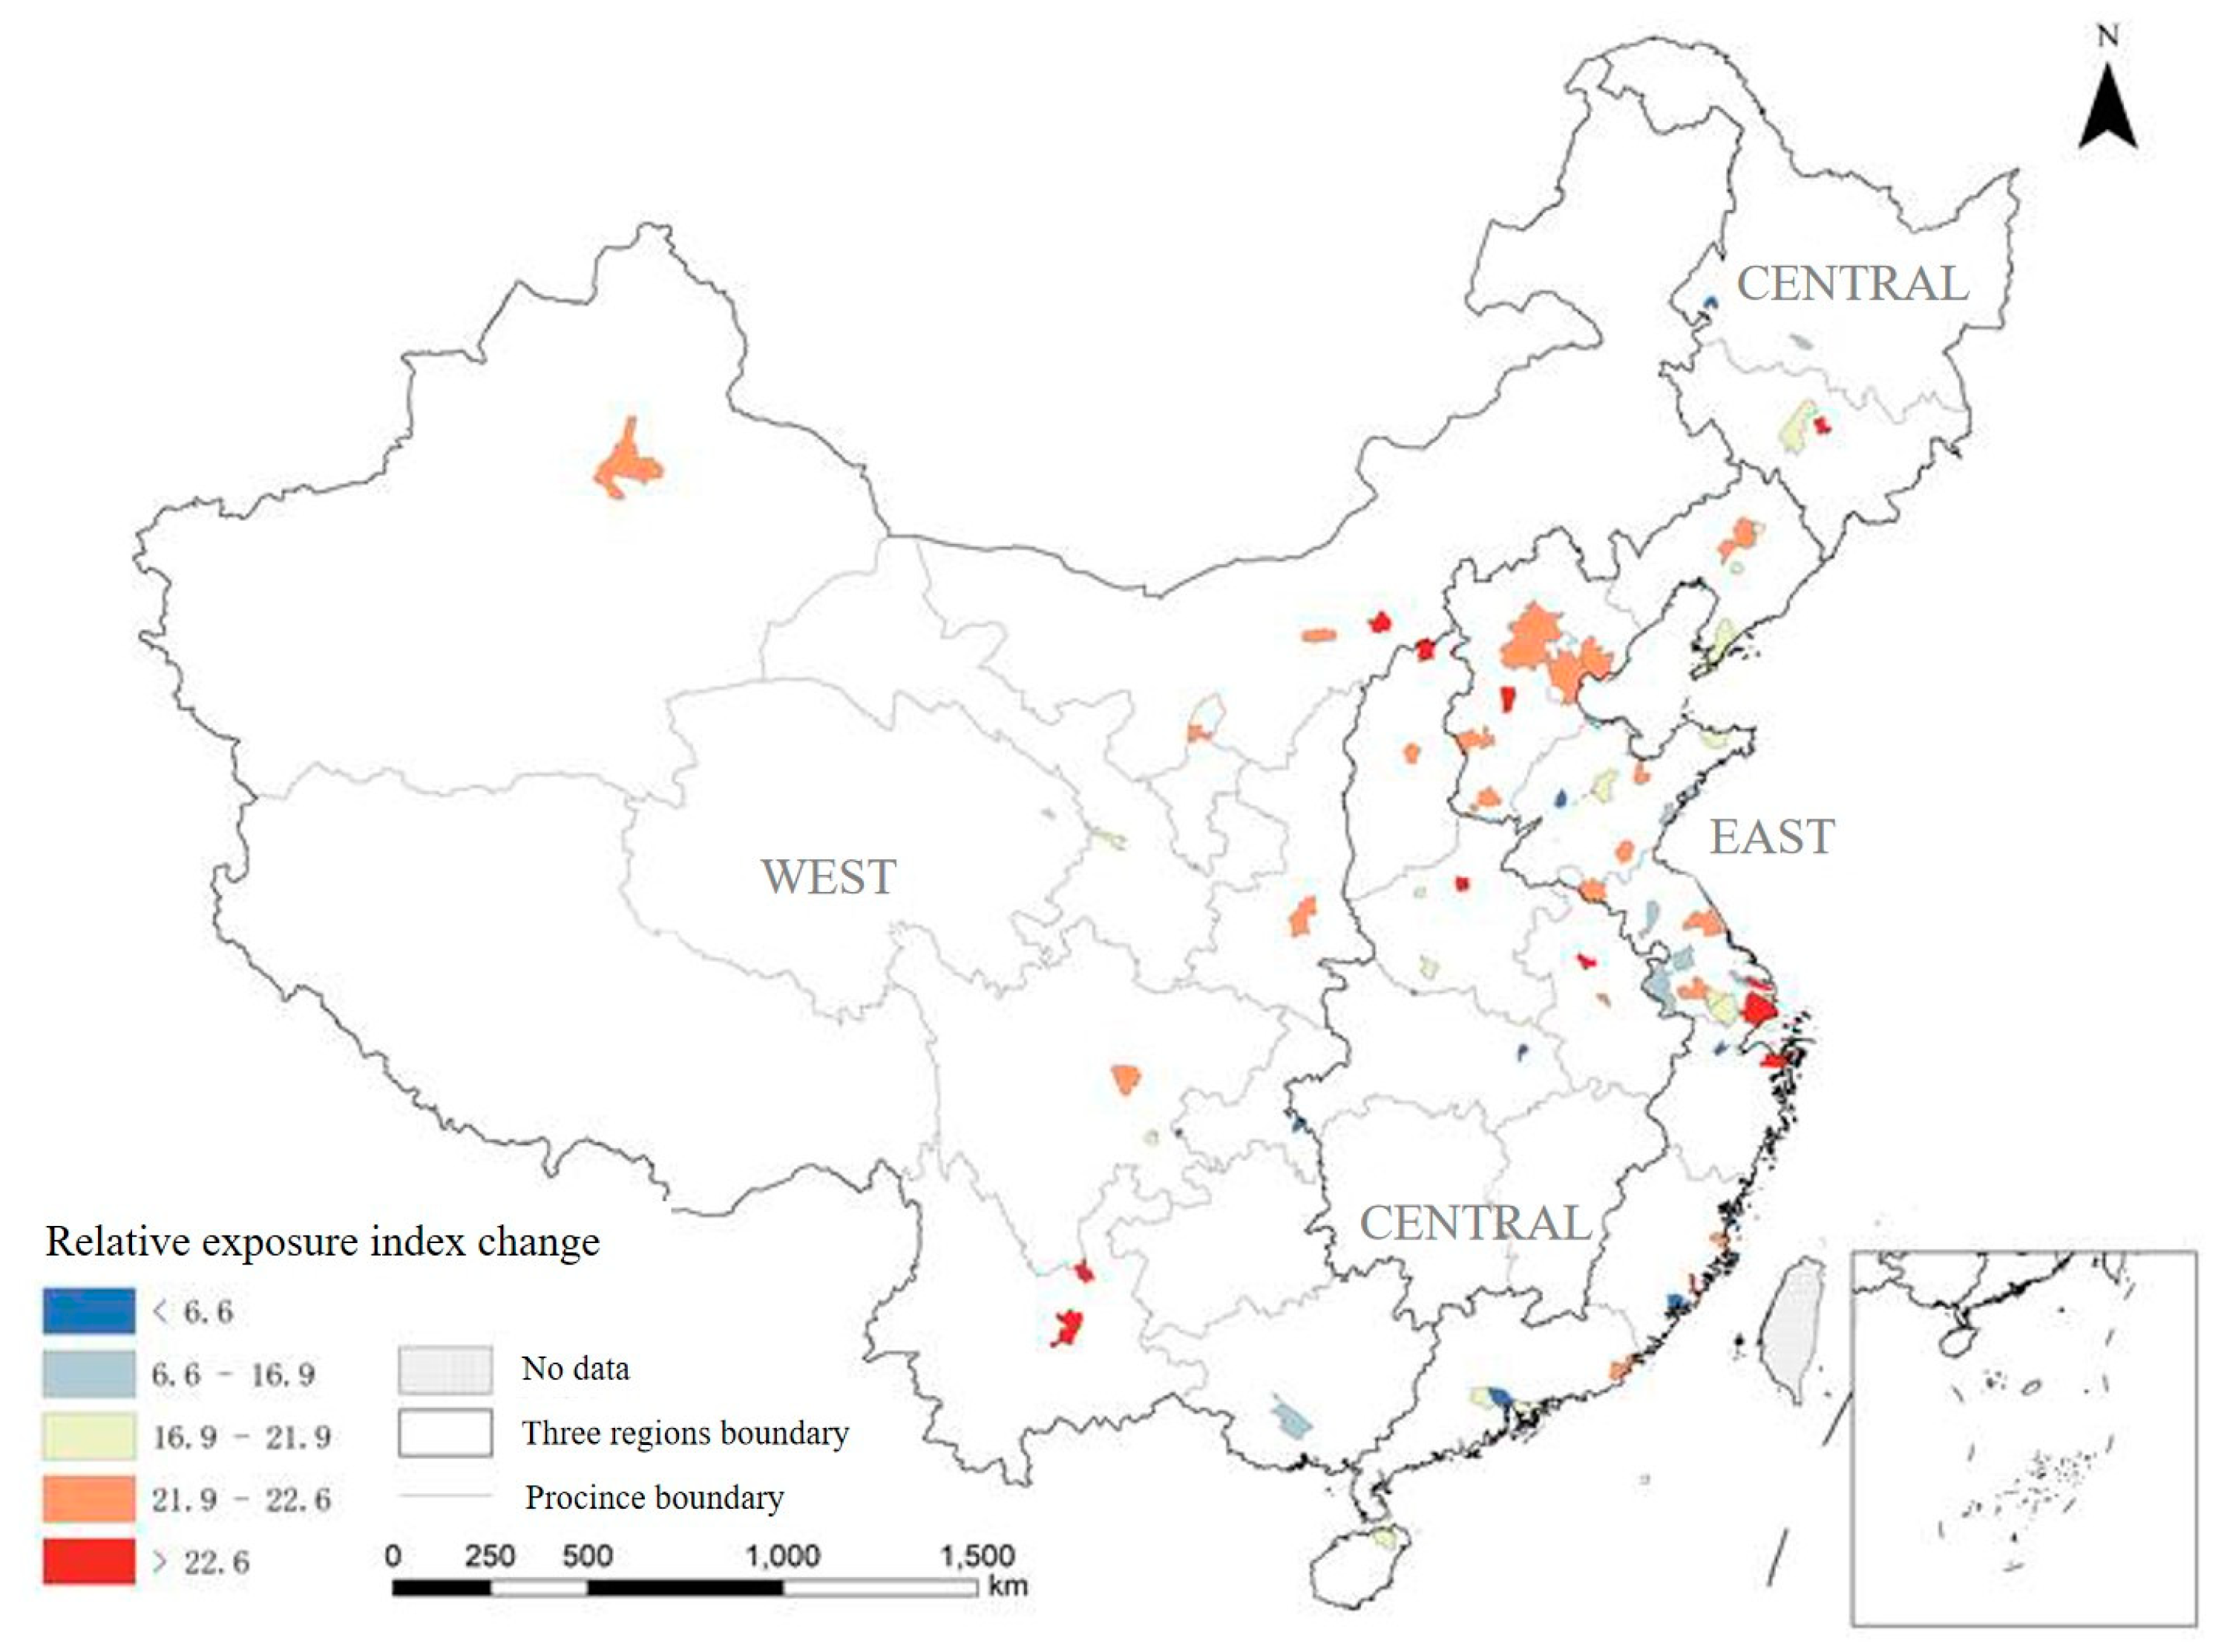
Figure 12.
Quadrant chart of absolute and relative exposure index changes in large cities.
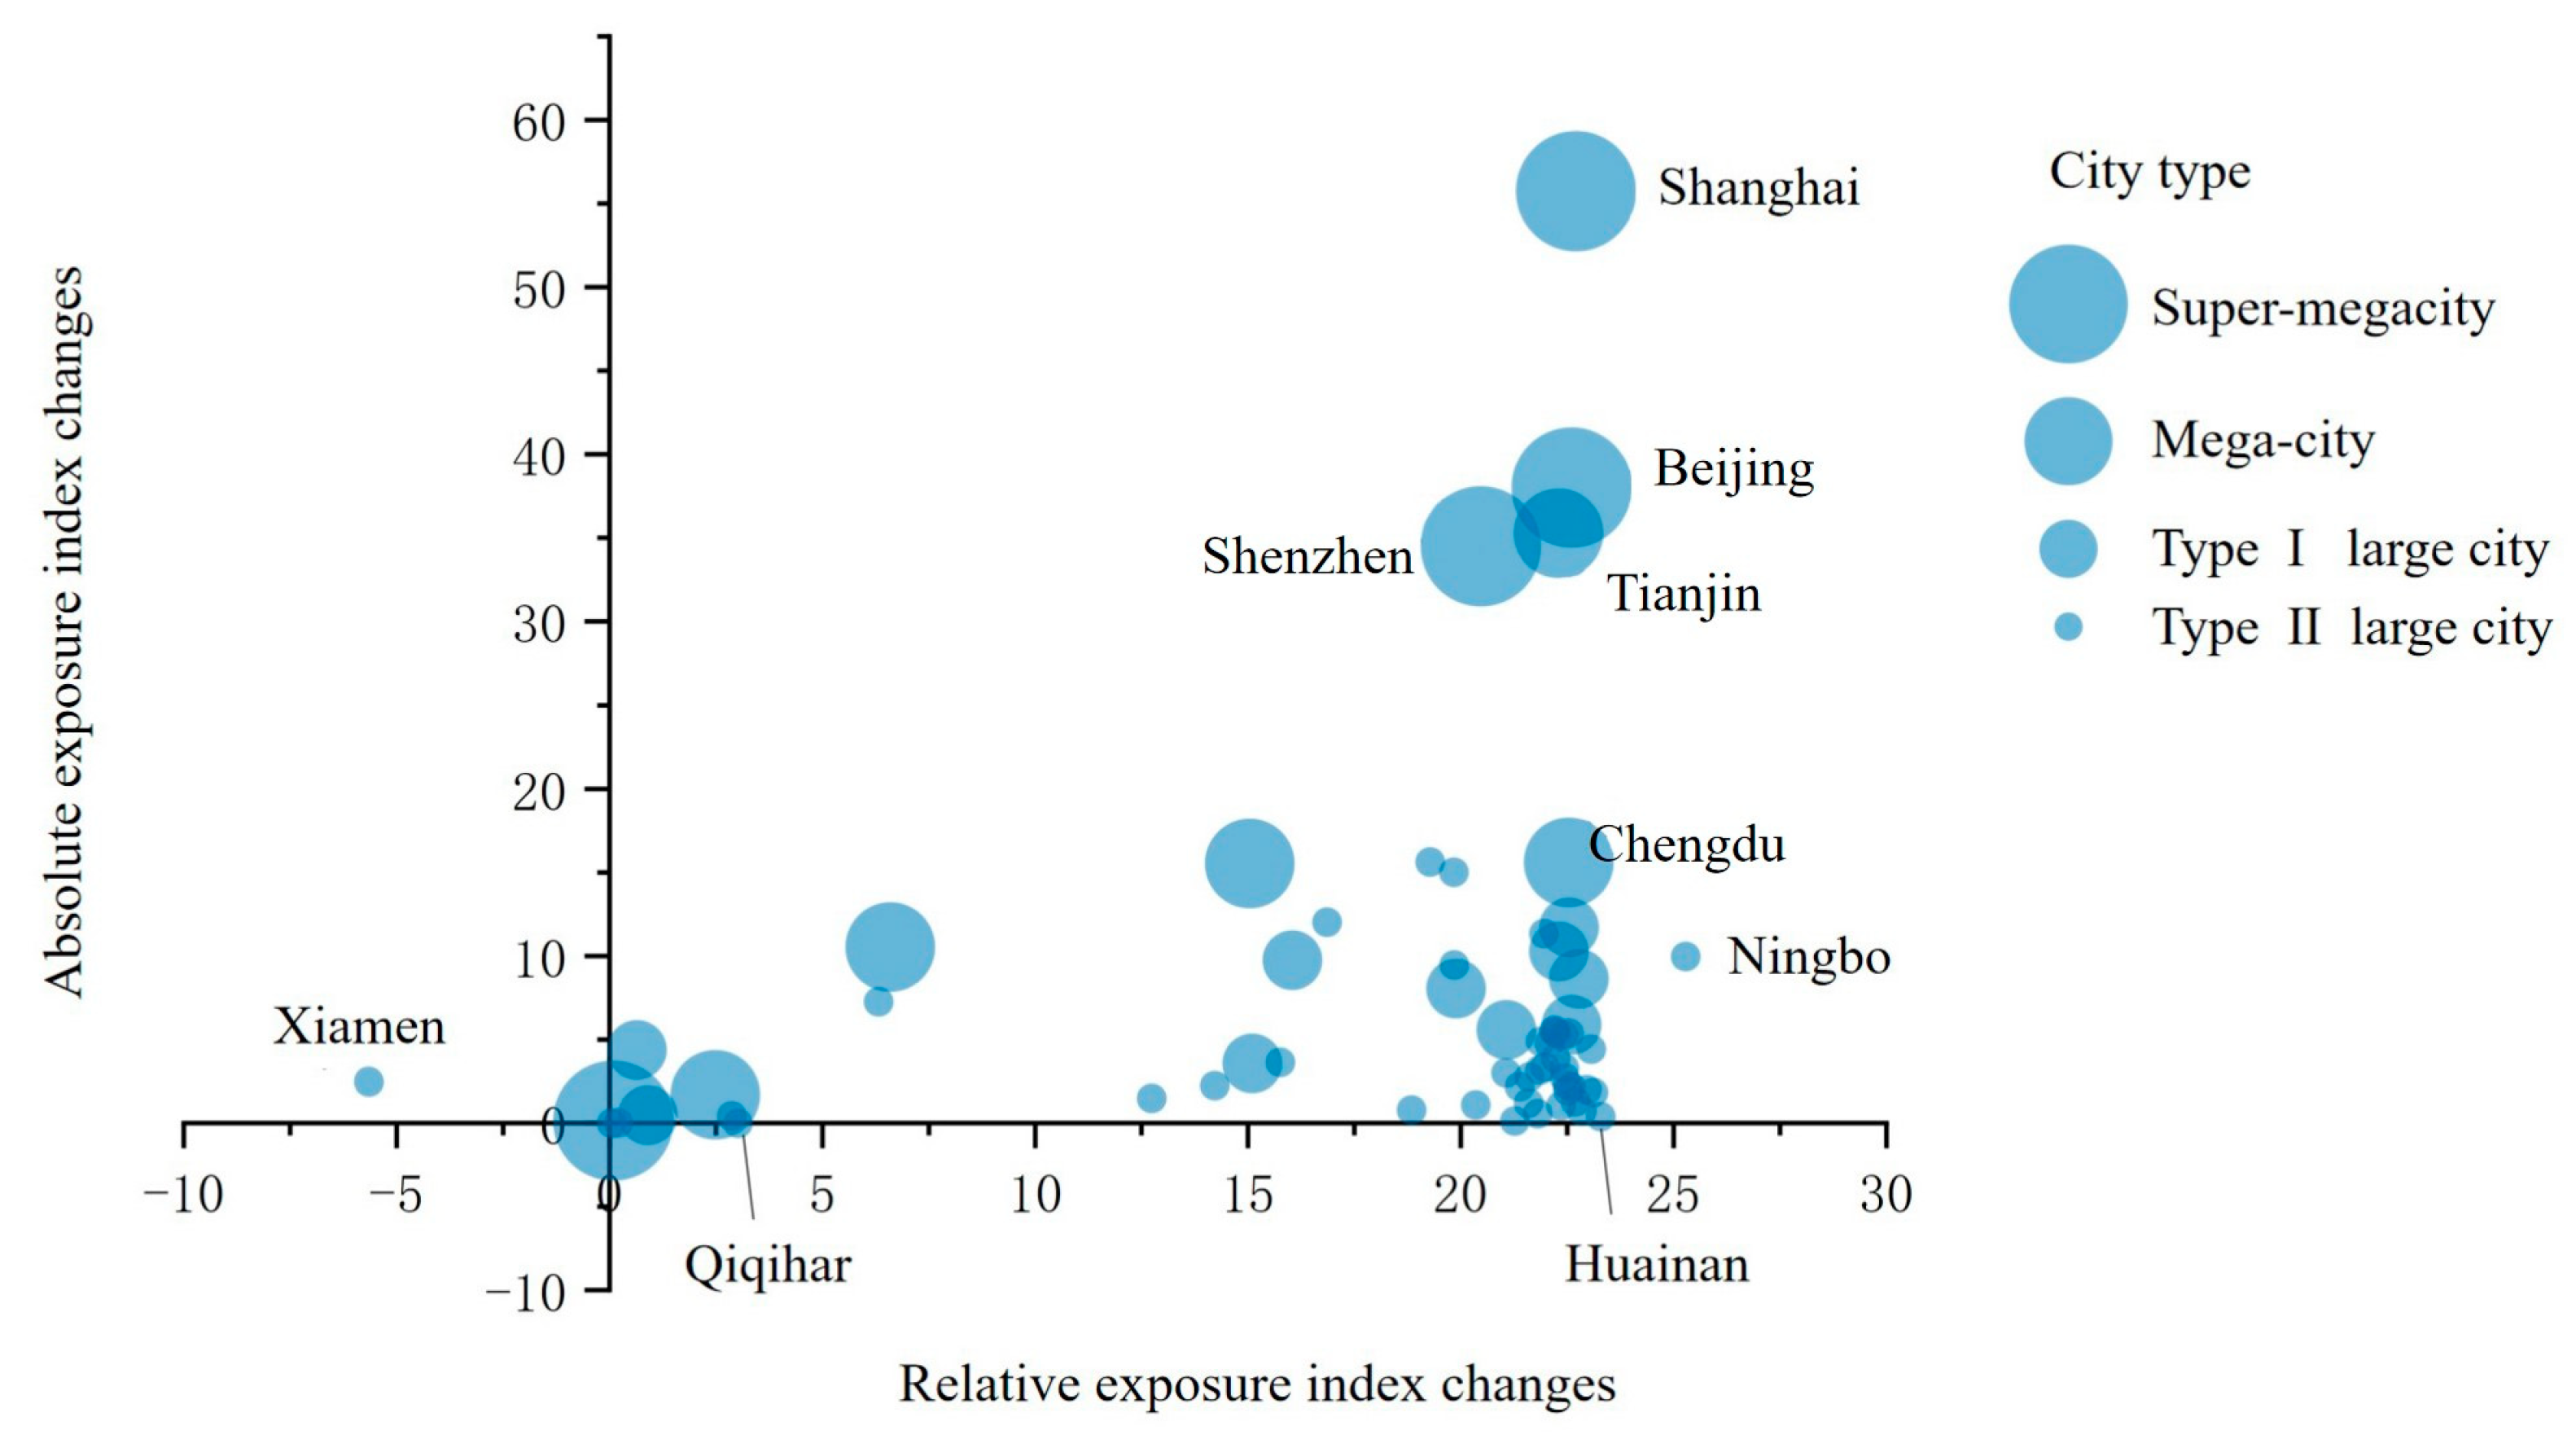
Figure 13.
Comparison of population grid data and statistical data.
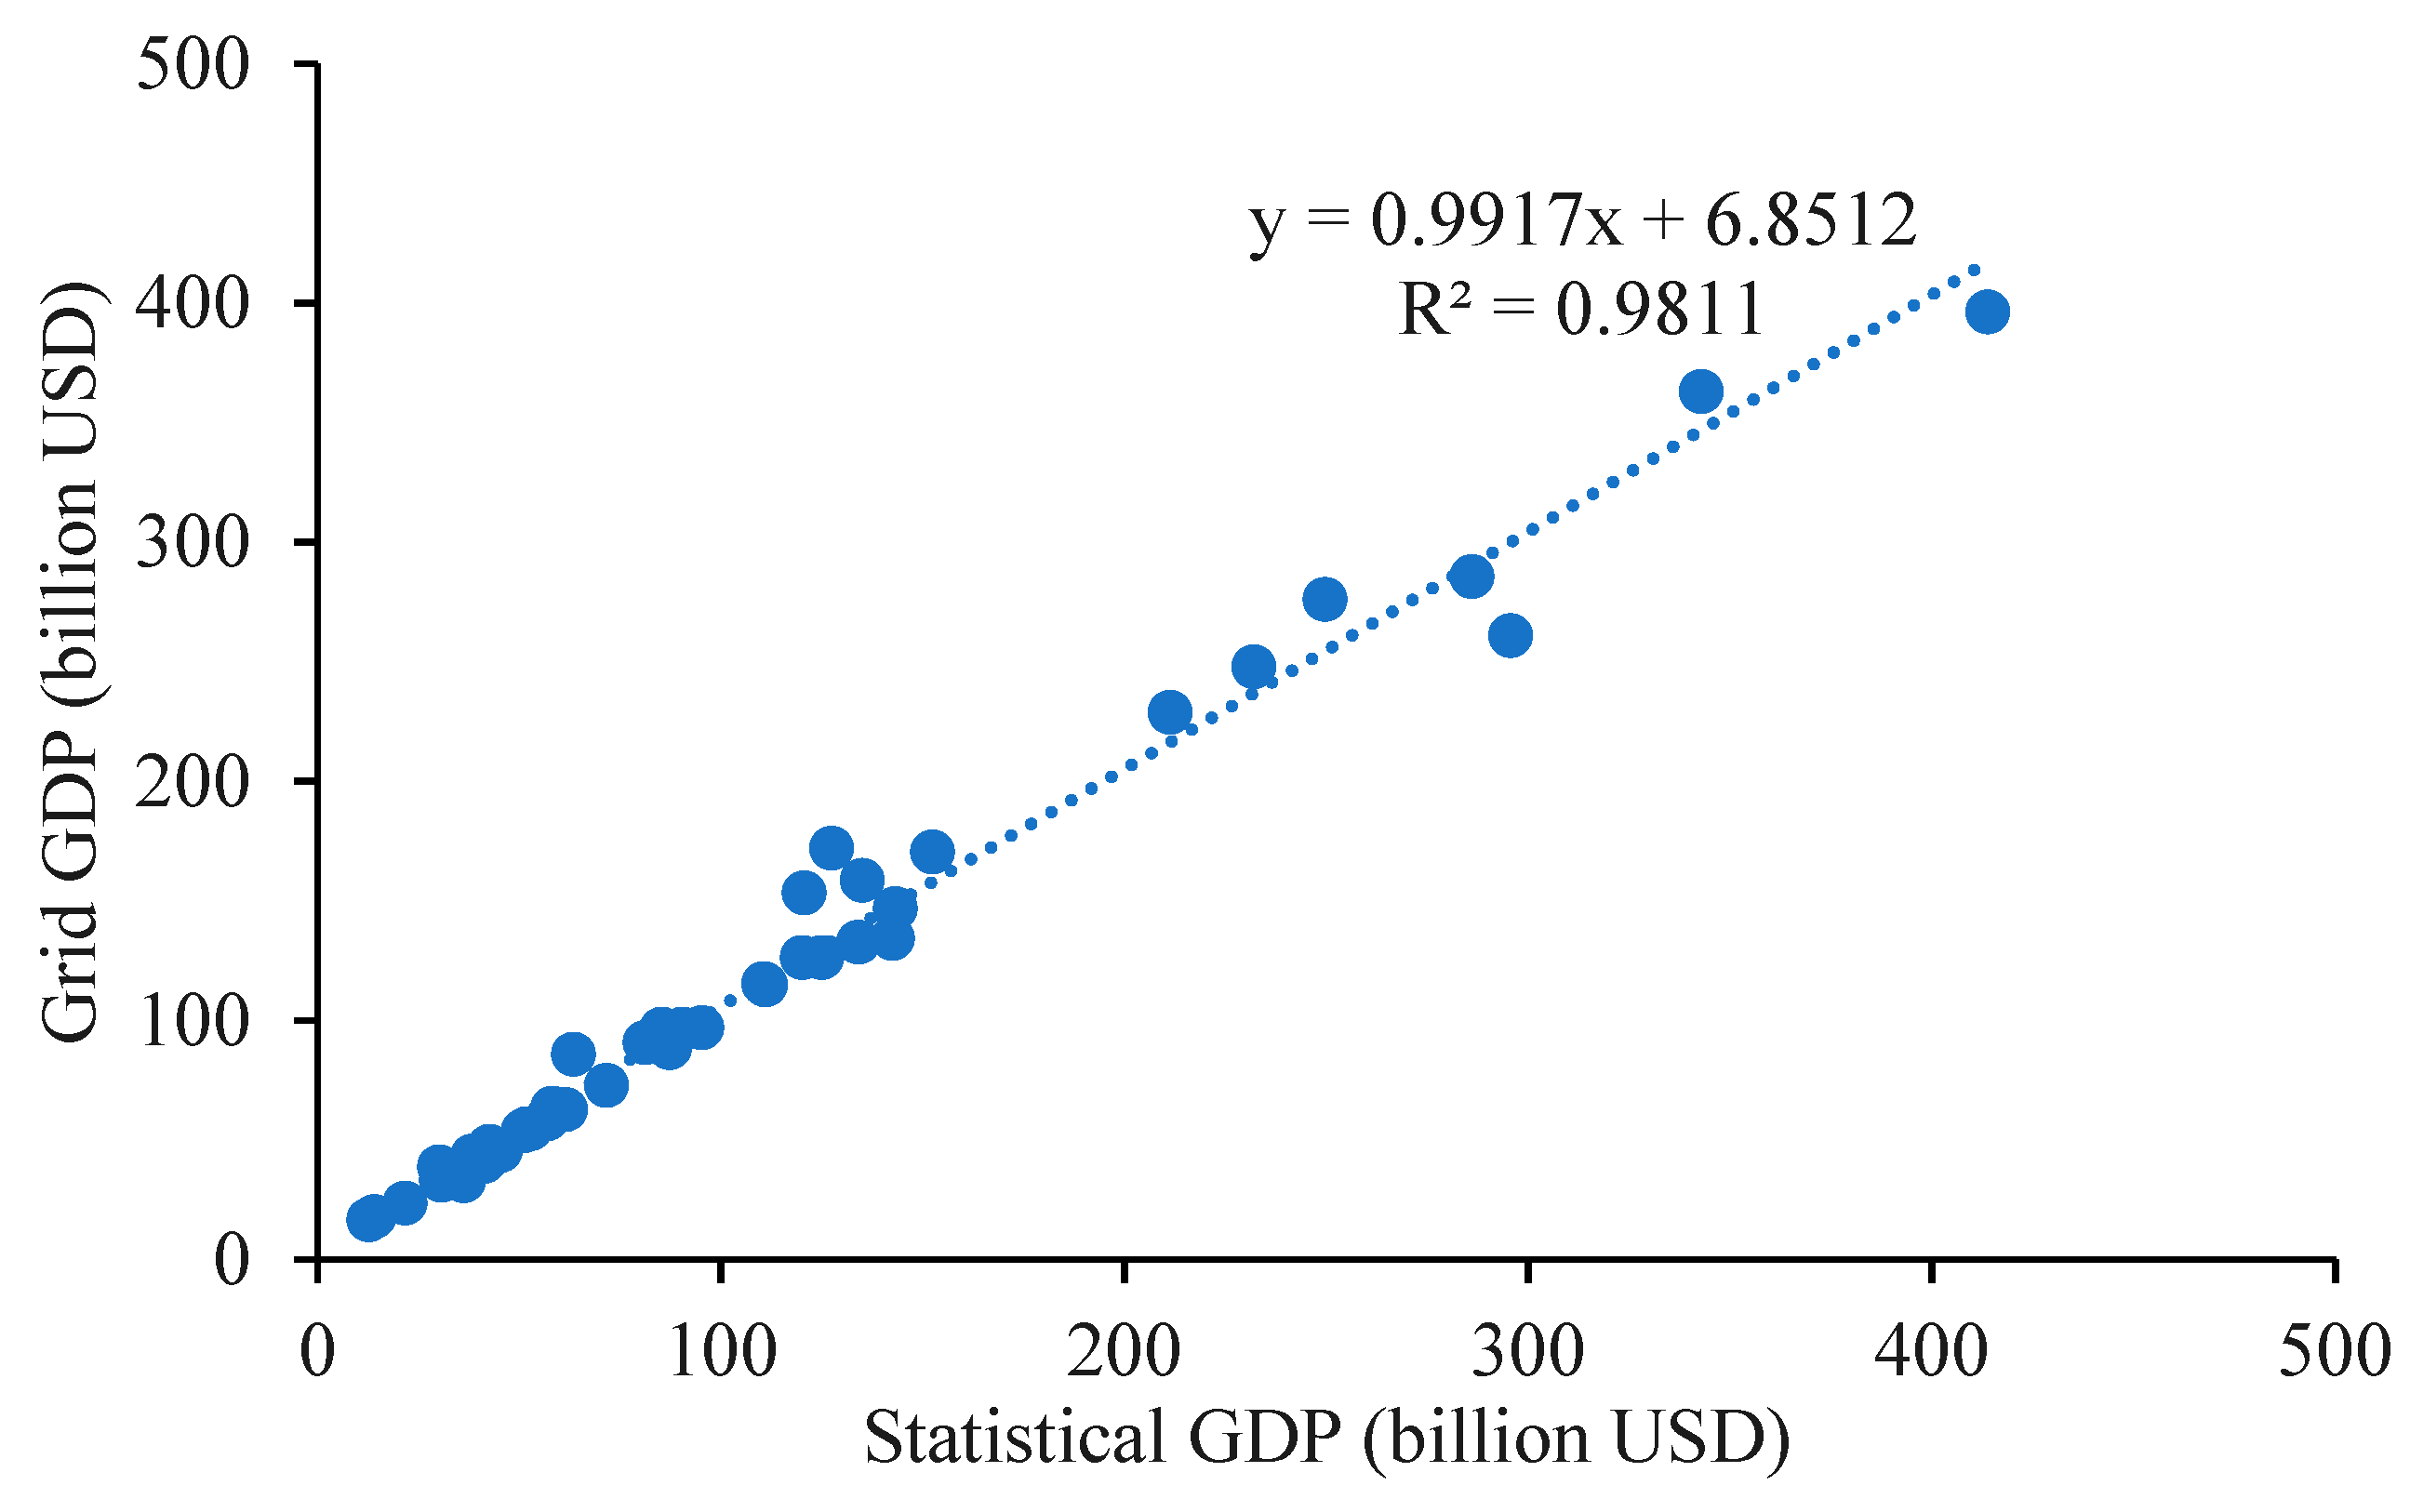

Table 1.
Seismic intensity classification based on PGA.
| Seismic intensity | Degree VII | Degree VIII | Degree IX | |
| PGA | 0.1g | 0.2g | 0.3g | 0.4g |
Table 2.
Statistics of UALCs and HSHUAs.
| Region | City size | City name | UALC area (km²) | HSHUA area (km²) | HSHUA area / UALC area (%) |
| Eastern China | Megacity | Beijing | 16389 | 16345 | 99.7 |
| Shanghai | 6211 | 6166 | 99.3 | ||
| Shenzhen | 1967 | 1735 | 88.2 | ||
| Supercity | Tianjin | 8558 | 8531 | 99.7 | |
| Nanjing | 6587 | 4841 | 73.5 | ||
| Guangzhou | 6945 | 1340 | 19.3 | ||
| Type I large city | Dalian | 5244 | 5146 | 98.2 | |
| Shenyang | 5083 | 4825 | 94.9 | ||
| Qingdao | 4785 | 2399 | 50.1 | ||
| Jinan | 4811 | 1036 | 21.5 | ||
| Hangzhou | 8232 | 647 | 7.9 | ||
| Type II large city | Shijiazhuang | 3500 | 3500 | 100 | |
| Handan | 2319 | 2319 | 100 | ||
| Yangzhou | 2292 | 2292 | 100 | ||
| Linyi | 1742 | 1742 | 100 | ||
| Anshan | 626 | 626 | 100 | ||
| Quanzhou | 537 | 537 | 100 | ||
| Weifang | 1527 | 1526 | 99.9 | ||
| Zibo | 2984 | 2974 | 99.7 | ||
| Tangshan | 5499 | 5476 | 99.6 | ||
| Yancheng | 403 | 4013 | 99.5 | ||
| Haikou | 2188 | 2171 | 99.2 | ||
| Shantou | 1985 | 1970 | 99.2 | ||
| Changzhou | 2853 | 2803 | 98.2 | ||
| Xuzhou | 3040 | 2951 | 97.1 | ||
| Fushun | 659 | 621 | 94.2 | ||
| Yantai | 2636 | 2417 | 91.7 | ||
| Xiamen | 1485 | 1338 | 90.1 | ||
| Suzhou | 4608 | 3742 | 81.2 | ||
| Wuxi | 1630 | 1290 | 79.2 | ||
| Baoding | 2551 | 1913 | 75.0 | ||
| Fuzhou | 1683 | 1212 | 72.0 | ||
| Foshan | 3883 | 2271 | 58.5 | ||
| Ningbo | 3544 | 1994 | 56.3 | ||
| Dongguan | 2396 | 785 | 32.8 | ||
| Nantong | 1896 | 525 | 27.7 | ||
| Huizhou | 2596 | 263 | 10.1 | ||
| Jining | 963 | 8 | 0.9 | ||
| Central China | Supercity | Wuhan | 8565 | 594 | 6.9 |
| Type I large city | Zhengzhou | 1058 | 1058 | 100 | |
| Changchun | 6945 | 5862 | 84.4 | ||
| Harbin | 10138 | 916 | 5.7 | ||
| Type II large city | Datong | 2065 | 2065 | 100 | |
| Taiyuan | 1455 | 1455 | 100 | ||
| Jilin | 1170 | 1170 | 100 | ||
| Huainan | 1045 | 1045 | 100 | ||
| Hefei | 517 | 517 | 100 | ||
| Luoyang | 461 | 461 | 100 | ||
| Nanyang | 1970 | 1462 | 74.2 | ||
| Huai’an | 4486 | 1970 | 43.9 | ||
| Qiqihar | 4338 | 751 | 17.3 | ||
| Xiangyang | 3636 | 169 | 4.7 | ||
| West China | Megacity | Chongqing | 43284 | 971 | 2.2 |
| Supercity | Chengdu | 3679 | 3679 | 100 | |
| Type I large city | Xi’an | 3918 | 3918 | 100 | |
| Kunming | 5624 | 5624 | 100 | ||
| Type II large city | Hohhot | 2062 | 2062 | 100 | |
| Lanzhou | 1693 | 1693 | 100 | ||
| Yinchuan | 1564 | 1564 | 100 | ||
| Xining | 324 | 324 | 100 | ||
| Baotou | 2296 | 2254 | 98.1 | ||
| Urumqi | 14851 | 13929 | 93.8 | ||
| Zigong | 826 | 754 | 91.3 | ||
| Nanning | 9826 | 4617 | 47.0 | ||
| Total | 278266 | 167177 | 60.1 |
Table 3.
Population, GDP, and built-up land in UALCs and HSHUAs in 2015.
| Area | City size | Population (million people) | GDP (×103 billion USD) | Built-up land (km2) |
| HSHUAs | Megacity | 56.37(22.61%) | 1.01(30.78%) | 5552 (20.57%) |
| Supercity | 37.81(15.17%) | 0.58(17.61%) | 3704 (13.73%) | |
| Type I large city | 46.26(18.56%) | 0.47(14.28%) | 4172 (15.46%) | |
| Type II large city | 108.85(43.66%) | 1.22(37.34%) | 13560 (50.25%) | |
| total | 249.30(100%) | 3.27(100%) | 26987 (100%) | |
| UALCs | Megacity | 76.89(22.23%) | 1.24(25.66%) | 6834 (19.00%) |
| Supercity | 52.74(15.24%) | 1.00(20.79%) | 4808(13.36%) | |
| Type I large city | 60.52(17.49%) | 0.75(15.48%) | 6326(17.58%) | |
| Type II large city | 155.81(45.04%) | 1.83(38.07%) | 18006 (50.05%) | |
| total | 345.95(100%) | 4.82(100%) | 35974 (100%) | |
| China | 1374.62 | 10.81 | 109929 |
* Figures in parentheses are the proportion of the population, GDP and built-up land to the total of different city scales.
Table 4.
Population, GDP, and built-up land growth in UALCs and HSHUAs during 1990-2015.
| Area | City size | Population (million people) | GDP (×103 billion USD) | Built-up (km2) |
| HSHUAs | Megacity | 29.55(3.02%) | 0.92(10.23%) | 1824(1.61%) |
| Supercity | 17.43(2.50%) | 0.54(11.80%) | 1564 (2.22%) | |
| Type I large city | 20.70(2.40%) | 0.43(10.74%) | 1634(2.01%) | |
| Type II large city | 42.71(2.01%) | 1.13(11.09%) | 5573(2.14%) | |
| total | 110.39(2.37%) | 3.02(10.87%) | 10592(2.01%) | |
| UALCs | Megacity | 29.57(1.96%) | 1.13(10.39%) | 2560(1.82%) |
| Supercity | 21.79(2.16%) | 0.95(12.36%) | 2034(2.14%) | |
| Type I large city | 23.49(1.98%) | 0.69(11.14%) | 2752 (2.22%) | |
| Type II large city | 59.67(1.95%) | 1.70(11.15%) | 7638 (2.15%) | |
| total | 134.51(1.99%) | 4.48(11.15%) | 14984 (2.10%) | |
| China | 231.29(0.74%) | 9.80(9.95%) | 48749 (2.37%) |
Note: Numbers in parentheses are average annual growth rates; GDP in 1990 is converted to 2015 price levels using the GDP deflator.
Disclaimer/Publisher’s Note: The statements, opinions and data contained in all publications are solely those of the individual author(s) and contributor(s) and not of MDPI and/or the editor(s). MDPI and/or the editor(s) disclaim responsibility for any injury to people or property resulting from any ideas, methods, instructions or products referred to in the content. |
© 2024 by the authors. Licensee MDPI, Basel, Switzerland. This article is an open access article distributed under the terms and conditions of the Creative Commons Attribution (CC BY) license (http://creativecommons.org/licenses/by/4.0/).
Copyright: This open access article is published under a Creative Commons CC BY 4.0 license, which permit the free download, distribution, and reuse, provided that the author and preprint are cited in any reuse.


