Submitted:
08 June 2024
Posted:
11 June 2024
You are already at the latest version
Abstract
The demonstration of compliance of rolling stock against disturbance limits for railway signaling, and in particular track circuits, is subject to a large deal of variability, caused by the diverse values of the electrical parameters of the railway line and resulting transfer functions, as well as operating conditions of rolling stock during tests. Instrumental uncertainty is evaluated with a Type B approach and shown to be much less than the experimental variability. Repeated test runs in acceleration, coasting, cruising, braking conditions are considered, deriving both max-hold (spread) and sample dispersion curves compared to the respective mean values (Type A approach to the evaluation of uncertainty). The major source of variability affecting a significant portion of the spectrum is caused by the superposed oscillations of the onboard LC filter, for which different choices of the transformation window duration are discussed. The test runs and the acquired data covered overall 1 day of tests along about 300 km of the Italian 3 kV DC railway network.
Keywords:
Electrical measurements
; Data acquisition
; Spectral analysis
; Signal processing
; Interference
; Railways
; Rolling stock
; Uncertainty
1. Introduction
Similarly to the electromagnetic compatibility (EMC) testing for CE mark in Europe of an electrical or electronic product, new and revamped rolling stock (RS) must undergo a process of verification and certification (the so called “homologation”), not only for radiated electromagnetic emissions (as per EN 50121-3-1 [1]), but also to demonstrate compliance with a range of signaling systems [2,3]. Harmonic and inter-harmonic distortion, differently from industrial and public low voltage networks, is not yet disciplined by a harmonized standard for electrified railways, although distortion levels may be high raising Power Quality concerns [4].
The tests must be exhaustive, covering normal and exceptional operating conditions (OCs): locomotive distortion changes with OCs (traction, cruising, coasting, braking) and operating point, OP (e.g. intensity of the effort). Such verification has safety implications, as in general occurs when dealing with traffic control and protection devices, although in many cases safety is ensured by redundant protocols and architectures, as explained in Section 2.2.
The track can couple disturbance onto various signaling systems, and in particular track circuits (TCs) [2,5,6,7]. The RS return current amplitude and distribution may vary due to many reasons, both in terms of current imbalance in the two rails (a differential-mode component) and intensity vs. frequency and position. The overall number of conductors and geometry set the basic impedance behavior, but rail-to-rail and track-to-track bonds, impedance bonds, soil resistivity and track-to-earth leakage may change the resulting transfer function and direction of flow of the return current. In addition, as the return current flows back towards the respective traction power stations (TPSs), the relative position of the RS (or locomotive, in the specific case) dramatically modifies the Line Frequency Response (LFR) [8,9].
The relationship between the locomotive return current leaving the axles and the track quantities (first of all the rail currents , , but also the rail-to-rail voltage ) is thus affected by all such parameters: besides varying during tests on real lines, their range can be in some way fixed a-priori when deciding on which lines and portions of lines tests should take place. This coupling is called “cold path”, to distinguish it from the “hot path” of the TPS current flowing to the locomotive along the catenary (), as shown in Figure 1. Also the hot-path TF is subject to variability caused by the TPS impedance, locomotive-TPS distance, geometry of conductors, and track parameters [8,10], but the cold-path TF is more heavily affected by track parameters, such as the rail impedance [11], track capacitance [12] and track conductance [13], besides construction/connection details (such as transversal bonding connections, rail welding points, etc.). A graphical description is provided in Figure 1.
All these elements contribute electrical asymmetry of the two rails [15], variable vs. frequency and in the order of maximum 10 % [5,16,17]; the section 8.8.2 of the EN 50167-1 [18] also indicates 10 %, but keeps a margin up to 20 %. Such asymmetry, besides other practical imbalances of the connection and tuning of TCs, causes a non-negligible fraction of the return current to transform into a differential-mode signal (rail current difference or rail-to-rail voltage ) coupling onto and potentially disturbing the track signaling devices.
Despite the electrical safety issues due to the high pantograph voltage, can be measured more easily than , as it flows in a well-definite conductor passing through the locomotive circuit breaker, rather than dispersing in the many paths to the wheels’ brushes (this is pointed out in Figure 1 by the green current probe symbols inside the “rolling stock under consideration”). As a note, on AC rolling stock the negative of the input transformer is also well defined and accessible and can be favorably used.
The locomotive current then, under worst-case assumptions for line and track parameters, configurations and number of trains, can be related to the disturbance to the signaling circuits. This is the approach commonly used to decide the RS current limits by the infrastructure owners, once signaling susceptibility is quantified.
Coming to the variability of measured data and the uncertainty of such approach to the assessment of RS conducted emissions relevant to signaling operation, the following points must be considered:
- first of all instrumental uncertainty, by applying metrology concepts [19] to the measurement chain, including sensors and data acquisition system (DAS); there is no uniform approach to deal with uncertainty of measurement results when dealing with compliance to limits and safety [20], for which either probabilistic approaches (combining the variability of data and instrumental uncertainty, in order to derive the likely distribution of measurement results) or rigid worst-case standpoints (where a conservative estimate of variability due to uncertainty is added on top of measurement results) may be adopted;
- there is then a wide range of power supply transients [21], such as inrush and short-circuit events [22], that are intrinsic to the system and are not usually taken into account in the verification of interference to signaling; however, the criteria to discard such transients based on their duration, their nature and origin are not formalized and established;
- other transients typical instead of RS operation occur much more frequently and they are relevant in terms of both instrumental uncertainty (e.g. scale setting and consequential out of scale) and transient disturbance to signaling (as the result of non-characteristic components arising during such transients) [23]; examples of such transients are pantograph bounces (bringing along electric arcs and on-board filter oscillations in DC RS [24]), wheel slip (causing traction converter reaction), various overvoltages [25], etc..
In conclusion, distortion patterns are quite diversified, especially if including harmonics and higher frequency components. To the aim of assessing the electromagnetic compatibility with signaling as part of the certification process, such behavior must be accounted for with a twofold objective: being as exhaustive as possible for safety implications and related probability calculations, but reducing the test time to a manageable duration, considering especially the problem of variability of data and related uncertainty. Uncertainty on fact is part of the assessment process with comparison to limits in order to establish compliance.
2. Rolling Stock and Signaling Characteristics
2.1. Rolling Stock and Return Current
RS consists of a locomotive loaded with coaches or, in the most modern implementations, of electrical multiple units and is the source of distortion and disturbance. Distortion is caused by the traction and auxiliary converters, that for DC systems are interfaced with the pantograph by means of a DC/DC buck converter (aka chopper), which masks the converter emissions by the interposed DC link capacitors and filters. This is a general benefit of DC railways where distortion and the significant spectral components are less than for AC railways [26]. When the locomotive inverters take directly power from the catenary [27], the inverters distortion patterns may need a significant optimization to avoid the frequency intervals where signaling is known to operate.
The locomotive return current couples with the victim TC conductively, in differential mode [2,3,5], whereas in principle it flows out the axles symmetrically (with the rails in electric parallel).
A certain deal of asymmetry exists in the rail-wheel contact resistances, in the coupling between rails of the same and adjacent tracks [15], and in the distributed leakage to earth components, that transform a fraction of the common-mode return current into differential-mode rail current. Such transformation is variable because of the combined action of the elements above and is in general limited to about 10 %, mainly due to the inductive coupling between the running rails of two parallel tracks. To this the conductive leakage paths must be added, providing an additional resistive term. Assuming a suitable value of the transformation ratio is an important step when determining safety margins and limits.
In DC systems the input chopper is buffered by a low-pass LC filter, with the objective of filtering out the supply distortion components, but causing significant low-frequency oscillations when triggered by any transient, due to a change of traction effort and in general driving variability or also by the electric arcs at the pantograph [24].
A sketch of a typical DC locomotive, like the one subjected to tests, is shown in Figure 2.
2.2. Signaling Systems
There is a variety of signaling systems that are connected to the track or in its proximity, against which return current spectrum must be assessed for compatibility:
- track circuits (TCs) of the power frequency and audio-frequency type [6], directly connected to the running rails and for this reason mostly affected by disturbance and current unbalance in the track;
- specific short-length devices for protection of e.g. level crossing and shunting yards, adopting track circuit technology and usually backed up by axle counters.
For many modern TCs interference is only a matter of availability, as safety is always ensured by using robust techniques, such as signal repetition and independent paths for signal transmission (a second channel is through a twisted pair not interfered by normal return current distribution to a large extent [30,31]).
The principle of operation of TCs is based on a modulated differential signal delivered by a transmitter (TX) over the track and picked up by one or more receivers (RXs) [6]: this is applicable for power frequency (PF) and audio-frequency (AF) TCs. In general TXs and RXs are coupled to the track with frequency selective circuits, filtering to some extent components outside the operating bandwidth. Such circuits are frequency selective thanks to their resonant behavior with inductive elements.
For PF TCs the transformer, depending on the use of a single rail or both, besides ensuring the galvanic separation with the track, provides also separation of the common-mode and differential-mode current across a physical interruption of the rail (mechanical insulating rail joint). The principle of operation and main connections are shown in Figure 3.
For AF TCs rails are continuous 8mechanically and electrically) and frequency selectivity is achieved by simple LC circuits in combination with S- or O-shaped cable joints connected to the rails [5], as shown in Figure 4. The transformer coupled TCs [6] are an older version.
Additional filtering may be then inside the electronic circuits of TX and RX systems, where channel guarding and selection may be implemented. The modulated signal ensures robustness against external noise, in addition to the band-pass filtering. For interoperable TCs limits are specified in the CLC/TS 50238-2 [14], whereas those not intended for trans-national use are disciplined by local codes, e.g. issued by the infrastructure owner or by a national safety agency. Let’s call them altogether “regulations” in the following.
The operation of a TC is quite simple where the signal received at each RX is shunted by the axle resistance of the RS entering the TC section, reducing the received signal amplitude, from which an occupied track section is detected.
Any superposed noise can alter the received amplitude possibly disguising an occupied track as a free track. From this the benefit of a well defined and limited bandwidth and the use of modulations and persistence of the received signal over long time intervals of some seconds. A more trivial solution is the increase of the transmitted voltage increasing correspondingly the signal-to-noise ratio at the RX.
The distributed resistance between the two rails may be already at a low value, due to a large conductance to earth , for example caused by a dirty track and high humidity percentage. This track resistance loads the TX and operates in parallel to the RX input resistance, shunting away from it a fraction of the transmitted current. The TX in this condition is significantly loaded when the track is free from train axles and tuning becomes more critical, requiring a large intensity to compensate the low RX voltage in the free track condition. It is evident that sensitivity for detection of entering RS axles is compromised and the TC is more exposed to superposed noise and distortion components of the return current.
It is also remarked that on modern railway lines both technologies may co-exist, so that PF TCs are kept for compatibility with older rolling stock, while upgrading the line to the newer AF TCs, for a matter of performance, safety level and ease of maintenance, although the cost is certainly higher. This configuration is sometimes termed “overlapped” and is very convenient to enhance interoperability and to maximize flexibility for what regards the planning and duration of modernization works and revamping. In principle, thus, the entire disturbance limit curves should be complied with, not only because rolling stock may travel during its service on different lines equipped with different signaling technologies, but also because such technologies may co-exist in some cases on the same track.
2.3. Track Frequency Response
As anticipated, track conductance and capacitance are two relevant parameters shunting the signal sourced by the TX, so that minimum requirements are set forth for a TC to operate correctly with the necessary dynamic range of RX signal amplitude between free and occupied track conditions [5].
It is immediate that worst-case scenarios may be based on the maximum axle resistance and maximum track conductance . The choice of the worst case has to be nevertheless balanced, as maximizing all parameters would lead to scenarios where the TC is hard to tune and performs much worse than in normal operation. Although in a conservative perspective for safety reasons, the typical configurations for selected test lines is as discussed below:
- usual choices are (as common conservative practice, especially when moving on turnout area and slowly on rusty tracks, the usual values being much less) and (corresponding to the limit of conductance to earth established by the EN 50122-2 for stray current protection [32]);
- it is immediate that when the RS moves along the lines in normal operating conditions, the immunity margins of the TCs found on the tracks are much more favorable, being the two parameters much smaller, in the order of for a wheel-rail contact area of several , and , as found in [13] at three different types of lines, both DC 3 kV and AC 25 kV.
Track capacitance may also contribute in extreme cases: average values are in the order of 100 nF /km, that at 5 kHz contribute 3 mS /km of equivalent susceptance. This means that even changes by an order of magnitude keep it below the worst-case conductance value, but not for the normal conductance values commented above in the order of 0.1mS /km–10mS /km [13].
Setting up such scenarios can be pursued in a controlled environment, like a test track or a simulator. A real line, instead, is not under control, for which average values may be assumed, but their hypothetical wide range of variation causes a significant theoretical variability of the system response, not of the instrumentation and operating conditions [19]. Such variability, however, cannot be verified by repeated tests that are all done on a few selected lines. As a consequence, the experimental variability of Type A based on the measured data is not able to represent the system variability for the track conditions expected in a perspective of functional safety assessment. It is instead able to characterize the experimental variability of the test and provides an indication of test uncertainty. To limit system variability, infrastructure owners prefer to use always one or a few lines for acceptance tests, so that variability is limited and specific behavior known by experience, if not evaluated by separate test campaigns of line parameters measurement.
3. Test Method and Setup
3.1. Line Configuration and RS Operating Conditions
The railway line configuration and the RS OCs are the most influencing factors for the variability of collected measured data, and must be chosen to be well representative of the real operating scenarios, including worst-case situations.
As said, usually infrastructure owners prefer using the same lines for acceptance tests, that does not ensure, however, a thorough coverage of all conditions in a safety assessment perspective. This is in general assumed as compensated by the margins introduced in the definition of the LFR and track asymmetry, or in the adoption of maximum values, rather than average or statistically relevant values (e.g. confidence interval).
To the aim of assessing the frequency response of the line selected for the tests, two approaches are generally followed:
- either the test line is short and calculable, so that the frequency response can be accurately determined and then measurement results can be extrapolated to other worst-case scenarios;
- or the test line is quite long and with a wide range of supply conditions, so that “hopefully” worst-case conditions of RS emissions are likely to occur frequently enough and captured during continuous recording.
3.2. Instrumentation and Data Post-Processing
It is quite common that infrastructure owners over-specify instrumentation performance, such as in terms of number of bits of the DAS, use of filters to further enhance the signal-to-noise ratio, or adoption of special sensors based on a specific technology without a real critical evaluation of performances of those available on the market. An example of the latter is imposing the use of a compensated transformer rather than a Rogowski coil or Hall-effect probe, hindering the adoption of the best devices available following the technological progress.
Conversely, national standards rarely provide indication of the acceptable instrumentation uncertainty and data variability. This aspect will be discussed in the following, showing that instrumental uncertainty as derived from a Type B approach, is way smaller than the variability of data as caused by a variety of factors, such as normal small-scale variability within a seemingly constant OC, overlapped low-frequency transients of the onboard LC filter and various forms of electrical noise.
For the tests discussed in the next section, the following instrumentation was used: a LEM Rogowski mod. R3030 located on the internal bus-bar near the main circuit breaker and a Picoscope mod. 4424 (12 bit), sampling at , that corresponds to a sampling time .
The contribution of the instrumental uncertainty is limited and acceptable as explained in the following.
The Rogowski probe was set to the lowest scale of 30 A to improve the sensitivity in some cases, but most of the time to the 300 A scale to allow margin for the LC filter oscillations and avoid the out-of-scale. Its contribution is about 1 % of uncertainty () after laboratory calibration, considering that it was well centered and fastened to the incoming bus-bar. Centering was achieved by interposition of a thick plastic foam layer, also to ensure electrical safety at the maximum level.
The data acquisition system (set to of input range) has an intrinsic quantization noise term of less than 0.01 % (), as calculable from the number of bits, and a prevailing non-linearity term in the order of 0.1 %, as declared from the manufacturer (so likely on the safe side, being a worst-case figure).
The data consists of individual records of duration transferred through the USB connection, and for each record windows of duration are taken overlapped by a factor 0.5, that provide a frequency resolution and a minimum frequency of 10 Hz, as visible in the spectra reported in Section 4. The spectrum resulting from the average of the individual spectra over the record of duration is indicated by .
The averaging of the transformation windows provides some improvement of the spectrum noise. It is acknowledged that averaging over , as in the reference case of , is not the best approach for the reduction of the effect of data variability, but the duration of was a constraint imposed by the Picoscope software at the time of the tests. Now, a in-house developed program in C language is able to acquire continuous data records of arbitrary length.
Before calculating the individual FFTs of each window, all data are windowed to reduce the spectral leakage by using a Hanning window (that is also in line with the requirements of the Italian Railways specification FS96 [35]). The entire process is implemented in Matlab with the function spectrogram() that receives as parameters the Hamming window vector and the indication of the windows overlap (in our case 50 %).
having indicated the time interval of duration with the notation ⋯ and a time step ; the summation makes explicit the averaging and the sliding approach for the three windows over the record duration; the multiplication of the two time vector of the signal and the Hanning window is component wise and is indicated by the symbol .
Spectral leakage is mainly caused by the continuously excited transient response of the onboard LC filter, so that is may affect the components at the lowest frequencies, but it is attenuated at a significant extent already at 50 Hz and above. This will be exemplified in the next Section 4.1 and evaluated more accurately by showing the resulting dispersion in Section 4.2.
4. Results
Sample results of a full day of test runs over about 300 km of railway lines are reported, discussing the observed variability and the compliance with limits for DC railways, taken from the Italian regulation [35] and the subset of interoperable track circuits for DC railways shown in [18].
4.1. Time-Domain Waveform
Before starting the discussion of the spectral behavior in the various OCs, it is worth giving a look at the pantograph current waveform and its peculiar characteristics. Some examples are provided in Figure 5.
It is easy to see that the low-frequency amplitude of the signal (or “pedestal”) may be quite variable, depending on both the power flow intensity and the amount and amplitude of the onboard filter oscillations. The main ripple at 100 Hz in all four insets of Figure 5 keeps at 4 App, whereas the filter oscillation at about 14 Hz causes significant signal excursion and variability. Taking long snapshots of 100 ms duration exposes the analysis to a significant spectral leakage, as evident by inspecting the four exemplifying insets. A shorter time window of e.g. 20 ms would not see much variation between its two ends most of the time (except for the steepest parts of the oscillating waveforms).
4.2. Variability and Uncertainty
The overall Type A uncertainty based on collected data in traction and braking condition is shown in Fig. 4 as profiles of (so 1 standard deviation) around the mean value (having used the Greek symbols for clarity also for sample quantities). It is evident that at many frequency points the blue profile is significantly higher than the mean, showing the previously announced variability due to line and operating conditions. Conversely the red profile shows in many cases very small values that may be caused by numerical noise of the Fourier post-processing (they are not visible when plotted on a vertical log scale). Such small values are not anyway relevant to the evaluation of interference to signaling.
Figure 6.
Pantograph current spectrum of the 3 kV DC locomotive (expressed as and profiles): (a) traction, (b) braking.
Figure 6.
Pantograph current spectrum of the 3 kV DC locomotive (expressed as and profiles): (a) traction, (b) braking.
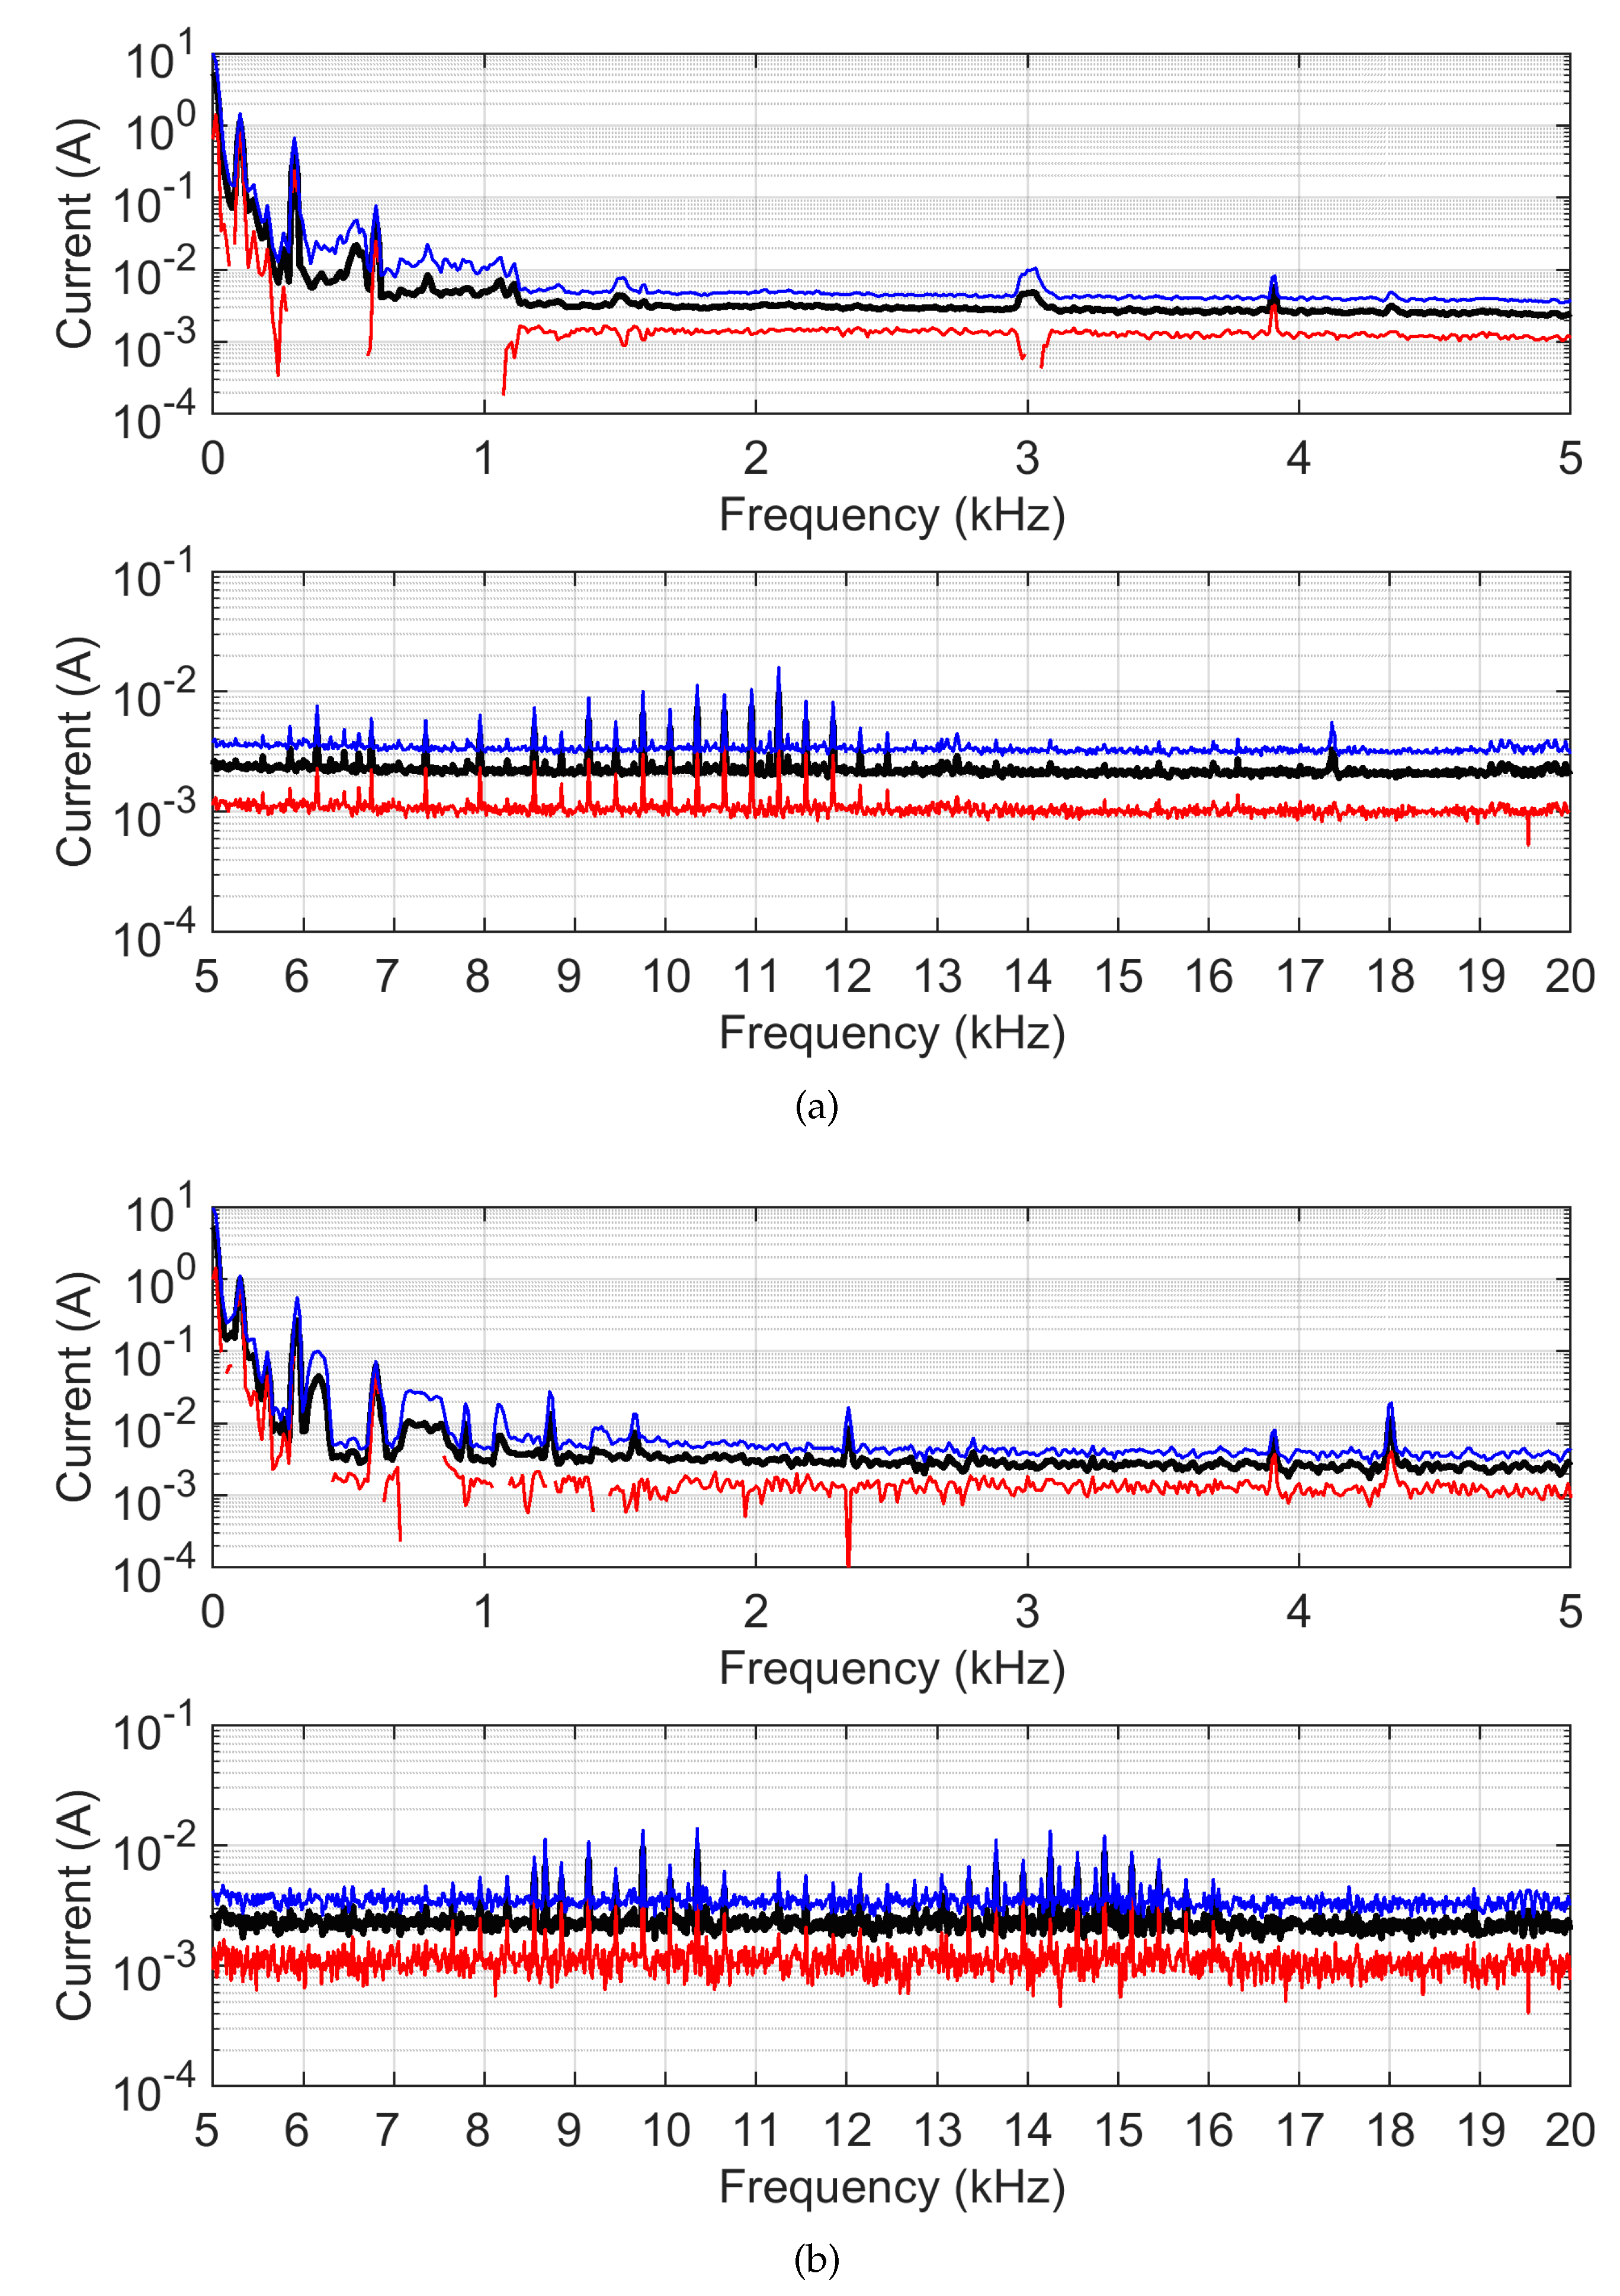
The exhaustive and accurate determination of a probability density function (pdf) would require a huge number of tests as convergence for unlikely extreme values is slow. However, focusing on the largest values that are relevant to the assessment of compliance and compatibility, a single-sided confidence interval may be estimated under an assumption of normality for the pdf profile above the average. The profile is a truncated normal distribution at the top side and includes all points at the bottom side, and the normality assumption holds up to about , so that a confidence level of 97.5 % is achieved at a coverage factor , namely at .
This is in reality a simplification as two factors must be taken into account:
- the TPS characteristic harmonics are much more stable and have step-like changes of amplitude when moving from one supply section to the other; nevertheless limit masks are devised to treat such unavoidable emissions specifically and signaling devices are designed not to use such narrow frequency bands;
- RS emissions are significantly time-varying and non-stationary, as caused by transients and by variable OCs due to the dynamic behavior [36], well described by Figure 5 of [37]; similarly to what commented for the measurement of the electromagnetic emissions by electric arcs, there is always a trade-off between the resolution bandwidth (here the width of the Fourier-transformed window that at the longest values entails an increasing number of samples) and the desired frequency resolution, as well as between the heavy use of the max-hold detector to clean up the resulting spectrum and the preservation of the shape for later interpretation. [38].
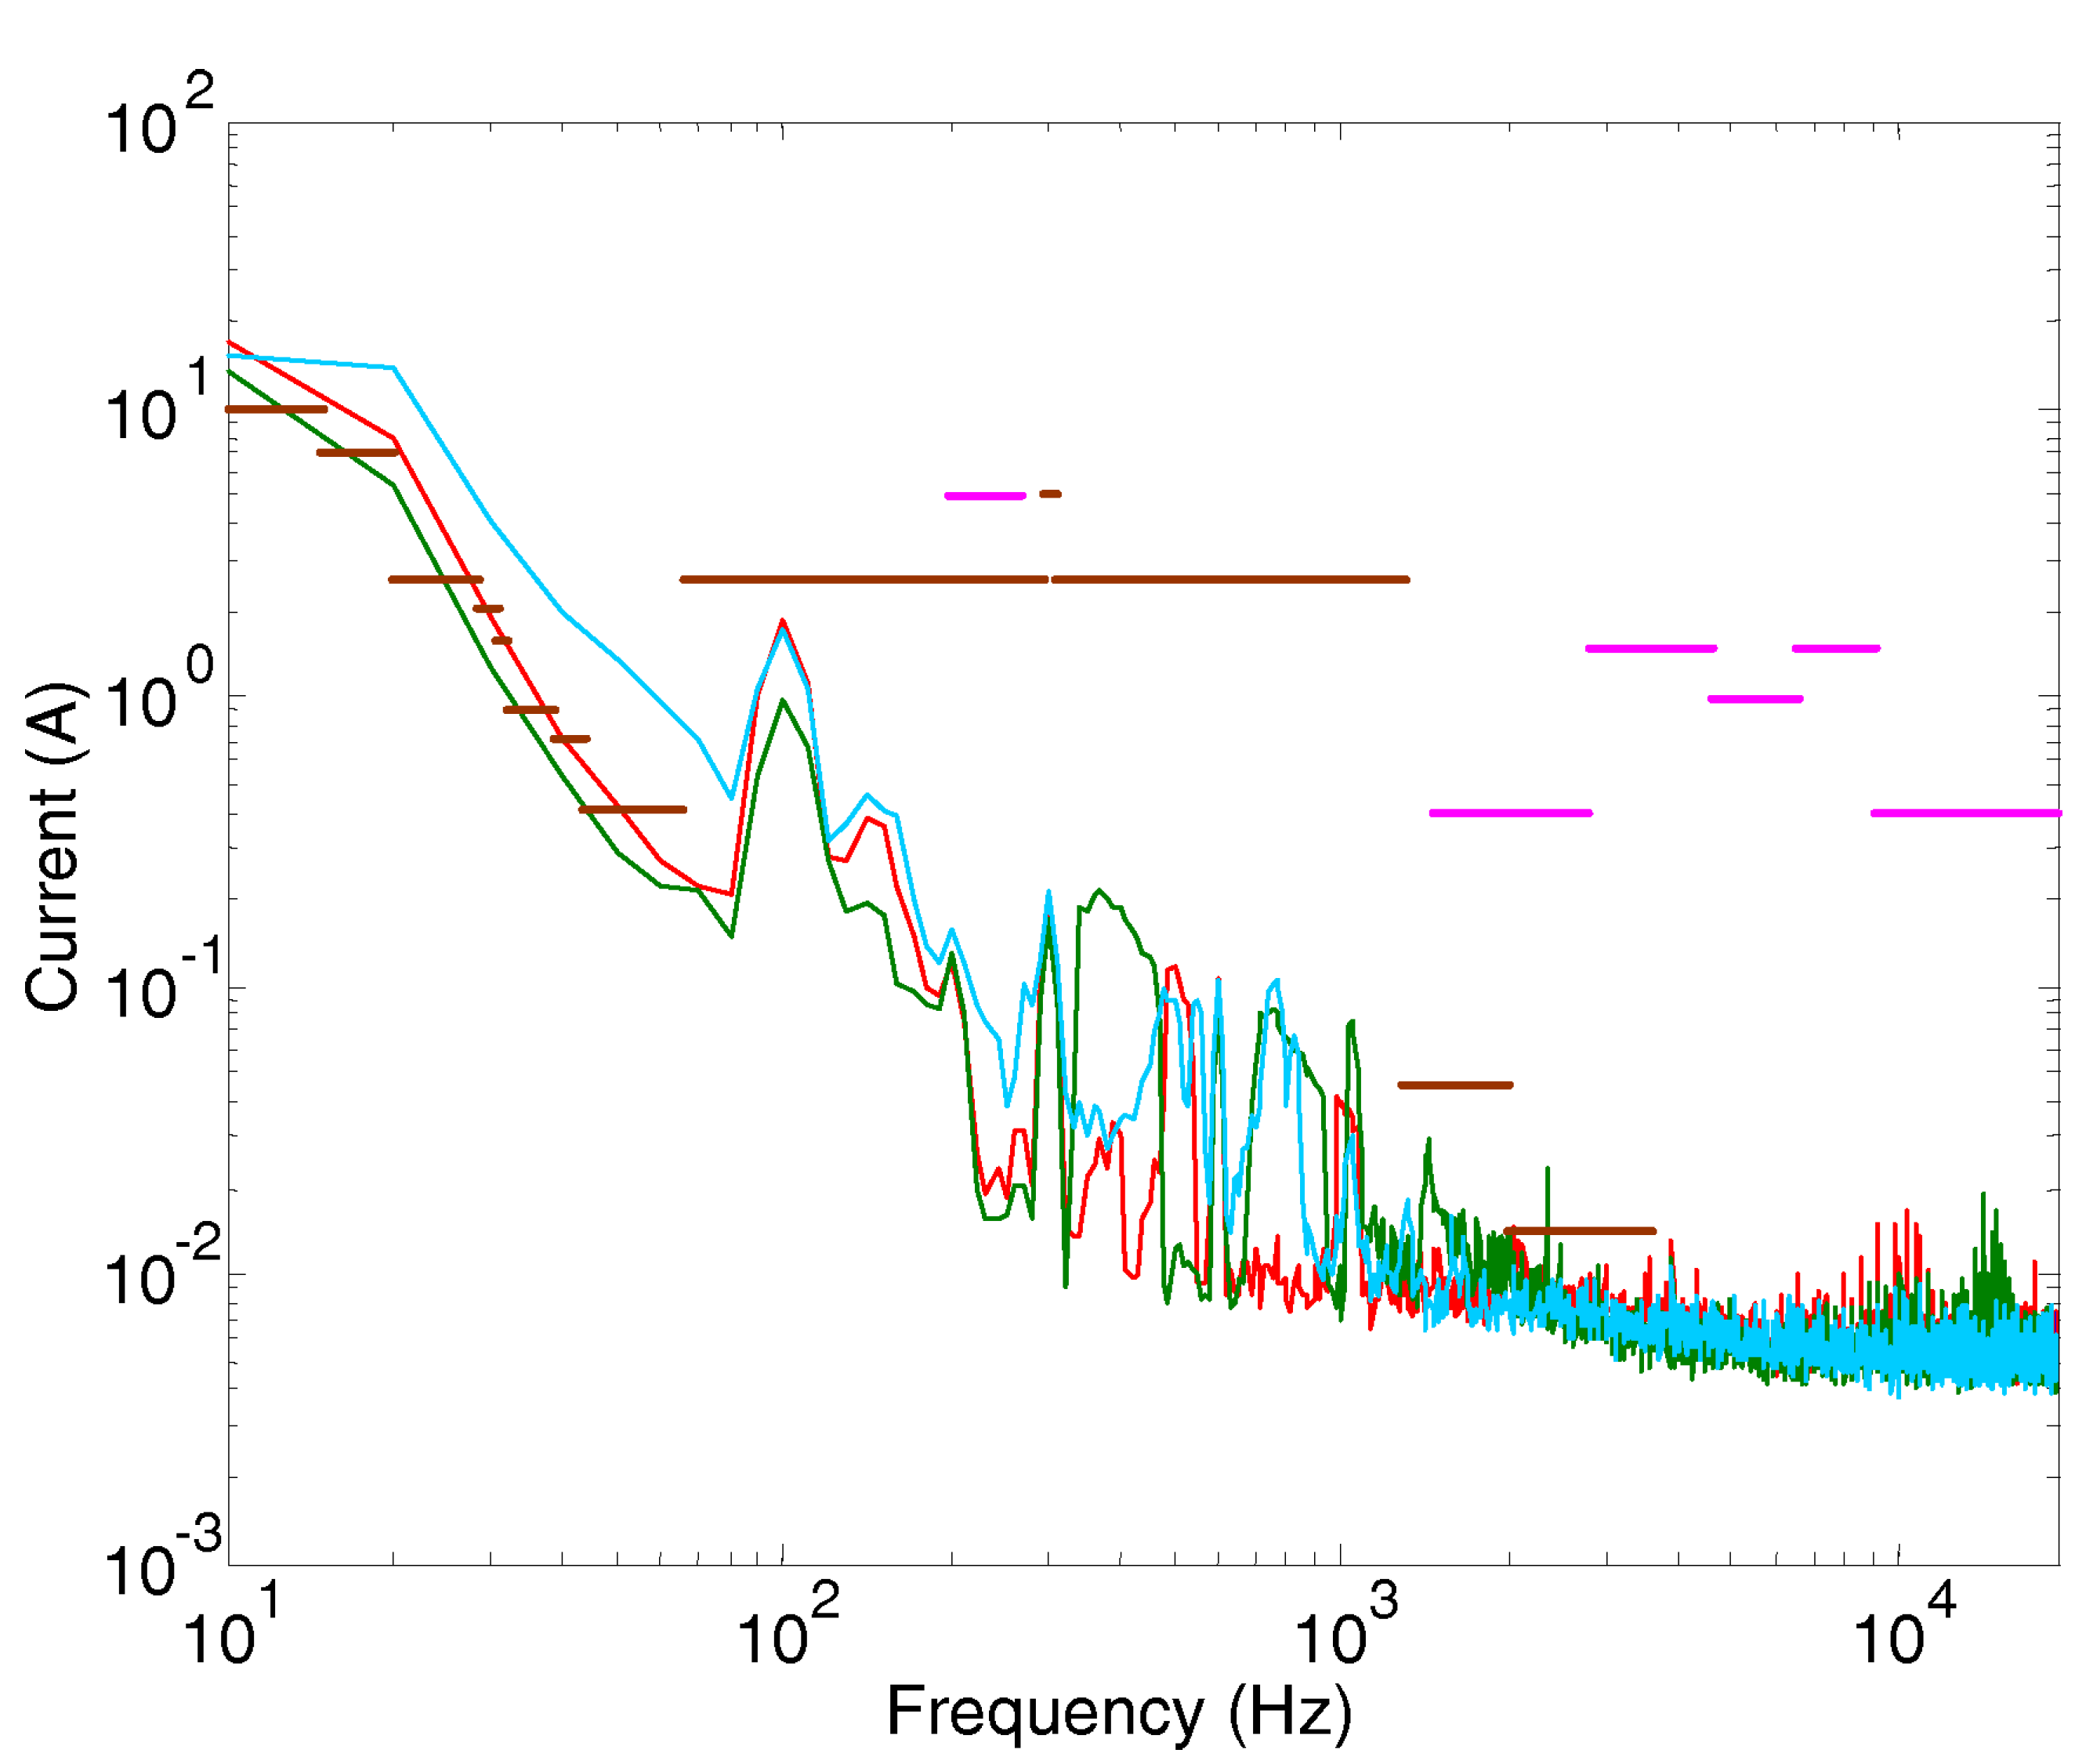
A closer look at the dispersion of the spectral components is provided in Figure 7, where both the standard deviation and the normalized standard deviation of are shown for two different choices of the transformation window ( 20 ms and 100 ms), leading to a different number of windows in a recording window , namely 19 and 3, respectively.
The two choices for ( 20 ms and 100 ms) result, respectively, in a coarser and finer frequency resolution, but at the same time in more and less averaged terms over one recording window and thus better and poorer dispersion values Theoretically, the estimated sample variance improves by the ratio of the two, so roughly a factor of 6, and the dispersion its square root. This is true, but does not take into account the different frequency resolution, where at and the number of collected spectral components in one frequency bin is larger and reach a greater deal of compensation, although such frequency resolution does not allow to distinguish for example the substation component at 300 Hz and the chopper component at 270 Hz, and is thus not commonly used.
Looking at the resulting values of dispersion, the 20 ms case provides an approximately 3 times smaller dispersion, as expected. Both window selections cannot avoid the spectral leakage due to the low-frequency oscillations, for which dispersion up to about 300 Hz is quite large: this is a better indicator of this form of spectral leakage, rather than inspecting directly the resulting spectra. Curiously the light brown 20 ms curve show a higher first value than the corresponding one of the light blue curve for 100 ms: this is easily explained considering that this is the first frequency bin at 50 Hz for the 20 ms case and for this reason collects all the low-frequency instability, that in the light blue curve is distributed over 5 frequency bins (spaced by 10 Hz).
If we consider the portion of the spectrum not significantly affected by spectral leakage (that means above 100Hz–200Hz), the observed dispersion in the two cases is in the order of 0.1Apk–0.2Apk for the 20 ms window, whereas it is up to about 1 Apk for the 100 ms. It is also remarkable that the 100 ms case shows some peaks of dispersion at both the characteristic frequencies of the substation (at 300 Hz and 600 Hz) and at those of the power conversion (around 500 Hz, 1000 Hz and 2000 Hz).
The darker curves indicate the normalized dispersion (as dispersion divided by the mean ) that is unit-less and easier to use and compare. The side effect is that at some spectral components a large mean value may hide a large dispersion, but this is known and implicit in the normalization operation.
4.3. Behavior at Different Operating Conditions
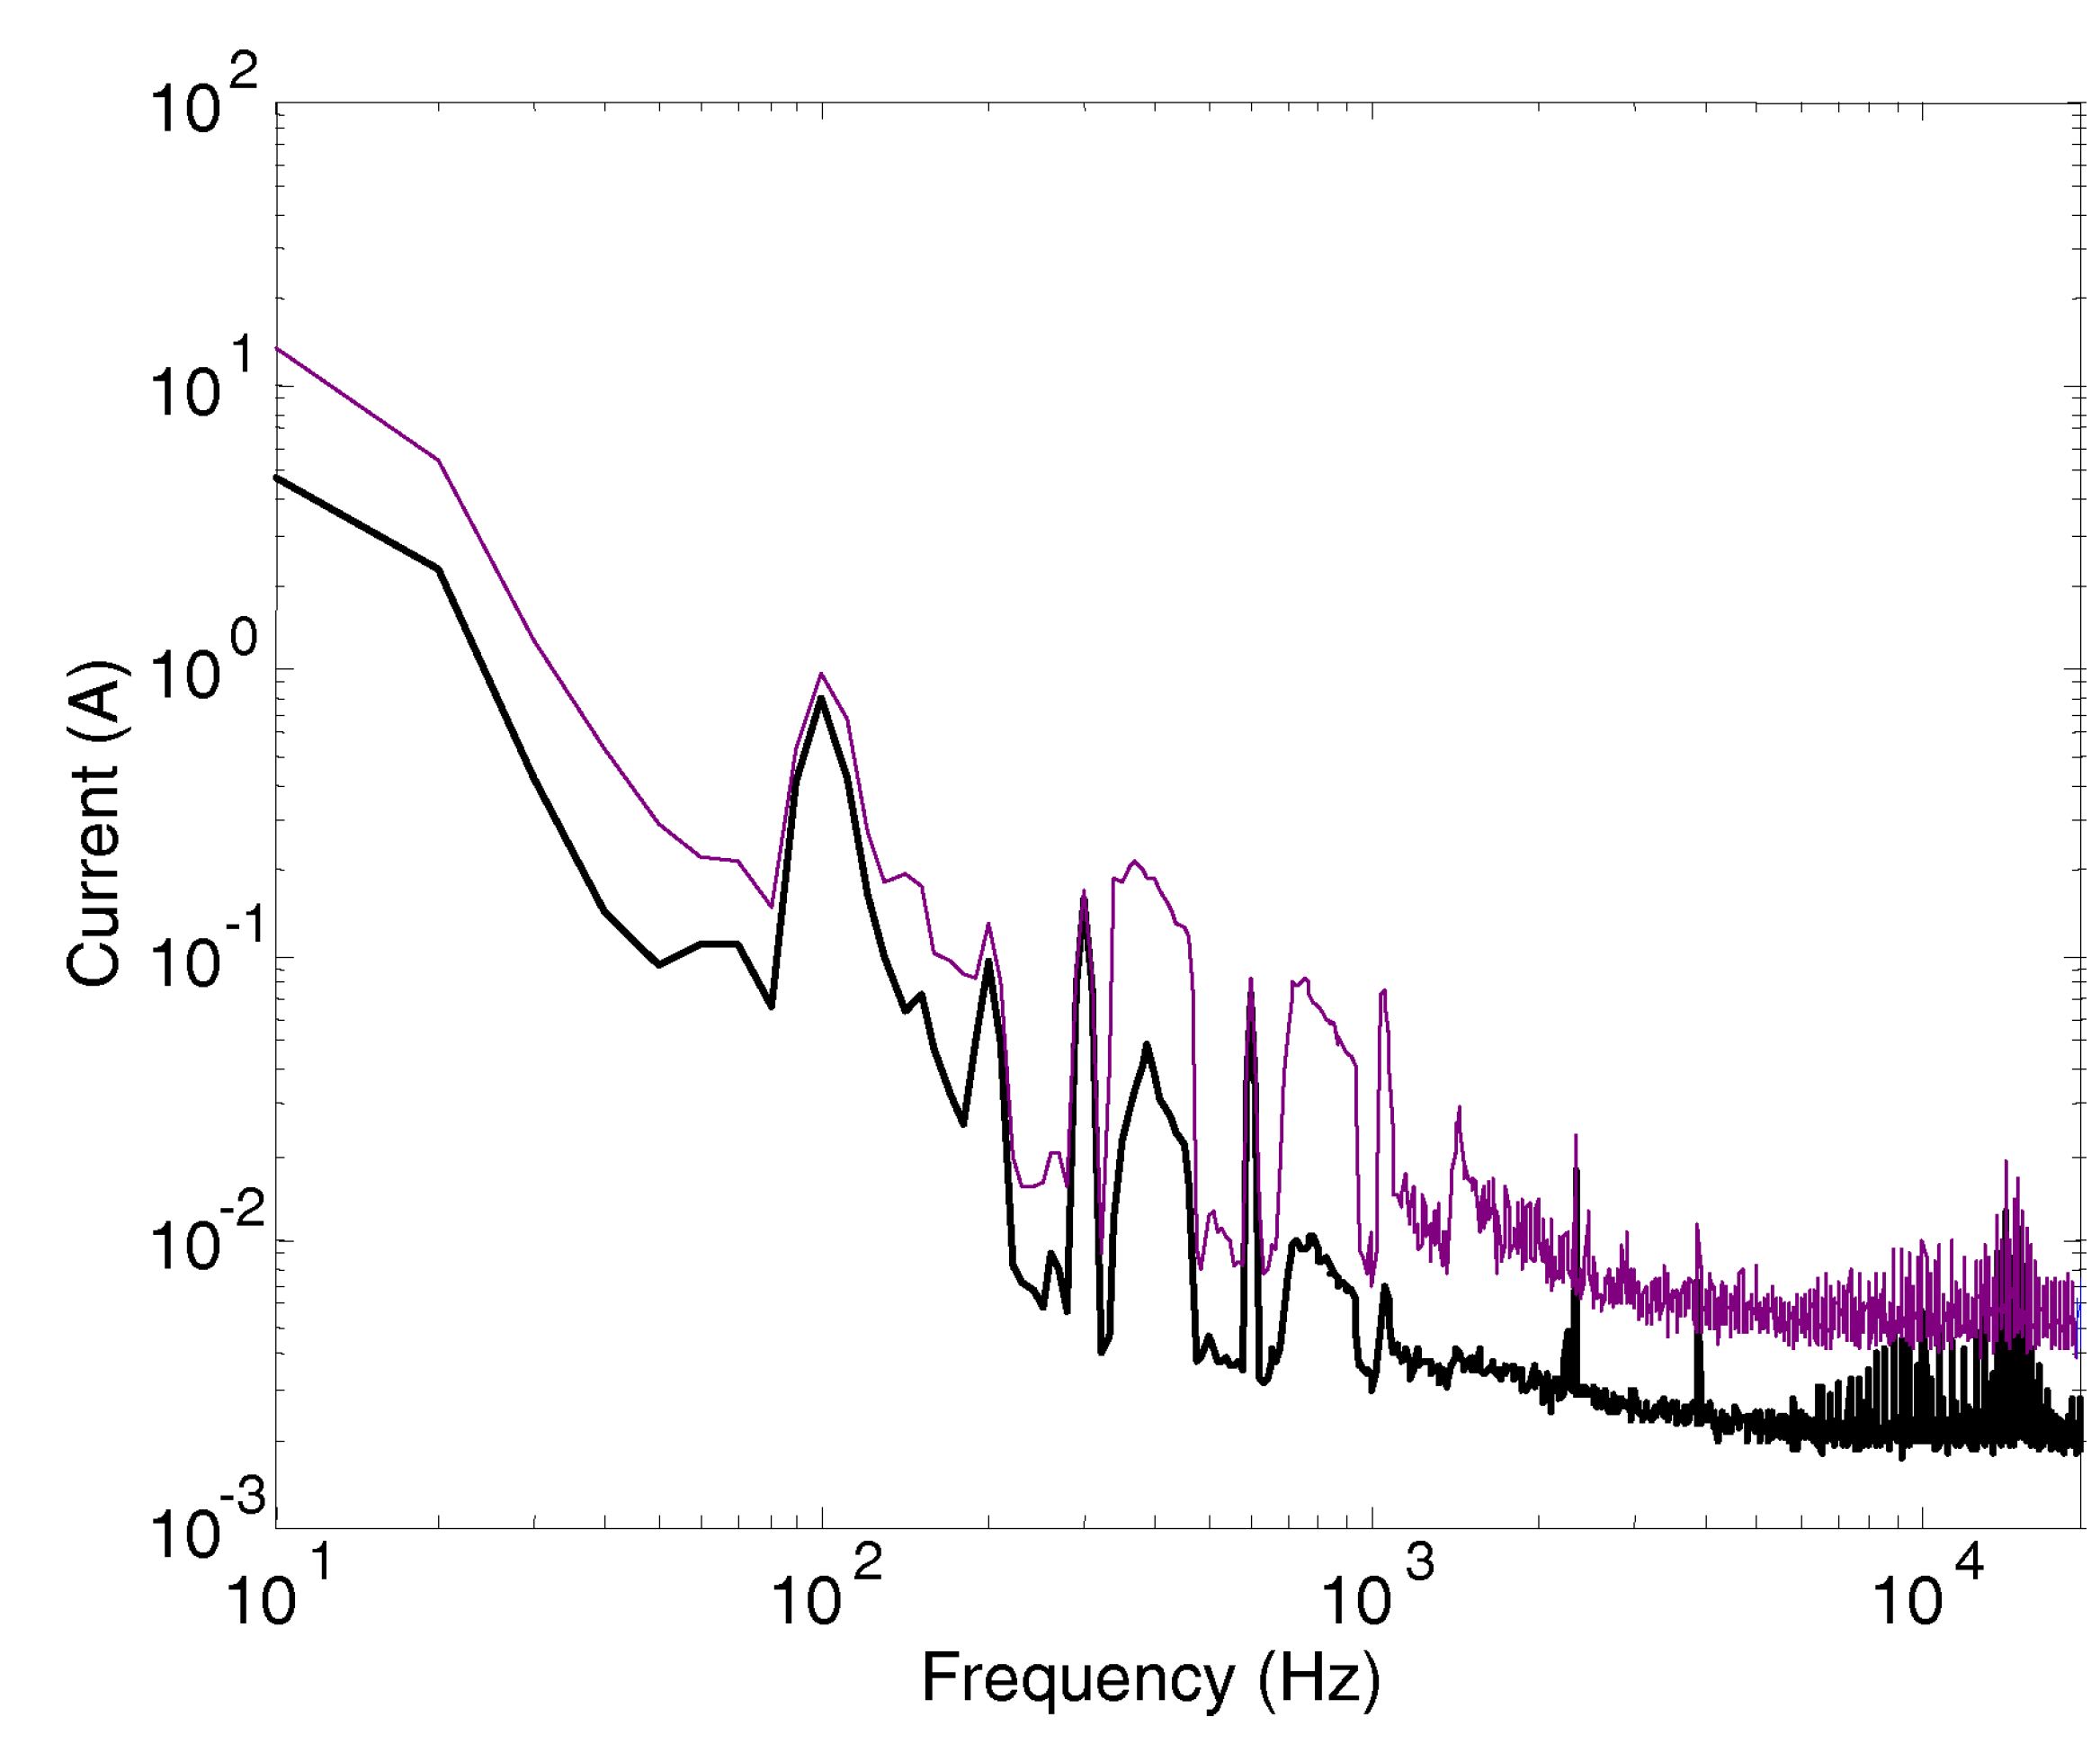
The measurements at standstill of Figure 8 show the background distortion caused by the TPS at 300 Hz and its multiples and the 100 Hz component caused by a 2nd harmonic at the rectifier output exciting the resonance filter of the TPS LC filter. In addition there can be recognized the 270 Hz component of the on-board chopper and its 2nd harmonic (before the TPS characteristic component at 600 Hz). It may be observed that all components are quite stable and that the max hold value (violet) is practically the same of the average value. The frequency interval below about 80 Hz shows the result of on-board filter oscillations and slow transients.
The visible separation between the violet and black curves in the intervals featuring small values at the bottom of the curves is simply due to background and FFT numerical noise and is not relevant to the assessment of interference, although the difference is significant between the max-hold and the background curves.
The tests performed in coasting conditions show that the TPS-related components have unaltered amplitude and are quite stable and stationary, with the max-hold almost overlapped to the average curves (as shown in Figure 9).
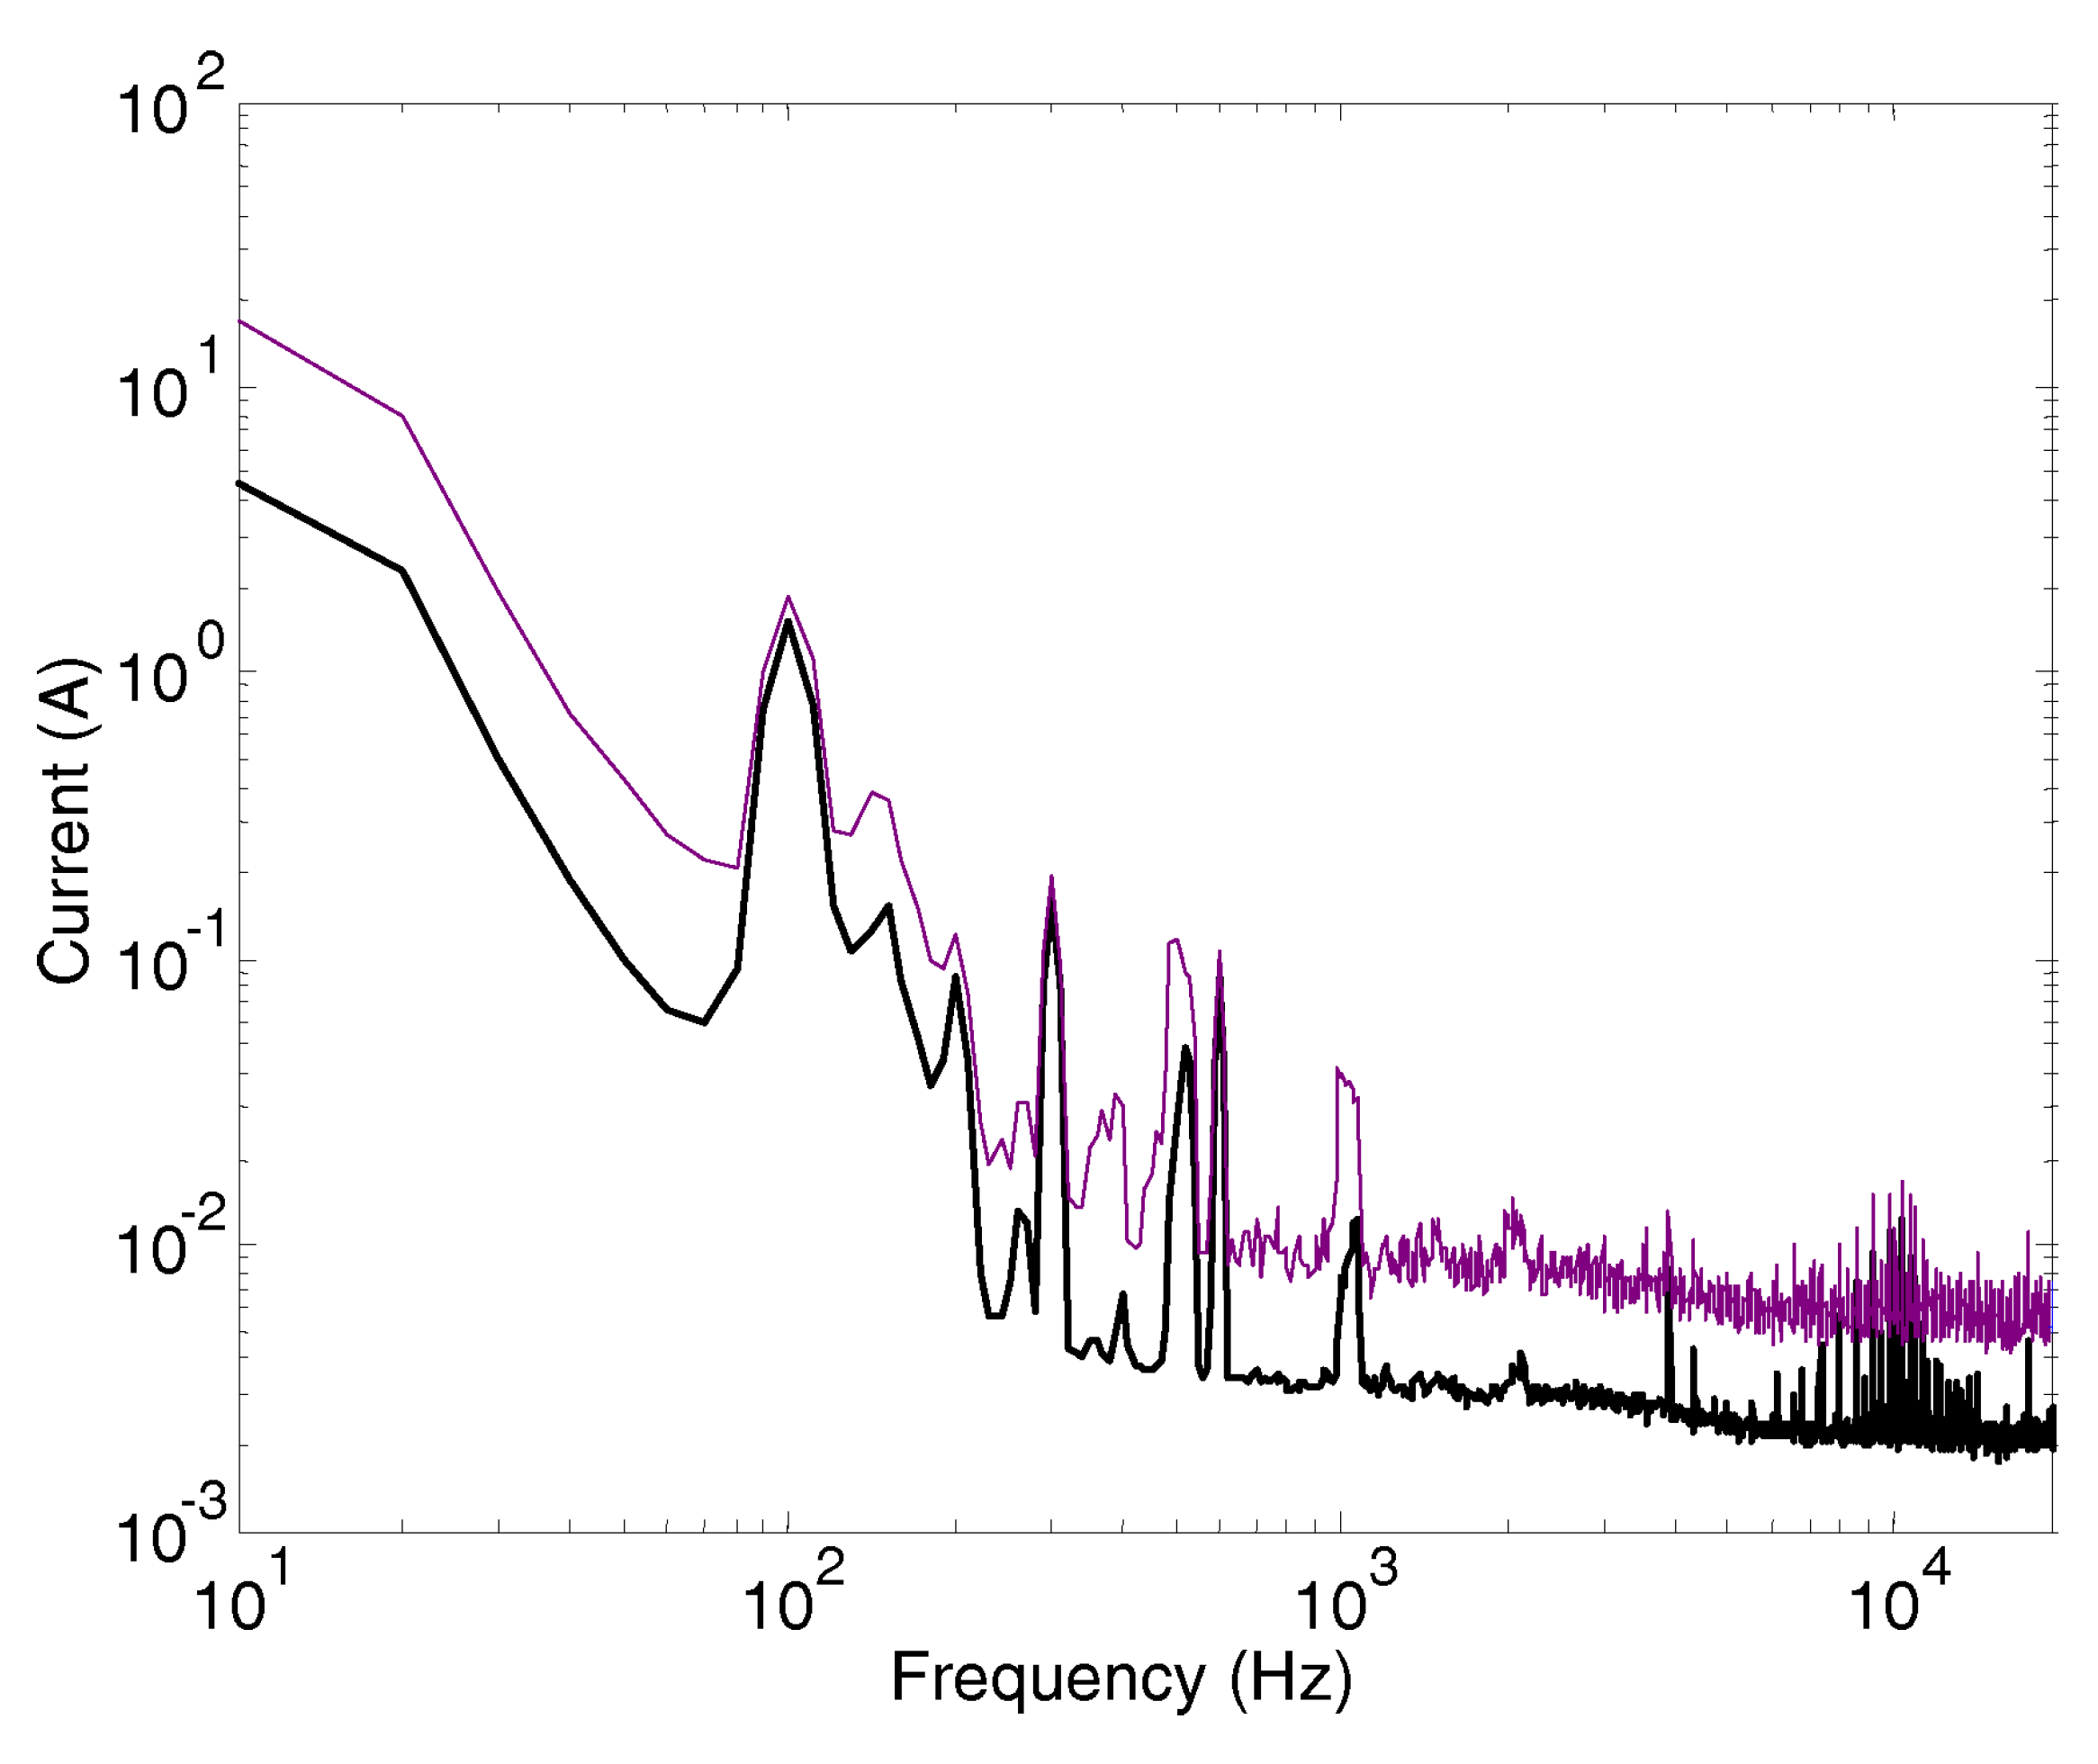
The cruising condition alternates moderate acceleration to coasting, and results in a mix of patterns coming from traction converters and auxiliaries. The traction converters are exploited at a fraction of the nominal power, so that unusual modulation conditions may occur. A pure acceleration condition does not normally “excites” such a broad range of spectral components and broad humps are generally not present (see for example Figure 10).
What can be observed in Figure 10 for the acceleration condition is that the TPS characteristic harmonics are slightly different if compared to Figure 8, with the 100 and 600 Hz components larger, but the 300 Hz smaller. This is not of course a consequence of the acceleration condition, but of the fact that the two recorded sequences are 8 minutes distant in time and that the locomotive has continued traveling on the line, ending to be supplied under a different TPS.
Braking is usually one of the most critical OCs for emissions, as the braking chopper has a variable modulation while tracking the catenary voltage. The results of one test run spanning about 15 s are shown in Figure 8. Components around 400 and 800 Hz show a significant dynamicity with an increase of a factor 5-10 with respect to the standstill test. The shape of the spectrum is weird like a big hump with steep sides as the max hold profile is obtained keeping all maxima, even if occurring at different time intervals over the recording time of about 15 s.
Figure 11.
Braking condition starting at 110 down to about 60 km/h in full configuration: average (black) and max hold (violet) curves.
Figure 11.
Braking condition starting at 110 down to about 60 km/h in full configuration: average (black) and max hold (violet) curves.
4.4. Comparison with Limits
As the final step of the compliance verification process, emissions must be compared with the limits in force in the country or on the infrastructure in which the RS is going to operate. The direct comparison of the max-hold results for the three considered OCs is shown below in Figure 12.
Although visually the recorded RS emissions are much lower than the limits, there are two areas of concern that deserve a comment.
At high frequency, at about kHz in braking conditions a spectrum component is clearly above the limit. It is one of the high-order harmonics of the chopper switching frequency and it is possible to note in Figure 11 that the average value is much lower than the maximum. This is one example of max-hold analysis that does not reflect the real distortion and possible interference; for this reason the limits of the FS96 are accompanied by a statistical evaluation, and high values are tolerated provided that they occur seldom (as it was in the present case, with an overall positive result of the homologation).
Second, the low-frequency interval is characterized by large values as caused by the onboard filter transient oscillations and affected by a significant spectral leakage. The phenomenon is more pronounced during coasting/cruising, when the absorbed power is low and frequent small adjustments of the speed are applied by the driver. In this case the transients are usually discarded and in any case they occur in a small fraction of the overall test duration.
5. Conclusion
The paper has evaluated quantitatively the variability and uncertainty of measured conducted emissions of rolling stock for assessment of compliance to limits of interference to signaling. Of the various types of signaling devices, track circuits are those affected by the most intense low-frequency components of the return current leaving the rolling stock back to the traction power station.
The examined case is that of a DC locomotive whose main spectral signatures are the front-end chopper switching frequency and harmonics, some leakage of spectral components of the converters downstream (e.g. traction and auxiliary converters), and the slower transients of the input LC filter (polluting the lowest part of the spectrum with significant spectral leakage caused by the low damping and long settling time of the filter). Such transients are peculiar of DC traction supply systems.
From the point of view of assessing the compatibility of the rolling stock under test against a wide range of signaling devices (such as power-frequency and audio-frequency track circuits), the sources of variability are many at various steps of the process.
- First of all the frequency response of the track and the distribution of the return current may vary for the various types of tracks and catenary power lines in a whole country. Such variability is covered by the choice of margins made by the regulatory body when determining the limits for the return current assigned to the single unit undergoing the homologation tests.
- The variability during the tests of the specific rolling stock unit, then, is caused most of all by the variable operating conditions (tractioning, braking, cruising, coasting, etc. at different power levels).
- Additional variability is caused by the spectral leakage resulting from the onboard filter oscillations that is unavoidable and may be addressed only selecting short transformation windows in the order of 20 ms, of course establishing then a fundamental component of the analysis at 50 Hz (by the way adequate for all track circuits to our knowledge).
- A fourth element influencing the result is the way the data are processed and compared to the limits, having shown that an over-cautious max-hold approach leads not only too pessimistic conclusions, but also affects the spectrum shape, so that it is more difficult to identify the origin and time-behavior of specific spectral components.
The evaluated dispersion for the spectral components not significantly affected by spectral leakage (so above some hundreds Hz) is in the order of 0.1Apk–0.2Apk when choosing a 20 ms window, whereas it increases to about 1 Apk if 100 ms are chosen, with occasional peaks for some spectral components. Normalizing such dispersion by the mean value provides more stable values and a unit-less expression of dispersion.
Since the observed variability measured as dispersion is always significant, even in nominally constant operating conditions, a robust approach to the evaluation of compliance with limits is advisable as the operational uncertainty is significantly large (as contrasted to the instrumental uncertainty, that amounts to a few %). A max-hold approach nevertheless is too cautious and may lead to spotting out some non-compliant cases where indeed there is no real risk of interference to the track circuits. From this it may be concluded that the statistical approach included in the FS96 specification [35] was well conceived although it requires a significant amount of experimental data to reach statistical significance.
Funding
This research received no external funding.
Institutional Review Board Statement
Not applicable.
Informed Consent Statement
Not applicable.
Conflicts of Interest
“The authors declare no conflict of interest.”
References
- EN 50121-3-1. Railway applications —Electromagnetic compatibility —Part 3-1: Rolling stock —Train andcomplete vehicle. CENELEC, Brussels, Belgium, 2017.
- Havryliuk, V.; Serdyuk, T. Distribution of harmonics of return traction current on feeder zone and evaluation of its influence on the work of rail circuits. 18th Intern. Wroclaw Symp. and Exhib. on Electromagnetic Compatibility;, 2006.
- Yuan, L.; Yang, Y.; Hernandez, A.; Shi, L. Novel Adaptive Peak Detection Method for Track Circuits Based on Encoded Transmissions. IEEE Sensors Journal 2018, 18, 6224–6234. [Google Scholar] [CrossRef]
- Olczykowski, Z.; Kozyra, J. Propagation of Disturbances Generated by DC Electric Traction. Energies 2022, 15, 6851. [Google Scholar] [CrossRef]
- Mariscotti, A.; Ruscelli, M.; Vanti, M. Modeling of Audiofrequency Track Circuits for Validation, Tuning, and Conducted Interference Prediction. IEEE Transactions on Intelligent Transportation Systems 2010, 11, 52–60. [Google Scholar] [CrossRef]
- Scalise, J. How Track Circuits Detect and Protect Trains. http://www.railwaysignalling.eu/wp-content/uploads/2014/11/How-track-circuits-detect-and-protect-trains.pdf , 2014. (accessed on 8 May 2024).
- Serdiuk, T.; Havryliuk, V.; Feliziani, M.; Serdiuk, K. Propagation of Harmonics of Return Traction Current in Rail lines. 2019 International Symposium on Electromagnetic Compatibility - EMC EUROPE. IEEE, 2019. [CrossRef]
- Ferrari, P.; Mariscotti, A.; Pozzobon, P. Reference curves of the pantograph impedance in DC railway systems. IEEE International Symposium on Circuits and Systems, 2000. [CrossRef]
- Huang, W.; He, Z.; He, Z.; Hu, H.; Wang, Q. Study on Distribution Coefficient of Traction Return Current in High-Speed Railway. Energy and Power Engineering 2013, 05, 1253–1258. [Google Scholar] [CrossRef]
- Zhao, B.; Ou, J.; Wang, D. Calculation Of Rail Impedance Of Track Circuit Considering Earth Stratification. Journal of Applied Science and Engineering 2022, 26, 197–205. [Google Scholar] [CrossRef]
- Mariscotti, A. Impact of rail impedance intrinsic variability on railway system operation, EMC and safety. International Journal of Electrical and Computer Engineering (IJECE) 2021, 11, 17. [Google Scholar] [CrossRef]
- Li, T.; Wu, M.; He, F.; Song, K. Finite element calculation of leakage resistance and distributed capacitance of rail to earth in ballastless track. Intern. Conf. on Power System Transients;, 2013.
- Mariscotti, A.; Pozzobon, P. Experimental Results on Low Rail-to-Rail Conductance Values. IEEE Transactions on Vehicular Technology 2005, 54, 1219–1222. [Google Scholar] [CrossRef]
- CLC/TS 50238-2. Railway applications —Compatibility between rolling stock and train detection systems —Part 2: Compatibility with track circuits. CENELEC, Brussels, Belgium, 2015.
- Zhang, J.; Yang, S.; Song, K.; Wang, Y.; Konstantinou, G.; Wu, M. Railway Signaling System Interference by Unbalanced Traction Harmonic Current: Mechanism, Modeling, and Solutions Based on Engineering Practice. IEEE Transactions on Transportation Electrification 2024, 10, 1850–1862. [Google Scholar] [CrossRef]
- Zhao, L.; Li, M. Probability Distribution Modeling of the Interference of the Traction Current in Track Circuits. Journal of Theoretical and Applied Information Technology 2012, 46, 125–131. [Google Scholar]
- Razghonov, S.; Kuznetsov, V.; Zvonarova, O.; Chernikov, D. Track circuits adjusting calculation method under current influence traction interference and electromagnetic compatibility. IOP Conference Series: Materials Science and Engineering 2020, 985, 012017. [Google Scholar] [CrossRef]
- EN 50617-1. Railway applications —Technical parameters of train detection systems for the interoperability of the trans-European railway system —Part 1: Track circuits. CENELEC, Brussels, Belgium, 2022.
- JCGM 100. Evaluation of measurement data —Guide to the expression of uncertainty in measurement. BIPM, Paris, France, 2008.
- Pendrill, L.R. Using measurement uncertainty in decision-making and conformity assessment. Metrologia 2014, 51, S206–S218. [Google Scholar] [CrossRef]
- Hanafy, A.M.; Hebala, O.M.; Hamad, M.S. Power Quality Issues in Traction Power Systems. 2021 22nd International Middle East Power Systems Conference (MEPCON). IEEE, 2021. [CrossRef]
- Bongiorno, J. Induced touch voltage in wayside cables of AC railways caused by traction supply transients. Electrical Engineering 2022, 105, 13–24. [Google Scholar] [CrossRef]
- Mariscotti, A. Characterization of Power Quality transient phenomena of DC railway traction supply. ACTA IMEKO 2012, 1, 26. [Google Scholar] [CrossRef]
- Mariscotti, A.; Giordano, D. Experimental Characterization of Pantograph Arcs and Transient Conducted Phenomena in DC Railways. ACTA IMEKO 2020, 9, 10. [Google Scholar] [CrossRef]
- Nicolae, P.M.; Nicolae, M.S.; Nicolae, I.D.; Netoiu, A. Overvoltages Induced in the Supplying Line by an Electric Railway Vehicle. IEEE International Joint EMC/SI/PI and EMC Europe Symposium, 2021. [CrossRef]
- Giordano, D.; Signorino, D.; Femine, A.D.; Gallo, D.; Cipolletta, G. Power Quality in DC railway systems. IEEE 11th International Workshop on Applied Measurements for Power Systems (AMPS). IEEE, 2021. [CrossRef]
- Steczek, M.; Chudzik, P.; Szelag, A. Combination of SHE- and SHM-PWM Techniques for VSI DC-Link Current Harmonics Control in Railway Applications. IEEE Transactions on Industrial Electronics 2017, 64, 7666–7678. [Google Scholar] [CrossRef]
- Yudhistira, Y.; Yoppy, Y.; Trivida, E.; Wahyu Wijanarko, T.A.; Nugroho, H.W.; Mandaris, D. Electromagnetic interference measurement for axle counters light rapid transit railway in Indonesia. International Journal of Electrical and Computer Engineering (IJECE) 2022, 12, 4632. [Google Scholar] [CrossRef]
- CLC/TS 50238-3. Railway applications —Compatibility between rolling stock and train detection systems —Part 3: Compatibility with axle counters. CENELEC, Brussels, Belgium, 2019.
- Mariscotti, A. Induced Voltage Calculation in Electric Traction Systems: Simplified Methods, Screening Factors, and Accuracy. IEEE Transactions on Intelligent Transportation Systems 2011, 12, 201–210. [Google Scholar] [CrossRef]
- Yang, L.; Hian, L.C.; Leong, L.W.; Chuan, K.O.M. Induced voltage study and measurement for communication system in railway. IEEE International Symposium on Electromagnetic Compatibility and 2018 IEEE Asia-Pacific Symposium on Electromagnetic Compatibility (EMC/APEMC). IEEE, 2018. [CrossRef]
- EN 50122-2. Railway applications —Fixed installations —Electrical safety, earthing and the return circuit —Part 2: Provisions against the effects of straycurrents caused by DC traction systems. CENELEC, Brussels, Belgium, 2022.
- Thurston, D.F. Broken Rail Detection: Practical Application of New Technology or Risk Mitigation Approaches. IEEE Vehicular Technology Magazine 2014, 9, 80–85. [Google Scholar] [CrossRef]
- Espinosa, F.; Hernandez, A.; Mazo, M.; Urena, J.; Perez, M.C.; Jimenez, J.A.; Fernandez, I.; Garcia, J.C.; Garcia, J.J. Detector of Electrical Discontinuity of Rails in Double-Track Railway Lines: Electronic System and Measurement Methodology. IEEE Transactions on Intelligent Transportation Systems 2017, 18, 743–755. [Google Scholar] [CrossRef]
- Ferrovie dello Stato. Specifica N. 37 0582 esp. 1.0, 1997.
- Salles, R.S.; de Oliveira, R.A.; Ronnberg, S.K.; Mariscotti, A. Analytics of Waveform Distortion Variations in Railway Pantograph Measurements by Deep Learning. IEEE Transactions on Instrumentation and Measurement 2022, 71, 1–11. [Google Scholar] [CrossRef]
- Salles, R.S.; Rönnberg, S.K. Review of Waveform Distortion Interactions Assessment in Railway Power Systems. Energies 2023, 16, 5411. [Google Scholar] [CrossRef]
- Mariscotti, A. Critical Review of EMC Standards for the Measurement of Radiated Electromagnetic Emissions from Transit Line and Rolling Stock. Energies 2021, 14, 759. [Google Scholar] [CrossRef]
Figure 1.
Hot- and cold-path transfer functions of rolling stock insisting on a track with track circuit and supplied, together with other traction units, from the catenary system [14].
Figure 1.
Hot- and cold-path transfer functions of rolling stock insisting on a track with track circuit and supplied, together with other traction units, from the catenary system [14].
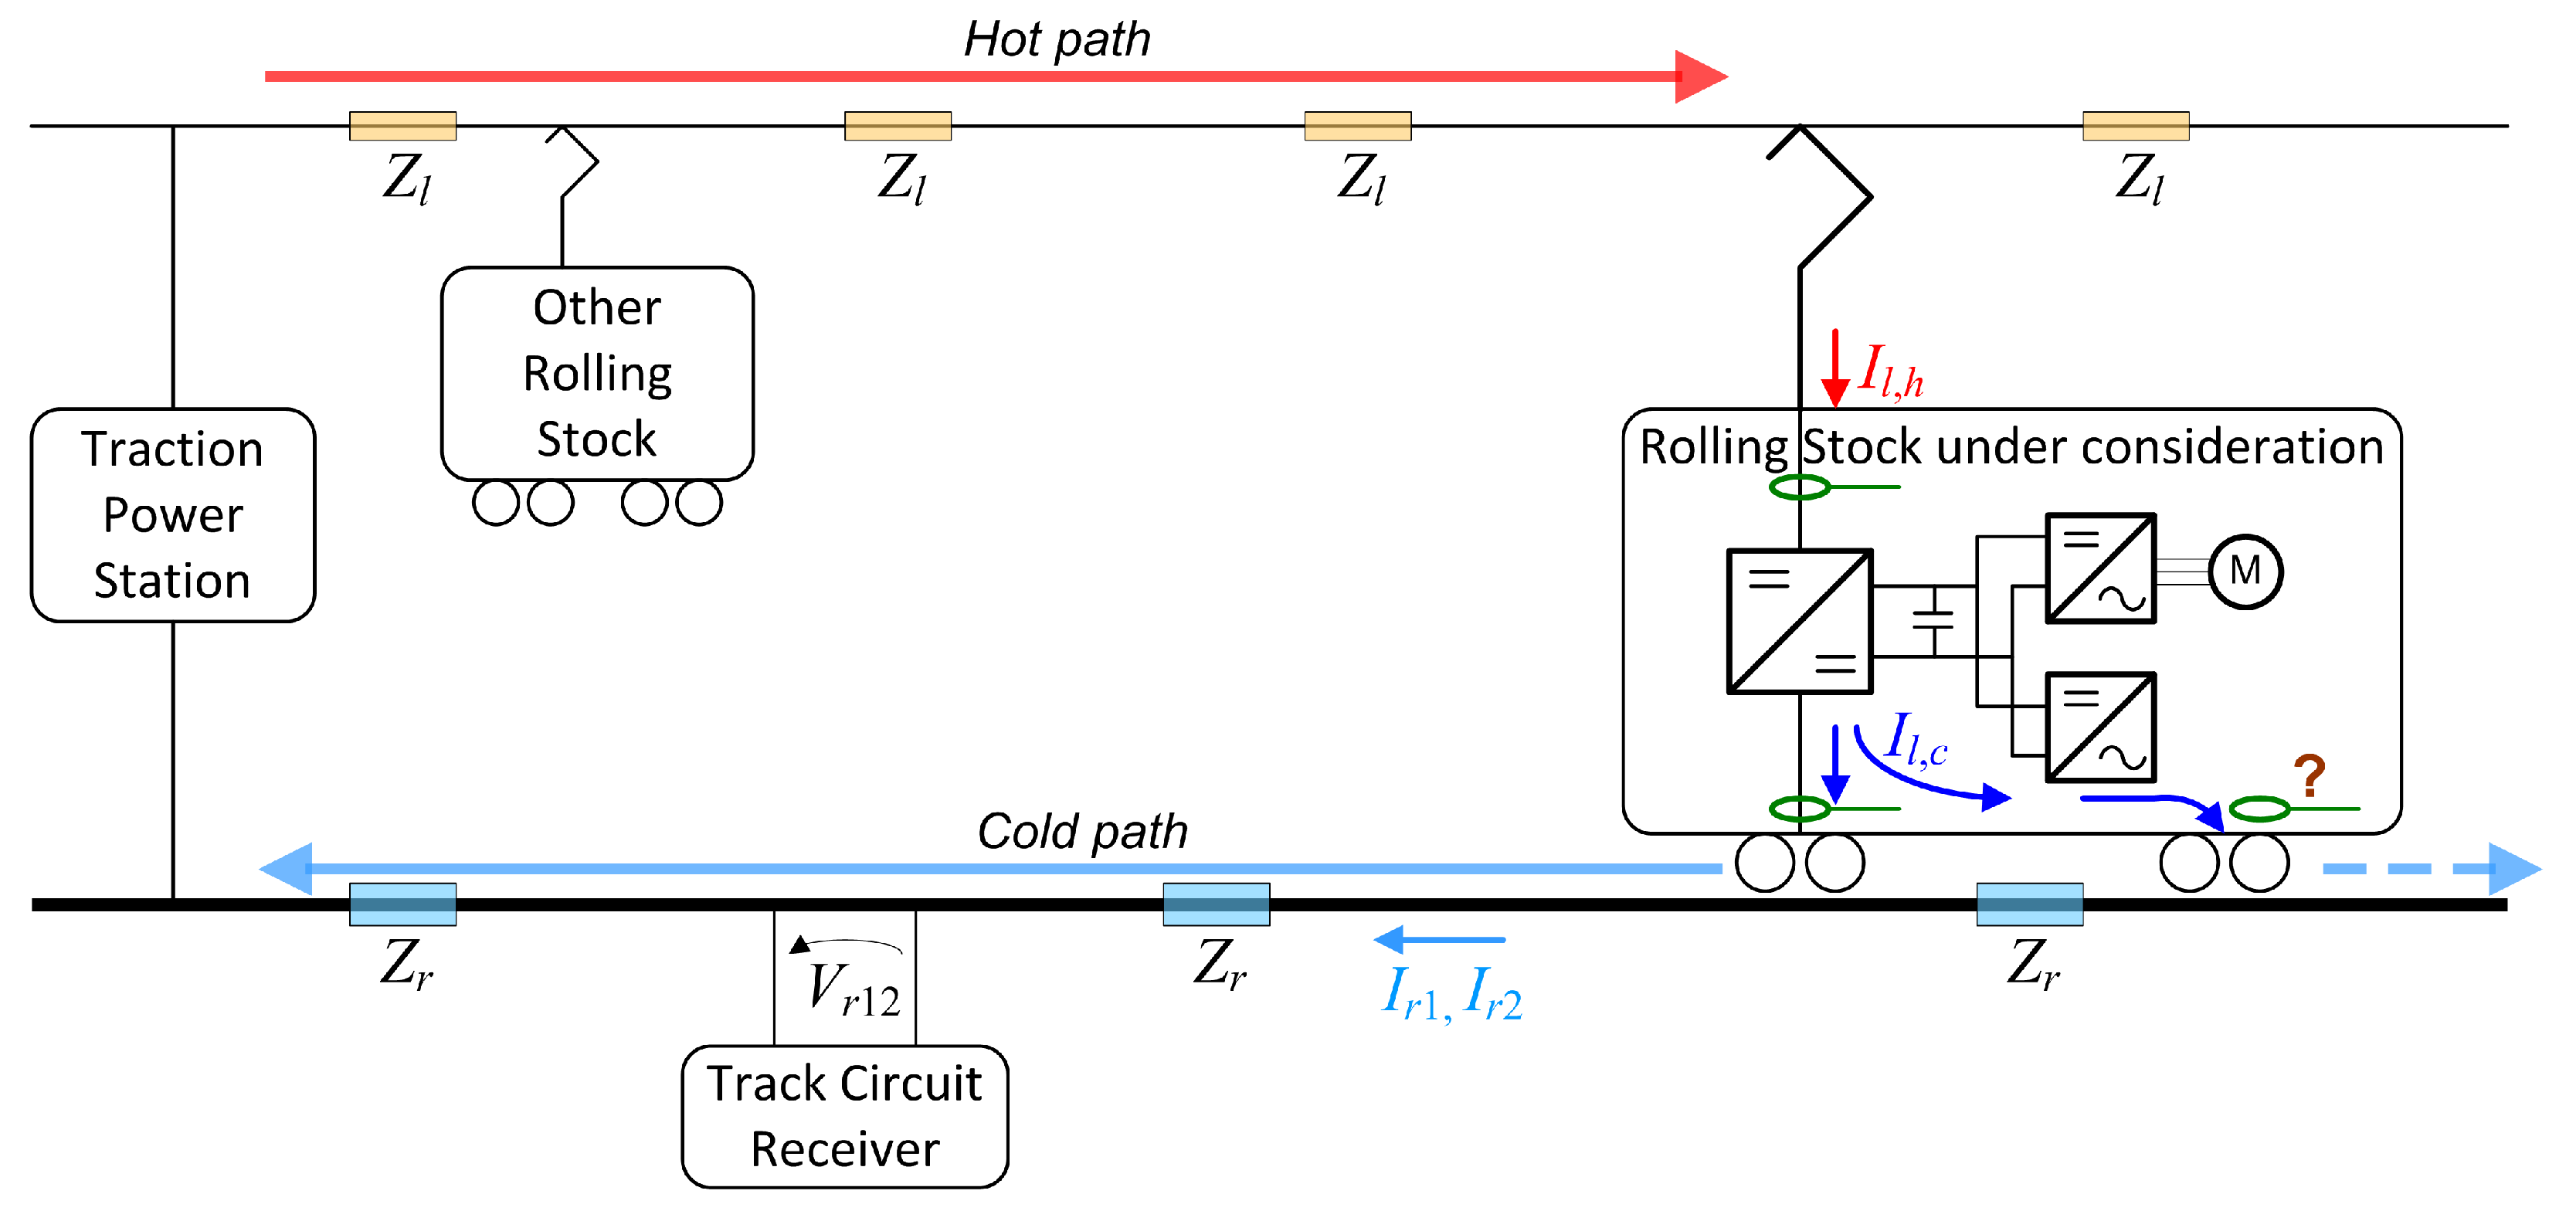
Figure 2.
Sketch of the power conversion systems onboard a DC locomotive: input LC filter, chopper, converter for auxiliaries (AUX), battery charger (B.C.) and traction inverter (INV) feeding the traction motors (M).
Figure 2.
Sketch of the power conversion systems onboard a DC locomotive: input LC filter, chopper, converter for auxiliaries (AUX), battery charger (B.C.) and traction inverter (INV) feeding the traction motors (M).
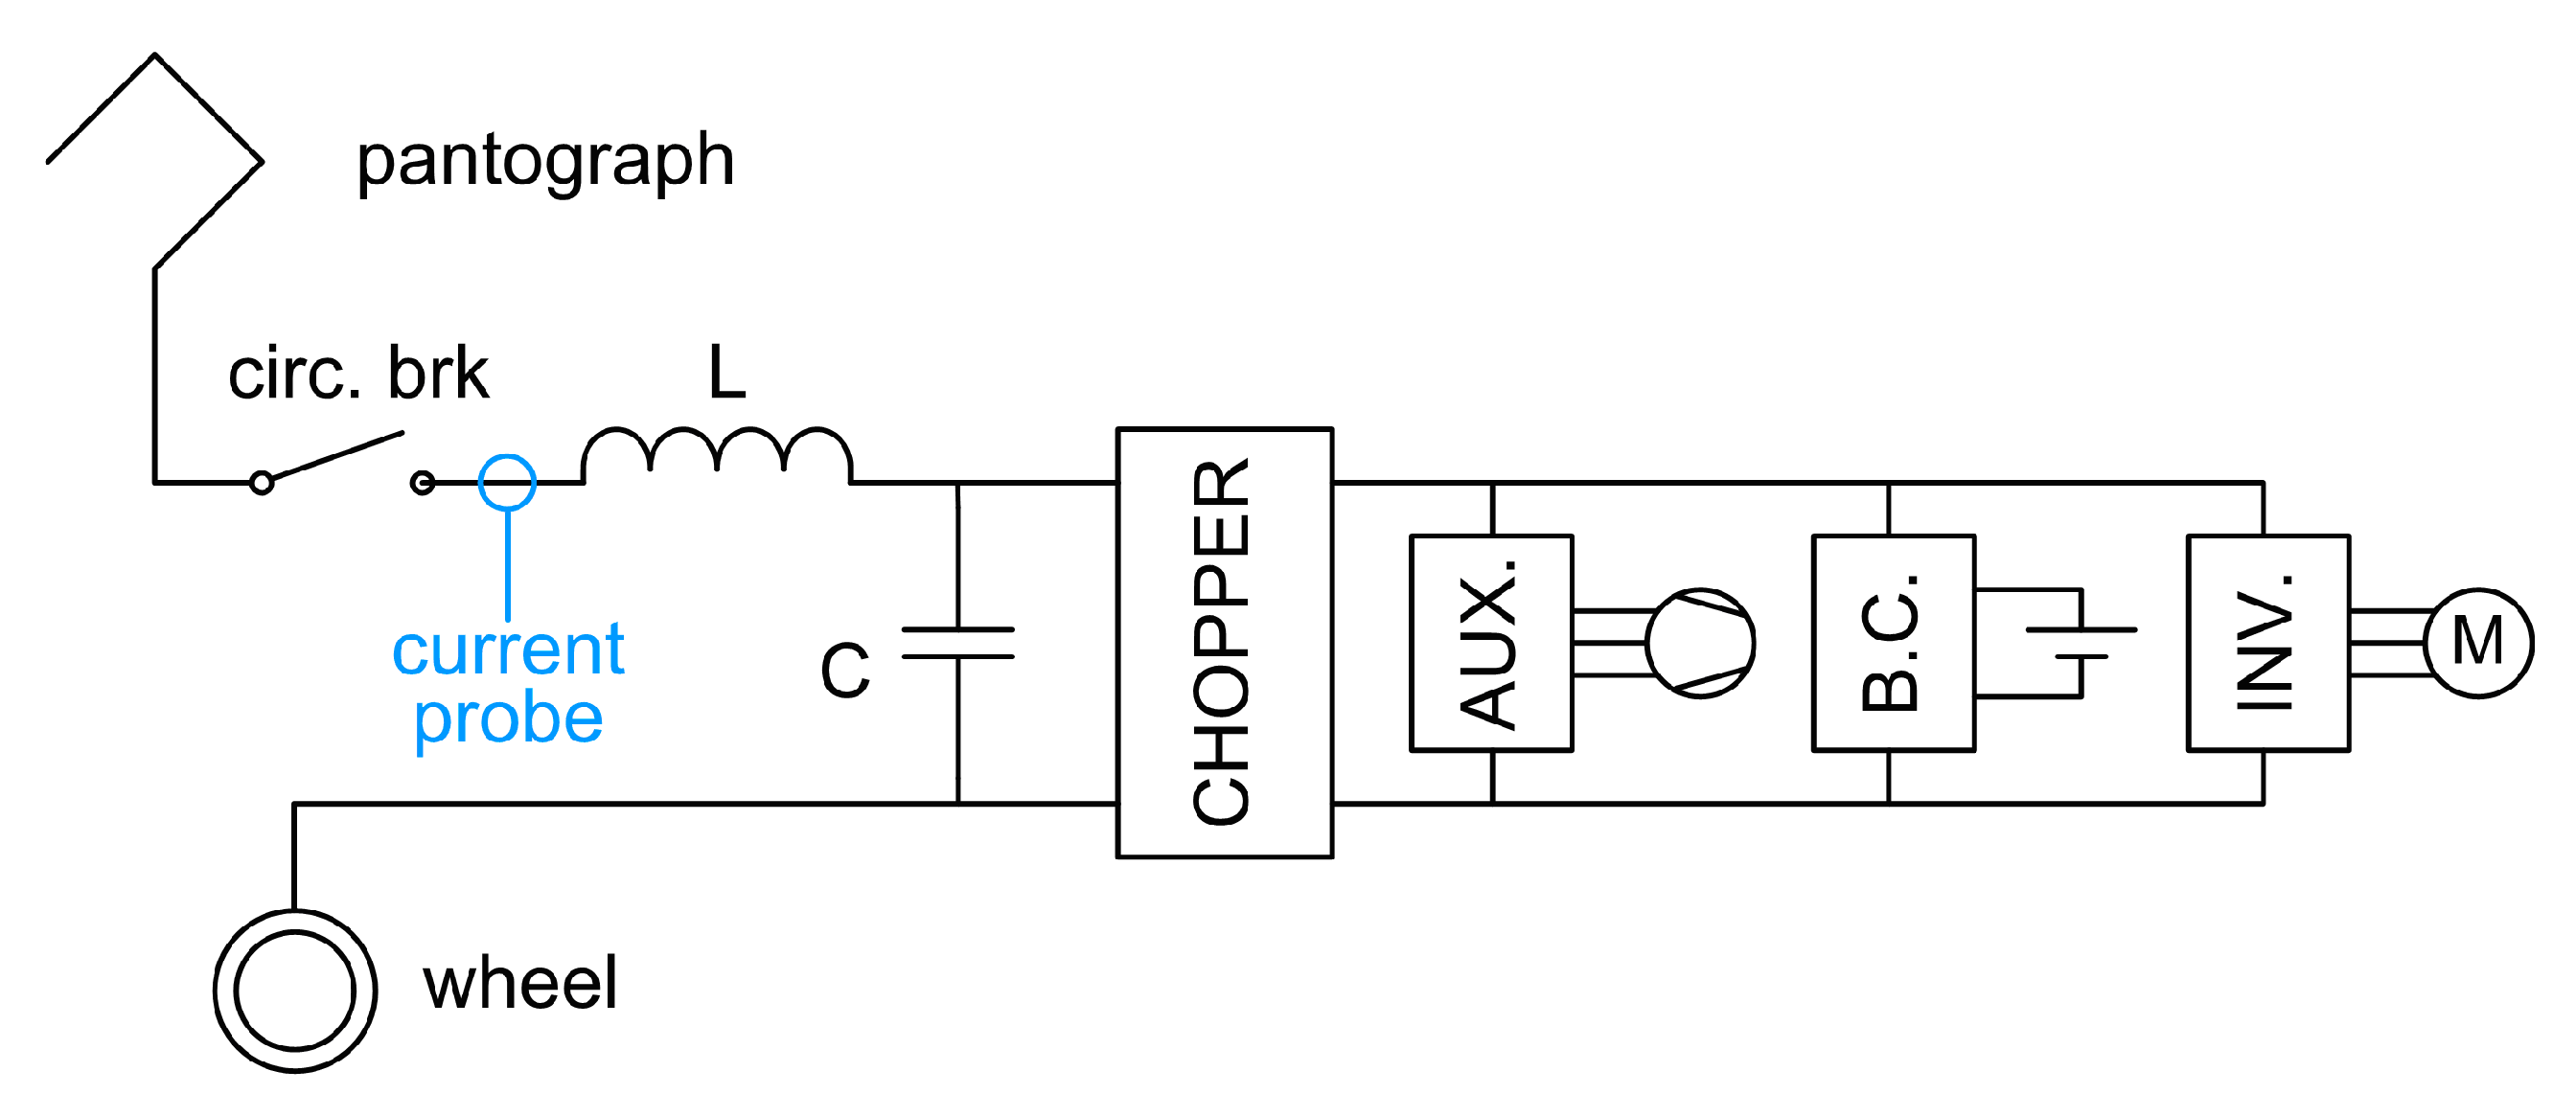
Figure 3.
Principle of operation of a PF TC requiring insulating rail joints (IRJs) and impedance bonds to electrically separate the different TC sections (here only one section “1” is shown), allowing at the same time the flow of the return current (in common mode). Transformer coupling ensures galvanic insulation; the signal at the receiver may be detected with a band-pass filter and rectification, or more complex circuits to achieve detection of amplitude and phase or frequency shift.
Figure 4.
Principle of operation of joint-less (above) and transformer coupled (below) AF TC with TX, RX and simplified coupling units (LC circuits). For the transformer coupled circuit the winding inductance may be sufficient and no additional inductor is needed (drawn in grey). Different TCs are electrically separated by operating at different center frequencies (, , ) on which resonant LC circuits are tuned. Residual current at frequency may still leak from TC “a” to the adjacent TCs “b” and “c” (not fully shown in the figure, only partially sketched in different colors, green and plum, respectively; they are identical to “a” and cover the left and right hand sections of the track).
Figure 5.
Snapshots of the pantograph current showing large LC filter oscillatory transients, chopper ripple almost overlapped to the substation 300 Hz component (as it will be discussed in Section 4.3 below), and some high-frequency ripple. The two top snapshots refer to the end of the traction phase, whereas the two bottom snapshots were taken during the largest current absorption in the middle of the acceleration phase.
Figure 7.
Calculation of the dispersion of the spectral components of for a recording sequence of about 10 s in traction OC for two selections of the transformation window , namely (in brown) and (in blue). The sample dispersion is the top curve in light color and normalized sample dispersion is the bottom curve in darker color.
Figure 8.
Standstill condition in full configuration as measurement of background noise and normal minimal variability: average (black) and max hold (violet) curves.
Figure 8.
Standstill condition in full configuration as measurement of background noise and normal minimal variability: average (black) and max hold (violet) curves.
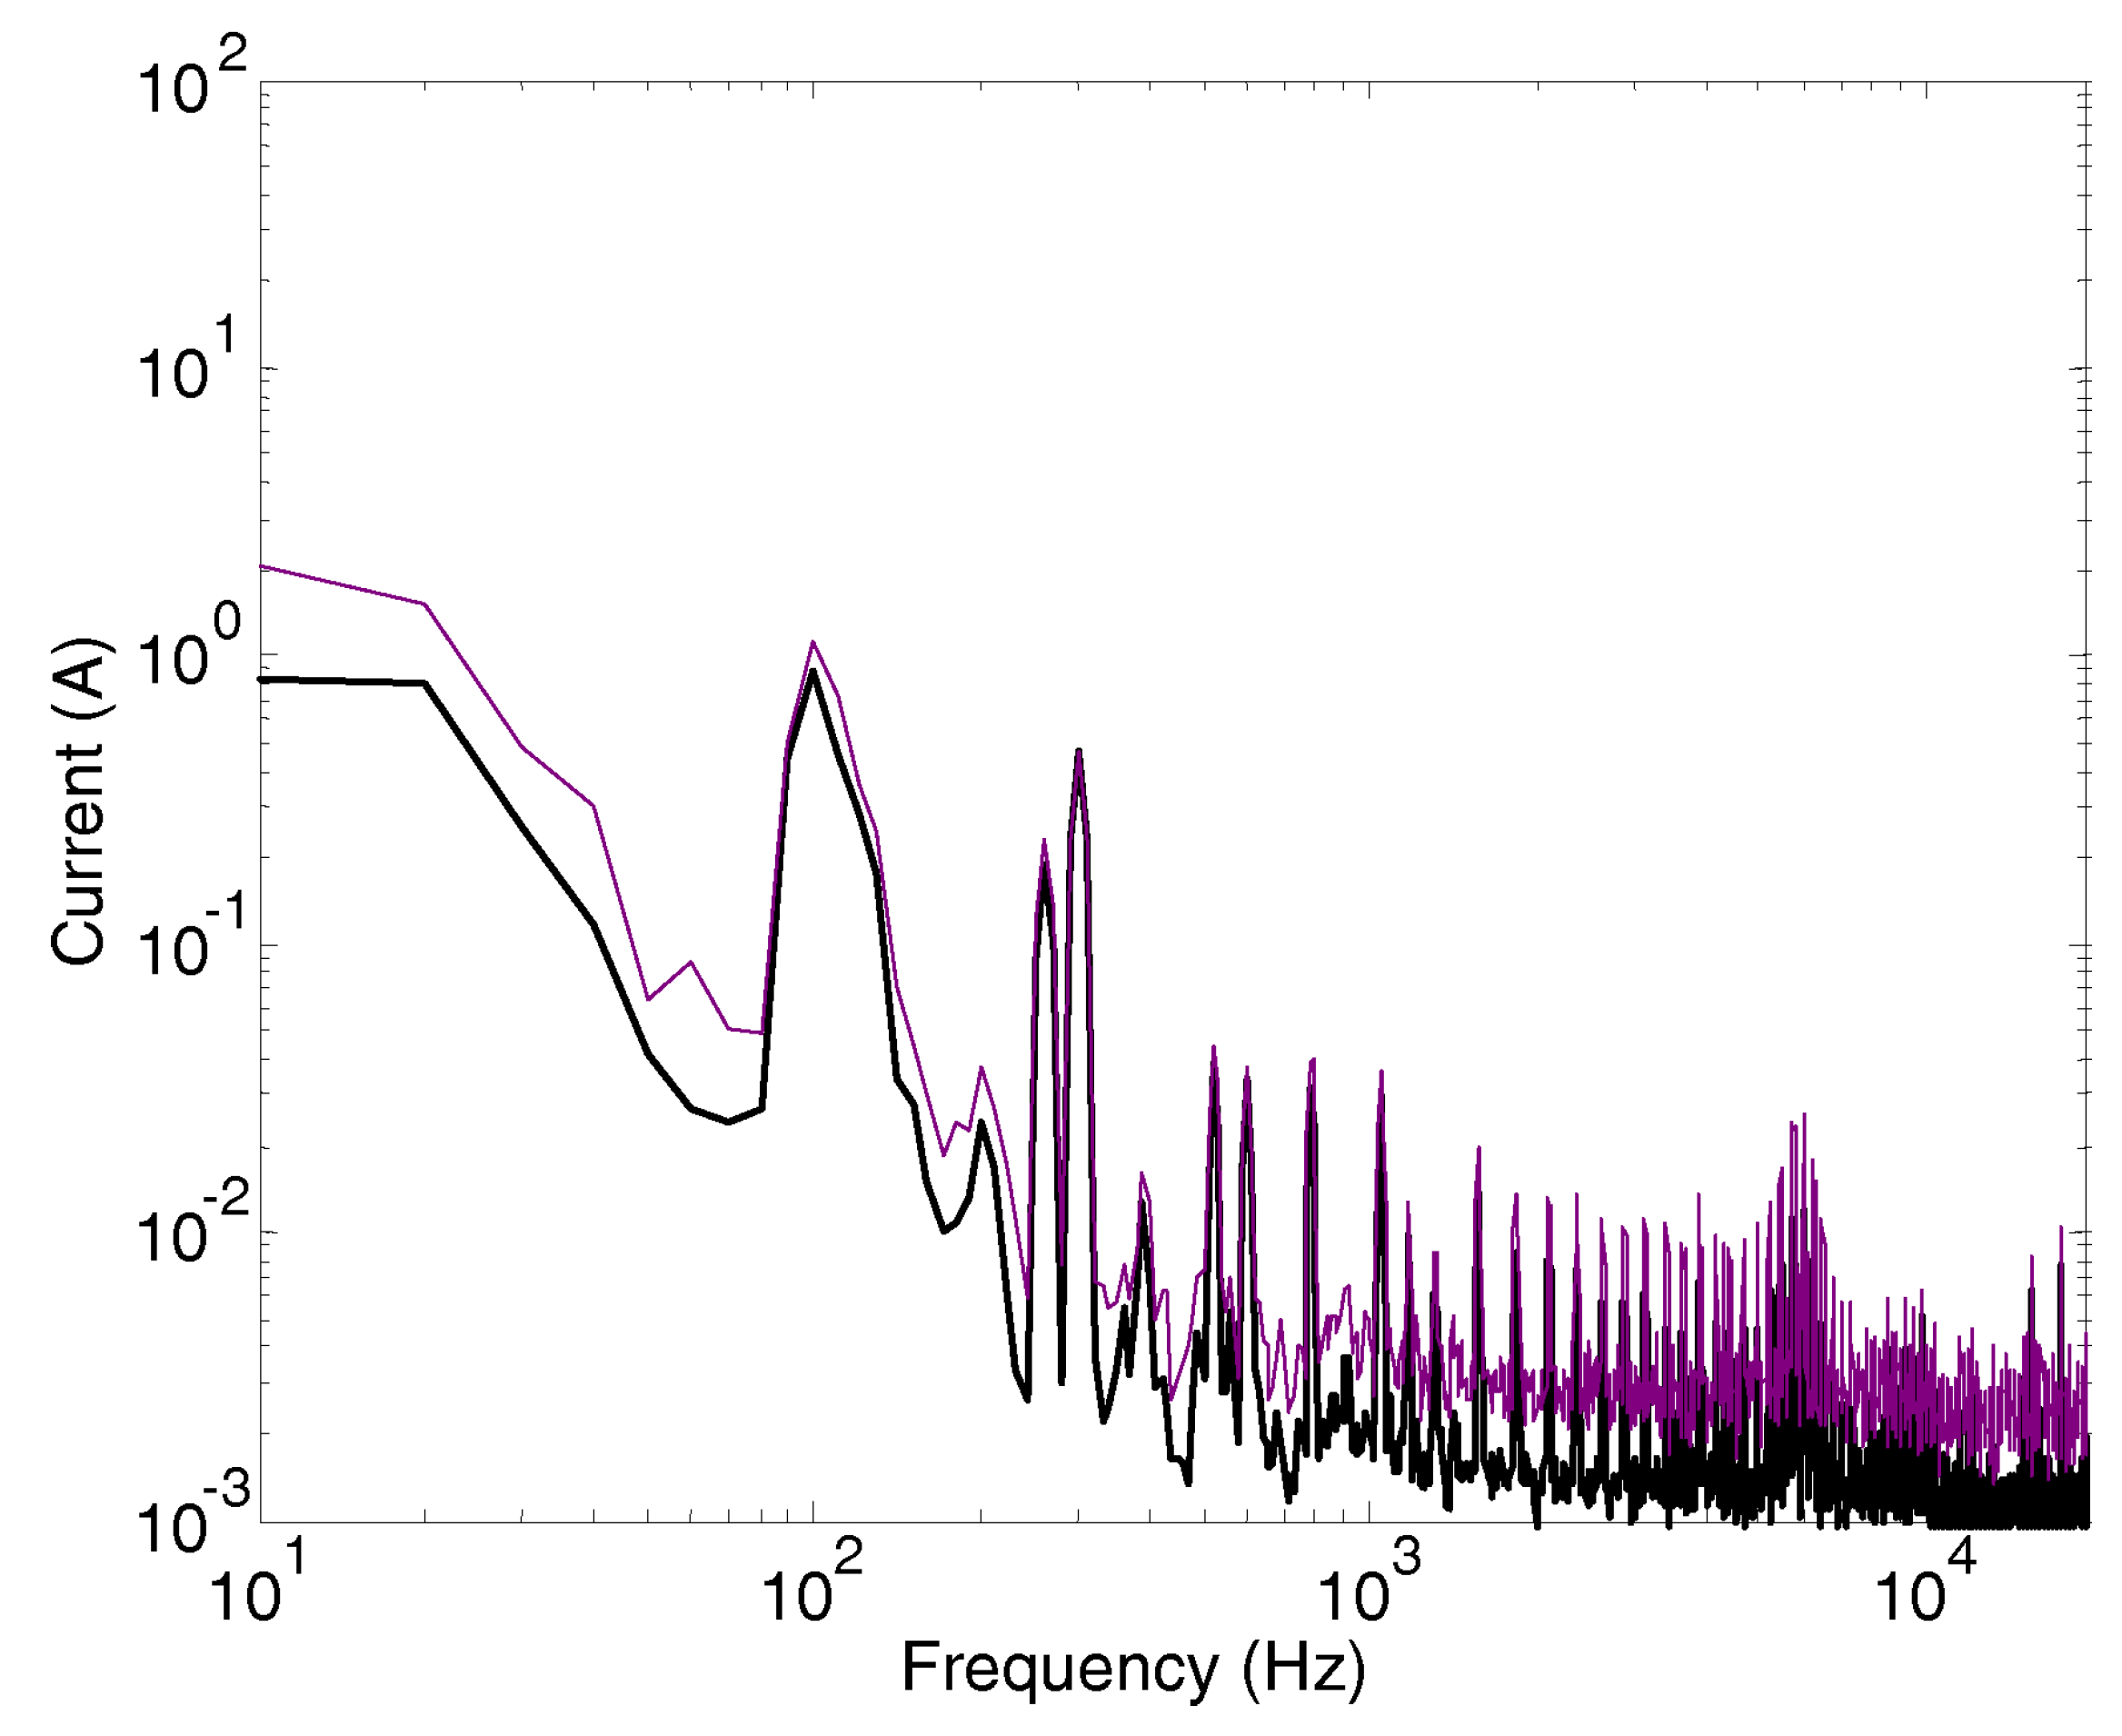
Figure 9.
Detail of stationary and variable components in coasting/cruising conditions at 110 km /h in full configuration: average (black) and max hold (violet) curves.
Figure 9.
Detail of stationary and variable components in coasting/cruising conditions at 110 km /h in full configuration: average (black) and max hold (violet) curves.
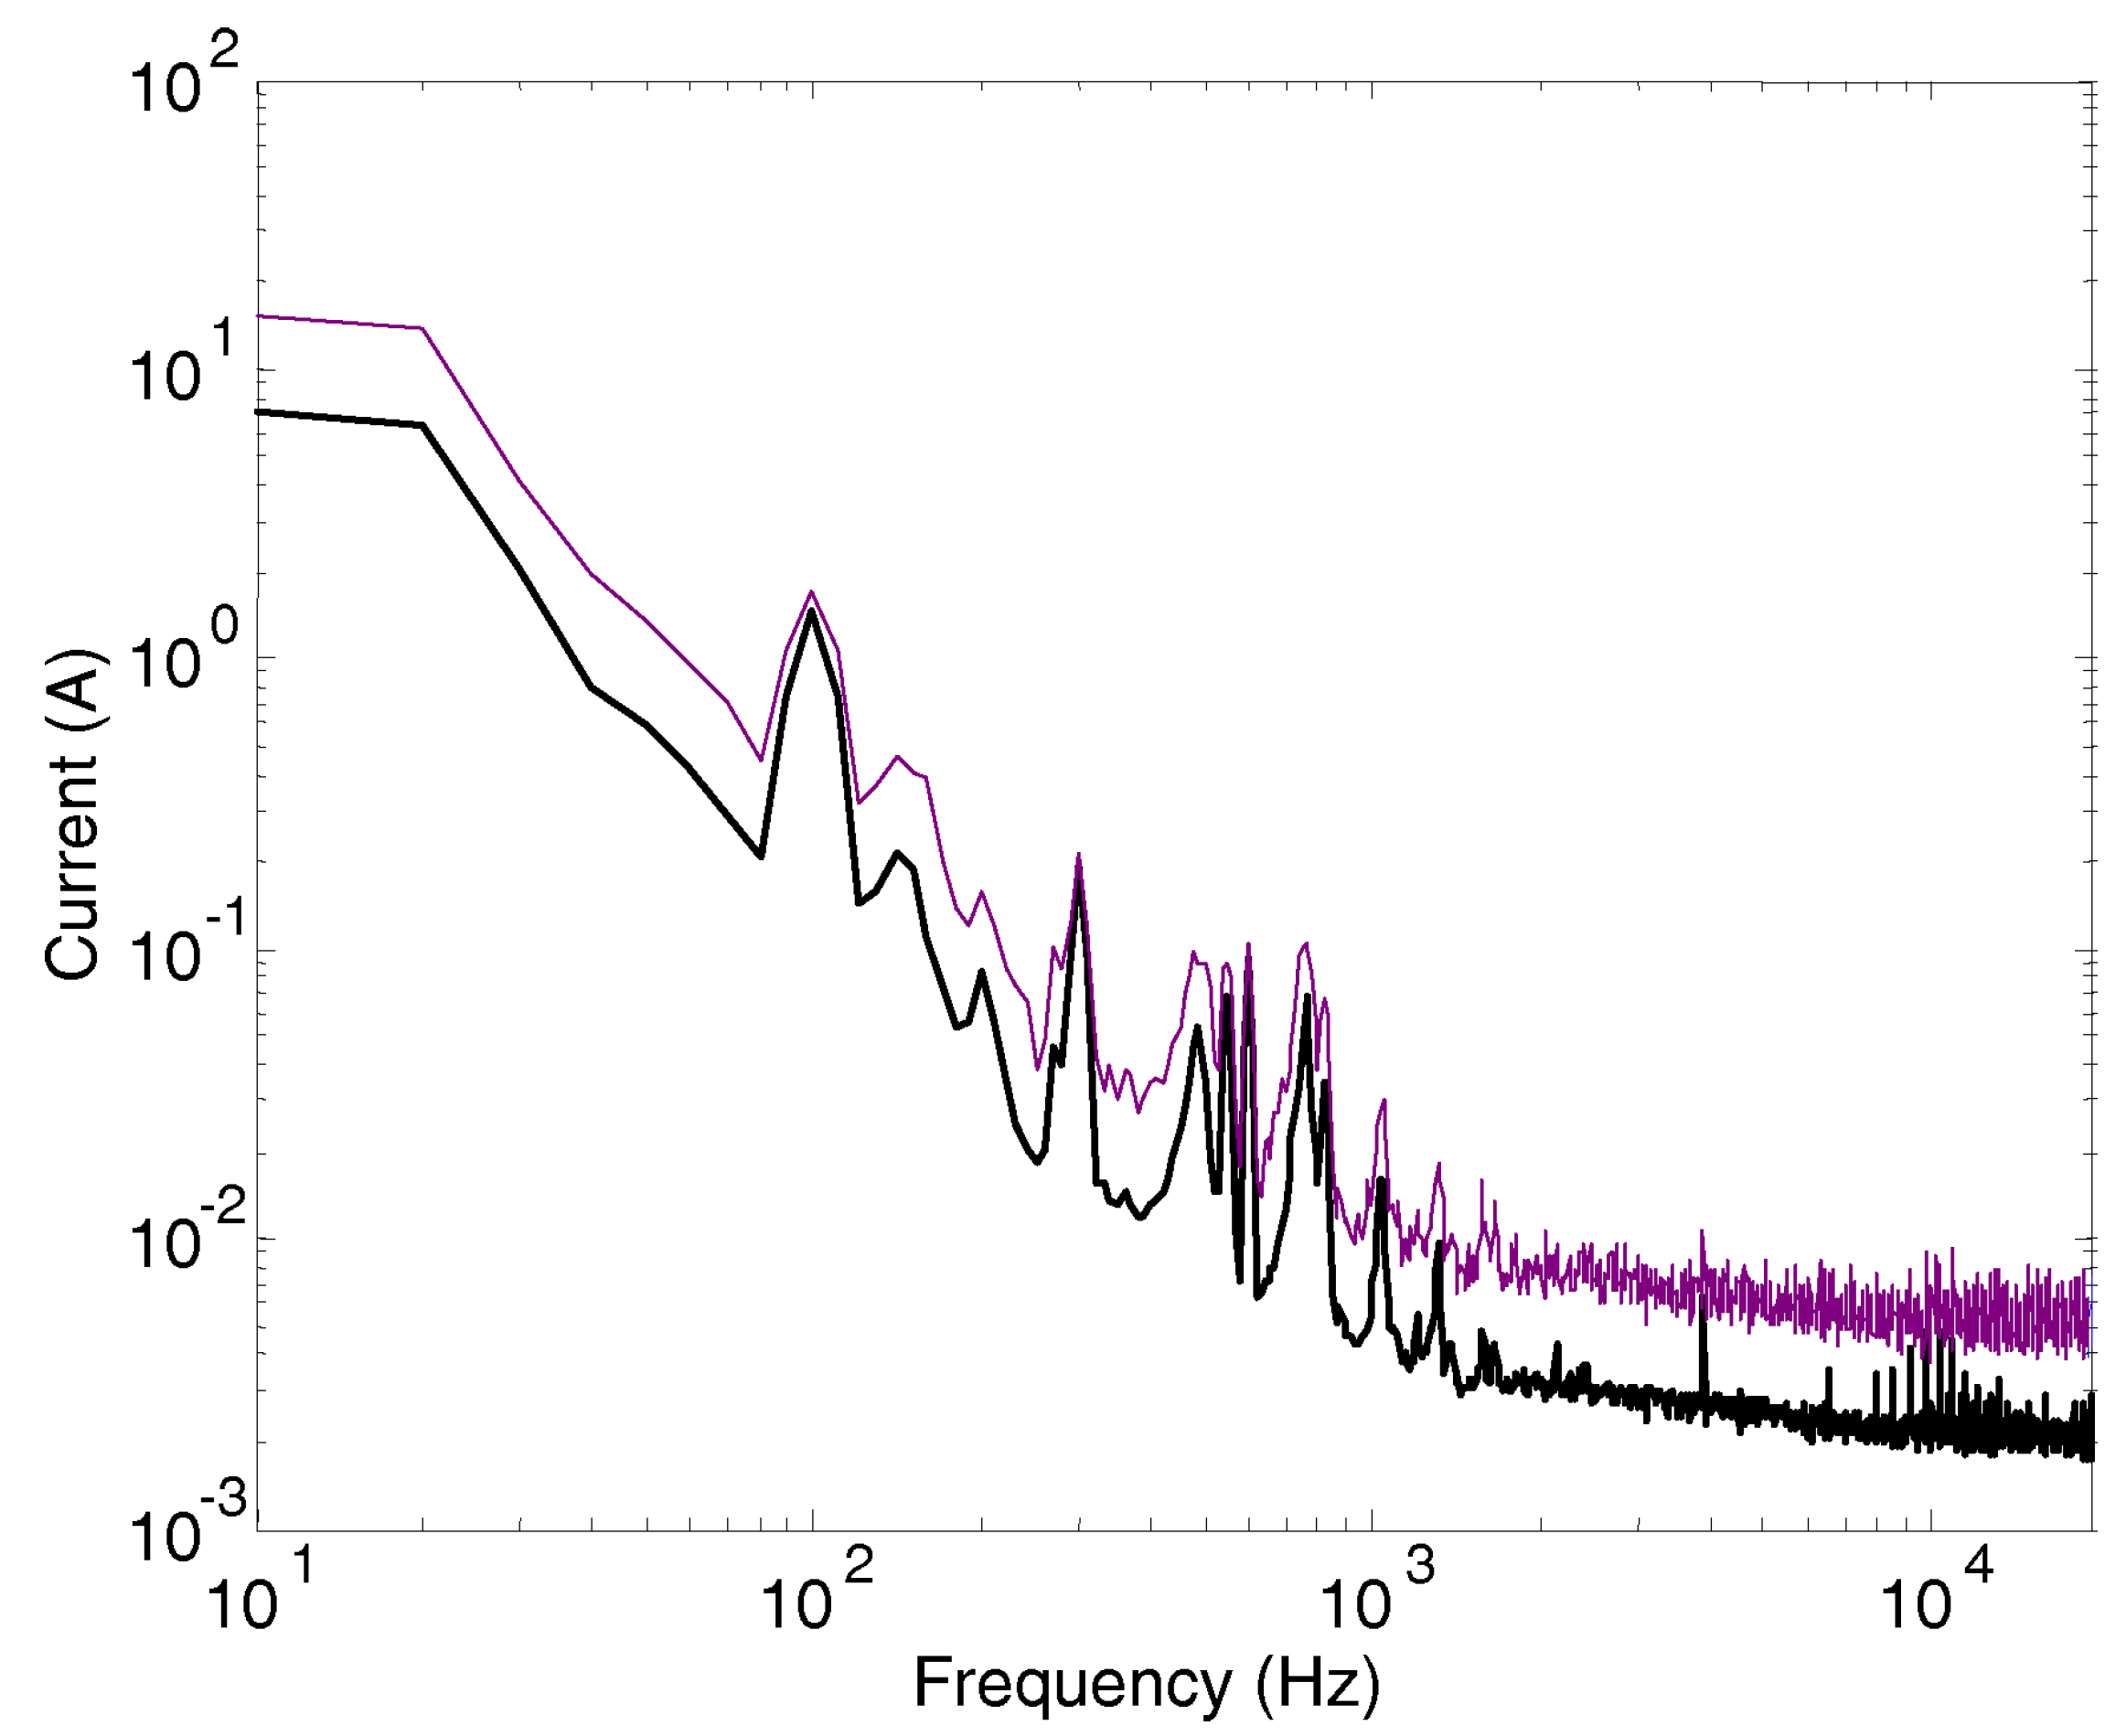
Figure 10.
Acceleration condition between approximately 60 and 110 km /h in full configuration: average (black) and max hold (violet) curves.
Figure 10.
Acceleration condition between approximately 60 and 110 km /h in full configuration: average (black) and max hold (violet) curves.
Disclaimer/Publisher’s Note: The statements, opinions and data contained in all publications are solely those of the individual author(s) and contributor(s) and not of MDPI and/or the editor(s). MDPI and/or the editor(s) disclaim responsibility for any injury to people or property resulting from any ideas, methods, instructions or products referred to in the content. |
© 2024 by the authors. Licensee MDPI, Basel, Switzerland. This article is an open access article distributed under the terms and conditions of the Creative Commons Attribution (CC BY) license (http://creativecommons.org/licenses/by/4.0/).
Copyright: This open access article is published under a Creative Commons CC BY 4.0 license, which permit the free download, distribution, and reuse, provided that the author and preprint are cited in any reuse.


