
Submitted:
09 June 2024
Posted:
11 June 2024
You are already at the latest version
Abstract
Graphene foam prepared by chemical vapor deposition method is a promising thermal interfacial material. However, the thermal properties of graphene foam highly depend on the experimental fabrication conditions during the chemical vapor deposition process. Aiming to reveal how to prepare the appropriate graphene foam for the various thermal management scenarios, the influence of experimental conditions on thermal properties of graphene foam is investigated. Furthermore, the contribution of thermal conductivity and thermal radiation to the effective thermal coefficient of graphene foam is carried out for comparison. Research results show that, the porosity and the cross-section shape of struts of growth template are two critical factors to affect the thermal transport of graphene foam, especially with the increase of temperature. In addition, the deposition time of graphene determines the wall thickness and affects the thermal conductivity directly. The thermal radiation contributes more than thermal conductivity when the temperature climbs continuously. Comparatively, the effective thermal coefficient of graphene foam composite with high porosity and circular shape struts is much superior to others at high temperature. The research findings can provide important guidance for the graphene foam fabrication and its applications in the field of thermal management.
Keywords:
graphene foam composite
; thermal conductivity
; finite element method
; CVD
1. Introduction
With the rapid development of increasingly compact and multi-functional electronics, excessive heat flux is inevitably becoming the most urgent issue, which leads to performance degradation, component failure, and even safety hazards. Therefore, effective thermal management and heat dissipation play a crucial role to address above problems. Correspondingly, a variety of innovative thermal solutions have been developed to enhance the thermal performance of electronics, including advanced heat sinks, thermal interface materials, cooling systems and high thermal conductive phase-change materials [1,2,3,4]. Graphene, a typical two-dimensional (2D) crystal with a layer of carbon atoms packed into a honeycomb lattice, has attracted most attentions in recent years due to its unique characteristics of superior electrical and thermal conductivities, high mechanical rigidity, and controllable functionalization [5]. Therefore, it has been extensively applied in various scenarios, especially in energy storage and conversion systems, including electrochemical sensors [6,7], composite materials [8,9], energy storage devices [10,11], adsorbents [12,13] and drug delivery [14,15]. However, the fabrication of the extremely thin graphene with one atomic layer is difficult to realize the mass production and the application is limited. In addition, the strong π-π interactions and van der Waals forces between adjacent graphene sheets result in agglomeration or accumulation phenomenon, which significantly reduces the specific surface area and seriously damages corresponding performance [16].
One of the most effective solutions is to develop three-dimensional (3D) graphene-based materials with porous structures, which not only retains the intrinsic properties of graphene, but also acquires the advantages of high porosity, large specific surface area and low density of porous materials [17]. Graphene foam (GF) is a highly porous and light material with 3D interconnected graphene networks that is typically synthesized via chemical vapor deposition (CVD) method. Attributed to its excellent mechanical strength, flexibility and high conductivity [18], GF is a good candidate substrate for energy storage and conversion applications, working as an excellent thermal conductive material [19,20], effective thermal insulation material [21], and thermal interface material [22,23]. The structure and performance of GF highly depends on the fabrication parameters of CVD method, including the type of growing substrates [24,25], growing temperature [26], carbon source concentration [27] and etching solution [28].
Effective thermal conductivity is one of the most important parameters to evaluate the thermal properties of graphene foam, which is contributed by solid thermal conduction and radiation, as well as the thermal conduction and convection of the medium filling the void spaces. Pettes et al. [28] experimentally measured the thermal conductivity of GF which was increased from 0.26 to 1.70 W·m-1·K-1 by using different etchants. Qi et al. [29] fabricated a novel 3D hierarchical GF macrostructure by filling the pores of GF with hollow grapheme networks. Their experimental results showed that, the thermal conductivity of the hierarchical macrostructures was increased to 2.28 W·m-1·K-1, which was 744% higher than that of the pure paraffin wax-based composite phase-change materials. Gao et al. [30] experimentally studied the thermal properties of free-standing GF skeleton and found that the thermal conductivity was within the range of 520-550 W·m-1·K-1, which could be attributed to the effective heat dissipation network of interconnected skeleton. The thermal properties of free-standing GF highly depended on the temperature, and its thermal conductivity was increased from 0.3 W·m-1·K-1 to 1.5 W·m-1·K-1 when the temperature varied from 310 K to 440 K [31]. As mentioned above, the thermal conductivity is valued differently depending on different experiments. In addition, the experimental measurement didn’t uncover the reason for the various experimental thermal conductivity and the contribution of different heat transfer methods.
A variety of numerical simulation models have been proposed to predict the thermal properties of GF, mainly including molecular dynamics simulation and finite element method. For porous foam materials, molecular dynamics simulations mainly provide insights into thermal motions and thermal conduction pathways at a molecular-level, which are helpful to understand the micro-scale thermal conduction mechanisms of the materials. Khosravani et al. [32] applied molecular dynamics simulation to investigate the thermal conductivity of polymer composite consisting of graphene foam/polydimethylsiloxane (GF/PDMS). It was found that the thermal conductivity of this composite was increased by 69% compared to pure PDMS. Chen et al. [33] systematically investigated the anisotropic thermal transport of carbon foams composed of six-winged graphene nanoribbons by using equilibrium molecular dynamics simulation method. The results indicated that the significant anisotropic behavior could be attributed to the orientation-dependent group velocity of long-wavelength phonons. Furthermore, the interfacial thermal conductivity could be enhanced by increasing the ambient temperature or external pressure. Due to high computational costs and limited simulation scales, it is still difficult to apply this method to study the thermal properties of porous materials at a macroscopic scale, or investigate the radiative heat transfer mechanisms.
The simulations based on the finite element method consider the overall material structure, pore morphology and heterogeneity. Therefore, it is possible to quantitatively analyze the thermal conductivity of porous foam materials, and describe the coupling mechanism between solid thermal conduction and radiative heat transfer. However, there are rarely limited researches on numerical simulation of thermal conductivity of GF using finite element method. Xiong et al. [34] validated the dynamic thermal behavior of compressed flexible GF based on finite element method, finding that the in-plane thermal conductivity increased while the cross-plane thermal conductivity decreased with compression. Furthermore, a spring model was proposed to predict the dynamic thermal conductivity of GF under compression. Zhang et al. [35] developed a finite element model to predict the thermal behavior of GF/PDMS polymer composite, and further investigated the influences of GF size, contact and interfacial resistance on the thermal conductivity. Numerical results showed that, the thermal conductivity of the polymer composite filled with graphene was increased by increasing radius and reducing length of GF struts. The representative volume element for the composite modeling is a typical Kelvin octahedron composed of quadrilaterals and hexagons. However, the pore structure of GF is predominantly composed of dodecahedral structures. Correspondingly, it is the interest of the present study to establish a physical model based on the dodecahedral structure of GF. The finite element method is used to investigate the influence of porosity and temperature on the effective thermal conductivity of GF under the conditions of solid thermal conduction, as well as conduction-radiation coupled heat transfer. This research may guide the preparation process of GF to obtain the required GF composite with potential thermal properties.
2. Methodology
2.1. Design of Physical Structure
During the fabrication process of GF via chemical vapor deposition, the morphology and structural parameters of the growth template directly determine the structure of GF, thereby affecting its thermal properties. Now the most commonly used templates in experiments include nickel foam [29], copper foam [36], aluminum foam [25], and so on. Although all these metal foams own a continuous network, it is distinct with each other in cross-section shape, struts diameter, and porosity due to the difference in surface property and preparation variables. Figure 1 shows the triangular-shape and the circular-shape cross section of GF struts based on different templates.
In order to investigate the influence of different templates on the thermal properties of GF, this research established the physical models with triangular-shape and circular-shape struts and with different strut diameters, as shown in Figure 2. The topology skeletons were built by 3dMax and SpaceClaim deriving from the real GF prepared by CVD method. As the graphene was deposited on the surface of metal skeleton in experiment and very thin in thickness, the thin shell element method was adopted to characterize the graphene and the inner support material remained the nickel foam, which synthesizes the GF composite existing in the procedure of preparation. The porosity of GF composite ranges from 0.904-0.985 for triangular-shape struts and from 0.904 to 0.987 for circular-shape struts. The porosity is the ratio of the void volume to the total volume of the cell. And as the physical structure remained the same, the different porosities were obtained by adjusting the equivalent diameter of struts.
2.2. Heat Transfer of GF Composite
Generally, heat transfer of open-cell foams includes thermal conduction of the solid skeleton and the filling material in pores. If the filling material is gas, it also takes consideration of heat convection between the solid skeleton and the filling gas, the thermal radiation between the surfaces of struts, as well as between the skeleton and the gas. As the pore size of GF composite is normally less than 500 μm, the natural heat convection in the pores can be neglected. Meanwhile, the thermal radiation can also be ignored when the temperature is below 400 K [37]. It was reported that when the temperature was above 800 K, the effective heat transfer coefficient of metal foams was three times higher than that at a room temperature [38], which revealed the integral role of thermal radiation. Therefore, with the temperature getting higher, the heat transfer of GF composite should consider the co-contribution of thermal conduction and thermal radiation.
For the foam of graphene deposited on the Ni skeleton, the heat transfer at a room temperature is the thermal conduction of the shell-like graphene, the interior Ni solid, and the filled gas in the pores. As the deposited graphene contacts with Ni solid, the heat transfer consists of not only the thermal conduction of graphene and Ni separately, but also the thermal conduction between graphene and Ni. With consideration of the graphene structure and the heat transfer property, the method of thin-shell element was adopted here in the numerical simulation. Herein, the total heat transfer (Qt) can be expressed into the thermal conduction of solid and gas (Qc) as:
With the rise of temperature, thermal radiation should be taken into accounts. Since the emissivity and the absorption of gas are normally small, the thermal radiation only considers the radiation between solid surfaces. And the total heat transfer is expressed into the thermal conduction and the thermal radiation (Qr) as:
2.3. Boundary Conditions and Governing Equations
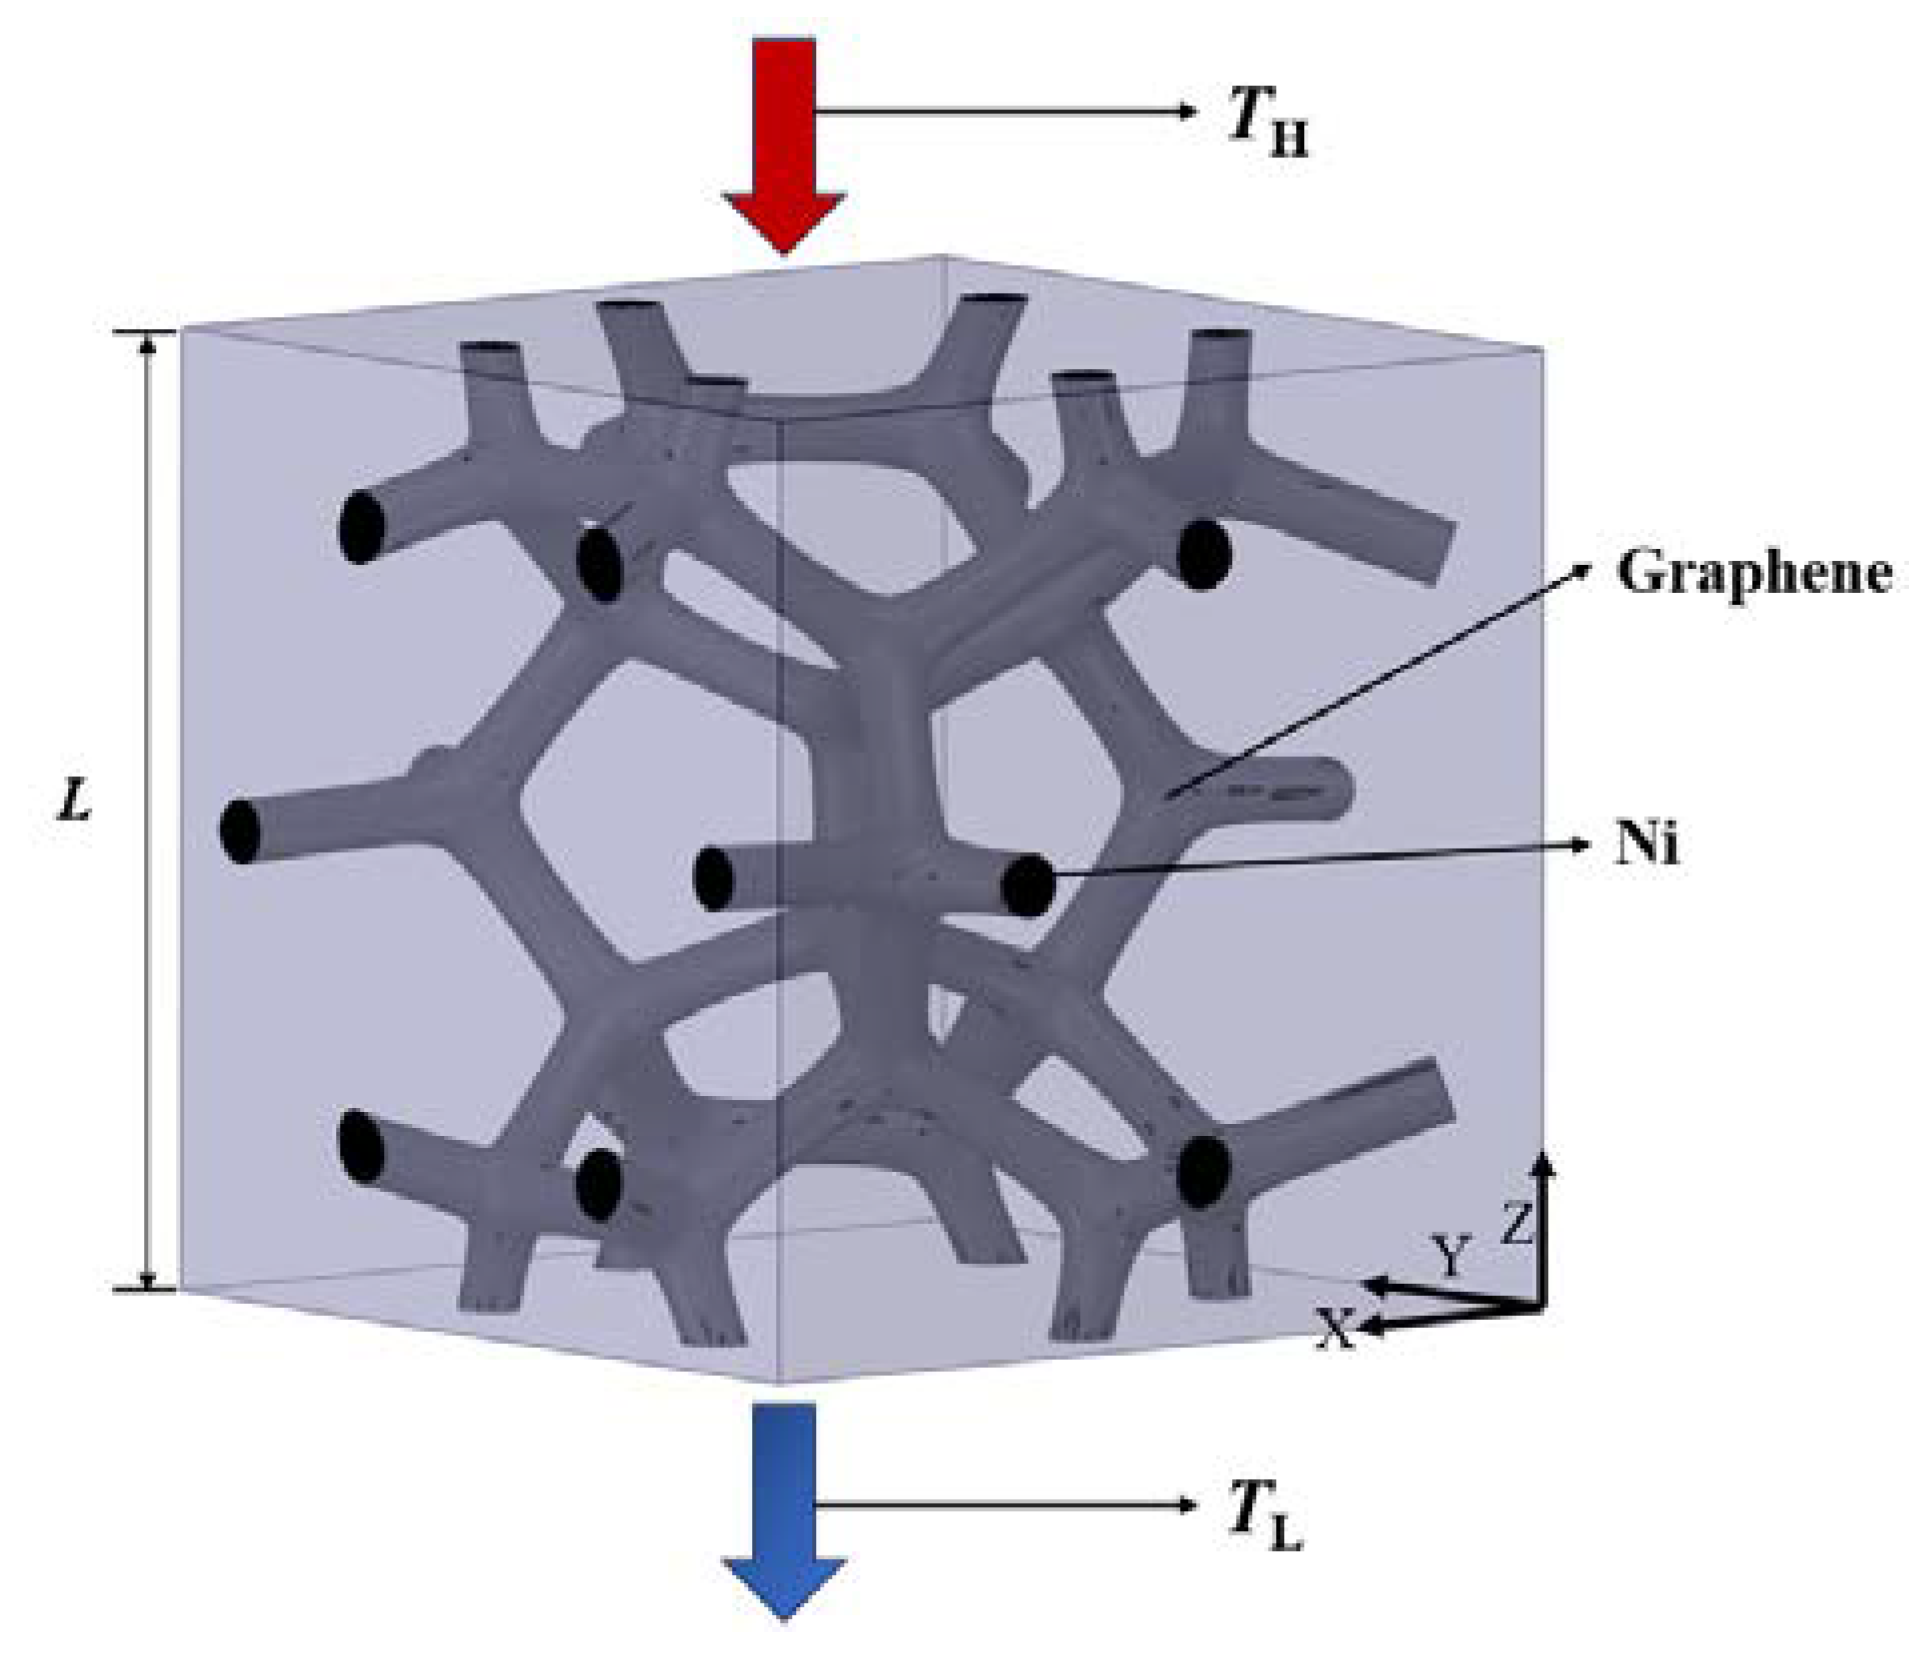
The cell of GF composite fabricated by CVD method is highly repetitive. In this research, a cell is adopted to investigate the thermal property of GF composite. The size of unit including the characterized cell and the air domain is 1 mm × 1 mm × 1 mm, as shown in Figure 3. The heat flows from the top surface with the high temperature (TH) to the bottom surface with the low temperature (TL). The other surfaces are symmetric and thermal isolated without slip. The relevant assumptions are as follows:
- (1)
- Because the CVD-based GF is mostly used as a thermal interface material, the heat transfer along the direction of thickness is much more important. And as the thickness of GF composite is much smaller, the heat flow of GF composite is set as one-dimensional transfer in Z-axial direction;
- (2)
- The thermal conduction of solid skeleton is isotropic;
- (3)
- The thermal conductivity of solids is constant.
Figure 3.
The computational domain and the boundary conditions.
The heat transfer in the GF composite satisfies the equation of conservation of energy. When the temperature is lower than 400 K, the temperature field inside the steady-state GF composite which has no internal heat source and only takes thermal conduction into consideration satisfies the following differential equation:
where k is the thermal conductivity, W·m-1·K-1; gradT is the temperature gradient.
When the temperature is higher than 400 K in which case the thermal radiation effect can’t be neglected, the energy equation of GF composite for the steady-state combined heat transfer is expressed by the following equation:
where qr is the density of the radiation heat flow, W·m-2.
For a one-dimensional heat transfer system where the heat is transferred along the Z direction, the differential equation can be simplified as:
where kz is the thermal conductivity in the Z direction, W·m-1·K-1.
When the temperature is lower than 400 K, the heat transferred along the Z direction is composed only of solid thermal conduction and air thermal conduction:
where qz is the heat flux in the Z direction, W·m-2; qc is the conduction heat flow, W·m-2.
When the temperature is higher than 400 K, the heat transferred along the Z direction is contributed by both thermal conduction and radiation, expressed as:
where qr is the radiation heat flow, W·m-2
According to Eq. (5)(6)(7), the heat flux in the Z direction can be expressed by the temperature gradient as:
where kec is the conductive thermal conductivity, W·m-1·K-1; ker is the radiative thermal conductivity, W·m-1·K-1.
The temperature gradient is used as thermal boundary conditions, expressed as follows:
where TH and TL are the temperature at the bottom and top surfaces of GF composite respectively, K.
Due to the complex pore structure of GF composite, in order to improve the accuracy without increasing the computational workload, the surface-to-surface (S2S) radiation model is used for the calculation of radiative heat transfer. S2S model takes into account radiative exchange on a gray diffuse surface. In the S2S model, any absorption, emission, or scattering of radiation by the medium can be ignored. The heat flux leaving a given surface k is composed of emitted and reflected energy as follows:
The energy flux leaving the surface k via radiation is qout,k , W·m-2. The emissivity and absorptivity of surface k are εk and αk, respectively. Tk is the surface temperature and qin,k is the energy flux incident on the surface from other surfaces, W·m-2. The incident energy is determined by the position, the direction, and the relative angel of two surfaces. The surface-to-surface “view factor” Fkj is introduced to illustrate this relationship. The incident energy flux can be expressed as:
where Ak and Aj are the area of surface k and j, m2; qout,j is the energy flux leaving the surface j, W·m-2. In detail, the view factor is functioned as:
where θk andθj are the angel between the normal of each surface and the line of dAk and dAj; r is the distance between dAk and dAj , m; θkj is determined by the visibility of dAj to dAk. If dAj to dAk is visible, θkj can be 1, otherwise 0. Based on reciprocity relationship of view factor (AkFkj = AjFjk) and Kirchoff’s law (εk = αk), it can derived that:
The view factor is solved by the S2S radiation model embedded in Fluent, and the effective radiation of each surface can be obtained based on the angular coefficient, thus obtaining the radiative heat transfer of each surface. The total heat flux through the GF composite can be calculated by solving the view factor and the energy equation at the same time. Effective thermal conductivity keff based on Fourier’s Law is expressed by:
where keff is the effective thermal conductivity, W·m-1·K-1; L is the thickness of GF composite, m.
Although the skeleton surface of GF composite is not smooth because of the inhomogeneity of deposition in experiments, the influence of view factor on the radiative heat transfer is more significant than that of the surface roughness. Therefore, all surfaces are assumed to be smooth in the numerical simulation.
ANSYS Fluent was used to solve the heat transfer process inside the GF composite. The steady state pressure-based solver is used for calculation, and second-order upwind is used to discretize the thermal conduction equation inside the GF composite. SIMPLE algorithm is adopted for the pressure velocity coupling and PRESTO method is used to discretize the pressure equation. By solving the energy equations with and without considering radiation, the temperature distribution of the GF composite and the total heat flux through the GF composite are obtained, which can be further used for the calculation of effective thermal conductivity. Table 1 presents thermophysical properties of materials used in the simulation.
2.4. Verification of Grid Independence
The unstructured polyhedral mesh is adopted to grid generation due to the complexity of model by Fluent Meshing. And the grid independence is verified selecting the model with the circular-shape struts and the porosity of 0.926. The high-temperature surface is set as 320 K, and the low-temperature one is 300 K. The filled gas is air. The mass fraction of graphene is 0.2%. Five-set grids were conducted in the verification. It is found that with the increase of grid numbers, the effective thermal coefficient climbs firstly, and plateaus then in Figure 4. When the grid numbers are more than 1090007, the deviation of effective thermal coefficient is less than 0.3%, which is acceptable. In order to balance the accuracy and the consumed time of calculation, the third-set grid (number of grids=1090007) is selected in this numerical simulation.
2.5. Numerical Method Validation
To validate the feasibility of method, the numerical thermal conductivity of graphene-nickel/epoxy composite was compared with the experimental results [39]. The temperature of the top and bottom surfaces and the composite materials of the skeleton is kept at the same temperature. Only the filling material is changed into epoxy resin. The experiment shows the effective thermal coefficient increases from 1.60 W·m-1·K-1 to 2.65 W·m-1·K-1 with the increase of graphene layers, which is determined by the deposition time. According to the XRD and Roman spectral intensity test on the graphene growth patterns at different reaction times, the mass fraction of graphene deposition is converted to the equivalent porosities of the physical models when the deposition rate remains the same. Then it is calculated that the effective thermal coefficient of GF composite rises with the more deposited graphene on the skeleton, namely the decrease of porosity, which agrees with the experimental conclusions. When the porosities decrease from 0.949 to 0.926, the effective thermal coefficient increases from 1.73 W·m-1·K-1 to 2.73 W·m-1·K-1 with the acceptable error (<5%) compared with the experimental results, as shown in Figure 5. The reason for a larger numerical result is that the heat process in the simulation is optimized and some of boundary conditions are ideal. It can be conclude that, the numerical method is feasible to investigate the thermal properties of GF composite.
3. Results and Discussion
3.1. The Thermal Property and the Influence Factors at a Room Temperature
In the preparation of GF by CVD method, the properties are often varied with the different growth template, porosities, and mass fraction of graphene. To learn the impact of variables in the experimental procedure on the effective thermal coefficient, the cross-section shape of struts, the porosity and the deposition thickness of graphene are investigated.
3.1.1. The Impact of Growth Template on the Thermal Properties
The growth template mainly differs with the porosity and the cross-section shape. At the same porosity (φ=0.904), the temperature fields of GF composite with circular-shape and triangular-shape struts are shown in Figure 6. Both present the temperature gradient distribution along the longitude of the skeleton. There is an obvious temperature drop at the junction of struts. Correspondingly, the temperature distribution of the fluid domain seems the same with that of the solid domain as it is affected significantly by the foam skeleton. But the influence of the cross-section shape on the temperature distribution is remarkable, especially at the junction. And the distribution is more uniform in the foam with circular-shape struts than that with triangular-shape struts, which demonstrates the impact of the cross-section shape on the thermal property to some degree.
Another characteristic of different templates is the various porosities. When the mass fraction of graphene remains, the porosity is changed via enlarging or reducing the diameter of struts. Figure 7 depicts the influence of porosity on the effective thermal coefficient of the GF composites with circular-shape and triangular-shape struts individually. In a big picture, the effective thermal coefficient drops with the porosity rising. That’s because the larger the porosity is, the less the solid skeleton which contributes more to the effective thermal coefficient is. In detail, the cross-section shape has little impact on the thermal coefficient at the similar porosity, though it disturbs the temperature distribution. Hence, the porosity of growth template is more significant than the cross-section shape to the thermal properties of GF composite.
3.1.2. The Impact of Growth Template on the Thermal Properties
When the deposition rate remains, the deposition thickness of graphene depends on the deposition time, which simultaneously increases the mass fraction of graphene. Is it good or not for a longer time to deposit graphene? Pettes et al. [28] provided the total thermal conductivity of GF at different deposition thicknesses of graphene. The experimental results proved that the heat transfer enhanced with the increase of graphene layers when the total number of layers is small. But the heat transfer got worse with the graphene being thicken continuously. Liu et al. [39] explained the enhancement of thermal conductivity in the initial phase owned to the decrease of graphene interlayer spacing according to the experiment and the calculation based on Bragg’s law. As the distance between the interlayers is equivalent to the thickness of monolayer graphene and is reduced, the thermal contact resistance shrinks with the overlaying graphene. With the accumulation of thermal contact resistance, the total thermal conductivity declines after climbing a peak. Therefore, the curve of effective thermal coefficient tends upward firstly and downward then with the increase of the graphene mass fraction.
As the preparation of the monolayer or several-layers graphene deposition is difficult, and it is hard to promise the uniform deposition with the low number of layers, here we adopted thin shell element method to explore the thermal properties of graphene with the layer-by-layer deposited feature and the continuous scale wall thickness. Figure 8 shows the effective thermal coefficient decreases with the increase of graphene mass fraction, no matter what the shape of cross section is. The slope of both curves stays similar. But the value of effective thermal coefficient of triangular-shape struts is higher than that of circular-shape struts. That’s because the total surface area of circular-shape struts is smaller than that of triangular-shape struts when the solid volume fraction is the same, which induces the graphene wall is thicker on the circular-shape struts. In this view, the deposition thickness of graphene dramatically influences the thermal properties of GF composite, and magnifies the effect of cross-section shape of struts on the heat transfer. It guides the control of deposition time in the fabrication experiment.
3.2. The Thermal Property and the Influence Factors at a High Temperature
As the radiative thermal energy is proportional to the fourth power of temperature according to Stefan-Boltzmann law, the contribution of thermal radiation cannot be ignored at a high temperature. Especially, the structural feature of open foam strengthens the radiation effect, such as intricate staggered struts and numerous surfaces. The coupled conductive-radiative heat transfer of foam composite with 0.2 wt.% graphene is investigated at the high temperature.
3.2.1. The Impact of Mean Temperature on the Thermal Properties
The effective thermal coefficient of GF composite depending on the mean temperature is shown in Figure 9. The mean temperature is defined as Tave = (TH+TL)/2, where TH and TL are the temperature of the top and the bottom surfaces. The emissivity of graphene is 0.9 [28]. For the GF composite with different porosities, the effective thermal coefficient grows nonlinearly with the mean temperature rising, and the nonlinearity is much more remarkable when the mean temperature gets higher. In the range of room temperature, the heat transfer of low-porosity foams is better than that of high-porosity foams, as the thermal conductivity of solid rules. However, the heat transfer develops in a different trend that the effective thermal coefficient of the high-porosity foam is much higher than that of the low-porosity foam with the temperature rising. It demonstrates that thermal radiation plays the significant role at a high temperature.
To reveal the effect of thermal radiation on the total heat transfer, the contribution of both heat transfer methods is illustrated in Figure 10 and Figure 11. It is seen that the thermal radiation accounts for from 16% to 83% with the temperature rising at the low porosity (φ=0.904) in the foam with circular-shape struts, and from 14% to 80% in the foam with triangular-shape struts. The big leap in the proportion discloses the essential change of heat transfer way and the importance of thermal radiation. Relatively, the thermal radiation occupies a large scale at the initial at the high porosity (φ=0.987 and φ=0.985) in the foam with different-shape struts, and the effective thermal coefficient surpasses that of the foam with low porosity under the influence of radiation. Thus, the mean temperature can dramatically change the thermal properties of GF composite and the function of applications. This regulation shows more prominently in the foam with higher porosities, where the ratio of effective thermal coefficient at a high temperature to that at a room temperature is 44.5 and 39.7, respectively for the circular-shape struts and the triangular-shape struts.
3.2.2. The Impact of Porosity on the Thermal Properties
Besides the research on the impact of porosity on the thermal properties at a room temperature, the impact of porosity at 400 K and at 1600 K is compared in Figure 12 and Figure 13.
Regardless of the influence of the strut shape and the temperature, the contribution of thermal radiation is simultaneously increase with the increase of porosity. It agrees with the research on thermal radiation contribution to the effective thermal coefficient of metal foams [40]. At 400 K, the drop of thermal conductivity of solid skeleton is much faster than the increase of thermal radiation with the rising porosities. And the whole trend of effective thermal coefficient is cut down, which demonstrates the thermal conduction dominates the thermal properties of GF composite at the room temperature. At 1600 K, the contribution of thermal radiation always occupies a leading position from the low to the high porosity, which results in the increase rate of both thermal radiation and thermal conduction is not dramatic. But the fact that the thermal radiation is enhanced in the foam with high porosity demonstrates the surface area is not the main factor to determine the thermal radiation as the diminishment of porosity is realized via reducing the effective diameter of struts. The enhancement might come from the enlargement of visible surface area which affects the view factor directly. In sum, the porosity is important to the heat transfer, especially to the thermal radiation at a high temperature.
3.3. The Impact of Cross-Section Shape of Struts on the Thermal Properties
The variation of effective thermal coefficient of GF composite with different cross-section shape of struts with the mean temperature is shown in Figure 14 at the porosity of 0.904. Besides the same non-linearly growth trend, the gap of effective thermal coefficient is enlarged with the temperature rising. The effective thermal conductivity of the GF with circular-shape struts increases more significantly with the increase of temperature in comparison with that of GF with triangular-shape struts.
Figure 15 explains the difference of the development depending on temperature. It is found that the proportion of thermal radiation of the foam with circular-shape struts processes faster than that of the foam with triangular-shape struts, which is the reason for the widen gap of effective thermal coefficient between the foams with different strut shapes, despite of the similarity in value at the low temperature.
3.4. The Impact of Cross-Section Shape of Struts on the Thermal Properties
In the coupled conductive-radiative heat transfer, the emissivity affects the emission and absorption of the skeleton surface according to the Kirchhoff’s law. The emissivity is determined by the intrinsic radiation property and the morphology and structure of the surface mostly, which are directly influenced by the choice of growth template, deposition conditions, and etching solutions during the preparation of GF by CVD method. In this research, the impact of emissivity varying from 0.6 to 1.0 is investigated at the mean temperature of 1600 K on effective thermal coefficient of GF composites with circular-shape and triangular-shape struts at the low and high porosities.
Figure 16 (a) shows the effective thermal coefficient increase by 12.4% and 4.4% with the increase of emissivity of the foam with circular-shape struts at the porosity of 0.904 and 0.987. And the increase is by 17.6% and 6.5% correspondingly for the foam with triangular-shape struts at the porosity of 0.904 and 0.985 in Figure 16 (b). It demonstrates that the increase of effective thermal coefficient at the low porosity is larger than that at the high porosity, as well the increase in the foam with triangular-shape struts is larger than that in the foam with circular-shape struts. The explanation for the difference of increase is that the surface area of the foam with low porosity and triangular-shape struts is more than that of the foam with high porosity and circular-shape struts, which enhances the thermal radiation overall.
3.5. The Impact of Temperature Difference on the Thermal Property
The impact of mean temperature on the thermal property is always mentioned in previous researches. But rare concerns are on the impact of temperature difference on the thermal property at the same mean temperature. As the mean temperature is the geometrical mean of temperature on the top and bottom surfaces, here we set the temperature difference is from 100 K to 800 K when the mean temperature remains 1600 K. The results are shown in Figure 17 that the effective thermal coefficient is influenced by the temperature difference. Compared with Figure 17(a) and (b), it is seen that the strut shape has no obvious disturbance on the results and the impact of porosity here is also tiny. But the temperature difference really makes the variation of effective thermal coefficient to some extent. Although the enhancement of heat transfer is limited, the impact should be admitted and realized.
3.6. Curve Fitting
According to the calculated data, the mathematical expressions of effective thermal conductivity, porosity and temperature are further fitted. Belcher et al. [41] proposed a second-order polynomial of the effective thermal conductivity as a function of the porosity over the entire range of 0≤φ≤1:
where φ is the porosity.
Based on this polynomial, the mathematical expression of the effective thermal conductivity and porosity without considering radiation effect is fitted as:
Figure 18 shows the comparison of effective thermal conductivity between simulated results and correlation in equation (17) under the condition of neglecting thermal radiation. It can be obviously observed that, the fitted mathematical equation is in good agreement with the simulation data.
When thermal radiation is taken into consideration at high temperature, the effective thermal conductivity of GF composite highly depends on porosity and temperature. Therefore, the effective thermal conductivity can be expressed as the function composition of porosity and temperature as follows:
According to the effective thermal conductivity of the GF composite obtained at different porosities and temperatures, the effective thermal conductivity as the function of porosity and temperature can be expressed by:
Figure 19 shows the comparison between the correlation in equation (19) and the simulated results when the thermal radiation is taken into consideration. It can be obviously observed that, the fitting mathematical equation is in high agreement with the simulated results at different temperatures and porosities.
4. Conclusions
In this study, the finite element method is applied to numerically investigate the thermal conductivity and radiation processes of the GF composite prepared by CVD method under different experimental preparation parameters. The influences of the skeleton cross-section shape, porosity, temperature and other parameters on the effective thermal conductivity, as well as the contribution of thermal radiation to the effective thermal conductivity under different parameters are studied. The main findings can be summarized as follows:
(1) The effective thermal conductivity of GF composite can be enhanced with the decrease of porosity, which can be attributed to the higher solid volume fraction at lower porosity. In addition, the effective thermal conductivity of GF composite is decreased with the increase of deposition time. When the volume fraction of graphene is increased from 0.05% to 0.2%, the effective thermal conductivity of the GF composite is decreased from 3.96 W·m-1·K-1 to 3.86 W·m-1·K-1.
(2) Under the condition of temperature higher than 400 K, the thermal radiation effect can’t not be neglected. At a given porosity of 0.904, when the average temperature increases from 400 K to 1600 K, the effective thermal conductivity of the GF composite with circular section and triangle section is increased by 1021.94% and 906.45%, respectively. In addition, GF composite with higher porosity is more easily affected by temperature compared to that with lower porosity. For GF composite with circular cross-section at 1600 K, the contribution of thermal radiation to effective thermal conductivity increases from 83% to 98% when the porosity increases from 0.904 to 0.987.
(3) The thermal properties of GF composite with lower porosity and larger pore surface area are more sensitive to changes of surface emissivity. When the surface emissivity of GF composite increases from 0.6 to 1, the effective thermal conductivity of GF composite with circular cross-section struts is increased by 12.4% and 4.4% at porosity of 0.904 and 0.987, respectively. The effective thermal conductivity of GF composite with triangular cross-section struts is increased by 17.6% and 6.5% at porosity of 0.904 and 0.985, respectively.
Therefore, the effective thermal conductivity of GF composite at temperature lower than 400 K can be enhanced by reducing the growth template porosity, adjusting the deposition time, and controlling the number of graphene layers. At temperature higher than 400 K, the effective thermal conductivity of GF composite can be improved by increasing the temperature and growth template porosity, reducing the surface area and increasing the surface emissivity.
Author Contributions
Conceptualization, R.Z. and T.D.; methodology, R.Z. and T.D.; software, R.Z.; validation, R.Z., Y.L. and J.B.; formal analysis, R.Z.; resources, T.D.; data curation, J.B.; writing—original draft preparation, R.Z.; writing—review and editing, Y.L. and T.D; visualization, R.Z. and J.B.; supervision, Y.L. and T.D.; project administration, Y.L. and T.D.; funding acquisition, Y.L. and T.D. All authors have read and agreed to the published version of the manuscript.
Data Availability Statement
Data are contained within the article.
Acknowledgments
The research was carried out with the financial support of Natural Science Foundation of Shandong Province (No. ZR2020ME178, No. ZR2021ME174), Shenzhen Fundamental Research Program (No. JCYJ20220530141009020) and Young Innovative Talents Introduction & Cultivation Program for Colleges and Universities of Shandong Province (Sub-title: Innovative Research Team of Advanced Energy Equipment) granted by Department of Education of Shandong Province.
Conflicts of Interest
The authors declare no conflicts of interest.
References
- Bagatella, S.; Cereti, A.; Manarini, F.; Cavallaro, M.; Suriano, R.; Levi, M. Thermally Conductive and Electrically Insulating Polymer-Based Composites Heat Sinks Fabricated by Fusion Deposition Modeling. Polymers 2024, 16, 432. [Google Scholar] [CrossRef] [PubMed]
- Alghamdi, A.A. Computational Optimization of Sandwich Silicone Rubber Composite for Improved Thermal Conductivity and Electrical Insulation. Polymers 2024, 16, 616. [Google Scholar] [CrossRef] [PubMed]
- Torres-Alba, A.; Mercado-Colmenero, J.M.; Caballero-Garcia, J.D.D.; Martin-Doñate, C. A hybrid cooling model based on the use of newly designed fluted conformal cooling channels and fastcool inserts for green molds. Polymers 2021, 13, 3115. [Google Scholar] [CrossRef] [PubMed]
- Tian, J.; Wang, C.; Wang, K.; Xue, R.; Liu, X.; Yang, Q. Flexible Polyolefin Elastomer/Paraffin Wax/Alumina/Graphene Nanoplatelets Phase Change Materials with Enhanced Thermal Conductivity and Mechanical Performance for Solar Conversion and Thermal Energy Storage Applications. Polymers 2024, 16, 362. [Google Scholar] [CrossRef] [PubMed]
- Liu, Y.; Qiu, L.; Liu, J.; Feng, Y. Enhancing thermal transport across diamond/graphene heterostructure interface. Int. J. Heat Mass Transf. 2023, 209, 124123. [Google Scholar] [CrossRef]
- Ho, K.S.; Paek, H.K.; Im, S.J.; Kim, J.W.; Kim, S.C.; Kim, U.S.; Kim, K.D.; Song, K.S. Robust and high-performance plasmonic refractive index sensor based on graphene waveguide ring resonator. Phys. Rev. B Condens. 2023, 663, 414980. [Google Scholar] [CrossRef]
- Lee, M.S.; Choi, H.J.; Baek, J.B.; Chang, D.W. Simple solution-based synthesis of pyridinic-rich nitrogen-doped graphene nanoplatelets for supercapacitors. Appl. Energy 2017, 195, 1071–1078. [Google Scholar] [CrossRef]
- Banda, H.; Rupam, T.H.; Rezk, A.; Visak, Z.; Hammerton, J.; Yuan, Q.; Saha, B.B. Preparation and assessment of ionic liquid and few-layered graphene composites to enhance heat and mass transfer in adsorption cooling and desalination systems. Int. J. Heat Mass Transf. 2024, 221, 125095. [Google Scholar] [CrossRef]
- Yan, Q.; Chen, B.; Ye, W.; Zhang, T.; Wan, J.; Zhou, Q.; Shen, J.; Li, J.; Lu, W.F.; Wang, H. Simultaneously improving mechanical, thermal, and anti-wear properties of Ti alloys using 3D-networked graphene as reinforcement. Carbon 2023, 213, 118152. [Google Scholar] [CrossRef]
- Rajeswari, K.; Suganthi, K.S.; Thiruvenkatam, S.; Devaraj, S.; Rajan, K.S. Graphene oxide–adipic acid nanocomposites for thermal energy storage: Assessment of thermophysical properties and energy storage performance. J. Energy Storage 2024, 77, 109949. [Google Scholar]
- Chen, H.; He, H.; Wang, B.; Han, L.; Ma, J.; Sui, D.; Wang, C.; Hua, Y. Investigating the physical-chemical effects of reduced graphene oxide-covered manganese oxide on ammonium-ion batteries. Appl. Energy 2024, 353, 122067. [Google Scholar] [CrossRef]
- Kumar, S.; Goswami, M.; Singh, N.; Deshpande, U.; Kumar, S.; Sathish, N. Flexible and lightweight graphene grown by rapid thermal processing chemical vapor deposition for thermal management in consumer electronics. New Carbon Mater. 2023, 38, 534–540. [Google Scholar] [CrossRef]
- Huang, P.; Feng, R.; Tang, Z.; He, Y.; Peng, D.; Li, E.; Wei, M.; He, Z.; Bai, Z. Exploring the use of 3D graphene sponge composited phase change material for improved thermal performance in battery thermal management systems. Appl. Therm. Eng. 2023, 235, 121389. [Google Scholar] [CrossRef]
- Romo-Rico, J.; Bright, R.; Krishna, S.M.; Vasilev, K.; Golledge, J.; Jacob, M.V. Antimicrobial graphene-based coatings for biomedical implant applications. Carbon Trends 2023, 12, 100282. [Google Scholar] [CrossRef]
- Fu, Q.; Feng, S.; Xiao, Z.; Gong, K.; Pang, X.; Yang, Y.; Zhou, C.; Liu, H.; Wang, J.; Zhou, J. An integrated sample-to-answer graphene microchip for ultrafast detection of multiple microorganisms. Sensor Actuat B-Chem. <bold>2024</bold>, 135584.
- Baig, Z.; Mamat, O.; Mustapha, M. Recent progress on the dispersion and the strengthening effect of carbon nanotubes and graphene-reinforced metal nanocomposites: a review. Crit. Rev. Solid State 2018, 43, 1–46. [Google Scholar] [CrossRef]
- Chen, K.; Shi, L.; Zhang, Y.; Liu, Z. Scalable chemical-vapour-deposition growth of three-dimensional graphene materials towards energy-related applications. Chem. Soc. Rev. 2018, 47, 3018–3036. [Google Scholar] [CrossRef] [PubMed]
- Banciu, C.A.; Nastase, F.; Istrate, A.I.; Veca, L.M. 3D graphene foam by chemical vapor deposition: synthesis, properties, and energy-related applications. Molecules 2022, 27, 3634. [Google Scholar] [CrossRef] [PubMed]
- Yu, Z.; Feng, Y.; Feng, D.; Zhang, X. Thermal properties of three-dimensional hierarchical porous graphene foam-carbon nanotube hybrid structure composites with phase change materials. Micropor. Mesopor. Mat. 2021, 312, 110781. [Google Scholar] [CrossRef]
- Zhao, Y.H.; Wu, Z.K.; Bai, S.L. Thermal resistance measurement of 3D graphene foam/polymer composite by laser flash analysis. Int. J. Heat Mass Transf. 2016, 101, 470–475. [Google Scholar] [CrossRef]
- Yuan, Y.; Liu, L.; Yang, M.; Zhang, T.; Xu, F.; Lin, Z.; Ding, Y.; Wang, C.; Li, J.; Yin, W. Lightweight, thermally insulating and stiff carbon honeycomb-induced graphene composite foams with a horizontal laminated structure for electromagnetic interference shielding. Carbon 2017, 123, 223–232. [Google Scholar] [CrossRef]
- Cheng, G.; Wang, X.; He, Y. 3D graphene paraffin composites based on sponge skeleton for photo thermal conversion and energy storage. Appl. Therm. Eng. 2020, 178, 115560. [Google Scholar] [CrossRef]
- Zhang, X.; Yeung, K.K.; Gao, Z.; Li, J.; Sun, H.; Xu, H.; Zhang, K.; Zhang, M.; Chen, Z.; Yuen, M.M.; Yang, S. Exceptional thermal interface properties of a three-dimensional graphene foam. Carbon 2014, 66, 201–209. [Google Scholar] [CrossRef]
- Lin, H.; Xu, S.; Wang, X.; Mei, N. Significantly reduced thermal diffusivity of free-standing two-layer graphene in graphene foam. Nat. Nanotechnol. 2013, 24, 415706. [Google Scholar] [CrossRef] [PubMed]
- Zhou, M.; Lin, T.; Huang, F.; Zhong, Y.; Wang, Z.; Tang, Y.; Bi, H.; Wan, D.; Lin, J. Highly conductive porous graphene/ceramic composites for heat transfer and thermal energy storage. Adv. Funct. 2013, 23, 2263–2269. [Google Scholar] [CrossRef]
- Zhou, M.; Bi, H.; Lin, T.; Lü, X.; Huang, F.; Lin, J. Directional architecture of graphene/ceramic composites with improved thermal conduction for thermal applications. J. Mater. Chem. A 2014, 2, 2187–2193. [Google Scholar] [CrossRef]
- Chen, Z.; Ren, W.; Gao, L.; Liu, B.; Pei, S.; Cheng, H.M. Three-dimensional flexible and conductive interconnected graphene networks grown by chemical vapour deposition. Nat. Mater. 2011, 10, 424–428. [Google Scholar] [CrossRef] [PubMed]
- Pettes, M.T.; Ji, H.; Ruoff, R.S.; Shi, L. Thermal transport in three-dimensional foam architectures of few-layer graphene and ultrathin graphite. Nano Lett 2012, 12, 2959–2964. [Google Scholar] [CrossRef] [PubMed]
- Qi, G.; Yang, J.; Bao, R.; Xia, D.; Cao, M.; Yang, W.; Yang, M.; Wei, D. Hierarchical graphene foam-based phase change materials with enhanced thermal conductivity and shape stability for efficient solar-to-thermal energy conversion and storage. Nano Res. 2017, 10, 802–813. [Google Scholar] [CrossRef]
- Gao, J.; Xie, D.; Wang, X.; Zhang, X.; Yue, Y. High thermal conductivity of free-standing skeleton in graphene foam. Appl. Phys. Lett. 2020, 117. [Google Scholar] [CrossRef]
- Li, M.; Sun, Y.; Xiao, H.; Hu, X.; Yue, Y. High temperature dependence of thermal transport in graphene foam. Nat. Nanotechnol. 2015, 26, 105703. [Google Scholar] [CrossRef] [PubMed]
- Khosravani, S.; Sadr, M.H.; Carrera, E.; Pagani, A.; Masia, R. Multi-scale analysis of thermal conductivity of graphene foam/PDMS composites. Mech. Adv. Mater. Struc. 2023, 1–13. [Google Scholar] [CrossRef]
- Chen, X.K.; Hu, X.Y.; Jia, P.; Xie, Z.X.; Liu, J. Tunable anisotropic thermal transport in porous carbon foams: The role of phonon coupling. Int. J. Mech. Sci. 2021, 206, 106576. [Google Scholar] [CrossRef]
- Xiong, Z.; Marconnet, A.; Ruan, X. Unconventional and Dynamically Anisotropic Thermal Conductivity in Compressed Flexible Graphene Foams. ACS Appl. Mater. 2022, 14, 48960–48966. [Google Scholar] [CrossRef]
- Zhang, Y.F.; Zhao, Y.H.; Bai, S.L.; Yuan, X. Numerical simulation of thermal conductivity of graphene filled polymer composites. Compos. Part B-Eng. 2016, 106, 324-331.
- Xia, D.; Yi, K.; Zheng, B.; Li, M.; Qi, G.; Cai, Z.; Cao, M.; Liu, D.; Peng, L.; Wei, D. Solvent-free process to produce three dimensional graphene network with high electrochemical stability. J. Phys. Chem. C. 2017, 121, 3062–3069. [Google Scholar] [CrossRef]
- Ma, W.; Miao, T.; Zhang, X.; Kohno, M.; Takata, Y. Comprehensive study of thermal transport and coherent acoustic-phonon wave propagation in thin metal film–substrate by applying picosecond laser pump–probe method. J. Phys. Chem. C. 2015, 119, 5152–5159. [Google Scholar] [CrossRef]
- Zhao, C.Y.; Lu, T.J.; Hodson, H.P.; Jackson, J.D. The temperature dependence of effective thermal conductivity of open-celled steel alloy foams. Mat. Sci. Eng. A-Struct. 2004, 367, 123–131. [Google Scholar] [CrossRef]
- Liu, Y.; Lu, J.; Cui, Y. Improved thermal conductivity of epoxy resin by graphene–nickel three-dimensional filler. Carbon Resources Conversion 2020, 3, 29–35. [Google Scholar] [CrossRef]
- Wang, M.; Pan, N. Modeling and prediction of the effective thermal conductivity of random open-cell porous foams. Int. J. Heat Mass Transf. 2008, 51, 1325–1331. [Google Scholar] [CrossRef]
- Kovács, R.; Rogolino, P. Numerical treatment of nonlinear Fourier and Maxwell-Cattaneo-Vernotte heat transport equations. Int. J. Heat Mass Transf. 2020, 150, 119281. [Google Scholar] [CrossRef]
Figure 1.
SEM images of GF based on different growth templates: (a) GF on Ni foam [29]; (b) GF on Cu foam [36]; (c) GF on Al2O3 foam [25].
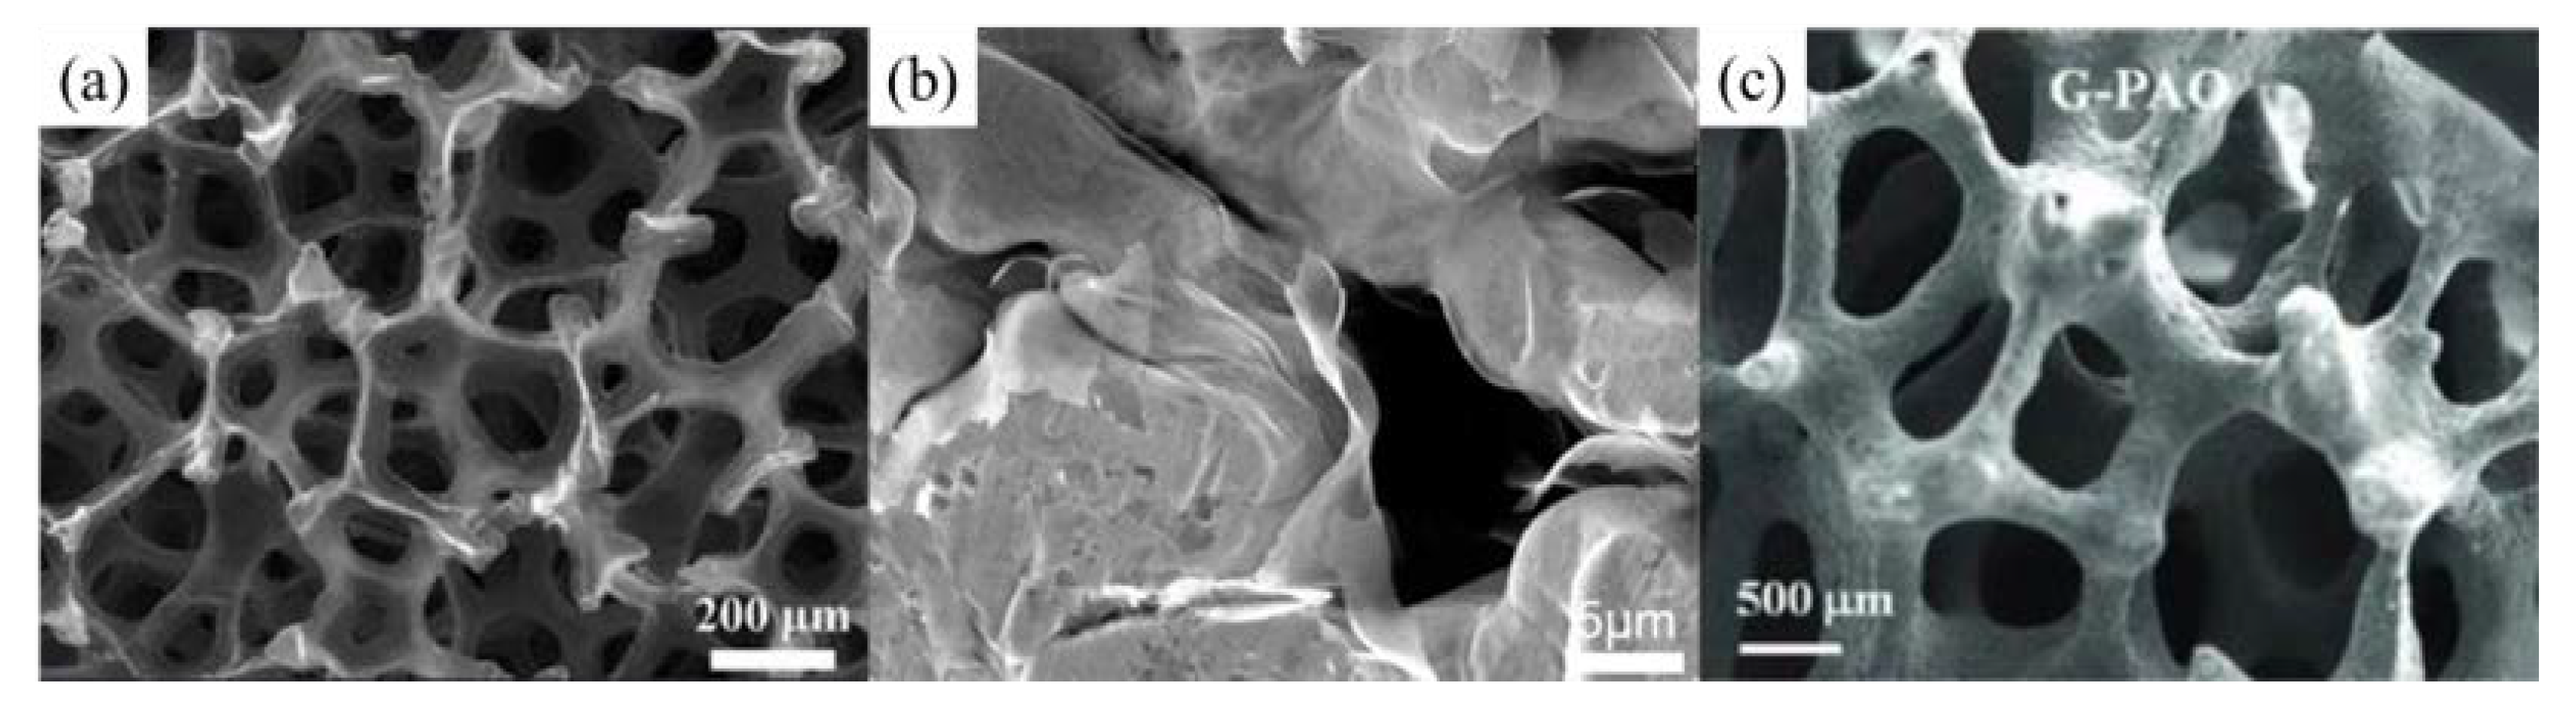
Figure 2.
Physical models of GF of different porosities: (a) with circular-shape cross section struts; (b) with triangular-shape cross section struts.
Figure 2.
Physical models of GF of different porosities: (a) with circular-shape cross section struts; (b) with triangular-shape cross section struts.
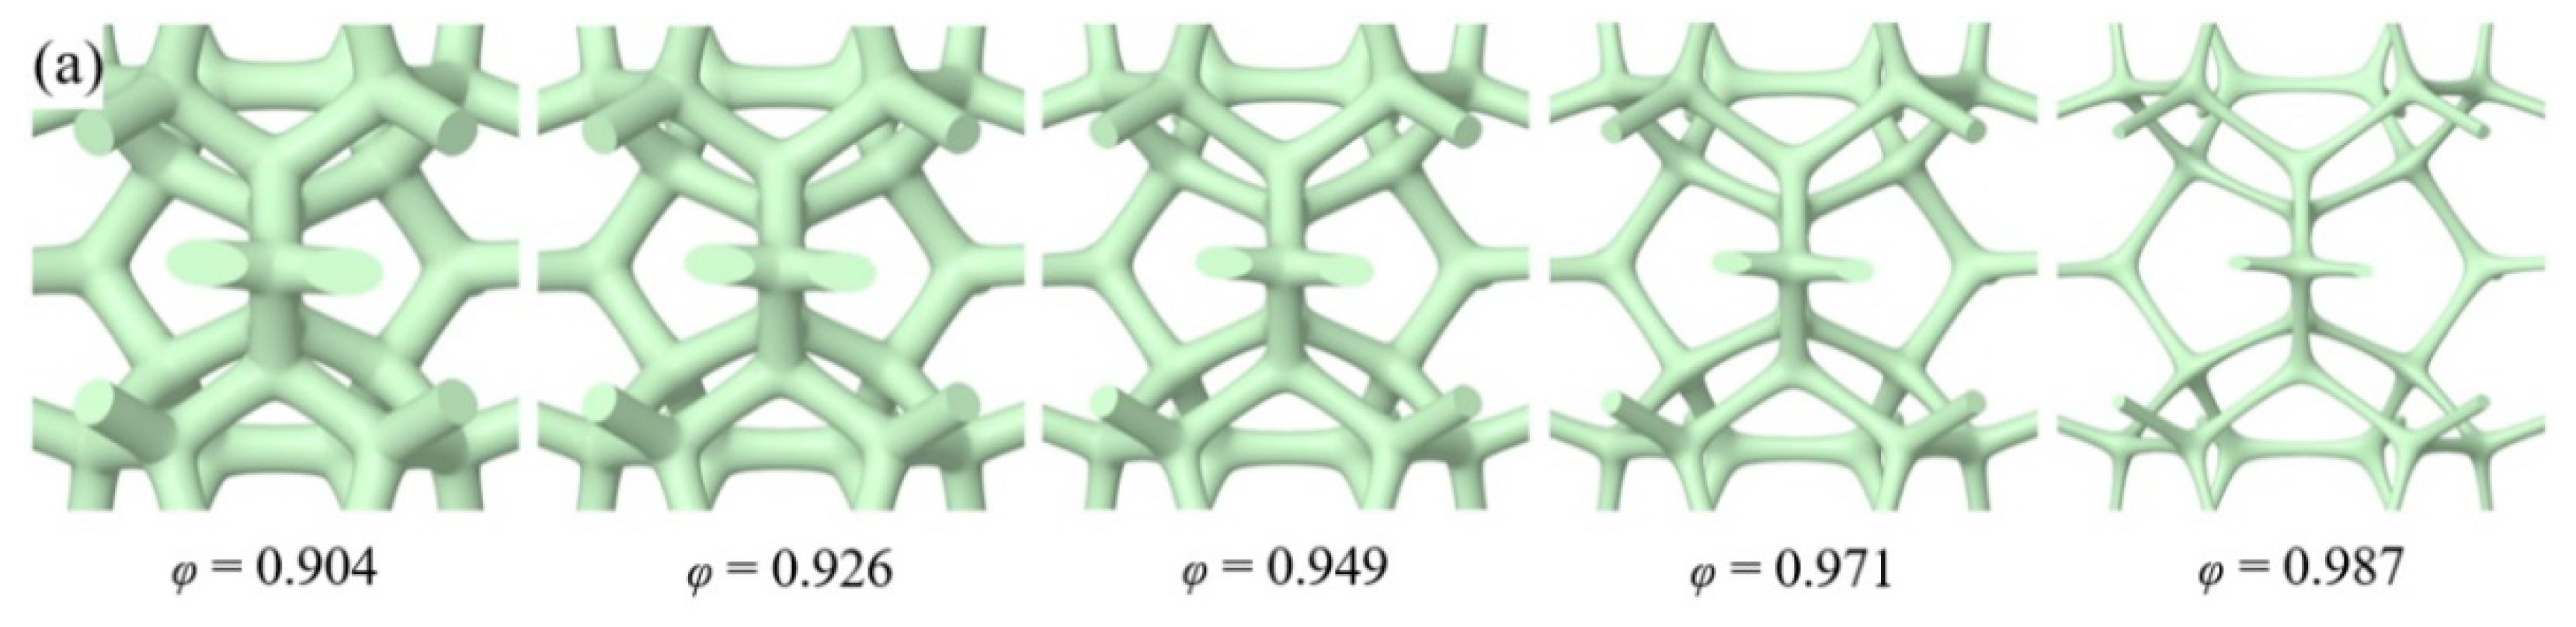
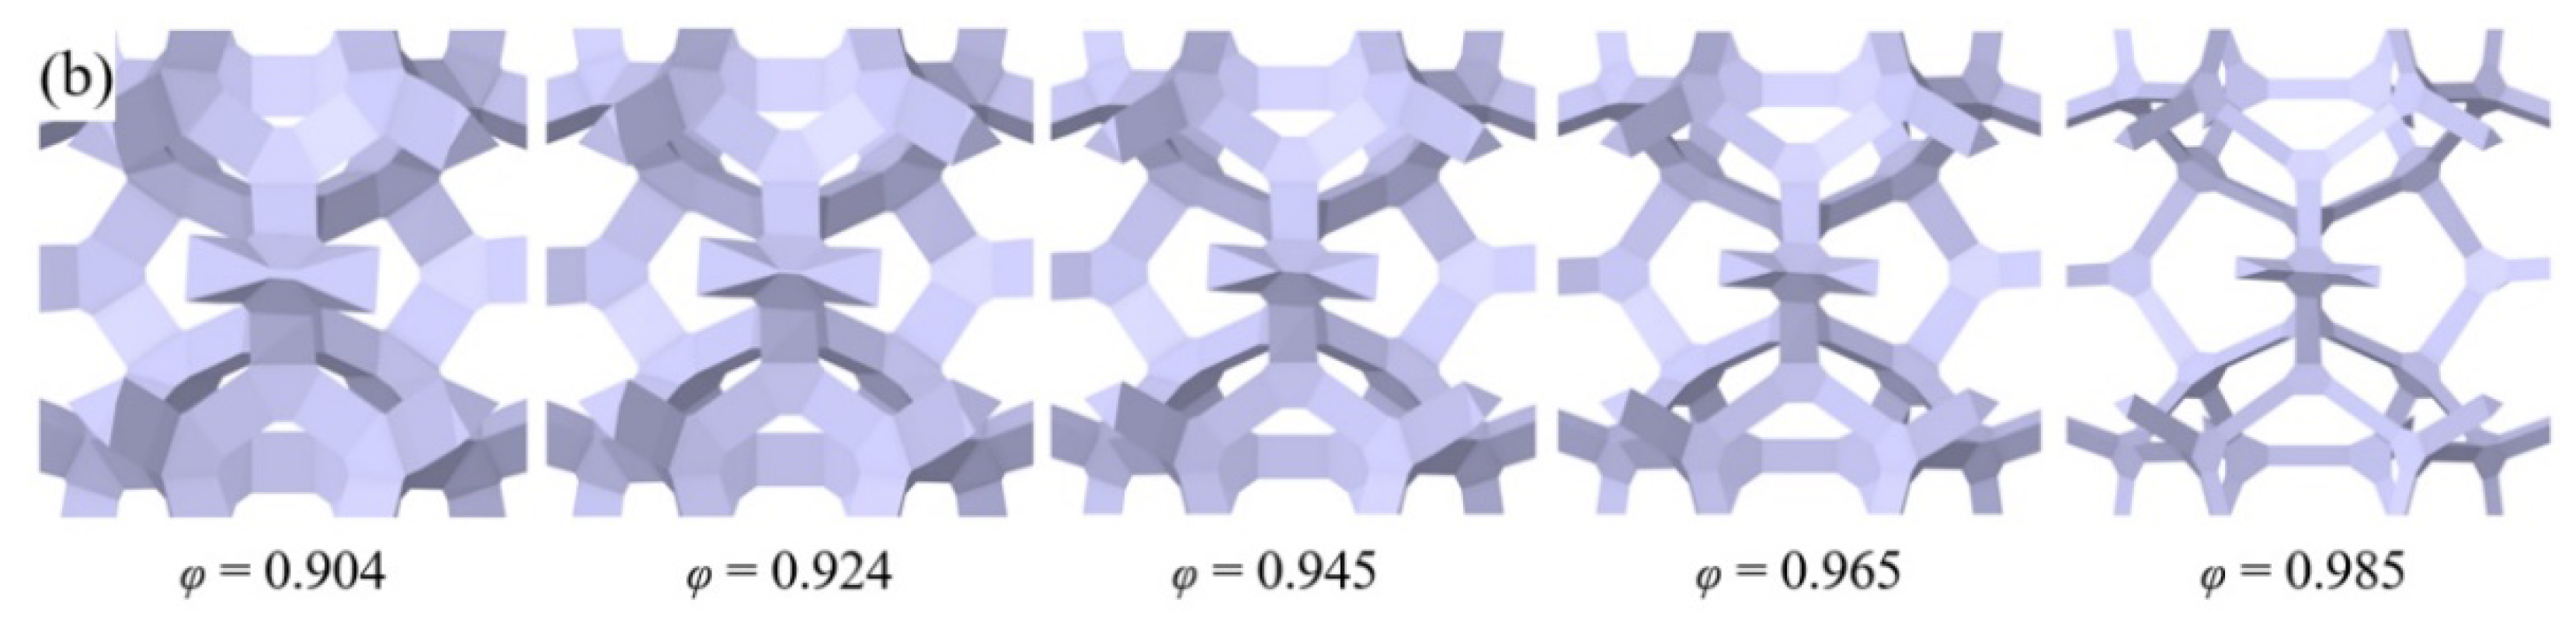
Figure 4.
Variation of the effective thermal coefficient with the porosity.
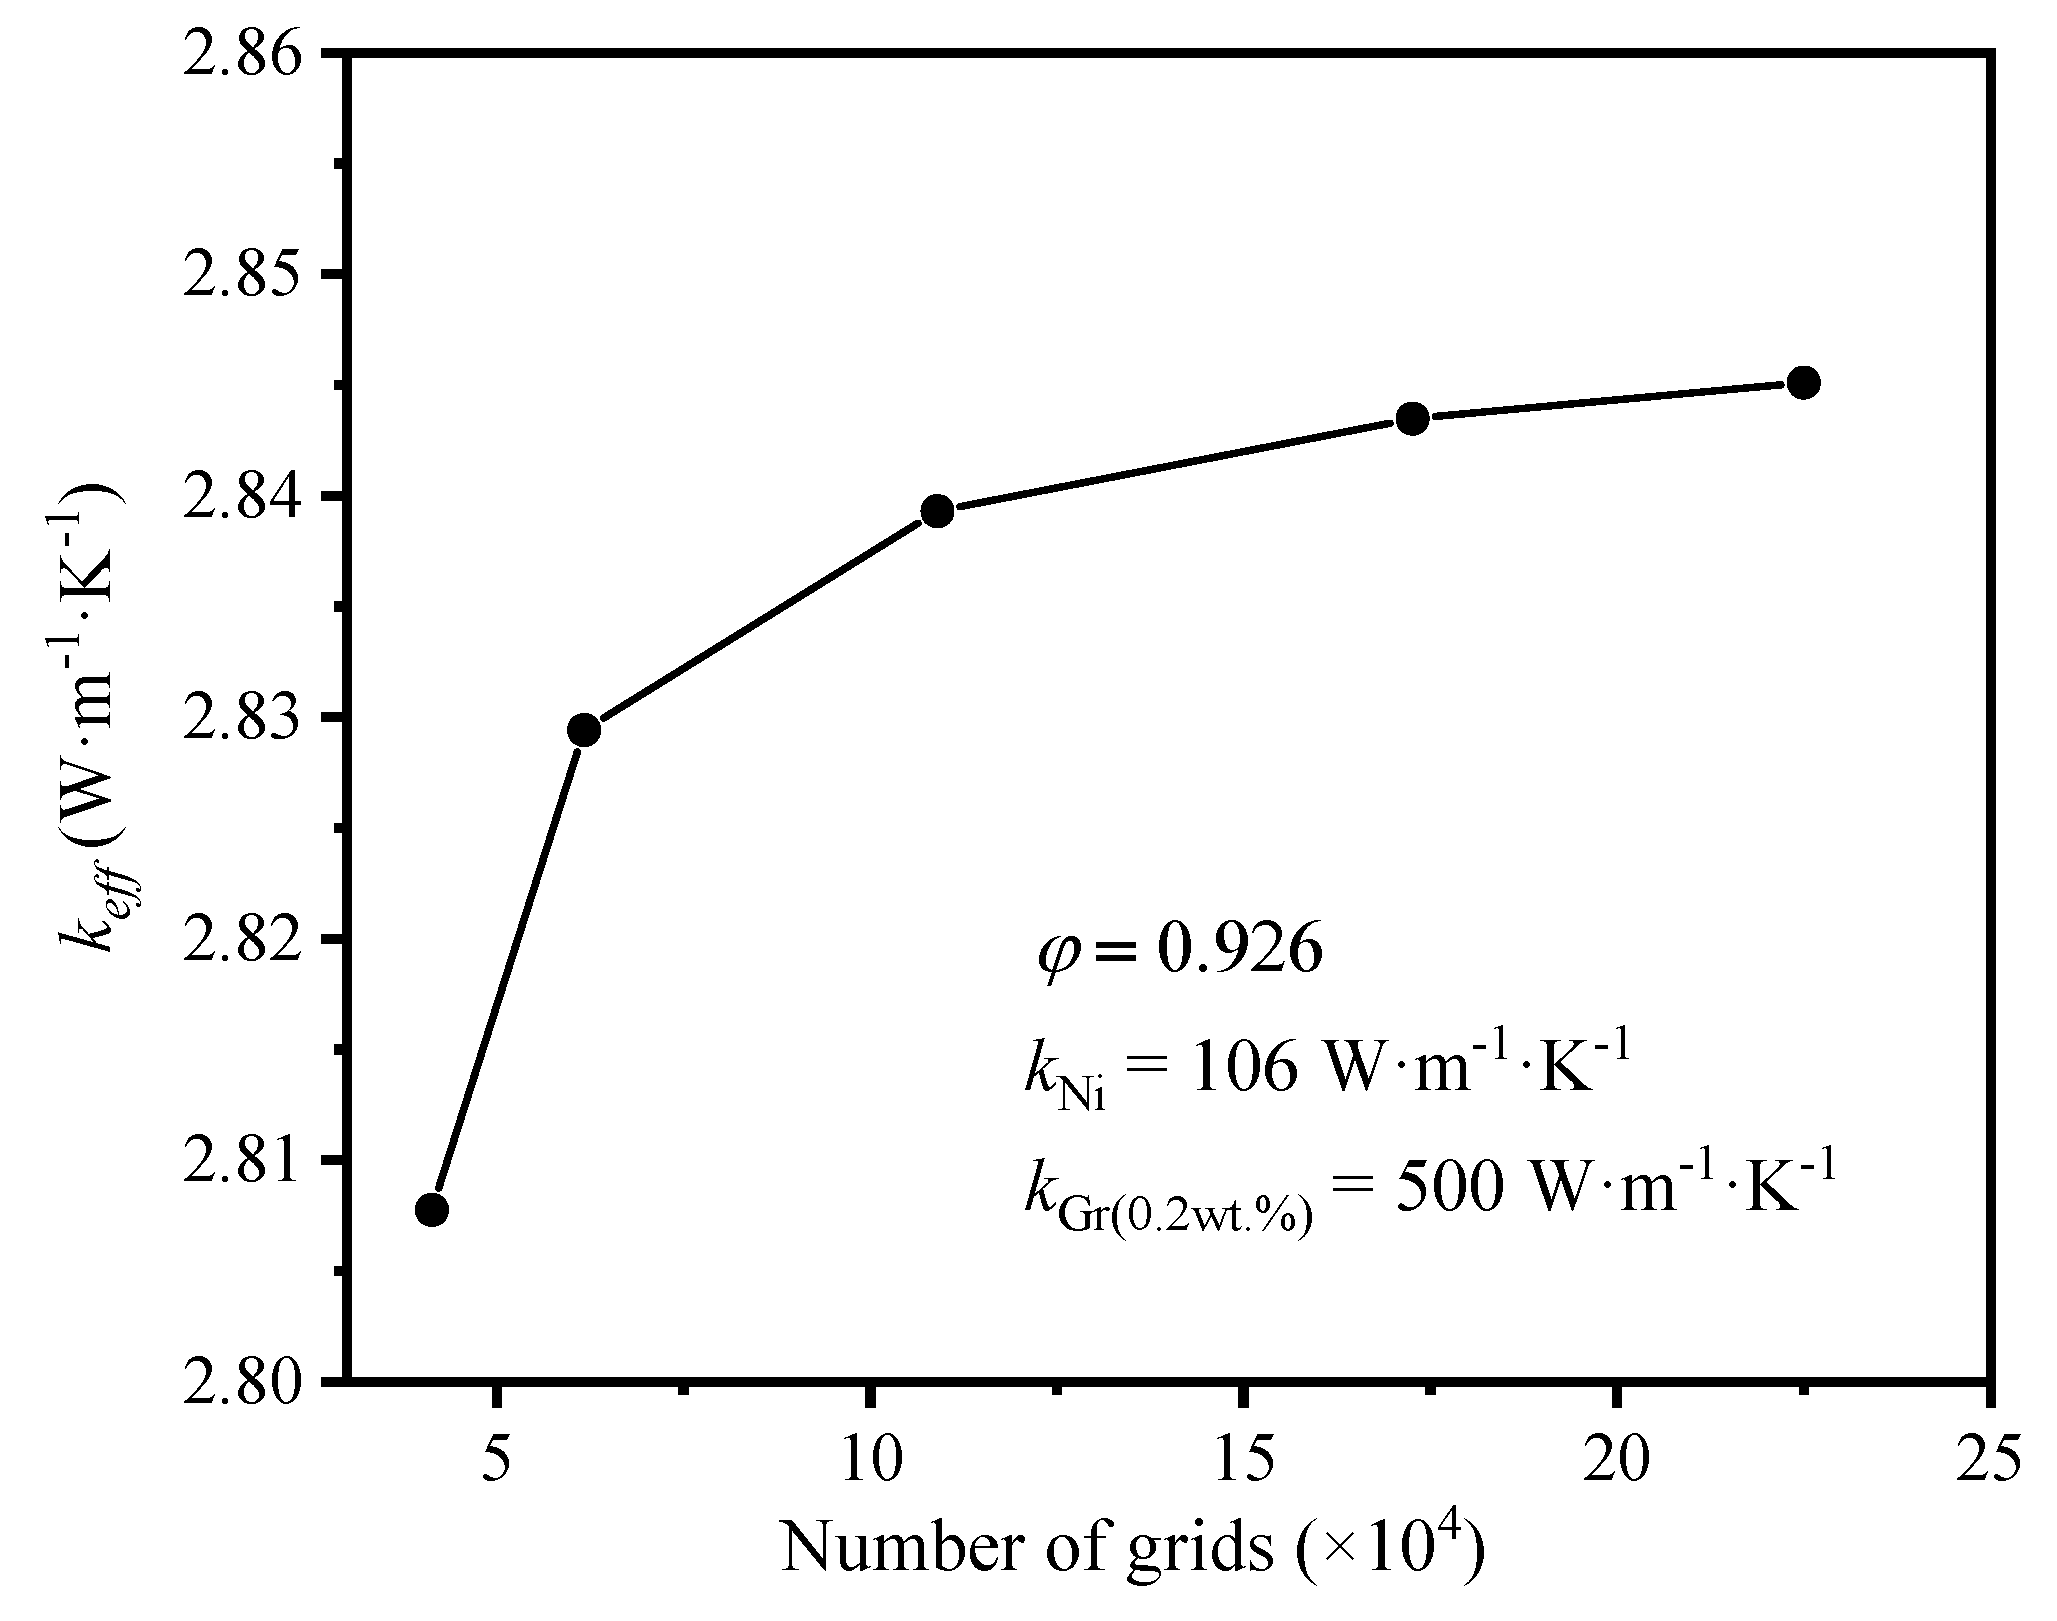
Figure 5.
Comparison between the numerical and experimental results (Graphene-Nickel/Epoxy).
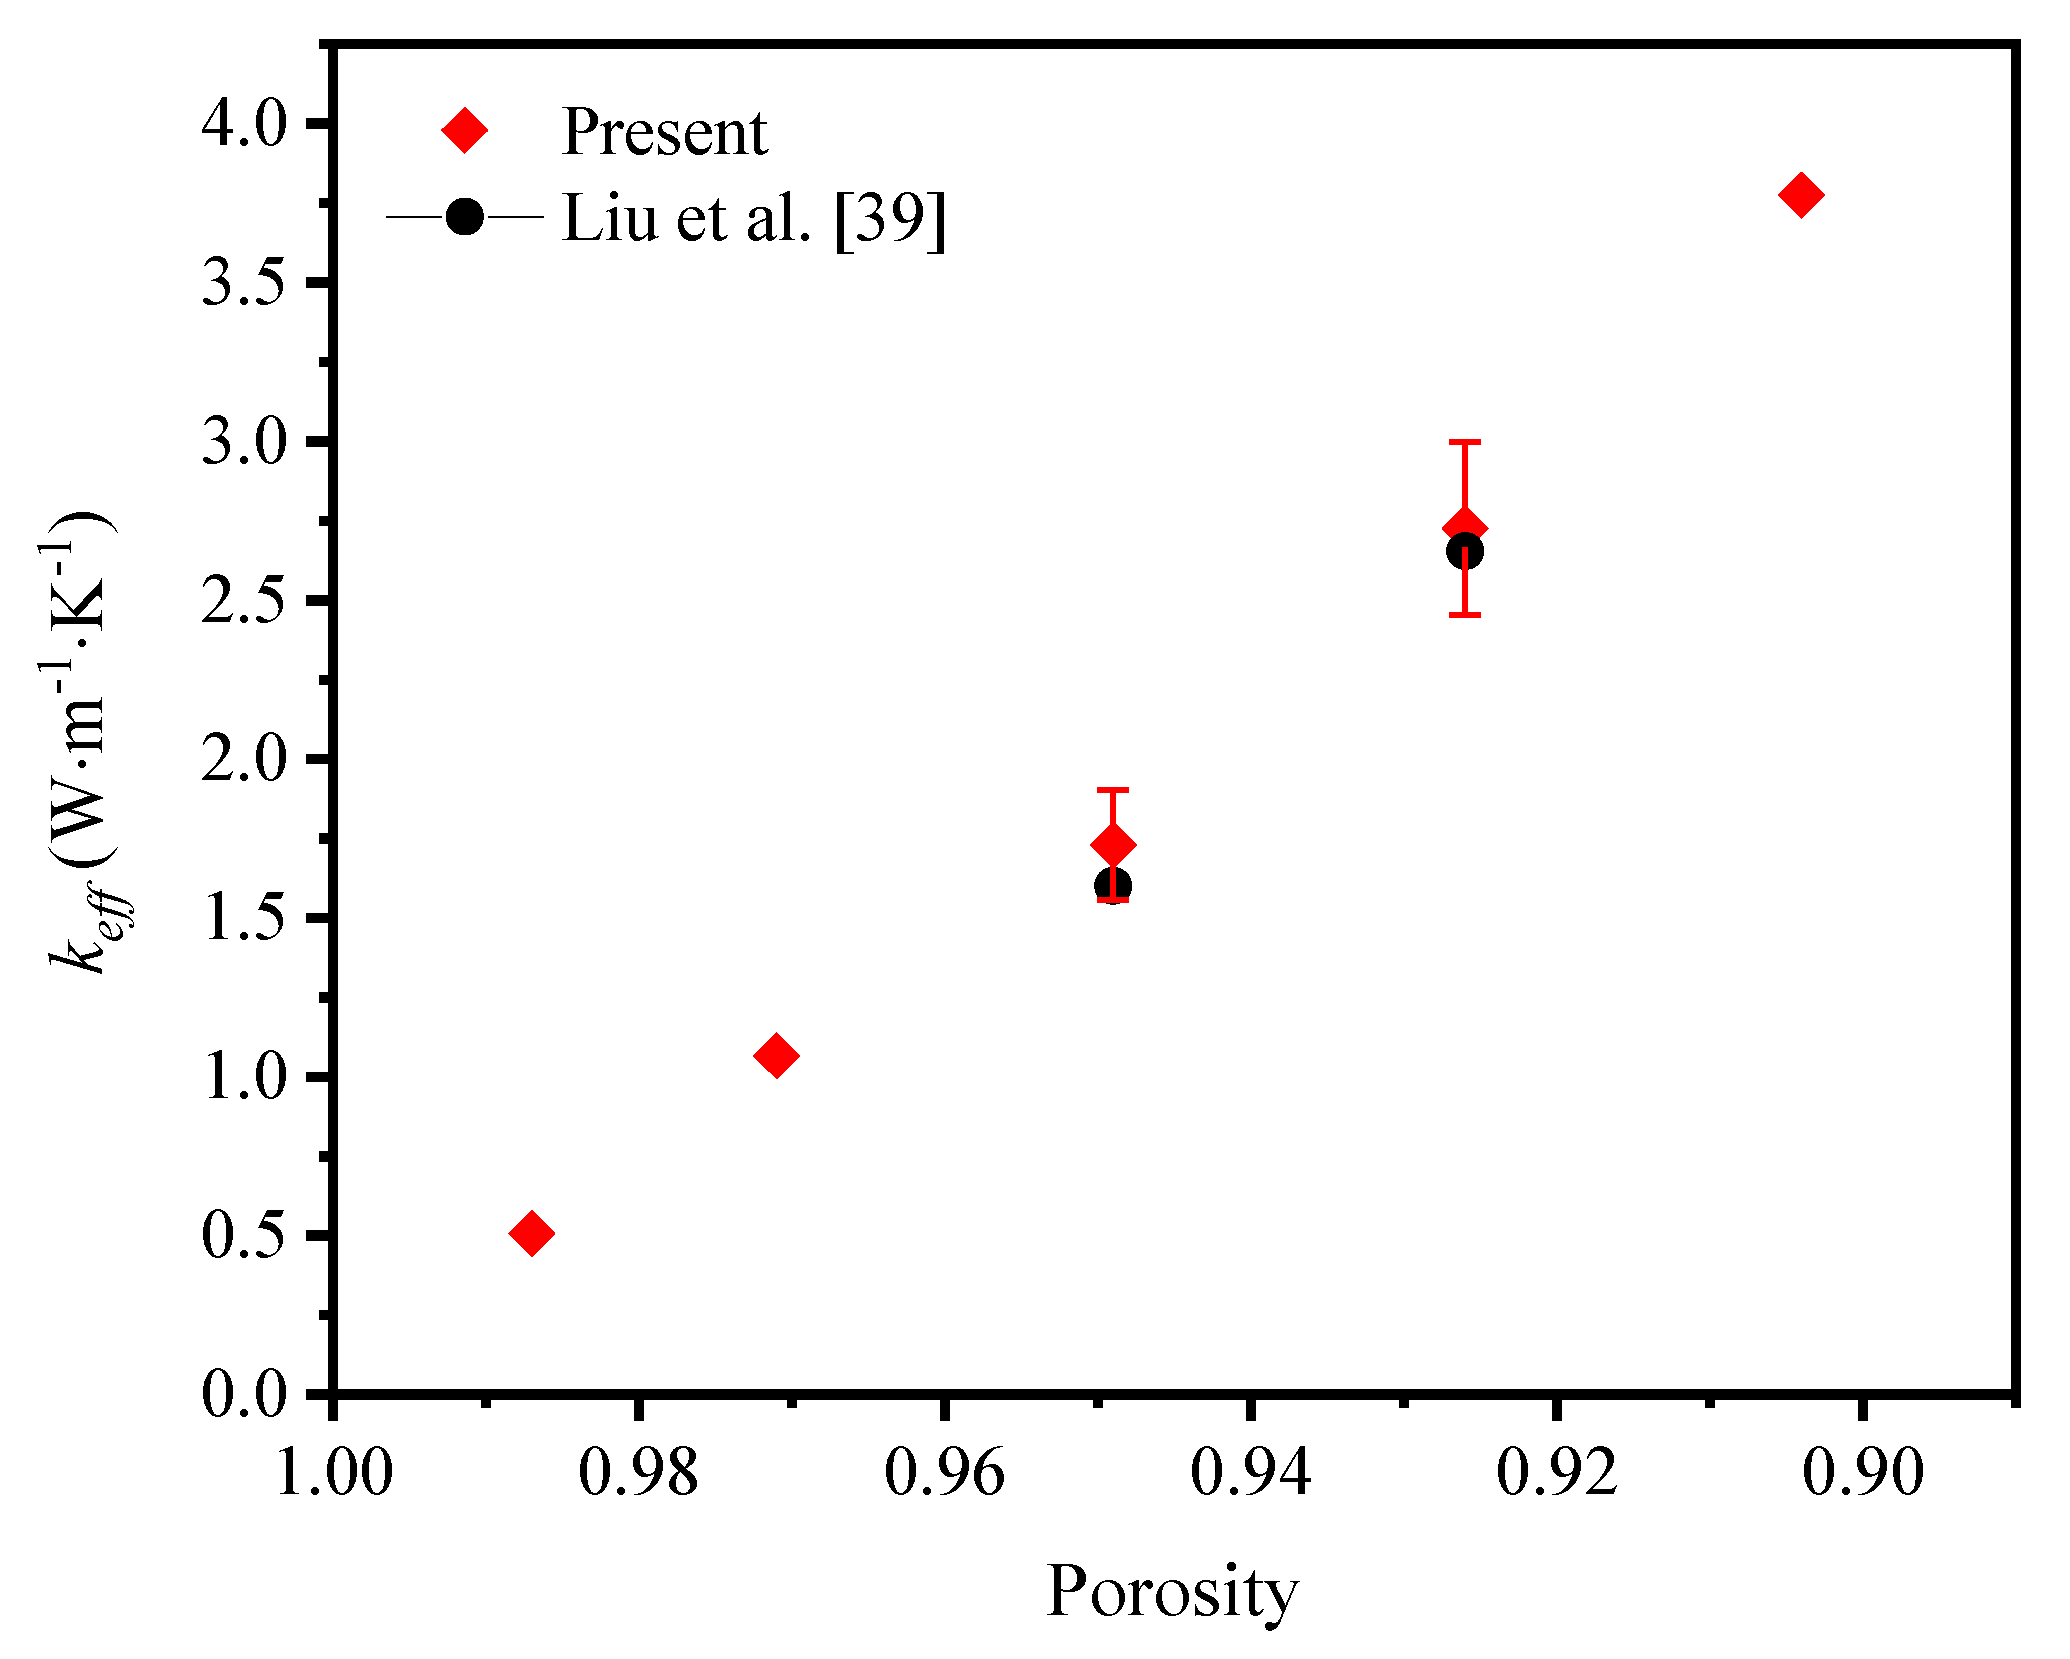
Figure 6.
Temperature distribution of the solid and fluid domain in different cross-section shapes of struts: (a) circular-shape struts; (b) triangular-shape struts.
Figure 6.
Temperature distribution of the solid and fluid domain in different cross-section shapes of struts: (a) circular-shape struts; (b) triangular-shape struts.
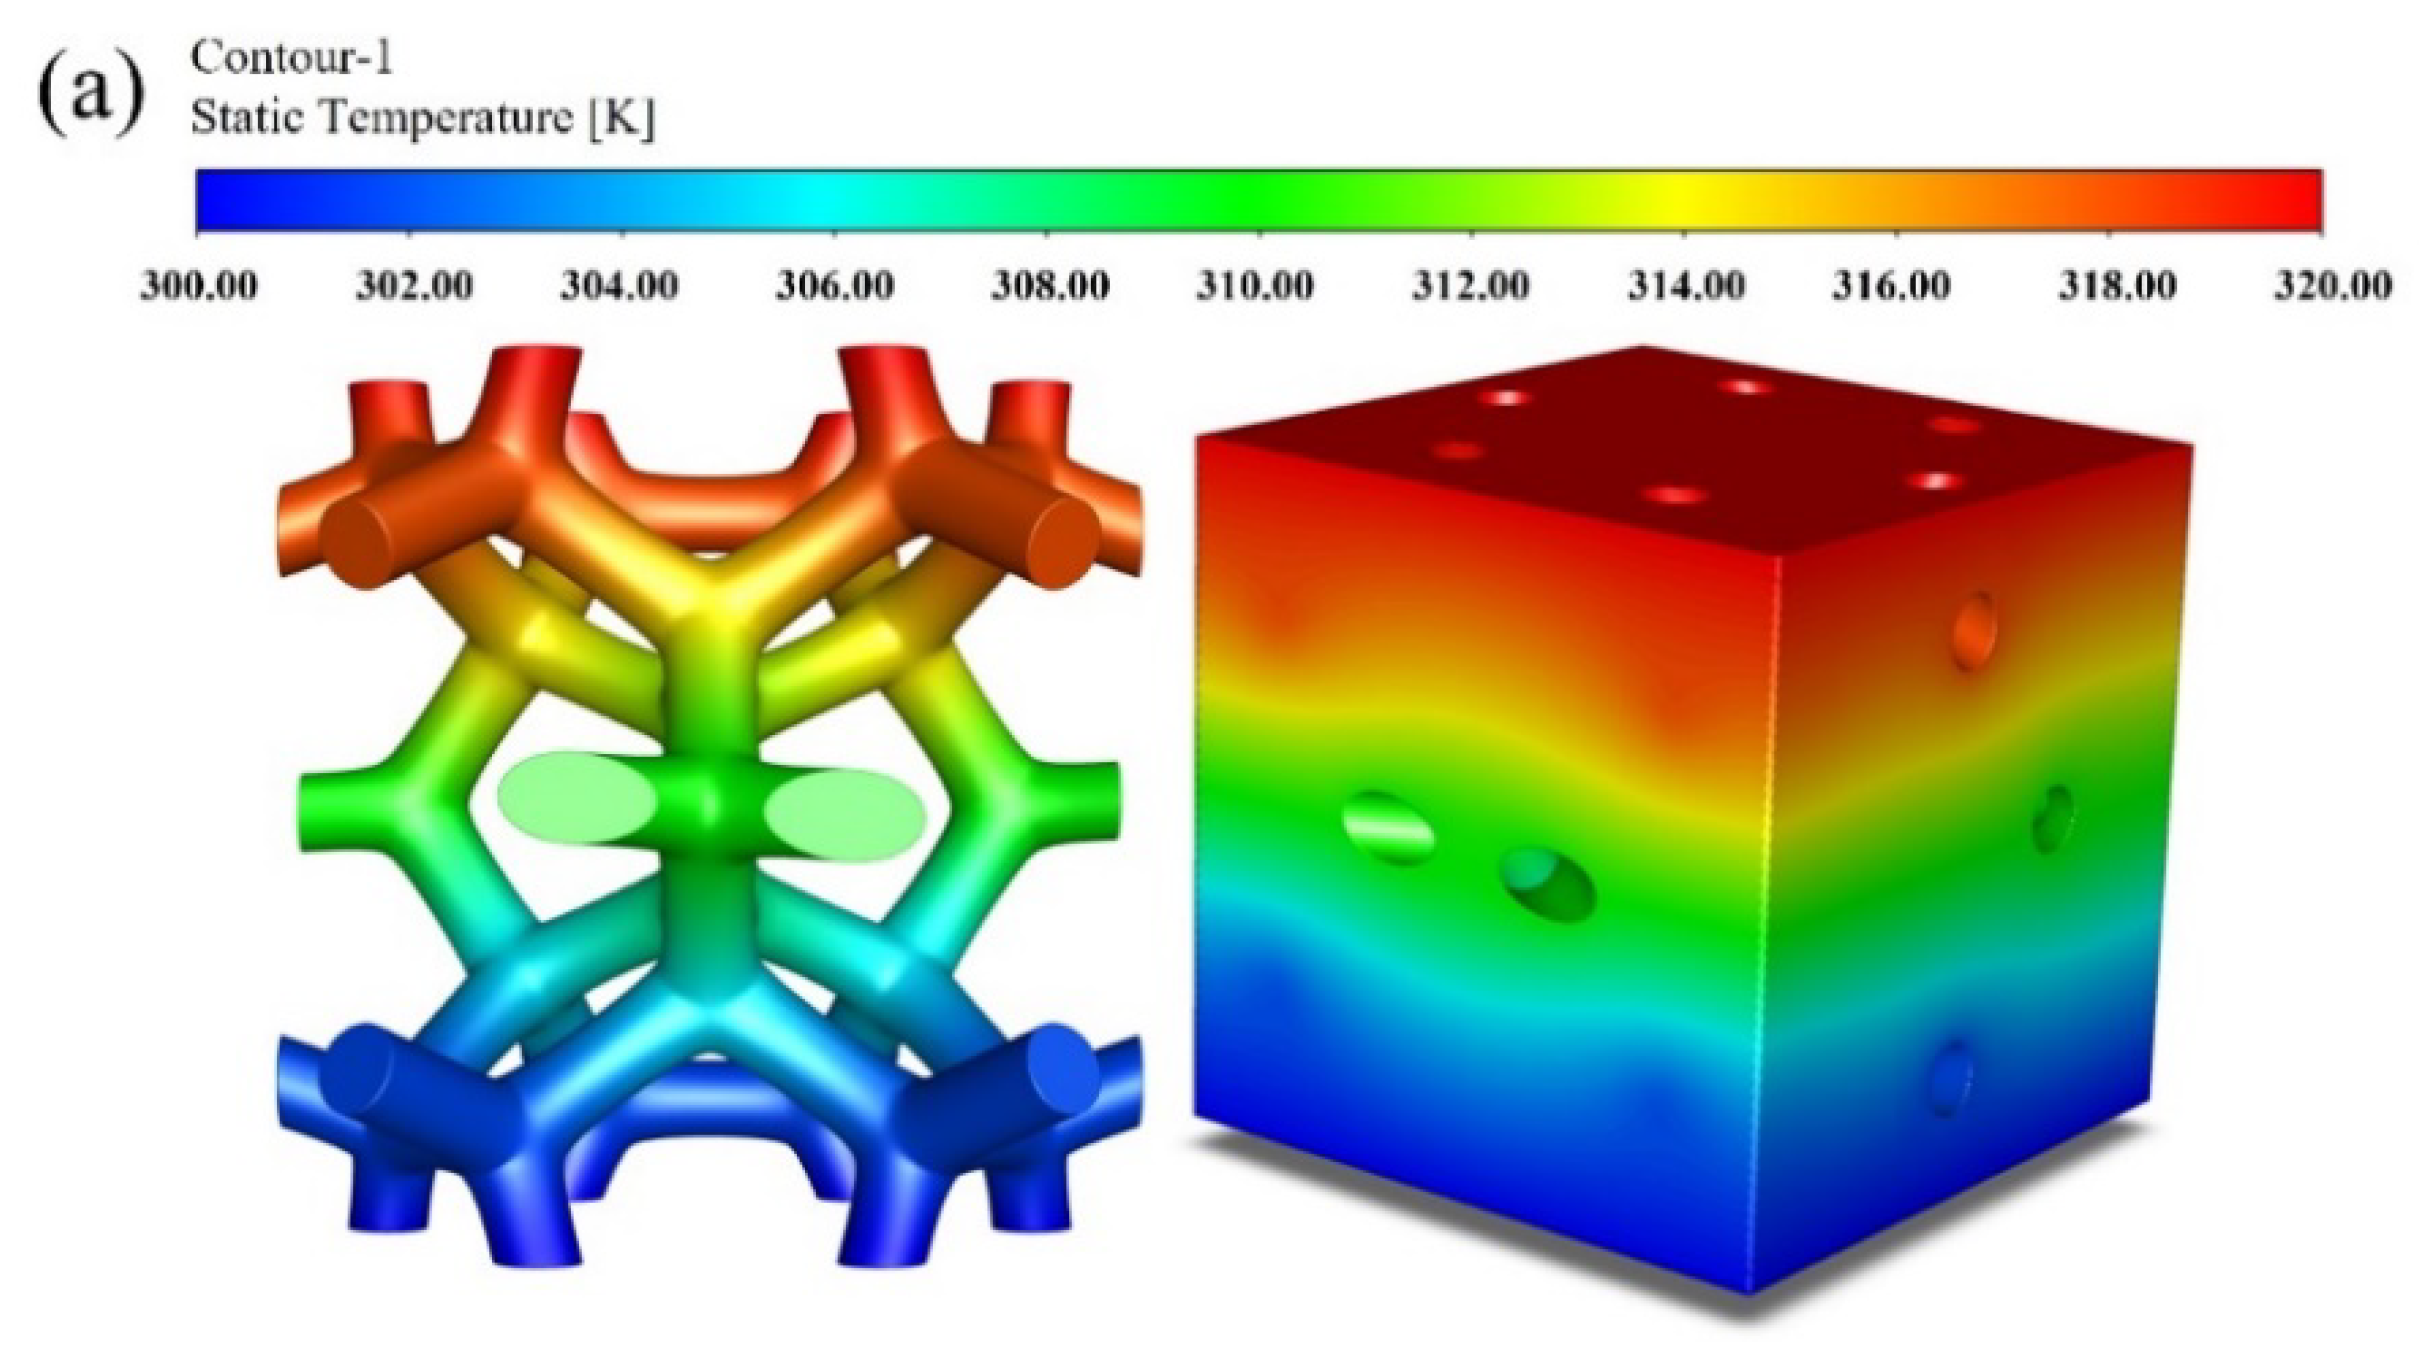
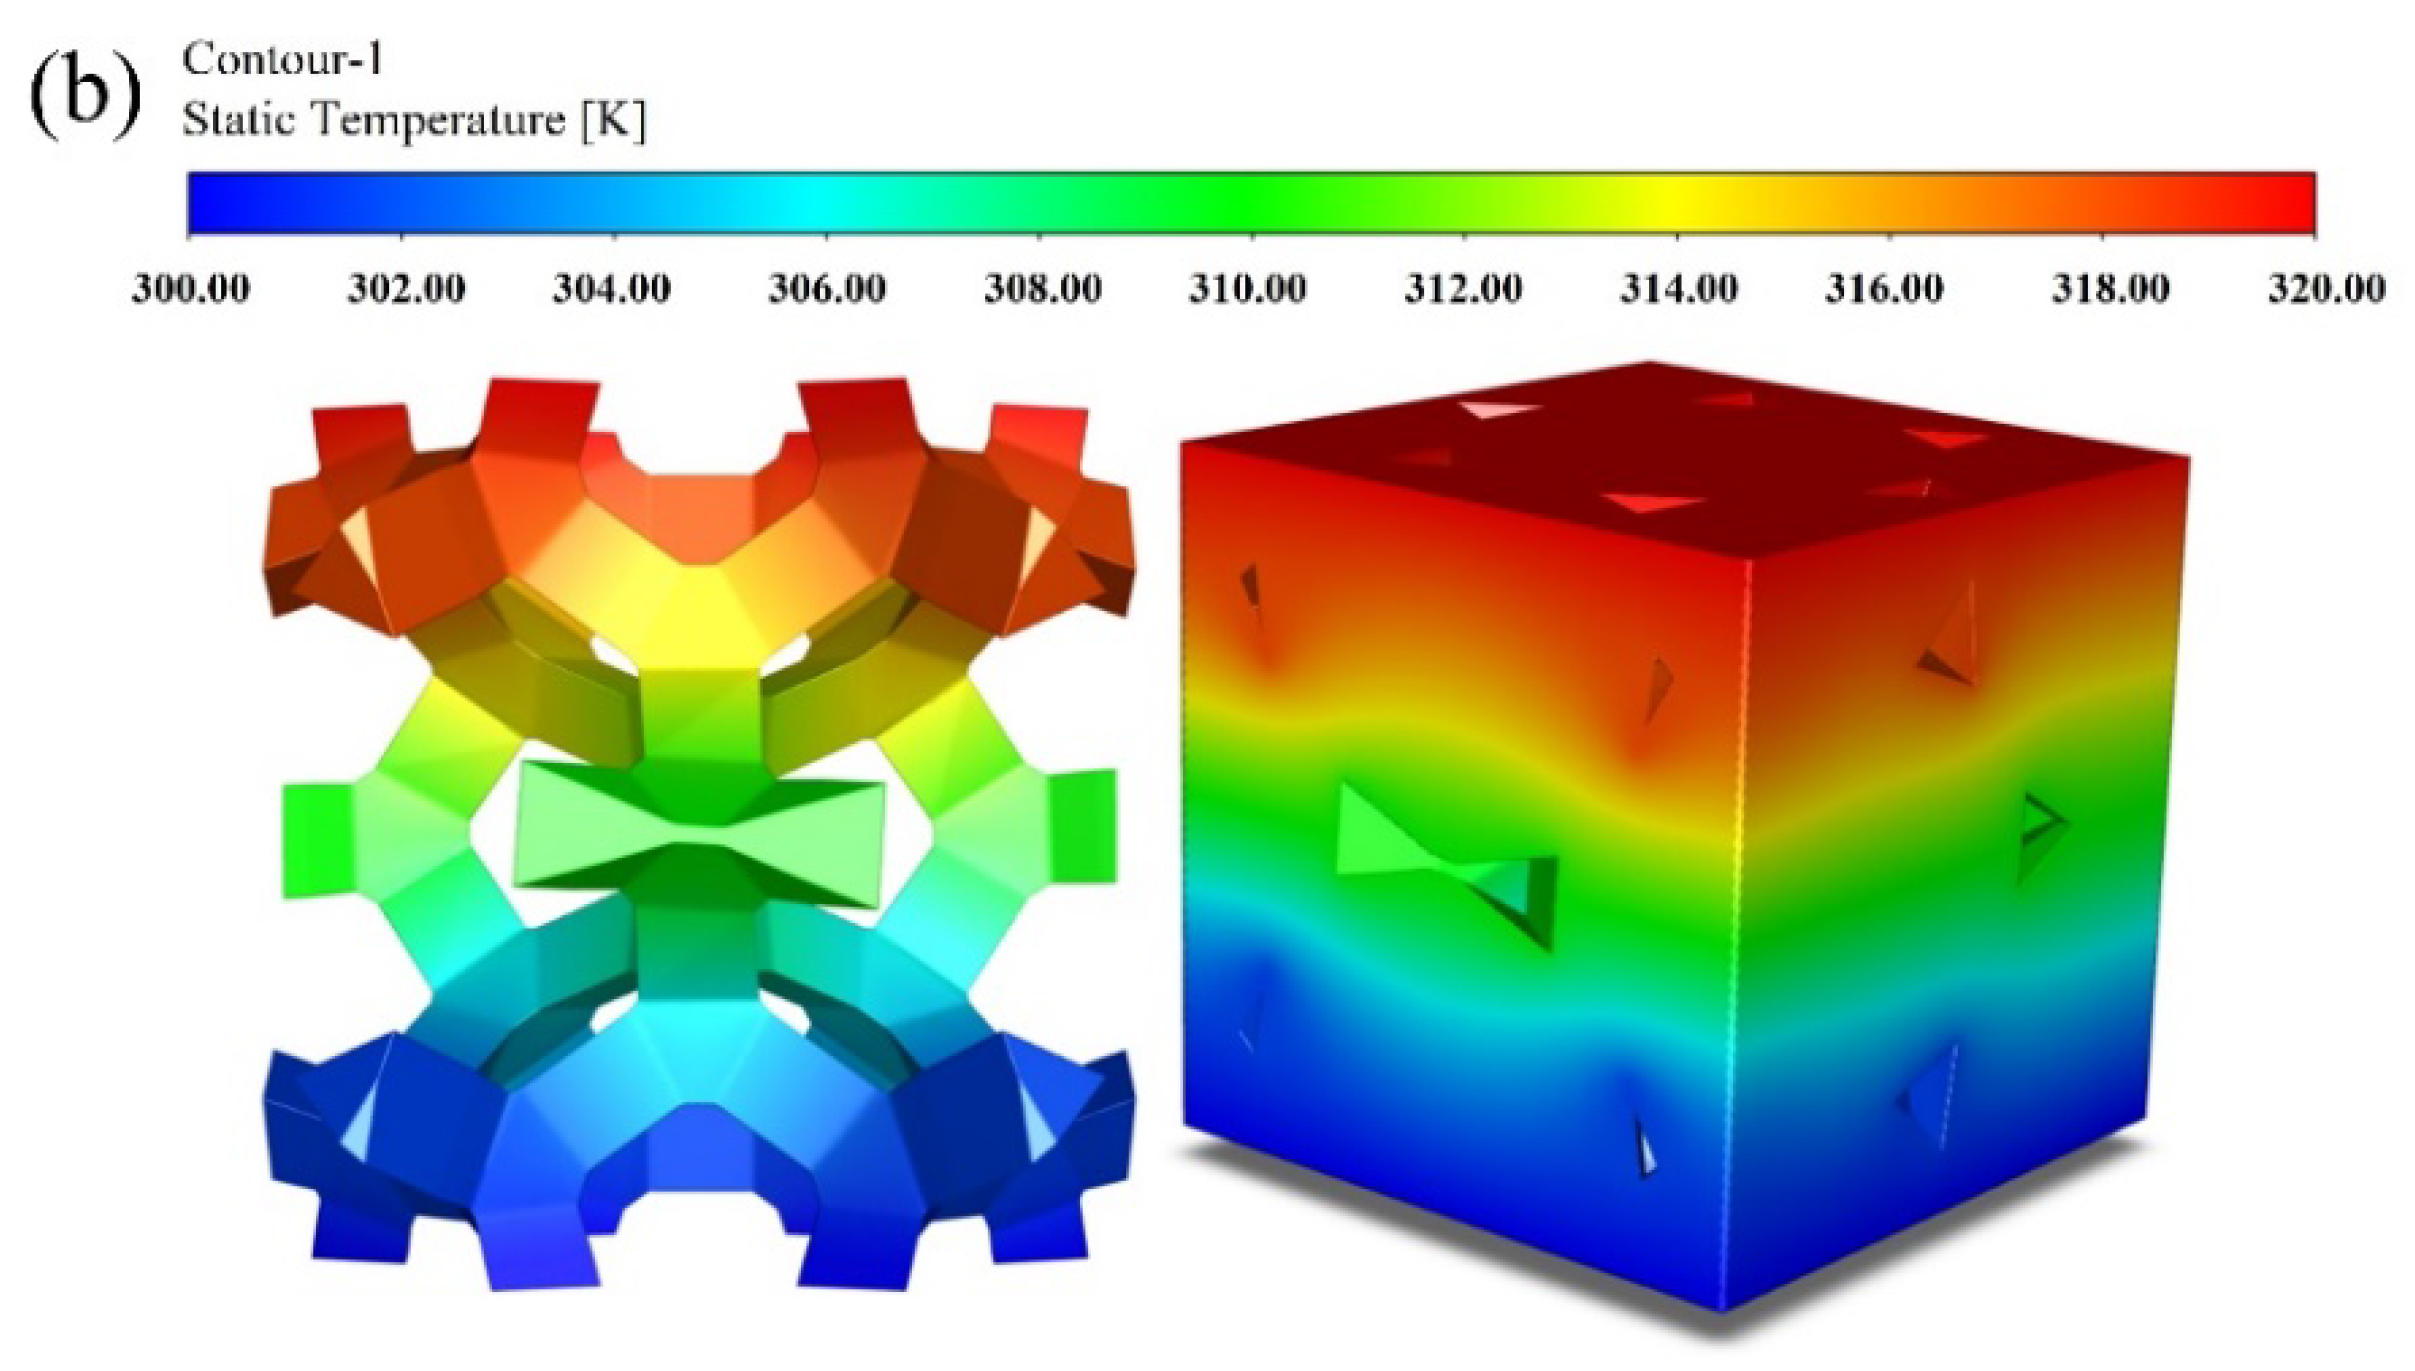
Figure 7.
Variation of effective thermal coefficient of circular-shape and triangular-shape struts with different porosities.
Figure 7.
Variation of effective thermal coefficient of circular-shape and triangular-shape struts with different porosities.
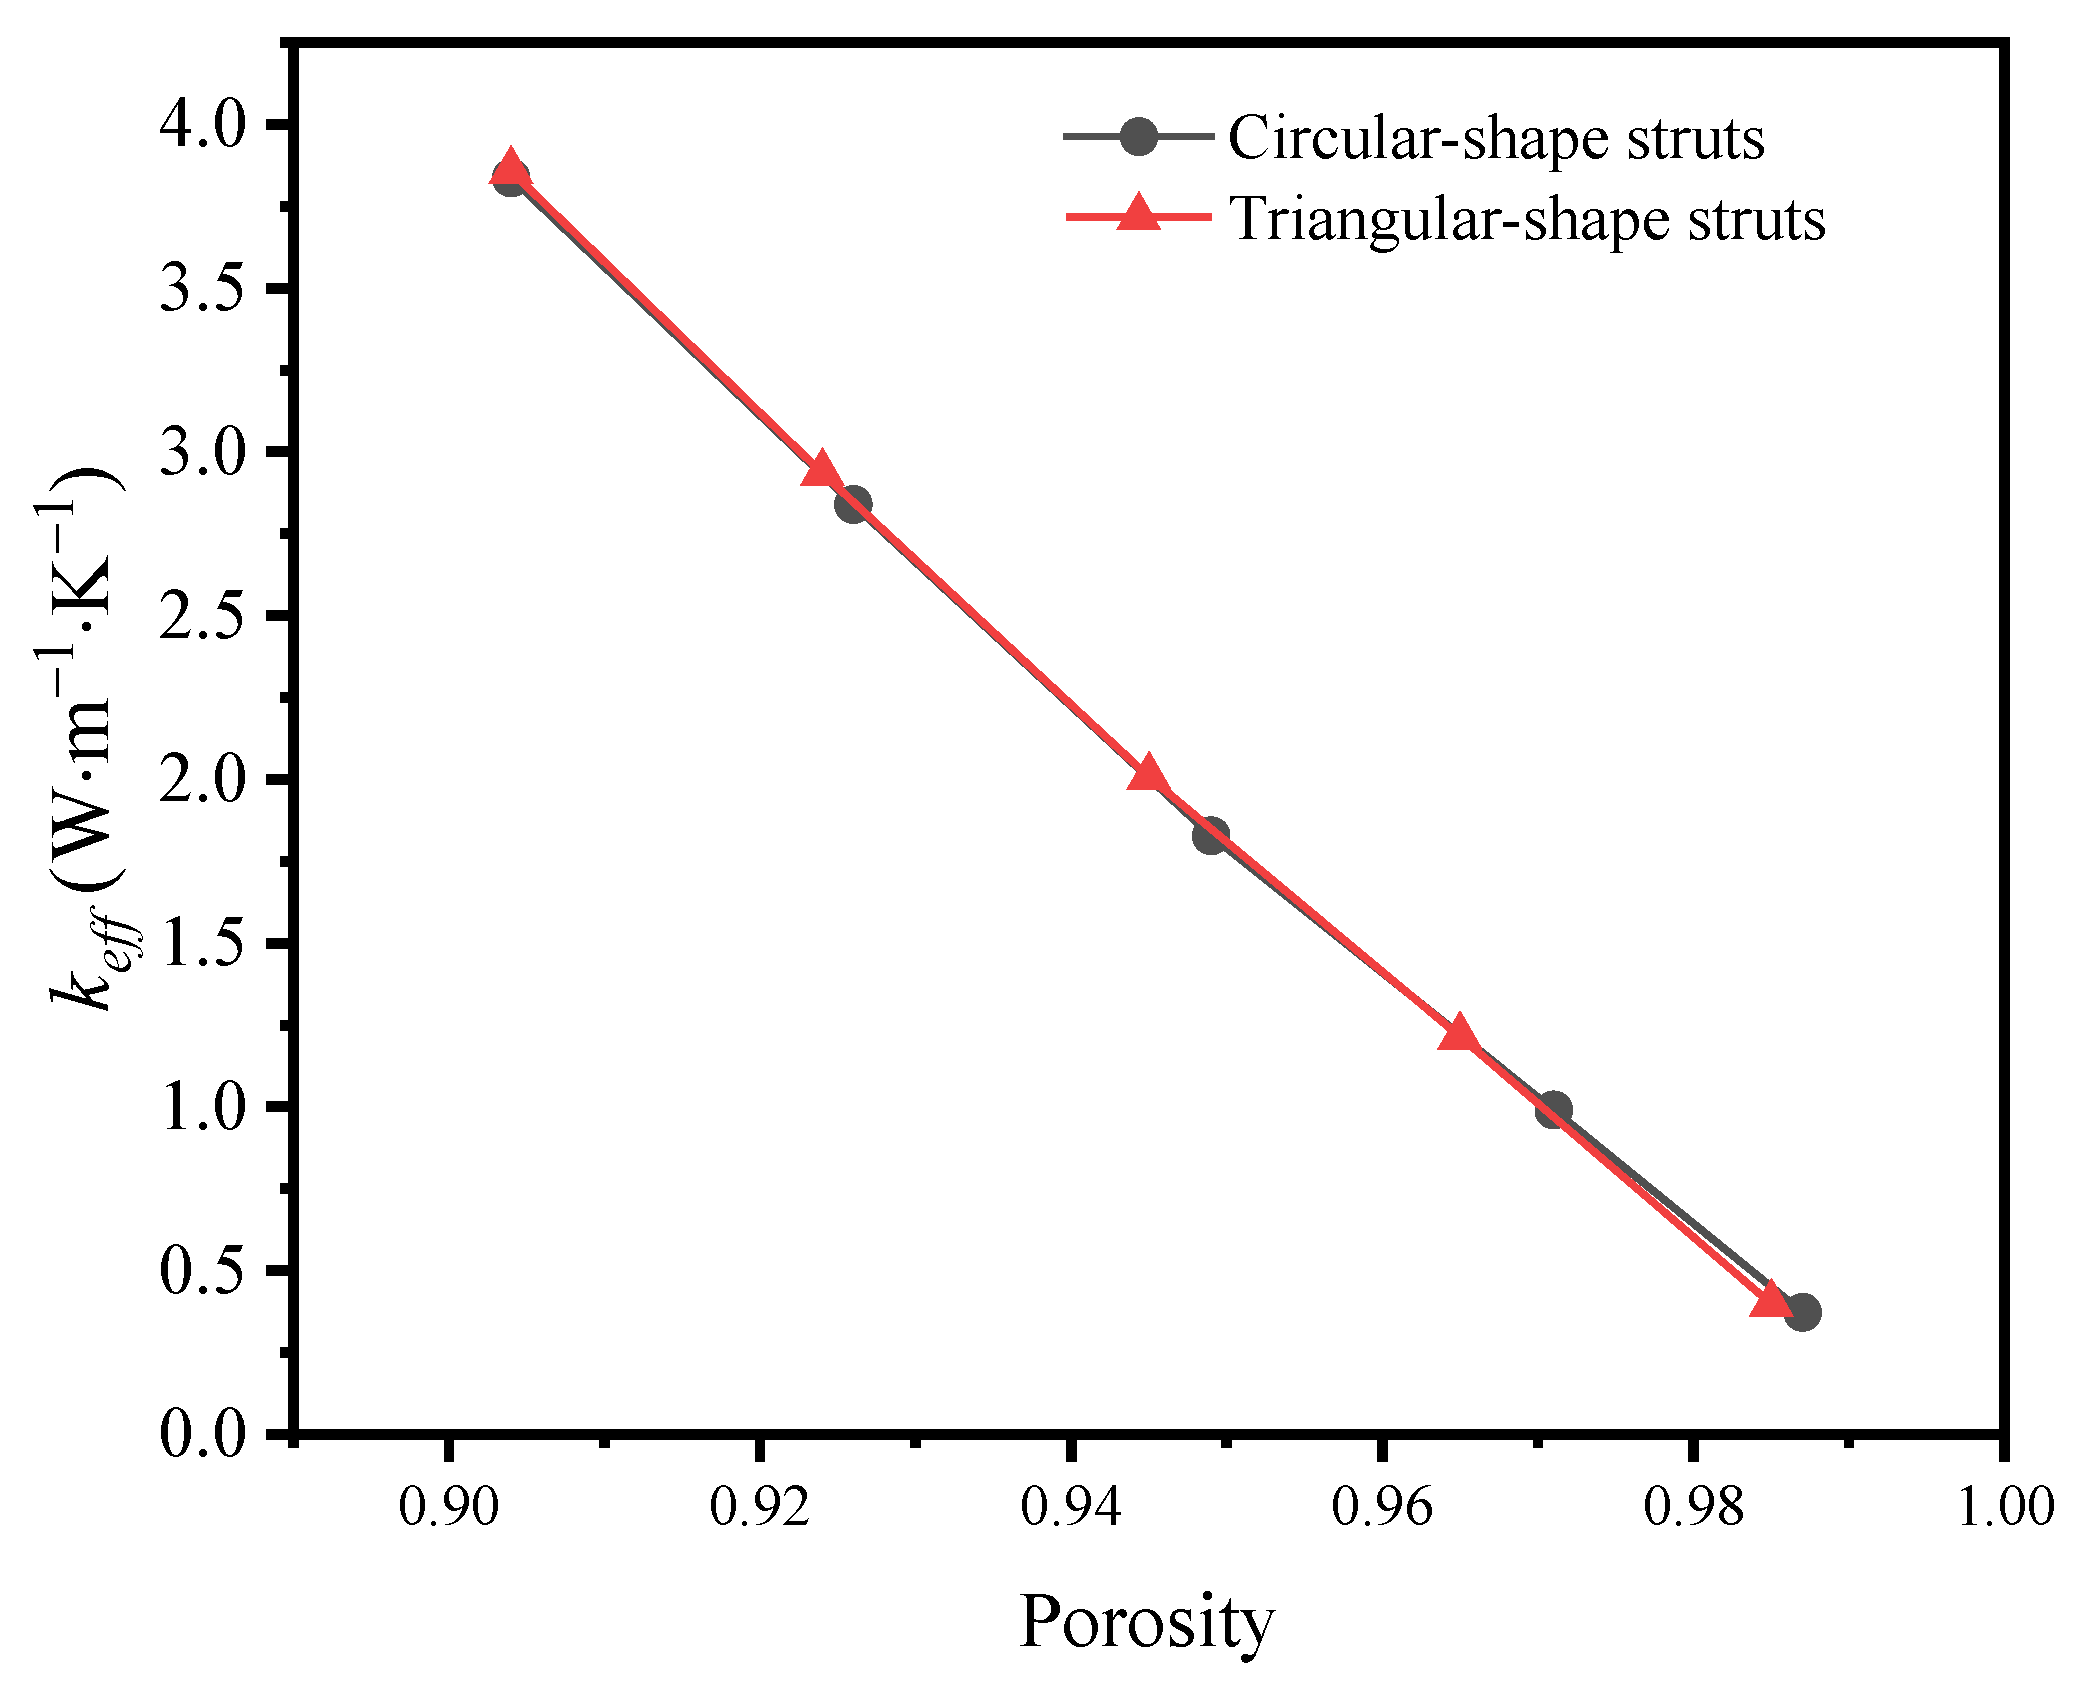
Figure 8.
Variation of effective thermal coefficient with graphene mass fraction.
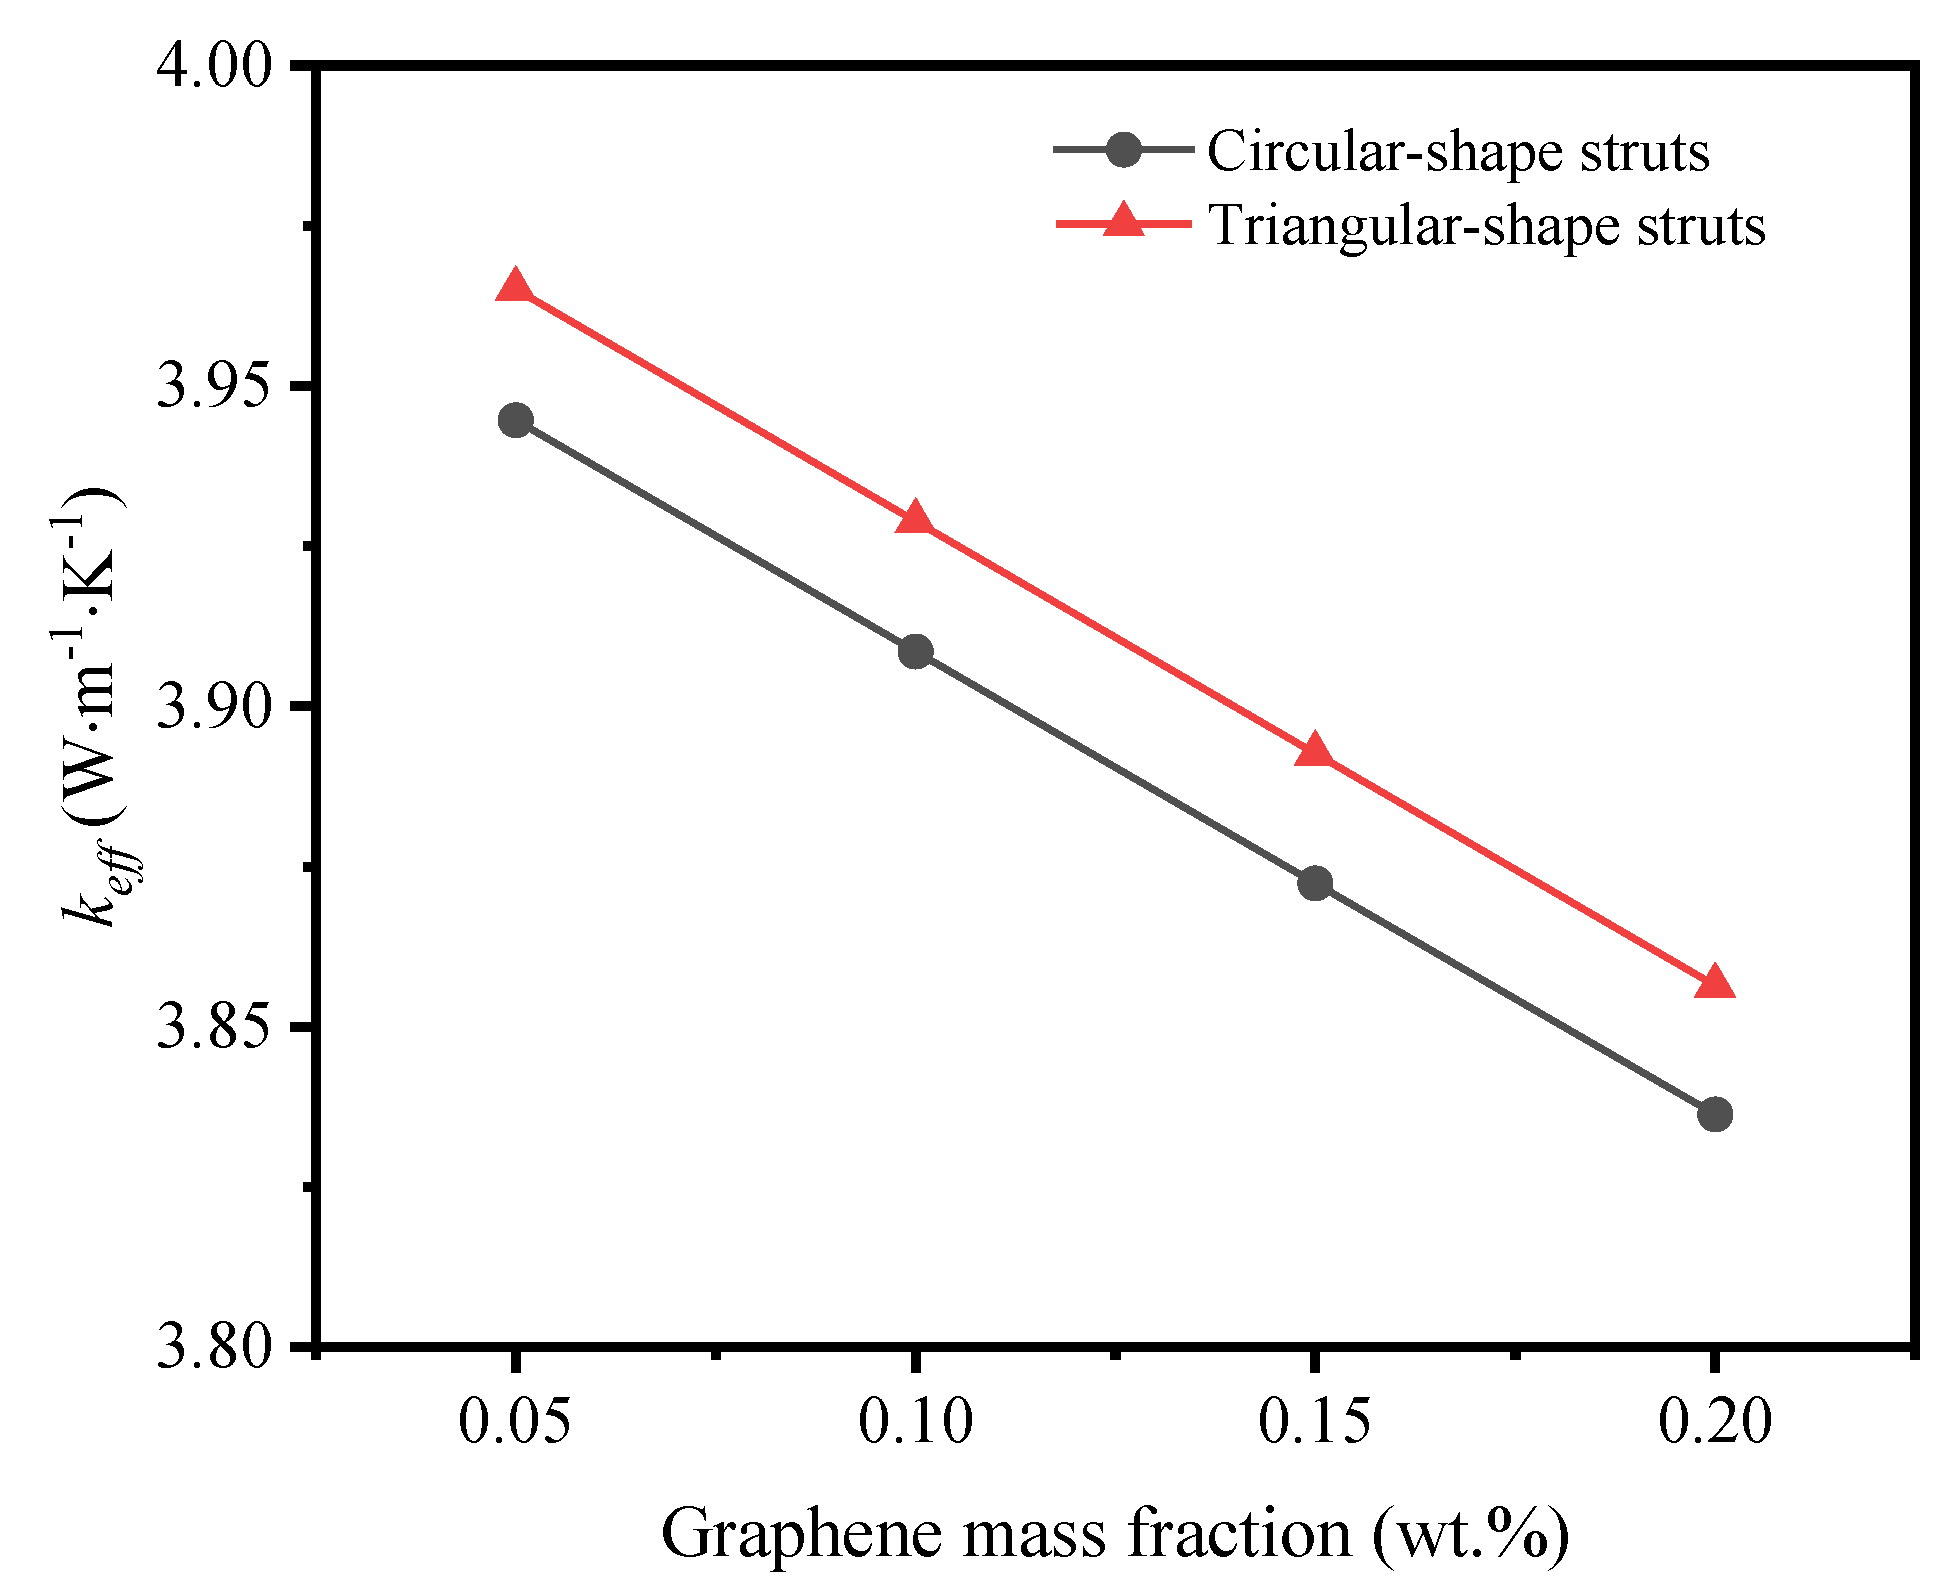
Figure 9.
Effective thermal coefficient of GF composite depending on the mean temperature: (a) circular-shape struts, (b) triangular-shape struts.
Figure 9.
Effective thermal coefficient of GF composite depending on the mean temperature: (a) circular-shape struts, (b) triangular-shape struts.
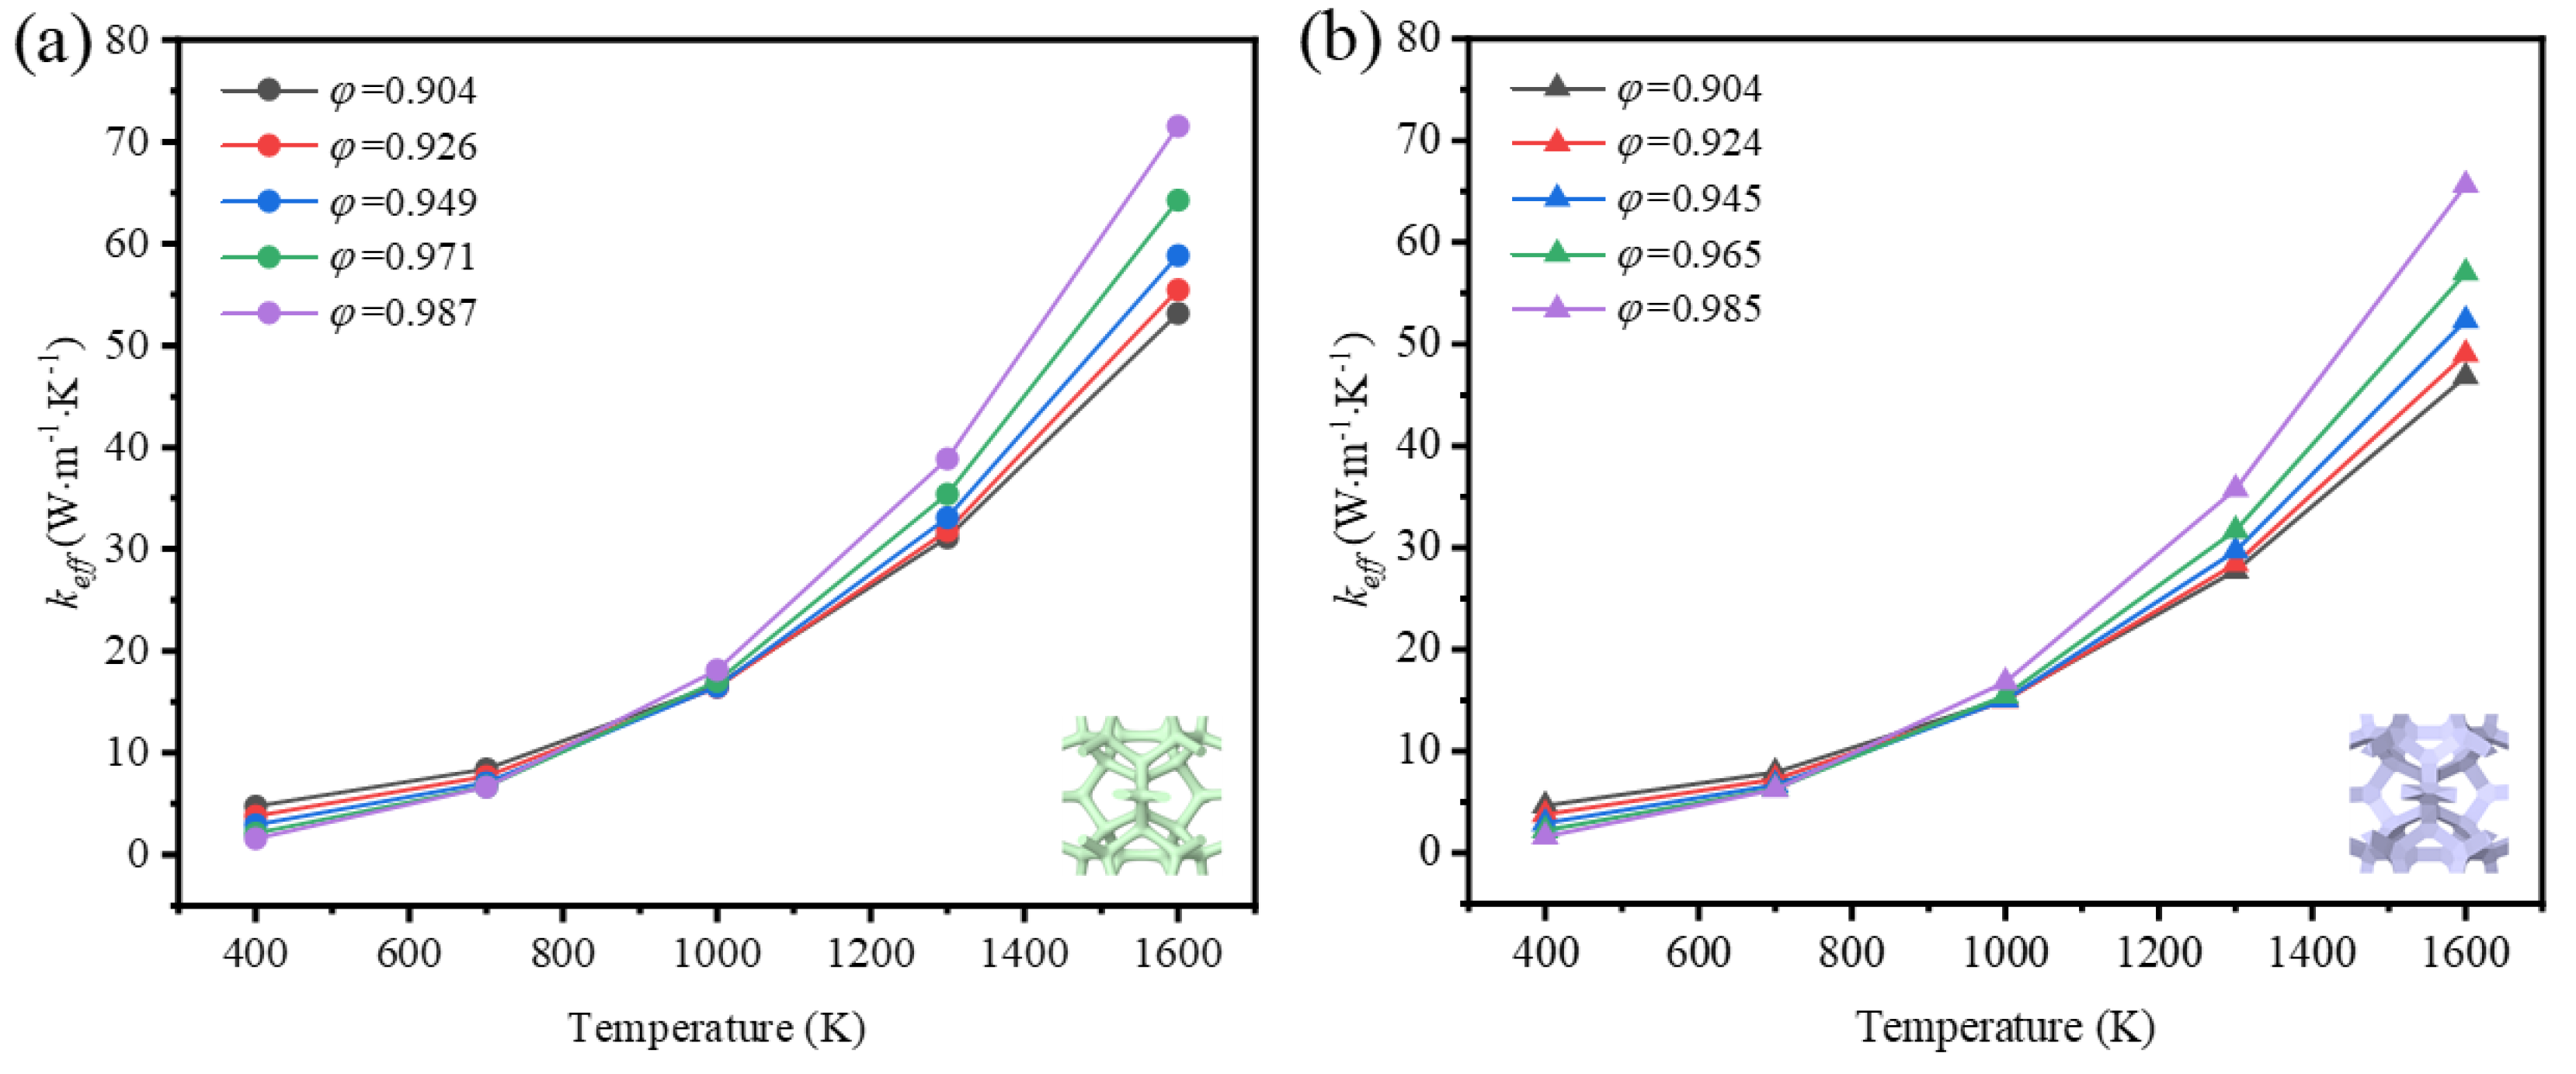
Figure 10.
Variation of effective thermal coefficient and thermal radiation contribution with temperature in GF composite with circular-shape struts at different porosities (φ): (a) φ=0.904; (b) φ=0.987.
Figure 10.
Variation of effective thermal coefficient and thermal radiation contribution with temperature in GF composite with circular-shape struts at different porosities (φ): (a) φ=0.904; (b) φ=0.987.
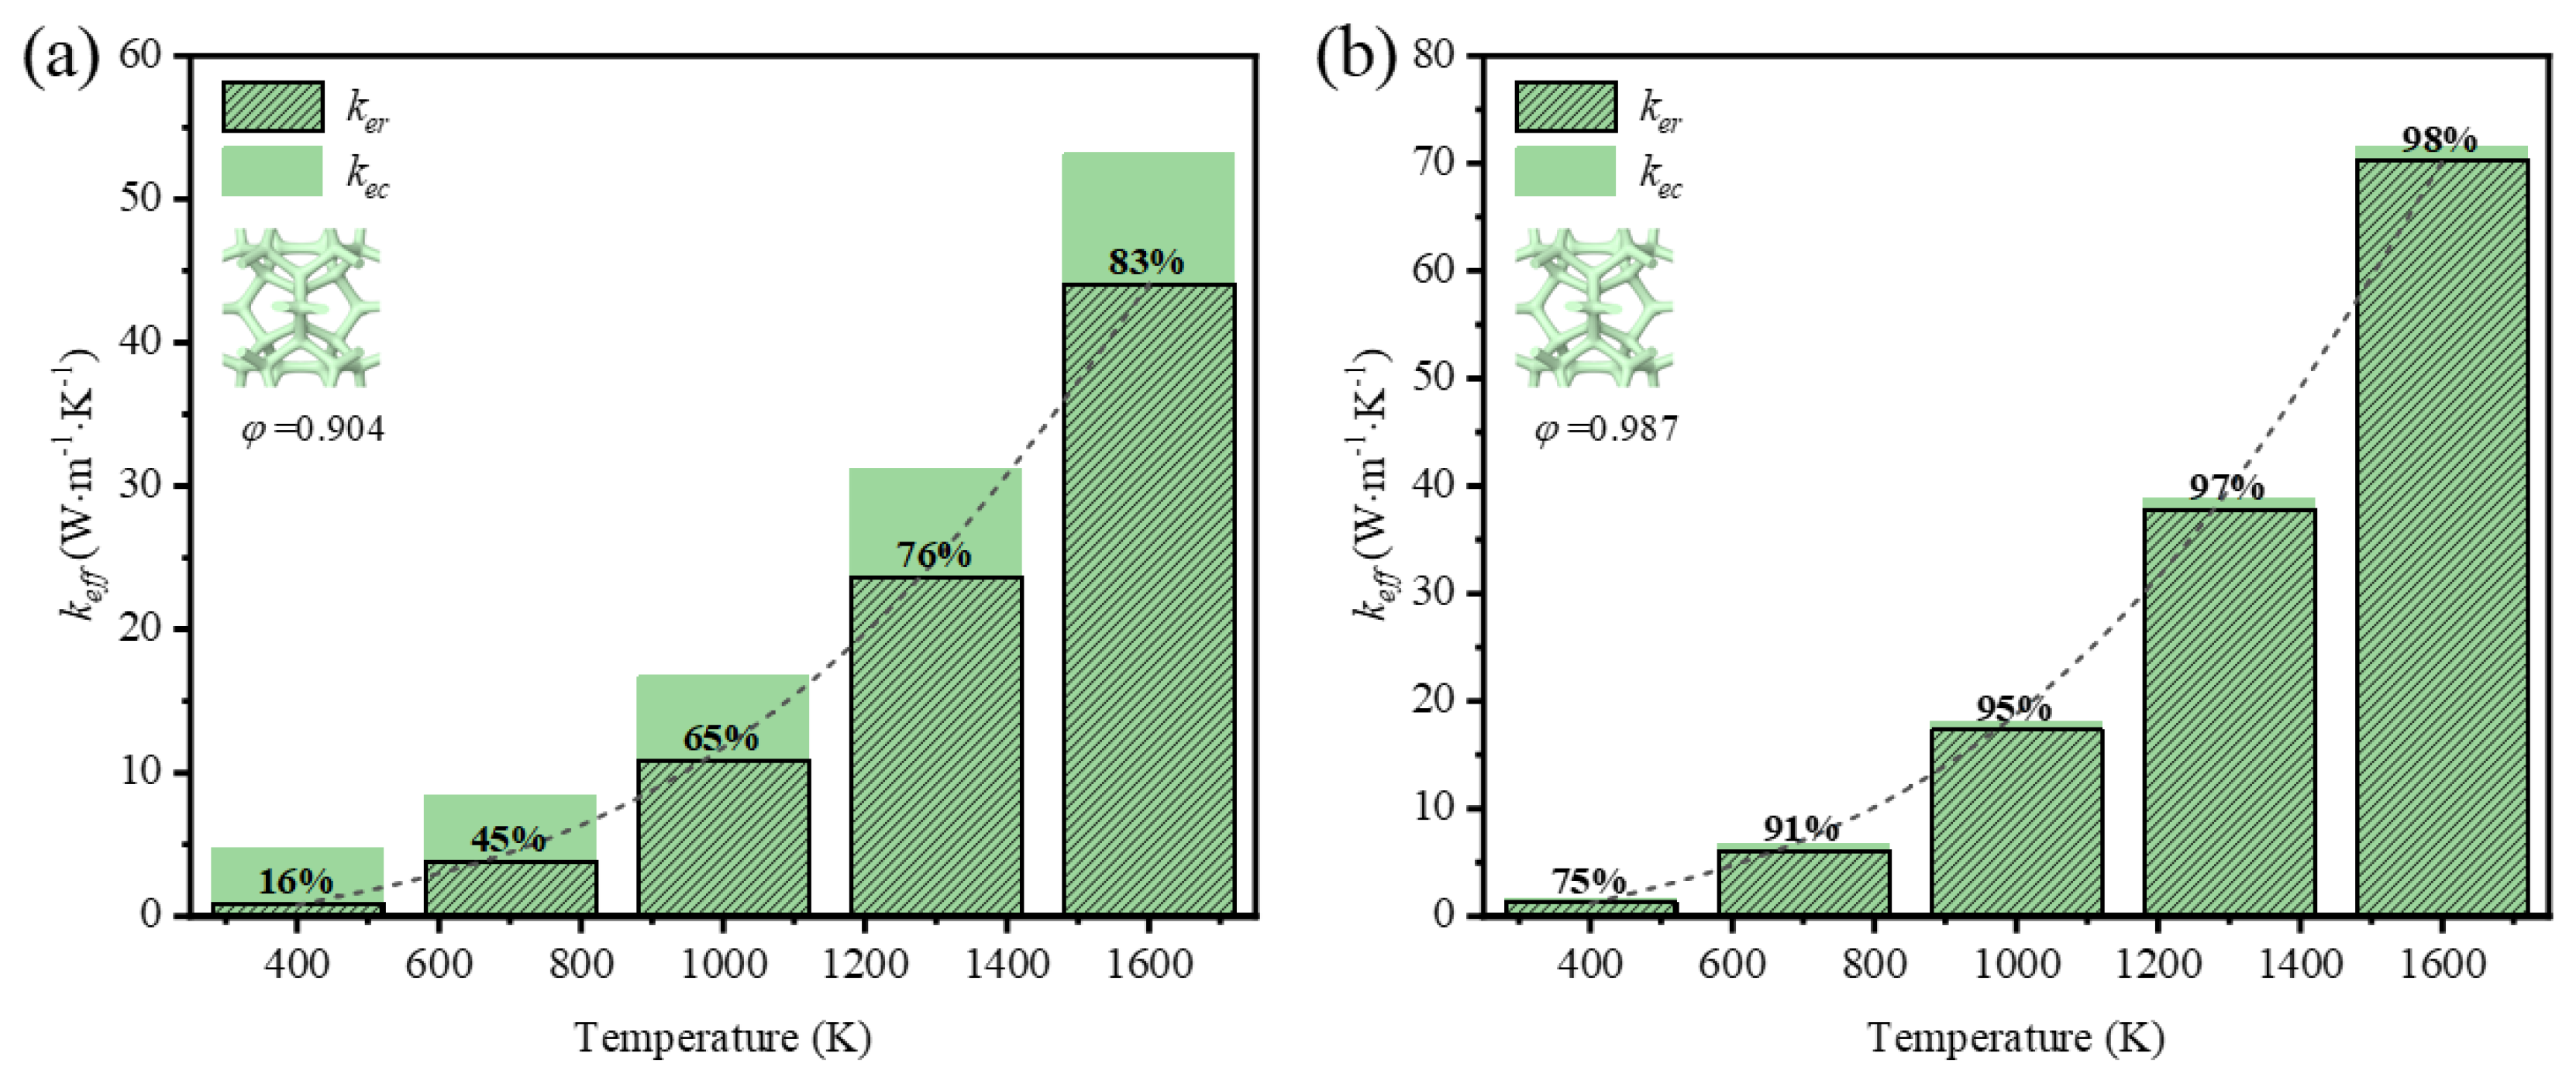
Figure 11.
Variation of effective thermal coefficient and thermal radiation contribution with temperature in GF composite with triangular-shape struts at: (a) φ=0.904; (b) φ=0.985.
Figure 11.
Variation of effective thermal coefficient and thermal radiation contribution with temperature in GF composite with triangular-shape struts at: (a) φ=0.904; (b) φ=0.985.
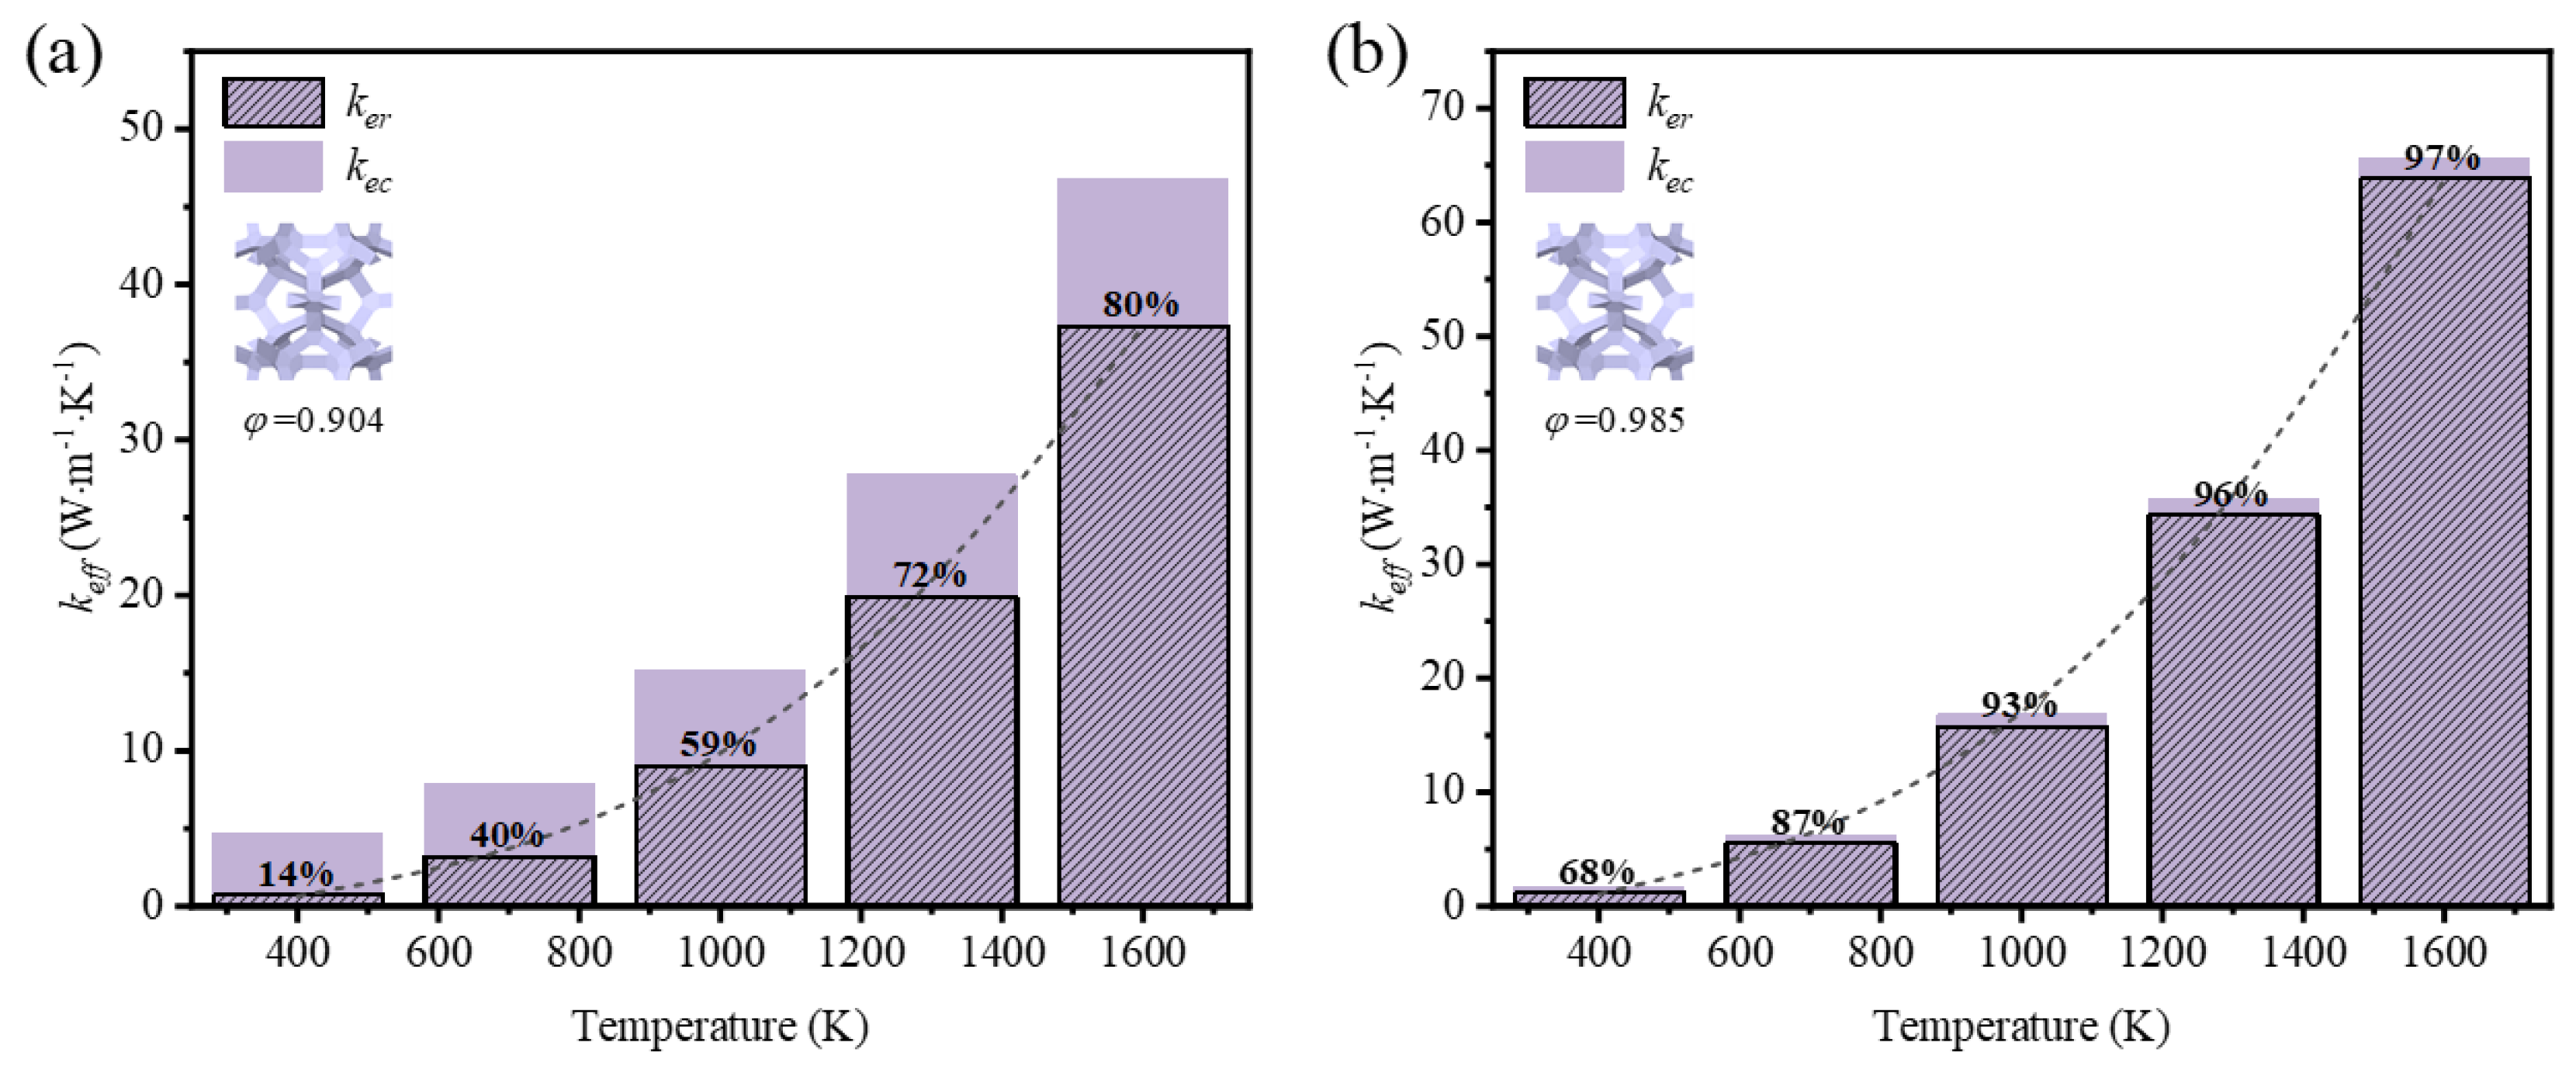
Figure 12.
Variation of effective thermal coefficient and contribution of thermal radiation with porosity of foam with circular-shape struts at: (a) T=400 K; (b) T=1600 K.
Figure 12.
Variation of effective thermal coefficient and contribution of thermal radiation with porosity of foam with circular-shape struts at: (a) T=400 K; (b) T=1600 K.
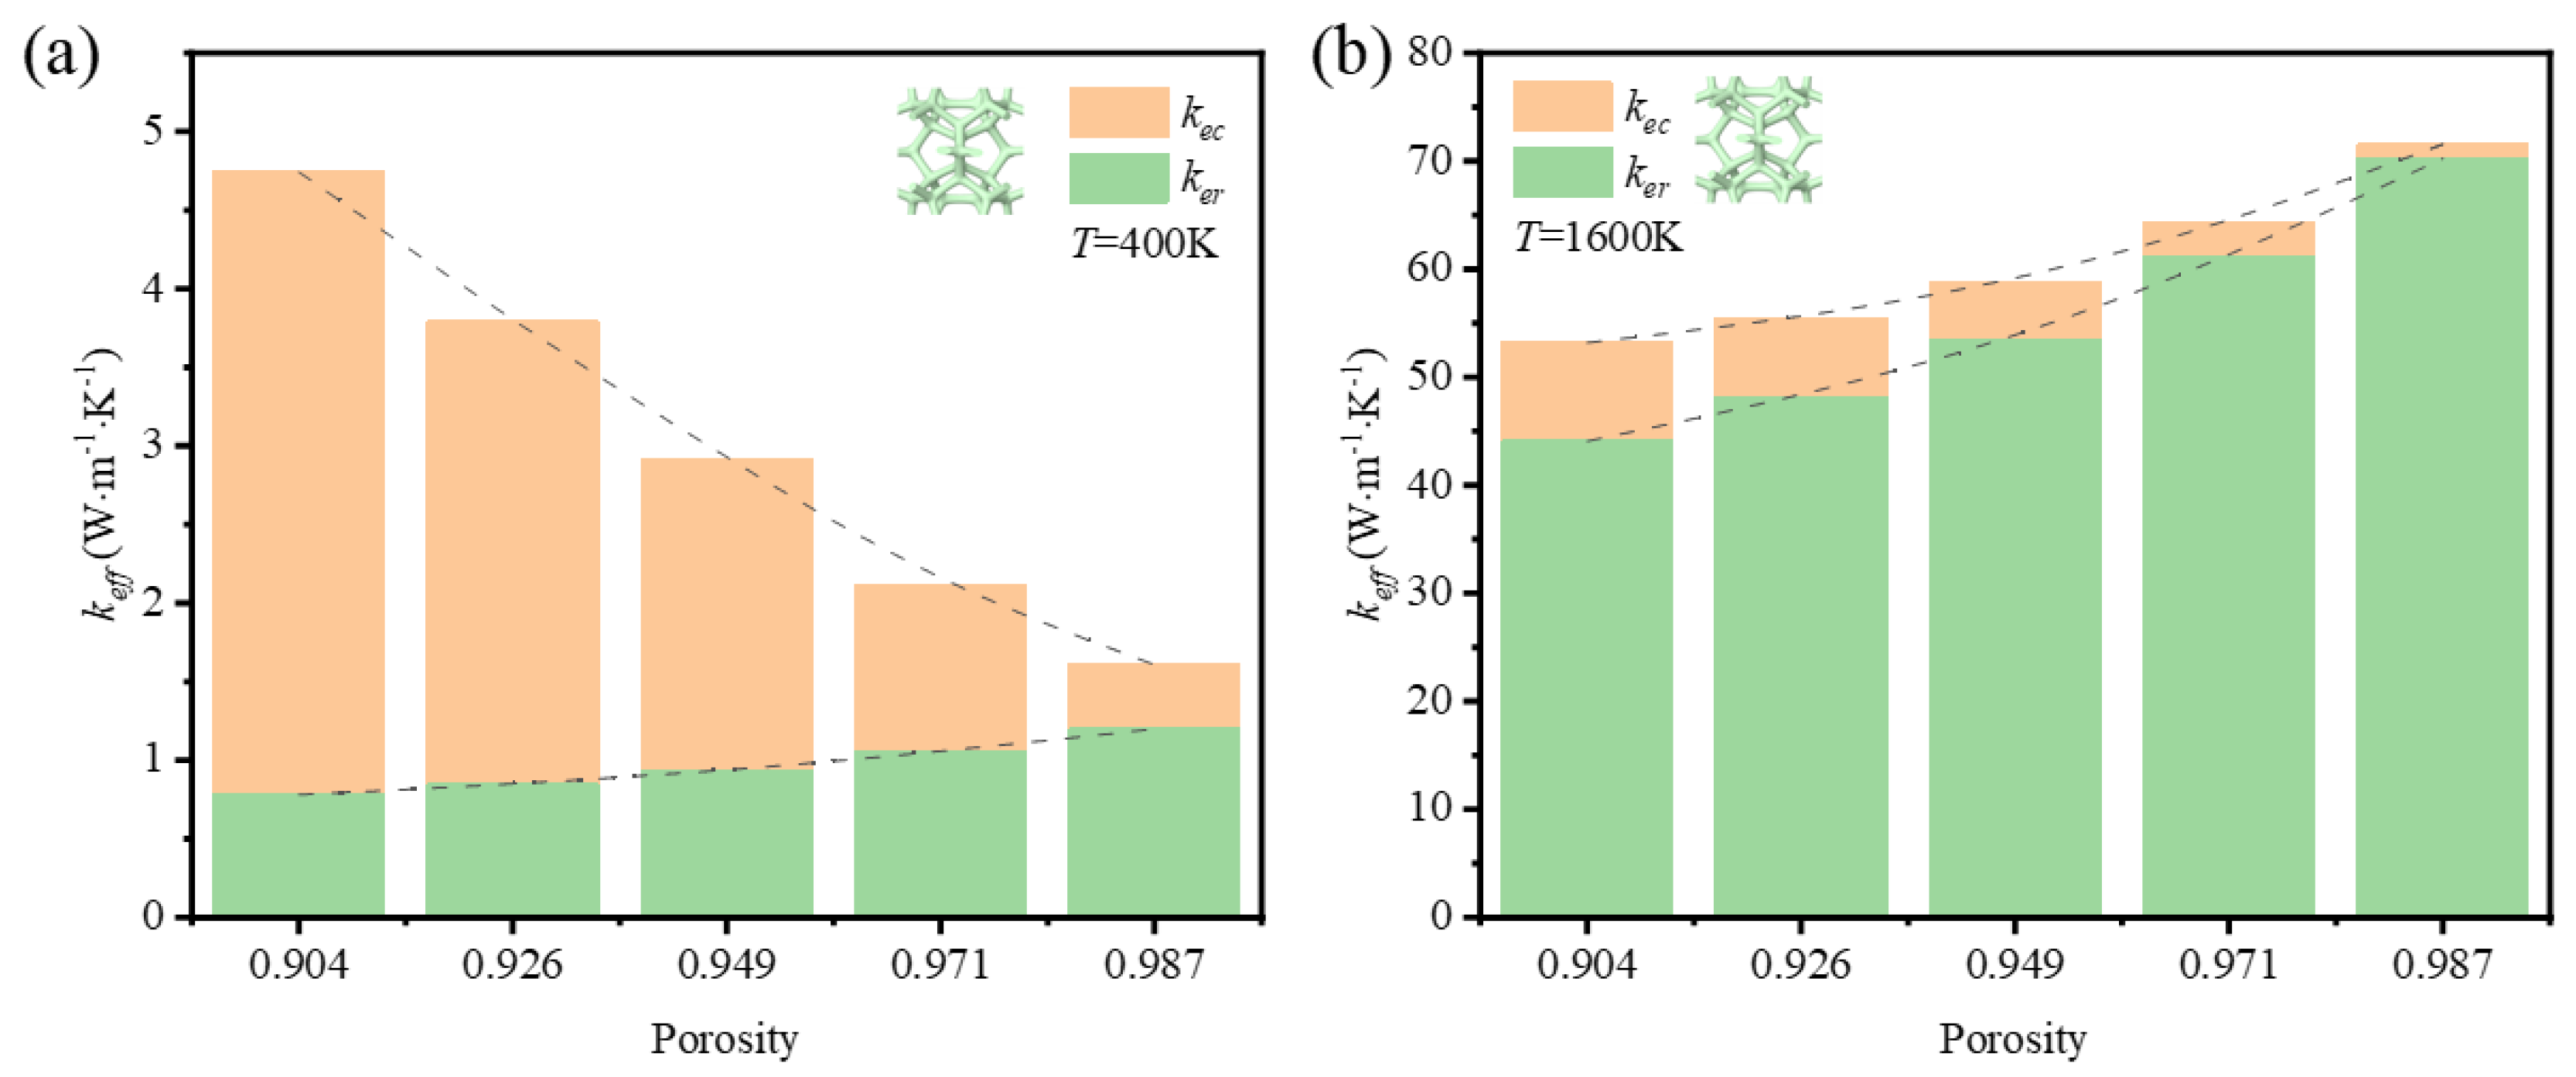
Figure 13.
Variation of effective thermal coefficient and contribution of thermal radiation with porosity of foam with triangular-shape struts at: (a) T=400 K; (b) T=1600 K.
Figure 13.
Variation of effective thermal coefficient and contribution of thermal radiation with porosity of foam with triangular-shape struts at: (a) T=400 K; (b) T=1600 K.
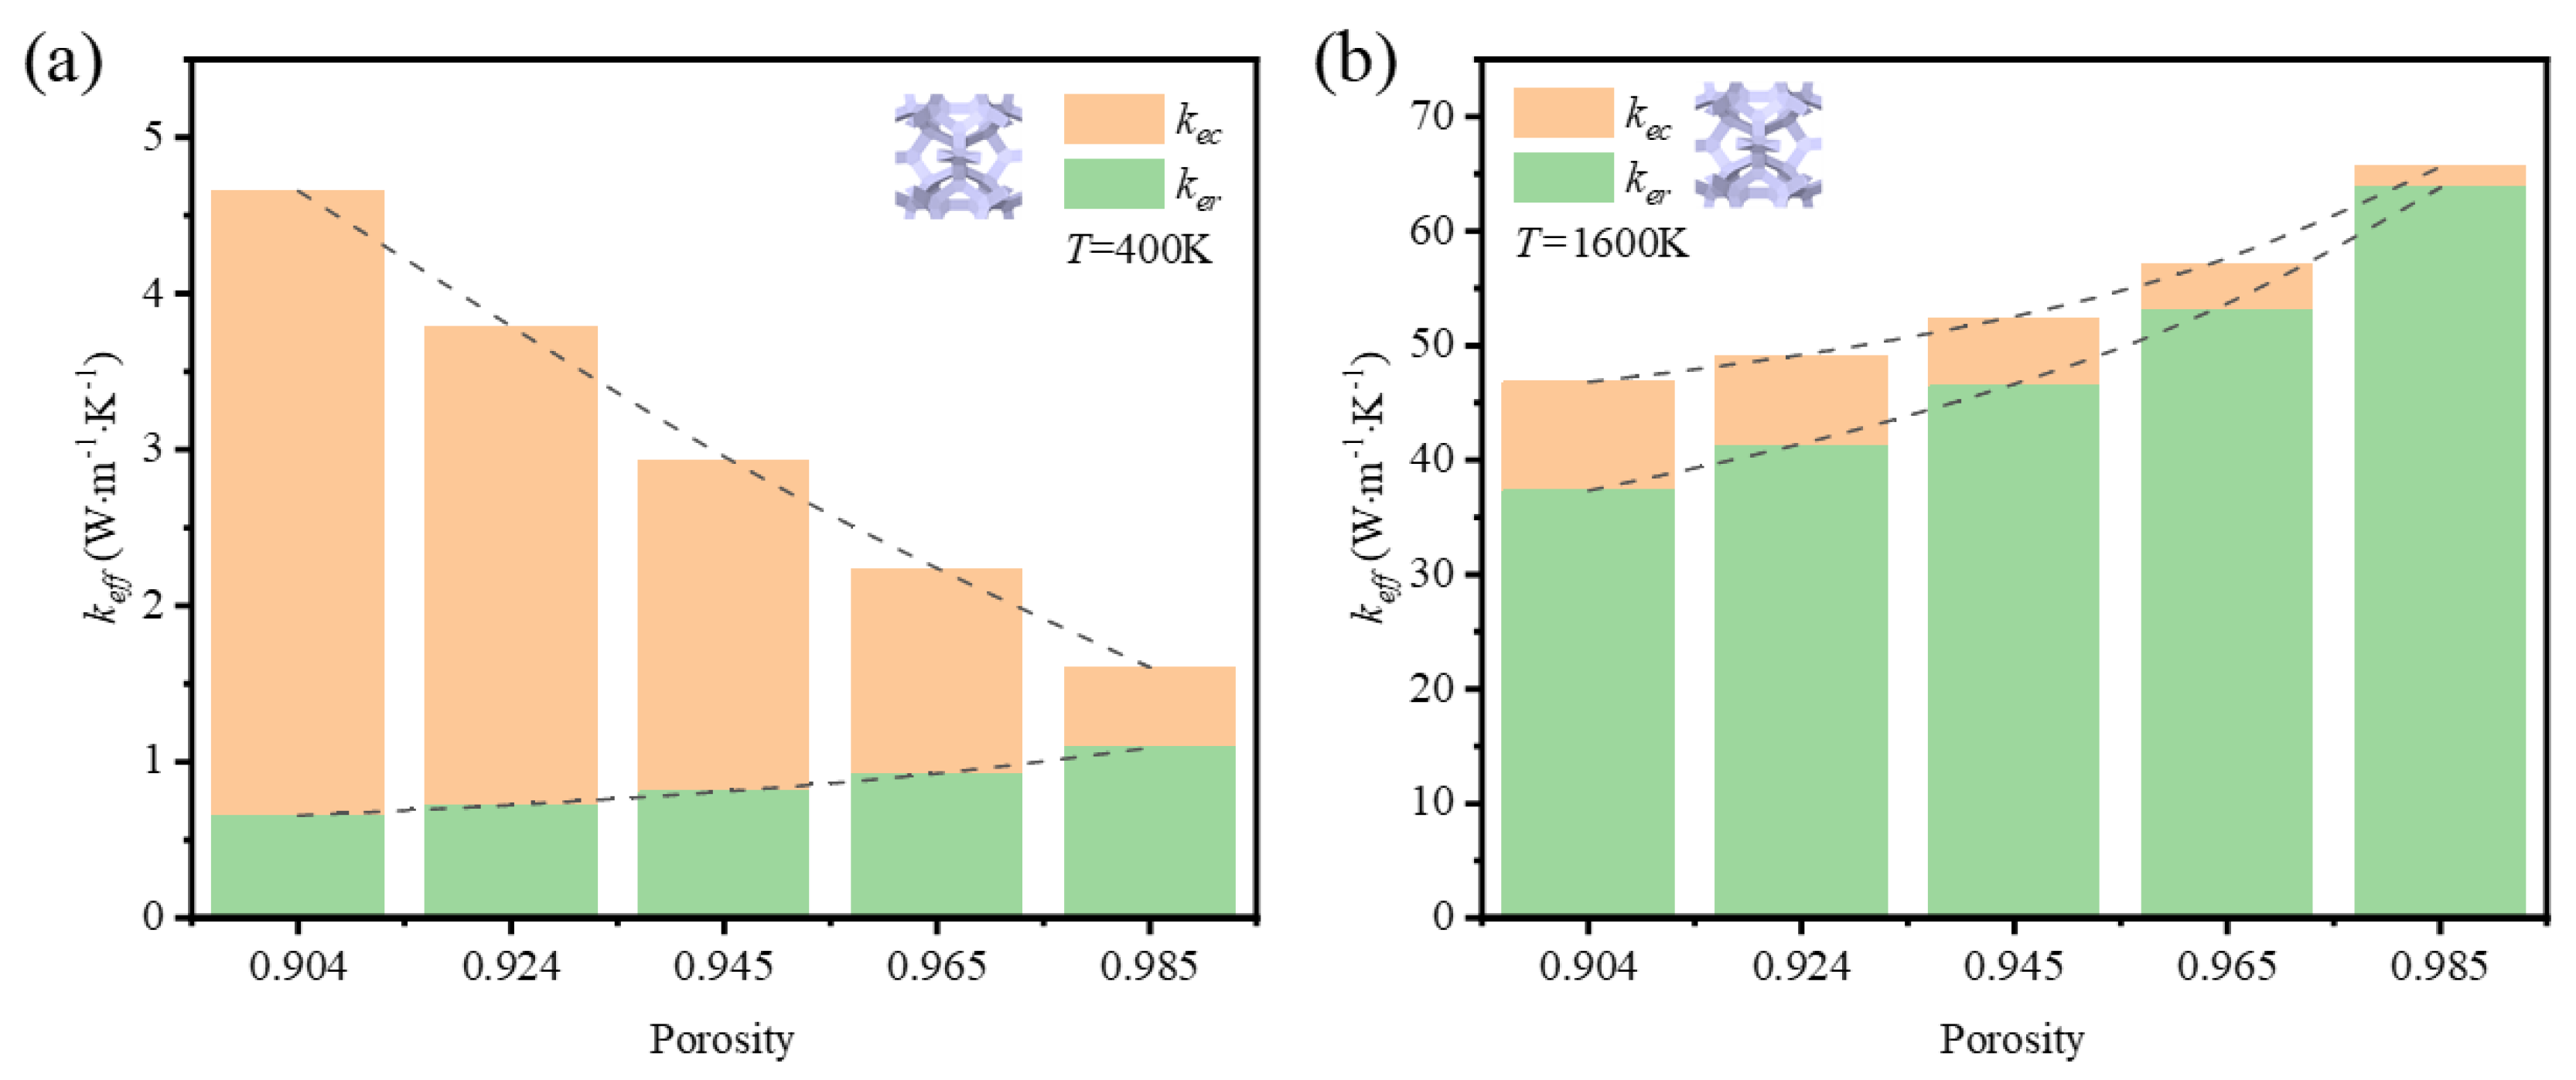
Figure 14.
Variation of effective thermal coefficient with temperature.
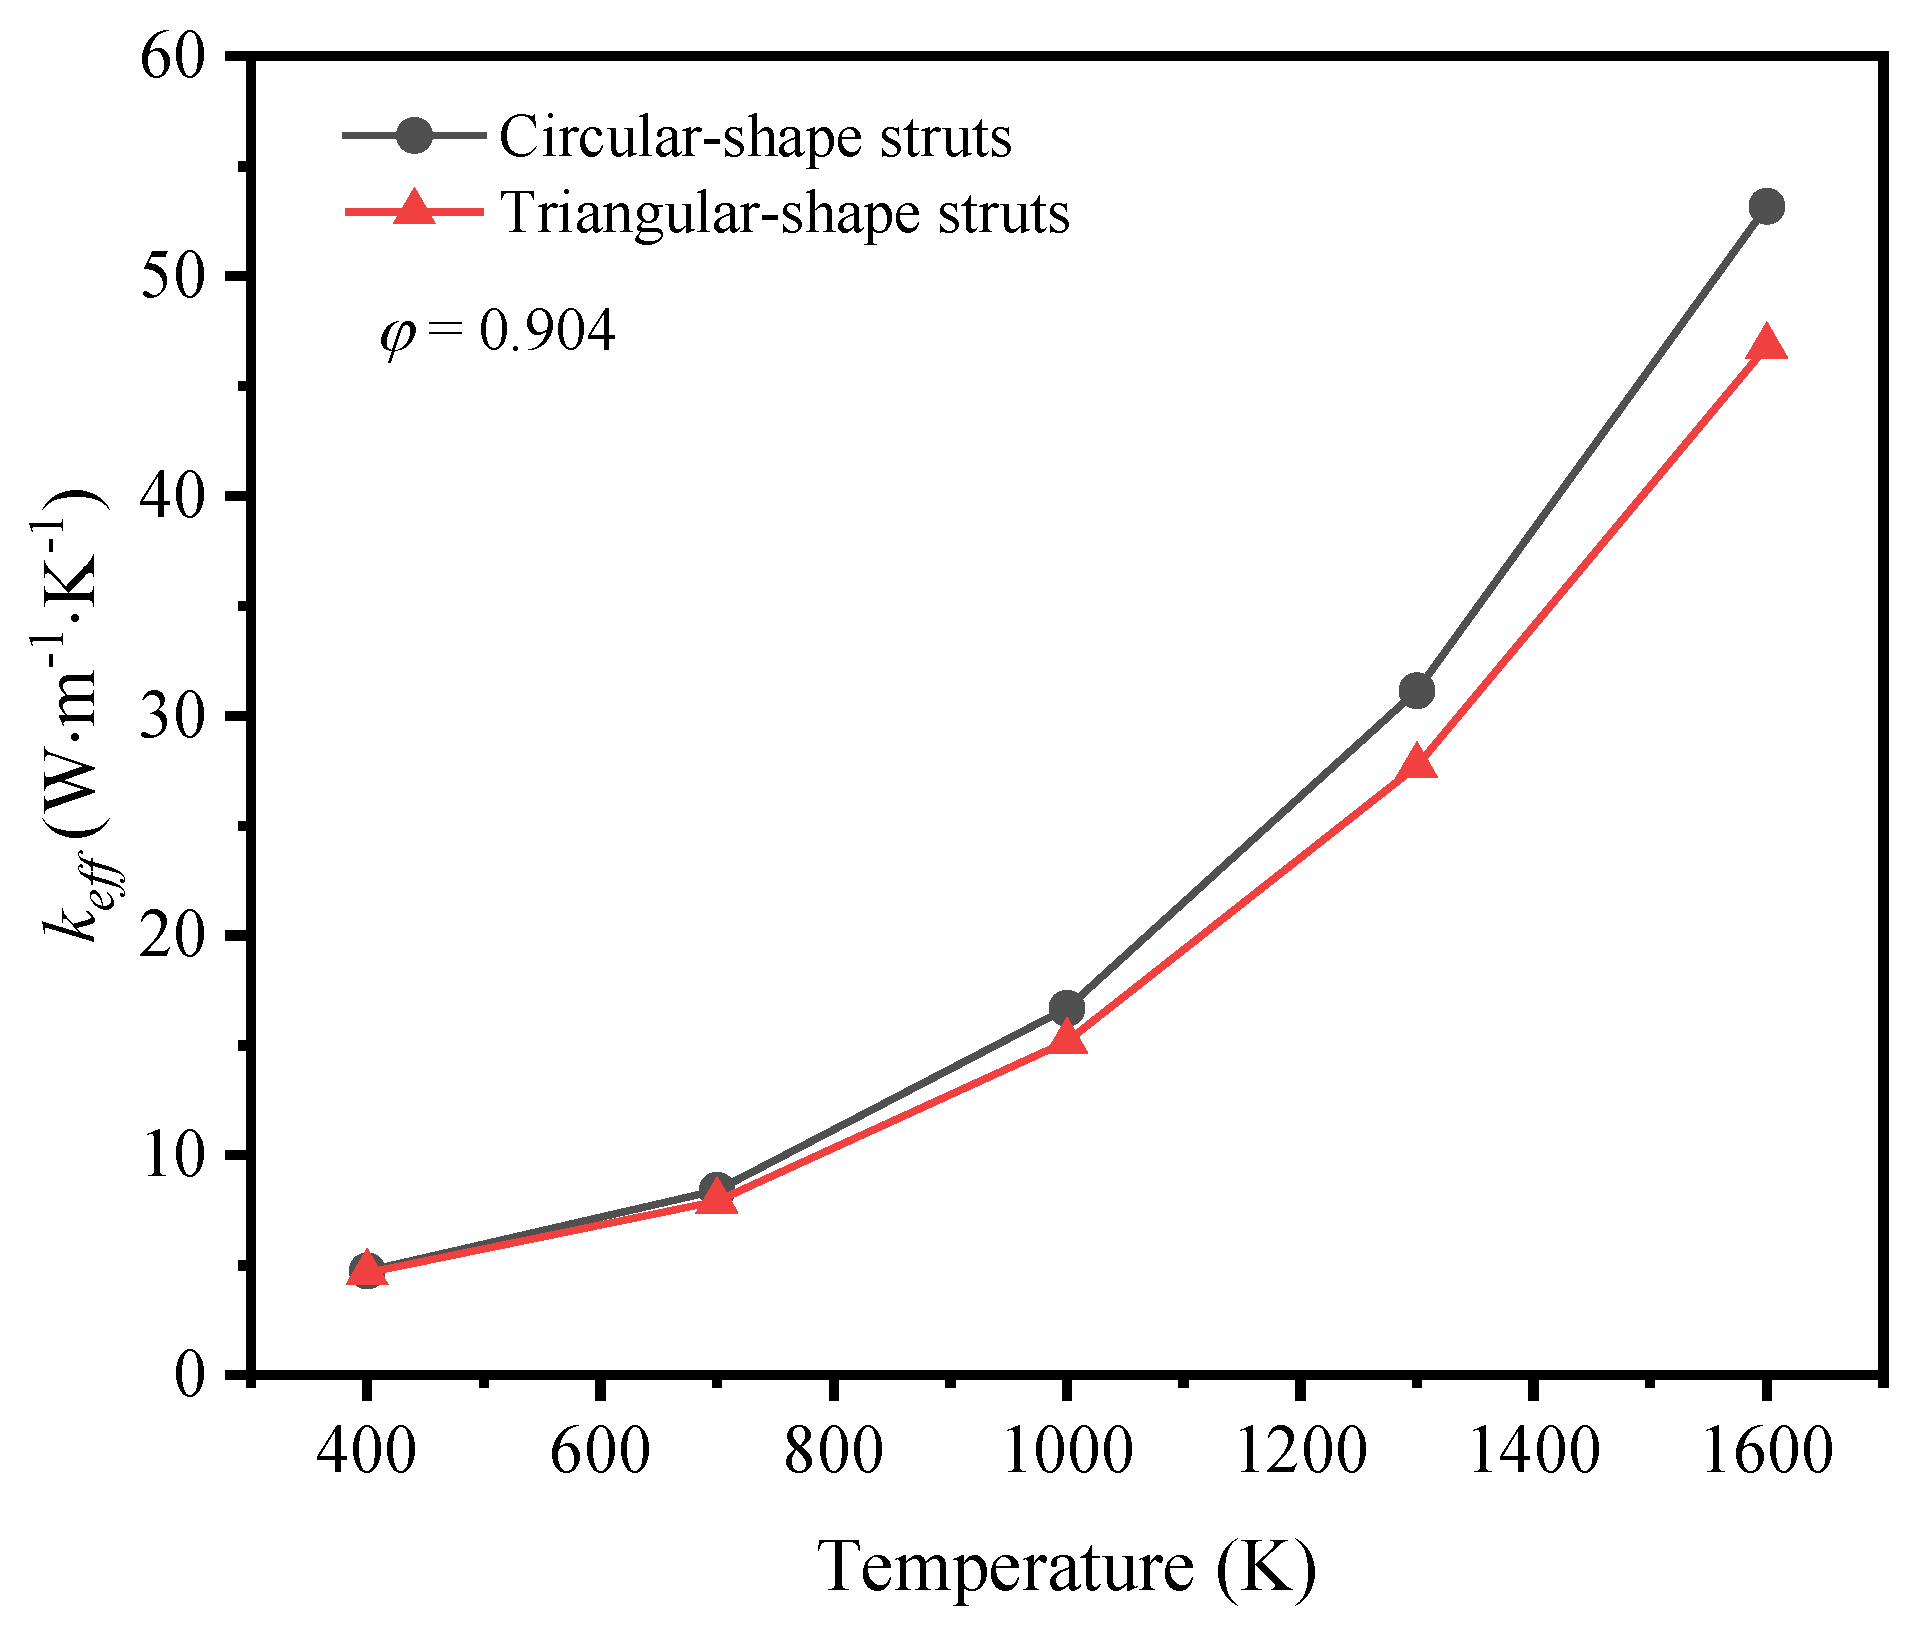
Figure 15.
Contribution of thermal radiation to effective thermal coefficient of the foam with different strut shapes at variable temperature.
Figure 15.
Contribution of thermal radiation to effective thermal coefficient of the foam with different strut shapes at variable temperature.
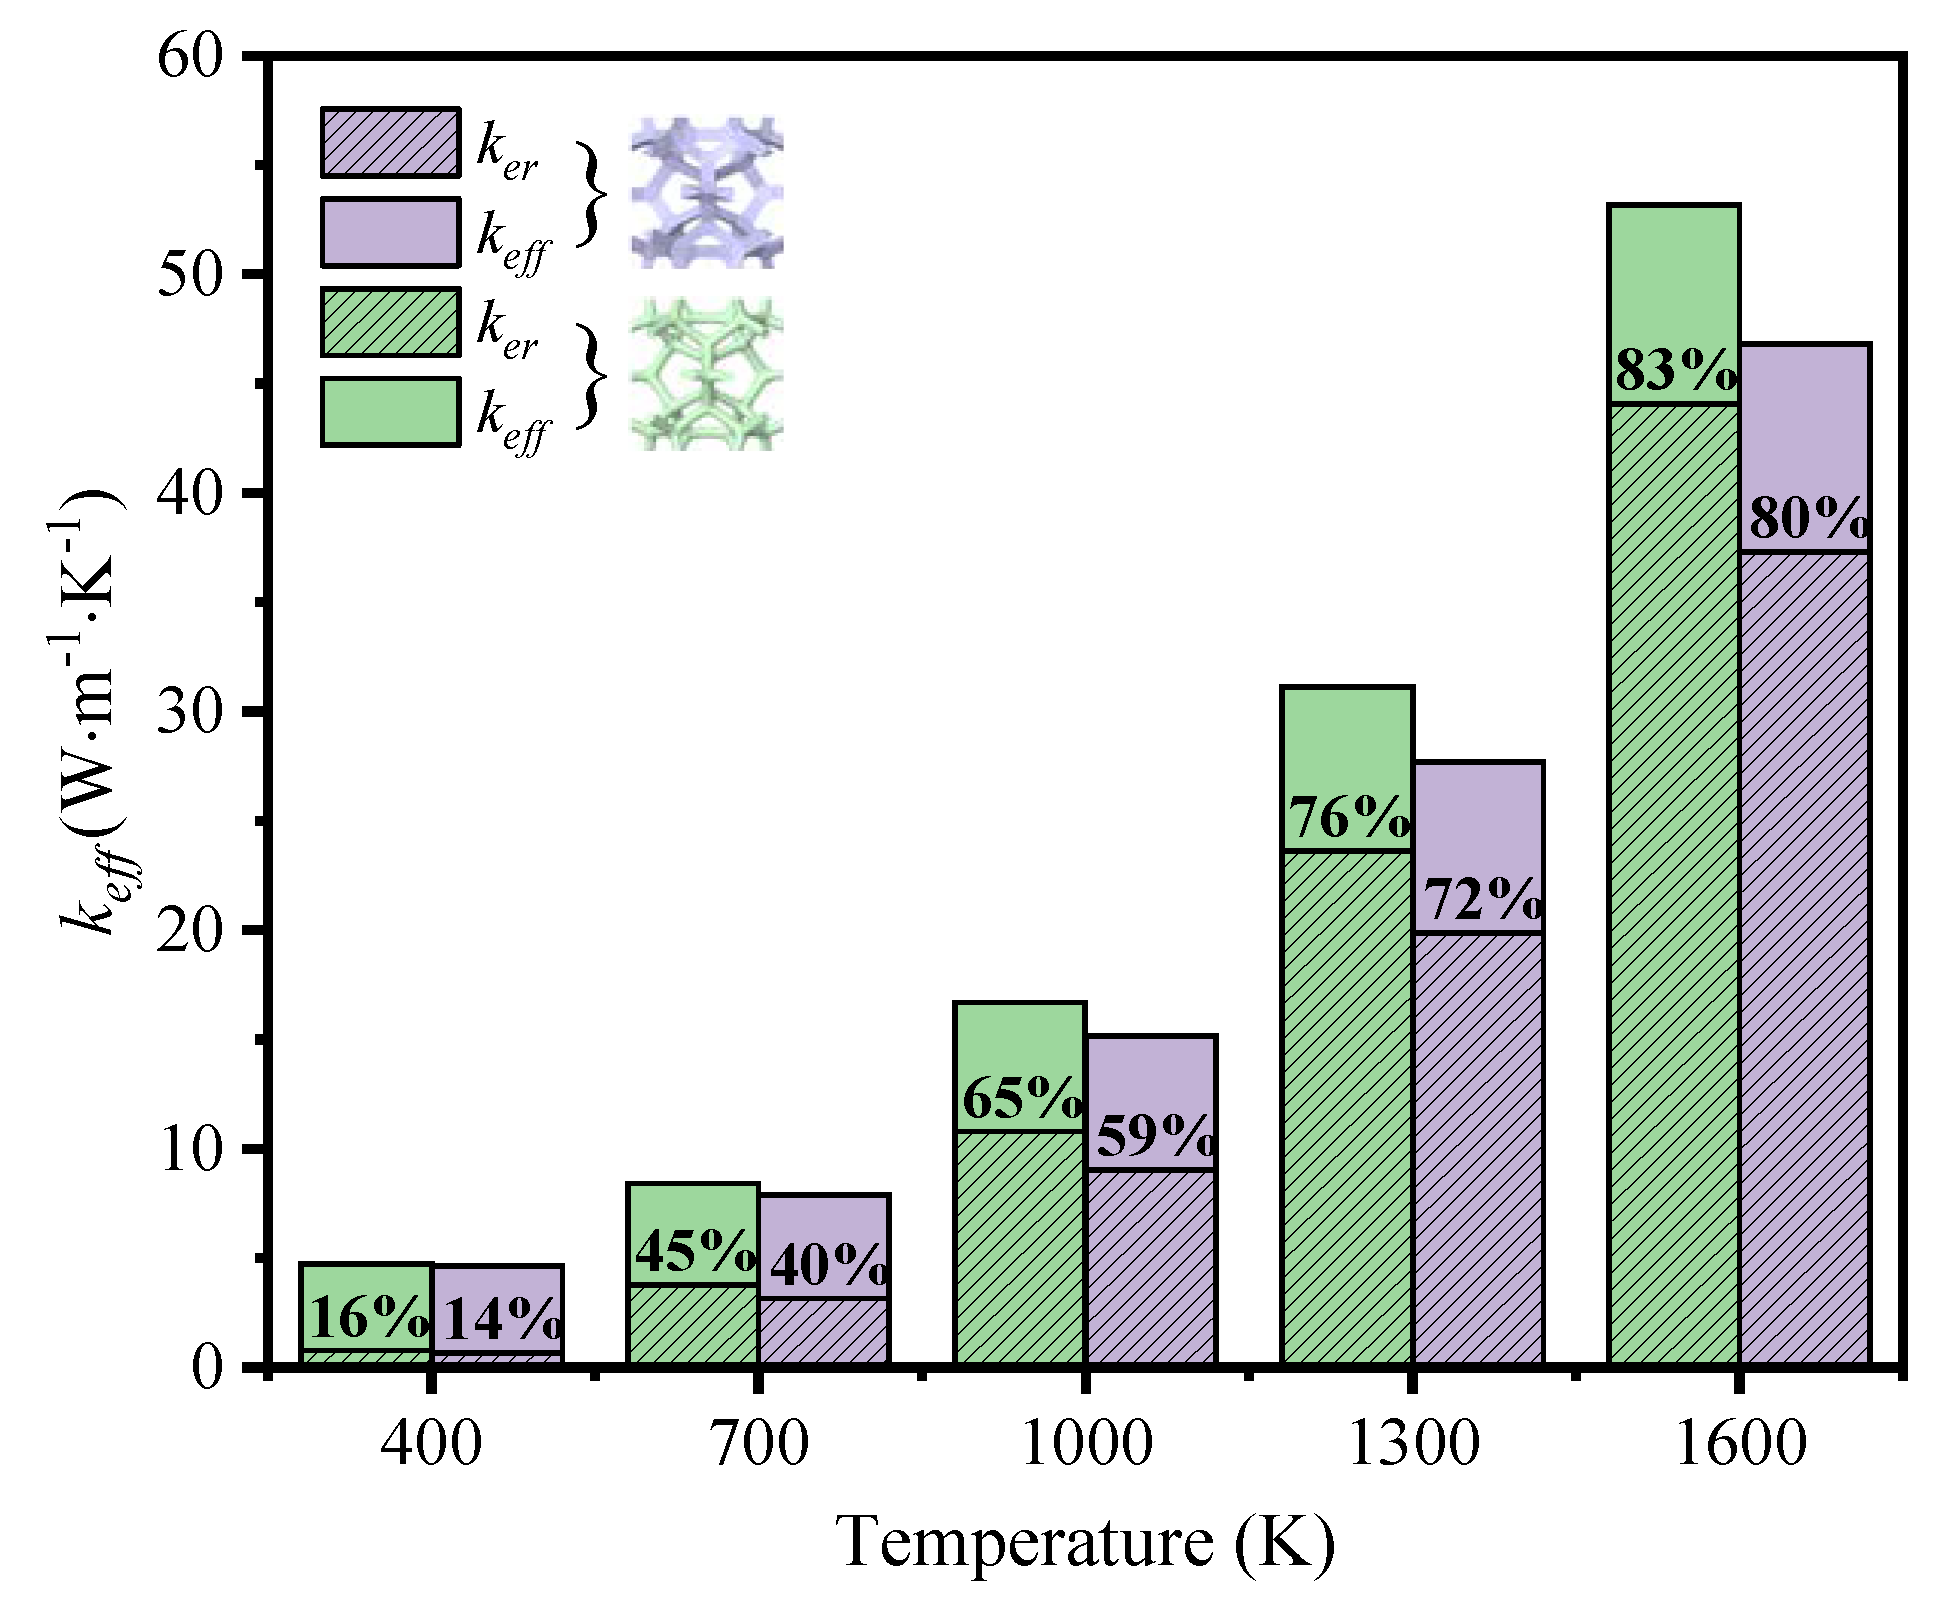
Figure 16.
Variation of effective thermal coefficient with emissivity at different porosities of the foam with (a) circular-shape struts; (b) triangular-shape struts.
Figure 16.
Variation of effective thermal coefficient with emissivity at different porosities of the foam with (a) circular-shape struts; (b) triangular-shape struts.
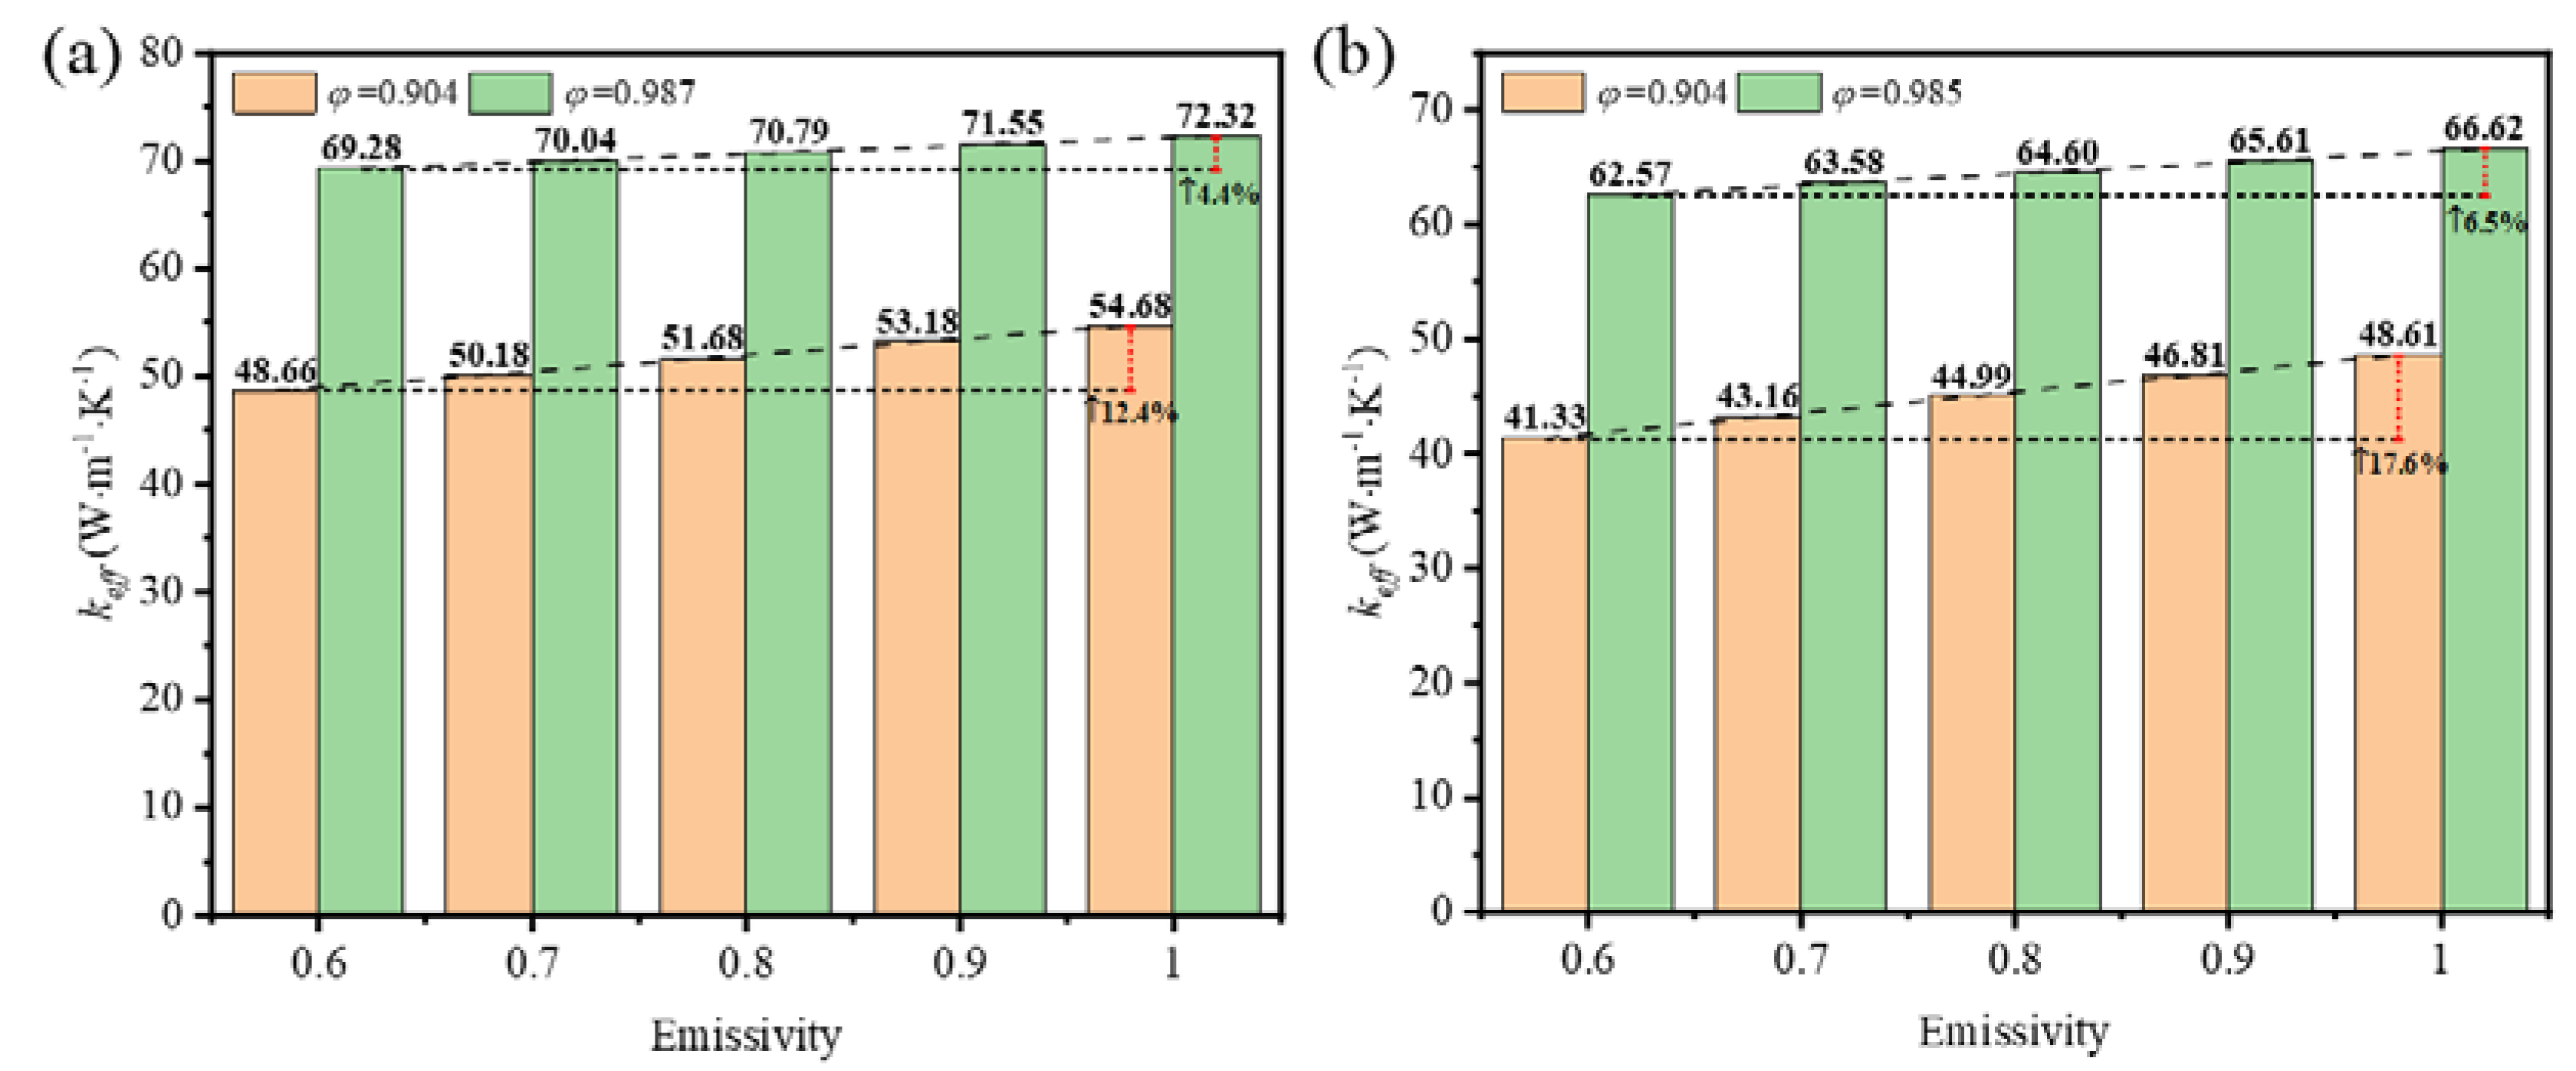
Figure 17.
Variation of effective thermal coefficient with temperature imposed on both surfaces at different porosities of the foam with (a) circular-shape struts; (b) triangular-shape struts.
Figure 17.
Variation of effective thermal coefficient with temperature imposed on both surfaces at different porosities of the foam with (a) circular-shape struts; (b) triangular-shape struts.
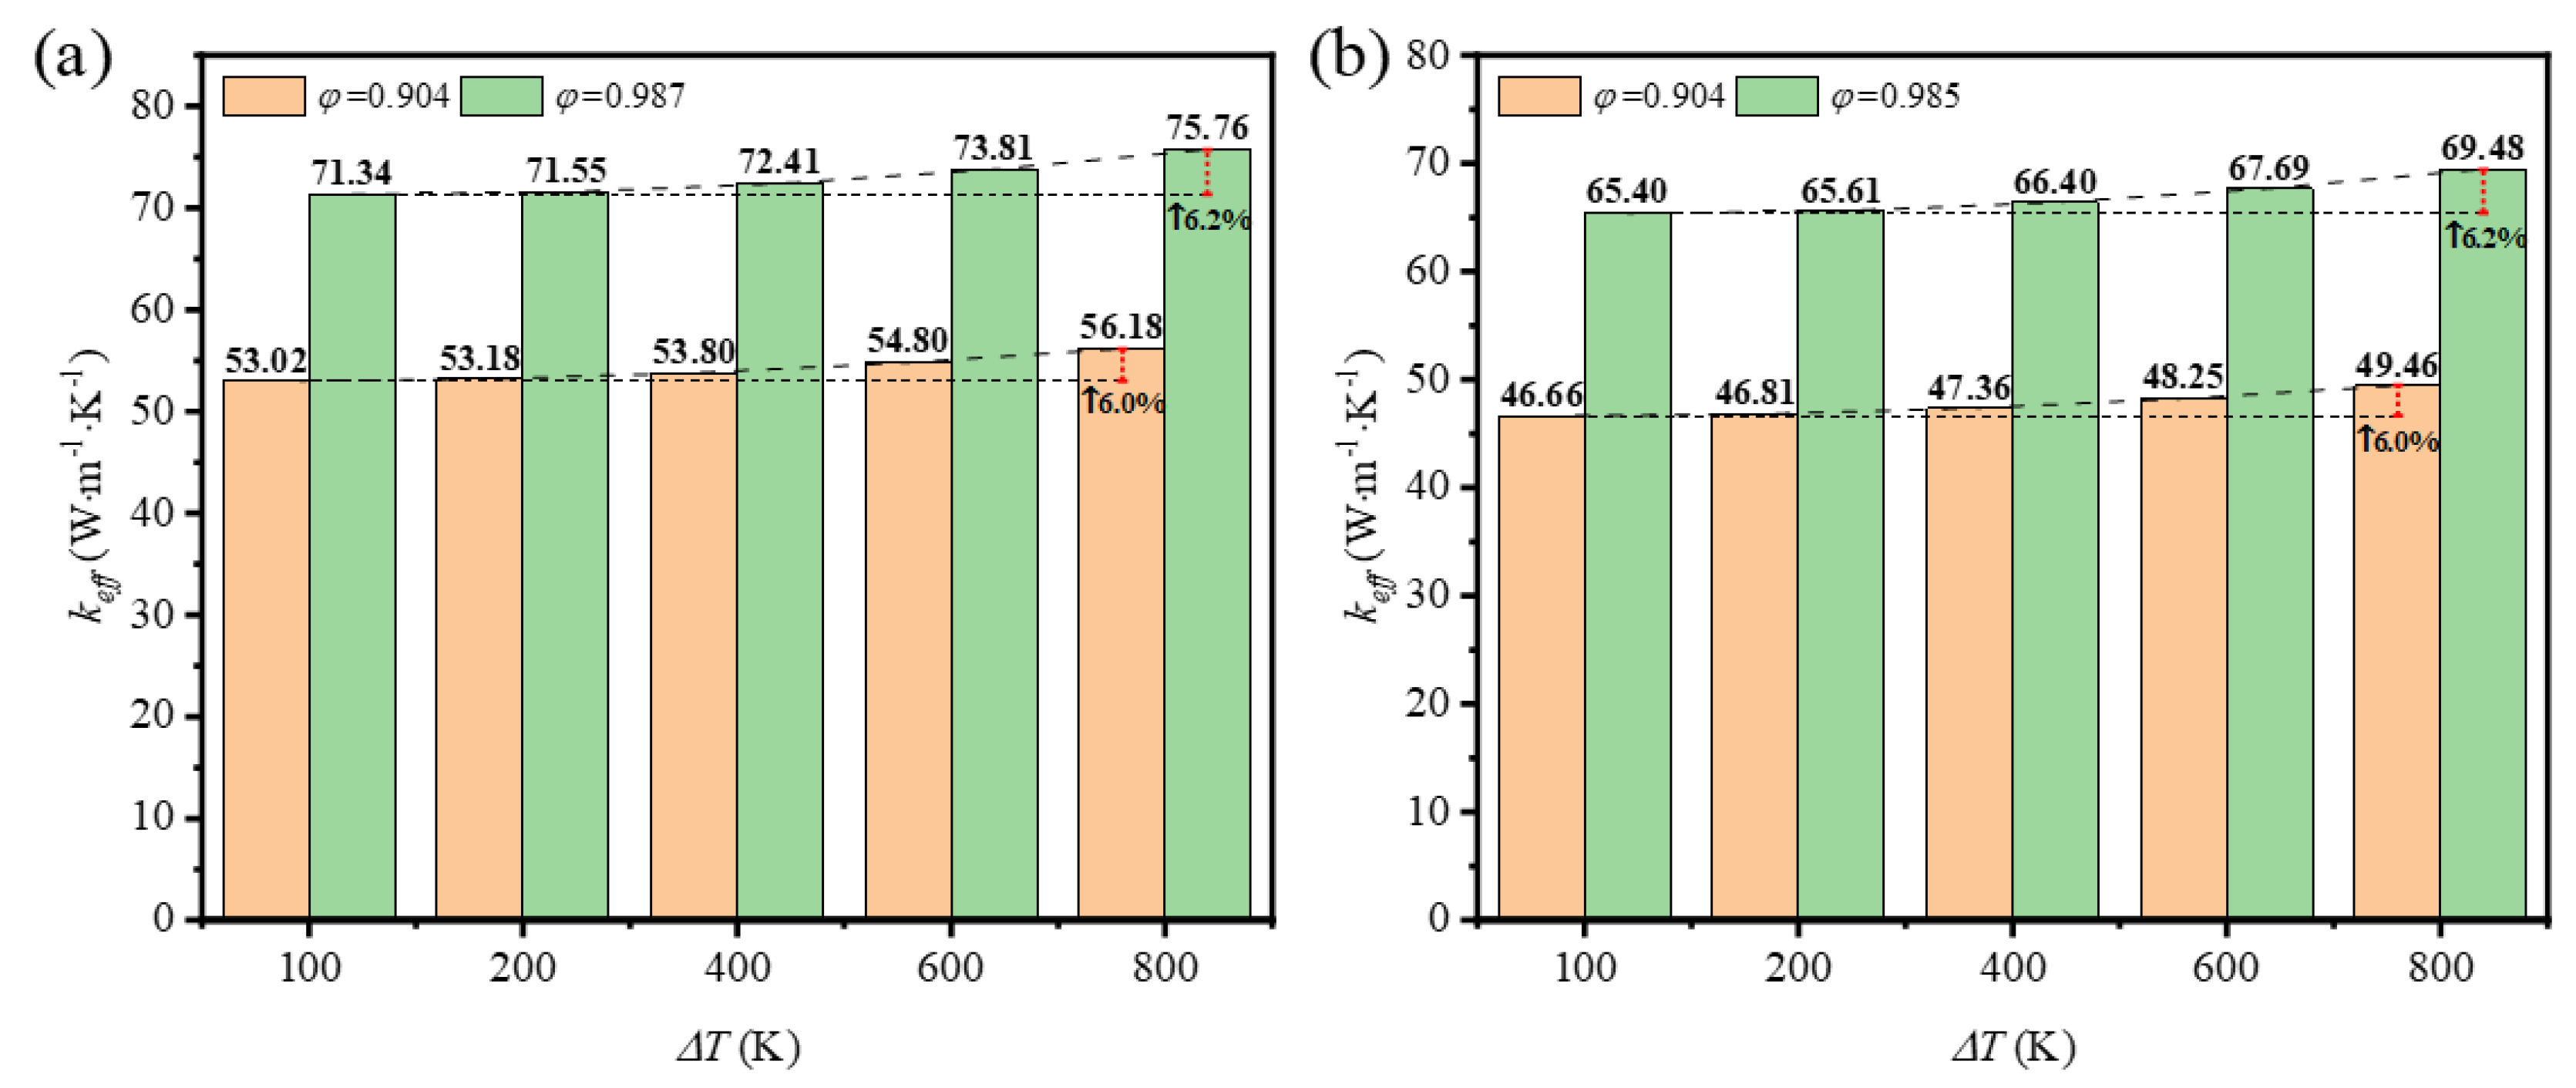
Figure 18.
Comparison of effective thermal conductivity between simulated results and correlation in equation (17).
Figure 18.
Comparison of effective thermal conductivity between simulated results and correlation in equation (17).
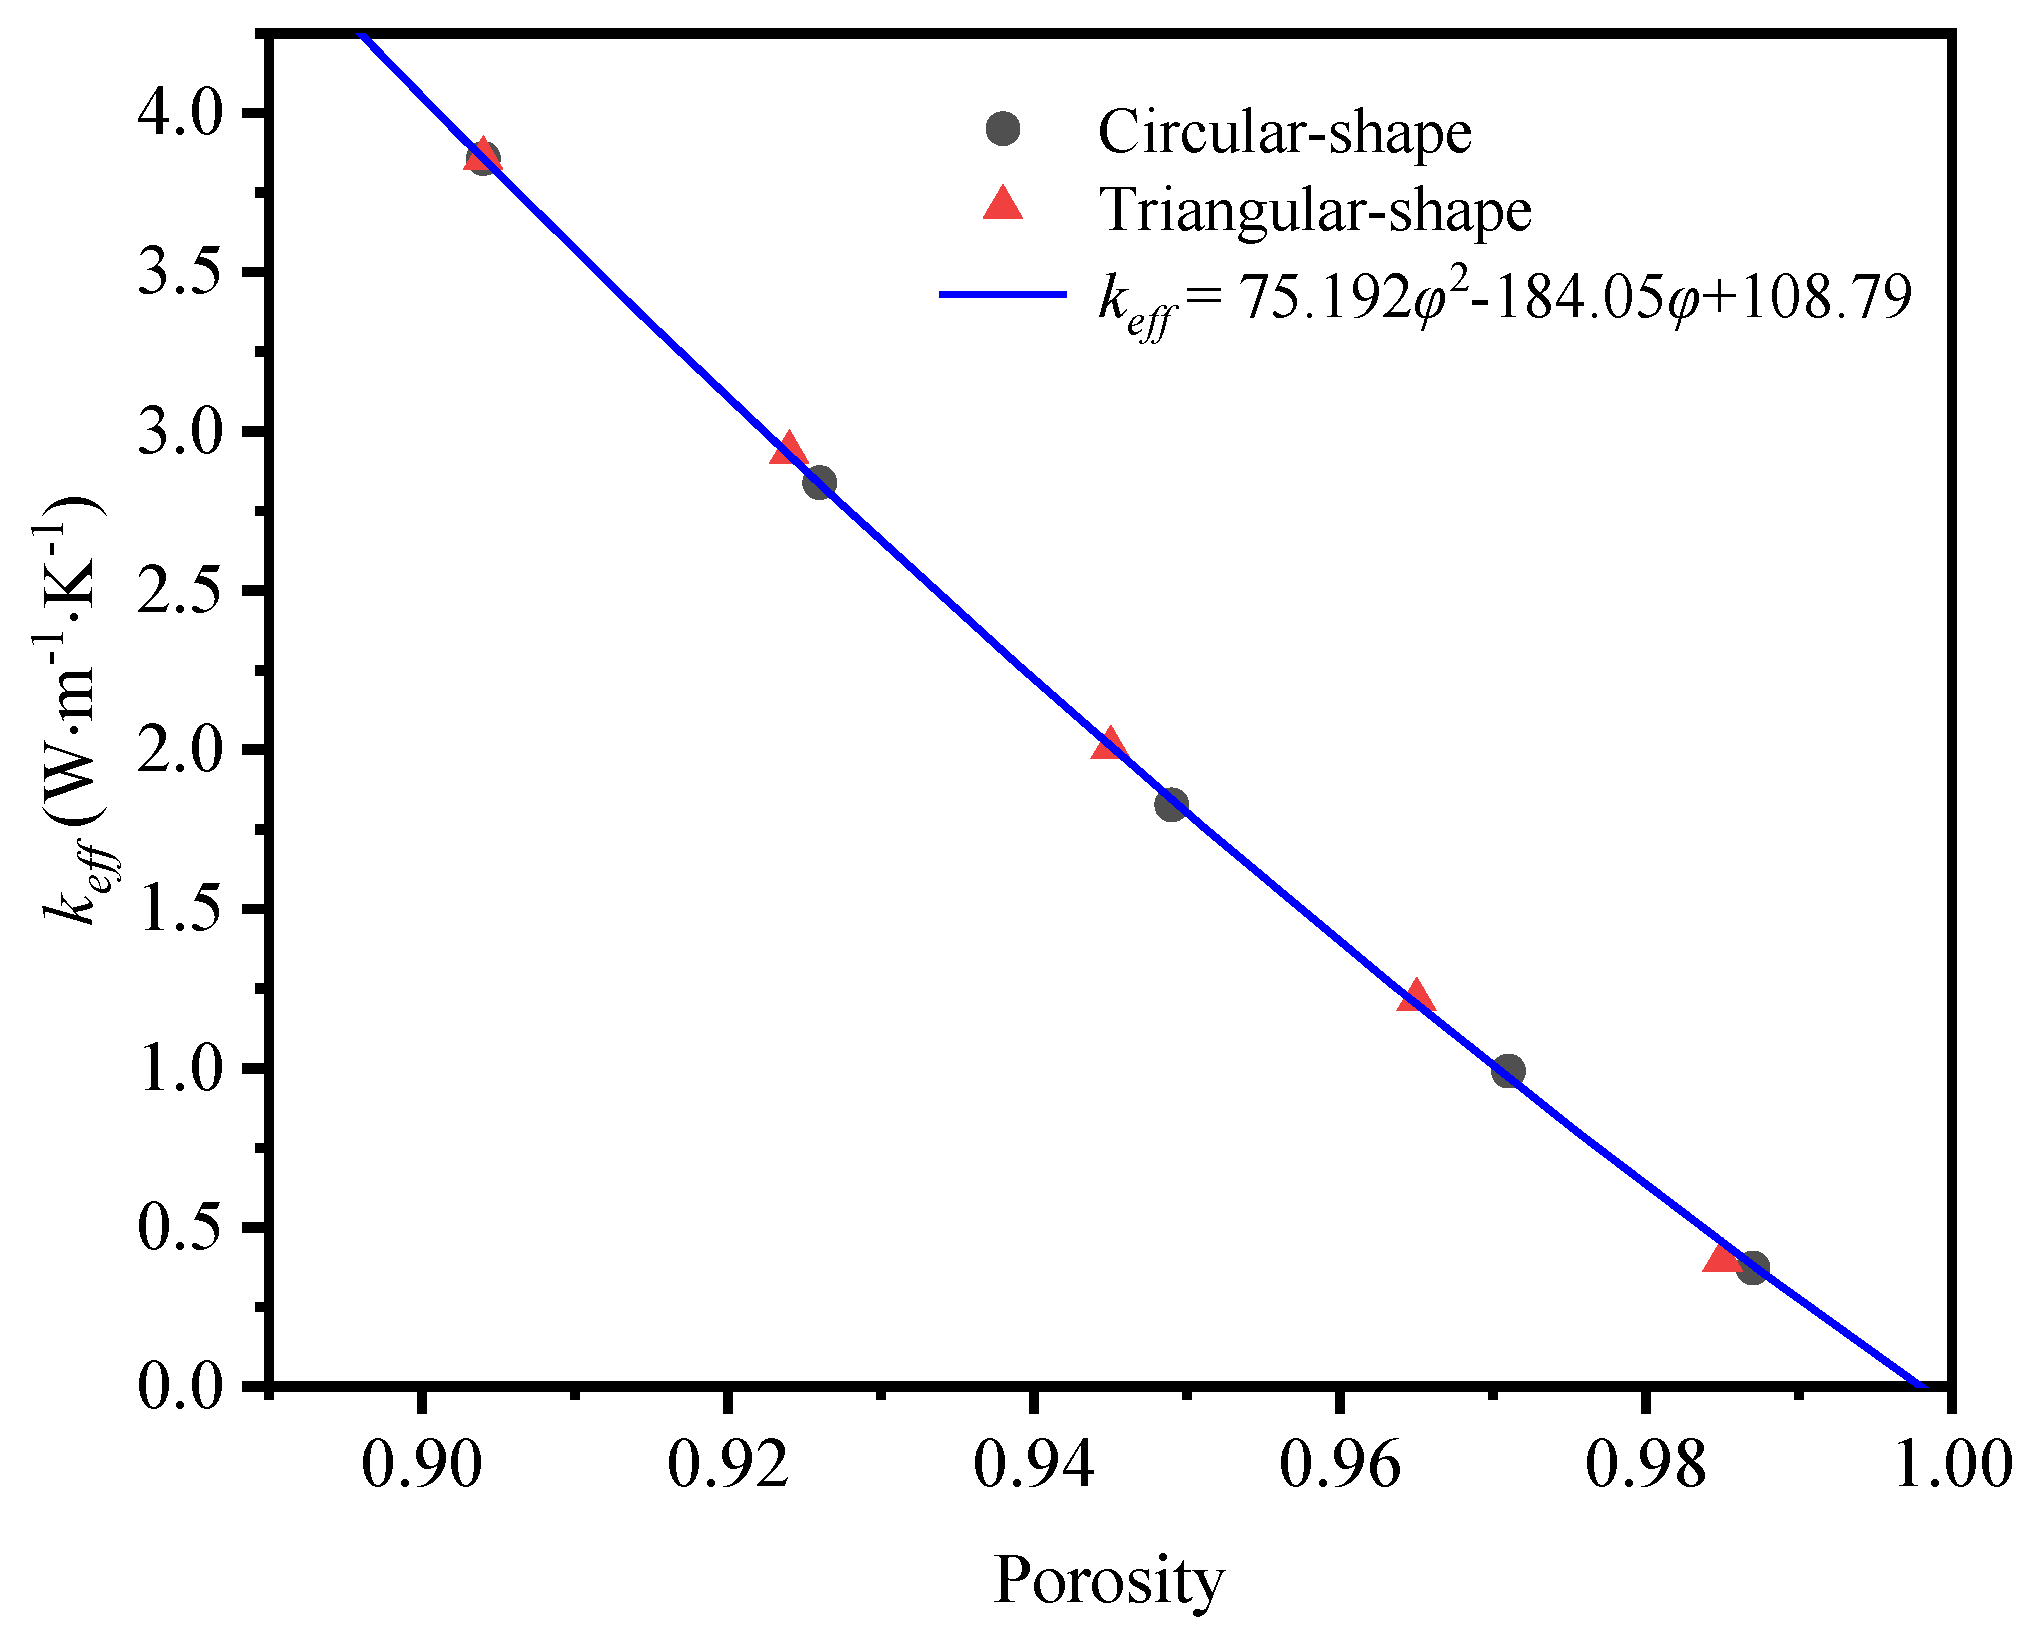
Figure 19.
Comparison of effective thermal conductivity between simulated results and correlation in equation (19).
Figure 19.
Comparison of effective thermal conductivity between simulated results and correlation in equation (19).
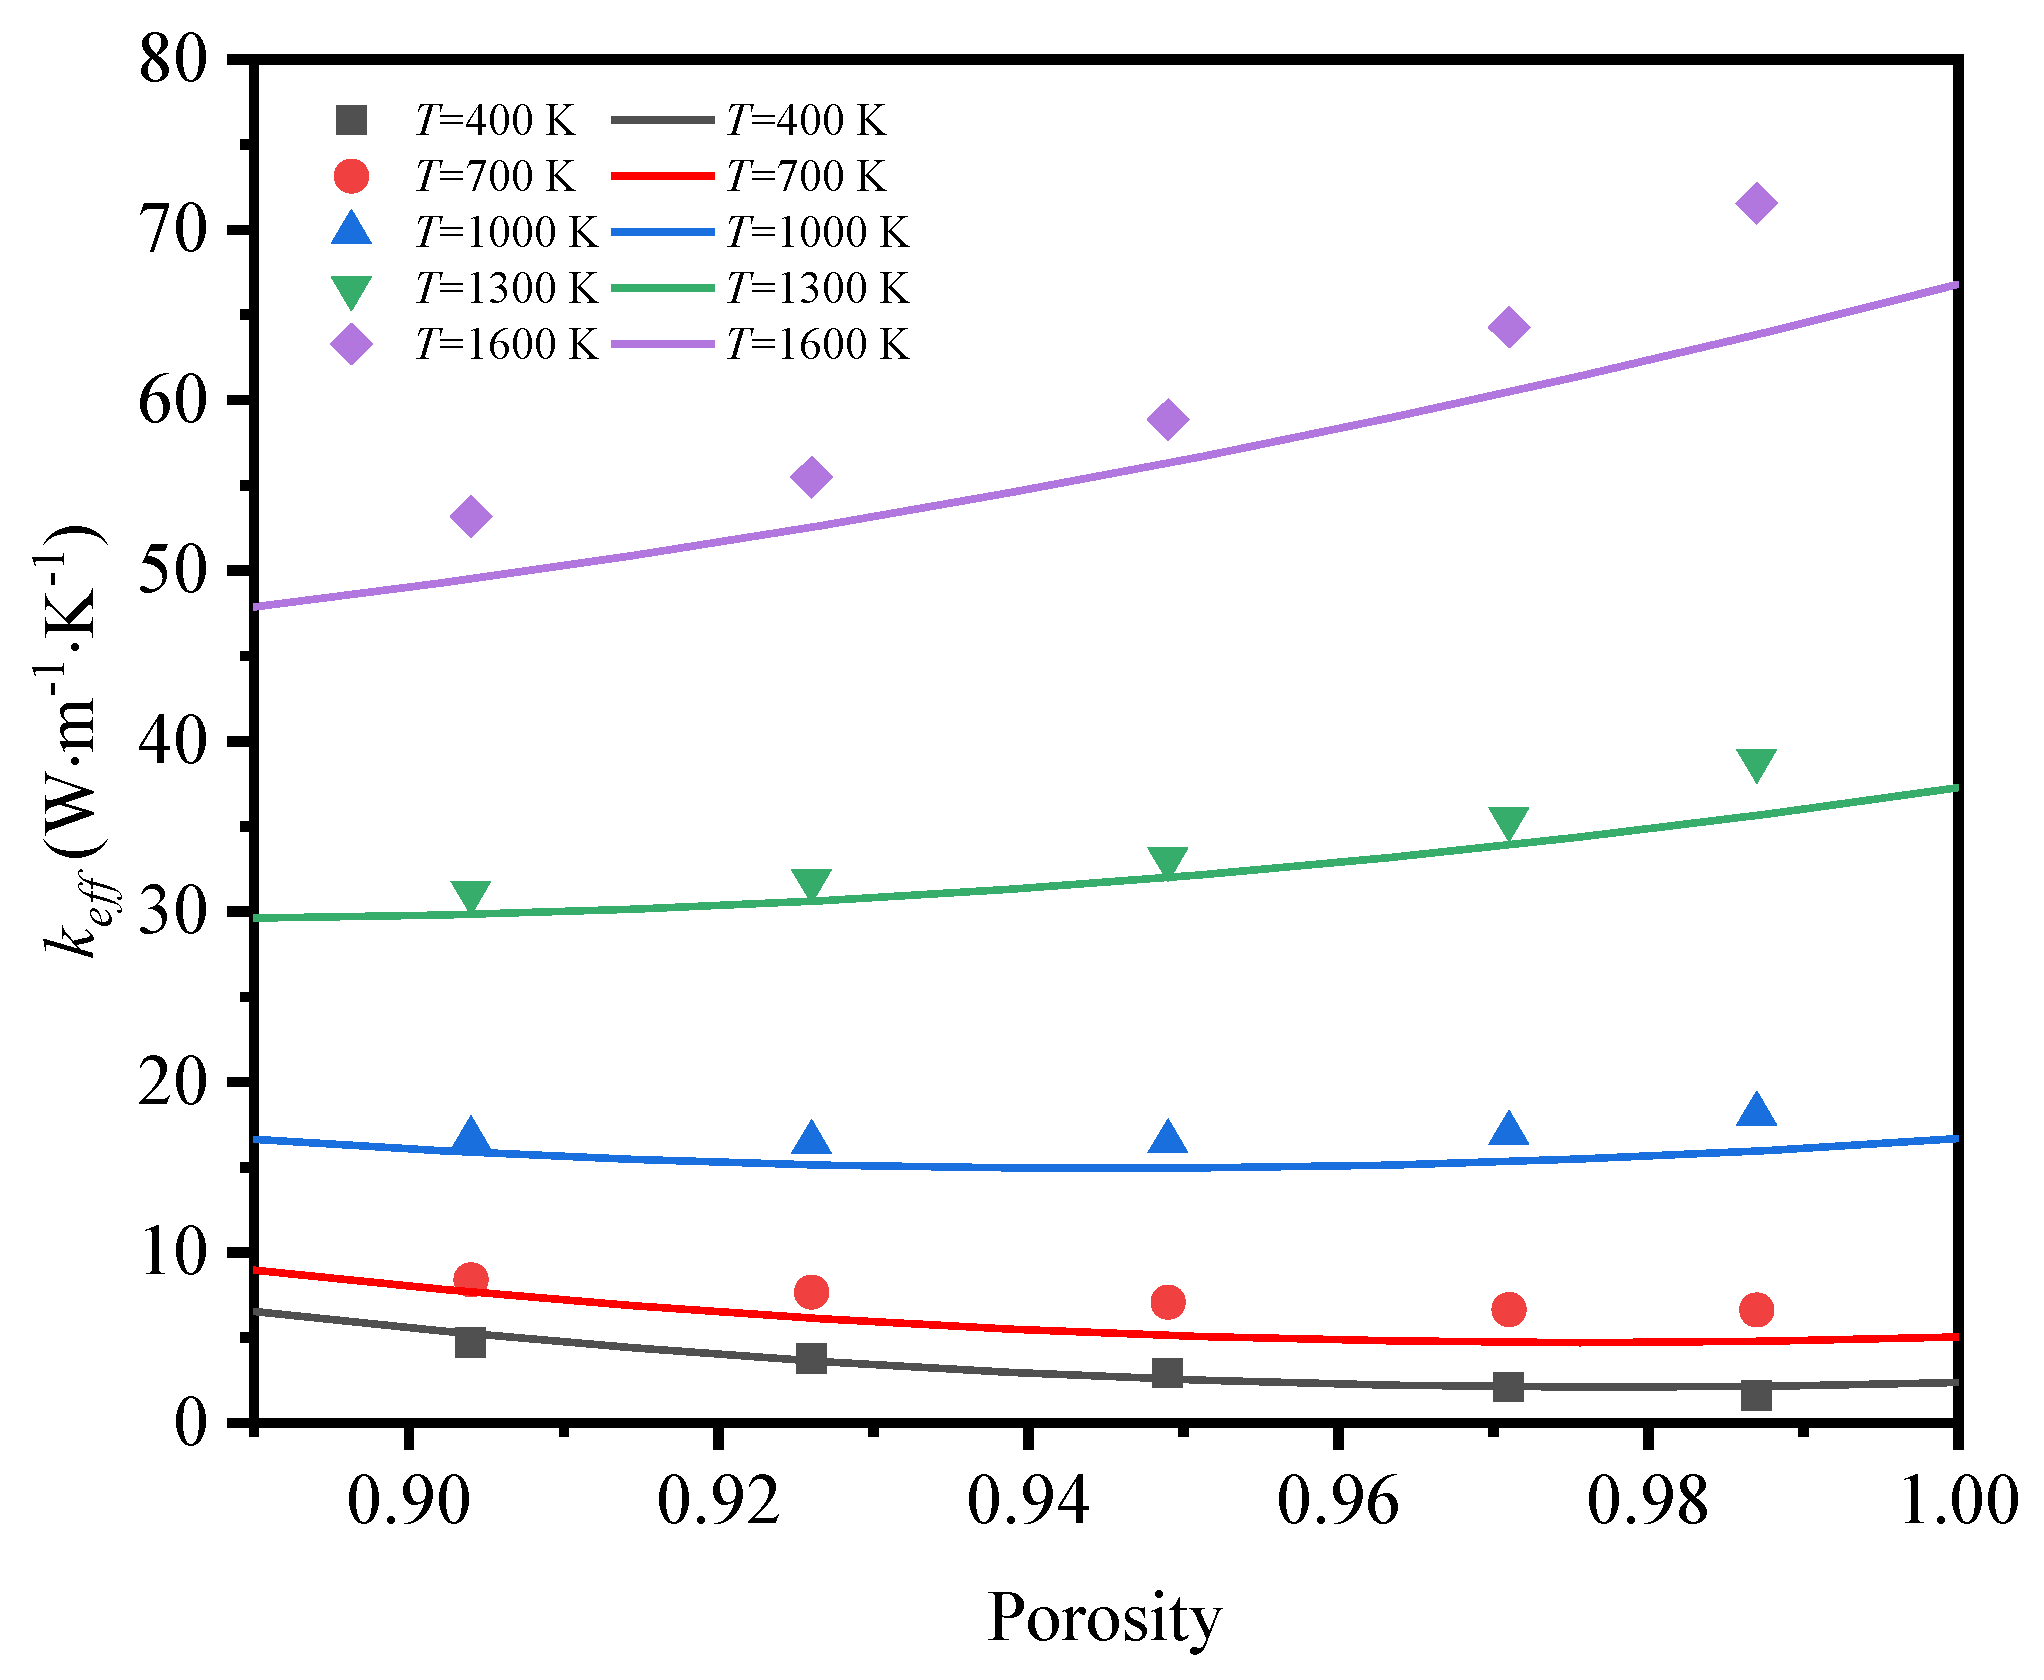

Table 1.
Thermophysical properties of materials used in the simulation.
| Material | Thermal Conductivity (W·m-1·K-1) |
Specific Heat (J·kg-1·K-1) |
Density (kg·m-3) |
|---|---|---|---|
| Air | 0.026 | 1006.43 | 1.225 |
| Graphene | 500 | 709 | 2250 |
| Nickel | 106 | 460.6 | 8900 |
| Epoxy resin | 0.2617 | 1110 | 1450 |
Disclaimer/Publisher’s Note: The statements, opinions and data contained in all publications are solely those of the individual author(s) and contributor(s) and not of MDPI and/or the editor(s). MDPI and/or the editor(s) disclaim responsibility for any injury to people or property resulting from any ideas, methods, instructions or products referred to in the content. |
© 2024 by the authors. Licensee MDPI, Basel, Switzerland. This article is an open access article distributed under the terms and conditions of the Creative Commons Attribution (CC BY) license (http://creativecommons.org/licenses/by/4.0/).
Copyright: This open access article is published under a Creative Commons CC BY 4.0 license, which permit the free download, distribution, and reuse, provided that the author and preprint are cited in any reuse.


