Submitted:
07 June 2024
Posted:
11 June 2024
You are already at the latest version
Abstract
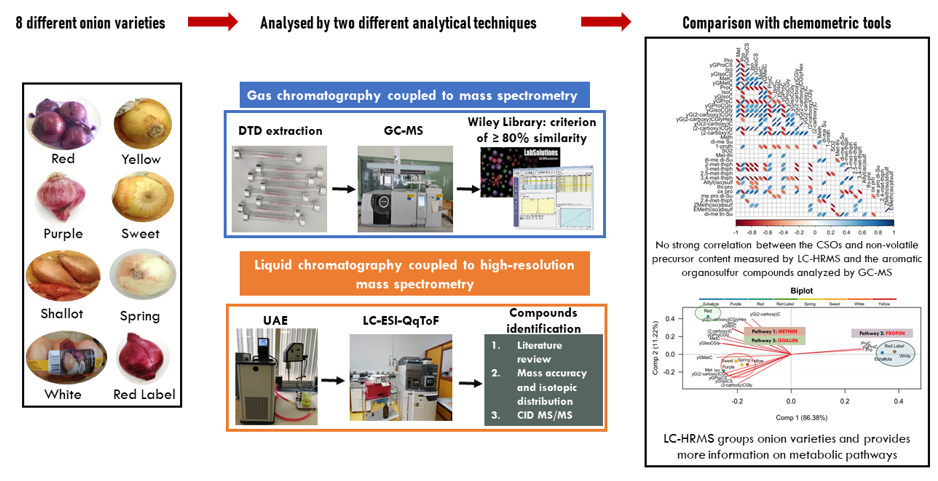
Onions are known not only for their culinary importance but also for their nutritional and health-promoting properties. Both properties are closely linked to its content of organosulfur compounds, which account for up to 5% of the dry weight of an onion. Given the importance of these compounds, suitable analytical methods are required for their study. Two techniques should be highlighted in this context: gas chromatography coupled to mass spectrometry (GC-MS), and liquid chromatography coupled to mass spectrometry (LC-MS). In this study, eight different onion varieties were analyzed using two distinct analytical techniques: direct thermal desorption–gas chromatography-mass spectrometry (DTD-GC-MS) and high-resolution mass spectrometry (HRMS) on an LC-ESI-QqTOF instrument. Each method identified 18 different organosulfur compounds, with LC-HRMS targeting non-volatile compounds, such as cysteine sulfoxides, and GC-MS targeting volatiles, such as disulfides and trisulfides. The results obtained were studied using Pearson correlations and principal component analysis. No precise correlation was found between the initial organosulfur compounds in onions and their hydrolysates. Consequently, although GC is one of the most employed techniques in the scientific literature, the use of LC-HRMS or a combination of both techniques may offer a more comprehensive and accurate description of the metabolomic profile of onions.
Keywords:
Allium cepa L.
; cysteine sulfoxides
; gas chromatography
; high-resolution mass spectrometry
; onion
; organosulfur compounds
1. Introduction
The genus Allium includes some of the most widely consumed and cultivated vegetables such as garlic, onion, and leek. In addition to their culinary importance [1], these vegetables have medicinal properties that contribute to consumers' health [2]. In particular, the onion, recognized by the FAO as one of the 15 most produced foodstuffs (tonnes) worldwide [3], has been the subject of numerous studies for its preventive effects on various diseases. Research suggests that onion consumption can help prevent inflammatory diseases [4], cancer [5], diabetes [6] and neurological disorders [7]. These properties, sensory (aromas and flavors) and medicinal, are closely linked to its content of sulfur compounds, which account for up to 5% of the dry weight of an onion [8].
Although the aromatic organosulfur compounds responsible for the onion sensory aspects constitute a diverse amalgam of compounds with varying structures, numerous studies have revealed that they are mainly derived from three non-volatile and odorless precursors. These 3 compounds, belonging to the family S-alk(en)yl cysteine sulfoxides (CSOs), are the following: S-methyl cysteine sulfoxide (methiin), S-(1-propenyl) cysteine sulfoxide (isoaliin), and S-propyl cysteine sulfoxide (propiin) [9]. Figure 1 illustrates the main pathways proposed for the synthesis of these CSOs. Pathway (a) shows the involvement of glutathione, which is methylated and then undergoes glycine loss, oxidation, and, finally, loss of the γ-glutamyl group, converting it to methyl cysteine sulfoxide. It should be noted that the last two steps, oxidation, and loss of the γ-glutamyl group, can occur in reverse order. The formation of the other two CSOs follows the same metabolic pathway but starts with different alkylations: for isoaliin, glutathione acquires a 1-propenyl group, and for propiin, it acquires a propyl group [10].
Then, these CSOs form the aromatic and volatile compounds characteristic of onions. This process begins with the enzyme alliinase [11]. In an intact onion bulb, alliinase and the CSOs, are compartmentalized and kept separate. This separation prevents premature reactions that would lead to the formation of volatile compounds. When the onion is damaged by cutting, crushing, or chewing, the cellular compartments are broken, allowing alliinase to come into contact with CSOs. The enzyme alliinase cleaves the 3 CSOs giving pyruvate, ammonia, and sulfenic acids, which, being highly reactive, finally generate the variety of aromatic compounds that characterize onion aroma [12]. Figure 2 illustrates this process of aroma compound formation.
Therefore, the metabolomic profile of onions is extensive, and having a comprehensive understanding of these pathways is crucial. This knowledge is particularly valuable due to the significant role of CSOs in the nutraceutical and sensory qualities of onions. Additionally, the composition of CSOs is influenced by various factors, including environmental, genetic, and cultivation variables [13]. Research on these compounds provides valuable insights into these complex interactions. Consequently, developing analytical methods that enable the detection and quantification of CSOs is an essential tool.
Numerous techniques for the determination of organosulfur compounds have been described in the literature, classified into direct and indirect methods. Direct methods evaluate non-volatile organosulfur compounds before enzymatic decomposition (metabolic pathway of Figure 1). In contrast, indirect methods are based on the estimation of various products generated after enzymatic conversion of the precursors (such as thiosulfinates, pyruvic acid, disulfides, etc.) (metabolic pathway of Figure 2). Although indirect methods have been widely used to measure onion pungency, establishing an accurate stoichiometric ratio between hydrolysates and significant CSOs can be challenging, often resulting in an underestimation of CSOs content [14].
Specifically, two techniques can be highlighted to study organosulfur compounds in onions: gas chromatography coupled to mass spectrometry (GC-MS) [15,16,17], and liquid chromatography coupled to mass spectrometry (LC-MS) [18,19,20,21]. In the context of GC-MS methods, most studies focus on identifying aromatic and volatile organosulfur compounds. When it comes to studying CSOs, their detection through GC is limited to laborious and time-consuming derivatization processes [14,22,23]. In addition, taking into account the thermolability of CSOs, the application of this type of analysis where high temperatures are often applied to volatilize the compounds may lead to erroneous estimates of CSOs [24]. In the case of LC-MS the milder analytical conditions allow the analysis of CSOs and their precursors, providing a probably more realistic analysis of the organosulfur compound content in onion bulbs.
Despite the differences between the two techniques, the literature includes articles that use both for studying organosulfur compounds in onions, often yielding very different results [25]. The comparison of direct and indirect techniques is interesting as it allows for exploring possible correlations between the analyzed compounds. These investigations can also reveal whether the volatile profile of onions reflects the initial content of sulfur compounds in the bulbs. This is why a comparison between the two techniques is proposed in this work, by studying different varieties of onions. Firstly, for the indirect study of organosulfur compounds in onion, the research group has previously developed a direct thermal desorption-gas chromatography-mass spectrometry (DTD-GC-MS) method to analyze organosulfur compounds in onion [17]. Regarding the direct study of CSOs and their non-volatile precursors, this work proposes the use of liquid chromatography coupled with high-resolution mass spectrometry (LC-HRMS) as an alternative technique. So, this work can also be an ideal complement to the previous one, allowing us to carry out, in a non-bibliographic but experimental way, a comparison between DTD-GC-MS and LC-HRMS with chemometric tools to unveil the metabolic profile of different onion samples.
2. Materials and Methods
2.1. Onion Samples
Seven different onion varieties and one shallot, all obtained from local supermarkets in the province of Cadiz (Spain), were used for this study. The characteristics of the samples were as follows: red onion variety (origin Austria, company Tara, 500 g net size, size 50/90 mm), purple onion variety (origin Spain, company la Gramola, 500 g net size, size 50/70 mm), shallot sample (origin France, company Ajos Malsamar S.L., size 250 g net size, size 50/70 mm), red Label variety (origin Spain, company Linda, 500 g mesh size, 50/70 mm size), yellow onion variety (origin Spain, bulk format, 55/75 mm size), sweet onion variety (origin Spain, company Calidad y origen, bulk format, 70/100 mm size), white onion variety (origin Peru, company Ajos Malsamar S.L., assortment format, size 60/80 mm) and spring onion variety (origin Spain, company La Gramola, 2 kg net format, size 50/90 mm). The whole bulb was used for all the experiments carried out, discarding the outer layers. The bulb was cut into small pieces with a knife, freeze-dried, and ground to obtain a more homogeneous matrix.
2.2. Chemicals and Solvents
Methanol (Fischer Chemical, Loughborough, UK) of HPLC-grade purity and Milli-Q water from a Milli-Q water purification system (manufactured by Millipore, Bedford, MA, USA) was used for UAE extraction. A 1 M HCl solution and a 1 M NaOH solution (Panreac, Barcelona, Spain) were used to adjust the pH levels.
Acetonitrile, methanol, water, and formic acid were used to analyze organosulfur compounds. All solvents used were of LC-MS purity and obtained from Honeywell (Guyancourt, France).
For the calibration of the mass spectrum system, a solution of sodium formate (NaF) and a solution of leucine enkephalin with a concentration of 100 pg µL−1 were utilized. For the preparation of the NaF solution, 100 µL of a 0.1 M NaOH solution was mixed with 200 µL of a 10% formic acid solution (Amresco Inc., Fontenay-sous-Bois, France). Finally, 20 mL of 80:20 acetonitrile:water was added. The leucine enkephalin solution was prepared from a 1 mg mL−1 concentration stock solution by 1:10 dilution in 0.1:50:50 formic acid:methanol:water. This stock solution was prepared from the commercial reagent leucine enkephalin acetate salt hydrate (Sigma-Aldrich, Saint Louis, MO, USA) ≥ 95% HPLC grade.
2.3. Study of Organosulfur Compounds Using GC-MS
In this case, to analyze the organosulfur compounds present in the onion samples, a TD-20 System (Shimadzu, Kyoto, Japan) coupled with a GCMS-TQ8040 (Shimadzu, Kyoto, Japan) system was used. Chromatographic separations were conducted using a Suprawax-280 capillary column (Teknokroma, Barcelona, Spain; 60 m length 0.25 mm column I.D. 0.25 m film thickness). The extraction of the organosulfur compounds present in the onion bulb was carried out in a desorption sample tube. Specifically, 10 mg of onion samples were placed in the desorption tube. The thermal desorption process was carried out by heating the cartridge to 205 ºC for 906 s with 1 mL min−1 He as coolant. The stripped volatiles were trapped in a Tenax GC cold trap (−15 °C), which was subsequently heated at 267 °C for 180 s, which allowed a rapid transfer to the GC capillary column. The GC analysis was carried out following the characteristics of the method previously published. Compounds were identified by comparing their mass spectra with the Wiley library (Wiley Registry of Mass Spectral Data, 7th edition, 2000), using a similarity criterion of at least 80%.
2.4. Study of Organosulfur Compounds Using LC-HRMS
2.4.1. Extraction of Organosulfur Compounds
For the extraction of organosulfur compounds before the LC-HRMS analysis, the ultrasound-assisted extraction (UAE) technique (Sonopuls HD 2070.2 processor, BANDELIN electronic GmbH & Co KG, Heinrichstrabe, Berlin, Germany), previously developed by the research group [26], was employed. The parameters used for the extraction were as follows: 76.8% methanol in water as the extraction solvent at pH 2; 58.5 °C as the extraction temperature; 85% as the UAE amplitude; 0.9 s as the cycle; and 0.2:13 g:mL sample mass/solvent volume as ratio. The extraction time was 2 minutes. Before mass spectrometric analysis, all samples were filtered using a 0.20 µm nylon syringe filter (Membrane Solutions, Dallas, TX, USA) and diluted 1:10 using the same solvent previously used for extraction.
2.4.2. Analysis of Organosulfur Compounds by LC-HRMS
To analyze the organosulfur compounds, present in the onion samples, a Shimadzu LC10-AD (Shimadzu, Noisiel, France) coupled with a SYNAPT XS High-Resolution Mass Spectrometer (Waters Corp., Milford, MA, USA) system was used. Chromatographic separations were conducted using a Sunfire C18 column (2.1 mm × 100 mm. i.d. 3.5 μm) (Waters Corp., Milford, MA, USA) in combination with a C18 guard column cartridge (3.5 µm, Waters Corp., Milford, MA, USA). The mobile phase consisted of acetonitrile:methanol:water:formic acid (12.5:22.5:65:0.1 v:v:v:v) at a constant flow rate of 0.1 mL min−1. The injection volume was 20 μL.
All mass measurements were performed in positive ion mode on an electrospray ionization quadrupole-time-of-flight mass spectrometer (ESI-QqToF) instrument. The temperature of the source was set at 130 °C; nitrogen was used as desolvation gas at a flow rate of 500 L h−1 and a temperature of 250 °C. The electrospray voltages were set at 3.4 kV for the capillary and 0.0 V for the sample cone. During the scan mode, the first and the second analyzers were used with low-mass (LM) and high-mass (HM) resolutions set to 4.9 and 15, respectively. All experiments were acquired during a scan time of 1 second in the range m/z 50-950.
During the CID MS/MS experiments, the first and the second analyzers were used with LM and HM resolutions set to 20 and 15, respectively. Argon was used as a collision gas with a pressure of 1.2 x 10⁻³ mbar inside the collision cell during MS/MS experiments (uncorrected Pirani gauge) and a trap collision energy tramp starting at 2 eV for all the organosulfur compounds and ending at 15 or 20 eV depending on the structure of the organosulfur compounds. All MS/MS experiments were acquired during 0.3 min at each excitation voltage in the range m/z 10–350.
The MassLynx software 4.2 (Waters Corp., Milford, MA, USA) was used for data acquisition and MS and MS/MS processing.
2.4.3. Identification of Organosulfur Compounds by LC-HRMS
Targeted identifications of organosulfur compounds were carried out as follows 1) literature search; 2) accurate mass measurements; 3) isotopic pattern; 4) CID tandem MS analysis.
- 1)
- 2)
- Then, from these previously reported compounds, the identification and characterization of compounds in the onion samples involved the evaluation of the mass error between the observed mass and the theoretical mass. To obtain accurate mass measurements mass spectrometers rely on calibration using ions of known m/z [31]. In this work, calibration of the instrument was performed externally before analysis with sodium formate solution. In addition, the calibration was validated by acquiring a post-calibration spectrum of the calibration solution itself (NaCOOH) and a known solution of leucine enkephalin. These calibration results showed a relative mass error of about 5 ppm. However, to ensure more accurate identification of the onion samples, candidate structures were considered with relative mass errors up to ± 10 ppm [32].
- 3)
- In addition, the isotopic pattern matching helped determine the chemical formula of the organosulfur compounds. Although the spectral patterns of isotopically generated ions are traditionally used as a secondary means of compound identification, in this work the careful examination of the theoretical patterns associated with a specific ion is also considered to be a powerful discriminator to uniquely identify chemical formulae [33].
- 4)
- Finally, tandem mass spectrometry analysis was employed to confirm the structure of the organosulfur compounds previously identified. Compounds for which reference MS/MS data could not be obtained were evaluated at the MS level only [34].
2.4. Statistical Analysis
The data from the organosulfur compounds analyzed by LC-HRMS and GC-MS were organized into two independent matrices (one for each chromatographic technique). The dimensions of both matrices were 8x18, with 8 corresponding to the number of onion varieties analyzed and 18 to the number of organosulfur compounds quantified with each of the techniques.
For each chromatographic technique, the area values of each onion variety were normalized by the total area of all the organosulfur compounds detected for each variety. In this way, the metabolomic profiles were independent of the variability of recovery during the DTD or the liquid extraction of the organosulfur compounds.
The multivariate analysis was carried out with R software [35] and RStudio [36]. Correlations were calculated with the Rpackage “corrplot” [37]. Pearson’s chi-square test for 2 × 2 contingency tables was calculated to identify the organosulfur compounds that were significantly correlated (p-value < 0.05). Only the significant correlations were plotted as ellipses. Their eccentricity was parametrically scaled to the correlation coefficient. Positive correlation was plotted in blue whereas negative correlation was plotted in red. The darker the color of the ellipse, the more correlated are the variables. Principal component analysis (PCA) was carried out with the package “mdatools” [38]. The data were autoscaled before doing the PCA analysis.
3. Results and Discussion
3.1. DTD-GC-MS Analysis and Identification
Using DTD-GC-MS, a total of 18 volatile and semi-volatile organosulfur compounds were tentatively identified according to the Wiley Library, with a match factor of more than 80%. The results obtained for one of the onions studied, the purple variety, are shown in Table 1.
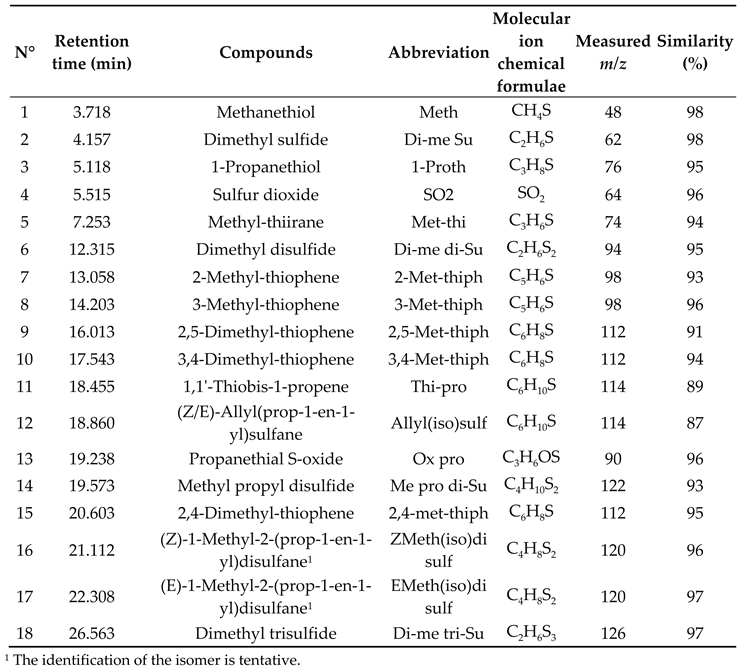
From a qualitative point of view and as we can see in Table 1, using DTD-GC-MS all the compounds identified in the samples correspond to the volatile and aromatic organosulfur compounds formed by reactions after the CS-lyase action (metabolic pathway illustrated in Figure 2). The high temperatures to which the samples are subjected during thermal desorption pre-extraction and subsequent gas chromatographic analysis mean that none of the non-aromatic precursors can be identified in the samples [14]. Other researchers had previously utilized headspace gas chromatography to quantify volatile compounds resulting from reactions catalyzed by CS-lyase, regarding these compounds as indicative of the vegetable's pungency level [22].
3.2. LC- ESI-QqToF Analysis and Identification
By LC-HRMS, 18 organosulfur compounds were identified in most of the onion samples. The results obtained for one of the onions studied, the purple variety, are shown in Table 2. The mass spectrometry results obtained for the other onion varieties are listed in Table S1-S7 of the supplementary material. A comparison of the structures of these compounds with those identified by GC-MS reveals that they are completely different families of organosulfur compounds. The compounds identified by LC-HRMS are associated with the CSOs accompanied by substantial amounts of their corresponding non-volatile precursors. By reviewing Figure 1, it is evident that this methodology facilitates the analysis of the compounds involved in the metabolic pathway of the formation of CSOs in onion. The absence of aromatic compounds in the same onion variety is probably attributed to the relatively mild analytical conditions, where the sample is not exposed to elevated temperatures. Consequently, the reactive processes responsible for forming aromatic compounds do not occur under these conditions.
Regarding the identification, all compounds showed a relative mass error of less than ± 10 ppm, in the 6.1-0.6 ppm range. In addition, it was possible to obtain CID MSMS spectra for some of the identified compounds to confirm their structure.
The specific fragmentation patterns obtained for purple onion can be observed in Table 2 and Figure 3. The results reported by Liu P. et al. 2020 and Böttcher C. et al 2017 [20,27], have been used as a basis for the identification of the products, but not much literature has been found on the fragmentation of the organosulfur compounds characteristic of onion. As can be seen from the MS/MS spectra, in all cases the precursor ions were [M+H]+. The 3 main CSOs, showed the most intense product ion at m/z 88.039, corresponding to the cleavage of the C-S bond and the consequent loss of the sulfoxide group (methiin [M+H-CH4OS]+; propiin [M+H-C3H8OS]+; isoaliin [M+H-C3H6OS]+).
In cases of unreported MSMS spectra (Table 2), the problem arises from isobaric contamination affecting the m/z values of the precursor ion. Ions with very close m/z values were reported in the tandem MS spectra. These m/z differences are too small to be discerned by mass spectrometry, even with high-resolution equipment such as the one used in this work. This isobaric contamination complicates MSMS analysis by making isolation of the designated precursor ion difficult, resulting in extensive mixtures of fragments.
3.2. Quantification of Organosulfur Compounds
Once the compounds were identified, they were quantified to compare the two analytical techniques. Since no commercial standards were available, the quantification of the different compounds by each of the techniques was performed by area quantification. Figure 4 shows the results of the analysis of the 8 samples using each of the two possible analytical techniques. Specifically, each bar represents the amount of each organosulfur compound (expressed in the relative area) for each variety tested.
In the case of GC-MS, the compounds are identified across all varieties, showing minimal differences in organosulfur content between them. However, when using LC-HRMS, there is significant variation in organosulfur content among the different varieties.
3.3. Correlations Between Organosulfur Compounds
As we have already seen, the use of each analytical technique provides information on different types of organosulfur compounds. When using LC-HRMS, the compounds identified correspond to those represented in Figure 1, whereas when using GC-MS it is only possible to study the volatile profile of the onion, after reaction with the enzyme allinase (Figure 2). However, in the end, both families of compounds are part of the same biosynthetic pathway of onion aromas. So, it makes sense that the compounds identified by LC ESI-QqToF are the non-aromatic precursors of the aromatic organosulfur compounds analyzed by DTD-GC-MS. In this work, by LC-ESI-QqToF analysis, propiin, methiin, and isoaliin were identified as the main CSOs in onion. Consequently, it is logical that GC analysis reveals mixtures of compounds with a propyl (-CH2CH2CH3), methyl (-CH3) and 1-propenyl (-CHCHCH3) functional groups, such as methanethiol, dimethylsulfide, 1-propanethiol, dimethyl disulfide, 1,1'-thiobis-1-propene, methyl propyl disulfide, (Z/E)-1-methyl-2-(prop-1-en-1-yl) di-sulfane, dimethyl trisulfide, and 1-propanethiol. To study these possible interactions in more detail, Pearson's chi-square test was applied to identify the significant correlations between the organosulfur compounds.
3.3.1. Correlations between Organosulfur Compounds Identified by LC- ESI-QqToF
First, possible correlations between the compounds identified only by LC-HRMS were studied (Figure 5). We can see that a priori there are many correlations between these non-volatile compounds, some of which can be explained through the biosynthetic routes of formation of the CSOs.
From Figure 5, it can be seen how methiin correlates positively with some of the precursors of its metabolomic pathway (Figure 1a): S-methyl cysteine (r = 0.71) and γ-glutamyl-S-methyl cysteine (r = 0.83). Similarly, propiin correlates positively with its precursors S-propyl cysteine (r = 0.82) and γ-glutamyl-S-propyl cysteine (r = 0.79) (Figure 1b). Furthermore, the negative correlation of propiin with γ-glutamyl-S-propyl cysteine sulfoxide (r = −0.79), could indicate that the formation of this CSO takes place through the loss of the γ-glutamyl group and subsequent oxidation and not in the opposite way, as was earlier seen in the introduction. In the case of isoaliin, which has a more complex metabolic pathway than the one summarised in Figure 1c (Complete pathway Figure 1S of the supplementary) [39], it is also observed that this CSO correlates positively with some of its precursors. Specifically, the following correlation were obtained: γ-glutamyl-S-(1-propenyl) cysteine sulfoxide (r = 1), γ–glutamyl-S-(S-1-propenyl)cysteine-glycine (r = 0.59); γ–glutamyl-S-(2-carboxypropyl) cysteine-glycine (r = 0.96), S-(2-carboxypropyl)cysteine-glycine (r = 0.96).
3.3.2. Correlations between Organosulfur Compounds Identified by DTD-GC-MS
Regarding the results obtained by GC-MS, there is less correlation among the organosulfur compounds analyzed with this technique. Figure 6 shows positive correlations among the thiophenes, which belong to the same family. Simultaneously, these thiophenes exhibit a negative correlation with propanethial S-oxide. This negative correlation is logical when considering the production pathways of these compounds (Figure 2). Both thiophenes and propanethial S-oxide are derived from the same sulfoxide, isoaliin, leading to a competitive process where the sulfoxide can either form thiophenes and other aromatic compounds or produce the small molecule responsible for eye irritation when cutting onions.
3.3.3. Correlations between Organosulfur Compounds Identified with Both Techniques
Finally, the possible correlations between the compounds analyzed with the two analytical techniques proposed in this work were studied. The results obtained are shown in Figure 7. A priori it does not seem possible to establish a strong relationship between the content of CSOs and non-volatile precursors quantified in the samples by LC-HRMS and the content of aromatic organosulfur compounds analyzed by GC-MS.
From Figure 7 propanethial S-oxide shows some correlations, both positive and negative, with the organosulfur precursors identified by HRMS. This compound, known as a tear factor because it is responsible for the eye irritation and watering caused by cutting onions, is generated from the main onion precursor, isoaliin. Therefore, it makes sense that this compound correlates positively with isoaliin (r = 0.73) and with the precursor of this metabolic pathway: γ-glutamyl-S-(1-propenyl) cysteine sulfoxide (r = 0.73), γ-glutamyl-S-(2-carboxypropyl) cysteine-glycine (r = 0.79), (2-carboxypropyl) cysteine-glycine (r = 0.63). In addition, it shows positive correlations with organosulfur compounds involved in the metabolic pathway for methiin synthesis and negative correlations with propiin (r = −0.76) and some of its precursors.
Finally, the correlations obtained between the identified compounds were complemented with principal component analysis (PCA) for a better understanding of the trends.
3.4. Principal Component Analysis
Principal component analysis (PCA) was conducted using the organosulfur compounds quantified by the two analytical techniques proposed in this study. All the data were autoscaled. The score plots obtained using the LC-HRMS data matrix, the GC-MS data matrix, and the combined data from both methods are shown in Figure 8.
Figure 8a illustrates the reduction of data from the 18 organosulfur compounds identified by LC-HRMS to two principal components, representing 97.6% of the total explained variance. All the scores were within the Hotelling T2 ellipse and revealed a tendency to form three distinct clusters among the eight onion varieties studied. The biplot of Figure 9a elucidates which organosulfur compounds influence each discriminant group the most. PC1, representing 86.38% of the explained variance, demonstrates positive correlations with propiin, S-propyl cysteine, and γ-glutamyl-S-propyl cysteine, while exhibiting negative correlations with the remaining non-volatile organosulfur compounds. Consequently, samples red label, white, and shallots, which tend to cluster together in the right part of the PC1, generally display higher levels of compounds from the family of propiin and lower concentrations of those from methiin and isoaliin families.
Figure 8b shows the score plot of the GC-MS data. In this case, the total explained variance retained by the first two principal components was approximately 59.5%. All the scores of the onion varieties were within the 95% Hotelling T2 ellipse, showing that there are no outliers. The score plot demonstrates that there is no observable clustering trend between the samples. This lack of clustering could probably be attributed to the harsh analytical conditions, which induce degradation and numerous reactions between organosulfur compounds.
Looking at the biplot obtained (Figure 9b), the negative loading of propanethial S-oxide has a very important contribution in PC1 and behaves differently from the rest of the organosulfur compounds (which show positive loadings). This opposite behavior can also be explained by the negative correlation already observed between these compounds in Figure 6. The biplot highlights the distinct metabolic pathway that this tear factor has concerning the other volatile compounds. The onion varieties analyzed by GC-MS are then differentiated according to these two metabolic pathways. The ‘yellow’ onion has a very high concentration of propanethial S-oxide and a low concentration of the remaining volatile organosulphur compounds, while the shallot has the lowest concentration of propanethial S-oxide and the highest concentration of the remaining compounds.
Finally, the PCA was conducted jointly using the results of both techniques (Figure 8c). From the obtained results, it is evident that the classification into three groups is primarily influenced by the findings derived from LC-HRMS analysis. While GC-MS offers slightly improved separation of shallots, red label, and white varieties, the main basis for classification stems from the information gleaned through LC-HRMS analysis, which is expected due to the greater variability afforded by this technique.
Furthermore, when examining the classifications of the onion samples, it becomes evident that those with higher content of non-volatile precursors identified by LC-HRMS did not necessarily result in higher concentrations of aromatic compounds detected by GC-MS. For example, although the spring onion exhibited the highest organosulfur compounds content by LC-HRMS, the shallots sample demonstrated the highest organosulfur compounds detected by GC-MS. These disparities could be due to the complexity highlighted above, where it is difficult to establish an exact stoichiometric relationship between hydrolysates and CSO, as suggested by some authors [40].
The findings from this study suggest that the proposed and compared analytical techniques yield distinct results. Primarily, while GC-MS allows for the analysis of the onion's volatile profile, LC-HRMS provides insights into the initial content of organosulfur compounds before enzymatic reaction with alliinase. However, neither compound types correlate satisfactorily, indicating no relationship between volatiles and non-volatiles. Therefore, despite GC being one of the most employed techniques in the literature for studying sulfur compound content in onions, we believe that for a more comprehensive and accurate depiction of the metabolomic profile in onions, employing LC-HRMS or combining both techniques provides a superior outcome.
5. Conclusions
The high popularity of onions, due to their significant content of organosulfur compounds responsible for their sensory attributes and health benefits, has driven the development of various analytical methods to study these compounds. In the literature, GC-MS is one of the most widely used methods for their analysis. However, the high temperatures required in this method lead to the hydrolysis of the initial organosulfur compounds, focusing primarily on the volatile profile of onions. To understand the relationship between this volatile profile and the initial organosulfur compounds in onions, such as CSOs, this study proposes the use of LC-HRMS as an alternative. For this objective, eight onion varieties were analyzed using both techniques. Both methods identified 18 sulfur compounds: DTD-GC-MS identified volatile organosulfur compounds such as disulfides, trisulfides, and the compound responsible for eye irritation when cutting onions, while LC-HRMS identified non-volatile organosulfur compounds like methiin, propiin, isoalliin, and their precursors. Correlating the results from both methods revealed no clear relationships between the volatile and non-volatile compounds identified by each technique. Furthermore, the results showed that LC-HRMS provides more detailed information on the metabolic pathways involved in the formation of onion aromas. This method also allows for the identification of similarities among the studied onion varieties, enabling classification in space through PCA. In contrast, the results obtained by GC-MS do not reveal similarities between the onion varieties but seem more discriminant between varieties. Therefore, despite GC-MS being one of the most employed techniques in the literature for studying sulfur compound content in onions, this work concludes that for a more comprehensive and accurate depiction of the metabolomic profile in onions, employing LC-HRMS or combining both techniques may provide a superior outcome.
Supplementary Materials
The following supporting information can be downloaded at the website of this paper posted on Preprints.org, Figure S1: Metabolic pathways for the synthesis of the isoallin.; Table S1: LC-ESI-Q-IMS-qToF based identification of organosulfur compounds on red onion variety; Table S2: Table S2. LC-ESI-Q-IMS-qToF based identification of organosulfur compounds on shallot sample; Table S3: LC-ESI-Q-IMS-qToF based identification of organosulfur compounds on red label onion variety; Table S4: LC-ESI-Q-IMS-qToF based identification of organosulfur compounds on yellow onion variety; Table S5: LC-ESI-Q-IMS-qToF based identification of organosulfur compounds on white onion variety; Table S6: LC-ESI-Q-IMS-qToF based identification of organosulfur compounds on sweet onion variety; Table S7: LC-ESI-Q-IMS-qToF based identification of organosulfur compounds on spring onion variety.
Author Contributions
Conceptualization, A.M.; G.F.B. and A.M.; methodology, A.V.G.-d.-P.; software, A.M., and A.V.G.-d.-P.; validation, A.V.G.-d.-P.; formal analysis, A.V.G.-d.-P. and A.M.; investigation, A.V.G.-d.-P.; resources, G.F.B. and A.M.; data curation, A.V.G.-d.-P. and A.M.; writing—original draft preparation, A.V.G.-d.-P.; writing—review and editing, A.M., G.F.B. and A.M.; visualization, A.M., G.F.B. and A.M.; supervision, A.M., G.F.B. and A.M.; project administration, G.F.B. and A.M.; funding acquisition, G.F.B. and A.M. All authors have read and agreed to the published version of the manuscript.
Funding
This project has received funding from the European Union’s Horizon 2020 research and innovation program under the Marie Skłodowska-Curie grant agreement no. 899546: “Integrated machine learning metabolomics using ion mobility mass spectrometry to unveil biomarkers in Allium samples”. This work has also been supported by the project “EQC2018-005135-P” (Equipment for liquid chromatography using mass spectrometry and ion chromatography) of the State Subprogram of Research Infrastructures and Technical Scientific Equipment.
Institutional Review Board Statement
Not applicable.
Informed Consent Statement
Not applicable.
Data Availability Statement
The data presented in this study are contained within the article.
Acknowledgments
The authors are grateful to the “Instituto de Investigación Vitivinícola y Agroalimentaria” (IVAGRO) of the University of Cadiz, and University of Brest for providing the necessary facilities to carry out the research.
Conflicts of Interest
The authors declare no conflicts of interest.
References
- Mallor, C.; Thomas, B. Resource allocation and the origin of flavor precursors in onion bulbs. J HORTIC SCI BIOTECH 2008, 83, 191–198. [Google Scholar] [CrossRef]
- Block, E. The Organosulfur Chemistry of the Genus Allium - Implications for the Organic Chemistry of Sulfur. Angew. Chemie Int. Ed. English 1992, 31, 1135–1178. [Google Scholar] [CrossRef]
- FAO. Global Forest Resources Assessment 2015; Food and Agriculture Organization of the United Nations: Rome, Italy, 2016. [Google Scholar]
- Marefati, N.; Ghorani, V.; Shakeri, F.; Boskabady, M.; Kianian, F.; Rezaee, R.; Boskabady, M.H. A review of anti-inflammatory, antioxidant, and immunomodulatory effects of Allium cepa and its main constituents. Pharm Biol. 2021, 59, 287–302. [Google Scholar] [CrossRef] [PubMed]
- Dorant, E.; Van den Brandt, P.A.; Goldbohm, E.A.; Sturmans, F. Consumption of onions and a reduced risk of stomach carcinoma. Gastroenterology 1996, 110, 12–20. [Google Scholar] [CrossRef] [PubMed]
- Ülger, T.G.; Çakiroglu, F.P. The effects of onion (Allium cepa L.) dried by different heat treatments on plasma lipid profile and fasting blood glucose level in diabetic rats. Avicenna J Phytomed, 2020, 10, 325–333. [Google Scholar] [CrossRef] [PubMed]
- Hegazy, E.M.; Sabry, A.; Khalil, W.K.B. Neuroprotective effects of onion and garlic root extracts against Alzheimer’s disease in rats: antimicrobial, histopathological, and molecular studies. Biotechnologia 2022, 103, 153–167. [Google Scholar] [CrossRef] [PubMed]
- Goncharov, N.V.; Belinskaia, D.A.; Ukolov, A.I.; Jenkins, R.O.; Avdonin, P.V. Chapter 41 - Organosulfur Compounds as Nutraceuticals. In Nutraceuticals: Efficacy, Safety and Toxicity. 2016, Ramesh, C.G., Editorial Elsevier Inc., 555–568, ISBN:9780128210383.
- Zhu, G.; Gou, J.; Klee, H.; Huang, S. Next-Gen Approaches to Flavor-Related Metabolism. Annu Rev Plant Biol. 2019, 29, 187–212. [Google Scholar] [CrossRef] [PubMed]
- Jones, M.G.; Hughes, J.; Tregova, A.; Milne, J.; Tomsett, A.B.; Collin, H.A. Biosynthesis of the flavour precursors of onion and garlic. J Exp Bot. 2004, 55, 1903–1918. [Google Scholar] [CrossRef] [PubMed]
- Bacon, J.R.; Moates, G.K.; Ng, A.; Rhodes, M.J.C.; Smith, A.C.; Waldron, K.W. Quantitative analysis of flavour precursors and pyruvate levels in different tissues and cultivars of onion (Allium cepa). Food Chem. 1999, 64, 257–261. [Google Scholar] [CrossRef]
- Silvaroli, J.A.; Pleshinger, M.J.; Banerjee, S.; Kiser, P.D.; Golczak, M. Enzyme That Makes You Cry-Crystal Structure of Lachrymatory Factor Synthase from Allium cepa. ACS Chem Bio. 2017, 12, 2296–2304. [Google Scholar] [CrossRef]
- Hill, C.R.; Haoci Liu, A.; McCahon, L.; Zhong, L.; Shafaei, A.; Balmer, L.; Lewis, J.R.; Hodgson, J.M.; Blekkenhorst, L.C. S-methyl cysteine sulfoxide and its potential role in human health: a scoping review. Crit Rev Food Sci Nutr. 2023, 11, 1–14. [Google Scholar] [CrossRef] [PubMed]
- Kubec, R.; Svobodová, M.; Velı́šek, J. Gas chromatographic determination of S-alk(en)ylcysteine sulfoxides. J Chromatogr A 1999, 862, 85–94. [Google Scholar] [CrossRef]
- Machová, M.; Bajer, T.; Šilha, D.; Ventura, K.; Bajerová, P. Release of Volatile Compounds from Sliced Onion Analysed by Gas Chromatography Coupled to Mass Spectrometry and Its Antimicrobial Activity. J. Food Nutr. Res. 2019, 58, 393–400, ISSN:1336-8672. [Google Scholar]
- Kim, N.Y.; Park, M.H.; Jang, E.Y.; Lee, J.H. Volatile Distribution in Garlic (Allium Sativum L.) by Solid Phase Microextraction (SPME) with Different Processing Conditions. Food Sci. Biotechnol. 2011, 20, 775–782. [Google Scholar] [CrossRef]
- González-de-Peredo, A.V.; Vázquez-Espinosa, M.; Espada-Bellido, E.; Ferreiro-González, M.; Carrera, C.; Palma, M.; Barbero, G.F. Application of Direct Thermal Desorption–Gas Chromatography–Mass Spectrometry for Determination of Volatile and Semi-Volatile Organosulfur Compounds in Onions: A Novel Analytical Approach. Pharmaceuticals 2023, 16, 715. [Google Scholar] [CrossRef] [PubMed]
- Mitrová, K.; Hrbek, V.; Svoboda, P.; Hajšlová, J.; Ovesná, J. Antioxidant activity, s-alk(en)yl-l-cysteine sulfoxide and polyphenol content in onion (allium cepa L.) cultivars are associated with their genetic background. Czech J. Food Sci. 2016, 34, 127–132. [Google Scholar] [CrossRef]
- Kim, S.; Lee, S.; Shin, D.; Yoo, M. Change in Organosulfur Compounds in Onion (Allium Cepa L.) during Heat Treatment. Food Sci. Biotechnol. 2016, 25, 115–119. [Google Scholar] [CrossRef]
- Böttcher, C.; Krähmer, A.; Stürtz, M.; Widder, S.; Schulz, H. Comprehensive Metabolite Profiling of Onion Bulbs (Allium Cepa) Using Liquid Chromatography Coupled with Electrospray Ionization Quadrupole Time-of-Flight Mass Spectrometry. Metabolomics 2017, 13, 1–15. [Google Scholar] [CrossRef]
- Rhyu, D.Y.; Park, S.H. Characterization of alkyl thiosulfinate in Allium hookeri root using HPLC-ESI-MS. J Korean Soc Appl Biol Chem. 2013, 56, 457–459. [Google Scholar] [CrossRef]
- Tsuge, K.; Kataoka, M.; Seto, Y. Determination of S-methyl-, S-propyl-, and S-propenyl-L-cysteine sulfoxides by gas chromatography-mass spectrometry after tert-butyldimethylsilylation. J Agric Food Chem. 2002, 50, 4445–4451. [Google Scholar] [CrossRef]
- Wang, H.; Li, J.; Wang, Z.; Zhang, X.; Ni, Y. Modified method for rapid quantitation of S-alk(en)yl-L-cysteine sulfoxide in yellow onions (Allium cepa L.). J Agric Food Chem. 2007, 55, 5429–5435. [Google Scholar] [CrossRef] [PubMed]
- Ramirez, D.A.; Locatelli, D.A.; González, R.E.; Cavagnaro, P.F.; Camargo, A.B. Analytical Methods for Bioactive Sulfur Compounds in Allium: An Integrated Review and Future Directions. J. Food Compos. Anal. 2017, 61, 4–19. [Google Scholar] [CrossRef]
- Lanzotti, V. The analysis of onion and garlic. J. Chromatogr. A 2006, 1112, 3–22. [Google Scholar] [CrossRef] [PubMed]
- González-de-Peredo, A.V.; Vázquez-Espinosa, M.; Espada-Bellido, E.; Carrera, C.; Ferreiro-González, M.; Barbero, G.F.; Palma, M. Flavonol composition and antioxidant activity of onions (Allium cepa L.) based on the development of new analytical ultrasound-assisted extraction methods. Antioxidants 2021, 10, 273. [Google Scholar] [CrossRef] [PubMed]
- Liu, P.; Weng, R.; Sheng, X.; Wang, X.; Zhang, W.; Qian, Y.; Qiu, J. Profiling of organosulfur compounds and amino acids in garlic from different regions of China. Food Chem. 2020, 305, 125499. [Google Scholar] [CrossRef] [PubMed]
- Qin, L.; Ma, H.; Zhang, X.; Zhang, Z.; Wang, Y. Metabolomics and transcriptomics analyses provides insights into S-alk(en)yl cysteine sulfoxides (CSOs) accumulation in onion (Allium cepa). Sci Hortic. 2023, 310, 111727. [Google Scholar] [CrossRef]
- Moreno-Ortega, A.; Pereira-Caro, G.; Ludwig, I.A.; Motilva, M.J.; Moreno-Rojas, J.M. Bioavailability of Organosulfur Compounds after the Ingestion of Black Garlic by Healthy Humans. Antioxidants 2023, 12, 925. [Google Scholar] [CrossRef] [PubMed]
- Moreno-Rojas, J.M.; Moreno-Ortega, A.; Ordóñez, J.L.; Moreno-Rojas, R.; Pérez-Aparicio, J.; Pereira-Caro, G. Development and Validation of UHPLC-HRMS Methodology for the Determination of Flavonoids, Amino Acids and Organosulfur Compounds in Black Onion, a Novel Derived Product from Fresh Shallot Onions (Allium Cepa Var. Aggregatum). LWT 2018, 97, 376–383. [Google Scholar] [CrossRef]
- Romson, J.; Emmer, Å. Mass calibration options for accurate electrospray ionization mass spectrometry. Int. J. Mass Spectrom. 2021, 467, 116619. [Google Scholar] [CrossRef]
- Tang, J.; Dunshea, F.R.; Suleria, H.A.R. LC-ESI-QTOF/MS characterization of phenolic compounds from medicinal plants (Hops and Juniper Berries) and their antioxidant activity. Foods, 2020, 9, 1–25. [Google Scholar] [CrossRef]
- Kramberger, K.; Barlič-Maganja, D.; Bandelj, D.; Baruca Arbeiter, A.; Peeters, K.; Miklavčič Višnjevec, A.; Jenko Pražnikar, Z. HPLC-DAD-ESI-QTOF-MS Determination of Bioactive Compounds and Antioxidant Activity Comparison of the Hydroalcoholic and Water Extracts from Two Helichrysum italicum Species. Metabolites 2020, 10, 403. [Google Scholar] [CrossRef] [PubMed]
- Okaiyeto, K.; Kerebba, N.; Rautenbach, F.; Kumar Singh, S.; Dua, K.; Oguntibeju, O.O. UPLC-ESI-QTOF-MS phenolic compounds identification and quantification from ethanolic extract of Myrtus communis ‘Variegatha’: In vitro antioxidant and antidiabetic potentials. Arab. J. Chem. 2023, 16, 104447. [Google Scholar] [CrossRef]
- R Core Team. R: A language and environment for statistical computing. R Foundation for Statistical. 2022, Computing, Vienna, Austria. https://www.R-project.org/.
- RStudio Team. RStudio: Integrated Development Environment for R. 2022, RStudio, PBC, Boston, MA. http://www.rstudio.com/.
- Wei, T.; Simko, V. R package 'corrplot': Visualization of a Correlation Matrix. (Version 0.92). 2021. Available from https://github.com/taiyun/corrplot.
- Kucheryavskiy, S. mdatools – R package for chemometrics. Chemom. Intell. Lab. Syst. 2020, 198, 103937. [Google Scholar] [CrossRef]
- Moreno-Ortega, A.; Ludwig, I.A.; Motilva, M.J.; Moreno-Rojas, J.M.; Pereira-Caro, G. Urinary excretion of organosulfur compounds after acute ingestion of black onion. Food Funct. 2023, 14, 5023–5031. [Google Scholar] [CrossRef]
- Randle, W.M.; Lancaster, J.E.; Shaw, M.L.; Sutton, K.H.; Hay, R.L.; Bussard, M.L. Quantifying Onion Flavor Compounds Responding to Sulfur Fertility-Sulfur Increases Levels of Alk(En)Yl Cysteine Sulfoxides and Biosynthetic Intermediates. J. Am. Soc. Hortic. Sci. 1995, 120, 1075–1081. [Google Scholar] [CrossRef]
Figure 1.
Metabolic pathways for the synthesis of main CSOs in onions.
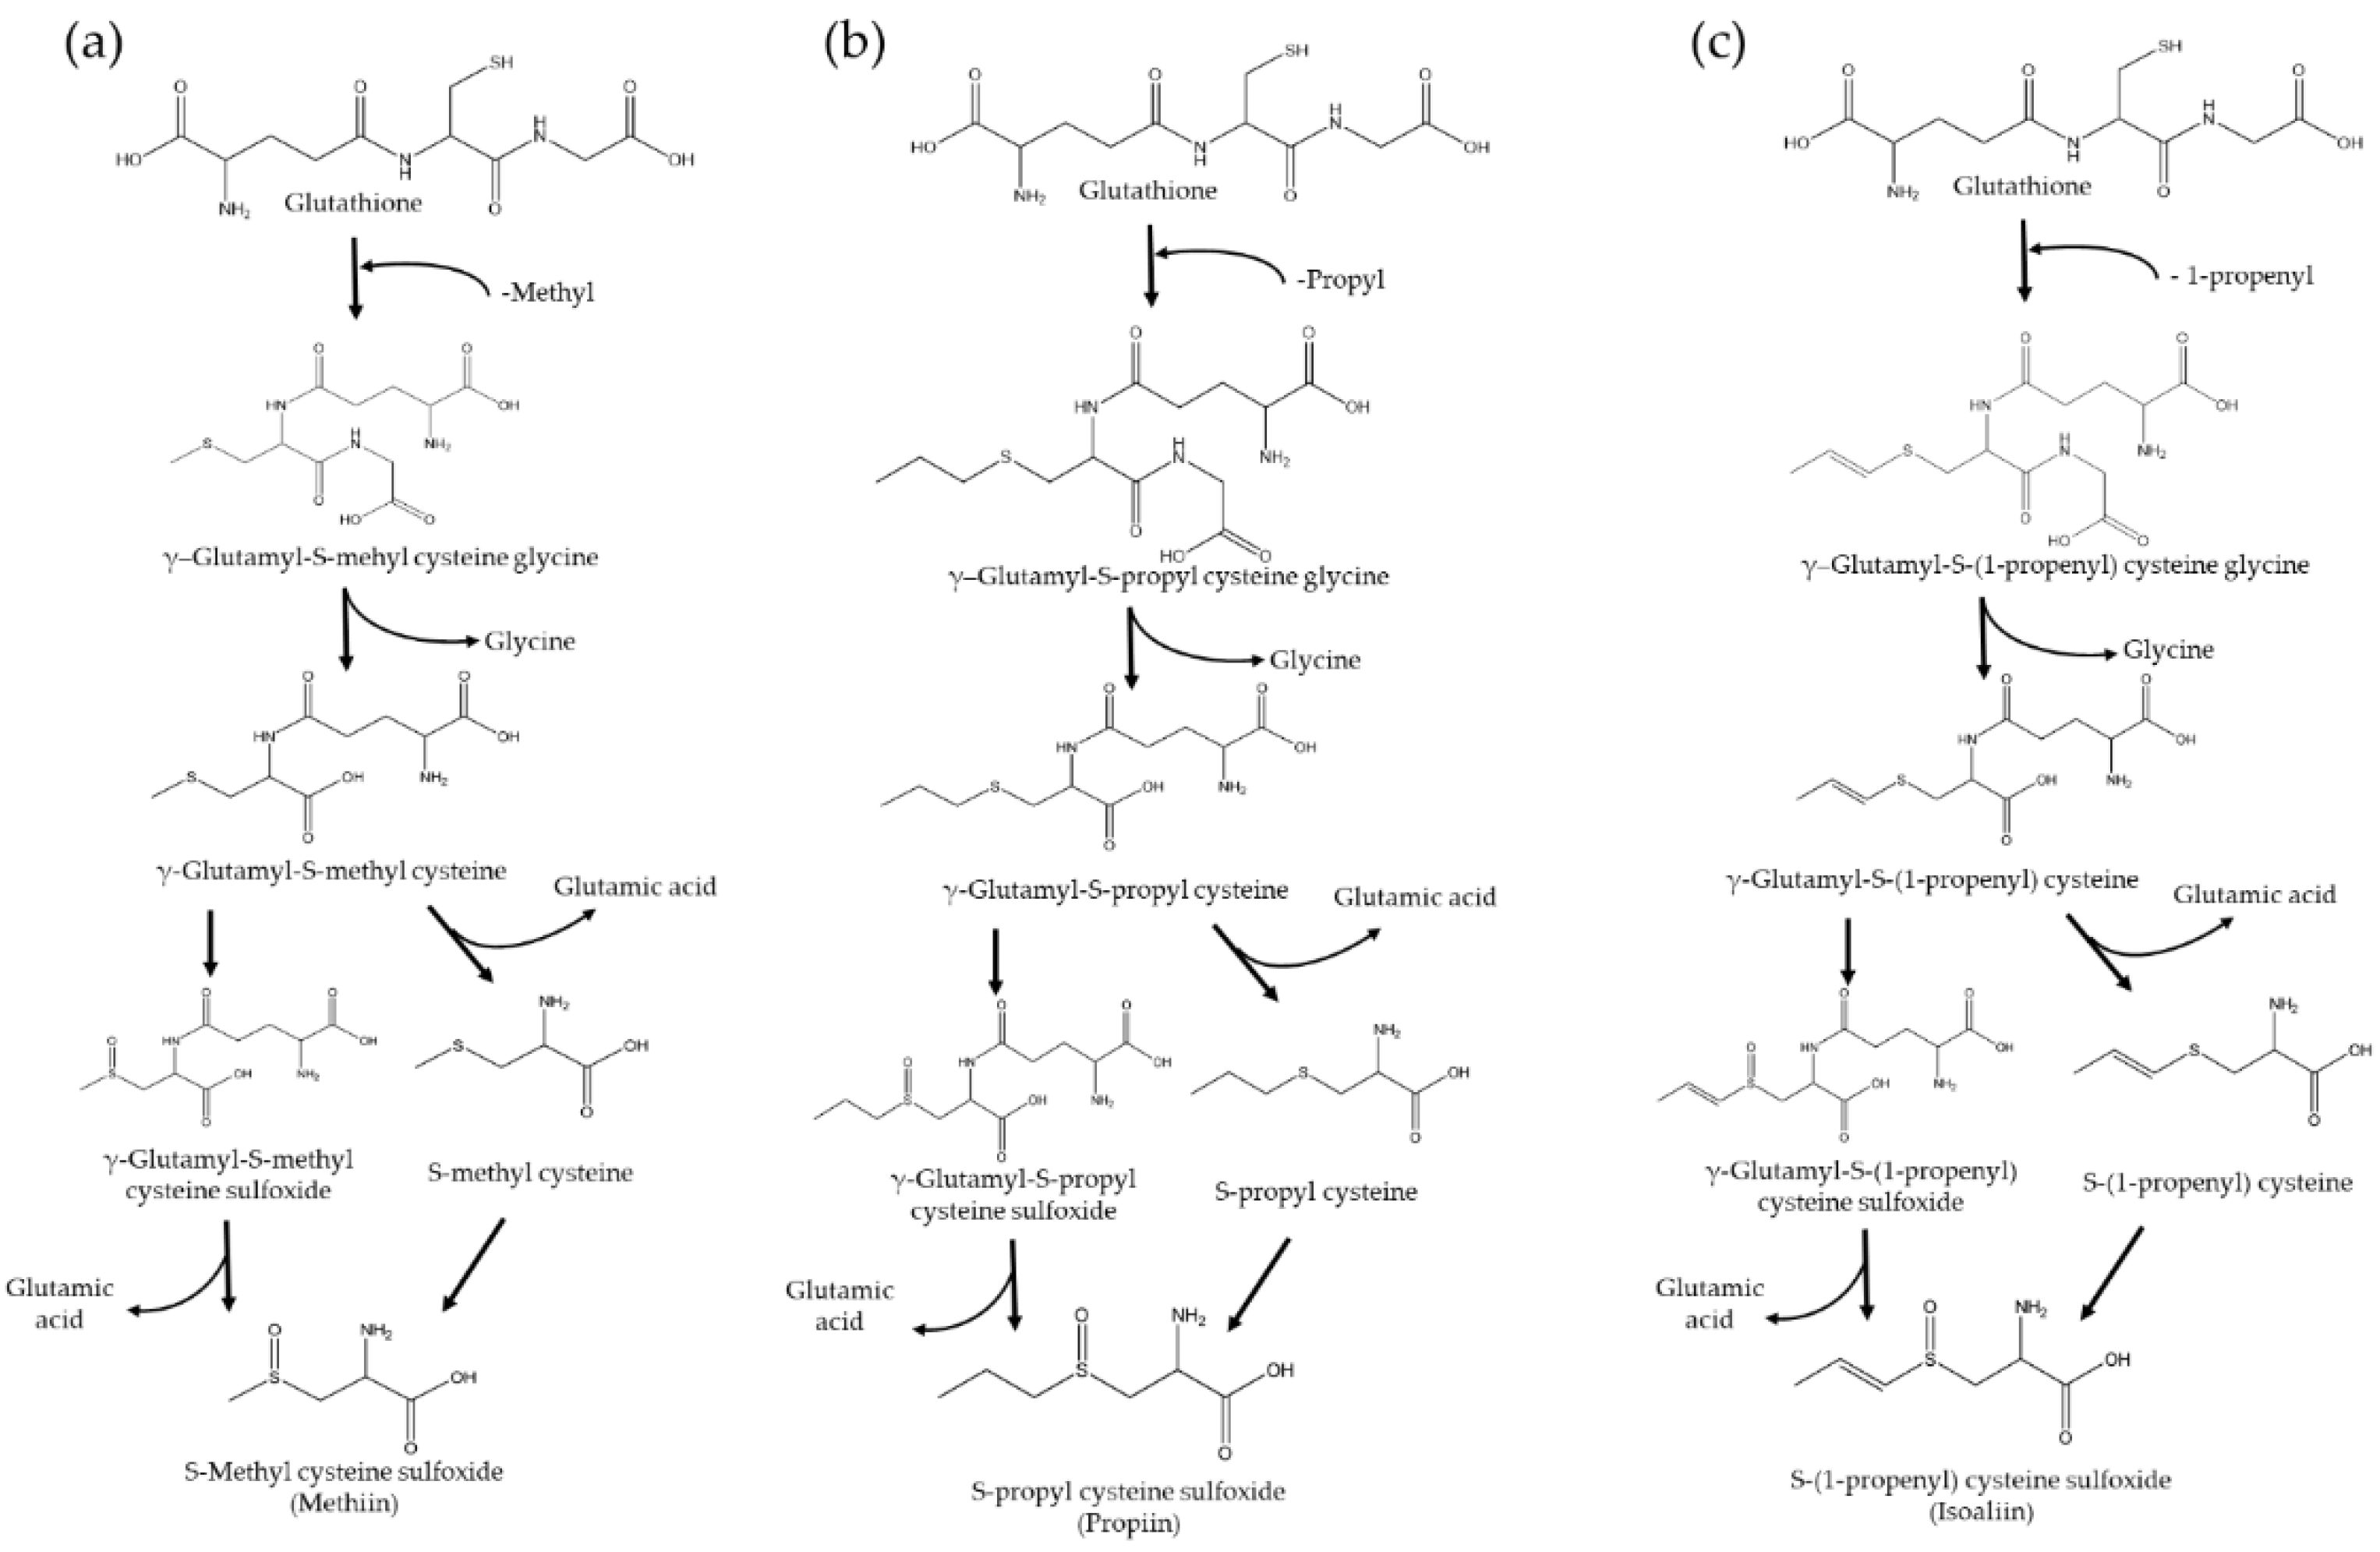
Figure 2.
Metabolic pathways for the synthesis of flavoring compounds.
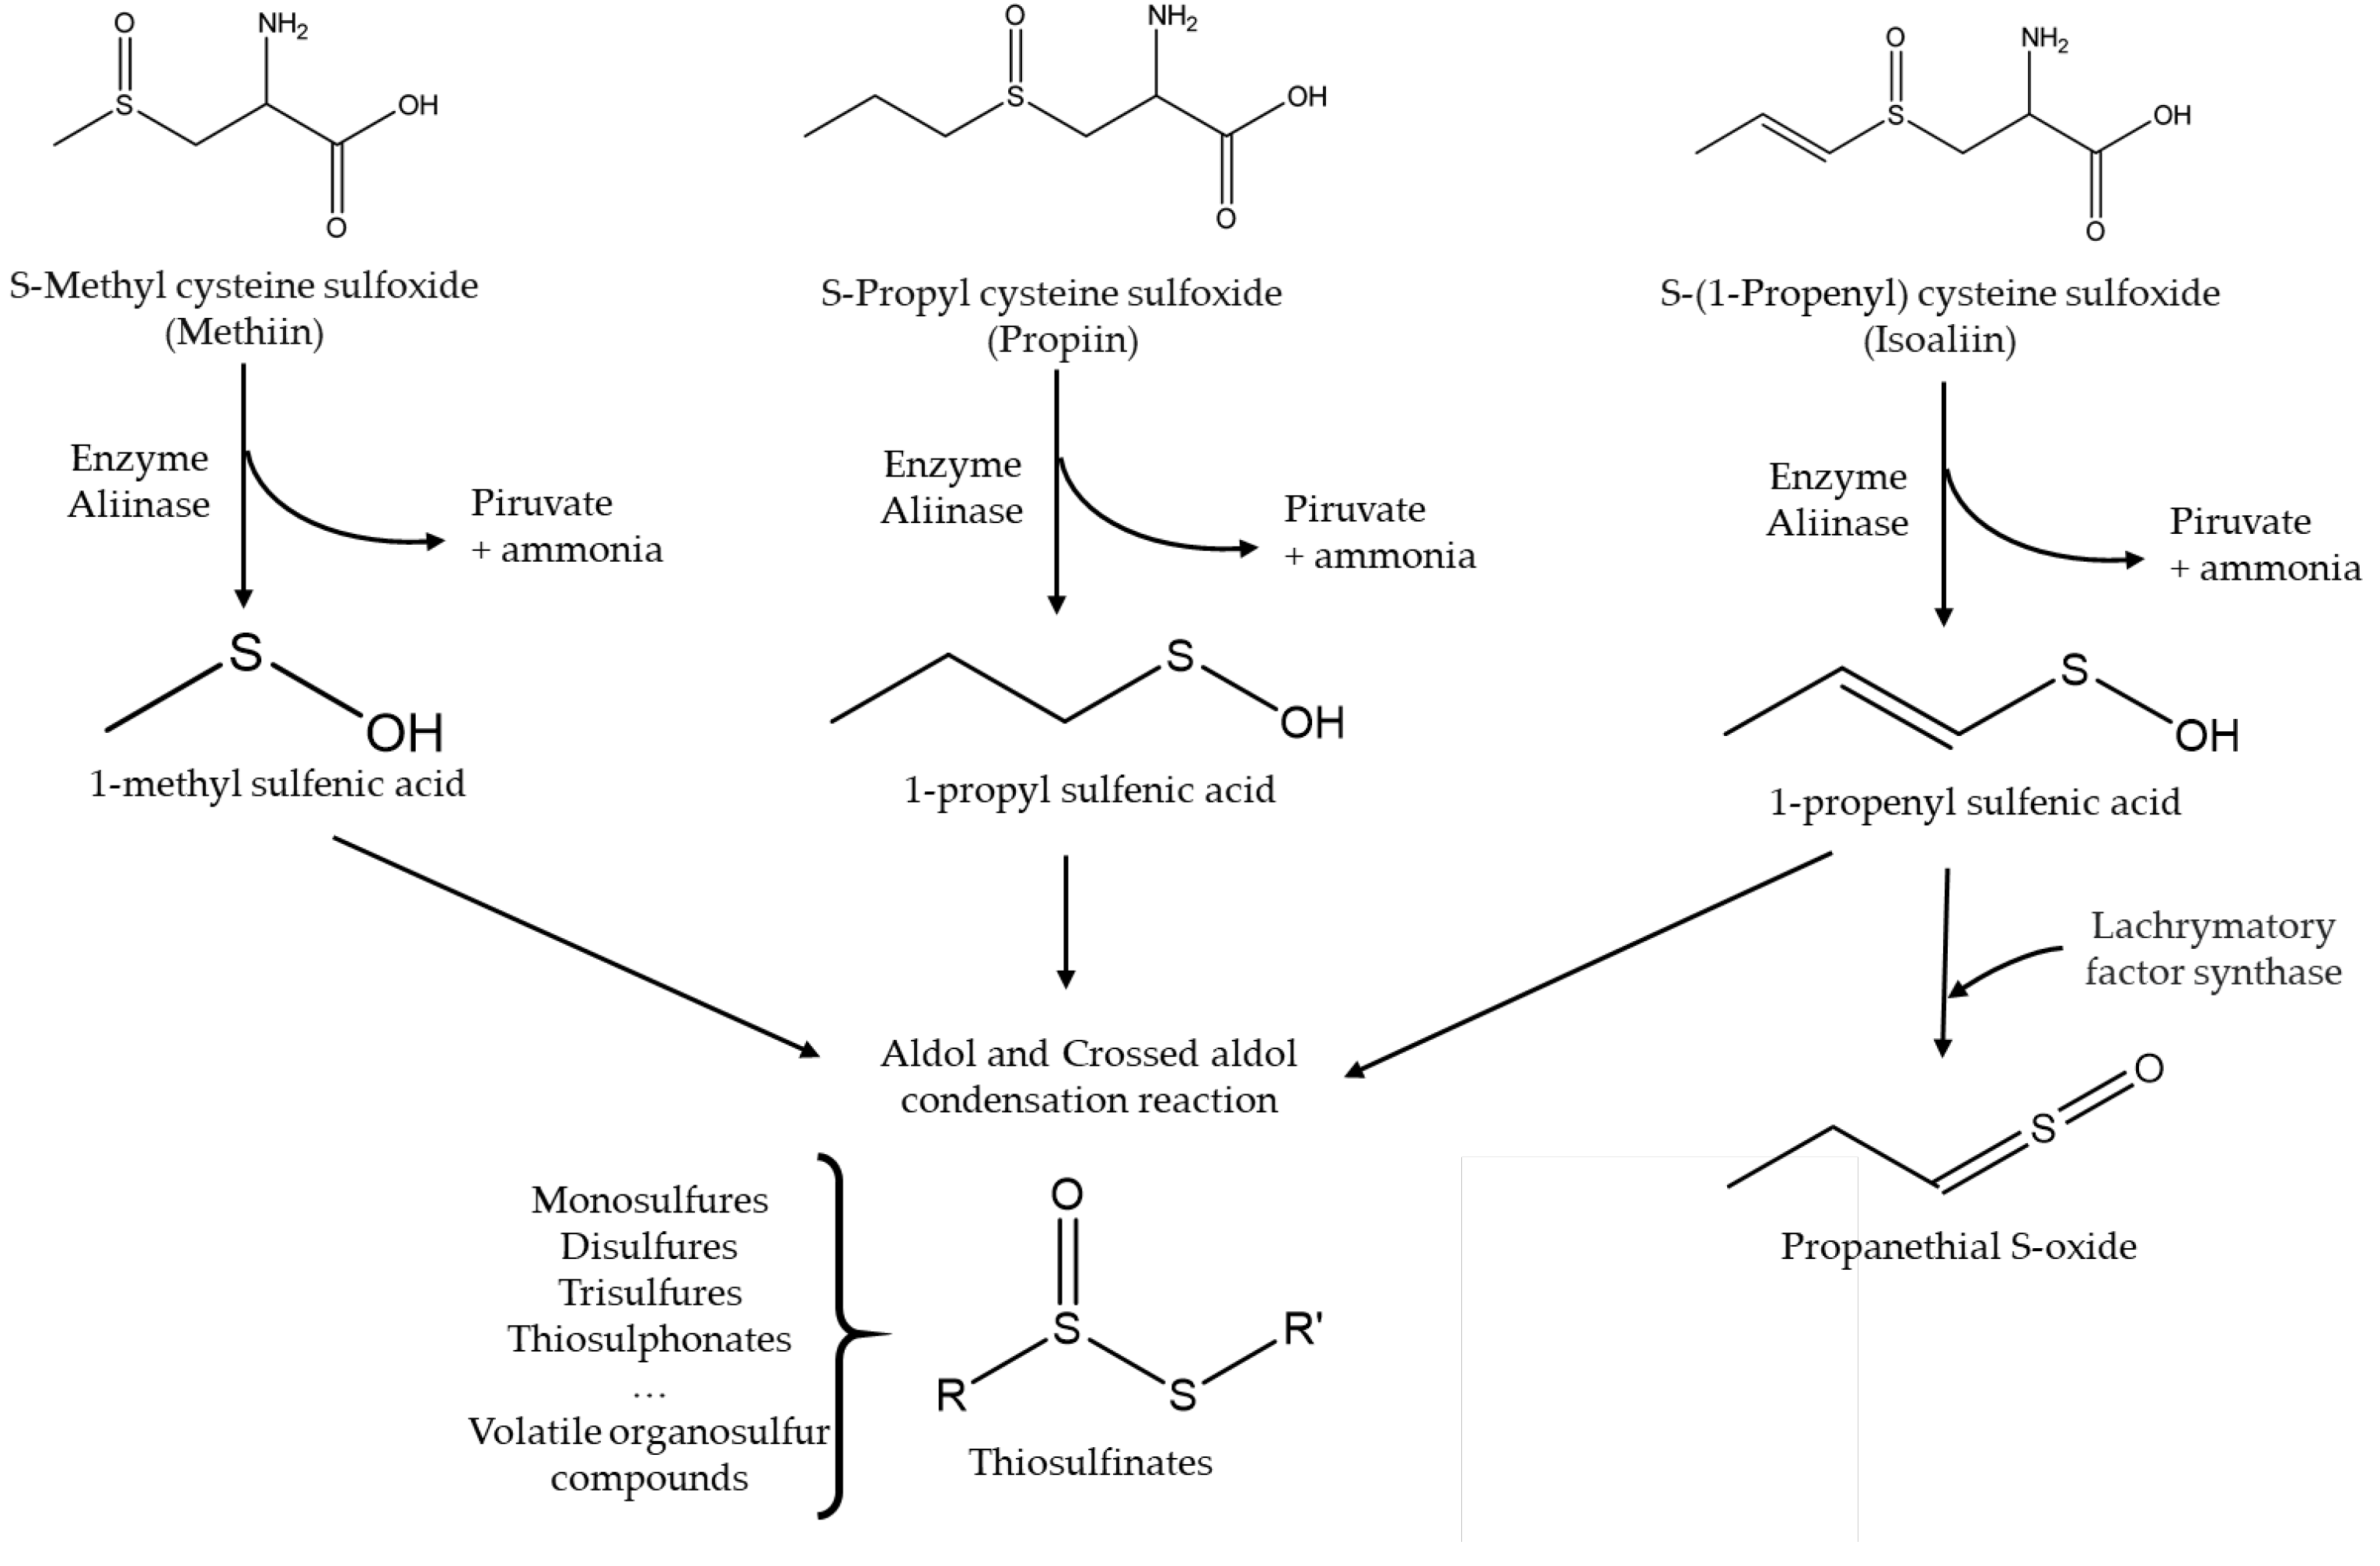
Figure 3.
Purple onion sample product ion mass spectra using ESI in positive ion mode. a) methiin; b) isoaliin; c) propiin; d) γ-glutamyl-S-methyl cysteine; e) γ-Glutamyl-S-(1-propenyl) cysteine sulfoxide; f) γ-Glutamyl-S-(1-propenyl) cysteine.
Figure 3.
Purple onion sample product ion mass spectra using ESI in positive ion mode. a) methiin; b) isoaliin; c) propiin; d) γ-glutamyl-S-methyl cysteine; e) γ-Glutamyl-S-(1-propenyl) cysteine sulfoxide; f) γ-Glutamyl-S-(1-propenyl) cysteine.
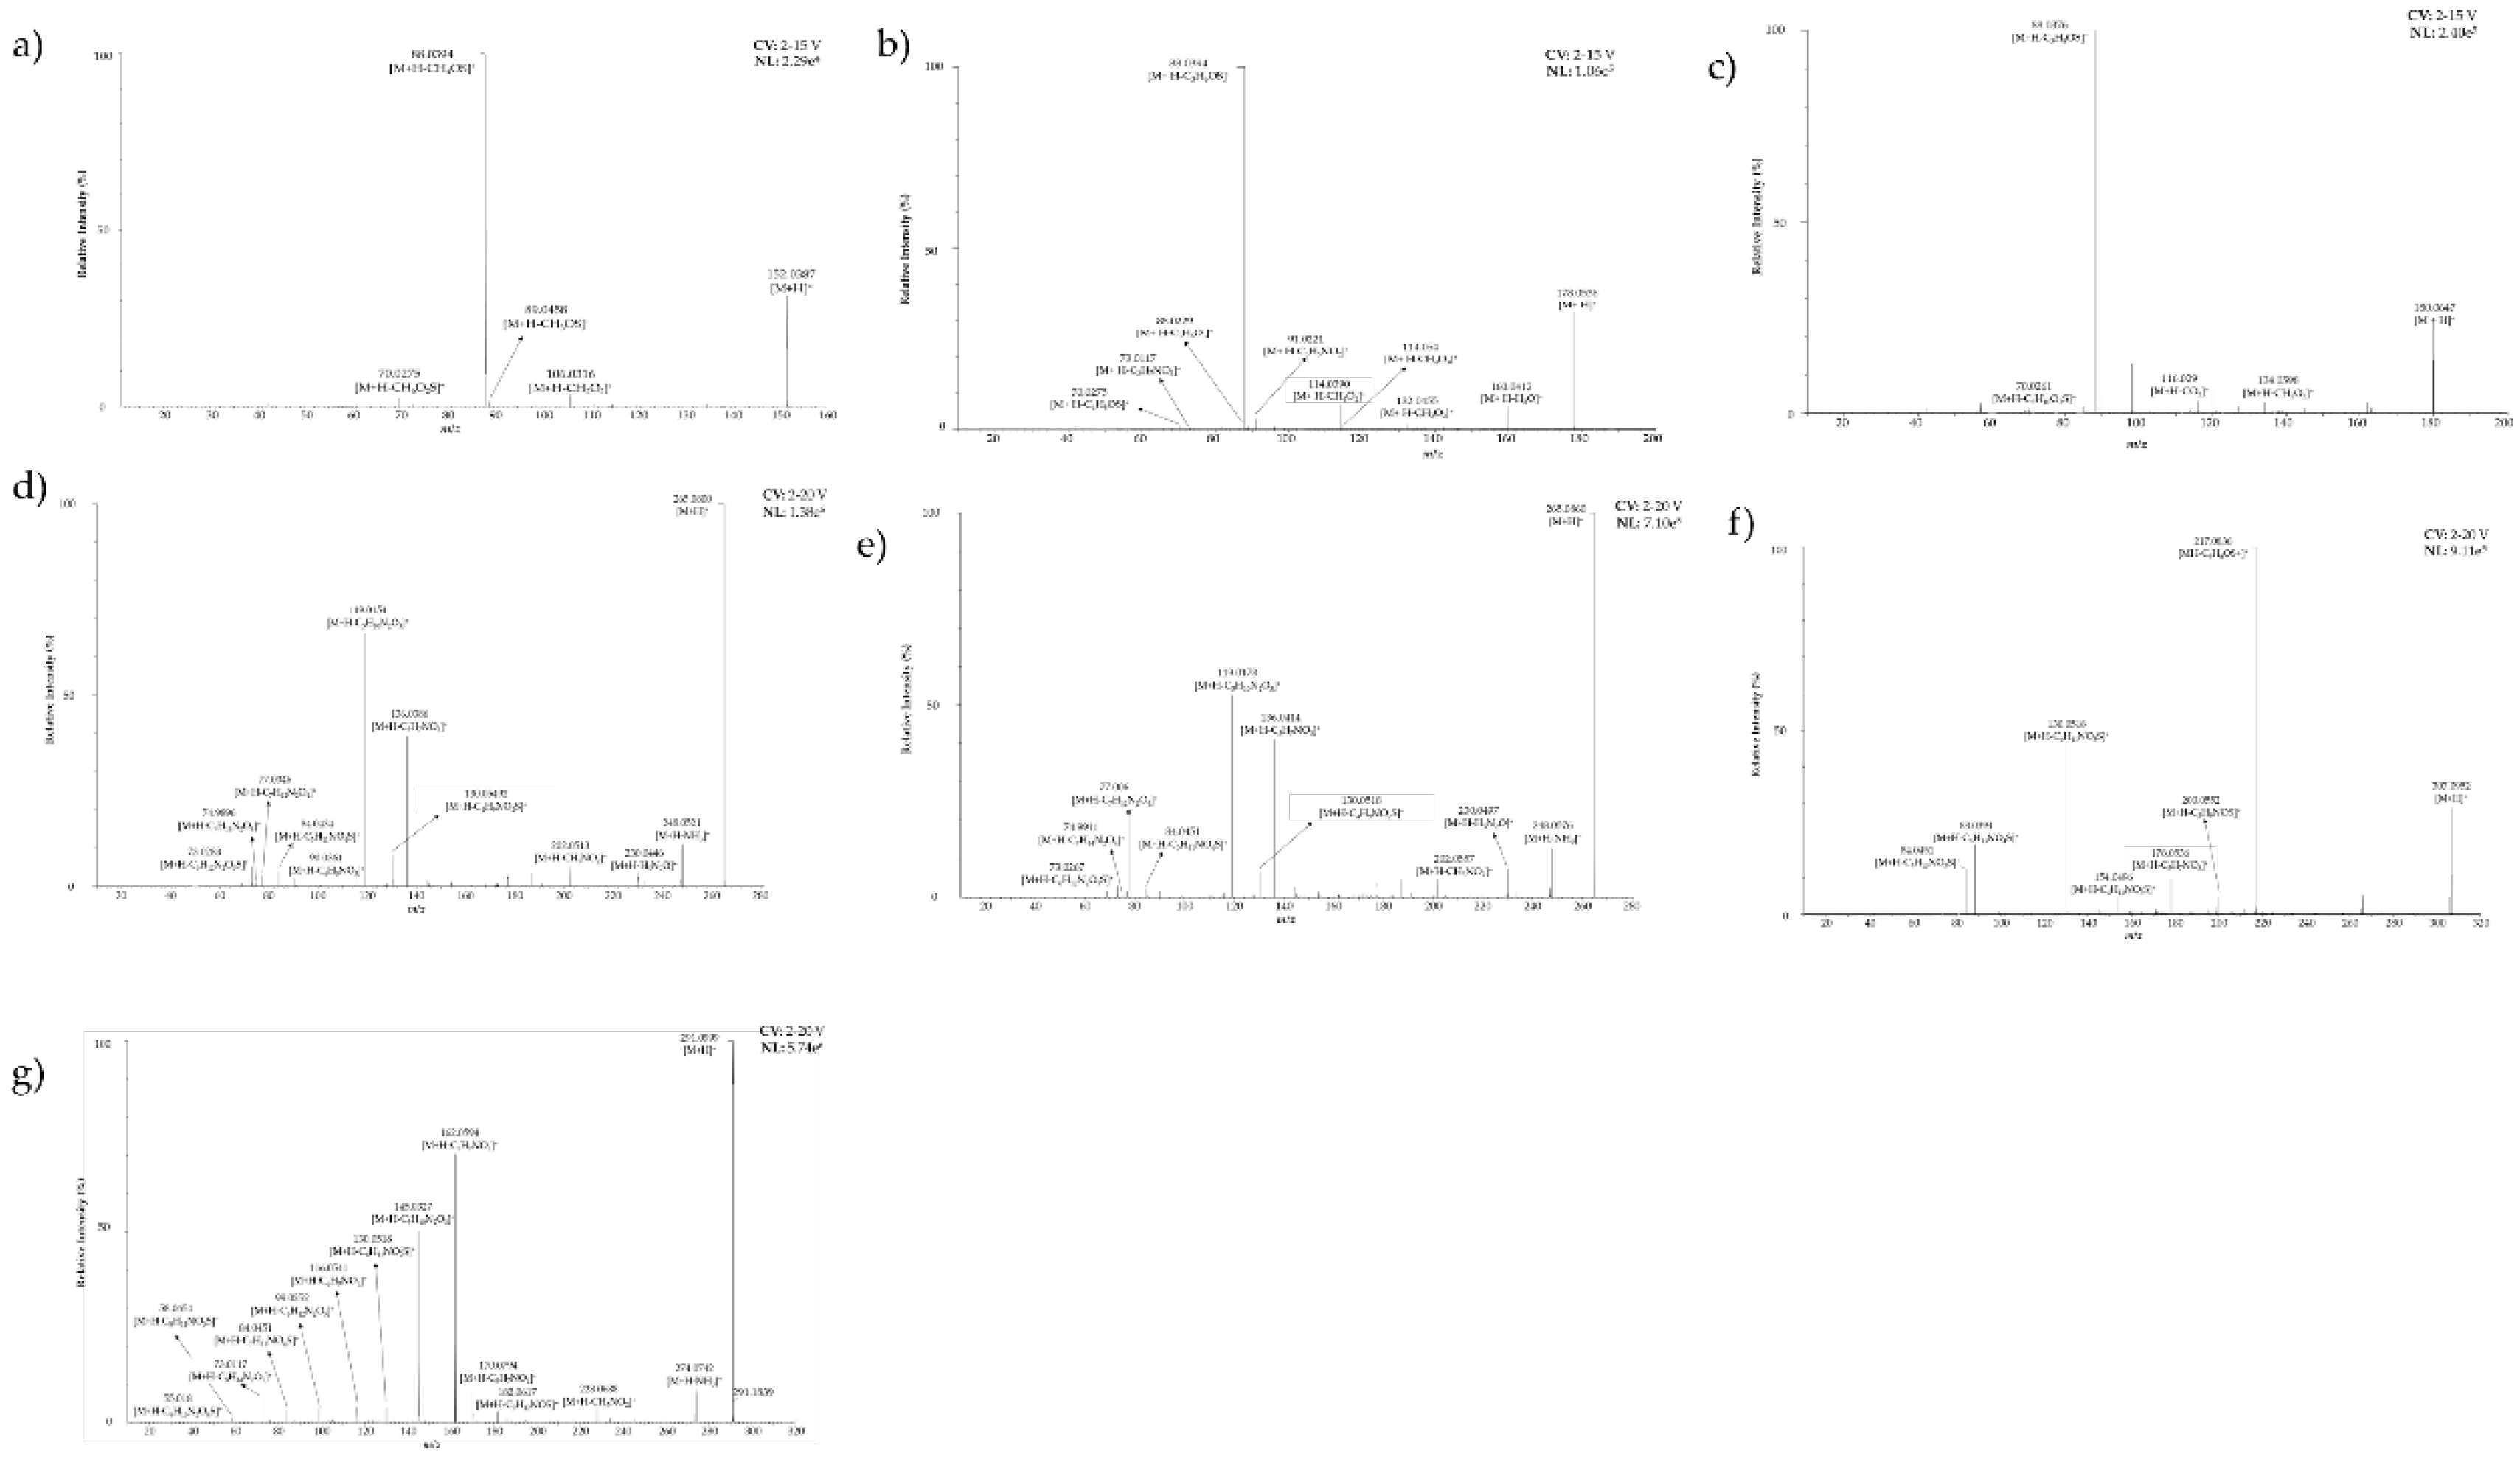
Figure 4.
Variation of the content of each organosulfur compound (quantified as normalized area values) according to the onion variety studied. Compounds quantified by LC-HRMS are shown in blue and compounds identified by DTD-GC-MS are shown in orange.
Figure 4.
Variation of the content of each organosulfur compound (quantified as normalized area values) according to the onion variety studied. Compounds quantified by LC-HRMS are shown in blue and compounds identified by DTD-GC-MS are shown in orange.
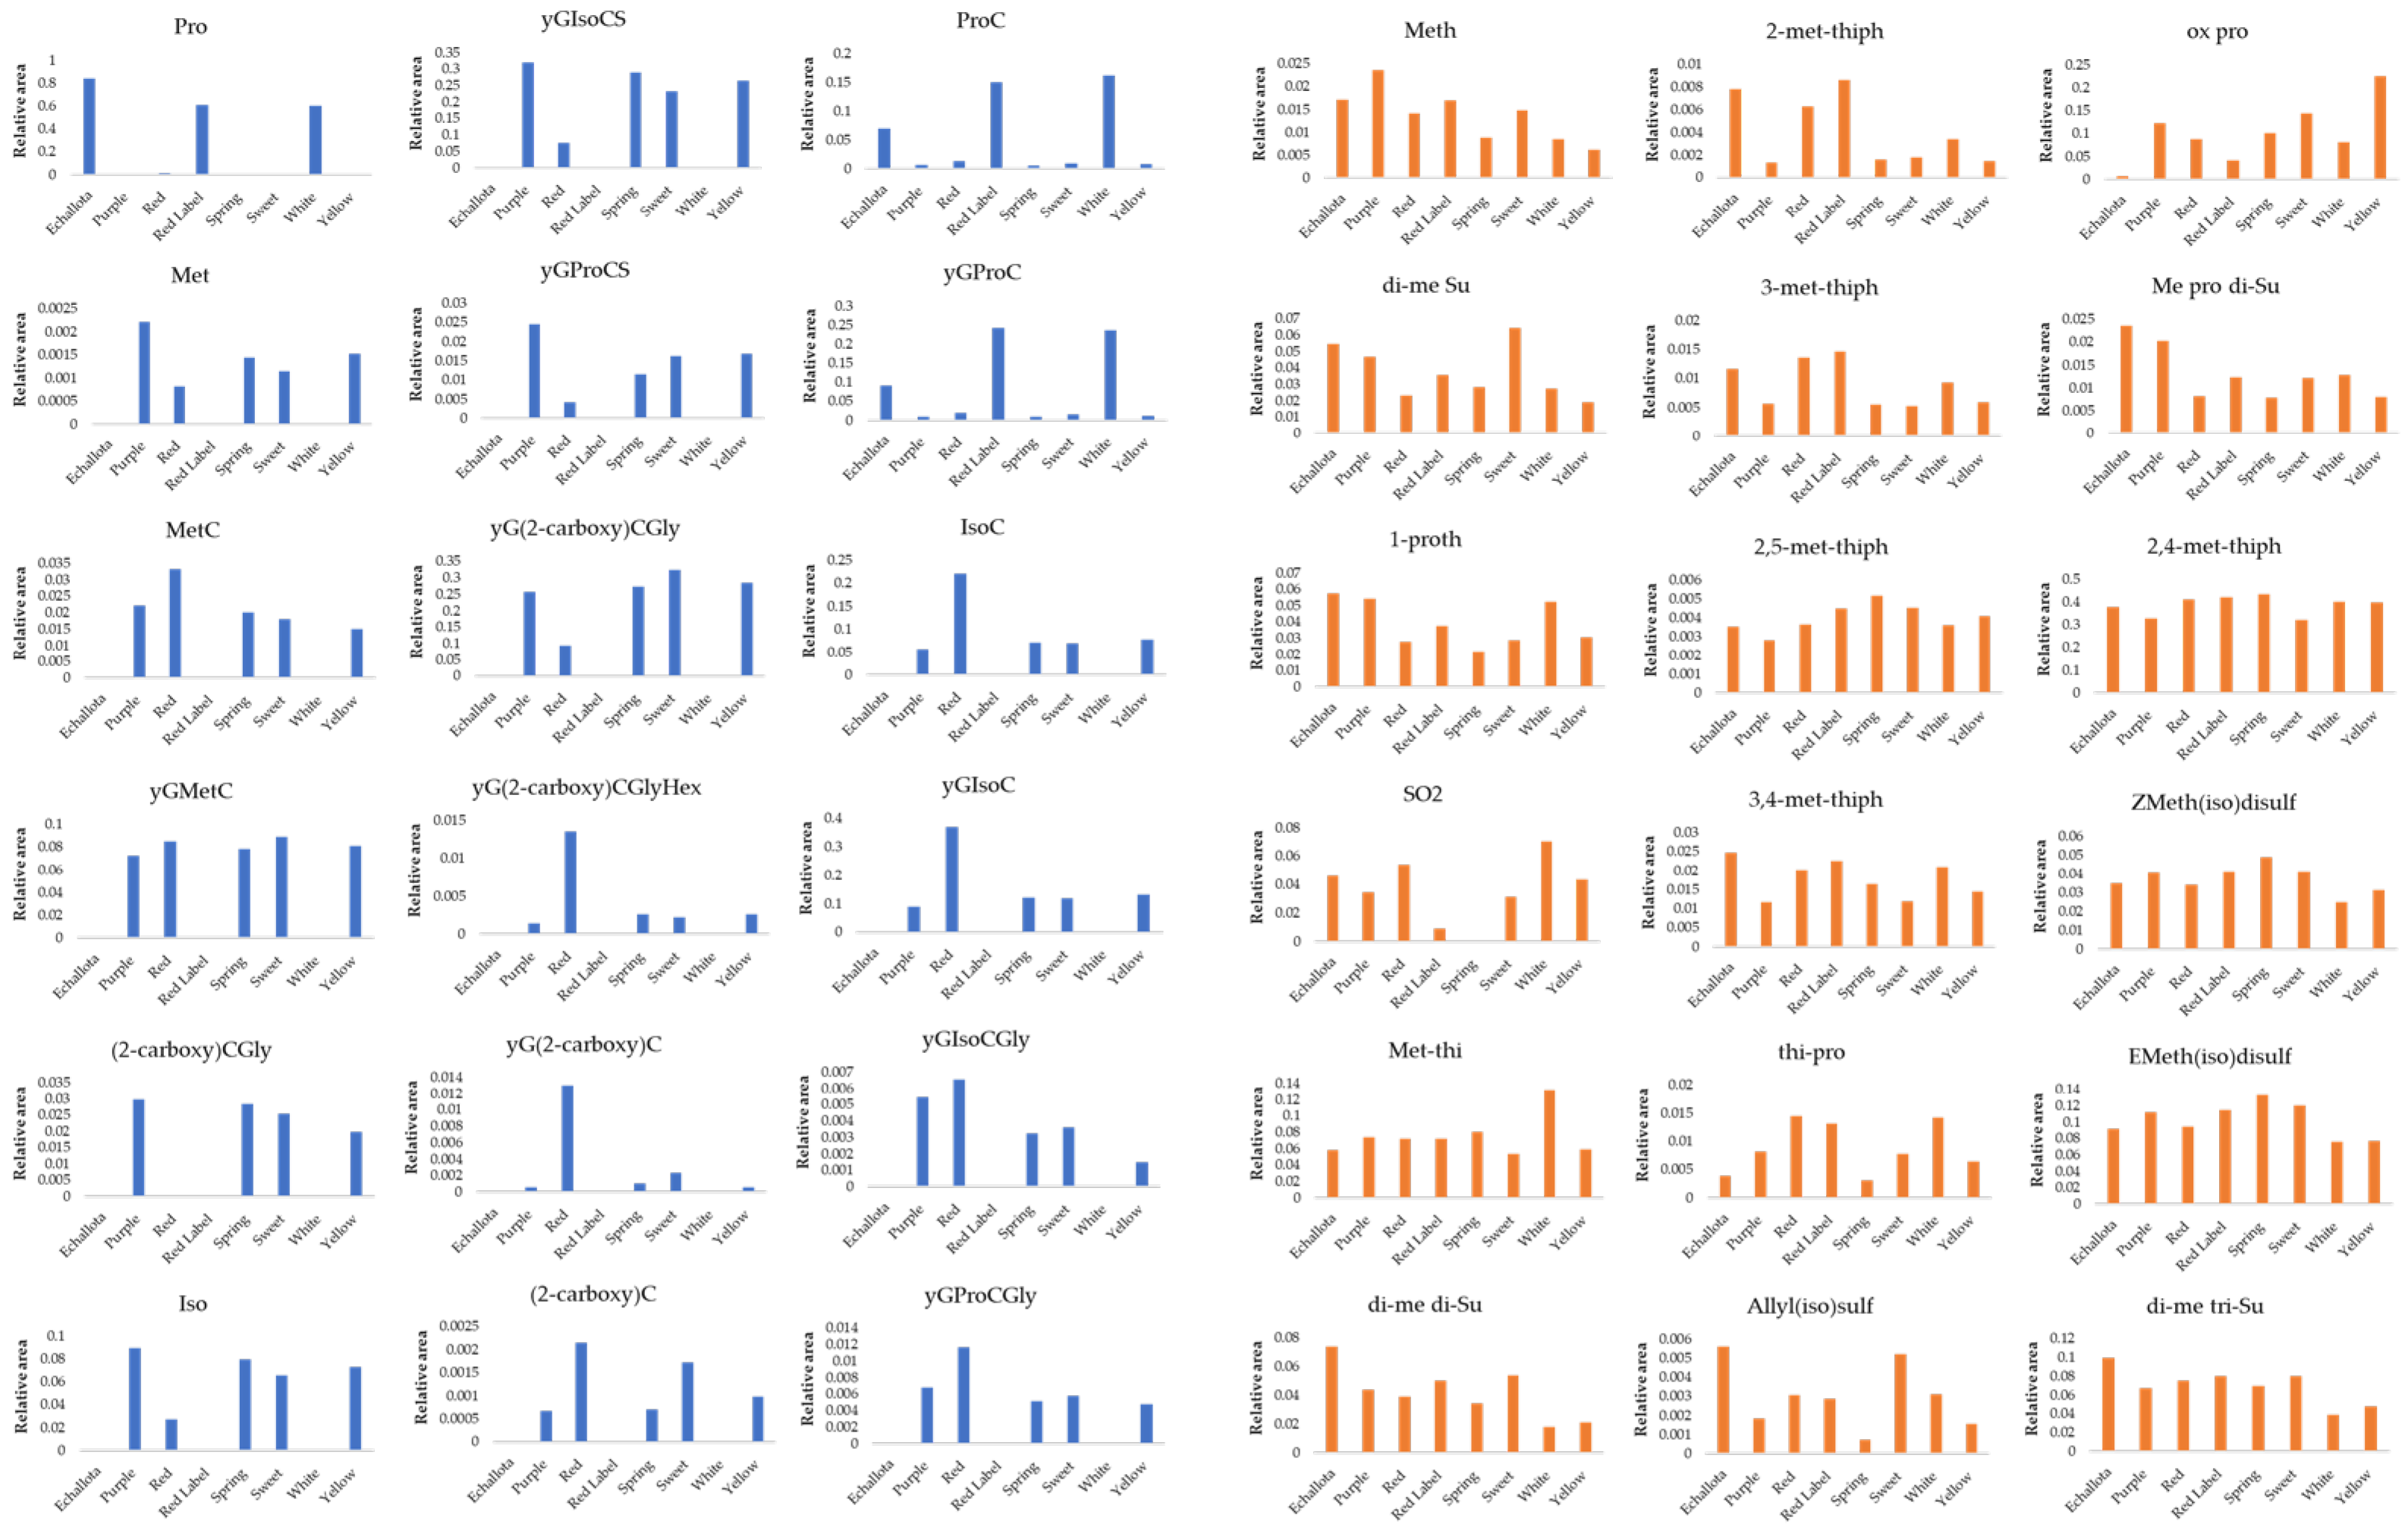
Figure 5.
Pearson Correlation Matrix: Analysis of the relationships between the organosulfur compounds identified by LC- ESI-QqToF.
Figure 5.
Pearson Correlation Matrix: Analysis of the relationships between the organosulfur compounds identified by LC- ESI-QqToF.
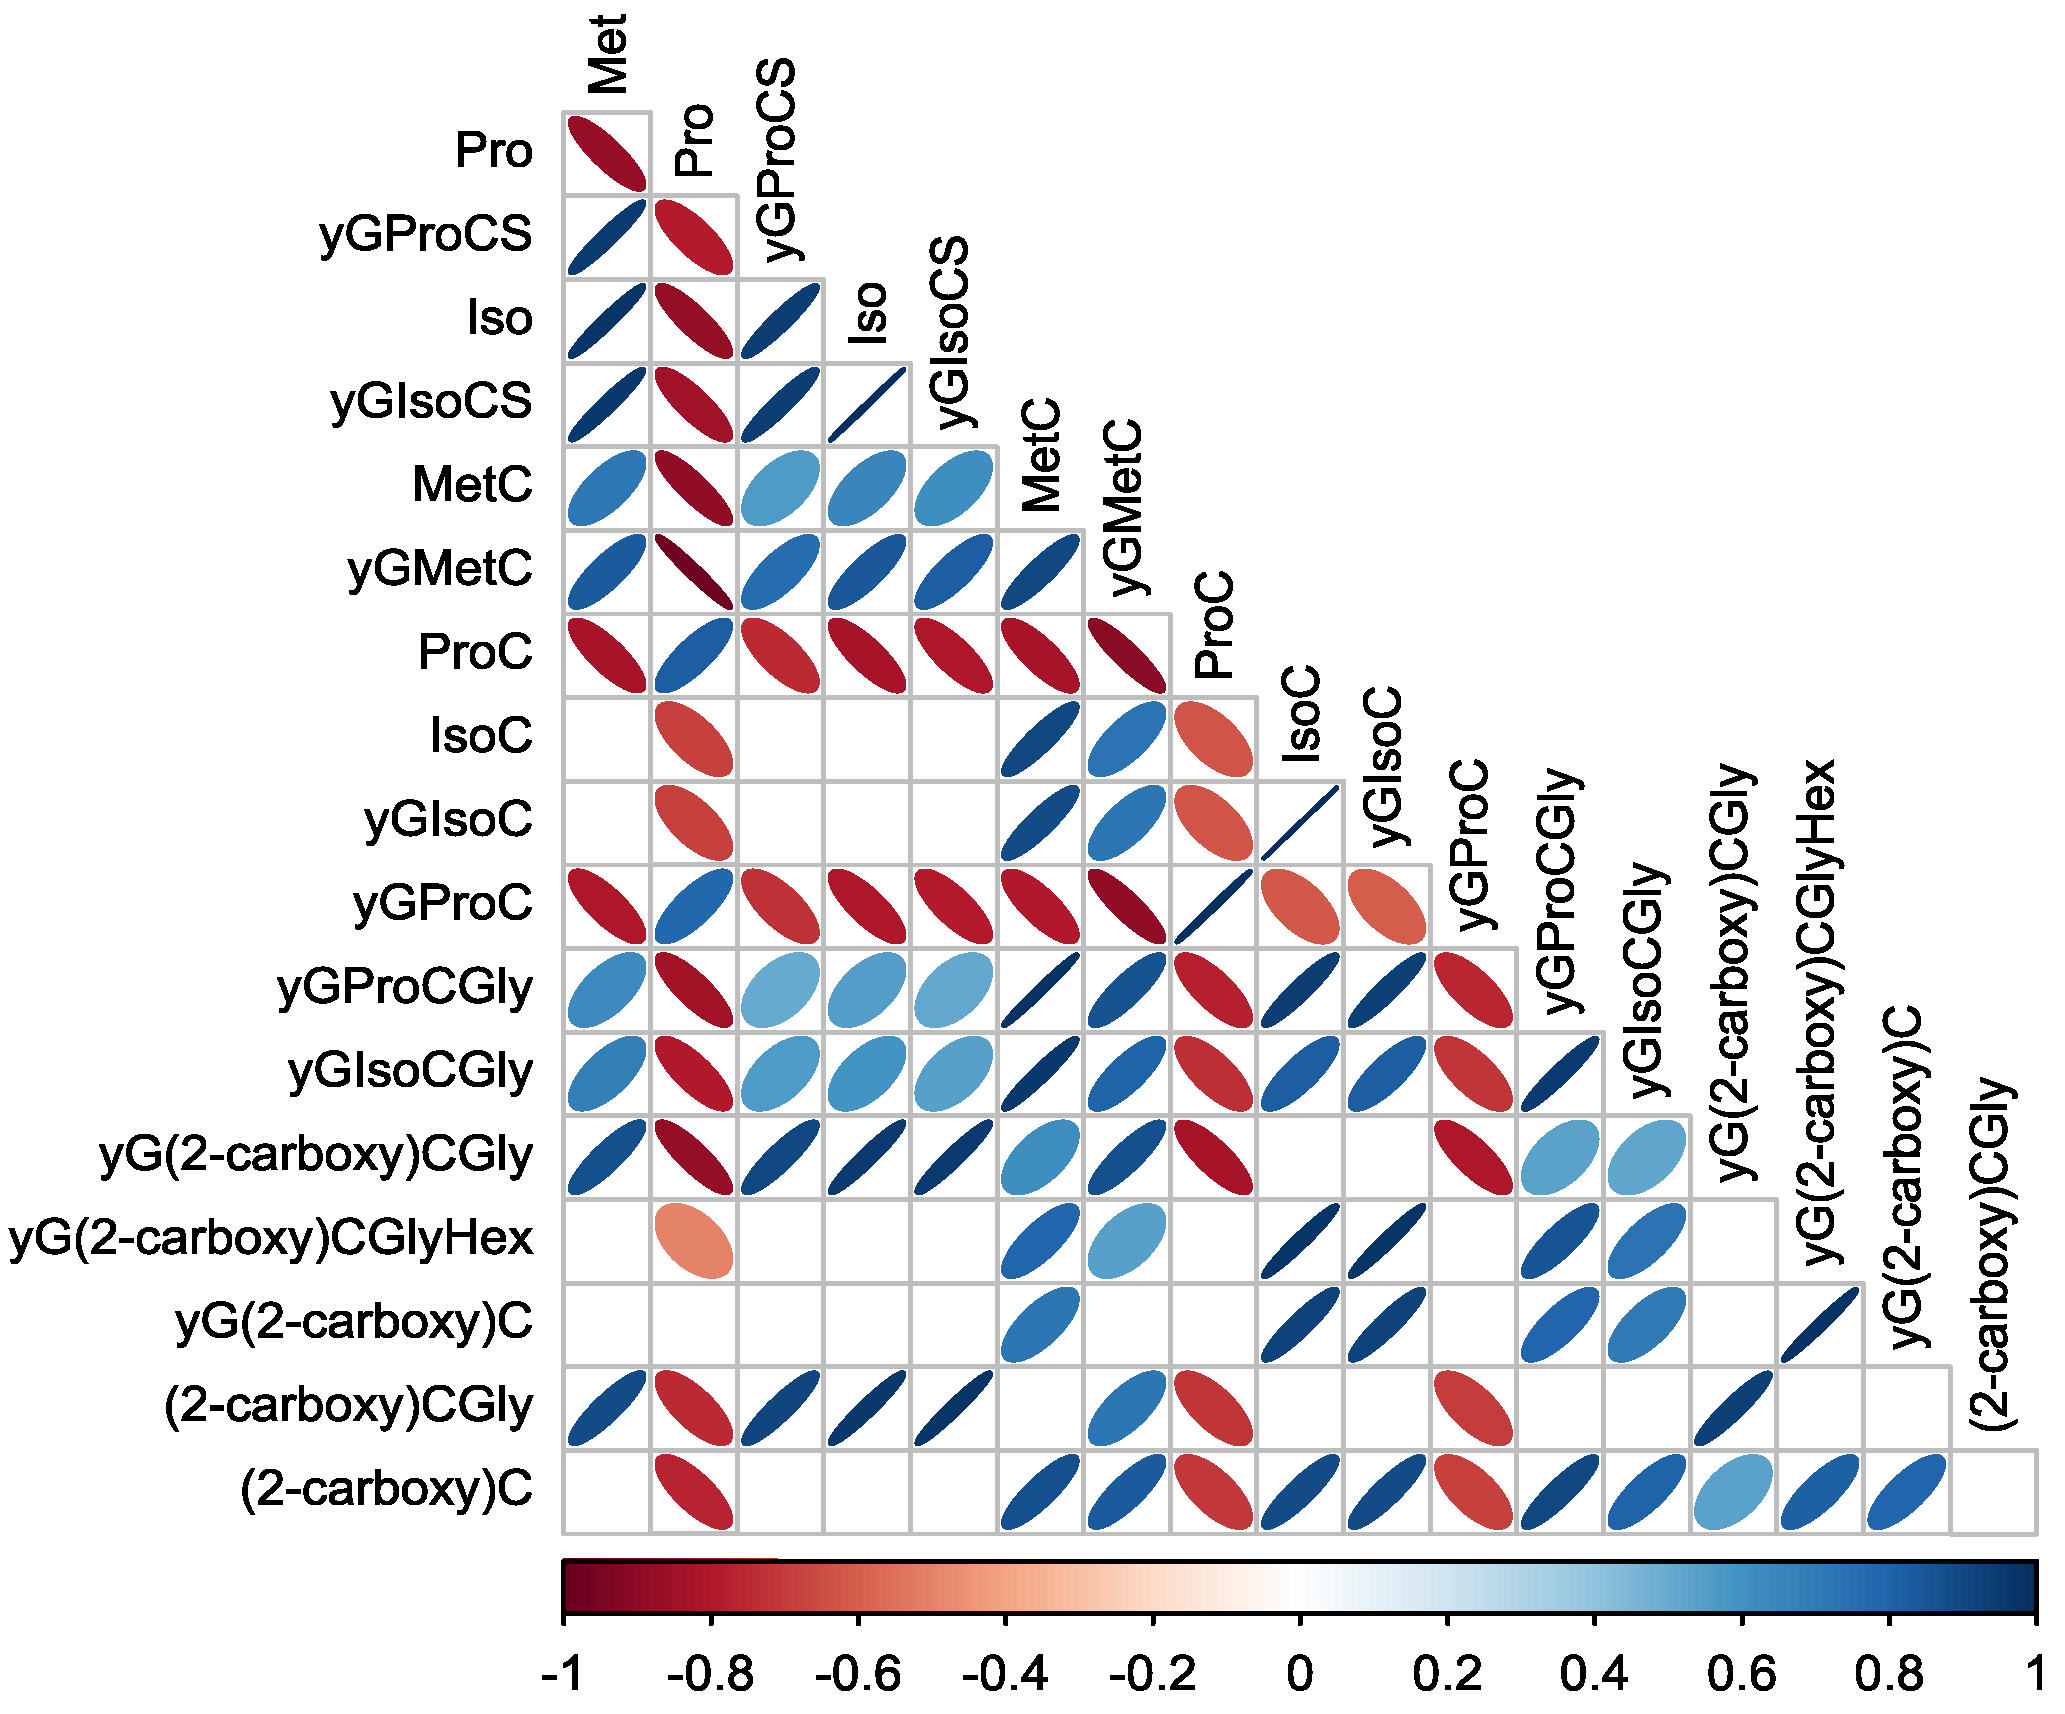
Figure 6.
Pearson Correlation Matrix: Analysis of the relationships between the organosulfur compounds identified by DTD-GC-MS.
Figure 6.
Pearson Correlation Matrix: Analysis of the relationships between the organosulfur compounds identified by DTD-GC-MS.
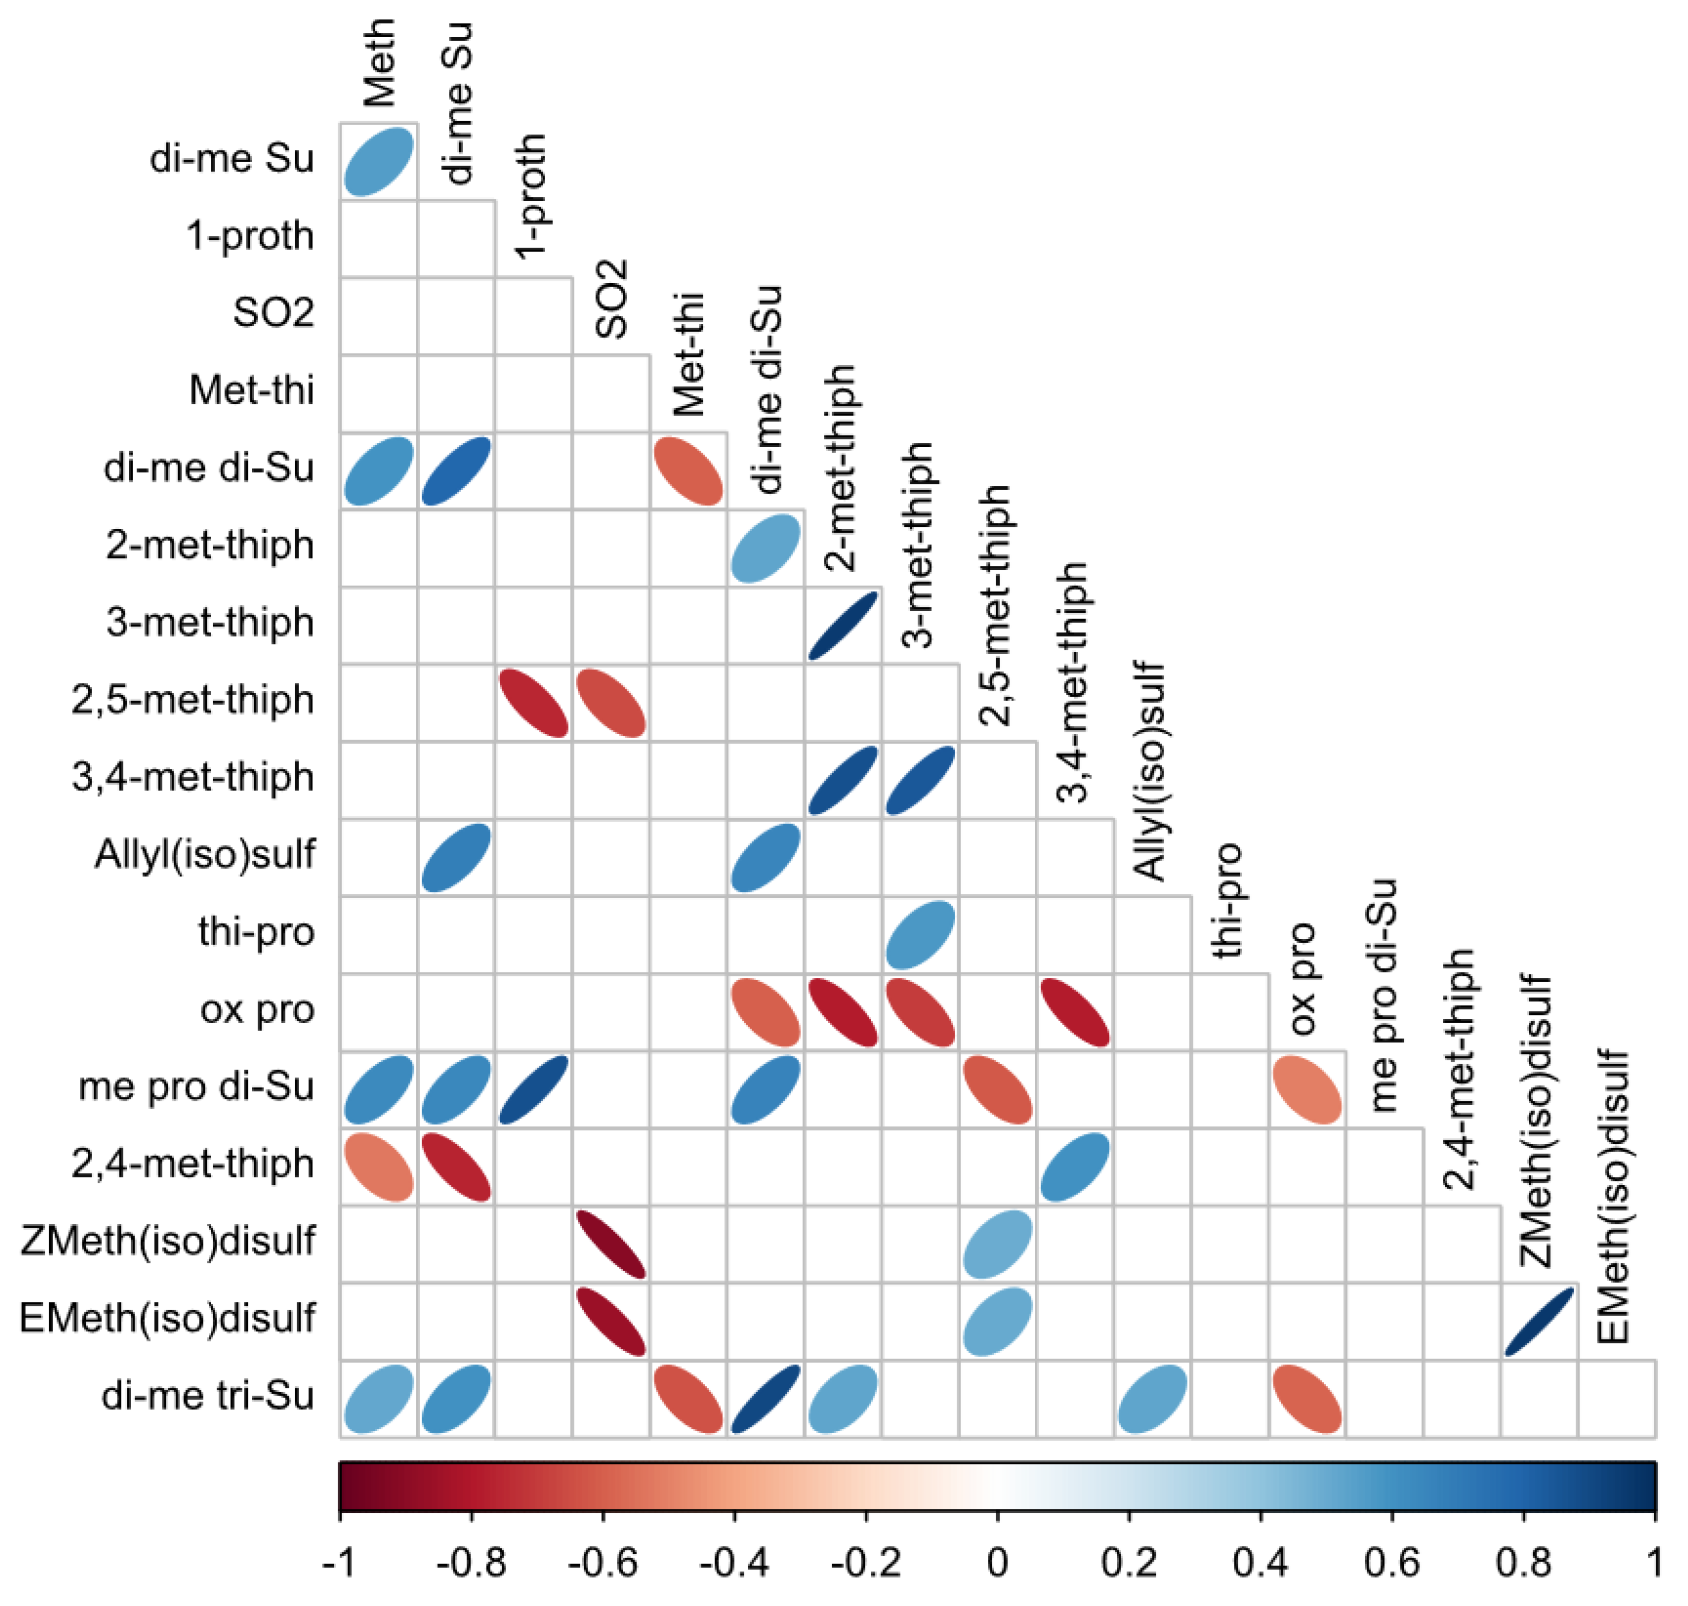
Figure 7.
Pearson Correlation Matrix: Analysis of the relationships between the organosulfur compounds identified with both analytical techniques.
Figure 7.
Pearson Correlation Matrix: Analysis of the relationships between the organosulfur compounds identified with both analytical techniques.
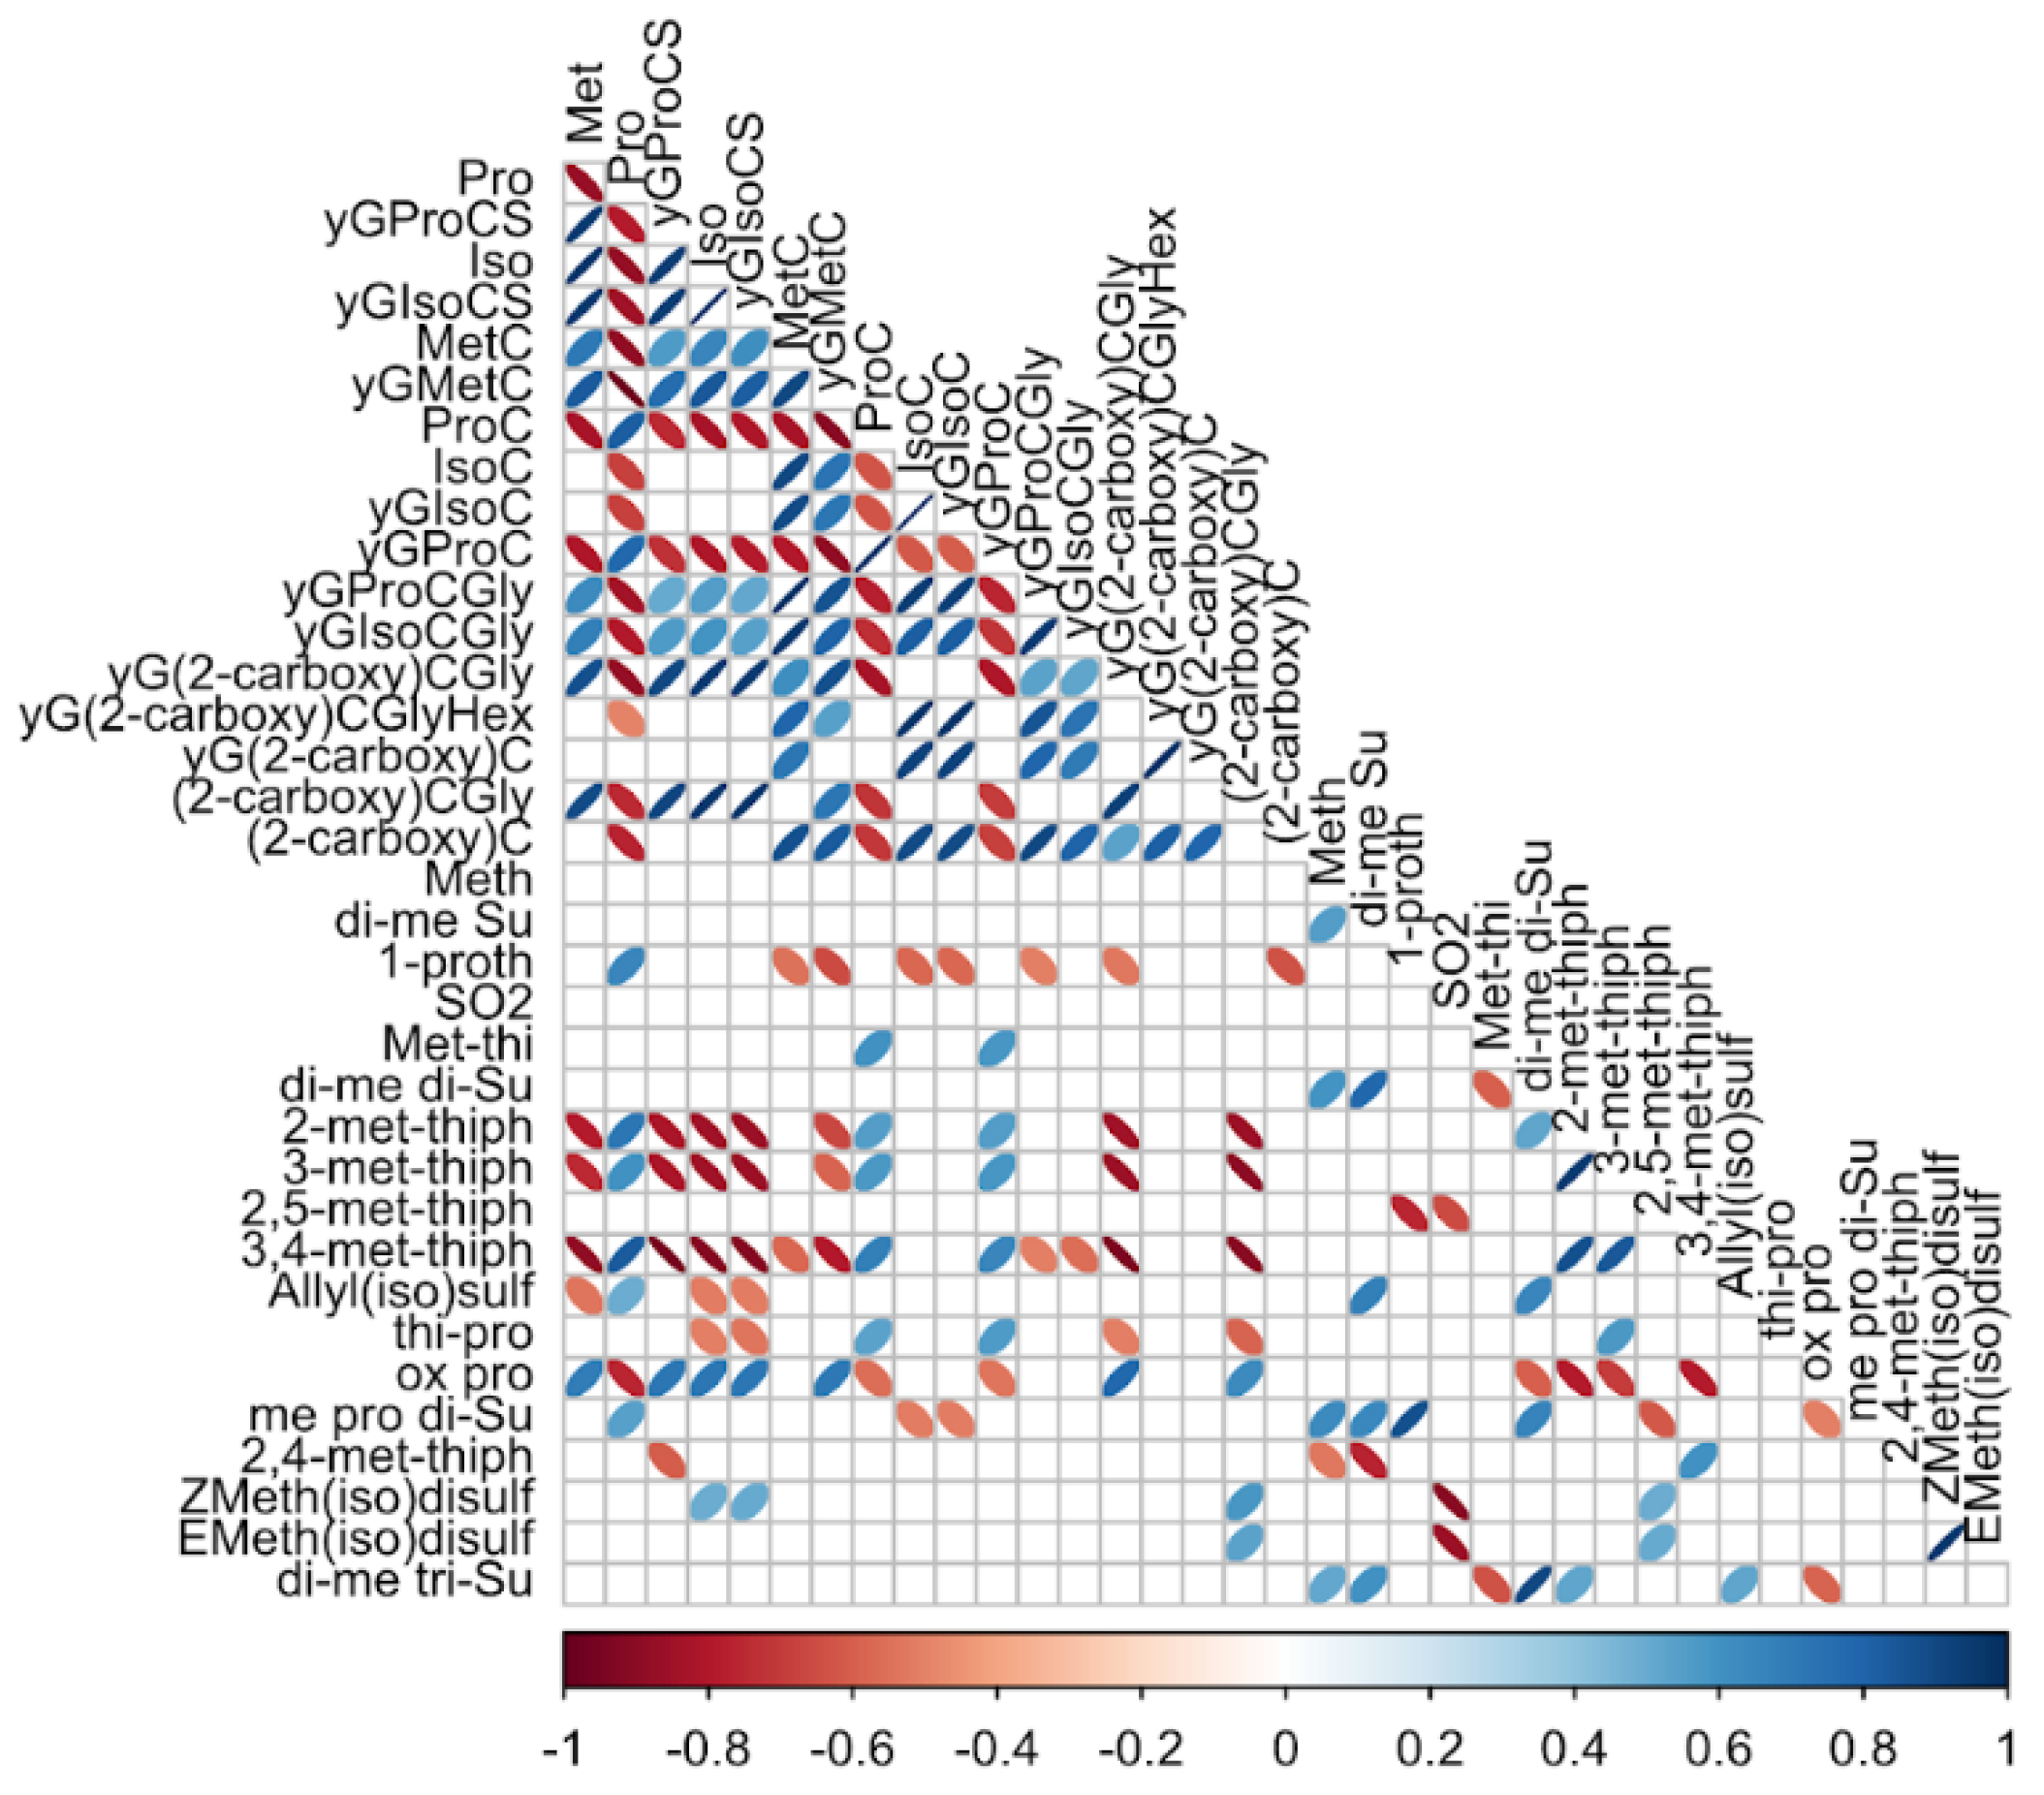
Figure 8.
Score plots depicting the results of principal component analysis (PCA) calculated on the dataset of 18 organosulfur compounds analyzed by: (a) LC-HRMS; (b) GC-MS; and (c) both analytical techniques combined. The ellipse represents the Hotelling T2 with a 95% confidence interval.
Figure 8.
Score plots depicting the results of principal component analysis (PCA) calculated on the dataset of 18 organosulfur compounds analyzed by: (a) LC-HRMS; (b) GC-MS; and (c) both analytical techniques combined. The ellipse represents the Hotelling T2 with a 95% confidence interval.
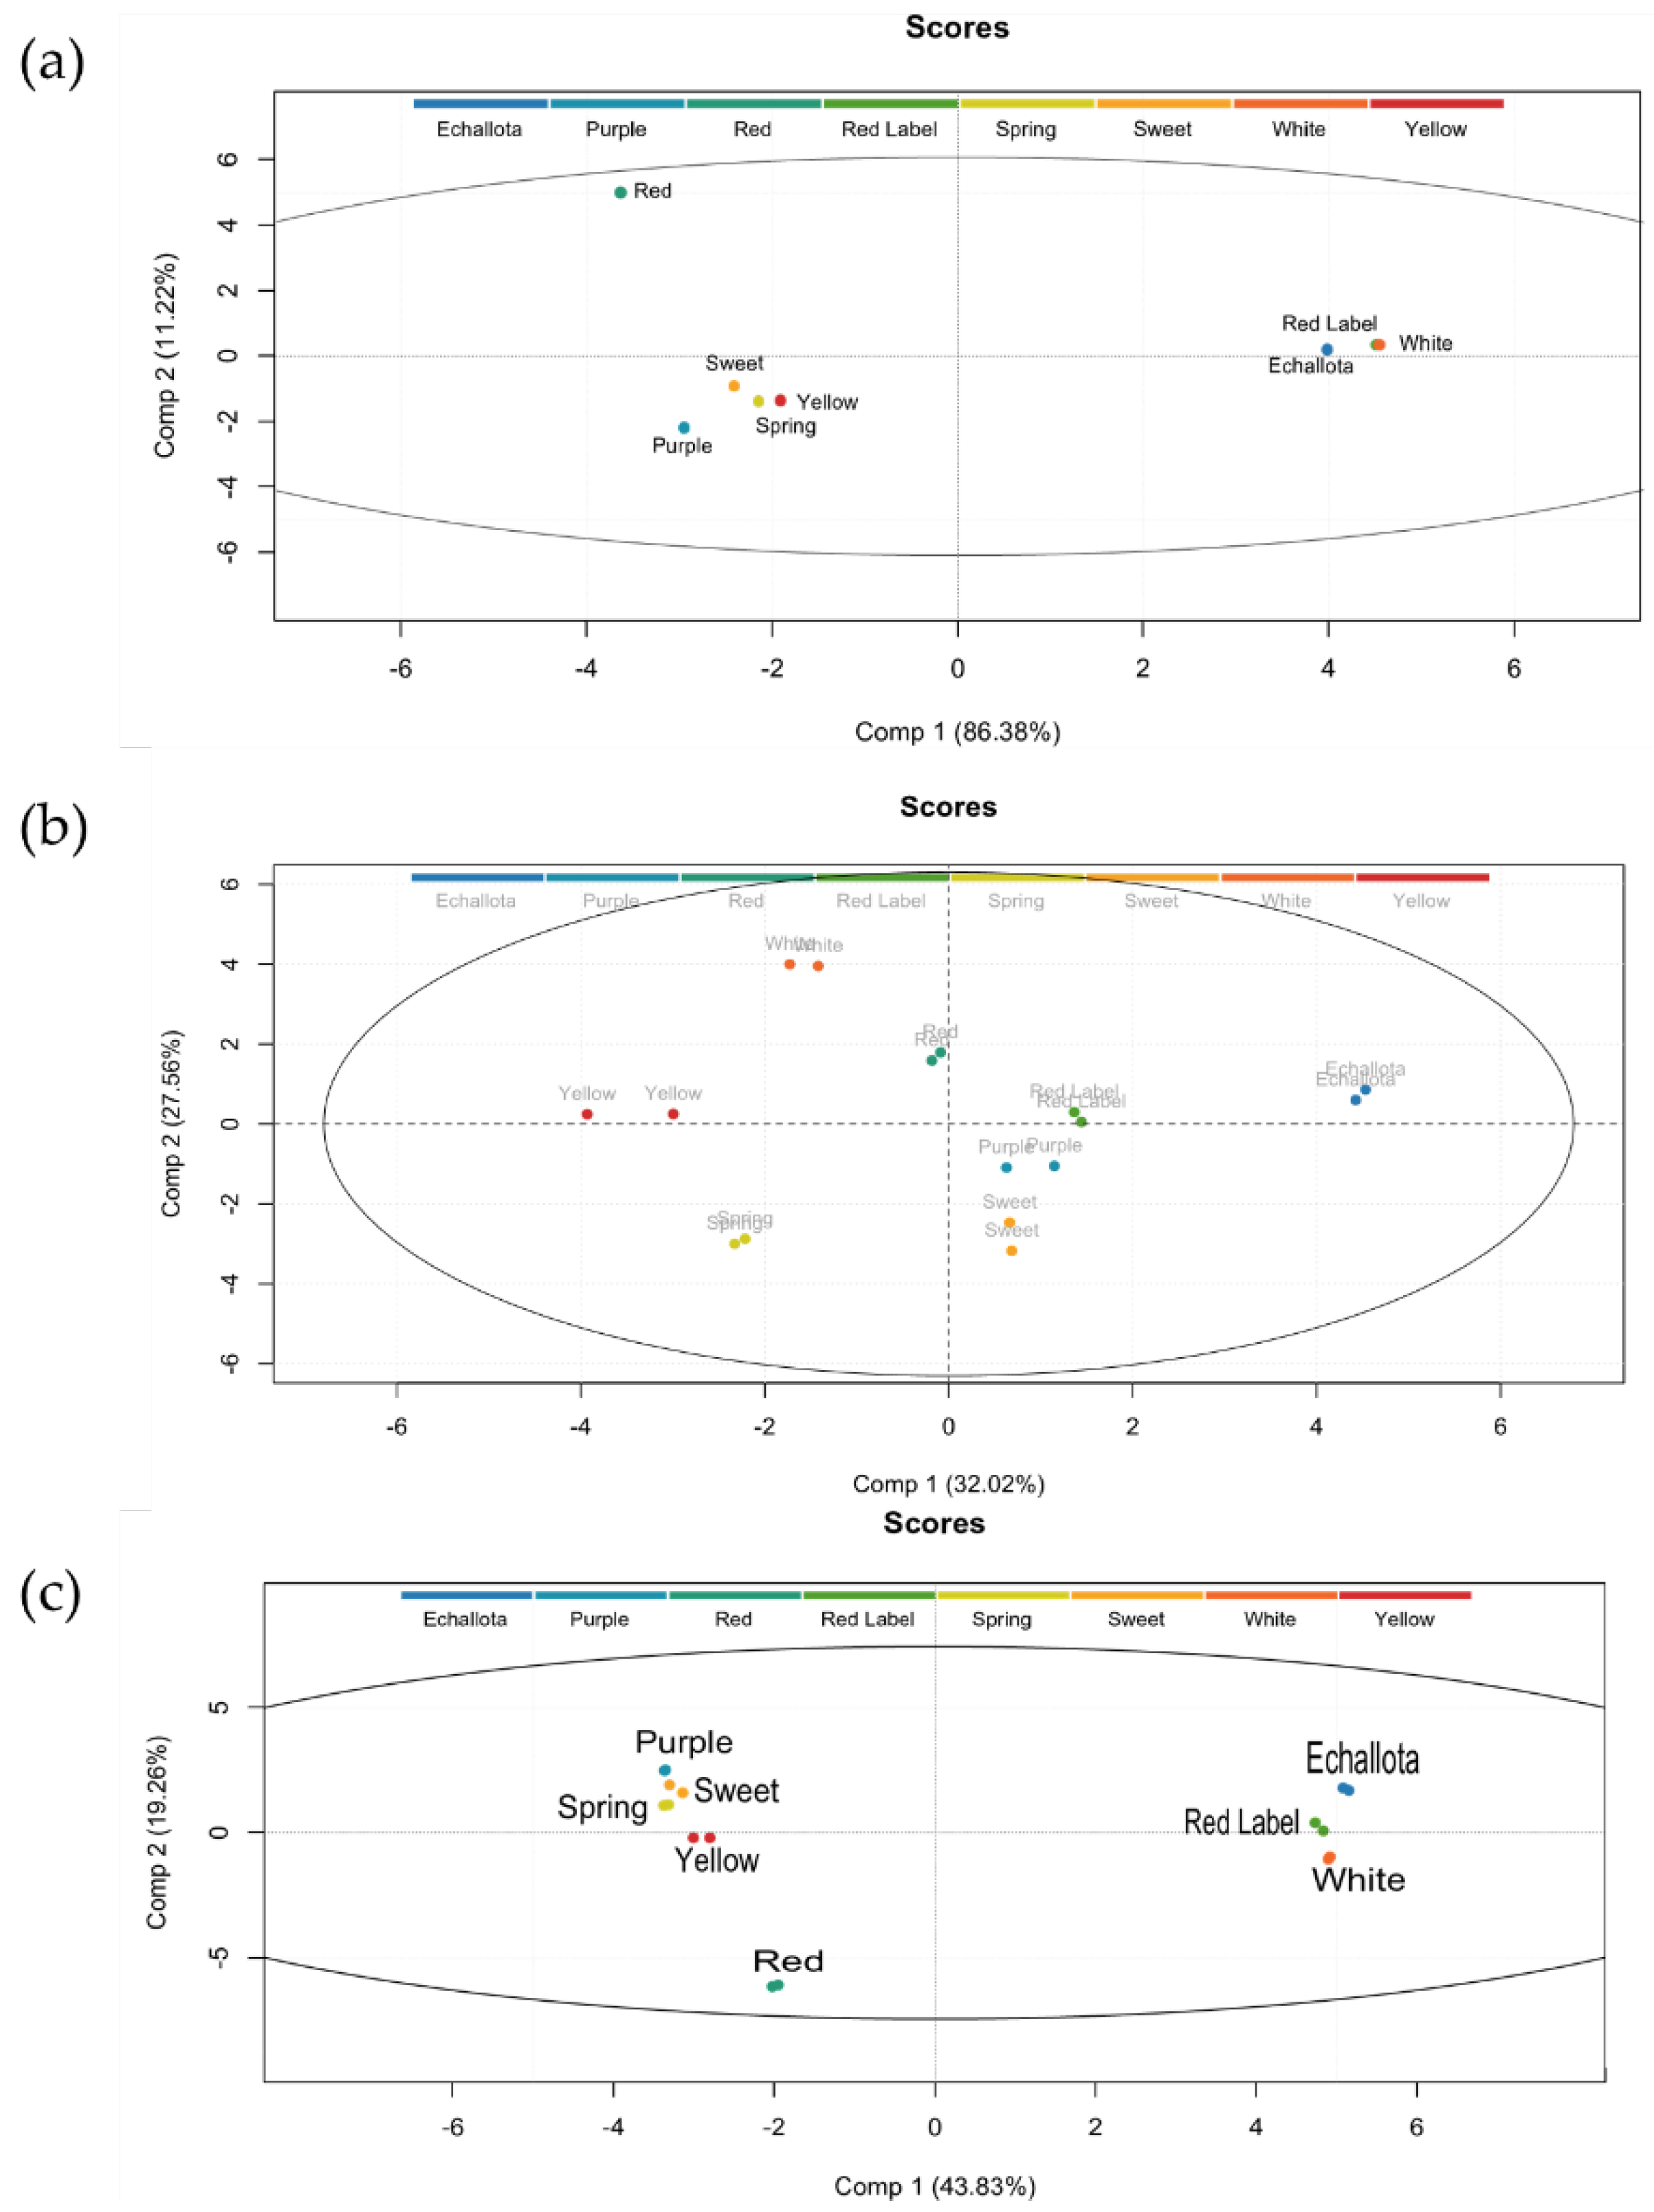
Figure 9.
PCA biplots of 18 organosulfur compounds analyzed by: (a) LC-HRMS; and (b) GC-MS.
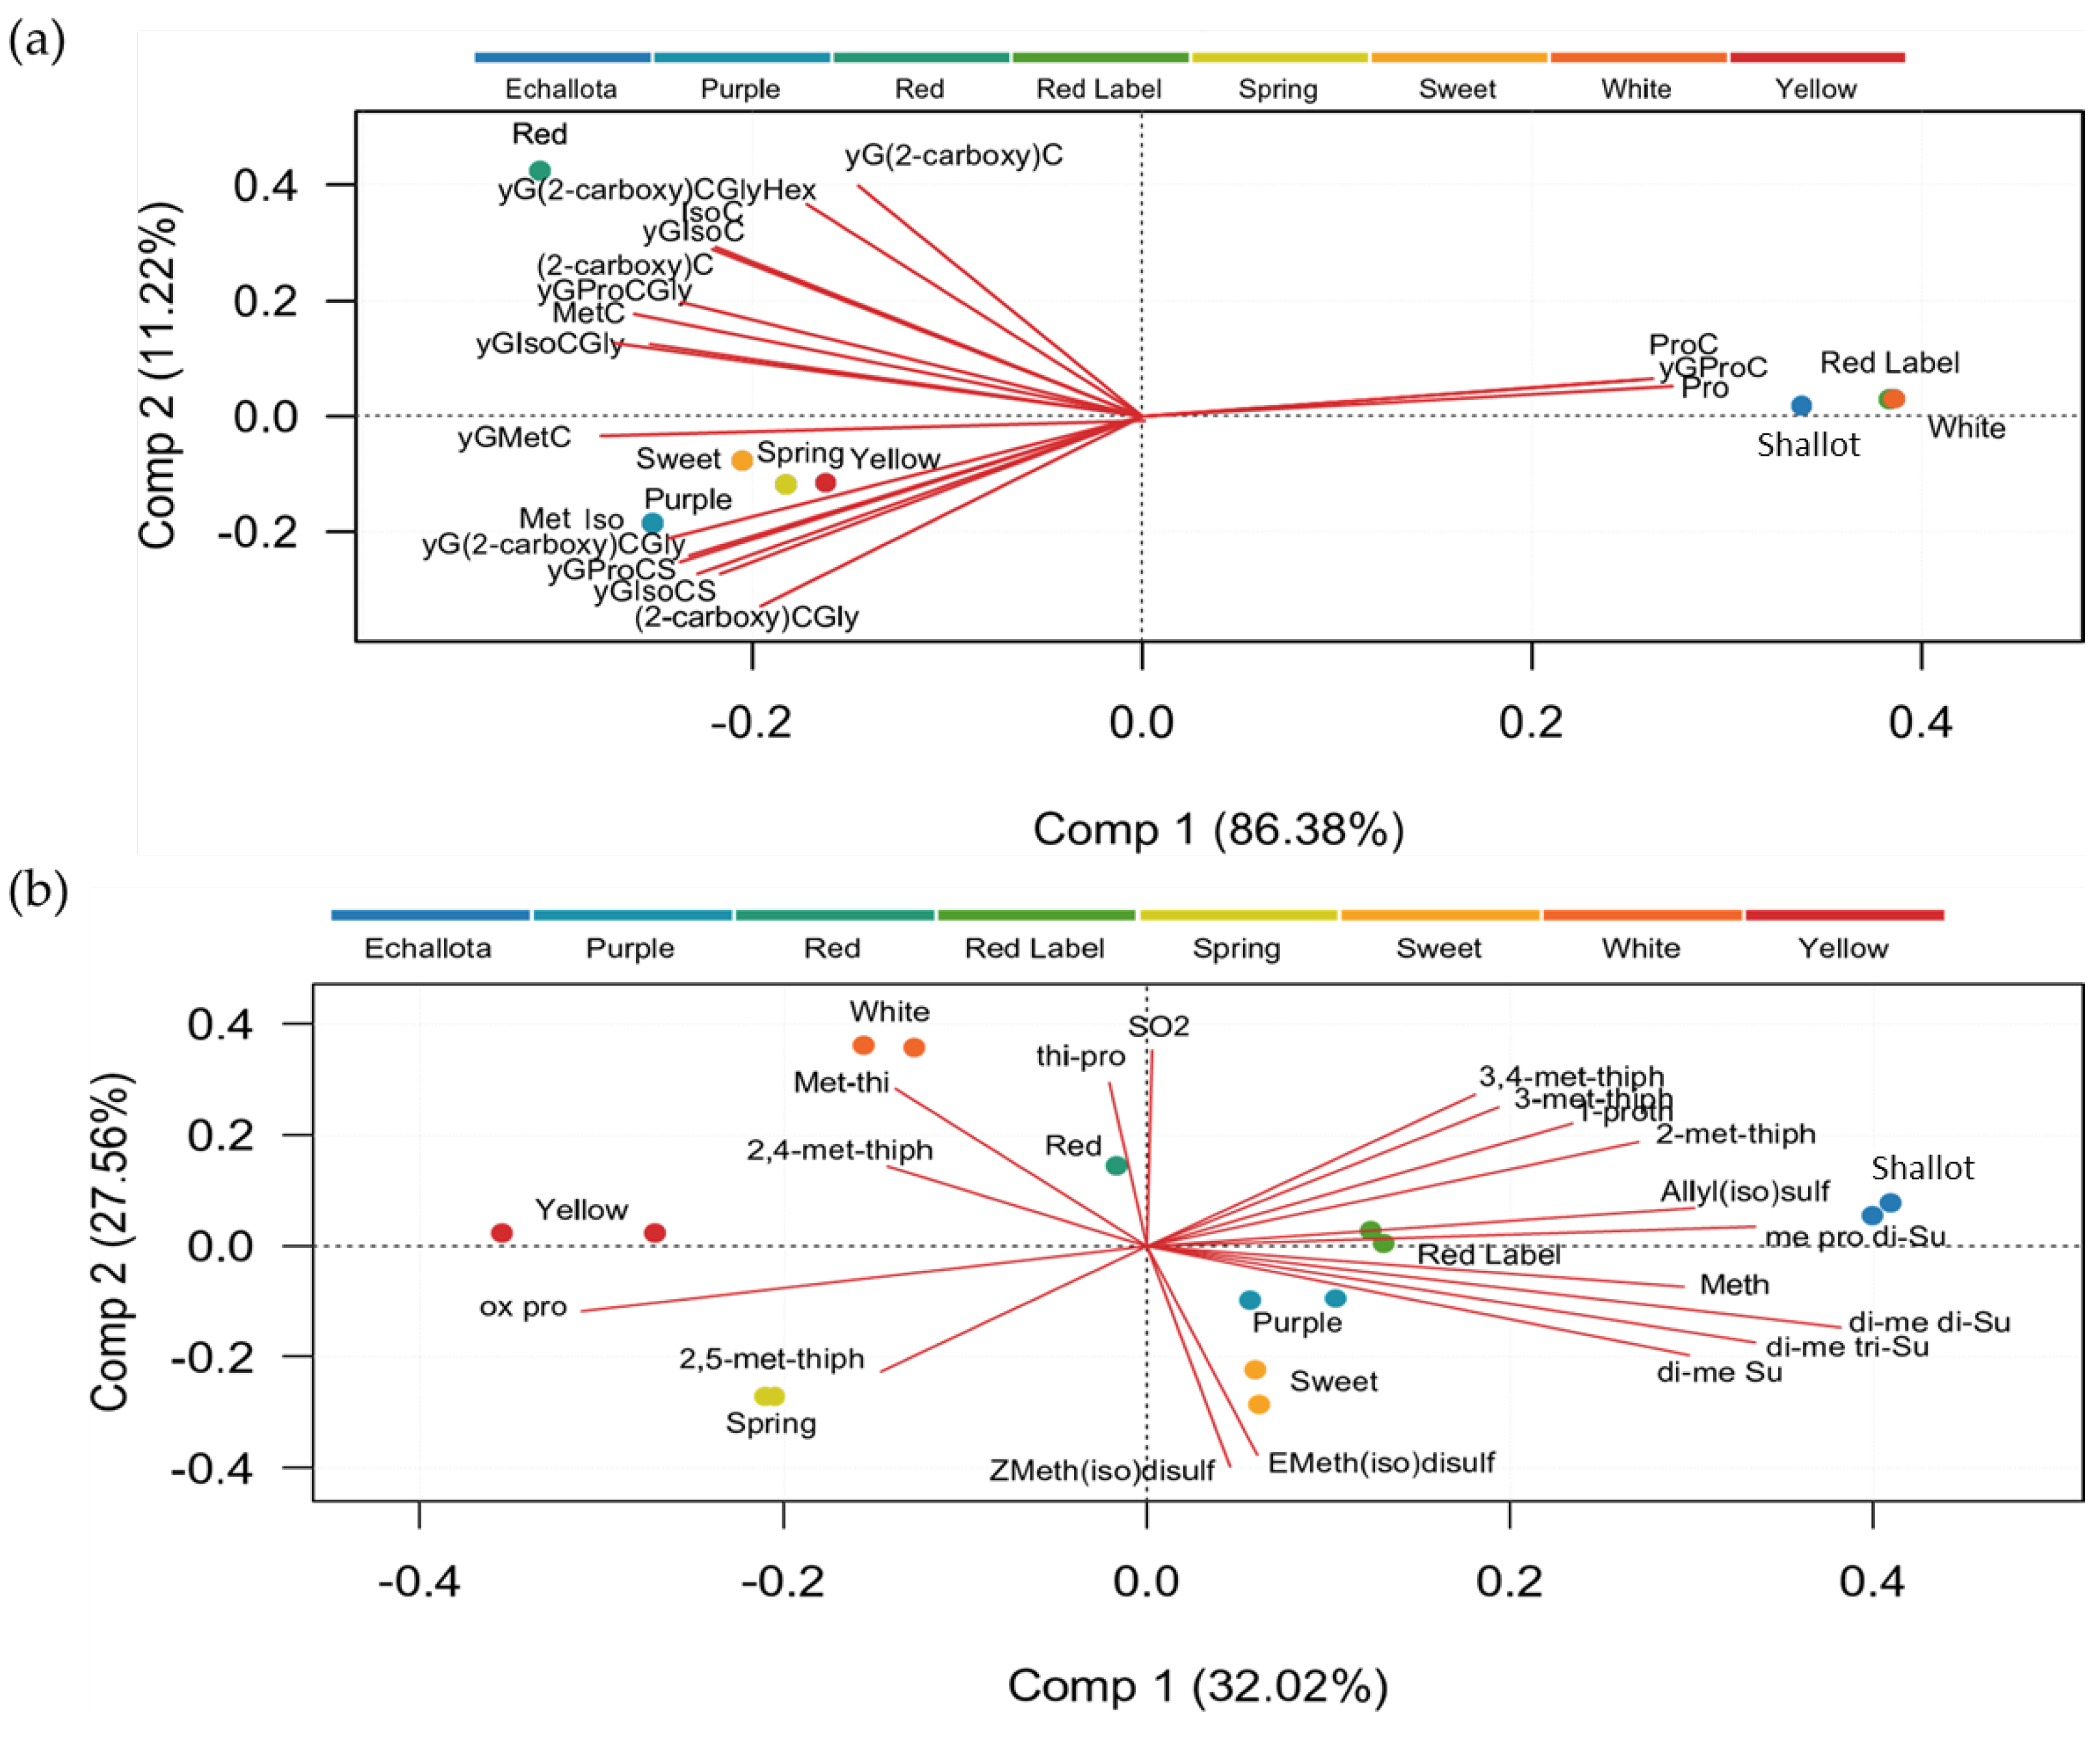

Table 2.
LC ESI-QqToF based identification of organosulfur compounds on purple onion variety.
| N° | Retention time (min) | Compounds | Abbreviation | Ion formulae | Measured m/z | Calculated m/z | Absolute error δ (ppm) | Product ions formula (Relative intensity [%], elemental composition) |
|---|---|---|---|---|---|---|---|---|
| 1 | 2.908 | Propiin | Pro | C6H14NO3S | 180.0705 | 180.0694 | 6.1088 | 70.0261 (1, C3H4NO+), 88.0376 (100, C3H6NO2+), 116.0290 (3, C5H8OS+), 134.0598 (3, C5H12NOS+), 180.0647 (23, C6H14NO3S+) |
| 2 | 3.145 | Methiin | Met | C4H10NO3S | 152.0385 | 152.0381 | 2.6309 | 70.0275 (2, C3H4NO+), 88.0392 (100, C3H6NO2+), 89.0458 (3, C3H7NO2+.), 106.0316 (8, C3H8NOS+), 152.0369 (47, C4H10NO3S+) |
| 3 | 3.331 | S-Methyl cysteine | MetC | C4H10NO2S | 136.0438 | 136.0432 | 4.4104 | No MSMS data available |
| 4 | 3.331 | y-glutamyl-S-methyl-L-cysteine | yGMetC | C9H17N2O5S | 265.0866 | 265.0858 | 3.0179 | 73.0276 (3, C3H5O2+), 74.9911 (1, C2H3OS+), 77.0062 (1, C2H5OS +), 84.0451 (2, C2H6NO+), 90.0379 (2, C3H8NS+), 119.0178 (53, C4H7O2S+), 130.0518 (7, C5H8NO3S+), 136.0414 (41, C4H10NO2S+), 202.0557 (5, C8H12NO3S+), 230.0497 (7, C9H12NO4S+), 248.0576 (13, C9H14NO5S+), 265.0860 (100, C9H17N2O5S+) |
| 5 | 3.348 | Isoaliin | Iso | C6H12NO3S | 178.0542 | 178.0538 | 2.2465 | 70.0275 (1, C3H4NO+), 73.0117 (1, C3H5S+), 88.0229 (3, C3H6NS+), 88.0394 (100, C3H6NO2+), 91.0221 (4, C3H7O+), 105.0016 (3, C3H5O2S+), 114.039 (8, C5H8NO2+), 118.0678 (6, C5H12NS+), 123.0119 (4, C3H7O3S+), 132.0455 (2, C5H10NOS+), 146.0599 (7, C6H12NOS+), 160.0412 (5, C6H10NO2S+), 178.0536 (30, C6H12NO3S+) |
| 6 | 3.348 | γ-Glutamyl-S-(1-propenyl) cysteine sulfoxide | yGIsoCS | C11H19N2O6S | 307.0981 | 307.0964 | 5.5357 | 84.0451 (12, C4H6NO+), 88.0394 (19, C3H6NO2+), 130.0518 (46, C5H8NO3+), 154.0496 (5, C7H8NO3+), 178.0536 (10, C6H12NO3S+), 200.0552 (5, C8H10NO5+), 217.0836 (100, C8H13N2O5+), 307.0952 (29, C11H19N2O6S+) |
| 7 | 3.449 | S-(2-carboxypropil) cysteine-glycine | (2-carboxy)CGly | C9H17N2O5S | 265.0866 | 265.0858 | 3.0179 | 73.0283 (5, C3H5O2+), 74.9896 (1, C2H3OS+), 77.0046 (3, C2H5OS+), 84.0434 (4, C2H6NO+), 90.0361 (2, C3H8NS+), 119.0154 (66, C4H7O2S+), 130.0492 (8, C5H8NO3S+), 136.0386 (39, C4H10NO2S+), 202.0513 (5, C8H12NO3S+), 230.0446 (4, C9H12NO4S+), 248.0521 (11, C9H14NO5S+), 265.0800 (100, C9H17N2O5S+) |
| 8 | 3.398 | γ-Glutamyl-S-propyl cysteine sulfoxide | yGProCS | C11H21N2O6S | 309.1130 | 309.1120 | 3.2351 | No MSMS data available |
| 9 | 3.449 | γ–Glutamyl-S-(2-carboxy propyl) cysteine glycine | yG(2-carboxy)CGly | C14H24N3O8S | 394.1303 | 394.1284 | 4.8208 | No MSMS data available |
| 10 | 3.534 | γ–Glutamyl-S-(2-carboxypropyl) cysteine glycine hexoside | yG(2-carboxy)CGlyHex | C20H34N3O13S | 556.1827 | 556.1812 | 2.6970 | No MSMS data available |
| 11 | 3.567 | γ–Glutamyl-S-(2-carboxypropyl) cysteine | yG(2-carboxy)C | C12H21N2O7S | 337.1080 | 337.1069 | 1.7799 | No MSMS data available |
| 12 | 3.584 | S-(2-carboxypropyl) cysteine | (2-carboxy)C | C7H14NO4S | 208.0648 | 208.0643 | 2.4031 | No MSMS data available |
| 13 | 4.075 | S-Propylcysteine | ProC | C6H14NO2S | 164.0752 | 164.0745 | 4.2664 | No MSMS data available |
| 14 | 4.091 | γ-Glutamyl-S-propyl cysteine | yGProC | C11H21N2O5S | 293.1176 | 293.1171 | 1.7058 | No MSMS data available |
| 15 | 4.818 | S-(1-Propenyl) cysteine | IsoC | C6H12NO2S | 162.0590 | 162.0589 | 0.6171 | No MSMS data available |
| 16 | 4.835 | γ-Glutamyl-S-(1-propenyl) cysteine | yGIsoC | C11H19N2O5S | 291.1022 | 291.1015 | 2.4047 | 55.018 (1, C3H3O+), 58.0654 (1, C3H8N+), 73.0117 (8, C3H5S+), 84.0451 (3, C4H6NO+), 99.0252 (3, C5H7S+), 116.0541 (4, C5H10NS+), 130.0518 (4, C5H8NO3+), 145.0327 (50, C6H9O2S+), 162.0594 (70, C6H12NO2S+), 170.0794 (8, C8H12NOS+), 182.0617 (3, C9H12NOS+), 228.0688 (4, C10H14NO3S+), 274.0742 (9, C11H16NO5S+), 291.0999 (100, C9H17N2O5S+) |
| 17 | 7.777 | γ–Glutamyl-S-(S-1-propenyl)cysteine glycine | yGIsoCGly | C13H22N3O6S2 | 380.0971 | 380.0950 | 5.5249 | No MSMS data available |
| 18 | 8.825 | γ–Glutamyl-S-(S-propyl)cysteine-glycine | YGProCGly | C13H24N3O6S2 | 382.1113 | 382.1107 | 1.5702 | No MSMS data available |
Disclaimer/Publisher’s Note: The statements, opinions and data contained in all publications are solely those of the individual author(s) and contributor(s) and not of MDPI and/or the editor(s). MDPI and/or the editor(s) disclaim responsibility for any injury to people or property resulting from any ideas, methods, instructions or products referred to in the content. |
© 2024 by the authors. Licensee MDPI, Basel, Switzerland. This article is an open access article distributed under the terms and conditions of the Creative Commons Attribution (CC BY) license (http://creativecommons.org/licenses/by/4.0/).
Copyright: This open access article is published under a Creative Commons CC BY 4.0 license, which permit the free download, distribution, and reuse, provided that the author and preprint are cited in any reuse.


