Submitted:
06 June 2024
Posted:
10 June 2024
You are already at the latest version
Abstract
The purpose of this experiment was to assess the morphological parameters and dry matter yield of Brachiaria decumbens ILRI-10871 grown for two years under four fertilizer rates (0,100, 300kg N and manure). The field experiment was carried out at Robit Bata Kebele in the Bahir Dar Zuria district of Amhara region, Ethiopia. Each 9-m2 plot in the treatments was arranged in a 4x2 factorial configuration in a randomized complete block design with three replications. Morphological data were collected from 10 randomly selected plants grown in the middle rows of each plot. All recorded datasets were subjected to a general linear model procedure of SAS (9.0) at a significance level of alpha
Keywords:
Brachiaria decumbens ILRI-10871 variety
; Fertilizer application
; Forage yield
1. Introduction
Livestock is a main source of animal protein, means of transportation, power for crop cultivation, export goods, manure for agricultural cultivation and household energy, means of wealth accumulation, and security in times of crop failure. In addition to this, the sector contributed about 17–25.3% to the national GDP, 39–49% to the agricultural GDP, 12–15% of the export earnings, 60–70% employment opportunity and 50% of household incomes (21). However, livestock productivity in Ethiopia in comparison to the livestock potential is low due to the attributes of inefficient nutritional and management practices, disease and parasitic occurrence, low genetic potential, lack of extension services, and inadequate information to improve animal performance (2; 9).
Among these constraints, inadequate quantity and quality of feed combined with high feed prices are the most important confronts for the livestock production sector (Shapiro et al., 2017; Ebro et al., 2022). Low dry matter yield and poor nutritional values characterize the two major feed resources (natural pasture and crop residues).These are the major available feed resources in the Bahir Dar Zuria District. The communal grazing lands in Bahir Dar Zuria District are overgrazed. In such cases, grasses were purchased from church and school compounds, and collected weeds from croplands were fed through a cut and carry system. As a result, animals could not get sufficient and balanced nutrients from natural pasture and crop residues due to high fiber and low protein content (Gashaw and Defar, 2017). Therefore, to minimize such kinds of feed challenges, to produce improved forages with fertilization for more than one year rather than depending on natural pasture and crop residue is mandatory. For that reason, the application of fertilizer on Brachiaria decumbens ILRI-10871 over the years is important to increase the biomass and quality of feeds and to ensure feed availability for year-round feeding. However, the application of fertilizer on the Brachiaria decumbens ILRI-10871 and fertilizer application rate is an extremely critical issue to achieving high yield and quality of forages. Most of the livestock farmers in Ethiopia do not apply manure or chemical fertilizers on forage grasses. Even if the farmer applied fertilizer, there is a lack of knowledge on the optimum dosage of fertilizer application for Brachiaria decumbens ILRI-10871 and the effect on quality and quantity of forage production have been a challenge for most livestock farmers. Even though, there is no comprehensive and adequately informative attempt or scientific evidence regarding the ideal level of fertilizer application rate for the highest herbage biomass and quality of grown forages, an appropriate fertilizer rate combination must be developed for the Brachiaria decumbens ILRI-10871.
2. Materials and Methods
2.1. Description of the Study Area
The research was conducted at Robit Bata Kebele, Bahir Dar zuria district, in the West Gojjam Zone of the Amhara Regional State of Ethiopia (Figure 1). Robit Bata is located a geographical coordination between 11°25′N-11°55′N latitude and 37°04′E-37°39′E longitude. Its altitude ranges from 1750 to 2300 m.a.s.l, with the mean annual rainfall ranging from 800 to 1250 mm and the mean annual temperature ranging between 10 and 32 °C. Natural pasture (communal and private), crop residues, hay, crop aftermath, attela and birint, agro-industrial by-products, indigenous browse trees/shrubs and improved forage are being used as livestock feed resources (Fentahun et al., 2020).
2.2. Site Selection, Land Preparation and Planting
The project site (ILRI project) was selected purposely based on suitable agro-ecological conditions for forage development. After selecting the site, the land was cleared of weeds and unwanted debris, then ploughed three times by oxen and harrowed to a fine tilth before planted, plots and blocked were outlaid. After proper land preparation, Brachiaria decumbens-10871 was planted in rows on well-prepared soil by using the root-splitting method. The planting method was two-thirds of the root splits were buried at a depth of 10-15cm, and the apical third was left on the ground (Cameron and Lemcke, 2008) and weeds free throughout the experimental period by manual weeding for each year as necessary. The experiment was carried out for two consecutive years (2021 and 2022).
2.3. Fertilizer Collection, Analysis and Application
Cattle manure was purchased from Robit Bata kebele farmers, while urea fertilizer was purchased from the Bahir Dar City local market. The cattle manure used in the experiment had a moisture (47%), pH (7.4), total nitrogen (TN) (1.5%), organic carbon (OC) (17.5%), and available phosphorus (Pav) (32.8 mg/kg) properties.
On the same day, manure and artificial fertilizer were manually applied to the surface. Split applications of fertilizer have been recommended, as the growth response is greater in the period immediately following the application of fertilizer (Watson, 1977). Urea fertilizer application, in which one half was applied at the time of planting and the remaining half was applied for second harvesting, while for manure, in which about 2/3 was applied at the time of planting and the remaining 1/3 was applied for second harvesting due to the slow release of nutrients. In the second year, the same amount of urea and manure was applied at the start of the rain after the uniform cutting of all the plots as in the first year.
2.4. Experimental Treatments
The study was conducted under a 4x2 factorial arrangement in a randomized complete block design (RCBD) with three replications. The treatments were composed of control with no fertilizer, 30tons/ha cattle manure, 100kg N/ha and 300kg N/ha, on Brachiaria decumbens-10871 was observed over two production years (2021 and 2022). The experiment has 4 treatments, 12 experimental plots and the individual plot size of 9m2 (3m*3m). The space between the plot and block was 1m and 1.5m, respectively. The spacing between rows and plants was 0.5m x 0.25m (Gadisa et al., 2019). There were seven (7) rows per plot and 12 plants per row. The treatments were assigned randomly into plots within each replication.
2.5. Morphological Parameter Sampling and Data Collection Methods
The samples were collected year-round for two consecutive years. On the same day, harvests were made 2 times per year by hand using a sickle, leaving a stubble height of 5-10cm from the soil to allow for more growth of new shoots (Tudsri et al., 2002). In each plot, ten plants were randomly selected to record the plant height, number of tillers per plant, number of leaves per plant, leaf length per plant and leaf width per plant. Fresh biomass yield (kg), dry matter yield (t/ha), and leaf to stem ratio were also determined.
2.5.1. Plant Height (PH) (cm)
The plant height was measured on the primary shoot from the soil surface (base) to the tip of the upper leaves of the main stem by using a measuring tape (Rayburn et al., 2007). The mean plant height from each treatment was determined by measuring the height of ten randomly selected plants from the middle rows of each plot, leaving the outer edge rows due to the border effect, and then the average height was calculated.
2.5.2. Number of Tillers per Plant (NTPP)
The number of tillers per plant was recorded by counting all shoots that arise from the main plant and excluding the main shoot from which the shoots arise (Mijena et al., 2022).The number of tillers per plant was counted from the same-tagged ten randomly selected plants from the middle rows and then the mean was calculated.
2.5.3. Number of Leaves per Plant (NLPP)
The number of leaves per plant was counted from all tillers, including the main shoot by taking ten randomly selected plants from the middle rows. By multiplying the NLPT by the NTPP, the total NLPP was obtained, and then the mean number of leaves per plant was calculated.
2.5.4. Leaf Length per Plant (cm)
The leaf length per plant was measured from the base of the collar region of the leaf to the tip of fully expanded leaves. It was measured from ten randomly selected sample plants in the middle rows by using a meter.
2.5.5. Leaf Width per Plant (cm)
The leaf width per plant was measured from the middle region of the leaf. It was measured from ten randomly selected sample plants from the middle row by using a meter.
2.5.6. Leaf-to-Stem Ratio (LSR)
The leaf–to-stem ratio was determined by manually separating sub-samples into leaves and stems, and weighed separately for leaf and stem. The dried sample of each component was weighed and LSR was calculated as the ratio of the dry weight of leaves (g) to the dry weight of stems (g) (Nguku et al., 2016).
2.5.7. Sampling Methods for Fresh Biomass and Dry Matter Yield (DMY) (t/ha)
The plot size of each treatment was 9m2 and from each plot, five middle rows (2nd, 3rd, 4th, 5th and 6th) with a net harvestable area of 4m2 per plot by considering border effects, which left 50cm lengthwise from each side. A fresh biomass yield of grass was measured immediately after harvesting and weighed on the field soon after mowing using a portable balance with a sensitivity of 0.01g. The dry matter percentage was determined by taking about 500g (weighted by a field sensitive balance) of sub-samples of fresh weight from each plot and chopped into short lengths (2-5cm) and then packed with an airtight bag and subjected to oven drying at 65ºC for 72 hours to estimate the dry matter yield (ton/ha). The dry matter percentage was determined by dividing the dry weight of the subsample by the weight of the fresh subsample and multiplying by 100.
DMY (t/ha) = (10x TFWx SSDW)/ (HAxSSFW) (Gelayenew et al., 2020).………………………eq.(1)
where: 10 is constant for conversion of yields in kg/m2 to tone/ha; TFW is Total Fresh Weight from harvesting area (kg); SSDW is Sub-Sample Dry Weight (g);HA is Harvestable Area (m2), and SSFW is Sub-Sample Fresh Weight (g).
2.6. Partial Budget Analysis
The information on all variable costs related to the cost of manure and urea fertilizer was recorded during the purchasing at Robit Bata Kebele farmers and Bahir Dar City local market, respectively. The biomass yield of each treatment was recorded in each production year. The purchased price of manure per quintal was 6,000 birr for each year, while the price of urea was 1,800 and 4,500birr per quintal in 2021 and 2022 at Bahir Dar City during our experimental periods, respectively. To estimate the price of fresh grass, the farmer estimate 1 kg of grass by 4.03 birr. The partial budget analysis was employed using the procedure recommended by CIMMYT (1988).
Adjusted DM yield (ADMY): The farmers using the same technologies would obtain yields 10% less than those obtained by the researchers would. ADMY = Biomass yield – (biomass yield × 0.1)
Gross benefit (GB) = adjusted dry matter yield × field/farm gate price for the grass
Total variable costs (TVC): This was calculated as the sum of all variable costs for a particular treatment.
Net benefit (NB) =Gross field benefit – total variable cost
Dominance analysis (D): This was carried out by first listing the treatments in order of increasing costs that vary or increasing net benefits. Any treatment that has net benefits that are less or equal to those of a treatment with lower costs that vary is dominant.
Marginal rate of return (MRR) = (∆NR/∆TVC)*100
2.7. Statistical Data Analysis
Data on biomass yield and morphological characteristics were subjected to analysis of variance (ANOVA) using the general linear model procedure in Statistical Analysis Software (SAS, 2004 version 9.0). When treatment means showed significant differences, Duncan’s Multiple Range Test (DMRT) significant difference test at P < 0.05 was used.
The statistical model for the analysis of the data was:
Yijk = μ +Fi+ Yj+ Fi*Yj + Eijk
where; Yijk is the all dependent variables (morphological data and DM yield), μ is the overall mean, Fi is the fixed effect of ith fertilizer levels (i=0, 30t/ha cattle manure, 100kg U/ha and 300kgU/ha), Yj is the random effect of jth production years (j=1st year and 2nd year, Fi*Yj is the interaction effect between fertilizer application and production years and Eijk is the residual error.
3. Results and Discussion
3.1. Effect of Fertilizer Levels and Years on Morphological Characteristics and Dry Matter Yield
3.1.1. Plant Height (PH) (cm)
The interaction effects of fertilizer rate and production years had a very high significant (P<0.001) effect on the plant height (Table 1). The highest PH (61.93 and 102.33cm) was measured at application of manure fertilizer in the first and second years, respectively. The shortest PH (42.57 and 57.3cm) was recorded from unfertilized plot in the first and second years, respectively, with the overall mean of 69.37cm. This might be due to the reason, the application of manure to improves soil nutrient availability (organic matter (OM), total nitrogen (TN), dissolved organic carbon (OC) and ammoniam (NH4+) contents) which are necessary for plant growth (Ma et al. 2022). In the current result, the PH at manure >300kg >100kg N>zero application of fertilizer levels and types in both years. The interaction result revealed that for 0, 100, 300 kg N/ha and manure fertilizer, the maximum PH recorded in year 2 compared to year 1. The significant difference of PH across the experimental years suggests that the different distribution of rainfall, temperature. This result was consistent with the finding of Walie et al. (2022), who conducted a research on desho and Napier grass at Guder watershed that the PH of second year (75.3cm) taller than the first year (55.5cm).
3.1.2. Number of Tillers per Plant (NTPP) (Counts)
The result of the current study showed that there was very highly significant (P<0.001) effect of fertilizer rate and production years on the NTPP (Table 1). The maximum number of tillers per plant (30.67 and 120.53) were counted at manure fertilizer in the first and second years, respectively. Whereas, the minimum number of tillers (15.4 and 24) was observed from unfertilized plot in the first and second years, respectively, with the overall mean of 51.94. The more NTPP were produced from cattle manure applied in both years, due to the addition of manure can increase the growth of tillers and improve the structure of the soil to become more crumb by increasing the root growth of the soil pores. In the current study, the NTPP at manure >300kg >100kg N>zero application of fertilizer levels and types in both years. This current result was in line with Bedeke et al. (2017), who indicated that there was a significant (P<0.05) difference on the NTPP of desho grass increased from 54.6 to 79.6 as the fertilizer levels increased from 100 to 350 kg N/ha. The NTPP increased when the production years was extended. This study was in line with Walie et al. (2022), who reported that the mean NTPP increased when the production years extended, which in the 2018 (36.3) lower than 2019 (95.9) at Aba Gerima watershed.
3.1.3. Number of Leaves per Plant (NLPP) (Counts)
The interaction effect of fertilizer application and production years had a very highly significant (P<0.001) effect on the NLPP (Table 1). The maximum NLPP (172.75 and 527.08) was recorded from manure in the first and second years, respectively, while the minimum NLPP was obtained from (138.12 and 154.2) without application of fertilizer in the first and second years, respectively, with the overall mean of 276.45. In the current study, the higher NLPP was recorded from fertilized grass as compared to unfertilized grass which is manure >300kgN/ha >100kgN/ha >0 in both years. This result was in line with findings of Priyadarshani et al. (2013), there were increased trends in the number of leaves with increased the levels of fertilizer application. However, this result was disagreed with Riyana et al. (2018), who showed that the manure has no significant effects on number of leaves per plant. The current finding of the NLPP of second year higher than 1st year in respective fertilizer treatment, this was in agreement with with Ajema et al. (2022), who reported that the NLPP of desho grass increased when the production years extended.
3.1.4. Leaf Length per Plant (LLPP) (cm)
The interaction between fertilizer application and production years had a very highly significant (P<0.001) effect on the LLPP (Table 1). The longest length of leaves per plant (17.51 and 45.17 cm) was recorded from manure application of fertilizer in the first and second years, respectively, while the shortest (12.75 and 15.95 cm) was obtained from without application of fertilizer in the first and second years, respectively, with an overall mean of 19.18. In the current study, the longer length of leaf was obtained from fertilized grass as compared to unfertilized grass. This result was in line with Mihret et al. (2018), longer LLPP of desho grass was recorded at NPS (30.48 cm) and manure (27.37 cm) than without fertilizer (19.87 cm). The present finding of LLPP in year 2 at 0, 100kg, 300kg N/ha and manure fertilizer levels and types were longer than year 1 in their respective fertilizer levels and types. However, this result was disagree with Ajema et al. (2022), who reported that the LLPP in year 1(41.87cm) was longer than year 2 (31.54cm).
3.1.5. Leaf Width per Plant (LWPP) (cm)
The interaction between fertilizer rate and production years had shown very a highly significant (P<0.001) effect on the LWPP (Table 1). The widest leaf width per plant (1.58 and 3.93cm) was recorded from manure fertilizer application in the first and second years, respectively, whereas the narrowest leaf width (1.26 and 3.4cm) was recorded from without fertilizer in the first and second years, respectively. The second year at all fertilizer type and level applied had wider LWPP than the first year.
3.1.6. Leaf to Stem Ratio (LSR)
The interaction of fertilizer levels and production years had a very highly significant (P<0.001) effects on the LSR (Table 1). The highest leaf to stem ratio (1.15 and 1.18) was measured from manure fertilizer in the first and second years, respectively, whereas the lowest LSR (0.68 and 0.88) was observed from control in the first and second years, respectively. The overall mean value of the current results was 1.03, which means, the dry weight of the leaf was greater than the dry weight of stem of grasses. Number leaf per tiller, leaf length, leaf width, and tiller number is the most important characteristics used to determine the leaf to stem ratio and forage quality. The leaf fraction has significant implications for the nutritive quality of the forage, as leaves contain higher levels of nutrients and less fiber than stems (Hidosa et al., 2015).
3.1.7. Dry Matter Yield (DMY) (t/ha)
The interaction effect of fertilizer rate and production years on dry matter yield in this study was highly significant (P<0.001) effect (Table 1). The highest dry matter yield (7.72 and 11.43 t/ha) was recorded from manure application in the first and second years, respectively, while the lowest DMY (5.88 and 9.23t/ha) from without fertilizer in the first and second years, respectively. The superior DMY (t/ha) was recorded from manure fertilizer reflects that the ability of grass which is rapidly regenerate, increasing in plant height, number of leaves per tiller, number of tillers per plant, and other morphological parameters of grass could be increasing forage yield. In the current study, the DMY (t/ha) increased from 0 to 100 to 300kgN/ha and manure in both years. This result was in line with Bedeke et al. (2017) indicated that DMY of desho grass was increased from 8.32 to 13.6 t/ha as the fertilizer level increased from 100 to 250 kg N/ha. The current result of DMY increase as the production year extended. The second year at all fertilizer type and level applied had more DMY than the first year with its respective fertilizer type and level. This result was agreed with Hidosa et al. (2020) reported that the higher DMY of desho grass varieties was recorded in 2018 (24.44 t/ha) than in 2017 (14.74 t/ha). This could be attributes to the genetic potential of grass adapting to the tested environmental factors such as soil characteristics, moisture, and temperature over a year.
3.2. Partial Budget Analysis
The overall partial budget analysis of the current study was presented in Table 2 for 1st year and Table 3 for 2nd year). The highest net benefit (22000.44birr) in the first year was obtained from at manure, while the lowest net benefit was recorded from 300kg (20915.9birr) (Table 2). Similar with year 1, the highest net benefit in the second year was obtained at manure-fertilized plot (35456.61birr) (Table 3). Generally, the higher net benefit was obtained from manure fertilizer than others and the second year had the higher net benefit than year 1.
4. Conclusions
The interaction effects of fertilizer application and production years had significant (p<0.001) effect on morphological characteristics, and dry matter yield observed in this study. The morphological characteristics and DMY increased as the level of fertilizer increased and the production year also extended. The highest PH, NTPP, NLPP, LLPP, LWPP, LSR and DMY were obtained from manure fertilizer application in both years. Based on this evaluation, Brachiaria decumbens-10871 with manure fertilizer application was recommended due to adaptive and better production performance to fulfill the shortage of forage quantity to enhance the livestock production and productivity in the study area and similar agro ecologies.
Author Contributions
Mekuanint Tadilo: investigation, formal analysis Mekuanint Tadilo, Netsanet Beyero and Melkamu Bezabih: methodology, writing—original draft preparation, writing—review and editing. All authors have read and agreed to the published version of the manuscript.
Funding
This work was supported by the U.S. Agency for International Development under the Feed the Future Innovation Lab for Small Scale Irrigation (contract no. AID-OAA-A-13-0055).
Data Availability Statement
The raw data supporting the conclusions of this article will be made available by the authors upon request.
Acknowledgments
I would like to give my deepest thanks U.S. Agency for International Development under the Feed the Future Innovation Lab for Small Scale Irrigation Project for granting my study, which covers laboratory analysis expenses.
Conflicts of Interest
There is no conflict of interest.
References
- Ajema, H., Berhane, G., and Kebede G., 2022. Biomass Yield and Nutritive Value of Desho (Pennisetum glaucifolium) Grass As Affected by Forage Stand Height under Central Highland Condition of Ethiopia, (Doctoral dissertation, Addis Ababa University).
- Alemayehu, M. , Kebede, G., Feyissa, F., & Assefa, G. 2017. Review on Major Feed Resources in Ethiopia: Conditions, Challenges and Opportunities. Academic Research Journal of Agricultural Science and Research. Vol. 5(3), pp. 176- 185. [CrossRef]
- Bedeke, W. , Hidosa, D. and Berhanu, T., 2017. Effect of planting space and fertilizer rate on productivity of desho grass (Pennisetum pedicellatum) in Jinka agricultural Research center, Southern Ethiopia. International Journal of Research in Agriculture and Forestry, 4(11), pp.14-19.
- Cameron, A. G., & Lemcke, B. 2008. Para Grass: A Pasture Grass for Wet and Flooded Soils, p. Agnote N° E30, Department of Regional Development, Primary Industry, Northern Territory Government, Australia, Fisheries and Resources.
- Ebro, A. , Adolfo, A.A, Adriaan, V., Jan van der, L., Haymanot, A., Yenenew, B., Beyadglign, H., Tinsae, B., Yared, D., Anteneh, A., & Mekonnen, A. 2022. Participatory evaluation and demonstration of different grazing land improvement techniques: case study Mecha district of west Gojam. Proceeding of the 29th annual conference of the Ethiopian society of Animal production. Addis Ababa, Ethiopia. PP. 337-344.
- Fentahun, S. , Urge, M., Mekuriaw, Y. 2020. Assessment of Seasonality Availability of Livestock Feed Resources and Feeding System in Bahir Dar Zuria District of Amhara Region, Ethiopia. Journal of Fisheries and Livestock Production, 8(1), p.293.
- Gadisa, B. , Dinkale, T., & Debela, M. 2019. Evaluation of Desho Grass (Pennisetum pedicellatum Trin) lines for their adaptability at Mechara Research Station, Eastern Oromia, Ethiopia. Journal of Ecology and the Natural Environment, 11(3), pp.26-32.
- Gashaw, M. , & Defar, G. 2017. Livestock feed resources, nutritional value and their implication on animal productivity in mixed farming system in Gasera and Ginnir Districts, Bale Zone, Ethiopia. International Journal of Livestock Production. 8 (2): 12-23. [CrossRef]
- Gelayenew, B. , Tamir, B., Assefa, G., & Feyissa, F. 2020. Effects of Spacing of Elephant Grass and Vetch Intercropping on Agronomic Performance and Herbage Yield of Elephant Grass. Ethiopian Journal of Agricultural Sciences, 30(2), pp.13-30.
- Hidosa, D., Ayele, B., & Mengistu, M. 2015. Participatory On-Farm Evaluation and Demonstration of Improved Legume Forage Species in Benatsemay Woreda of South Omo Zone, Journal of Biology, Agriculture and Healthcare; 5(21).
- Hidosa, D. , Belachew, B., & Kibiret, S. 2020. Evaluation of Desho (Pennisetum pedicellatum) Grass Varieties for Dry Matter Yield and Chemical Composition in South Omo Zone, South Western Ethiopia. Agricultural Research & Technology: Open Access Journal, 25(1), pp.44-51.
- International Maize and Wheat Improvement Center (CIMMYT). 1988. Farm Agronomic to farmers’ recommendation. An Economic Training Manual. Completely revised edition, D.F. Mexico. 51p.
- Ma, D. , Wang, J., Li, H., Che, J., & Yue, Z. 2022. Simultaneous removal of COD and NH4+-N from domestic sewage by a single-stage up-flow anaerobic biological filter based on Feammox. Environmental Pollution, 314, 20213. [CrossRef]
- Mihret, B., Asmare, B., & Mekuriaw, Y. 2018. Effect of fertilizer type and plant spacing on plant morphological characteristics, yield and chemical composition of desho grass (Pennisetum pedicellatum Trin.) in Northwestern Ethiopia. Journal of Agricultural Science and Technology, VOL. 10, No 2, pp 107 - 114, 201.
- Mijena, D. , Mekete, B., & Getiso, A. 2022. Effect of NPS Fertilizer And Harvesting Stage on Agronomic Performance And Nutritional Quality of Bracharia Grass Under Supplementary Irrigation At Wondogenet, Southern Ethiopia. (Doctoral dissertation, Ambo University). Ukrainian Journal of Ecology, 12(10), pp.20-33.
- Nguku, S. A., Njarui D. N., Musimba, N. K. R., Amwata D. & Kaindi, E. M. 2016. Primary production variables of Brachiaria grass cultivars in Kenya drylands. Tropical and Subtropical Agroecosystems, 19(1), pp.29–39. E-ISSN: 1870-0462.
- Priyadarshani, N. D. N., Amarasinghe, M. K. T. K., Subasinghe, S., Palihakkara, I. R., & Kumarasinghe, H. K. M. S. 2013. Effect of organic and inorganic fertilizers on biomass production, oil yield and quality of vetiver (Vetiveria zizanioides L.). Journal of Agricultural Sciences, 8(1).
- Rayburn, E.B., Lozier, J. D., Sanderson, M. A., Smith, B. D., Shockey, W. L., Seymore, D. A. & Fultz, S. W. 2007. Estimating pasture forage mass from pasture height. West Virginia University: Extension service,1, 1-2.
- Riyana, D., Widiyastuti, Y., Widodo, H. & Purwanto, E. 2018. March. Effect of manure and plants spacing on yield and flavonoid content of Elephantopus scaber L. In IOP Conference Series: Earth and Environmental Science, Vol. 142, No. 1, p. 012038. IOP Publishing.
- SAS, 2004. SAS users guide, statistics SAS institute. Gary, USA.
- Shapiro, B.I., Gebru, G., Desta, S., Negassa, A., Nigussie, K., Aboset, G. and Mechale, H., 2017. Ethiopia livestock sector analysis: A 15 year livestock sector strategy. ILRI Project Report. Nairobi, Kenya: International Livestock Research Institute.
- Tudsri, S., Jorgensen, S. T., Riddach, P. & Pookpakdi, A. 2002. Effect of cutting height and dry season closing date on yield and quality of five Napier grass cultivars in Thailand, Tropical Grasslands, 36(4), 248-252.
- Walie, M. , Tegegne, F., Mekuriaw, Y., Tsunekawa, A., Kobayashi, N., Ichinohe, T., Haregeweyn, N., Mekuriaw, S., Masunaga, T., Okuro, T., Meshesha, D. T., & Adego, E. 2022. Effects of farmyard manure and Desmodium intercropping on forage grass growth, yield, and soil properties in different agro-ecologies of Upper Blue Nile basin, Ethiopia soil properties in different agro-ecologies of Upper Blue Nile basin, Ethiopia. Cogent Food & Agriculture, 8(1). [CrossRef]
- Watson, K.S., Peterson, A.E. & Powell, R.D. 1977. Benefits of spreading whey on agricultural land. Journal of Water Pollution Control Federation, pp.24-34.https://www.jstor.org/stable/25039215.
Figure 1.
Map of the study area.
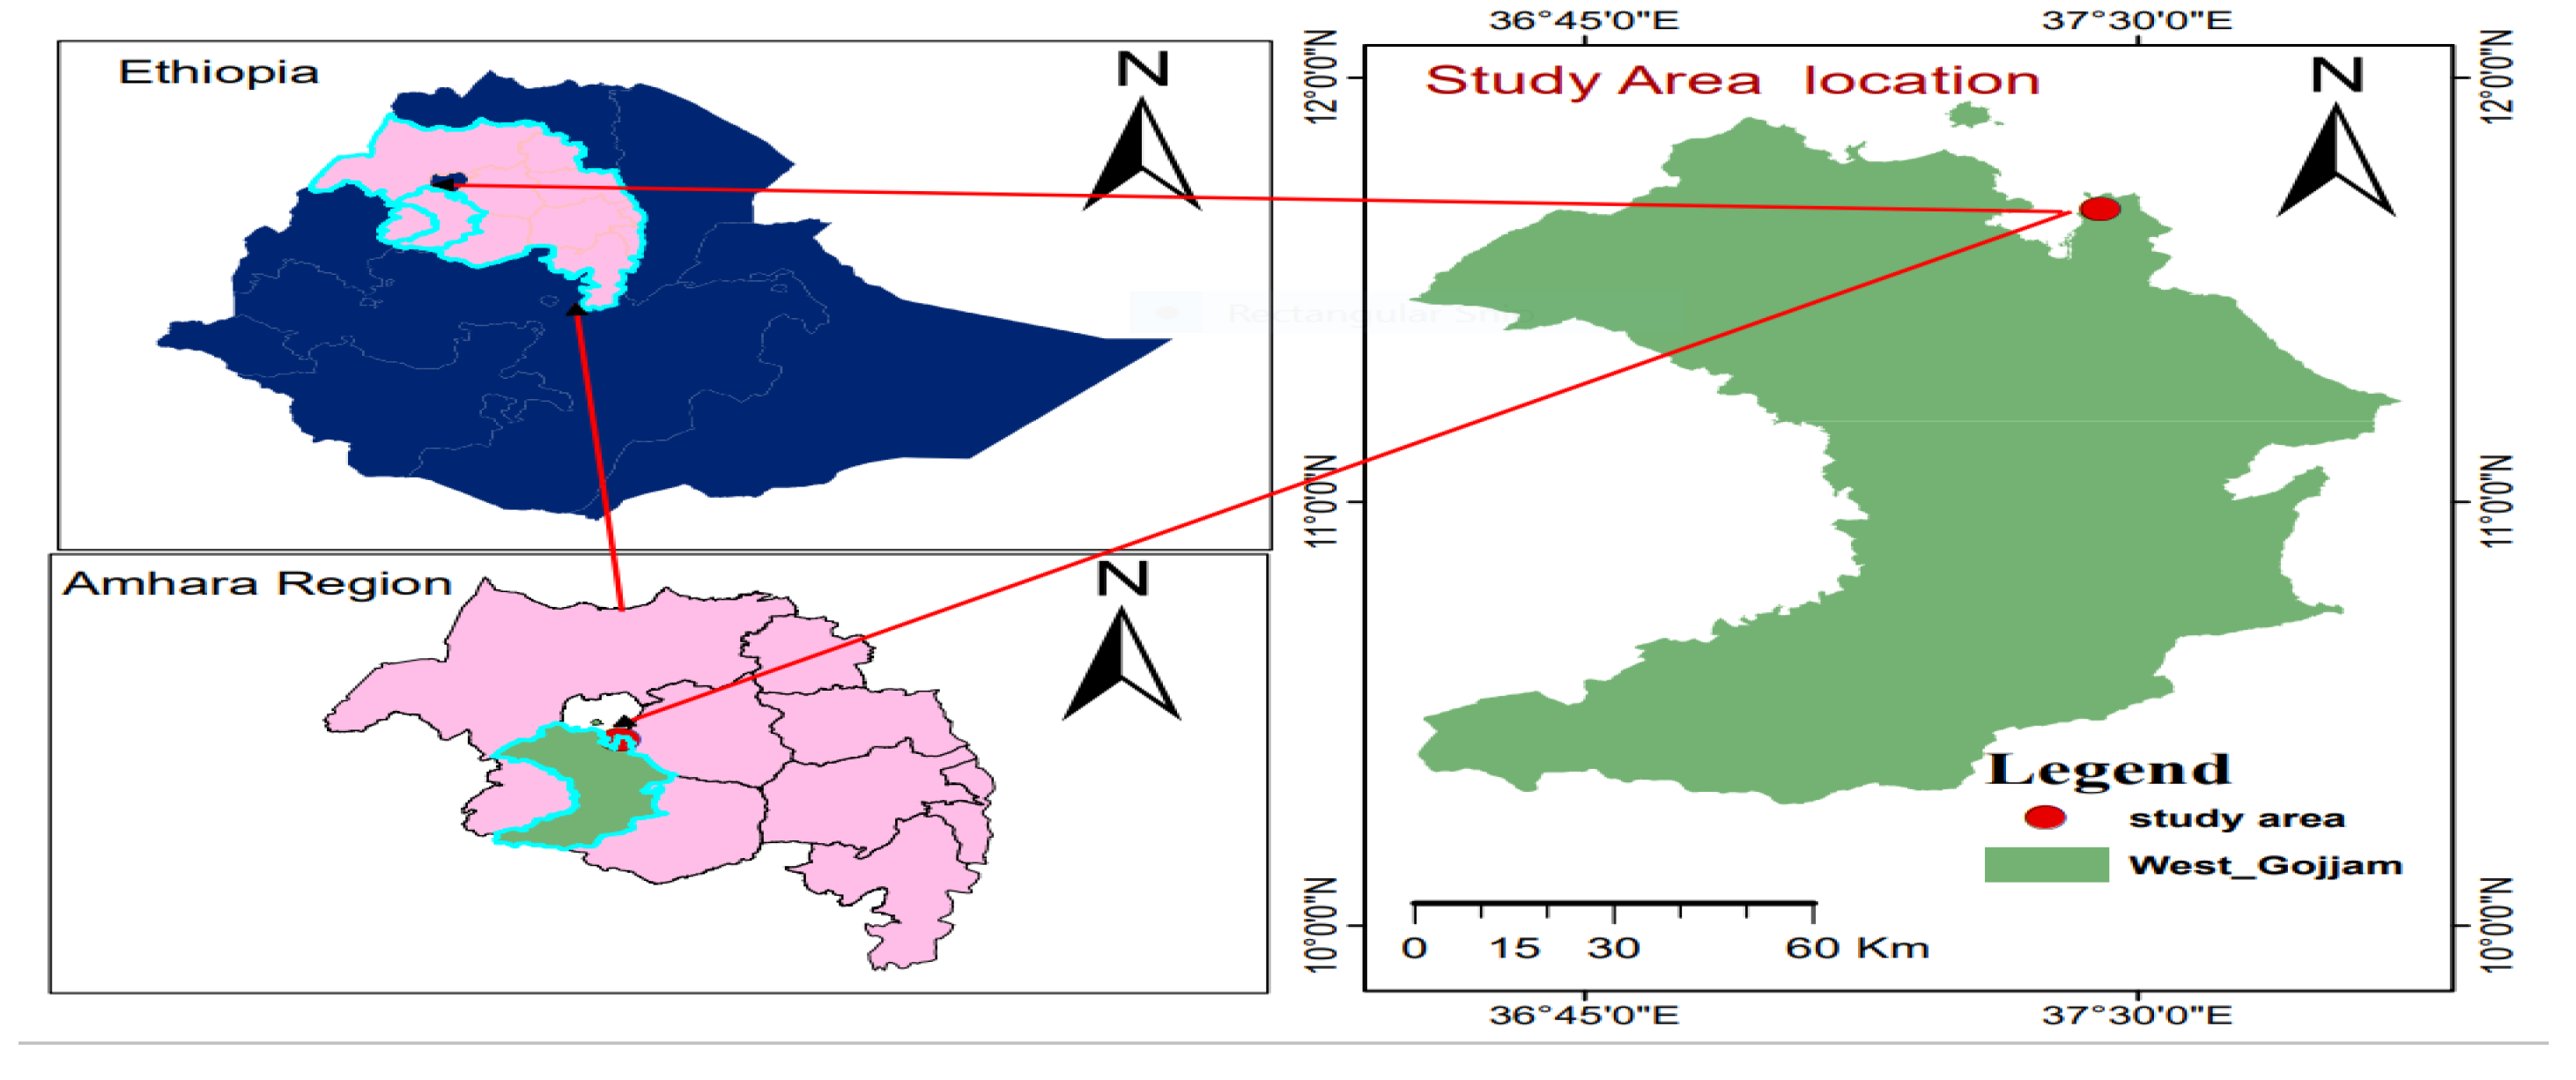

Table 1.
Interaction effect of fertilizer application and years on morphological parameters and DMY.
Table 1.
Interaction effect of fertilizer application and years on morphological parameters and DMY.
| Factors | Parameters | |||||||
| Fertilizer rate | Years | PH | NTPP | NLPP | LLPP | LWPP | LSR | DMY(t/ha) |
| Control | 2021 | 42.57e | 15.40j | 154.20f | 12.75c | 1.26h | 0.68g | 5.88e |
| 100kg N | 2021 | 57.30de | 27.60def | 167.04e | 13.57c | 1.54g | 0.88f | 6.76de |
| 300kg N | 2021 | 58.50d | 28.27def | 172.70e | 14.11d | 1.58f | 1.11d | 7.26d |
| Manure | 2021 | 61.93cd | 30.67def | 172.75e | 17.51c | 1.60e | 1.15b | 7.72d |
| Control | 2022 | 57.30de | 24.00d | 138.12d | 15.95bc | 3.40d | 0.88f | 9.23c |
| 100kg N | 2022 | 73.33b | 75.47c | 394.50c | 16.51bc | 3.71c | 0.96e | 10.13b |
| 300kg N | 2022 | 101.67a | 93.60b | 485.17b | 17.87bc | 3.84b | 1.12c | 10.77ab |
| Manure | 2022 | 102.33a | 120.53a | 527.08a | 45.17a | 3.93a | 1.18a | 11.43a |
| Overall mean | 69.37 | 51.94 | 276.45 | 19.18 | 2.61 | 1.03 | 8.65 | |
| SEM± | 7.26 | 13.92 | 8.57 | 9.9 | 0.003 | 0.002 | 0.77 | |
| CV% | 5.79 | 7.23 | 0.94 | 8.45 | 1.92 | 3.64 | 7.65 | |
| R2 | 0.99 | 0.99 | 0.99 | 0.98 | 0.99 | 0.99 | 0.98 | |
| Frt*yr | <.0001 | <.0001 | <.0001 | 0.0104 | <.0001 | <.0001 | <.0001 | |
PH=plant height, NTPP= Number of tiller per plant, NLPP=Number of leaves per plant, LLPP= Length leaf per plant, LWPP= Length width per plant, LSR=leaf to stem ratio, DMY (t/ha) =Dry matter yield ton per hectare, SEM= Standard error of mean, CV= Coefficient of variation.
Table 2.
Partial budget analysis of different fertilizer level and type on Bracharia decumbens grass varie.
Table 2.
Partial budget analysis of different fertilizer level and type on Bracharia decumbens grass varie.
| Descriptions | Fertilizer type and levels (Treatments) | |||
| Control | 100 kg urea | 300kg urea | Manure | |
| DMY (Kg) | 5880 | 6760 | 7260 | 7720 |
| ADMY (Kg) (A) | 5290 | 6080 | 6530 | 6948 |
| Cost of urea | 0 | 1800 | 5400 | 0 |
| Cost of manure | 0 | 0 | 0 | 6,000 |
| TVC (B) | 0 | 1800 | 5400 | 6,000 |
| Grass Price (birr/ kg) (C) | 4.03 | 4.03 | 4.03 | 4.03 |
| Gross benefit (A*C)(D) | 21318.7 | 24502.4 | 26315.9 | 28000.44 |
| Net benefit (D-B)(birr) | 21318.7 | 22702.4 | 20915.9 | 22000.44 |
| Change in TVC (∆TVC) | 0 | 1800 | 5400 | 6000 |
| Change in net benefit (∆NR) | 0 | 1473.7 | -402.8 | 681.74 |
| MRR (%) = (∆NR/∆TVC)*100 | ND | 8.19 | D | 11.36 |
Table 3.
Partial budget analysis of different fertilizer level and type on Bracharia decumbens grass variety in year 2.
Table 3.
Partial budget analysis of different fertilizer level and type on Bracharia decumbens grass variety in year 2.
| Descriptions | fertilizer type and levels (Treatment) | |||
| Control | 100kg urea | 300kg urea | Manure | |
| DMY (Kg) | 9230 | 10130 | 10770 | 11430 |
| ADMY (Kg) (A) | 8307 | 9117 | 9693 | 10287 |
| Cost of urea ETB Kg-1 | 0 | 4500 | 13500 | 0 |
| Cost of manure in ETB Quintal-1 | 0 | 0 | 0 | 6000 |
| TVC (B) | 0 | 4500 | 13500 | 6000 |
| Grass Price (birr/kg) (C) | 4.03 | 4.03 | 4.03 | 4.03 |
| Gross benefit (A*C)(D) | 33477.21 | 36741.51 | 39062.79 | 41456.61 |
| Net benefit (D-B)(birr) | 33477.21 | 32241.51 | 25562.79 | 35456.61 |
| Change in TVC (∆TVC) | 0 | 4500 | 13500 | 6000 |
| Change in net benefit (∆NR) | 0 | -1234.7 | -7914.42 | 1979.4 |
| MRR (%) = (∆NR/∆TVC)*100 | ND | D | D | 31.96 |
Disclaimer/Publisher’s Note: The statements, opinions and data contained in all publications are solely those of the individual author(s) and contributor(s) and not of MDPI and/or the editor(s). MDPI and/or the editor(s) disclaim responsibility for any injury to people or property resulting from any ideas, methods, instructions or products referred to in the content. |
© 2024 by the authors. Licensee MDPI, Basel, Switzerland. This article is an open access article distributed under the terms and conditions of the Creative Commons Attribution (CC BY) license (http://creativecommons.org/licenses/by/4.0/).
Copyright: This open access article is published under a Creative Commons CC BY 4.0 license, which permit the free download, distribution, and reuse, provided that the author and preprint are cited in any reuse.


