Submitted:
05 June 2024
Posted:
10 June 2024
You are already at the latest version
Abstract
Background: Methotrexate (MTX) displayed cytotoxic properties against some cancer cells. However, there is very limited data about the possible anti-tumoral potential of them in breast cancer (BC) cells. We aimed to determine the effects of MTX, which is widely used in clinical practice, on cell viability, Hypoxia-inducible factor (HIF) -1α, HIF-2α and prolyl 4-hydroxylase-transmembrane (P4H-TM) in BC cells (MCF-7) and health breast cell (HTERT-HME1) treated with MTX. Methods: Human healthy breast cells (HTERT-HME1) and BC cells (MCF-7) treated with MTX for 24 h, 48h, and 72 h, the effects of MTX on cell viability. Results: The cell viability and with half-maximal inhibitory concentration (IC50) values of of MTX treatment in healthy breast cells were determined to be higher than in MCF-7 cells. MTX showed higher cytotoxicity against MCF-7 cells. MTX significantly reduced cell viability values in HTERT-HME1 and MCF-7 cells. HIF-1α, HIF-2α, and P4H-TM levels was significantly higher in the MCF-7 group than the other groups. Morever, there was a moderate significant correlation between HIF-1α and HIF-2α levels and between HIF-1α and P4H-TM. Conclusions: MTX will show a further decrease in cell viability in long-term treatments of 48 and 72 hours, it is predicted that short-term use may be more appropriate. P4H-TM may be a novel regulator of hypoxia in BC cells. HIF-1α, a key protein responsible for the molecular mechanism of hypoxia in cells, is a key mediator between P4H-TM and hypoxia in MTX-treated cells. HIF-1α, HIF-2α, and P4H-TM values may be markers that can be used as a panel to differentiate BC from healthy women.
Keywords:
HIF-1α
; HIF-2α
; P4H-TM
; Breast Cancer
1. Introduction
One of the most common malignant tumors in women is breast cancer (BC) (1). As a common feature of solid tumors, with tumor growth, disharmony occurs in the vascular network of the tissue and a hypoxic environment occurs (2). Hypoxia is a common condition in solid tumors. When tumor cells do not receive enough oxygen, they adapt to the hypoxic state by creating genetic differences before cell death (3).
Hypoxia-inducible factor (HIF) family members facilitate both oxygen delivery and adaptation to oxygen deprivation by regulating the expression of genes involved in many cellular processes, including glucose uptake and metabolism, erythropoiesis, angiogenesis, cell proliferation and apoptosis (4, 5). To date, three HIF family members have been identified in human cells in response to low oxygen levels. Each of these heterodimers, named HIF-1, HIF-2 and HIF-3, consists of an α subunit and a β subunit that dissociate under normoxic conditions (6, 7). Cellular and developmental responses to hypoxic conditions are mediated primarily by HIF-1α, encoded by the HIF1A gene (8). Three HIF-α isoforms (HIF-lα, HIF-2α, HIF-3α) produced by alternative splicing have been identified (9). Overexpression of HIF-1 and HIF-2alpha has been found in some human cancers, possibly as a result of intratumoral hypoxia or genetic alterations. With the formation of a hypoxic environment, adaptive responses are regulated by HIF-1 (10-12).
Prolyl 4-hydroxylase-transmembrane (P4H-TM) belongs to the family of HIF-prolyl 4-hydroxylases (HIF-P4Hs) that regulate the stability and activity of hypoxia-inducible transcription factors (HIFs) that play a central role in oxygen homeostasis (13, 14). P4H-TM plays a role in tumor progression in BC (15).
Both the therapeutic efficacy and toxic effects of methotrexate (MTX), which has been used in cancer treatment for a long time due to its inhibition of cell division, may vary from patient to patient (16). Therefore, unlike other antineoplastic drugs, MTX is used in a wide dose range (17).
Therefore, in this study, we aimed to determine the effects of MTX, which is widely used in clinical practice, on cell viability, HIF-1α, HIF-2α and P4H-TM in BC cells (MCF-7) and health breast cell (HTERT-HME1) treated with MTX.
2. Materials and Methods
- Cell Culture and Cell Viability Assay
The experiments were performed on human healthy breast cells (HTERT-HME1) and human breast cancer (MCF-7) cell lines. The cell lines obtained from the American Type Culture Collection (ATCC) and were cultivated on 10% fetal bovine serum (FBS), and 100 IU/mL of penicillin and 10 mg/mL of streptomycin containing high-glucose Dulbecco’s modified Eagle’s medium (DMEM) (GibcoTM, Sigma). Cells were cultivated in a humidified atmosphere with 5% CO2 at 37◦C. The cells were subcultured with 0.25% Tripsin-EDTA. The cytotoxicity of MTX (Submex; Abdi Ibrahim, Istanbul, Turkey)) against human healthy and breast cancer cell lines (HTERT-HME1 and MCF-7) was determined using the 3-(4,5-dimethythiazol-2-yl)-2,5-diphenyl tetrazolium bromide (MTT, Merck KGaA, Darmstadt, Germany) dye reduction assay. Cells were seeded at 1x10⁴ cells/well on 96 well plates for each group, and after overnight incubation, cells were treated with different concentrations of MTX for 24 h, 48 h and 72 h in 5% CO2 atmosphere at 37°C. At the end of the incubation time, the MTT reagent (20 μL) was added and the cells were incubated for a further 3 h. The formed formazan crystals were dissolved in 100 μL of dimethyl sulfoxide (DMSO) and the absorptions were measured a wavelength of 490 nm, and at a reference wavelength of 570 nm, using a microplate reader (Multiskan GO-Thermo, Waltham, MA USA). Experiments were performed three times and the IC50 values, which corresponds to the concentration required for 50% inhibition of cell viability, were calculated by Graphpad prism software (version 9, La Jolla, CA, USA). Results were expressed as percentage of viable cells relative to the untreated control cells.
- Experimental Groups
Groups were formed to form health breast cell (HTERT-HME1) control, MTX + HTERT-HME1 cell, breast cancer cell (MCF-7) control, MTX+MCF-7 cells. Cells were seeded at 3x10⁵ cells/well on 6 well plates for each group. 24 hours after cell seeding, the control group was replaced with the normal medium and the others with the medium containing the MTX. While the other groups were incubated for 48 hours, the MTX groups was treated with 48 hours of MTX. At the end of the experiments, cell lysate was prepared using 1xRipa lysis buffer and a protease inhibitor cocktail set (Merck KGaA, Darmstadt, Germany) as stated in our previous studies (18,19).
- Biochemical Analysis
- Measurement of hypoxia-inducible factor 1α (HIF-1α)
HIF-1α levels were measured according to the manufacturer’s instructions (HIF-1α ELISA Kit, Cat.No.: E0422Hu, BT LAB, Zhejiang, China). The coefficients of intra- and interassay variation were <8% (n = 20) and <10% (n = 20), respectively.
- Measurement of hypoxia-inducible factor 1α (HIF-2α)
HIF-2α levels were measured according to the manufacturer’s instructions (HIF-2α ELISA Kit, Cat.No.: E7164Hu, BT LAB, Zhejiang, China). The coefficients of intra- and interassay variation were <8% (n = 20) and <10% (n = 20), respectively.
- Measurement of transmembrane prolyl 4-hydroxylase (P4H-TM)
P4H-TM levels were measured according to the manufacturer’s instructions (P4H-TM ELISA Kit, Cat.No.: E7241Hu, BT LAB, Zhejiang, China). The coefficients of intra- and interassay variation were <8% (n = 20) and <10% (n = 20), respectively.
- Statistical Analysis
Statistical Package for the Social Sciences version 21.0 software package for Win-dows (IBM Corp., Armonk, NY, USA) and Office 365 were used for data evaluation, analysis and creation of figures. The Shapiro-Wilk test was applied for normality analysis. Numerical variables were represented as mean±standard deviation. One-way ANOVA was used for comparison of continuous variables between more than two groups; Tukey-HSD were used for post-hoc significance. The Pearson correlation analyses were used for to evaluate relationship between the numerical variables. A p-value <0.05 was considered for statistical significance.
3. Results
- In-vitro Effects of MTX on HTERT-HME1 and MCF-7 Cells
The anti-tumor potential of MTX in different concentration were evaluated on HTERT-HME1 and MCF-7 cells. The MTT assays were performed to investigate the dose-dependent MTX effect on cell viability. For this purpose, MTX were added on cells at an increasing concentration (2.5-100μM) during 24h, 48 h and 72h and half-maximal inhibitory concentration (IC50) values were calculated (Table 1).
The cell viability and IC50 value of MTX treatment in healthy breast cells- HTERT-HME were higher than MCF-7 cells, MTX showed higher cytotoxicity against MCF-7 cells. MTX significantly reduced cell viability values in HTERT-HME1 and MCF-7 cells. It indicates that MTX showed a dose-dependent cytotoxic effect on both cells after 24, 48 and 72 hours of incubation on HTERT-HME1 and MCF-7 cells (Figure 1 and Figure 2).
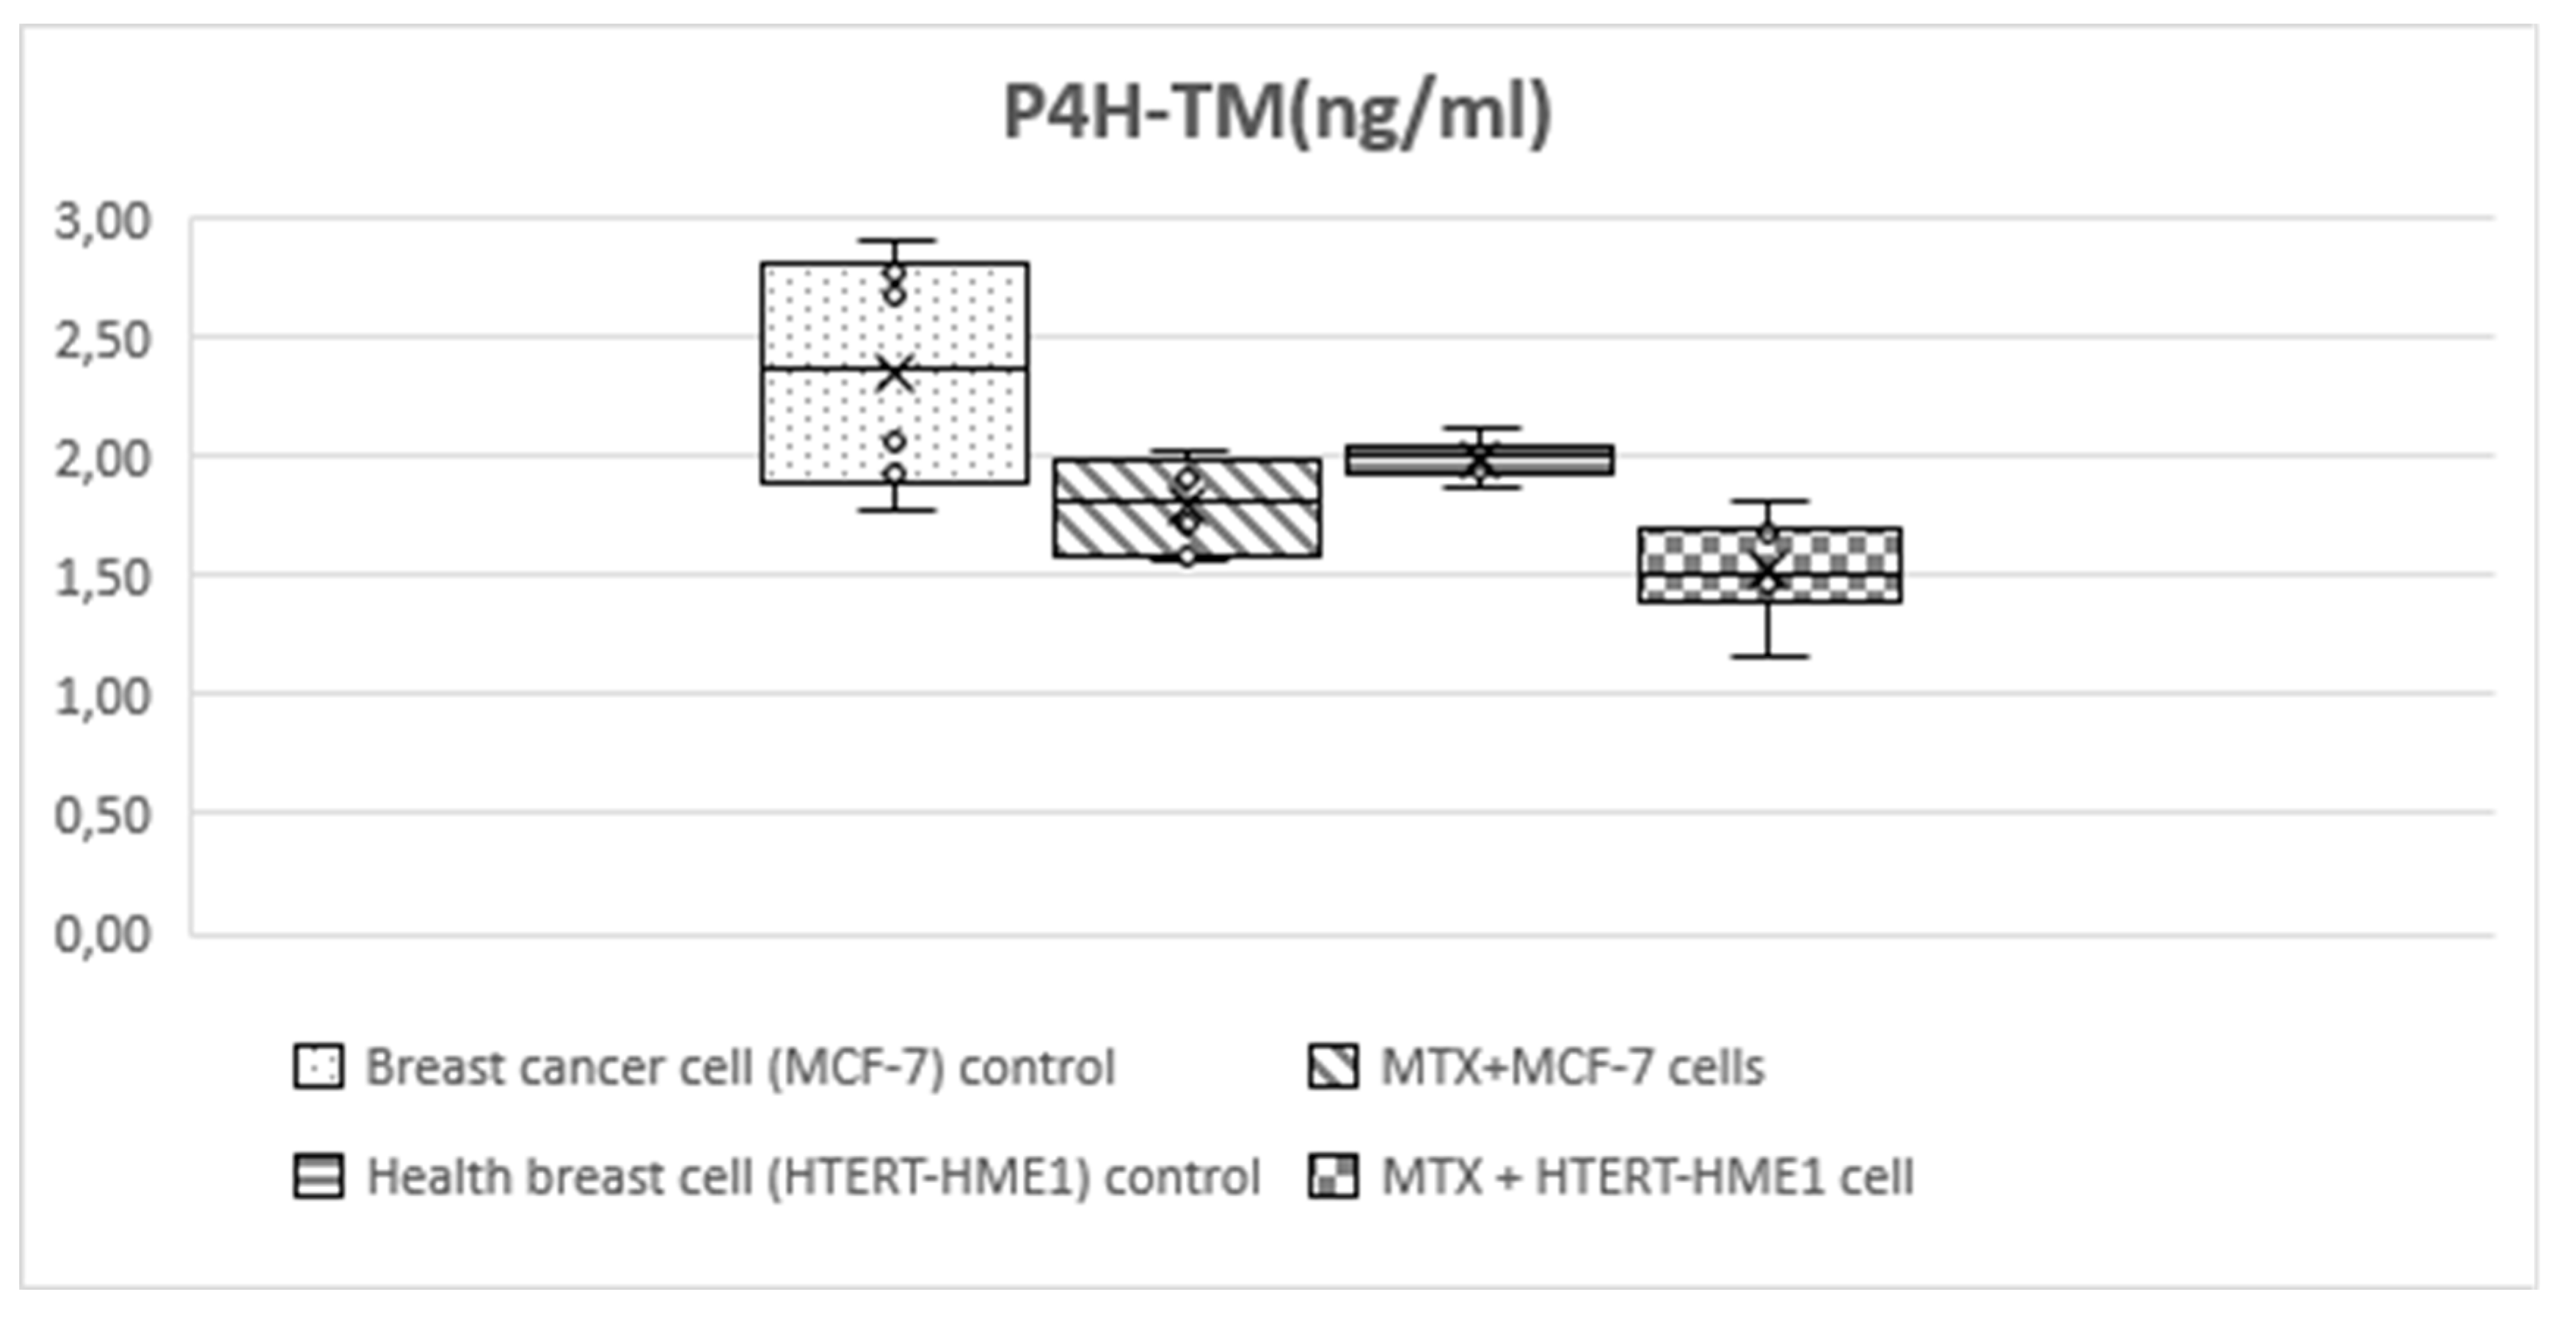
Statistically significant differences were found between MCF-7, MTX+MCF-7 cells, HTERT-HME1 and MTX+HTERT-HME1 cell groups in terms of HIF-1, HIF-2, P4H-TM (Table 2, Figure 3, Figure 4and Figure 5). Post-hoc Tukey HSD analysis was applied to determine the groups where the difference originated (Table 3).
HIF-1 level was significantly higher in the MCF-7 group (3.56±0.4) than the other groups (MTX+MCF-7 cells: 2.88±0.18; HTERT-HME1: 2.63±0.17; MTX + HTERT-HME1 cells: 2.4±0.19). In addition, it was significantly higher in the MTX+MCF-7 cells group than in the MTX + HTERT-HME1 cell group (2.88±0.18 vs 2.4±0.19). HIF-2 level was significantly higher in the MCF7 group (10.04±0.72) than in the HTERT-HME1 group (7.32±0.77) and in the MTX + HTERT-HME1 cell group (8.45±0.92), while there was no significant difference with the MTX+MCF-7 cells group (9.43±0.43). Also, it was significantly higher in the MTX+MCF-7 cells group than in the HTERT-HME1 group. P4H-TM level was significantly higher in the MCF7 group (2.35±0.48) than in the MTX+MCF-7 cells group (1.79±0.2) and MTX+HTERT-HME1 cells group (1.52±0.22), but not significantly different from the HTERT-HME1 group (1.99±0.08). In addition, it was significantly higher in the HTERT-HME1 group than in the MTX + HTERT-HME1 cell group.
There was a moderate statistically significant correlation between HIF-1 and HIF-2 levels (r:0.595; p:0.002) and between HIF-1 and P4H-TM (r:0.441; p:0.031). There was no statistically significant correlation between HIF-2 and P4H-TM (r:0.169; p:0.429) (Table 4).
Figure 1.
HTERT-HME1 cells were treated with increasing concentrations of MTX for 24, 48 and 72h. The cell viability was determined using the MTT assay. Absorbance values were measured at 570 nm and normalized against untreated control cells (n:6).
Figure 1.
HTERT-HME1 cells were treated with increasing concentrations of MTX for 24, 48 and 72h. The cell viability was determined using the MTT assay. Absorbance values were measured at 570 nm and normalized against untreated control cells (n:6).
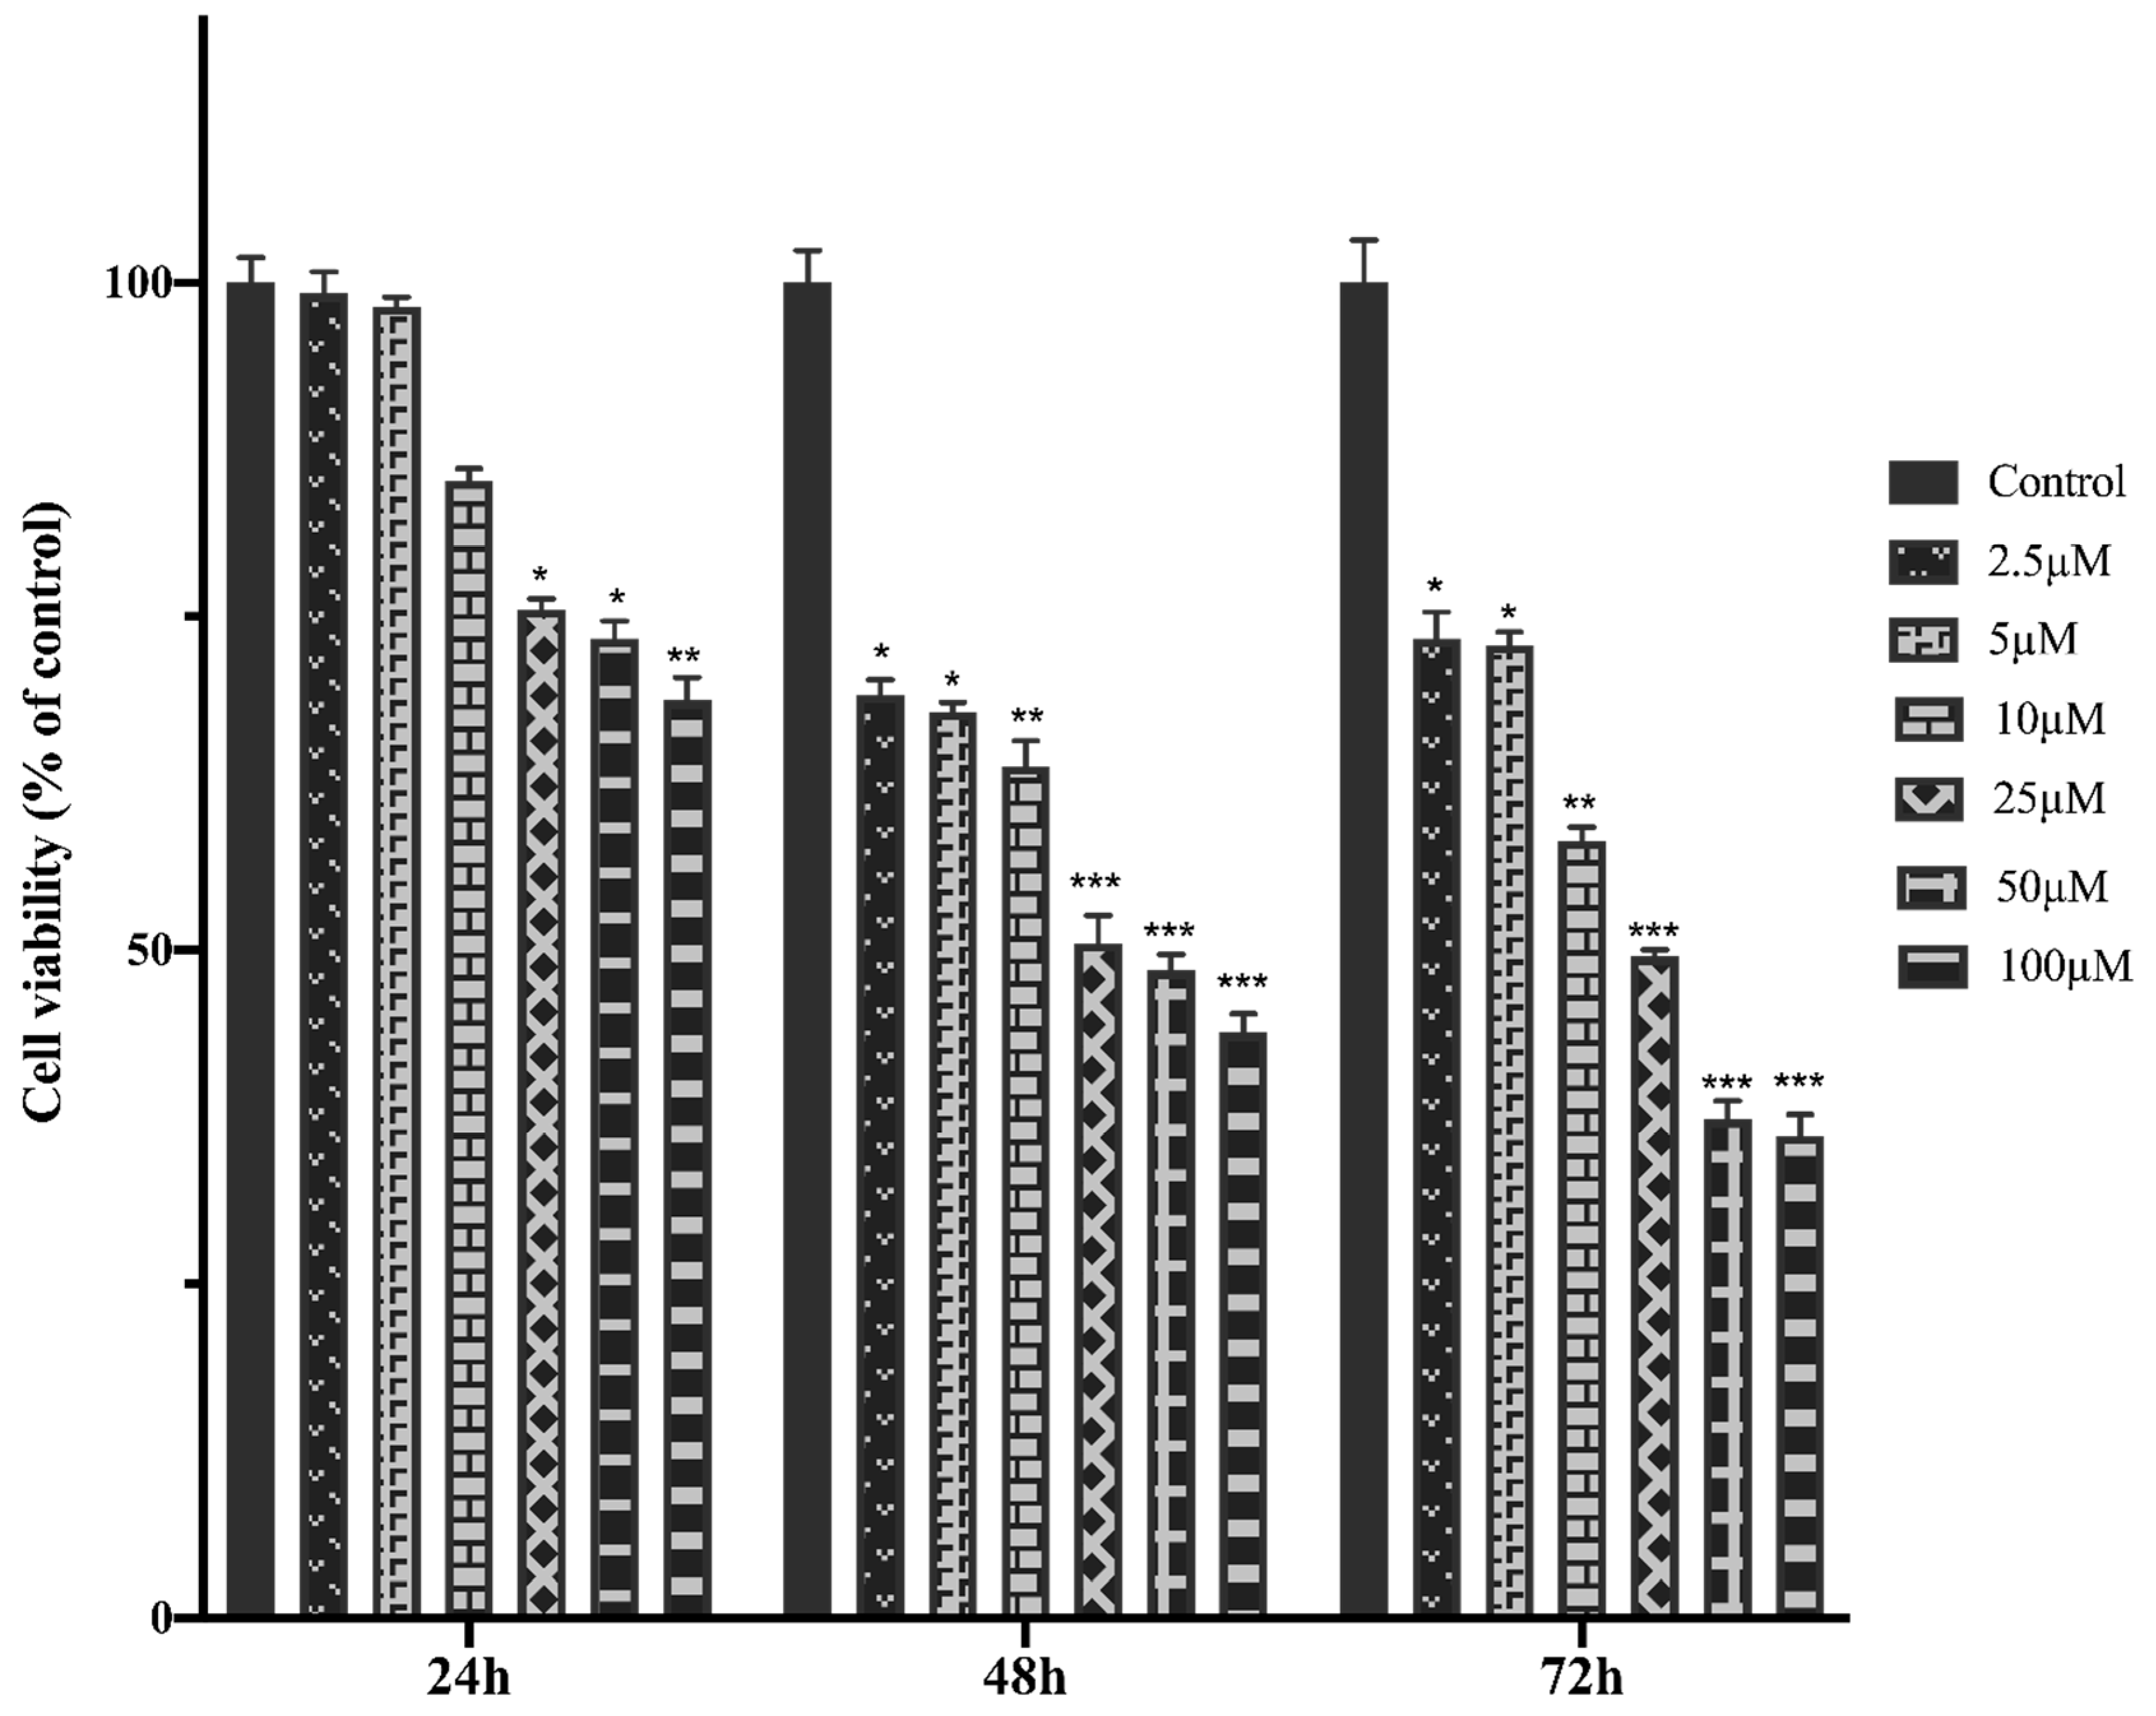
Figure 2.
MCF-7 cells were treated with increasing concentrations of MTX for 24, 48 and 72h. The cell viability was determined using the MTT assay. Absorbance values were measured at 570 nm and normalized against untreated control cells (n:6).
Figure 2.
MCF-7 cells were treated with increasing concentrations of MTX for 24, 48 and 72h. The cell viability was determined using the MTT assay. Absorbance values were measured at 570 nm and normalized against untreated control cells (n:6).
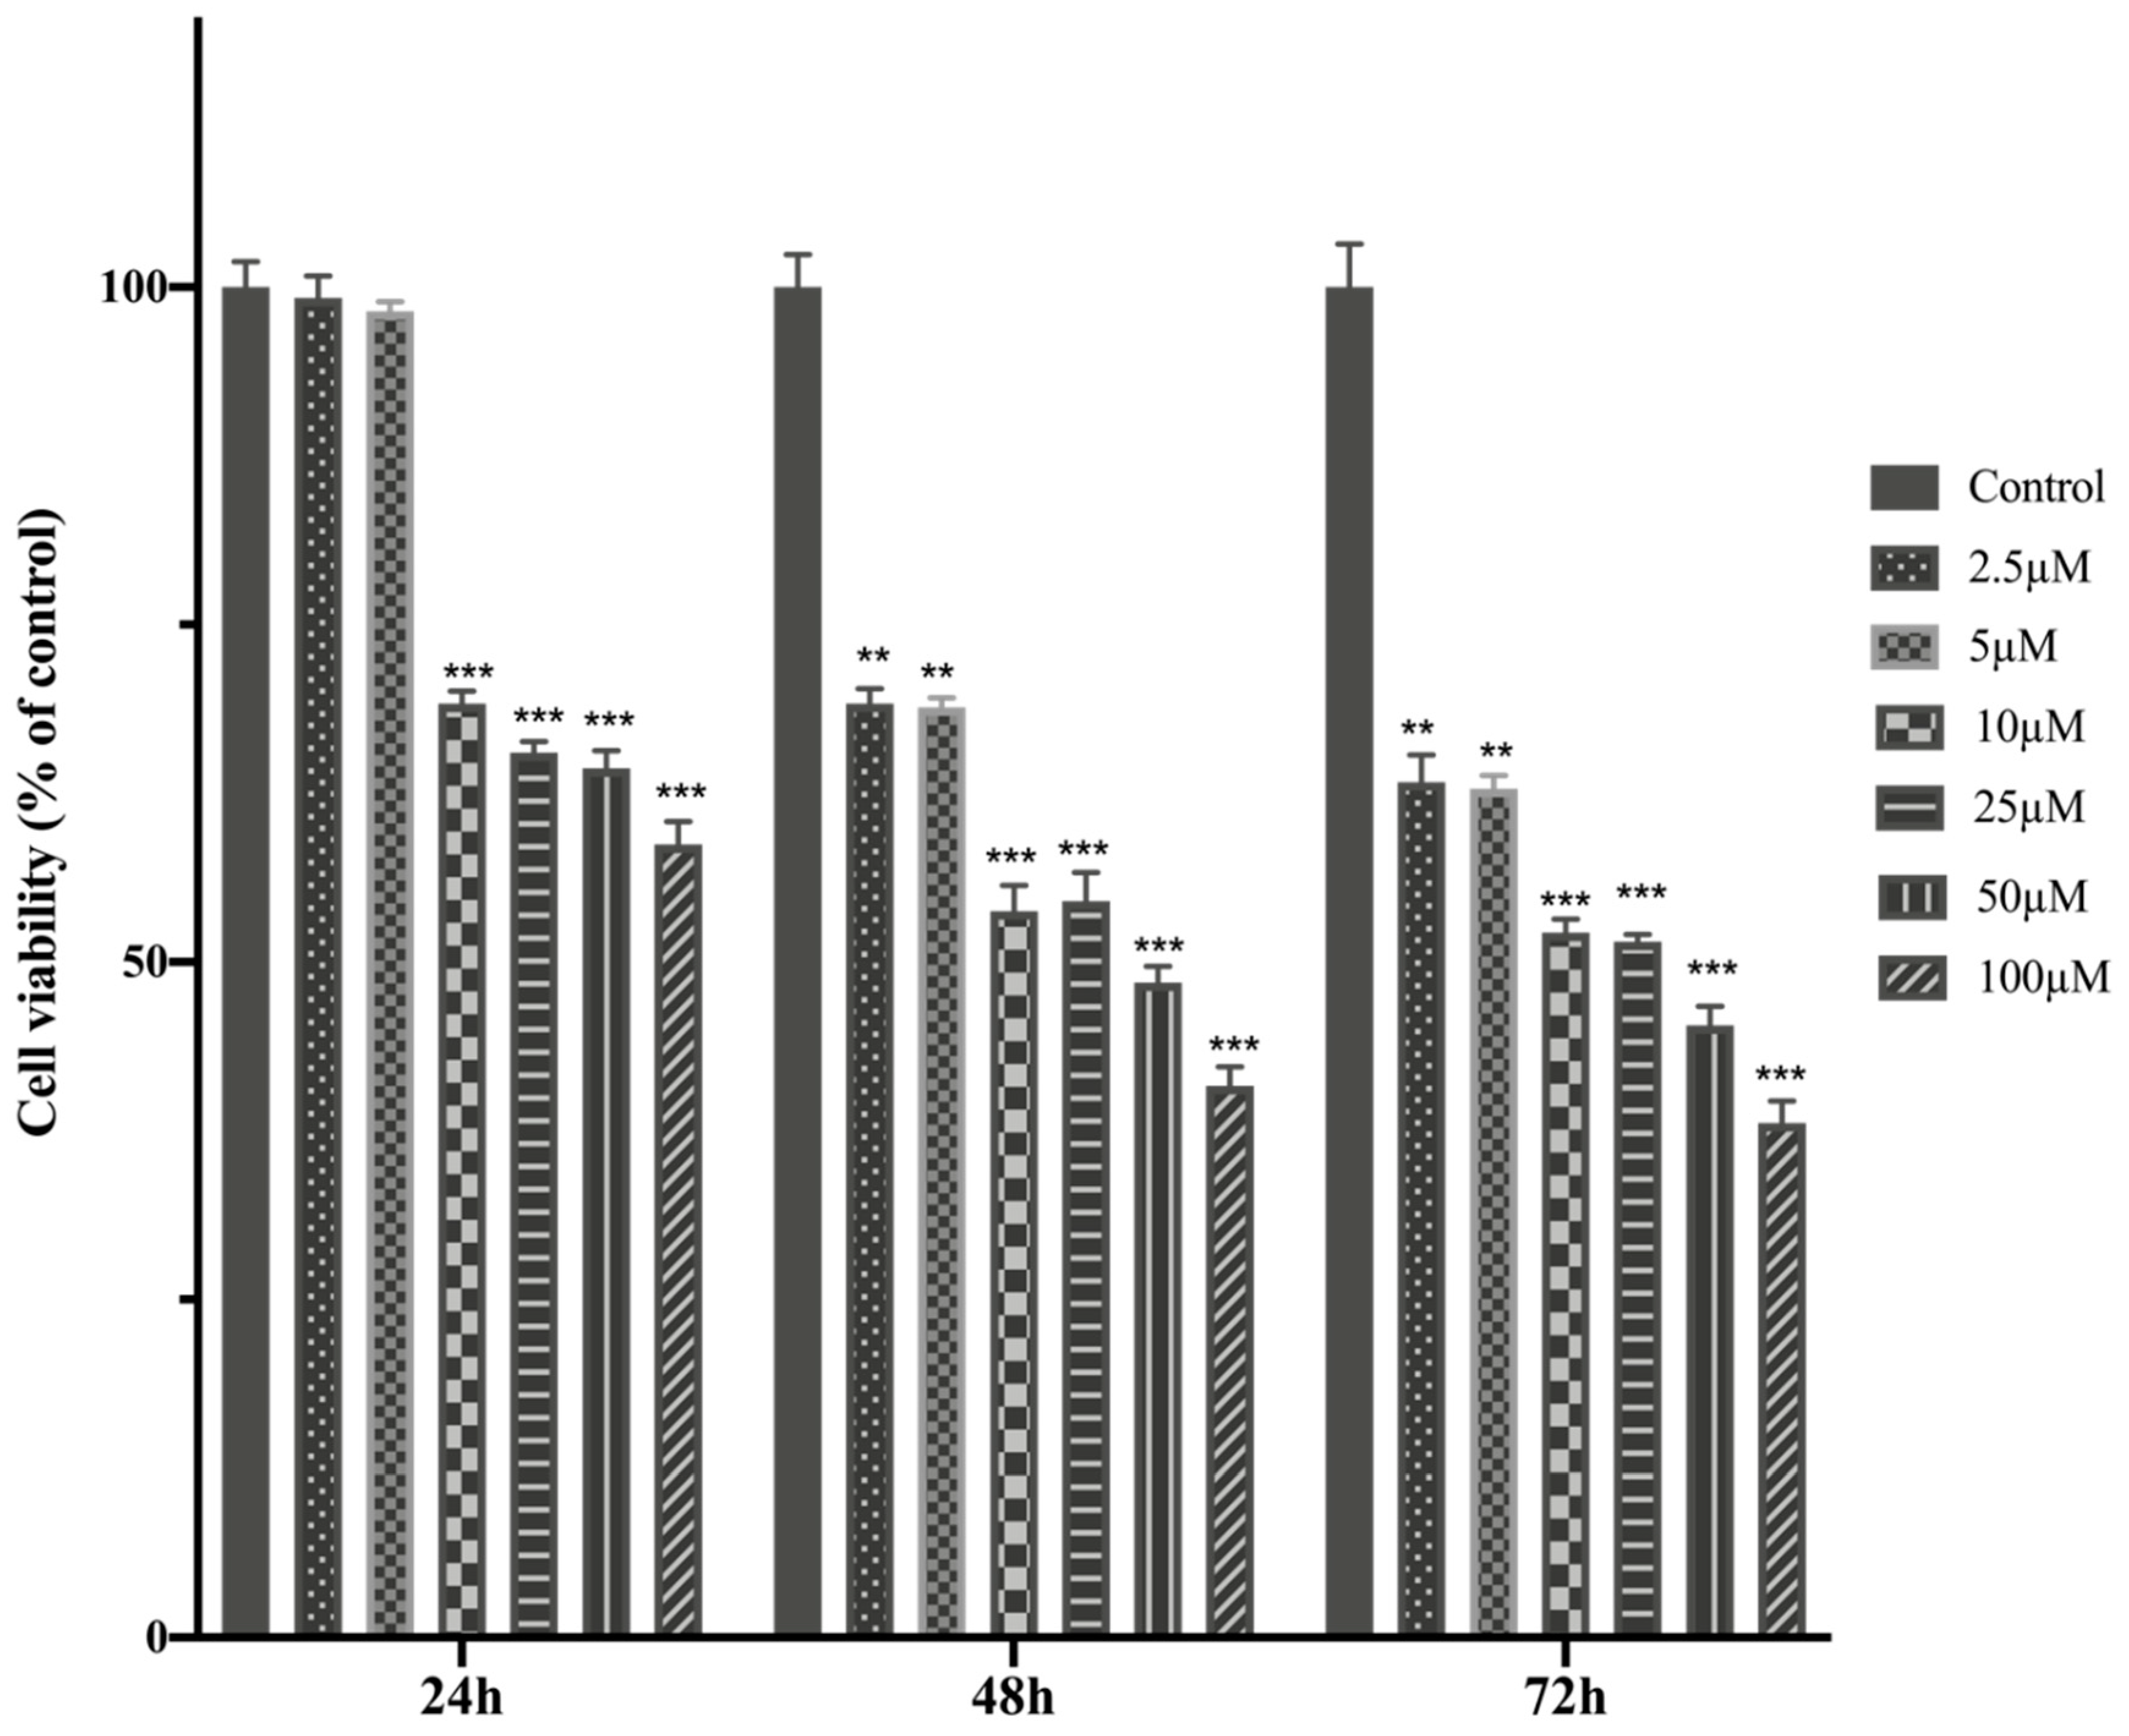
Figure 3.
Box-plot graph of HIF1 level in treatment and control groups.
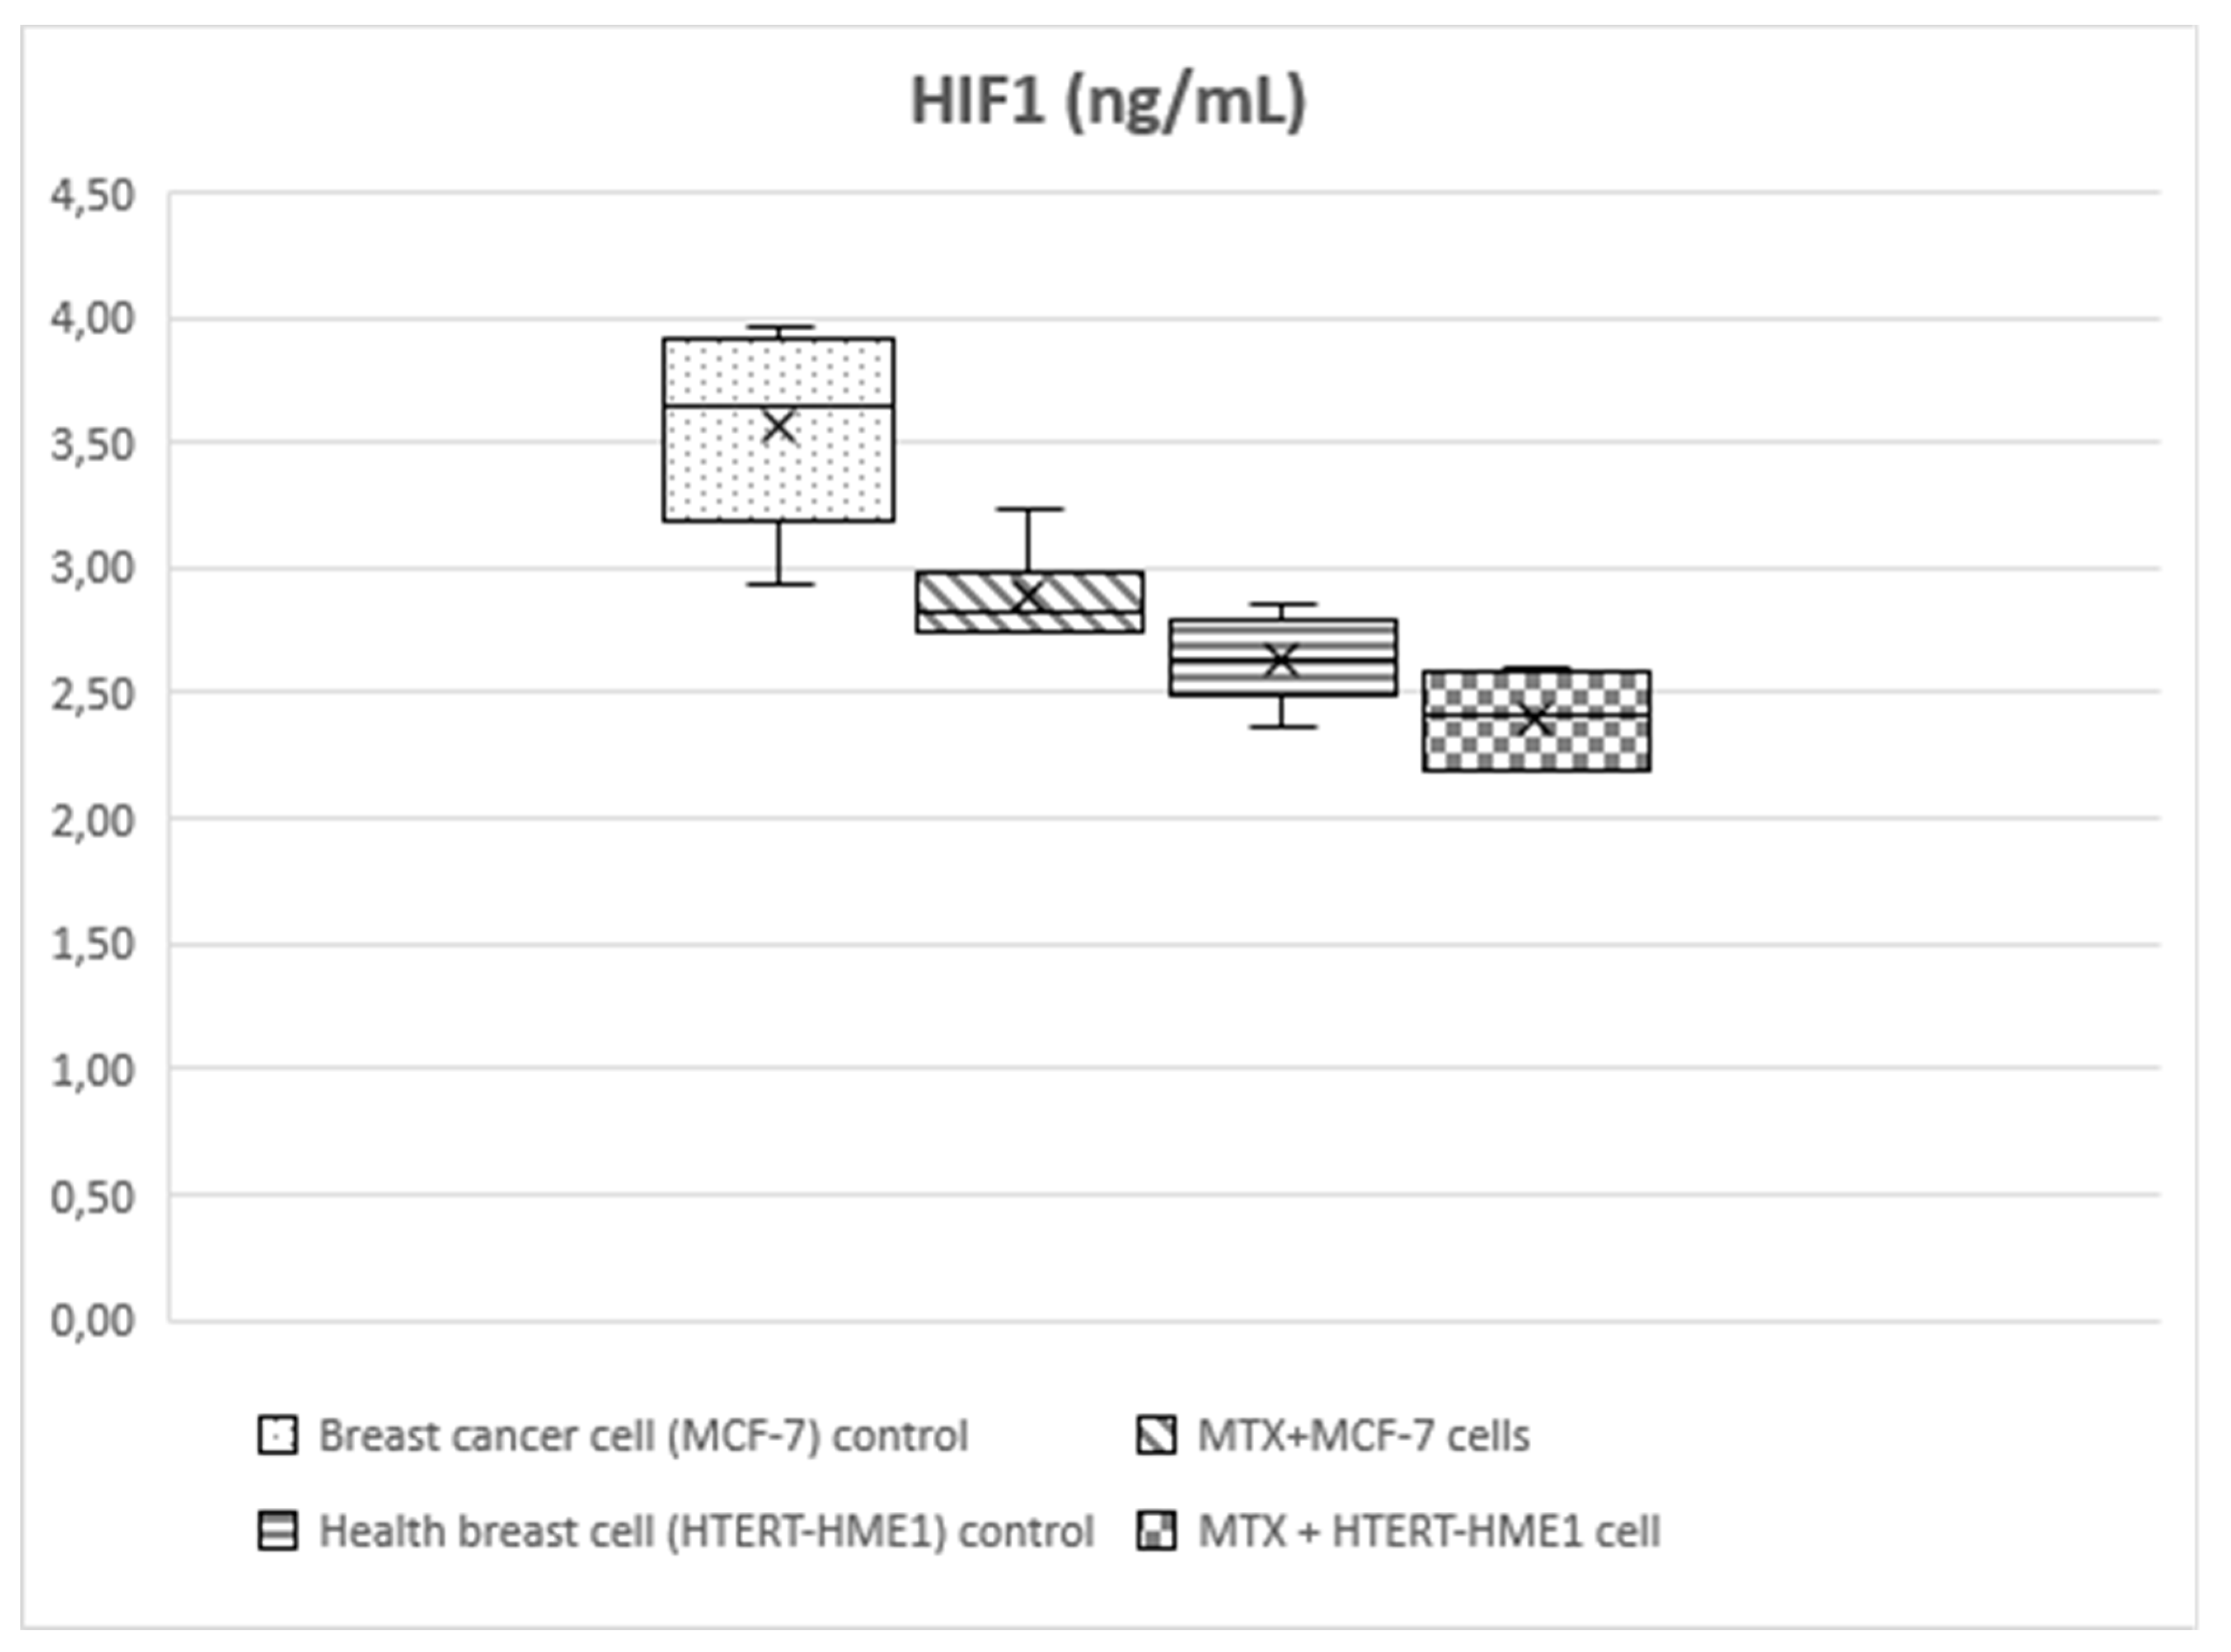
Figure 4.
Box-plot graph of HIF-2 level in treatment and control groups.
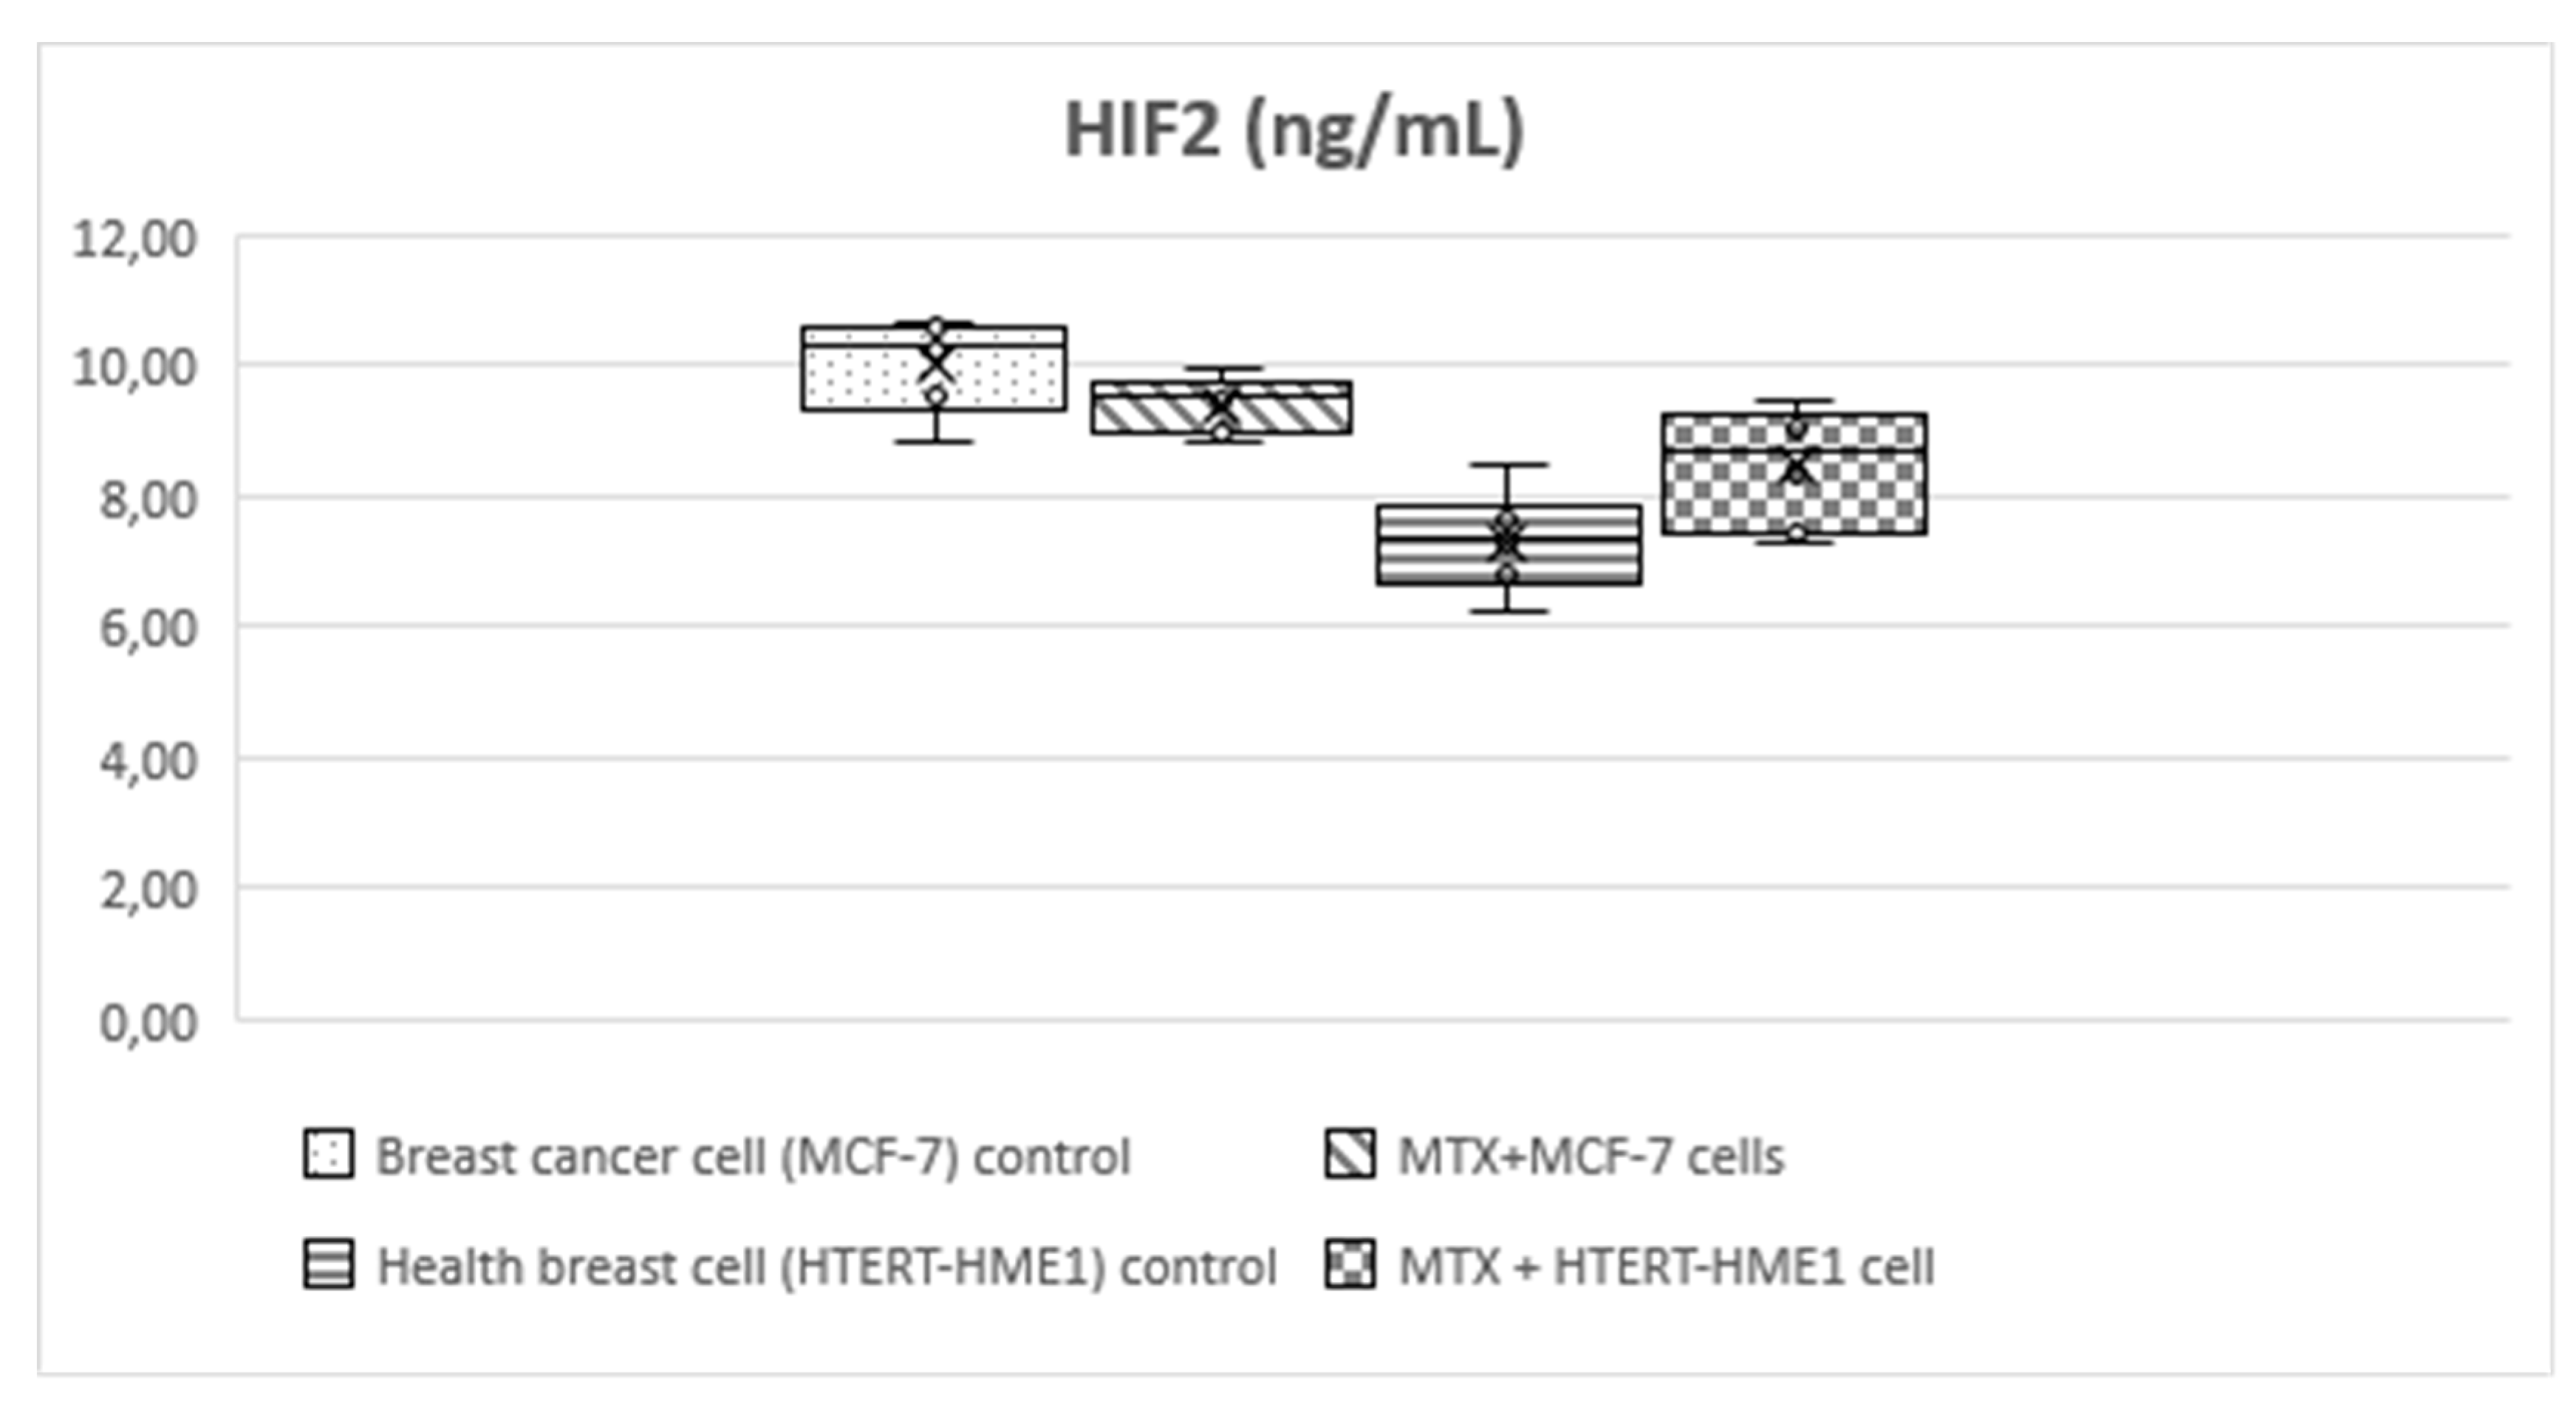
Figure 5.
Box-plot graph of P4H-TM level in treatment and control groups.
4. Discussion
Although the mechanism of toxicity caused by MTX is not known exactly, several mechanisms have been proposed to explain the toxicity. In current study, the effects of MTX on cell viability, HIF-1α, HIF-2α and P4H-TM were investigated in BC cells (MCF-7) and healthy breast cells. MTX significantly reduced cell viability values in HTERT-HME1 and MCF-7 cells in a long time. HIF-1α, HIF-2α, and P4H-TM levels was significantly higher in the MCF-7 group than the other groups. Morever, there was a moderate significant correlation between HIF-1α and HIF-2α levels and between HIF-1α and P4H-TM. P4H-TM may be a novel regulator of hypoxia in BC cells. HIF-1α, a key protein responsible for the molecular mechanism of hypoxia in cells, is a key mediator between P4H-TM and hypoxia in MTX-treated cells.
In chemotherapy, the contribution of dose and duration of use to the type of toxicity should not be ignored. For example, renal toxicity may be prominent in high doses of methotrexate and liver toxicity may be prominent in low dose maintenance therapy (20). In current study, MTX showed a dose-dependent cytotoxic effect on both cells after 24, 48 and 72 hours of incubation on HTERT-HME1 and MCF-7 cells. MTX overdose has complex toxicokinetic and produces myriad clinical features mimicking conditions of lesser severity. Organ dysfunction related to bone marrow, kidney or central nervous system is lifethreatening.
Patient education, regular clinical observation and laboratory monitoring are important to recognize and diagnose overdose at the earliest stage of treatment with MTX (21). Considering that MTX will show a further decrease in cell viability in long-term treatments of 48 and 72 hours, it is predicted that short-term use may be more appropriate. The increase in cell death rates at high doses of MTX and long-term treatments is remarkable. It is estimated that low doses will be more effective for short-term treatments. Although treatment efficacy is important in patients receiving chemotherapy, knowledge and monitoring of treatment-related side effects is at least as important. In addition to the known and predictable side effects associated with chemotherapeutics, the fact that unexpected effects may develop should always be taken into consideration. The impact of timely recognition and rehabilitation of early or late toxicities on treatment outcomes is undeniably clear.
Studies have shown that HIF plays an important role in many cancers such as lung, prostate, breast, endometrium and colon (22-27). In BC, it has been reported that HIF-1 expression is increased and this is associated with poor prognosis (28). However, there are few studies proving the effect of HIF-1α on prognosis in BC. In a retrospective study by Bos et al. (29) HIF-1 α was examined immunohistochemically in BC and normal breast tissue; it was observed that the expression of HIF-1α in positive tumor cells increased as the stage progressed and this rate reached maximum in poorly differentiated invasive carcinomas. In addition, high HIF-1 α levels were statistically significantly associated with increased expression of ER proteins (29). HIF-1α levels have been associated with aggressive tumor nature (30). In other studies on HIF, it has been reported that high HIF values cause poor prognosis, high risk of metastasis and recurrence (31-33). In a retrospective study, Dales et al. (34) observed the effects of HIF-1α expression on survival, local recurrence and distant metastasis in 745 patients with invasive BC and found that high HIF-1 α levels were associated with high metastasis risk, poor survival and early recurrence even in patients with negative lymph nodes. As a result of these observations, the researchers reported that by determining the HIF-1α level before treatment, a step can be taken to select patients who may benefit from specific treatments (34). In current study, HIF-1α and HIF-2α levels was significantly higher in the MCF-7 group than the other groups. In addition, HIF-1α was significantly higher in the cancer cells treated with MTX than in the untreated health breast cell, while there was no significant difference with the groups in HIF-2α levels. Hypoxia is a dysregulation of the homeostatic balance between oxygen delivery and oxygen consumption that causes cells or tissues to lack sufficient oxygen. Although HIF-1α and HIF-2α share a high degree of sequence identity, a similar protein structure and several common targets, they mediate unique patterns of gene regulation. HIF-1α is ubiquitously expressed, whereas HIF-2α is expressed only by certain cell types and tumor types. HIF-1α plays a dominant role in the response to acute hypoxia, while HIF-2α drives the response to chronic hypoxia (35). Li et al. (36) demonstrate that HIF-1α knockdown was found to suppress the shift from S-phase to G(1) induced by hypoxia and increase drug sensitivity to MTX. HIF-1α knockdown reduces tumorigenicity of MCF-7 cells and suggest a promising combination of both anti-HIF-1 strategy and traditional chemotherapy to improve cancer treatment. More comprehensive and in-depth research is required on HIF-1α and HIF-2α the pathways its mediates. Targeted HIF-1a therapeutics will bring new hope to breast cancer patients in the near future.
HIF-1α identified as a substrate for P4H-TM-mediated proline hydroxylation and P4H-TM has been linked to cancer development (15,37). The role of P4H-TM in BC is largely unknown. Since HIF-1, which has been identified as a substrate of P4HTM, is frequently involved in tumor formation and cancer progression, P4HTM may be associated with cancer development. In current study, P4H-TM level was significantly higher in the MCF7 group than in the MTX+MCF-7 cells group and MTX+HTERT-HME1 cells group, but not significantly different from the HTERT-HME1 group. P4H-TM level was also significantly lower in the in the health cells treated with MTX than in the untreated health breast cell. Thus, P4H-TM could have a role in BC. There was a moderate statistically significant correlation between HIF-1 and P4H-TM, while there was no statistically significant correlation between HIF-2 and P4H-TM. P4H-TM, an endoplasmic reticulum enzyme is induced by hypoxia and acts on HIF-alpha (38). In current study, since MTX decreases P4H-TM levels in both breast cancer cells and healthy breast cells, treatment with MTX at the appropriate dose and duration may reduce hypoxia in BC. Further studies are needed to elucidate the mechanism of the relationship between HIF-1 and P4H-TM in BC.
5. Conclusions
The above data support the notion that the dose and duration of MTX, which is used in the treatment of many diseases in clinics, should be adjusted very well. Otherwise, MTX administration may cause serious structural and physiologic disorders in many cells and organs. In conclusion, HIF-1α, HIF-2α, and P4H-TM values may be markers that can be used as a panel to differentiate BC from healthy women. The correlation between HIF-1α and P4H-TM values may indicate that HIF-1α affects tumor progression via P4H-TM. It is thought that these factors can be used in determining prognosis and treatment with the provision of method and group standardization in animal and human studies in this field.
Author Contributions
O.C., S.D., D.D.E., B.P., C.U.A. and H.U. conceptualized and designed this study. D.D.E. and S.D. performed data acquisition. D.D.E. and S.D. performed the statistical analyses. O.C., S.D., D.D.E., B.P., C.U.A. and H.U. drafted the manuscript. All authors finalized the manuscript. O.C., S.D., and H.U. supervised the entire process. All authors have read and agreed to the published version of the manuscript.
Funding
Please add: “This research received no external funding” or “This research was funded by TURKISH MEDICAL ONCOLOGY ASSOCIATION”.
Institutional Review Board Statement
Not applicable.
Data Availability Statement
The data underlying this article are available in the article. If needed, please contact the corresponding author. The email address is seyma_dumur@hotmail.com.
Conflicts of Interest
The authors declare no conflict of interest.
References
- Smolarz B, Nowak AZ, Romanowicz H. Breast Cancer-Epidemiology, Classification, Pathogenesis and Treatment (Review of Literature). Cancers (Basel). 2022;14(10):2569. [CrossRef]
- Emami Nejad A, Najafgholian S, Rostami A, et al. The role of hypoxia in the tumor microenvironment and development of cancer stem cell: a novel approach to developing treatment. Cancer Cell Int. 2021;21(1):62. [CrossRef]
- Sørensen BS, Horsman MR. Tumor Hypoxia: Impact on Radiation Therapy and Molecular Pathways. Front Oncol. 2020;10:562. [CrossRef]
- Bouthelier A, Aragonés J. Role of the HIF oxygen sensing pathway in cell defense and proliferation through the control of amino acid metabolism. Biochim Biophys Acta Mol Cell Res. 2020;1867(9):118733. [CrossRef]
- Luo Z, Tian M, Yang G, et al. Hypoxia signaling in human health and diseases: implications and prospects for therapeutics. Signal Transduct Target Ther. 2022;7(1):218. [CrossRef]
- Yfantis A, Mylonis I, Chachami G, et al. Transcriptional Response to Hypoxia: The Role of HIF-1-Associated Co-Regulators. Cells. 2023;12(5):798. [CrossRef]
- Ghosh R, Samanta P, Sarkar R, et al. Targeting HIF-1α by Natural and Synthetic Compounds: A Promising Approach for Anti-Cancer Therapeutics Development. Molecules. 2022;27(16):5192. [CrossRef]
- Taylor CT, Scholz CC. The effect of HIF on metabolism and immunity. Nat Rev Nephrol. 2022;18(9):573-587. [CrossRef]
- Semenza GL. Hypoxia-inducible factor 1: master regulator of O2 homeostasis. Curr Opin Genet Dev. 1998;8(5):588-594. [CrossRef]
- Chen Z, Han F, Du Y, Shi H, Zhou W. Hypoxic microenvironment in cancer: molecular mechanisms and therapeutic interventions. Signal Transduct Target Ther. 2023;8(1):70. [CrossRef]
- Schwab LP, Peacock DL, Majumdar D, et al. Hypoxia-inducible factor 1α promotes primary tumor growth and tumor-initiating cell activity in breast cancer. Breast Cancer Res. 2012;14(1):R6. [CrossRef]
- Muz B, de la Puente P, Azab F, Azab AK. The role of hypoxia in cancer progression, angiogenesis, metastasis, and resistance to therapy. Hypoxia (Auckl). 2015;3:83-92.
- Myllykoski M, Sutinen A, Koski MK, et al. Structure of transmembrane prolyl 4-hydroxylase reveals unique organization of EF and dioxygenase domains. J Biol Chem. 2021;296:100197. [CrossRef]
- Byts N, Sharma S, Malm T, et al. Inactivation of mouse transmembrane prolyl 4-hydroxylase increases blood brain barrier permeability and ischemia-induced cerebral neuroinflammation. J Biol Chem. 2022;298(3):101721. [CrossRef]
- Gilkes DM, Chaturvedi P Bajpai S, Wong CC, Wei H, Pitcairn S, et al. Collagen prolyl hydroxylases are essential for breast cancer metastasis. Cancer Res. 2013;73(11):3285–96.
- Widemann BC, Adamson PC. Understanding and managing methotrexate nephrotoxicity. Oncologist 2006; 11: 694-703. [CrossRef]
- Bruton L, Chapner B, Knollman B. Goodman & Gilman’s the pharmacological basis of therapeutics. 12 th Edition, USA: The McGraw-Hill Companies, 2011; 1665-771.
- Dogan Z, Duzgun Ergun D, Durmus S, Sahin H, Erkanlı Senturk G, Gelisgen R, Senyigit A, Uzun H. Empagliflozin and sacubitril/valsartan reverse methotrexate cardiotoxicity by repressing oxidative stress and hypoxia in heart embryonic H9c2 cardiomyocytes – the role of morphology of mitochondria observed on electron microscopy. Eur Rev Med Pharmacol Sci. 2023; 27 (9): 3979-3992. [CrossRef]
- Dogan Z, Durmus S, Duzgun Ergun D, Gelisgen R, Uzun H. Ranolazine exhibits anti-inflammatory and antioxidant activities in H9c2 cardiomyocytes Eur Rev Med Pharmacol Sci. 2023; 27 (7): 2953-2963.
- Kurkjian DC ve Ozer H. Management of advers effects of treatment. In:Devita VT, Hellman TS and Rosenberg’s SA (Eds). Cancer, Philadelphia 2008, 8th edition, Chapter 63, p 2617-2638.
- Pannu AK. Methotrexate overdose in clinical practice. Curr Drug Metab. 2019;20(9):714-719. [CrossRef]
- Zhong H, De Marzo AM, Laughner E, Lim M, Hilton DA, Zagzag D, Buechler P, Isaacs WB, Semenza GL, Simons JW. Overexpression of hypoxia-inducible factor 1alpha in common human cancers and their metastases. Cancer Res 1999;59:5830–5.
- Ravi R, Mookerjee B, Bhujwalla ZM, Sutter CH, Artemov D, Zeng Q, Dillehay LE, Madan A, Semenza GL, Bedi A. Regulation of tumor angiogenesis by p53- induced degradation of hypoxia-inducible factor 1alpha. Genes Dev 2000;14:34–44. [CrossRef]
- He et al. HIF-1alfa prognosis in small lung cancer Bos R, Zhong H, Hanrahan CF, Mommers EC, Semenza GL, Pinedo HM, Abeloff MD, Simons JW, van Diest PJ, van der Wall E. Levels of hypoxia-inducible factor-1 alpha during breast carcinogenesis. J Natl Cancer Inst 2001;93:309–14. [CrossRef]
- Bos R, van der Groep P, Greijer AE, Shvarts A, Meijer S, Pinedo HM, Semenza GL, van Diest PJ, van der Wall E. Levels of hypoxia-inducible factor-1alpha independently predict prognosis in patients with lymph node negative breast carcinoma. Cancer. 2003; 97:1573-1581.
- Bos R, Zhong H, Hanrahan CF, Mommers EC, Semenza GL, Pinedo HM, Abeloff MD, Simons JW, van Diest PJ, van der Wall E. Levels of hypoxiainducible factor-1 alpha during breast carcinogenesis. J Natl Cancer Inst 2001;93:309–14. [CrossRef]
- Liu ZJ, Semenza GL, Zhang HF. Hypoxia-inducible factor 1 and breast cancer metastasis. J Zhejiang Univ Sci B. 2015; 16:32-43. [CrossRef]
- Bos R, van der Groep P, Greijer AE, et al. Levels of hypoxia-inducible factor-1alpha independently predict prognosis in patients with lymph node negative breast carcinoma. Cancer. 2003;97(6):1573-1581.
- Bos R, Zhong H, Hanrahan CF, et al. Levels of hypoxia-inducible factor-1 alpha during breast carcinogenesis. J Natl Cancer Inst. 2001;93(4):309-314. [CrossRef]
- Liu ZJ, Semenza GL, Zhang HF. Hypoxia-inducible factor 1 and breast cancer metastasis. J Zhejiang Univ Sci B. 2015; 16:32-43. [CrossRef]
- Ryan HE, Lo J, Johnson RS. HIF-1 alpha is required for solid tumor formation and embryonic vascularization. EMBO J 1998;17:3005–15. [CrossRef]
- Talks KL, Turley H, Gatter KC, et al. The expression and distribution of the hypoxia-inducible factors HIF-1alpha and HIF-2alpha in normal human tissues, cancers, and tumor-associated macrophages. Am J Pathol. 2000;157(2):411-421.
- Semenza GL. HIF-1 and human disease: one highly involved factor.Genes Dev 2000;14:1983–91.
- Dales JP, Garcia S, Meunier-Carpentier S, et al. Overexpression of hypoxia-inducible factor HIF-1alpha predicts early relapse in breast cancer: retrospective study in a series of 745 patients. Int J Cancer. 2005;116(5):734-739. [CrossRef]
- Yu T, Tang B, Sun X. Development of Inhibitors Targeting Hypoxia-Inducible Factor 1 and 2 for Cancer Therapy. Yonsei Med J. 2017;58(3):489-496. [CrossRef]
- Li J, Shi M, Cao Y, et al. Knockdown of hypoxia-inducible factor-1alpha in breast carcinoma MCF-7 cells results in reduced tumor growth and increased sensitivity to methotrexate. Biochem Biophys Res Commun. 2006;342(4):1341-1351. [CrossRef]
- Klotzsche-von Ameln A, Prade i, Grosser M, Kettelhake A, Rezaei M, Chavakis T, et al. PHD4 stimulates tumor angiogenesis in osteosarcoma cells via TGF-α. Mol Cancer Res. 2013;11(11):1337–48. [CrossRef]
- Koivunen P, Tiainen P, Hyvärinen J, et al. An endoplasmic reticulum transmembrane prolyl 4-hydroxylase is induced by hypoxia and acts on hypoxia-inducible factor alpha. J Biol Chem. 2007;282(42):30544-30552. [CrossRef]

Table 1.
Calculated IC50 values (μM) of MTX for HTERT-HME1 and MCF-7 cell lines (n:6).
| Cell Line | 24h | 48h | 72h |
|---|---|---|---|
| MCF-7 | 15.01 ± 0.8 | 10.07 ± 1.3 | 8.01 ± 0.9 |
| HTERT-HME1 | 24.12 ± 0.7 | 16.09 ± 1.2 | 12.08 ± 1.1 |
Table 2.
Comparison of HIF-1, HIF-2, P4H-TM levels between treatment and control groups.
| Breast cancer cell (MCF-7) control | MTX+MCF-7 cells | Health breast cell (HTERT-HME1) control | MTX + HTERT-HME1 cell | p value | |
| HIF-1α (ng/mL) | 3.56±0.4 | 2.88±0.18 | 2.63±0.17 | 2.4±0.19 | <0.001 |
| HIF-2α (ng/mL) | 10.04±0.72 | 9.43±0.43 | 7.32±0.77 | 8.45±0.92 | <0.001 |
| P4H-TM (ng/mL) | 2.35±0.48 | 1.79±0.2 | 1.99±0.08 | 1.52±0.22 | 0.001 |
One-way ANOVA test was applied.
Table 3.
Post-hoc comparison of HIF-1α, HIF-2α, P4H-TM levels between treatment and control groups.
| 1 vs 2 | 1 vs 3 | 1 vs 4 | 2 vs 3 | 2 vs 4 | 3 vs 4 | |
|---|---|---|---|---|---|---|
| HIF-1α (ng/mL) | 0.001 | <0.001 | <0.001 | 0.343 | 0.018 | 0.416 |
| HIF-2α (ng/mL) | 0.482 | <0.001 | 0.006 | <0.001 | 0.131 | 0.062 |
| P4H-TM (ng/mL) | 0.015 | 0.163 | <0.001 | 0.638 | 0.372 | 0.045 |
1: Breast cancer cell (MCF-7) control; 2: MTX+MCF-7 cells; 3: Health breast cell (HTERT-HME1) control; 4: MTX + HTERT-HME1 cell.
Table 4.
The relationship between HIF-1, HIF-2 and P4H-TM levels.
| HIF-2 | P4H-TM | ||
|---|---|---|---|
| HIF-1 | r | 0.595 | 0.441 |
| p value | 0.002 | 0.031 | |
| HIF-2 | r | 0.169 | |
| p value | 0.429 |
Pearson correlation analysis was applied.
Disclaimer/Publisher’s Note: The statements, opinions and data contained in all publications are solely those of the individual author(s) and contributor(s) and not of MDPI and/or the editor(s). MDPI and/or the editor(s) disclaim responsibility for any injury to people or property resulting from any ideas, methods, instructions or products referred to in the content. |
© 2024 by the authors. Licensee MDPI, Basel, Switzerland. This article is an open access article distributed under the terms and conditions of the Creative Commons Attribution (CC BY) license (http://creativecommons.org/licenses/by/4.0/).
Copyright: This open access article is published under a Creative Commons CC BY 4.0 license, which permit the free download, distribution, and reuse, provided that the author and preprint are cited in any reuse.


