
Submitted:
05 June 2024
Posted:
06 June 2024
You are already at the latest version
Abstract
The aim of this study was to investigate the relationship between postprandial glycemic levels based on flash-monitoring and the production of intestinal hydrogen (H2) and methane (CH4) gases based on measurement of the amount of these gases in exhaled air. We studied 14 subjects with type 2 diabetes mellitus (T2DM) and 10 individuals without diabetes (control) with 3 food-load tests with simultaneous determination of gases in exhaled air and assessment of glucose levels. In 15.4% of patients with T2DM, there was a non-significant increase in exhaled H2. How-ever, all subjects in the control group had significant increase in exhaled H2. Moreover, the level of H2 in exhaled breathafter food load in patients with T2DM was lower than in normoglycemic subjects. Also, in normoglycemic subjects there was an inverse correlation between maximum glucose rise and maximum H2 in exhaled air after food load. At the same time in patients with T2DM the level of CH4 in exhaled air directly correlated with the parameters of postprandial glycemia in the test with lactulose. Confirmation of a causal relationship between decreased H2 production, increased intestinal CH4 production, and more severe postprandial glycemia may identify new therapeutic targets in the correction of postprandial glycemia in patients with T2DM.
Keywords:
dietary fiber
; molecular hydrogen
; methane
; type 2 diabetes
; postprandial glucose levels
1. Introduction
The dietary approach in patients with type 2 diabetes mellitus (T2DM) is recognized as an important goal for maintaining optimal glycemic control and reduce the risk of late complications. Dietary fiber (DF) is now an essential component of a healthy diet. According to World Health Organization(WHO) recommendations, the daily dose of DF for adults should be at least 25 g [1]. According to the Academy of Nutrition and Dietetics (USA), the amount of DF per day should be equal to 14 g of fiber per 1000 kcal, which generally corresponds to approximately 25g/day for adult women and 38 g/day for adult men [2]. For patients with T2DM, it is also important to include DF in amounts equivalent to those without T2DM [3].
Recommendations to increase the amount of DF in the diet are driven by the extensive evidence that DF reduces the risk of a range of chronic diseases. For example, DF intake is associated with reduced risk of cardiovascular disease [4], colorectal cancer [5,6], T2DM [7] and obesity [8]. Fiber intake is associated with a reduction in total cholesterol and low-density lipoprotein (LDL) cholesterol.
DF affects the absorption of carbohydrates [9] and contributes to maintaining a healthy intestinal microbiota metabolism by serving as a substrate for its fermentation. This fermentation process yields short-chain fatty acids (SCFAs) [10], which, following upon absorption through the intestinal wall into the bloodstream, exert beneficial effects on human metabolism. These effects include regulating inflammation [11], optimizing the immune response [12], suppressing renin-angiotensin system activity [13], mitigating sympathetic nervous system activity in myocardial reperfusion injuries [14], and reducing levels of total cholesterol, LDL cholesterol while improving high-density lipoprotein cholesterol (HDL) [15].
In addition to the formation of SCFAs, anaerobic fermentation of carbohydrates by the intestinal microbiota initially produces hydrogen (H2) and, in some humans, methane (CH4) [16]. These gases are partially absorbed through the intestinal wall into the blood and eliminated from the body by respiration. Therefore, an increase in the concentration of intestinal gases in exhaled air indicates the beginning of the fermentation process of DF by gut bacteria. This principle underprints basis of the respiratory test for the detection of Small Intestinal Bacterial Overgrowth (SIBO) syndrome [17]. SIBO is characterized by the presence of at least >105 colony-forming units of colonic bacteria per mL of jejunal aspirate [18]. In general, the colonic bacteria in humans produce between 35 and 321 mL of H2 per day [19], and perhaps as high as 12 L/day [20]. The amount of H2in the colon lumen depends on many factors, mainly on the rate of H2 production and the rate of H2 utilization by different representatives of the intestinal microbiota [21]. Thus, methane-producing archaea can metabolize H2 and CO2 [22], resulting in the production of CH4, which can also be determined via breath tests [23]. Therefore, the composition of the intestinal microbiota, in particular the presence of glycolytic bacteria and methane-producing archaea, can be indirectly estimated from the breath test.
H2 has recently been shown to have antioxidant, anti-inflammatory, and antiapoptotic effects [24,25,26]. H2 molecules freely diffuse into cells and neutralize the most reactive oxygen species (ROS), such as hydroxyl radicals and peroxynitrite that in turns reduces the production of proinflammatory molecules and subsequent apoptosis. In contrast, there is little evidence that methanogenic bacteria provide therapeutic effects, and may even be implicated in various adverse effects [27,28,29].
The production of H2 and CH4 depends on the amount and type of DF, which is a heterogeneous group of compounds with different physicochemical properties [30]. This may account for differences in their effects on metabolism in both T2DM patients and normoglycemic subjects. In addition, these differences may be due to phenotypic, genetic, and other characteristics specific to individuals. Currently, along with the recommendation to increase the intake of whole grains, vegetables, and fruits as a source of DF, DF that are produced from natural raw materials are being incorporated into healthy diets to provide more fiber in a small quantities [31]. These include inulin and guar gum [32,33,34]. Their addition makes it possible to saturate the diet with DF and achieve the recommended daily intake of DF.
In the literature available to us, the association between the level of intestinal gases (H2 and CH4) in exhaled air with postprandial glycemia as measured by flash glucose monitoring in patients with T2DM and normoglycemia has not been studied. Therefore, the aim of our study was to evaluate the level of CH4 and H2 in exhaled air in response to the ingestion of different types of food load and the association of these parameters with postprandial glycemia levels.
2. Materials and Methods
Fourteen patients with T2DM and ten individuals without diabetes (control group) were included in the study.
Inclusion criteria for patients with T2DM were: established diagnosis of T2DM, BMI>30 kg/m2, age between 40 and 70 years, acceptable drugs such as those from the groups of SGLT-2i, DPP-4i, metformin, SU derivatives, and willingness and ability to perform all study procedures, signed informed consent.
Exclusion criteria for patients with T2DM were: T1DM, use of short- or ul-tra-short-acting insulin and use of oral sugar-lowering drugs except metformin, SU, SGLT-2i, DPP-4i, gastrointestinal form of autonomic neuropathy.
Inclusion criteria for the control group were age 25-55 years and signed informed consent. Exclusion criteria for the control group were the presence of T1DM, T2DM, obesity or metabolic syndrome.
General exclusion criteria for all study participants were: inflammatory bowel dis-ease, taking antibiotics within 1 month before the study, taking pre- and probiotics within 1 week before the study, taking prokinetics and laxatives, including lactulose within 1 week before the study, having undergone colonoscopy or irrigoscopy within the last 4 weeks before the study, and impaired cognitive abilities.
Twenty-four hours before inclusion in the study, participants were advised to ex-clude foods containing DF from their diet.
The study was approved by the Local Ethic Committee (protocol #5 of 14 April 2022).
During the study, subjects underwent 3 food-load tests with simultaneous deter-mination of gases in exhaled air (performance of hydrogen/methane breath test) and assessment of glucose levels in interstitial fluid. All tests were carried out in the morning hours on an empty stomach, consistently 150 g of boiled buckwheat groats in combination with inulin 30 g, 150 g of boiled buckwheat groats with guar gum 30 g (Optifiber®), lactulose 20 g were used as a food load instead of the usual breakfast. The nutritional load was given from 7:30 to 10:00 am.
Inulin produced in the Netherlands was used in the study (Composition: per 100 g - 90 g fiber, 0 g protein, 0 g fat, 7 g carbohydrates, caloric value - 208 kcal). Guar gum (Optifiber®): extract of Cyamopsis tetraganoloba fruit, manufacturer Nestle Health Science (Deutschland) GmbH, Osthofen (Germany). Lactulose 667 mg/mL (Portalac® syrup), manufacturer Belupo (Republic of Croatia).
For continuous glucose monitoring (CGM), each participant was fitted with a FreeStyleLibre (FSL) sensor at least 2 days before the food-load tests. Patients were trained in the use of the FSL sensor. For adequate data collection, it was recommended to read the sensor using a reader or a smartphone with the FreeStyleLibreLink app installed at least every 8 hours, even outside of the tests. Glucose results were analysed via the LibreView cloud-based monitoring system based on generated reports from compatible FreeStyle glucose monitoring devices. Determination of gases in exhaled air was performed during the hydrogen-methane breath test, a modern non-invasive method for diagnosing gut microflora disorders based on the determination of H2 and CH4 concentration in exhaled air.
The test consisted of collecting exhaled air samples (on an empty stomach and every 20 min after a food load for 3 h: 10 samples per breath test) in aluminized plastic bags (Guangzhou Itingbaby Tech Co., China) from which the air was analysed for hydrogen H2,CH4 and oxygen (O2) on a gas analyser (GastroCH4ECK by Bedfont, UK) no later than 7 days after the breath test and exhaled air sampling. H2 and CH4 concentrations were adjusted for true oxygen content for standardization to alveolar gas levels and presented in ppm (parts per million). Participants, who’s peak CH4 production in exhaled air during the 90 min test was 3 ppm or more, were considered to be PCH4. Participants, who’s peak H2 production in exhaled air during the 90 min test was 20 ppm or more, were considered to be PH2. When concentrations of both gases exceeded cut-off levels (CH4 ≥3 ppm and H2 ≥20 ppm), participants were considered to be PCH4+H2, whereas participants with low gas concentrations (CH4<3 ppm and H2<20 ppm) in the test were regarded as weak CH4 and H2 producers (WPCH4+H2).
Based on A(G) from baseline and duration of its rise after food load, AUСrel(G) was calculated. The amplitude of gases and them tmax after food load were analysed, AUCabs(H2), AUCabs(CH4) was calculated.
Statistical analysis of the results was performed using IBM SPSS Statistics software, version 26 using standard methods of variation statistics. All data are presented as median [quartile1; quartile3] (Me [Q1; Q3]); mean ± standard deviation of the mean (Mean ± SD). Normality of distribution was checked using the Shapiro-Wilk criterion. Comparison of the results of respiratory tests with the frequency of more than 3 measured points was performed using the calculation of AUC. The A(H2), A(CH4) was estimated as the difference between baseline (before DF intake) and the maximum level of the index. Analysis of variance with the Friedman test was used to compare data for dependent samples with non-normal distribution. The Mann-Whitney test was used for intergroup comparison of two independent samples. Nonparametric correlations were calculated using the Spearman rank correlation coefficient, parametric correlations were calculated using the Pearson correlation coefficient.
Differences were considered statistically significant at p<0.05. Since the study was a pilot project, the sample size was not calculated in advance.
3. Results
3.1. Subject Characteristics
This section may be divided by subheadings. It should provide a concise and precise description of the experimental results, their interpretation, as well as the experimental conclusions that can be drawn. The study included 14 patients with T2DM (78.6% female) and 10 controls (90% female). There were 71 food load tests: 41 tests in T2DM patients and 30 tests in the control group, including 23 with lactulose, 24 with guar gum and 24 with inulin. Characteristics of the study participants are presented in Table 1.
Doses and type of glucose-lowering medications therapy in patients with T2DM did not change during the study. The majority of patients received metformin (71.4%), 57.1% - sulfonylurea (SU), 50.0% - sodium-glucose co-transporter type 2 inhibitors (SGLT-2i), 21.4% - dipeptidyl peptidase type 4 inhibitors (DPP-4i), 14.3% - insulin. Statins were received by 42.9% of T2DM patients. Participants in the control group received no medications.
3.2. Gas Production Analysis
Intestinal gas production up to 90 minutes after lactulose administration hardly increased in 46.2% of T2DM patients, while all those in the control group had gas production within 90 min. Based on the character of intestinal gas production before 90 min in the test patients with T2DM, patients were divided into predominantly hydrogen producers (PH2) (30.8%), CH4 andH2 producers (PCH4+H2)(7.6%), or methane producers (PCH4) (15.4%). In the control group these ratios were PH2 (30.0%), PCH4+H2 (60.0%), and PCH4 (10.0%) (Figure 1).
H2 production within 180 minutes after lactulose administration was noted in 84.6 % of T2DM patients (69.2 % of which were PH2) and in all control subjects (70.0% of PCH4+H2 and 30.0% PH2) (Figure 2).
H2 production was maximal on inulin administration in both T2DM patients and controls (Table 2). Specifically,the absolute area under the curve (AUCabs)of H2andthe amplitude (A) of H2were significantly higher on inulin compared to guar gum intake (p<0.05), and on lactulose compared to guar gum intake (p<0.05), with no significant differences between inulin and lactulose intake.
Compared to the control group, the AUCabs(H2) were significantly lower (p<0.05) in patients with T2DM in both the lactulose and inulin tests, but not the guar gum tests.
Thetime to reach maximum levels(tmax) H2after lactulose administration was about 50 min later in T2DM patients compared to the control group (p<0.05). There were no significant differences in tmax H2 between the tests within each of the study groups. The amplitude H2was significantly lower (≈31 ppm) in T2DM group compared to the control group after lactulose intake.
No significant differences in the degree of CH4 increase(as measured by AUCabs(CH4) and A(CH4)) were observed in the T2DM group compared to the control group. However, there was a tendency for greater CH4 elevation in the control group on all types of nutritional loads (Table 2). In the control group, a significant difference was obtained for A(CH4) in the test with lactulose compared with inulin intake (p <0.05).
3.3. Glucose Level Analysis
The glucose curve was analyzed in both groups: amplitude (A(G)), and duration of glucose rise was measured, and the relative area under the glycemic curve(AUCrel(G)) was calculated (Tables 3).
Among all the loading tests, the minimal rise in glucose from baseline and AUCrel(G) were observed on the background of lactulose intake, both in the group of T2DM patients and in the control group, the difference with the intake of DF was significant (Table 3). No significant difference in A(G) after inulin intake with buckwheat and after guar gum intake with buckwheat, as well as in AUCrel(G)between different types of DF added to buckwheat, was obtained in each of the study groups (p>0.05).
There was no significant difference in A(G) and AUCrel(G) after lactulose administration between the patient group and the control group (p>0.05). Upon ingestion of buckwheat with DF, the increase in glycemia was expectedly greater in T2DM patients compared to the control group (p<0.05). AUСrel(G) was significantly higher after taking buckwheat with DF in the group of patients with T2DM compared to the control group (Figure 3).
There was no significant difference in the duration of glucose rise depending on the food load both in the group of patients with T2DM and in the control group, and no statistical difference in the duration of glucose rise between the study groups (p>0.05). However, there was a tendency to a shorter duration of glucose rise after taking buckwheat with DF in the control group compared to the group of patients with T2DM.
There was a direct significant correlation was obtained between A(G) on inulin and on guar gum. For example, in the T2DM group (0.617), p=0.019, in the control group (0.944), p=0.0001 (Figure 4 A,B), as well as between AUCrel(G) on inulin and on guar gum, in the T2DM group (0.582), p=0.029, in the control group (0.806), p=0.005 (Figure 4 C,D).
In addition, in the group of T2DM patients, there is a direct significant correlation between AUCrel(G) on lactulose and on guar gum (0.568), p=0.043, and between the duration of glucose rise on inulin and on lactulose (0.718), p=0.006 (Figure 5). However, there was no correlation between the duration of glucose rise on lactulose and guar gum as well as on inulin and guar gum.
In the group of T2DM patients in the test with lactulose, significant direct correlations were obtained between duration (G) and AUCabs(CH4) (0.707, p<0.01), between AUCrel(G)and AUCabs(CH4) (0.824, p<0.01), as well as between A(G) and AUCabs(CH4) (0.773, p<0.01) (Figure 6A,B,C)). Significant direct correlations were also obtained between AUCrel(G) and AUCabs(CH4) (0.624, p<0.05) in the guar gum test, suggesting a direct association of glucose elevation and CH4 production (Figure 6D). No correlations of H2 elevation with postprandial glucose were found in this group.
In the control group, a direct correlation between A(G) and AUCabs(CH4) (0.646, p < 0.05) was found in the inulin test, confirming the association of CH4 production with greater glucose elevation. In this group, a significant inverse correlation between A(G) and A(H2) (-0.638, p=0.047) was found in the test with gum, that is, a more pronounced rise in H2 was associated with a smaller rise in glucose (Figure 7).
4. Discussion
In recent years, a growing body of evidence has highlighted the key role of the gut microbiota in human health and disease. Its involvement in the regulation of carbohy-drate metabolism, as well as in the prevention of obesity, arterial hypertension, and atherosclerosis has increased significantly [35]. The gut microbiota is nowadays consi-dered as a "virtual organ" [36,37], capable of interacting with many tissues and systems, as well as with the brain. The anaerobic environment of the colon is home to 100 trillion microorganisms [38], more than 1000 microbial species [39], and the number of microbial genes exceeds our own by a factor of 100 [40]. The gut microbiota, by forming metabolites during fermentation of food components, influences systemic inflammation, intestinal permeability, glucose and lipid metabolism, insulin sensitivity and overall energy homeostasis in the body [41]. The state of the intestinal microbiota is altered in the presence of T2DM. Thus, the amount of Bifidobacterium, Bacteroides, Faecalibacterium, Akkermansia and Roseburia has an inverse correlation with T2DM, while Ruminococcus, Fusobacterium and Blautia have a direct correlation [42]. Some microorganisms stimulate the production of anti-inflammatory cytokines and chemokines. Other microbes and their metabolites, such as lipopolysaccharides and trimethylamine-N-oxide, contribute to metabolic endotoxemia, chronic inflammation, and T2DM [43].
Moreover, pathobionts, microorganisms involved in the development of pathological processes, may play a role not only in the pathogenesis of T2DM, but also in type 1 diabetes mellitus (T1DM) [44,45,46]. Two sets of factors are of particular interest. One set includes those that contribute to maintaining an optimal spectrum of microorganisms for preventing metabolic disorders. The other set involves factors that lead to changes in the intestinal microbiota, ultimately resulting in the progression of insulin resistance and systemic inflammation.
Gases released during fermentation of DF by intestinal microorganisms can have an independent effect on metabolic processes in the human body. H2 is a major by-product of the fermentation of food polysaccharides produced by many gut bacteria. Absorbed in the intestine, H2 can have systemic effects and actively influence the state of metabolism. Molecular H2 is known to exert antioxidant effects [46]. In T2DM-mouse model, oral ingestion of H2 water stimulates energy metabolism [47]. The positive therapeutic effect of drinking water enriched with H2 were confirmed in clinical studies on patients with T2DM, obesity, non-alcoholic fatty liver disease, hypertriglyceridemia, etc. [48,49,50]. Perhaps the exogenous administration of molecular H2 is associated with the effect of "substitution therapy" that replenishes H2 deficiency in these pathological conditions.
Another intestinal gas is CH4, which is produced by a group of archaea capable of reducing CO2, methanol, and acetate to CH4, using H2 as an electron donor. CH4 is en-tirely a product of archaea, as it is not produced or utilized by mammalian cells. Elevated concentrations of CH4 in the intestine are associated with diseases such as irritable bowel syndrome with predominant constipation [51], diverticulosis [52], and colorectal cancer [53]. There is also data on the relationship between increased production of CH4 and a decrease in serotonin [54].
DF intake can result in varying responses in individuals, depending on the presence of methane-producing archaea (MetArchs) in the large intestine. People can be classified into different groups: those who release only H2 in exhaled air (indicating the absence of MetArchs), those who predominantly release CH4 (indicating the presence of many MetArchs consuming H2), those who release both CH4 and H2 (with relatively few MetArchs present), and those who do not release significant amounts of H2 and CH4 (indicating poor intestinal flora). CH4 production in exhaled air is observed in approximately one third of the adult population [55], with higher percentage prevalence in women [56]. In our study up to 180 minutes in the test with lactulose, H2 production increased in all control subjects but only in 84.6% of patients with T2DM. In these T2DM patients, isolated production of CH4 was observed in 7.7% of them, and in 7.7% of T2DM patients didn’t produce any significant amounts of either CH4 or H2. However, there among the subjects without T2DM, all of them produced some level of gases. That is, among patients with T2DM there were more people with low H2 production and/or with isolated CH4 production compared to the normoglycemic subjects.
A higher density of the intestinal MetArh population has been previously reported in obese individuals compared with their normal weight peers. Interestingly, it has been reported that there is a decrease in MetArch was observed after bariatric surgery [57].
The large production of CH4 in obese individuals has found its explanation in the hypothesis that interspecies electron transfer of H2 between bacteria and archaea in-creases energy absorption by the large intestine, and this favors weight gain [58]. The H2 taken by MetArch is converted to CH4, and thus does not enter the bloodstream and consequently does not exert antioxidant effects. This in turn increases oxidative stress, which can contribute to obesity [59]. If we consider increased CH4 production as an in-dicator of metabolic disorders and oxidative stress [60,61], H2 synthesis is an indicator of metabolic health andthe state of antioxidant defense.
We found that AUCabs(H2) in T2DM patients was lower on any type of food load compared to AUCabs(H2) in normoglycemic subjects. This may indicate an inverse association between H2 production and glycemic levels and an impaired hydrogen response to food intake in T2DM patients. This finding is further supported by the presence of an inverse correlation in normoglycemic subjects between A(G) and A(H2) in the guar gum test (-0.638, p=0.047), i.e. a more pronounced rise in H2 is associated with a smaller rise in glucose.
Interestingly, the type of DF may influence H2 production. In our study, H2 production after buckwheat porridge with inulin was greater than after the same portion of porridge with guar gum or lactulose.
Although there was no significant difference in postprandial response to inulin and guar gum administration, there were important correlations with CH4 levels. Elevation of CH4 levels correlated directly with postprandial glycemia in the group of T2DM patients: significant direct correlations were obtained between A(G) and AUCabs(CH4) (0.773) (p < 0.001) and duration (G) and AUCabs(CH4) (0.707, p<0.01); AUCrel(G) and AUCabs(CH4) (0.824, p < 0.005) in the lactulose test, suggesting a direct association of glucose elevation and CH4 production.
Study limitation. The median age of the control group was slightly lower compared to a similar figure in T2DM patients. The T2DM patients were on different variants of glucose-lowering medication, which may have influenced the composition of the intes-tinal microbiota and intestinal gas production.
5. Conclusions
To our knowledge, this is the first study to investigate the relationship between postprandial glycemic levels based on flash-monitoring and the production of intestinal H2 and CH4 gases based on measurement of the amount of these gases in exhaled air. In 15.4% of patients with T2DM, there was a non-significant increase in exhaled H2. How-ever, all subjects in the control group had significant increase in exhaled H2. Moreover, the level of H2 in exhaled air after food load in patients with T2DM was lower than in normoglycemic subjects. Also, in normoglycemic subjects there was an inverse correlation between maximum glucose rise and maximum H2 in exhaled air after food load. At the same time in patients with T2DM the level of CH4 in exhaled air directly correlated with the parameters of postprandial glycemia in the test with lactulose. The obtained data may indicate the existence of a relationship between the level of intestinal gases and postprandial glycaemia. Further study of the relationship between intestinal gas production and postprandial glycaemia in patients with T2DM in a larger sample and on different types of sugar-lowering therapy is needed. Confirmation of a causal relation-ship between decreased H2 production, increased intestinal CH4 production and more severe postprandial glycemia may identify new therapeutic targets in the correction of postprandial glycemia in patients with T2DM.
Author Contributions
Conceptualization, I.M. and O.M.; methodology, I.M. and O.M.; formal analysis, Y.K. and O.P.; investigation, Y.K., O.P. and S.S.; writing—original draft preparation,I.M.,Y.K., O.P., S.S. and T.W.L.; reviewing and editing final draft, I.M.,Y.K., O.P., S.S. and T.W.L.; visualization, Y.K., O.P. and S.S.; supervision, I.M. and O.M. All authors have read and agreed to the published version of the manuscript.
Funding
This research received no external funding.
Institutional Review Board Statement
The study was conducted in accordance with the Declaration of Helsinki, and approved by Ethics Committee of Moscow Regional Research and Clinical Institute by M.F.Vladimirski (protocol code 5 of 14 April 2022).
Informed Consent Statement
Informed consent was obtained from all subjects involved in the study.
Data Availability Statement
We encourage all authors of articles published in MDPI journals to share their research data. In this section, please provide details regarding where data supporting reported results can be found, including links to publicly archived datasets analyzed or generated during the study. Where no new data were created, or where data is unavailable due to privacy or ethical restrictions, a statement is still required. Suggested Data Availability Statements are available in section “MDPI Research Data Policies” at https://www.mdpi.com/ethics.
Acknowledgments
This review was performed under the State Assignment of Lomonosov Moscow State University.
Conflicts of Interest
The authors declare no conflicts of interest.
References
- World Health Organisation. WHO updates guidelines on fats and carbohydrates. Available online: https://www.who.int/news/item/17-07-2023-who-updates-guidelines-on-fats-and-carbohydrates (accessed on 4 June 2024).
- Dahl, W.J.; Stewart, M.L. Position of the Academy of Nutrition and Dietetics: Health Implications of Dietary Fiber. J. Acad. Nutr. Diet. 2015, 115, 1861–1870. [Google Scholar] [CrossRef] [PubMed]
- ElSayed, N.A.; Aleppo, G.; Aroda, V.R.; Bannuru, R.R.; Brown, F.M.; Bruemmer, D.; Collins, B.S.; Hilliard, M.E.; Isaacs, D.; Johnson, E.L.; et al. 5. Facilitating Positive Health Behaviors and Well-being to Improve Health Outcomes: Standards of Care in Diabetes-2023. Diabetes Care 2023, 46, 68–96. [Google Scholar] [CrossRef] [PubMed]
- Soliman, G.A. Dietary Fiber, Atherosclerosis, and Cardiovascular Disease. Nutrients. 2019, 11, 1155. [Google Scholar] [CrossRef] [PubMed] [PubMed Central]
- O'Keefe, S.J. Diet, microorganisms and their metabolites, and colon cancer. Nat Rev Gastroenterol Hepatol. 2016, 13, 691–706. [Google Scholar] [CrossRef] [PubMed] [PubMed Central]
- Zhou, E.; Rifkin, S. Colorectal Cancer and Diet: Risk Versus Prevention, Is Diet an Intervention? Gastroenterol Clin North Am. 2021, 50, 101–111. [Google Scholar] [CrossRef] [PubMed]
- Xiao, M.; Jia, X.; Wang, N.; Kang, J.; Hu, X.; Goff, H.D.; Cui, S.W.; Ding, H.; Guo, Q. Therapeutic potential of non-starch polysaccharides on type 2 diabetes: from hypoglycemic mechanism to clinical trials. Crit Rev Food Sci Nutr. 2024, 64, 1177–1210. [Google Scholar] [CrossRef] [PubMed]
- Tian, S.; Chu, Q.; Ma, S.; Ma, H.; Song, H. Dietary Fiber and Its Potential Role in Obesity: A Focus on Modulating the Gut Microbiota. J Agric Food Chem. 2023, 71, 14853–14869. [Google Scholar] [CrossRef] [PubMed]
- Singh, P.; Tuck, C.; Gibson, P.R.; Chey, W.D. The Role of Food in the Treatment of Bowel Disorders: Focus on Irritable Bowel Syndrome and Functional Constipation. Am J Gastroenterol. 2022, 117, 947–957. [Google Scholar] [CrossRef] [PubMed] [PubMed Central]
- Karppinen, S.; Liukkonen, K.; Aura, A.-M.; Forssell, P.; Poutanen, K. In Vitro fermentation of polysaccharides of rye, wheat and oat brans and inulin by human faecalbacteria. J.Sci.Food Agric. 2000, 80, 1469–1476. [Google Scholar] [CrossRef]
- Li, M.; van Esch, B.C.A.M.; Wagenaar, G.T.M.; Garssen, J.; Folkerts, G.; Henricks, P.A.J. Pro- and anti-inflammatory effects of short chain fatty acids on immune and endothelial cells. Eur J Pharmacol. 2018, 831, 52–59. [Google Scholar] [CrossRef] [PubMed]
- Losol, P.; Wolska, M.; Wypych, T.P.; Yao, L.; O'Mahony, L.; Sokolowska, M. A cross talk between microbial metabolites and host immunity: Its relevance for allergic diseases. Clin Transl Allergy. 2024, 14, e12339. [Google Scholar] [CrossRef] [PubMed]
- Wang, L.; Zhu, Q.; Lu, A.; Liu, X.; Zhang, L.; Xu, C.; Liu, X.; Li, H.; Yang, T. Sodium butyrate suppresses angiotensin II-induced hypertension by inhibition of renal (pro)renin receptor and intrarenal renin-angiotensin system. J Hypertens. 2017, 35, 1899–1908. [Google Scholar] [CrossRef]
- Yu, Z.; Han, J.; Chen, H.; Wang, Y.; Zhou, L.; Wang, M.; Zhang, R.; Jin, X.; Zhang, G.; Wang, C.; Xu, T.; Xie, M.; Wang, X.; Zhou, X.; Jiang, H. Oral Supplementation With Butyrate Improves Myocardial Ischemia/Reperfusion Injury via a Gut-Brain Neural Circuit. Front Cardiovasc Med. 2021, 23, 718674. [Google Scholar] [CrossRef]
- Haghikia, A.; Zimmermann, F.; Schumann, P.; Jasina, A.; Roessler, J.; Schmidt, D.; Heinze, P.; Kaisler, J.; Nageswaran, V.; Aigner, A.; Ceglarek, U.; Cineus, R.; Hegazy, A.N.; van der Vorst, E.P.C.; Döring, Y.; Strauch, C.M.; Nemet, I.; Tremaroli, V.; Dwibedi, C.; Kränkel, N.; Leistner, D.M.; Heimesaat, M.M.; Bereswill, S.; Rauch, G.; Seeland, U.; Soehnlein, O.; Müller, D.N.; Gold, R.; Bäckhed, F.; Hazen, S.L.; Haghikia, A.; Landmesser, U. Propionate attenuates atherosclerosis by immune-dependent regulation of intestinal cholesterol metabolism. Eur Heart J., 2022, 43, 518–533. [Google Scholar] [CrossRef]
- Vernia, P.; Di Camillo, M.; Marinaro, V.; Caprilli, R. Effect of predominant methanogenic flora on the outcome of lactose breath test in irritable bowel syndrome patients. Eur J ClinNutr., 2003, 57, 1116–1119. [Google Scholar] [CrossRef]
- Hammer, H.F.; Fox, M.R.; Keller, J.; Salvatore, S.; Basilisco, G.; Hammer, J.; Lopetuso, L.; Benninga, M.; Borrelli, O.; Dumitrascu, D.; Hauser, B.; Herszenyi, L.; Nakov, R.; Pohl, D.; Thapar, N.; Sonyi, M. European H2-CH4-breath test group. European guideline on indications, performance, and clinical impact of hydrogen and methane breath tests in adult and pediatric patients: European Association for Gastroenterology, Endoscopy and Nutrition, European Society of Neurogastroenterology and Motility, and European Society for Peadiatric Gastroenterology Hepatology and Nutrition consensus. United European Gastroenterol J. 2022, 10, 15–40. [Google Scholar] [CrossRef] [PubMed] [PubMed Central]
- Rezaie, A.; Buresi, M.; Lembo, A.; Lin, H.; McCallum, R.; Rao, S.; et al. Hydrogen and methane-based breath testing in gastrointestinal disorders: the North American Consensus. Am J Gastroenterol. 2017, 112, 775–784. [Google Scholar] [CrossRef] [PubMed] [PubMed Central]
- Levitt, M.D. Production and excretion of hydrogen gas in man. N. Engl. J. Med. 281, 122–127. [CrossRef]
- Strocchi, A.; Levitt, M.D. Maintaining intestinal H2 balance: credit the colonic bacteria. Gastroenterology. 1992, 102, 1424–1426. [Google Scholar] [CrossRef]
- Phillip, B. Hylemon; Spencer, C. Harris; Jason, M. Ridlon. Metabolism of hydrogen gases and bile acids in the gut microbiome. Prague Special Issue. 2018, 592, 2070–2082. [Google Scholar] [CrossRef] [PubMed]
- Pimentel, M.; Saad, R.J.; Long, M.D.; Rao, S.S.C. ACG Clinical Guideline: Small Intestinal Bacterial Overgrowth. Am J Gastroenterol. 2020, 115, 165–178. [Google Scholar] [CrossRef] [PubMed]
- Costa, K.C.; Leigh, J.A. Metabolic versatility in methanogens. CurrOpinBiotechnol. 2014, 29, 70–75. [Google Scholar] [CrossRef] [PubMed]
- Barancik, M.; Kura, B.; LeBaron, T.W.; et al. Molecular and cellular mechanisms associ//ated with effects of molecuar hydrogen in cardiovascular and central nervous systems. Antioxidants (Basel) 2020, 9, 1281. [Google Scholar] [CrossRef] [PubMed]
- Medvedev, O.S. Role of human and animal microbiome’s hydrogen and methane in an antioxidant organism defense. Uspekhisovremennoybiologii. 2022, 142, 349–364. [Google Scholar] [CrossRef]
- Ohsawa, I.; Ishikawa, M.; Takahashi, K.; Watanabe, M.; Nishimaki, K.; Yamagata, K.; et al. Hydrogen acts as a therapeutic antioxidant by selectively reducing cytotoxic oxygen radicals. Nat Med. 2007, 13, 688–694. [Google Scholar] [CrossRef] [PubMed]
- Boros, M.; Keppler, F. Methane Production and Bioactivity-A Link to Oxido-Reductive Stress. Front Physiol. 2019, 10, 1244. [Google Scholar] [CrossRef] [PubMed] [PubMed Central]
- Ernst, L.; Steinfeld, B.; Barayeu, U.; Klintzsch, T.; Kurth, M.; Grimm, D.; Dick, T.P.; Rebelein, J.G.; Bischofs, I.B.; Keppler, F. Methane formation driven by reactive oxygen species across all living organisms. Nature. 2022, 603, 482–487. [Google Scholar] [CrossRef] [PubMed]
- Keppler, F.; Boros, M.; Polag, D. Radical-Driven Methane Formation in Humans Evidenced by Exogenous Isotope-Labeled DMSO and Methionine. Antioxidants (Basel). 2023, 12, 1381. [Google Scholar] [CrossRef]
- Ivanova, A.Y.; Shirokov, I.V.; Toshchakov, S.V.; Kozlova, A.D.; Obolenskaya, O.N.; Mariasina, S.S.; Ivlev, V.A.; Gartseev, I.B.; Medvedev, O.S. Effects of Coenzyme Q10 on the Biomarkers (Hydrogen, Methane, SCFA and TMA) and Composition of the Gut Microbiome in Rats. Pharmaceuticals (Basel). 2023, 16, 686. [Google Scholar] [CrossRef]
- World Health Organization. Carbohydrate intake for adults and children: WHO guideline summary. 2023. Available online: https://www.who.int/publications/i/item/9789240073593 (accessed on 4 June 2024).
- Qin, Y.Q.; Wang, L.Y.; Yang, X.Y.; Xu, Y.J.; Fan, G.; Fan, Y.G.; Ren, J.N.; An, Q.; Li, X. Inulin: properties and health benefits. Food Funct. 2023, 14, 2948–2968. [Google Scholar] [CrossRef] [PubMed]
- Zhang, S.; Meng, G.; Zhang, Q.; Liu, L.; Yao, Z.; Wu, H.; Gu, Y.; Wang, Y.; Zhang, T.; Wang, X.; Zhang, J.; Sun, S.; Wang, X.; Zhou, M.; Jia, Q.; Song, K.; Qi, L.; Niu, K. Dietary fibre intake and risk of prediabetes in China: results from the Tianjin Chronic Low-grade Systemic Inflammation and Health (TCLSIH) Cohort Study. Br J Nutr. 2022, 128, 753–761. [Google Scholar] [CrossRef] [PubMed]
- Yu, X.; Gurry, T.; Nguyen, L.T.T.; Richardson, H.S.; Alm, E.J. Prebiotics and Community Composition Influence Gas Production of the Human Gut Microbiota. mBio. 2020, 11, e00217–20. [Google Scholar] [CrossRef] [PubMed] [PubMed Central]
- Armet, A.M.; Deehan, E.C.; O'Sullivan, A.F.; Mota, J.F.; Field, C.J.; Prado, C.M.; Lucey, A.J.; Walter, J. Rethinking healthy eating in light of the gut microbiome. Cell Host Microbe. 2022, 30, 764–785. [Google Scholar] [CrossRef] [PubMed]
- O'Hara, A.M.; Shanahan, F. The gut flora as a forgotten organ. EMBO. 2016, 7, 688–693. [Google Scholar] [CrossRef] [PubMed]
- Luqman, A.; Hassan, A.; Ullah, M.; Naseem, S.; Ullah, M.; Zhang, L.; Din, A.U.; Ullah, K.; Ahmad, W.; Wang, G. Role of the intestinal microbiome and its therapeutic intervention in cardiovascular disorder. Front Immunol. 2024, 15, 1321395. [Google Scholar] [CrossRef] [PubMed]
- Thursby, E.; Juge, N. Introduction to the human gut microbiota. Biochem. J. 2017, 474, 1823–1836. [Google Scholar] [CrossRef] [PubMed]
- Sender, R.; Fuchs, S.; Milo, R. Revised estimates for the number of human and bacteria cells in the body. PloS Biol. 2016, 14, e1002533. [Google Scholar] [CrossRef] [PubMed]
- Valdes, A.M.; Walter, J.; Segal, E.; Spector, T.D. Role of the gut microbiota in nutrition and health. BMJ. 2018, 361, 36–44. [Google Scholar] [CrossRef]
- Wen, Y.; Sun, Z.; Xie, S.; Hu, Z.; Lan, Q.; Sun, Y.; et al. Intestinal flora derived metabolites affect the occurrence and development of cardiovascular disease. J Multidiscip Healthcare 2022, 5, 2591–2603. [Google Scholar] [CrossRef]
- Gurung, M.; Li, Z.; You, H.; Rodrigues, R.; Jump, D.B.; Morgun, A.; Shulzhenko, N. Role of gut microbiota in type 2 diabetes pathophysiology. EBioMedicine. 2020, 51, 102590. [Google Scholar] [CrossRef] [PubMed] [PubMed Central]
- Shan, Z.; Sun, T.; Huang, H.; Chen, S.; Chen, L.; Luo, C.; Yang, W.; Yang, X.; Yao, P.; Cheng, J.; Hu, F.B.; Liu, L. Association between microbiota-dependent metabolite trimethylamine-N-oxide and type 2 diabetes. Am J Clin Nutr. 2017, 106, 888–894. [Google Scholar] [CrossRef] [PubMed]
- Ruze, R.; Liu, T.; Zou, X.; Song, J.; Chen, Y.; Xu, R.; Yin, X.; Xu, Q. Obesity and type 2 diabetes mellitus: connections in epidemiology, pathogenesis, and treatments. Front. Endocrinol. 2023, 14, 1161521. [Google Scholar] [CrossRef] [PubMed]
- Del Chierico, F.; Rapini, N.; Deodati, A.; Matteoli, M.C.; Cianfarani, S.; Putignani, L. Pathophysiology of Type 1 Diabetes and Gut Microbiota Role. Int J Mol Sci. 2022, 23, 14650. [Google Scholar] [CrossRef] [PubMed]
- Tian, Y.; Zhang, Y.; Wang, Y.; Chen, Y.; Fan, W.; Zhou, J.; Qiao, J.; Wei, Y. Hydrogen, a Novel Therapeutic Molecule, Regulates Oxidative Stress, Inflammation, and Apoptosis. Front. Physiol. 2021, 12, 789507. [Google Scholar] [CrossRef]
- Kamimura, N.; Nishimaki, K.; Ohsawa, I.; Ohta, S. Molecular hydrogen improves obesity and diabetes by inducing hepatic FGF21 and stimulating energy metabolism in db/db mice. Obesity (Silver Spring). 2011, 19, 1396–403. [Google Scholar] [CrossRef] [PubMed]
- LeBaron, T.W.; Singh, R.B.; Fatima, G.; Kartikey, K.; Sharma, J.P.; Ostojic, S.M.; Slezak, J. The Effects of 24-Week, High-Concentration Hydrogen-Rich Water on Body Composition, Blood Lipid Profiles and Inflammation Biomarkers in Men and Women with Metabolic Syndrome: A Randomized Controlled Trial. Diabetes, Metabolic Syndrome and Obesity. 2020, 13, 889–896. [Google Scholar] [CrossRef]
- Kura, B.; Szantova, M.; LeBaron, T.W.; Mojto, V.; Barancik, M.; SzeiffovaBacova, B.; Kalocayova, B.; Sykora, M.; Okruhlicova, L.; Tribulova, N.; et al. Biological Effects of Hydrogen Water on Subjects with NAFLD: A Randomized, Placebo-Controlled Trial. Antioxidants. 2022, 11, 1935. [Google Scholar] [CrossRef]
- SKajiyama, S.; Hasegawa, G.; Asano, M.; Hosoda, H.; Fukui, M.; Nakamura, N.; Kitawaki, J.; Imai, S.; Nakano, K.; Ohta, M.; Adachi, T.; Obayashi, H.; Yoshikawa, T. Supplementation of hydrogen-rich water improves lipid and glucose metabolism in patients with type 2 diabetes or impaired glucose tolerance. Nutrition Research. 2008, 28, 137–143. [Google Scholar] [CrossRef]
- Bin Waqar, S.H.; Rehan, A. Methane and Constipation-predominant Irritable Bowel Syndrome: Entwining Pillars of Emerging Neurogastroenterology. Cureus. 2019, 11, e4764. [Google Scholar] [CrossRef] [PubMed] [PubMed Central]
- Yazici, C.; Arslan, D.C.; Abraham, R.; Cushing, K.; Keshavarzian, A.; Mutlu, E.A. Breath Methane Levels Are Increased Among Patients with Diverticulosis. Dig Dis Sci. 2016, 61, 2648–2654. [Google Scholar] [CrossRef] [PubMed] [PubMed Central]
- Dharmawardana, N.; Goddard, T.; Woods, C.; Watson, D.I.; Butler, R.; Ooi, E.H.; Yazbeck, R. Breath methane to hydrogen ratio as a surrogate marker of intestinal dysbiosis in head and neck cancer. Sci Rep. 2020, 10, 15010. [Google Scholar] [CrossRef] [PubMed] [PubMed Central]
- Pimentel, M.; Kong, Y.; Park, S. IBS subjects with methane on lactulose breath test have lower postprandial serotonin levels than subjects with hydrogen. Dig Dis Sci. 2004, 49, 84–87. [Google Scholar] [CrossRef]
- Keppler, F.; Schiller, A.; Ehehalt, R.; Greule, M.; Hartmann, J.; Polag, D. Stable isotope and high precision concentration measurements confirm that all humans produce and exhale methane. J Breath Res. 2016, 10, 16003. [Google Scholar] [CrossRef]
- Peled, Y.; Gilat, T.; Liberman, E.; et al. The development of methane production in childhood and adolescence. J Pediatr Gastroenterol Nutr. 1985, 4, 575–579. [Google Scholar] [CrossRef]
- DiBaise, J.K.; Zhang, H.; Crowell, M.D.; Krajmalnik-Brown, R.; Decker, G.A.; Rittmann, B.E. Gut microbiota and its possible relationship with obesity. Mayo Clin Proc. 2008, 83, 460–469. [Google Scholar] [CrossRef]
- Million, M.; Tidjani Alou, M.; Khelaifia, S.; Bachar, D.; Lagier, J.-C.; Dione, N.; Brah, S.; Hugon, P.; Lombard, V.; Armougom, F.; Fromonot, J.; Robert, C.; Michelle, C.; Diallo, A.; Fabre, A.; Guieu, R.; Sokhna, C.; Henrissat, B.; Parola, P.; Raoult, D. Increased gut redox and depletion of anaerobic and methanogenic prokaryotes in severe acute malnutrition. Sci Rep. 2016, 6, 26051. [Google Scholar] [CrossRef]
- Heindel, J.J.; Lustig, R.H.; Howard, S.; et al. Obesogens: a unifying theory for the global rise in obesity. Int J Obes. 2024, 48, 449–460. [Google Scholar] [CrossRef] [PubMed] [PubMed Central]
- Cesario, V.; Di Rienzo, T.A.; Campanale, M.; D'angelo, G.; Barbaro, F.; Gigante, G.; Vitale, G.; Scavone, G.; Pitocco, D.; Gasbarrini, A.; Ojetti, V. Methane intestinal production and poor metabolic control in type I diabetes complicated by autonomic neuropathy. Minerva Endocrinol. 2014, 39, 201–7. [Google Scholar] [PubMed]
- Zhang, M.; Xu, Y.; Zhang, J.; Sun, Z.; Ban, Y.; Wang, B.; Hou, X.; Cai, Y.; Li, J.; Wang, M.; Wang, W. Application of methane and hydrogen-based breath test in the study of gestational diabetes mellitus and intestinal microbes. Diabetes Res Clin Pract. 2021, 176, 108818. [Google Scholar] [CrossRef] [PubMed]
Figure 1.
Distribution of study participants depending on the release of H2 and CH4 during a lactulose breath test (up to 90 minutes of the test). PCH4 – methane release ≥ 3 ppm; PH2 hydrogen release ≥ 20 ppm; PCH4+/H2+ simultaneous release of methane ≥ 3 ppm and hydrogen ≥ 20 ppm; PCH4-/H2- – methane release <3 ppm, hydrogen <20 ppm.
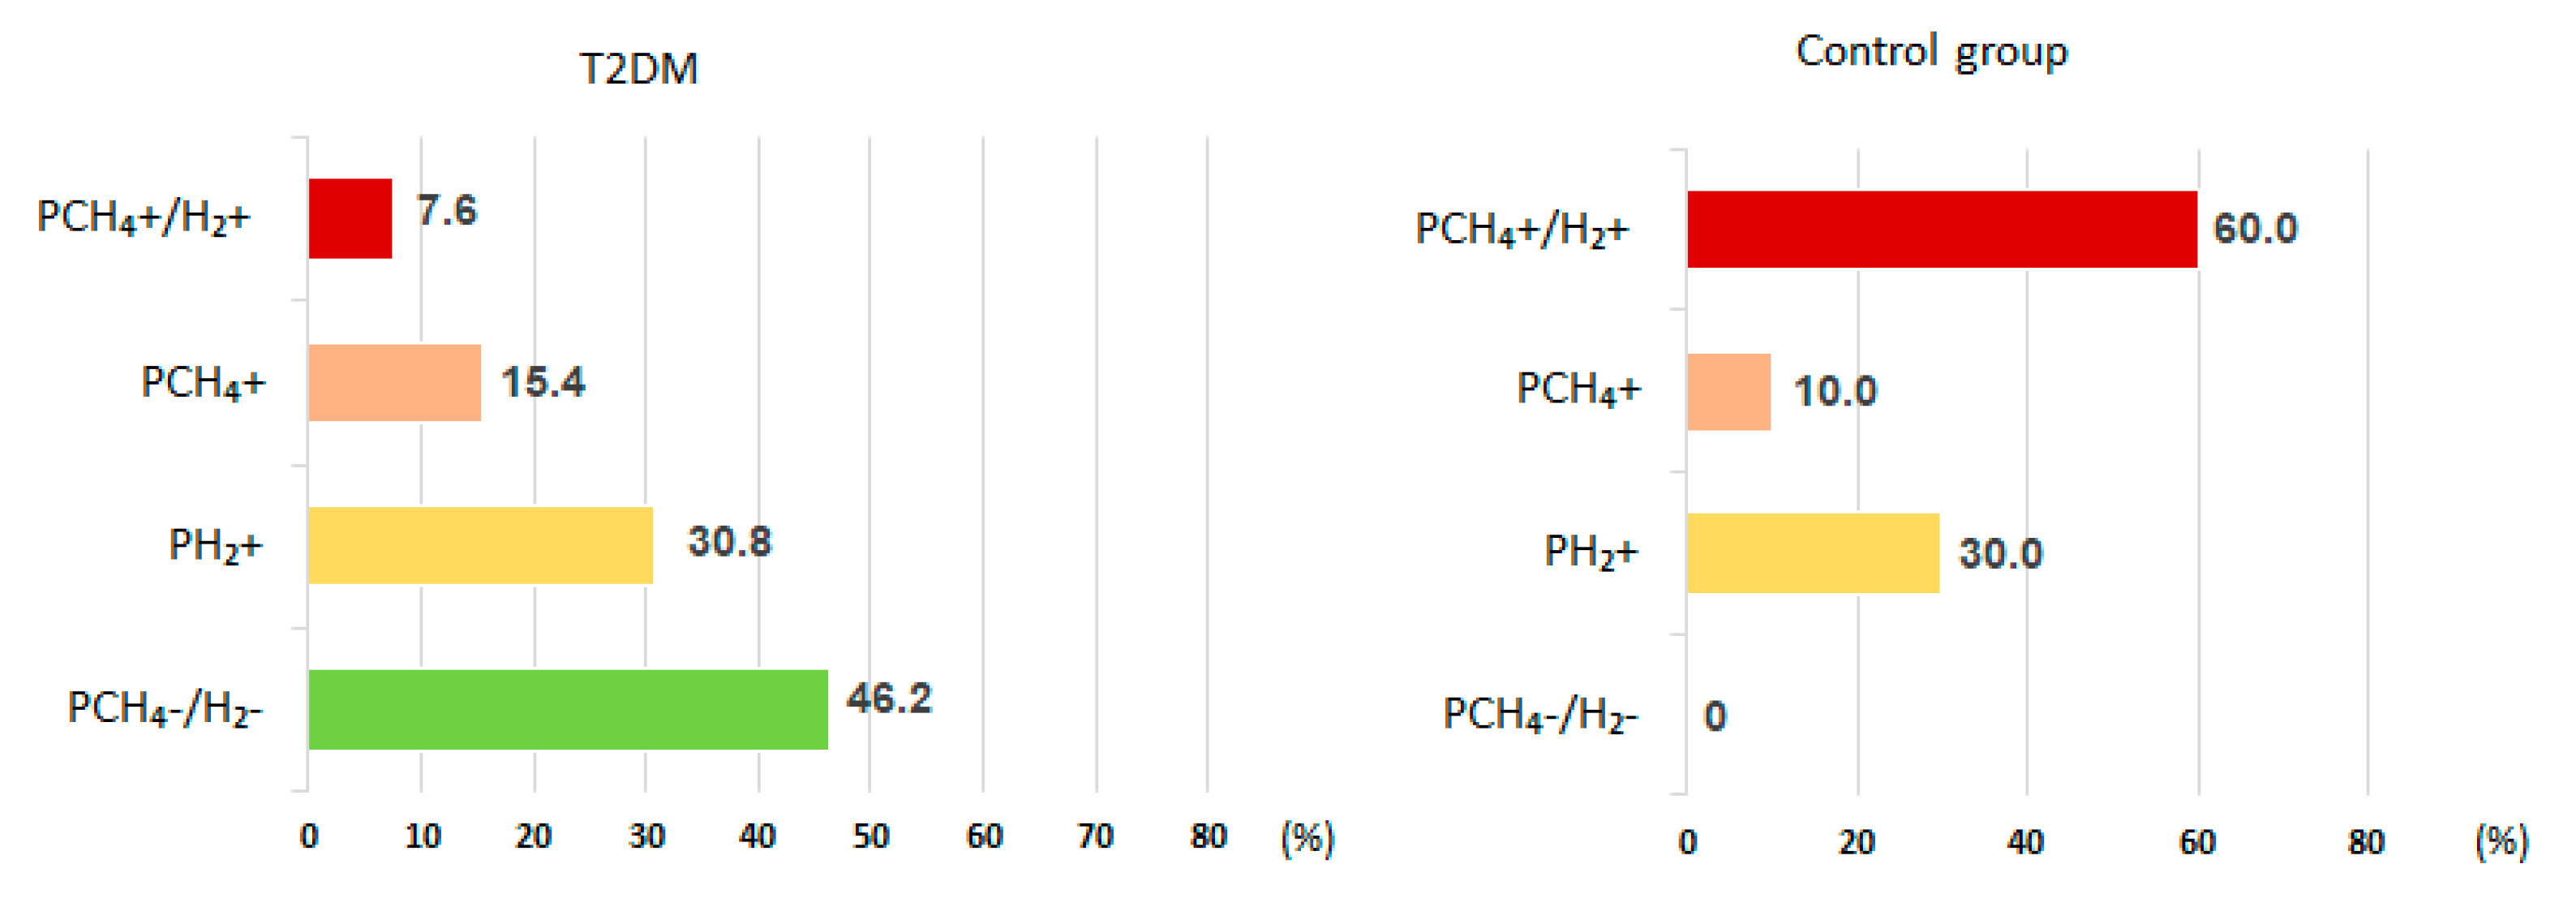
Figure 2.
Distribution of participants in the study group and the control group depending on the release of H2 and CH4 during a breath test.PCH4 – methane release ≥ 3 ppm; PH2 hydrogen release ≥ 20 ppm; PCH4+/H2+ simultaneous release of methane ≥ 3 ppm and hydrogen ≥ 20 ppm; PCH4-/H2- – methane release <3 ppm, hydrogen <20 ppm.
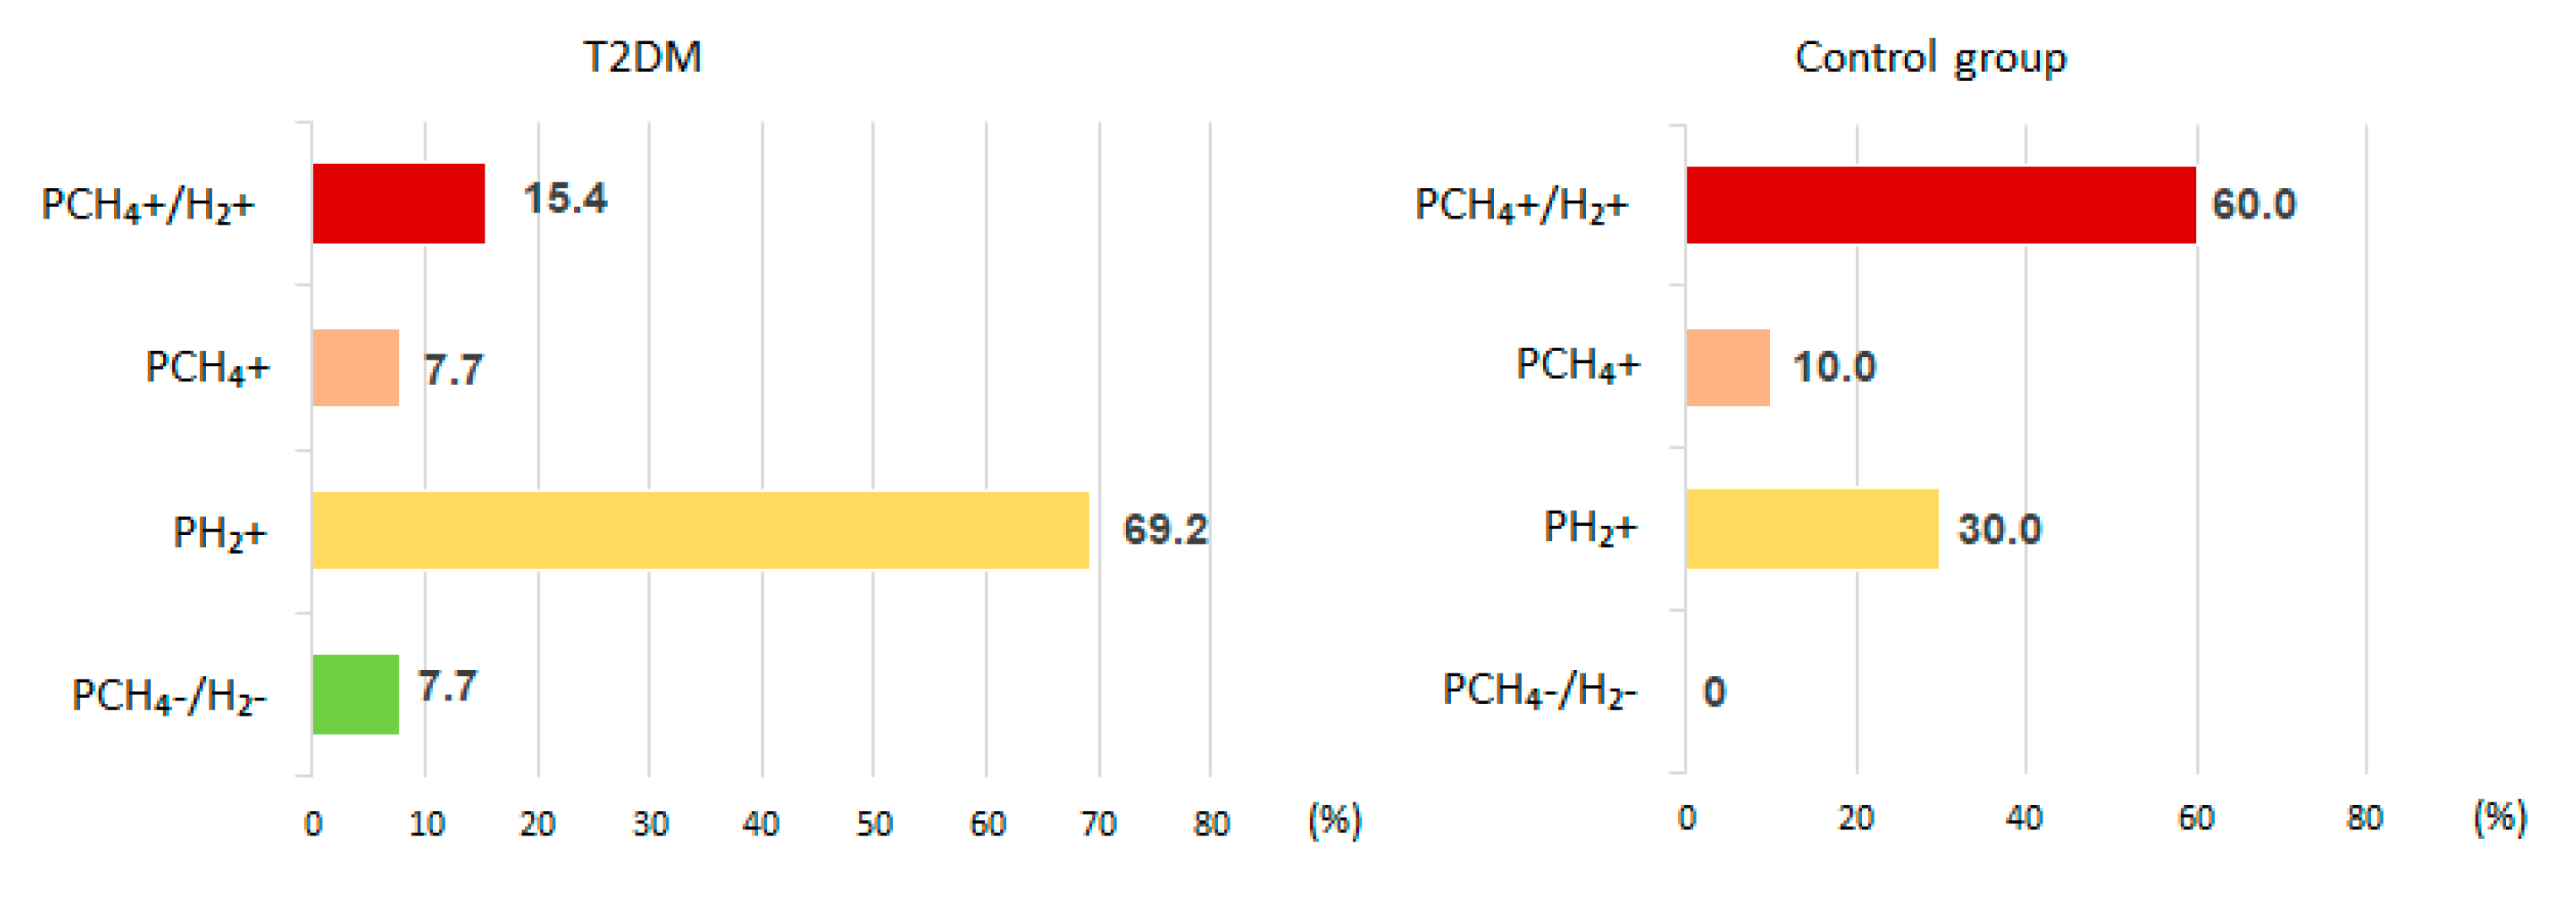
Figure 3.
Relative area under the glycemic curve [AUCrel(G) (mM*min from 0 to 180 min)] during the test.
Figure 3.
Relative area under the glycemic curve [AUCrel(G) (mM*min from 0 to 180 min)] during the test.
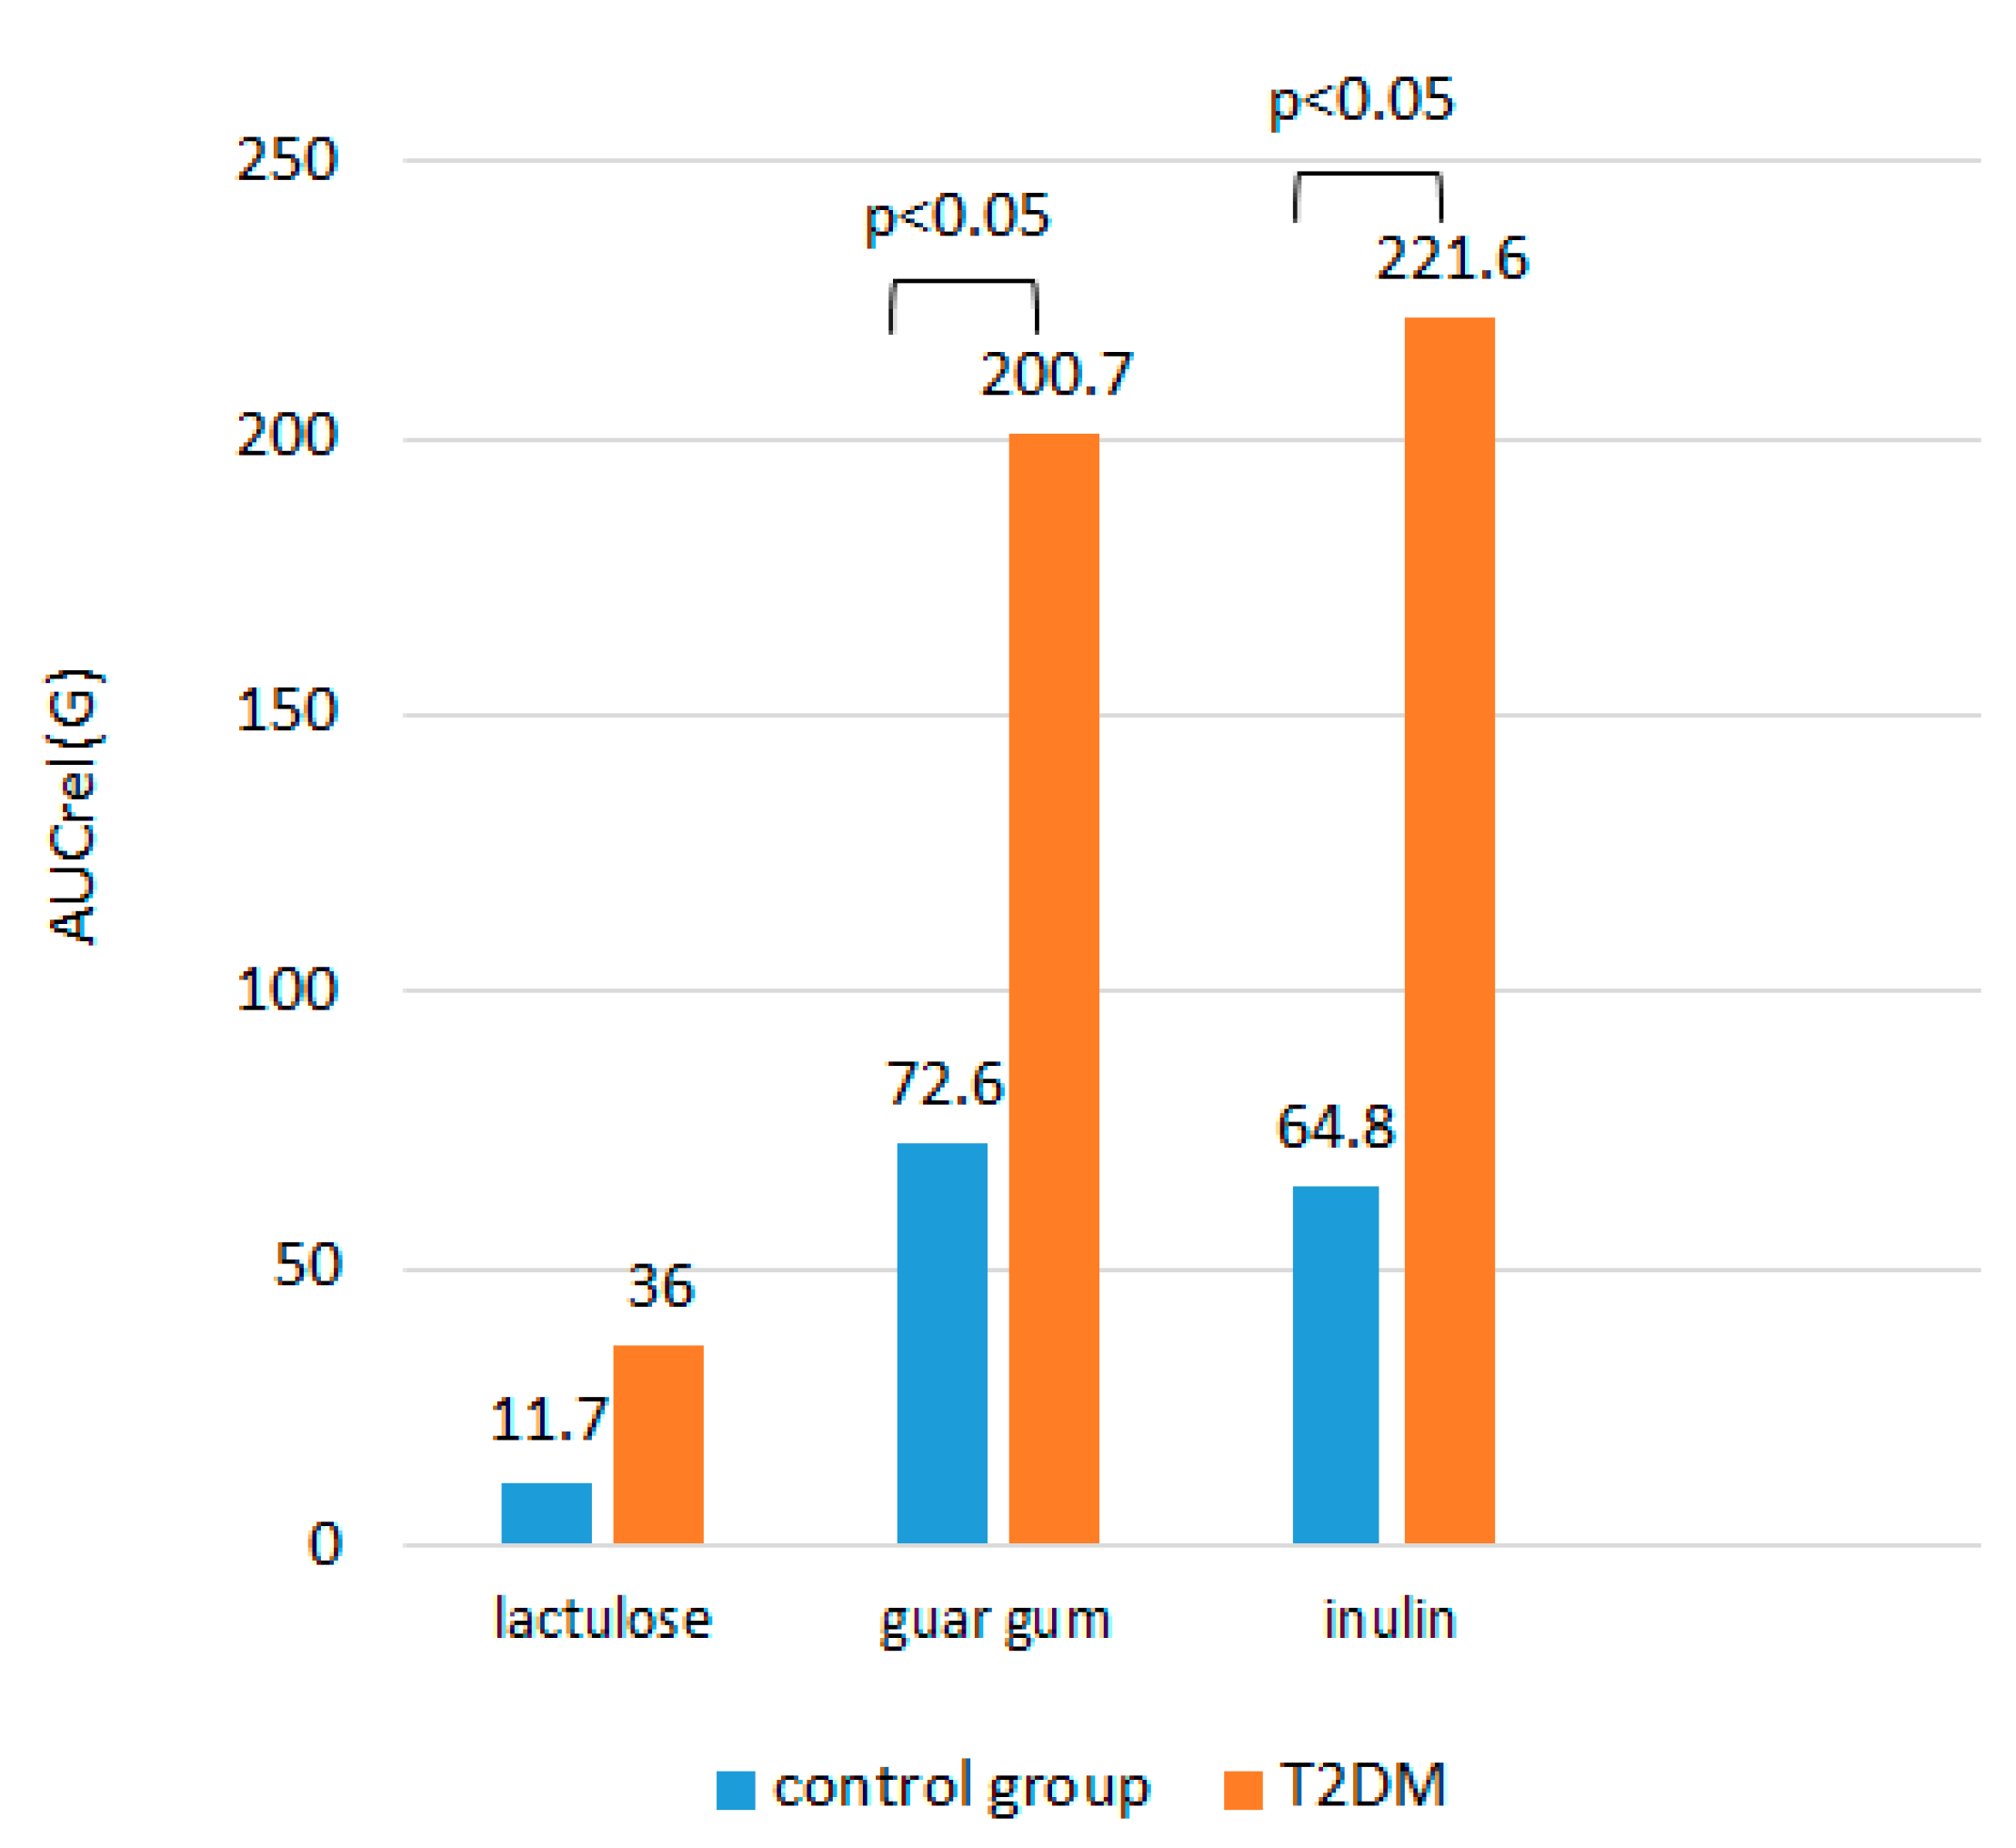
Figure 4.
Correlation between A(G) on inulin and on guar gum in the T2DM group (a) and in the control group (b); and correlation between AUCrel(G) on inulin and on guar gum in the T2DM group (c) and in the control group (d).
Figure 4.
Correlation between A(G) on inulin and on guar gum in the T2DM group (a) and in the control group (b); and correlation between AUCrel(G) on inulin and on guar gum in the T2DM group (c) and in the control group (d).
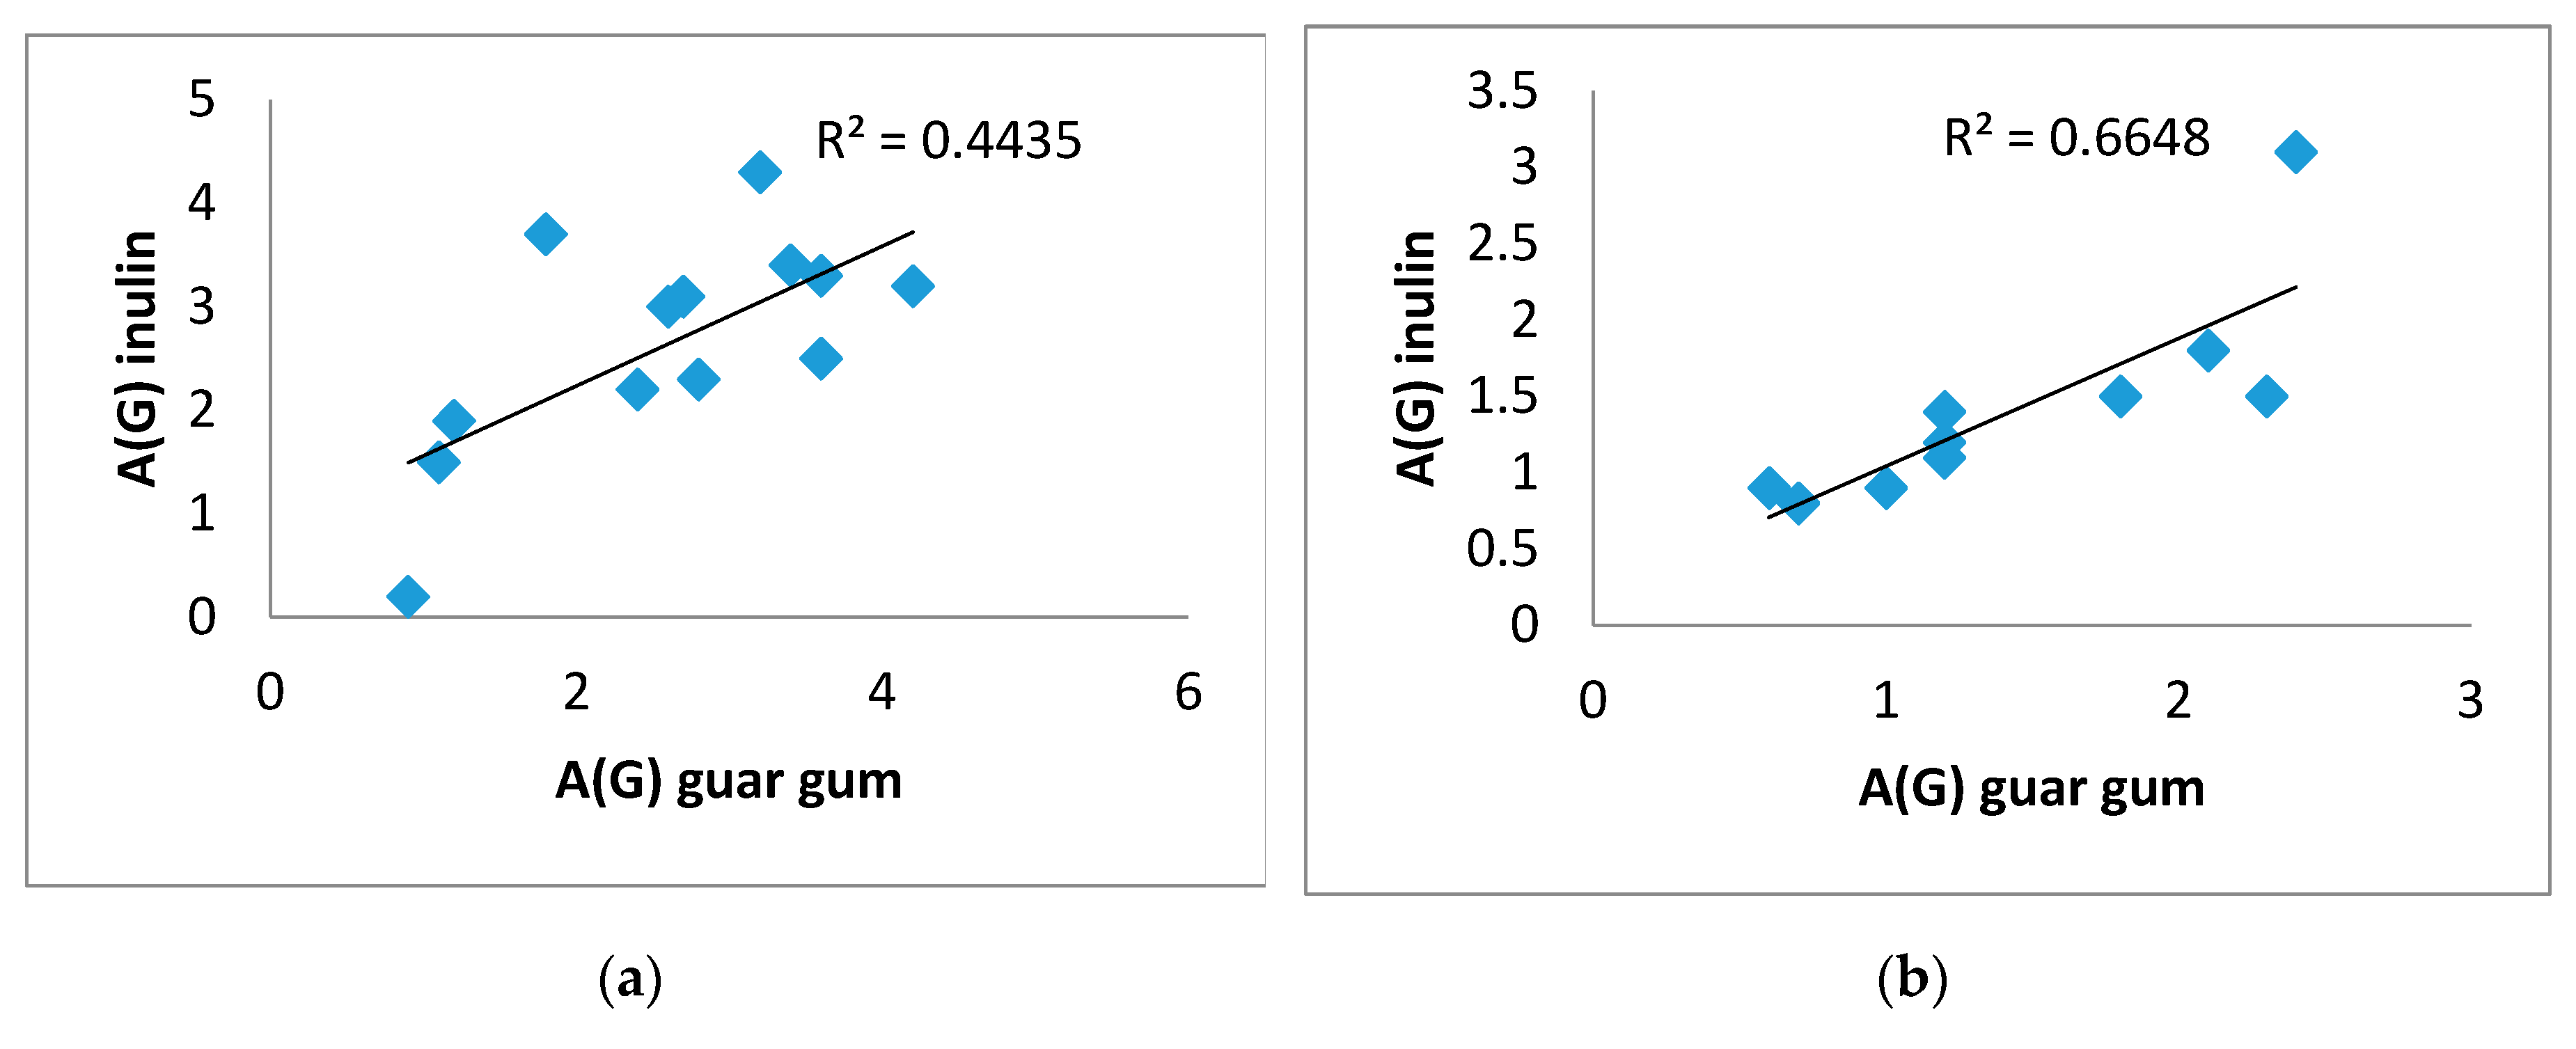
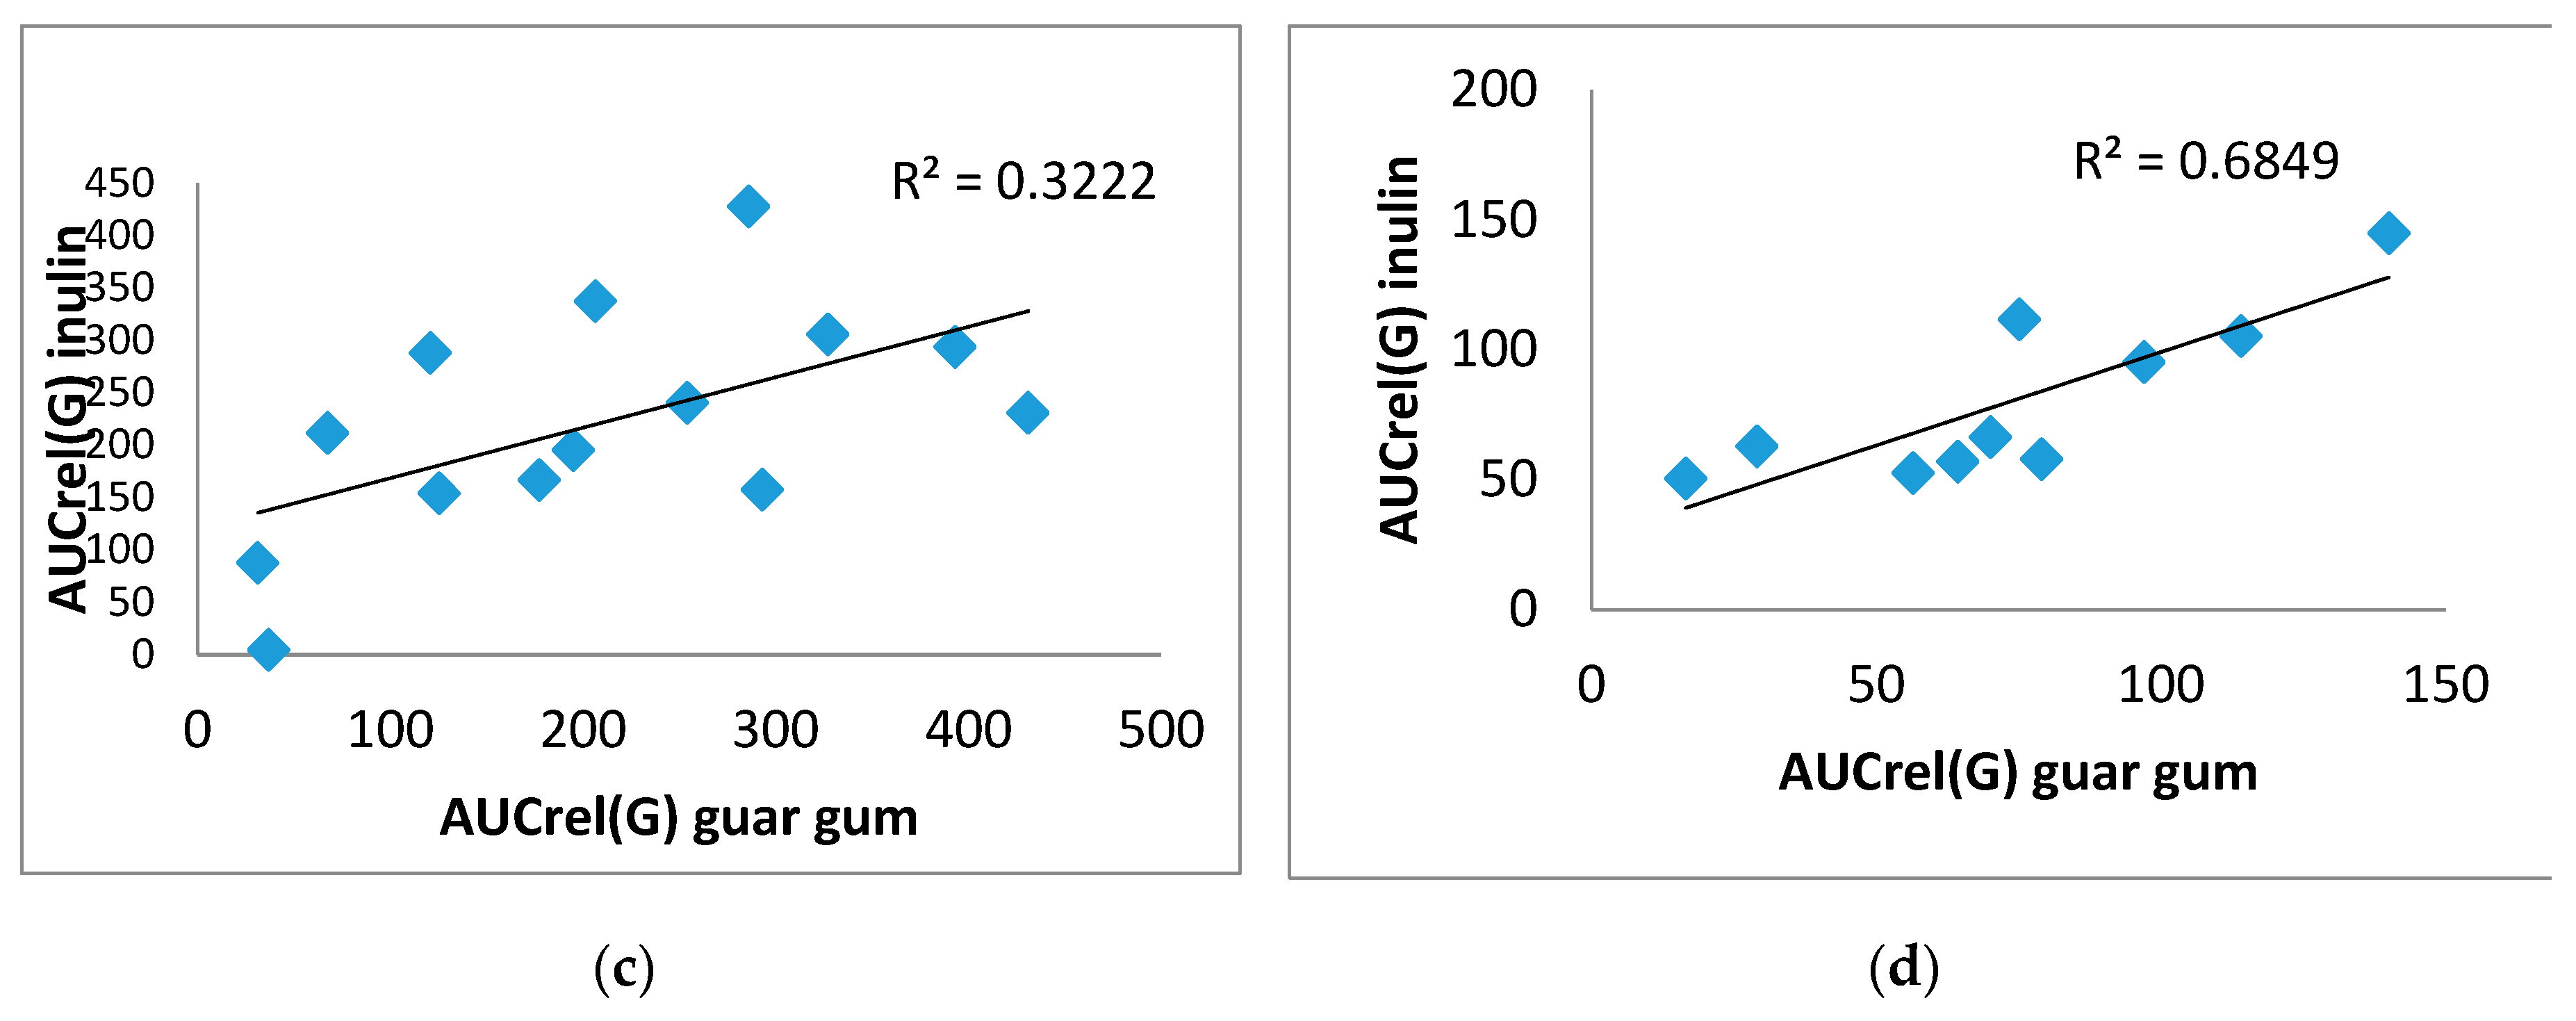
Figure 5.
Correlation between AUCrel(G) on lactulose and on guar gum (a); between Duration (G) on lactulose and on inulin (b) in the T2DM group..
Figure 5.
Correlation between AUCrel(G) on lactulose and on guar gum (a); between Duration (G) on lactulose and on inulin (b) in the T2DM group..
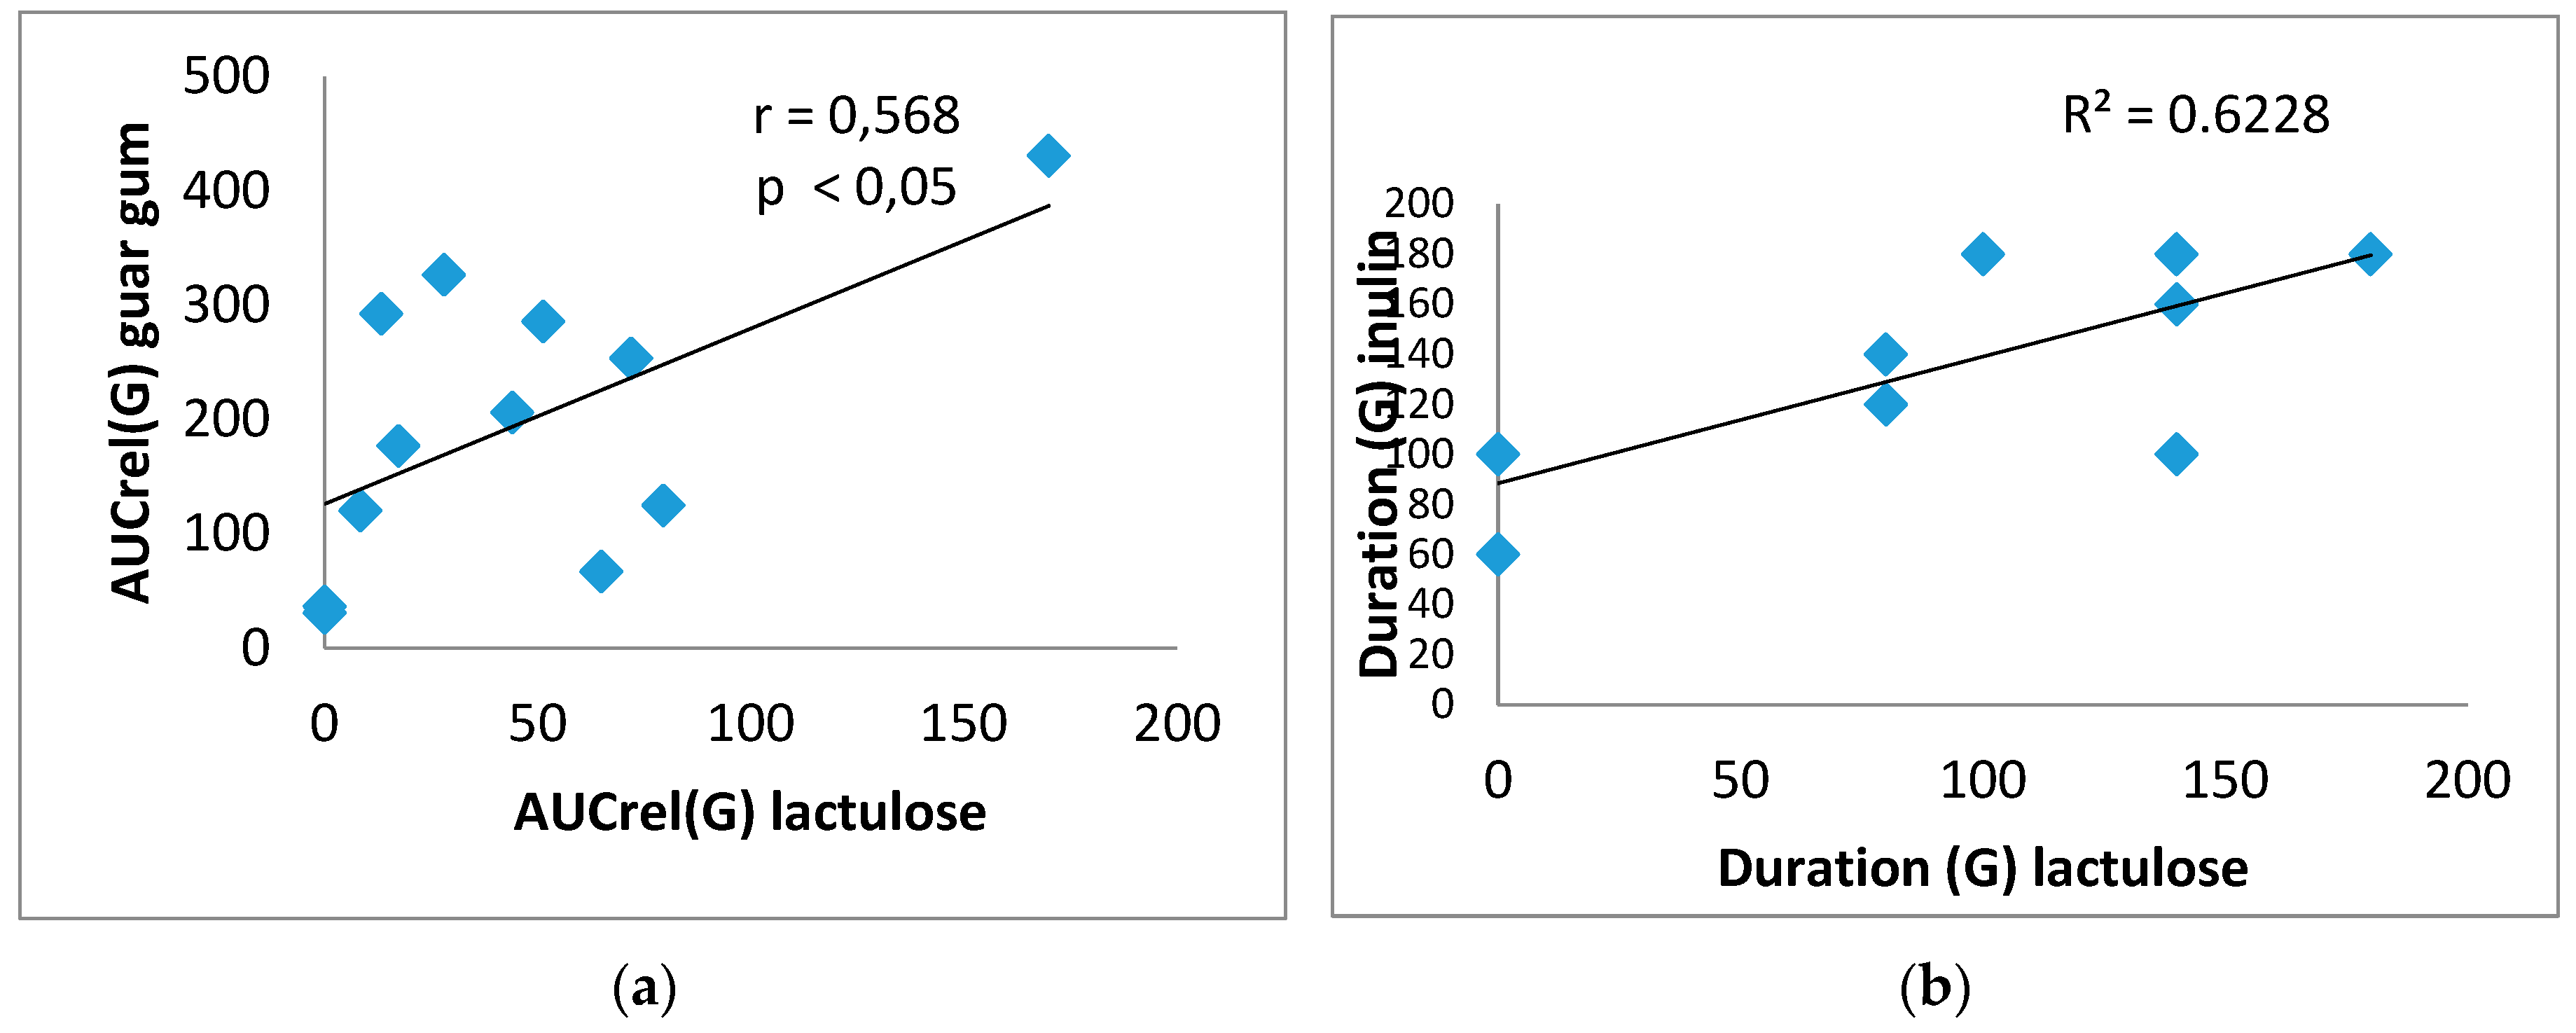
Figure 6.
Correlation between AUCabs (СН4) and duration(G) (a); AUCabs (СН4) and AUCrel(G) (b); A(G) and AUCabs(СН4) (c) in the test with lactulose; AUCrel(G) and AUCabs (СН4) in the test with guar gum (d) in the T2DM group.
Figure 6.
Correlation between AUCabs (СН4) and duration(G) (a); AUCabs (СН4) and AUCrel(G) (b); A(G) and AUCabs(СН4) (c) in the test with lactulose; AUCrel(G) and AUCabs (СН4) in the test with guar gum (d) in the T2DM group.
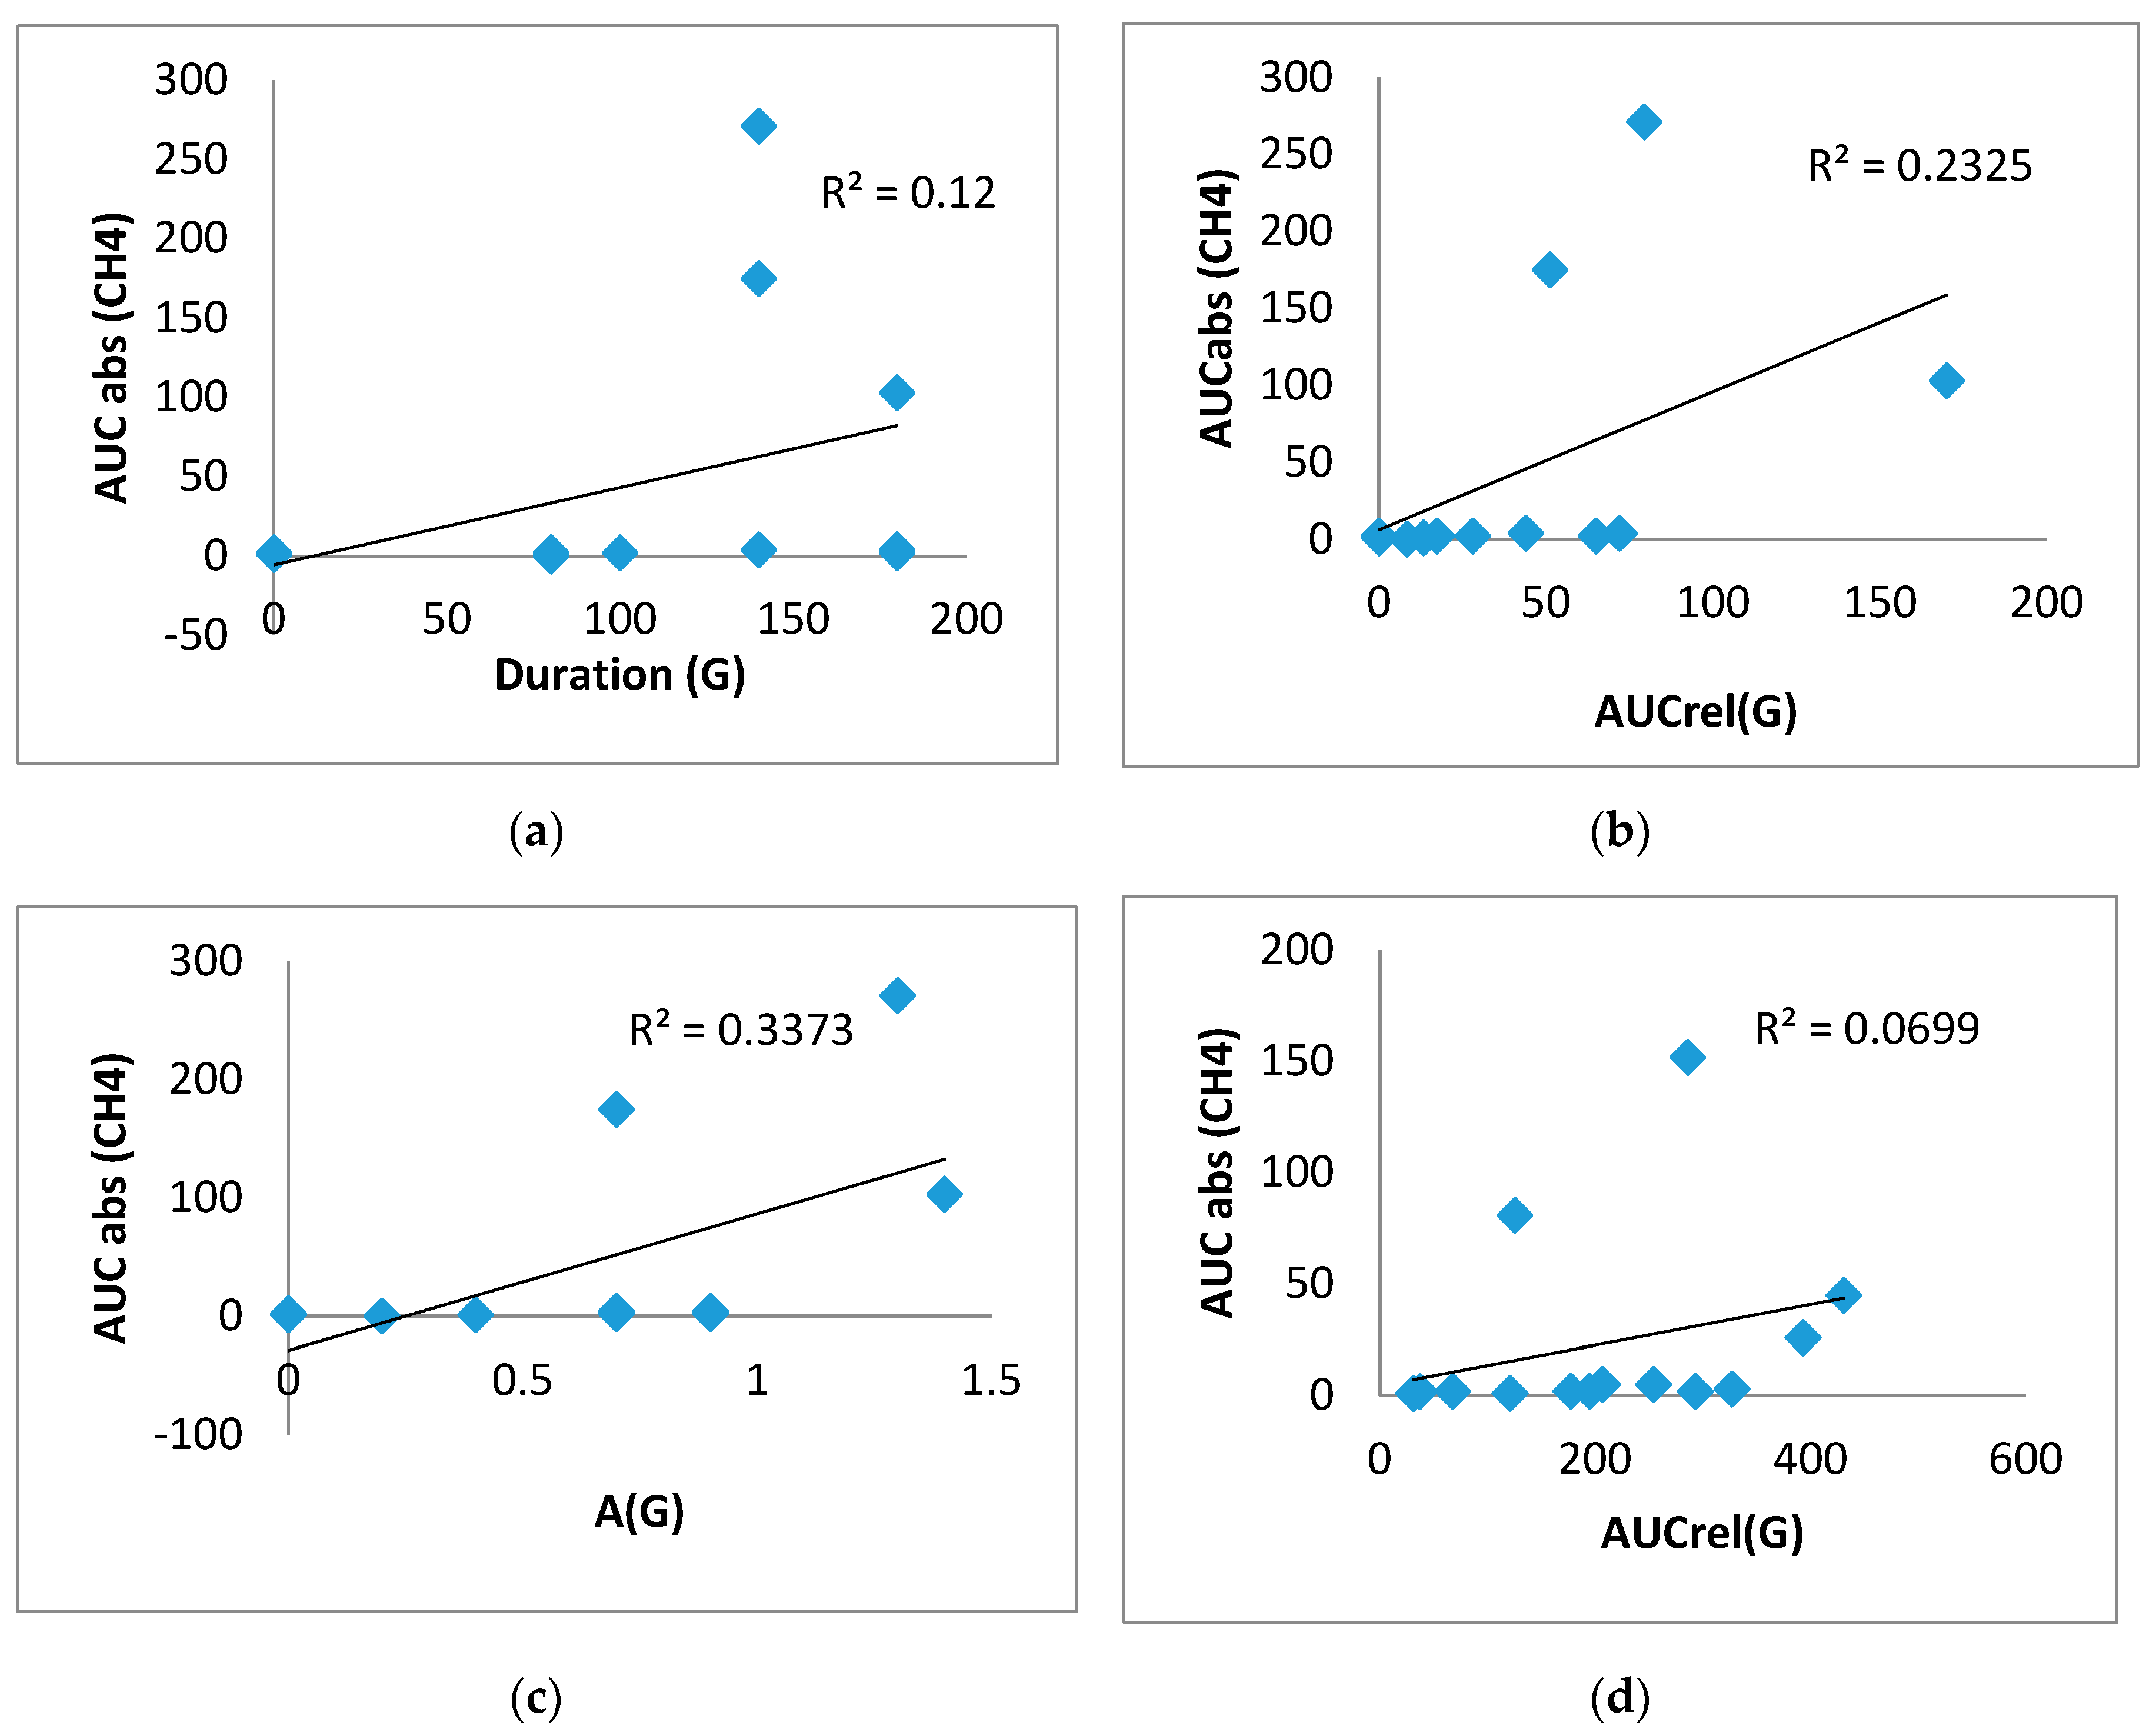
Figure 7.
Correlation between A(G) and AUCabs (СН4) in the test with inulin (a); A(G) and A(H2) in the test with guar gum (b) in the control group.
Figure 7.
Correlation between A(G) and AUCabs (СН4) in the test with inulin (a); A(G) and A(H2) in the test with guar gum (b) in the control group.
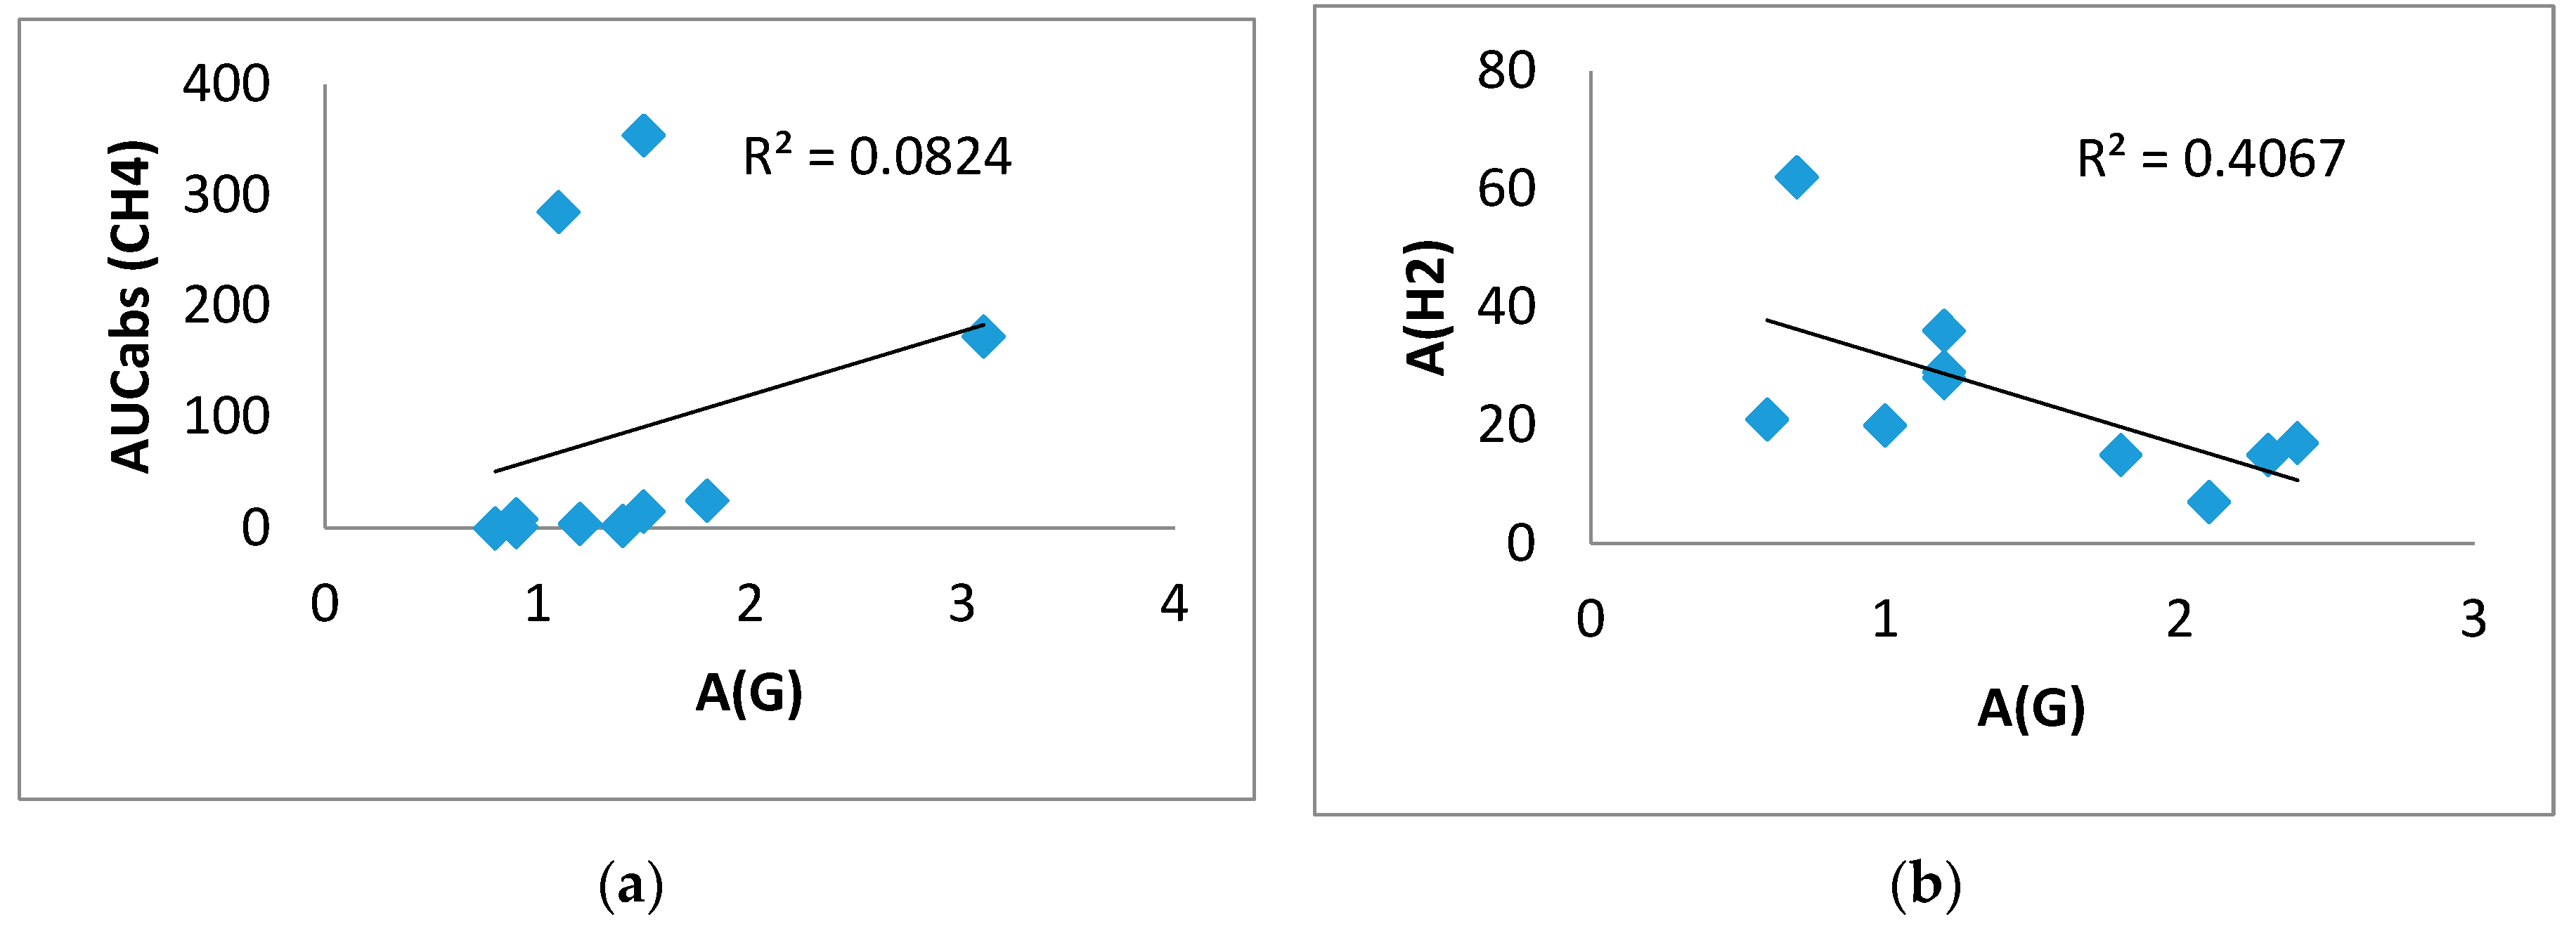

Table 1.
Characteristics of the study participants.
| Subject characteristics | T2DM | Control |
|---|---|---|
| Number of subjects, (%) | 14 (78.6%) | 10 (90%) |
| Age | 58 [54.0; 62.3] | 35.5 [27.5; 52.0] |
| Weight (kg) | 111.5 [92.0; 123.3] | 59.5 [54.0; 64.3] |
| BMI1 (kg/m2) | 42.3 [35.6; 47.7] | 21.9 [19.6; 23.6] |
| HbA1c2(%) | 8.4 [6.9; 9.9] | - |
1 Dates are presented as Me [Q1; Q3]. BMI – body mass index; HbA1c – glycated hemoglobin.
Table 2.
Indicators of gas production during tests with lactulose and dietary fibers in T2DM patients and control group.
Table 2.
Indicators of gas production during tests with lactulose and dietary fibers in T2DM patients and control group.
| Groups | Me 1)[Q1;Q3] 2) Mean ± SD |
Lactulose | guar gum | Inulin | |||
|---|---|---|---|---|---|---|---|
| Н2 | СН4 | Н2 | СН4 | Н2 | СН4 | ||
| T2DM | AUCabs (ppm) | 1) 96 [65;118] 2) 93±41 |
2 [1;4] 2) 44±87 |
43 [34; 70] 2) 50±28 |
3 [2;21] 2) 23±44 |
105 [70; 151] 2) 117±62 |
1) 4 [1;44] 2) 38±69 |
| A (ppm) |
1) 61 [30;66] 2) 58±36 |
1) 1 [1;2] 2) 11±20 |
1) 17 [8;33] 2) 23±19 |
1) 1 [-1;2] 2) 2±5 |
1) 71 [44;81] 2) 69±31 |
1) 1 [-1;2] 2) 2±5 |
|
| tmax (min) | 1) 160 [140;180] 2) 149±36 |
1) 60 [20; 140] 2) 75±65 |
1) 140 [80;160] 2) 120±60 |
1) 30 [0;75] 2) 41±45 |
1) 170 [120;180] 2) 148±37 |
1) 40 [0;110] 2) 54±58 |
|
| Control group | AUCabs (ppm) | 1) 142 [102;215]* 2) 163±70 |
1) 15 [2;191] 2) 86±125 |
1) 53 [42;74] 2) 64±34 |
1) 13 [1;86] 2) 65±103 |
1) 186 [118;225]* 2) 175±64 |
1) 11 [2;136] 2) 87±134 |
| A (ppm) |
1) 92 [67;122]* 2) 87±40 |
1) 3 [1;31] 2) 28±47 |
1) 20 [15;29] 2)25±15 |
1) 2 [1;8] 2) 12±20 |
1) 81 [62;89] 2)80±33 |
1) 2 [-1;20] 2) 14±24 |
|
| tmax(min) | 1) 110 [85;135]* 2) 114±38 |
1) 50 [25;90] 2)68±55 |
1) 160 [130;175] 2) 146±40 |
1) 70 [20;100] 2) 62±48 |
1) 120 [100;140] 2) 120±39 |
1) 40 [0;60] 2) 44±47 |
|
*р <0.05 – between T2DM and control group; AUCabs (absolute areas under the curve), A (amplitude), tmax (time to reach maximum levels).
Table 3.
Glucose levels during tests in the T2DM patients and control group.
| 1) Me [Q1;Q3] 2) Mean ± SD |
Lactulose(a) | guar gum(b) | inulin (c) | |||
|---|---|---|---|---|---|---|
| T2DM | Control | T2DM | Control | T2DM | Control | |
| A (G) (mM) |
1) 0.7 [0.3;0.9] 2) 0.7±0.5 |
1) 0.3 [0.2;0.3] 2) 0.5±0.7 |
1) 2.8† [1.7;3.5] 2) 2.6±1.02 |
1) 1.2* [0.9;2.2] 2) 1.5±0.7 |
1) 2.8 [2.1;3.3] † 2) 2.6±1.0 |
1) 1.3* [0.9;1.6] 2) 1.4±0.7 |
| Duration (min) |
1) 80 [120;170] 2)108±63 |
1) 90 [75;165] 2) 108±50 |
1) 180 [140;180] 2)154±37 |
1) 130 [80;180] 2) 130±50 |
1) 140 [115;180] 2) 143±37 |
1) 110 [95;165] 2) 120±41.1 |
| AUСrel(G) (mM*min) |
1) 36 [9.6;70.3] 2) 45.7±48,1 |
1) 11.7 [3.3;19.0] 2) 26.0±49.4 |
1) 200.7† [107.4;301.5] 2) 210.3±126.9 |
1) 72.6* [49.6;101.3] 2) 74.1±36.9 |
1) 221.6† [157.1;297.0] 2) 221.8±107.6 |
1) 64.8* [55.9; 107.1] 2) 80.6±32.0 |
A(G) - the amplitude of glucose level, AUСrel(G) - the relative area under the glycemic curve from 0-180 min. p - the validity of the differences; (a-b); [no differences with (b-c)]. *р <0.01; †р <0.0001.
Disclaimer/Publisher’s Note: The statements, opinions and data contained in all publications are solely those of the individual author(s) and contributor(s) and not of MDPI and/or the editor(s). MDPI and/or the editor(s) disclaim responsibility for any injury to people or property resulting from any ideas, methods, instructions or products referred to in the content. |
© 2024 by the authors. Licensee MDPI, Basel, Switzerland. This article is an open access article distributed under the terms and conditions of the Creative Commons Attribution (CC BY) license (http://creativecommons.org/licenses/by/4.0/).
Copyright: This open access article is published under a Creative Commons CC BY 4.0 license, which permit the free download, distribution, and reuse, provided that the author and preprint are cited in any reuse.


