Submitted:
03 June 2024
Posted:
04 June 2024
You are already at the latest version
Abstract
Global stress is widespread in todays post-pandemic world of political and economic uncertainty. Vibroacoustic technology is a vibrotactile intervention with multiple uses, and its impact on stress lacks interpretation. This research assessed if the vibroacoustic technology of a Vibroacoustic Sound Massage (VSM) can reduce psychological, physiological and cognitive stress. The Perceived Stress Scale (PSS-10), and electrocardiogram (ECG) and electroencephalogram (EEG) biosignals were used to quantify results. Participants were divided into Low Stress and High Stress groups. ECG results show VSM increased parasympathetic activity for all participants, with the Low Stress group more effected. EEG results indicate increased concentration (TBR), reduced arousal and increased relaxation (BAR), and non-significant effects on participant well-being (FAA), though variability in this metric was homogenised after VSM. Together, these results validate VSM as an effective support tool for stress management and further research is required.
Keywords:
Electroencephalography (EEG)
; Electrocardiogram (ECG)
; Heart Rate Variability (HRV)
; Vibroacoustic Technology
; Vibroacoustic Sound Massage (VSM)
; Stress
1. Introduction
COVID-19 generated global stress and illuminated the scale of an existing mental health crisis. Meta-analysis during the pandemic showed world stress prevalence at 36.5% with psychological distress at 50% [1]. The epidemic endorsed and supported the destigmatisation of mental health. Mindfulness knowledge dissemination rose together with spiritual-practitioner popularity and a widespread prioritisation of self-care interventions. Post-pandemic saw a surge in physical health and wellness spaces in the West, with holistic Eastern wellness practises (including meditation, breathing exercises, sound baths and yoga) becoming commonplace in daily routines. This foci on mental health improvement spawned a booming wellness-technology industry and exponential growth in new biotechnologies. The severed connection between brain and body once supported by Western science is now outdated, with scholastic knowledge shifting to bridge the gap [2,3,4].
Established well-being and stress management interventions include yoga [5,6,7], music [8,9], and meditation [10], with research linking their soothing effects to psychobiological vagal tone mediation [11,12,13]. The present study assesses effects of vibroacoustic technology on stress, measured using a PSS-10 subjective stress measure and biosignals recorded by electroencephalography (EEG) and electrocardiogram (ECG).
1.1. State Of The Art
The term vibroacoustic refers to a bimodal approach by which people simultaneously receive tactile and auditory stimulation. The term vibrotactile is used throughout this paper to refer to the tactile low-frequency stimulation of the intervention. Conceptualised in the 1980’s by therapist Olav Skille and music therapist Juliette Alvin, sinusoidal waves and/or music are played through specifically designed furniture with in-built speakers. Uses for the technology are multifaceted, including pain reduction [14,15,16,17], physiological recovery [18] and relief from psychological afflictions such as anxiety [19] depression [20] and insomnia [21].
Vibroacoustic research presently lacks methodological conformity, with extensive diversity in: session duration (ranging from twenty minutes to one hour), recurrence (as individual or regular sessions), and sonic attributes (featuring repetitive low-frequency sinusoidal waves, soundscape, music, or a combination of these). Similarly diverse is terminology, labelled: tactile low frequency vibration, vibroacoustic therapy (VAT) [22], VA treatment [23,24], physioacoustic therapy (PAT) [25,26], the PA method [21] and vibroacoustic music (VAM) [27]. Consequently, the field remains unestablished. Preliminary research infers the intervention can relieve stress [28] though assessment of this is scarce [29,30,31,32]. To the authors knowledge, four studies to date specifically compare the effect of vibroacoustic interventions on stress using biosignal measurements.
The first is a double-blinded randomized controlled trial of 54 university students by Kantor et al. (2022) [30] who compared an experimental group (VAT) to a control (placebo). Both groups listened to the same piece of music developed for the study on a reclined wooden chair structure the VIBROBED®. The VAT group were exposed to low frequency sound (LFS) within a frequency range of 0-100Hz. Exposure lasted twenty minutes for both groups and participant heart rate variability (HRV) was assessed for an acute stress response. HRV results showed that for the VAT group, exposure to LFS statistically increased parasympathetic nervous system activity. This indicates heightened nervous system relaxation showing that VAT can be used as a stress management tool for university students.
A second study by Vilímek et al. (2022) [32] also used a VIBROBED® as well as the VIBRATICS I vibroacoustic device. The latter is a padded flat vibrating surface upon which participants lay in the supine position. HRV measured stress, in addition to a mood checklist (UWIST-MACL) and the Perceived Stress Scale (PSS-10). The research assessed the effect of low-frequency vibration (LFV) on subjective stress perception and physiological function in 24 participants. The study design used only sounds of nature and no musical elements. Three conditions with varying sonic and tactile stimuli were tested, each lasting twenty minutes: the first included the natural sound of a forest river paired with a constant 40Hz LFV without modulation; the second used the same nature sound and LFV with the addition of amplitude modulation; and the third condition was a placebo using the nature sound alone with neither LFV nor modulation. Both HRV and stress perception were insignificantly effected in all conditions. Results differ from other research using LFV in combination with music that assessed the effect of VAT on physiological functions [29,32,33,34,35,36,37]. This illustrates the necessity for a musical element during interventions. Additionally, larger studies are required to quantify significant results of LFV.
Delmastro et al. (2018) [29] conducted a third study that assessed the effects of a vibroacoustic intervention on stress using biosignals. Physiological impact on 8 participants was measured using HRV, electrocardiogram (ECG) and Galvanic Skin Response (GSR). This study design is markedly comparable to the present research due to implementation of ECG and HRV metrics. An AcusticA vibroacoustic chaise longue was assessed. This is a deep wooden chair supporting the head, body and legs. All participants were exposed to an ill-defined twenty minute VAT therapy ‘melody’ within the frequency range of 20Hz-17kHz, constituting “specific music and melodies composed by a music therapist” [29]. ECG and GSR results show VAT induced physiological relaxation, with participants also reporting muscular relaxation. With respect to the studies’ sample size, a far greater participant pool is required to cater for inter-individual differences.
A fourth article is a proposal for a scoping review into the physiological effects of VAT authored by Kantor et al. (2022) [31]. Inclusion criterion are broad, accommodating all studies using physiological biomarkers of stress. Due to this broad inclusion criteria, results are likely to deviate greatly. The paper proposes an analysis of the effects of vibroacoustic technology (sedative or stimulatory), in addition to acknowledgement of the most efficacious sonic attributes for vibroacoustic stress management. Unfortunately, the final scoping review to which Kantor et al’s (2022) protocol points ceases to exist. A scoping review of the same author exploring effects of vibroacoustic therapy on adult pain [22] collated 430 records to conclude that research remains too sparse for accurate identification of specific VAT pain management characteristics. Despite this finding, a scoping review defining vibroacoustic intervention stress relieving characteristics would be markedly beneficial for the field and furthered hardware development. Evidenced, vibroacoustic technology requires extensive exploration.
Vibroacoustic Sound Massage (VSM) is used throughout the present paper to refer to the VibroAcoustics Bass Module [38] which is assessed. The research uses biosignal measurements to analyse effects of VSM on human stress (quantified as psychological, physiological and cognitive stress). EEG and ECG biosignals are recorded before, during and after exposure. PSS-10 scores recorded before and after exposure are used as an intra-participant control baseline for High Stress or Low Stress grouping. All metrics are collated to accurately assess the multimodal effects of VSM on physiological, psychological and cognitive stress. To the authors knowledge, concurrent neural, cardiovascular and cognitive oscillations have never been assessed simultaneously before, during and after VSM exposure.
The present study fills gaps in current vibroacoustic research in multiple ways. First, the study assesses the effect of VSM on stress using concurrent EEG and ECG biosignal metrics, in addition to a subjective stress measure the PSS-10. Secondly, it is conducted on a vibrotactile modality on which participants lay fully flat to facilitate maximised contact. Thirdly, the research is conducted on a larger participant sample (38 participants) as compared to studies of smaller sizes. Fourthly, the VSM sound design features quantified stress-reducing sonic characteristics (including rhythmicity and pitch, as further discussed). Novel in its approach, the research assesses if supine-position VSM is efficacious as a stress management tool, quantified with EEG, ECG and PSS-10 measures. To the authors knowledge, these stress metrics have never been concurrently recorded, collated and analysed into one vibroacoustic research methodology before.
The study poses three research questions (RQ) and associated hypotheses (H):
Research Question One (RQ1), cognitive stress: How does VSM affect mental processing? Hypothesis 1 (H1): VSM positively effects concentration (Theta/Beta Ratio), relaxation (Beta/Alpha Ratio), and well-being (Frontal/Alpha Asymmetry).
Research Question Two (RQ2), physiological stress: How does VSM affect the autonomic nervous system, vagal tone and heart rate? Hypothesis 2 (H2): VSM increases HRV, causing more parasympathetic activity (increased RMSSD and HF) and less sympathetic activity (reduced SDNN and LF). VSM will reduce HR BPM [29].
Research Question Three (RQ3), psychological stress: Are participants with higher PSS-10 scores more impacted by VSM? Hypothesis 3 (H3): VSM benefits individuals with higher perceived psychological stress [30].
In the following sections, the apparatus used, methodology and study design are clearly explained, results are analysed and discussed, and conclusions are drawn.
2. Materials and Methods
Vibration is integral to human functioning. Omnipresent, it determines everything from heart contractions, to nerve impulses, to the resonant frequency of groups of cells. Resonant frequencies are naturally occurring vibrations in the body, which can synchronise with external sonic vibrations. Liquid, tissue and bone all have different resonant frequencies. Sonic tactile vibrations emitted by vibroacoustic technology are designed to affect resonant frequencies inside the body. Single sine waves can activate areas that share a resonant frequency, while more complex tones (like those in music) cause resonance of multiple areas simultaneously [39,40]. Vibroacoustic technology facilitates a tactile reception of sonic vibration. It uses low-frequency sine waves and/or music within the range of human hearing to provide an embodied or haptic experience of sound.
The internal mechanisms supporting vibroacoustic efficacy are yet to be fully understood, thus the present study broadens knowledge by using biosignals to measure the effects of VSM on cognitive, physiological and psychological stress. To quantify cognitive stress, brainwaves are recorded using an electroencephalogram (EEG). EEG records electrical activity in the brain from which mental disposition can be deduced as brain wave states, of which there are five: delta (0.5Hz-4Hz), theta (4Hz-7Hz), alpha (8Hz-12Hz), beta (16Hz-31Hz), and gamma (36Hz-90Hz) [41]. High frequency brain waves are associated with greater cognitive arousal, while low frequency brain waves indicate a calmer mental state. The Muse S (Gen 2) is a portable EEG device used in the study to accurately map prefrontal and temporal lobe activity.
To measure physiological stress, an electrocardiogram (ECG) is used to record electrical activity in the heart. This electrical activity changes relative to how stressed the nervous system is. The central nervous system (CNS) includes the brain, spinal cord and a large nerve network called the peripheral nervous system (PNS). The PNS communicates between the CNS and the body, and is composed of the somatic and autonomic nervous systems. The somatic nervous system carries peripheral sensory information (such as indicating when something is too hot to touch), while the autonomic nervous system governs subconscious activities like digesting, breathing and blood pressure [42,43].
With regards to physiological stress, the focus of the present study is the autonomic nervous system (ANS). This constitutes the enteric, sympathetic and parasympathetic nervous systems: the enteric nervous system regulates the gut, the sympathetic nervous system (SNS) regulates a ‘fight or flight’ response which is present when we are on high alert, and the parasympathetic nervous system (PNS) regulates a ‘rest and digest’ response, occurring during periods of rest and calm.
ECG records electrical impulses of the heart through heart rate (HR) beats-per-minute (BPM) and heart rate variability (HRV). HRV is an indicator of activity in the nervous system and a measure of vagal tone. Vagal tone describes the electrical activity of the vagus nerve which is the main nerve of the parasympathetic division of the ANS. The vagus nerve extends from the brain stem, down the spinal cord to the abdomen, and connects to major organs including the heart, gut and lungs. The vagus nerve and vagal circuit are crucial for emotion regulation and the stress response [44]. Mediated by the central nervous system, the vagus nerve is the primary mechanism for heart-brain interactions and transmits sensory information between the two. It is integral for controlling heart rate, digestion, blood glucose and other visceral functions [45]. The primary function of the vagus nerve is to sustain homeostasis. Vagal tone is indicative of vagus nerve functioning, with increased vagal tone representing parasympathetic activity (a relaxed response). HRV is used to measure vagal tone and the status of the vagus nerve. In the present study, a Polar H10 Heart Rate Monitor chest strap was used to measure ECG data accurately from the chest region, which recorded HR BPM and HRV. ECG readings for a calm un-stressed nervous system would show low HR BPM and high HRV, the latter illustrative of parasympathetic nervous system activity. On the contrary, a stressed nervous system would show high HR BPM and low HRV, indicative of activity in the sympathetic nervous system.
Vagus Nerve Stimulation (VNS) is a clinical neuromodulation practice used to modulate and increase vagal tone. VNS can provide therapeutic relief from a wealth of conditions including epileptic seizures [46,47], low mood and depression [48,49], obesity [50] and migraines [51]. VNS often involves an invasive medical implant, while alternative non-invasive nervous system treatments use surface electrodes, music and vibration, and ultrasound [52,53]. Vibroacoustic interventions are neurophysiologically beneficial, and this research posits that vibroacoustic technology could be used as an alternative non-invasive solution to VNS for stress regulation.
Psychological stress is assessed in the present study using the Perceived Stress Scale (PSS-10) questionnaire to record changes in perceived stress before and after exposure. The PSS-10 is a 10-item self-report questionnaire and widely used diagnostic support tool. PSS-10 scores are positively correlated with stress (higher scores indicate higher stress). Using average participant score as the dividing threshold, participants are categorised into a High or Low Stress group by their initial PSS-10 score. Psychological stress is quantified by comparing questionnaire responses before and after the vibroacoustic intervention.
The research adopts a within-subjects mixed-methods approach, with quantitive (PSS-10, EEG and ECG) and qualitative (verbal first-person accounts) data streams analysed and correlated.
2.1. Apparatus
2.1.1. EEG Apparatus: Muse S (Gen 2)
A Muse S (Gen 2) EEG device was used to measure electrical activity of the frequency bands delta (δ), theta (θ), alpha (α), beta (β) and gamma (γ). It has one reference electrode and six channels; four working nodes and two auxiliary channels. Four nodes measure electrical current with respect to a zero-voltage reference node. Two auxiliary channels are used for calibration which can record additional peripheral signals (the latter was unnecessary for the purpose of the present study). The four working electrodes are located at AF7, AF8, TP9 and TP10, with a single reference electrode at FpZ. AF7 and AF8 measure activity in the frontal lobe, while TP9 and TP10, located above the ears, record information from the temporal lobes (see Figure 1 and Image 1). The EEG device records jaw clenches and blinking which were cleaned from the dataset before analysis to reduce electrical interference or ‘noise’. To assess the cognitive impact of VSM, frequency bands (δ, θ, α, β, γ) were analysed comparing summed power (peak frequencies) of specific bands.
Image 1.
Participant wearing a Muse S (Gen 2) EEG headband.
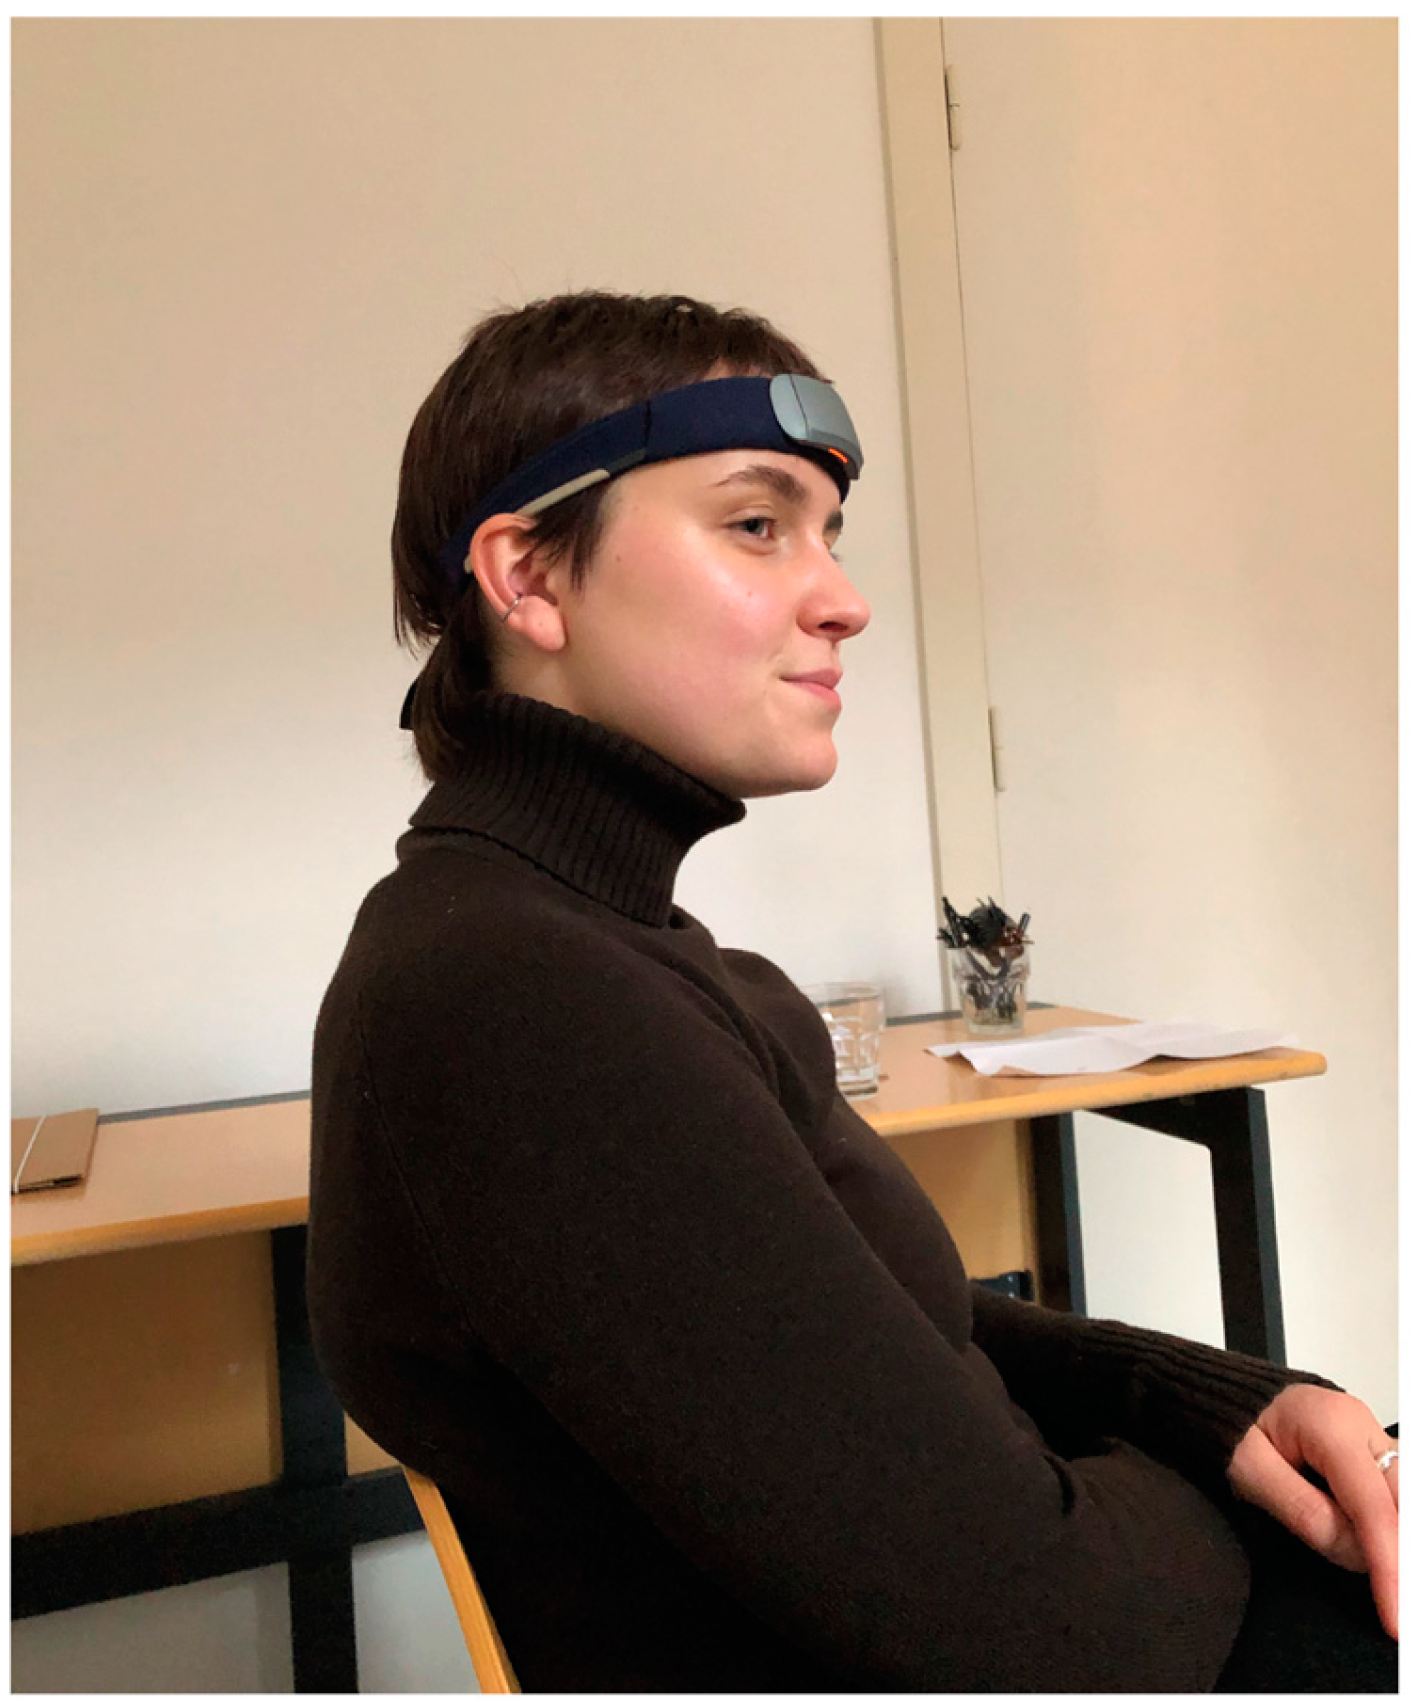
The Muse S (Gen 2) headset was chosen for the study because of its reliability, precision, mobility, and design (a soft headband was crucial for the study as participants were laying down for a duration of 45 minutes). This EEG device records raw data from the 4 electrodes at a sampling rate of 256Hz. It was connected via bluetooth to the iPad application Mind Monitor [54] which records signals from the headband in real-time. Mind Monitor processes raw EEG data from each of the four electrodes using a spectral analysis to break the signals down into five frequency bands (δ, θ, α, β, and γ). These are visualised in the app (see Image 2).
Image 2.
Mind Monitor iPad application displaying live EEG data.
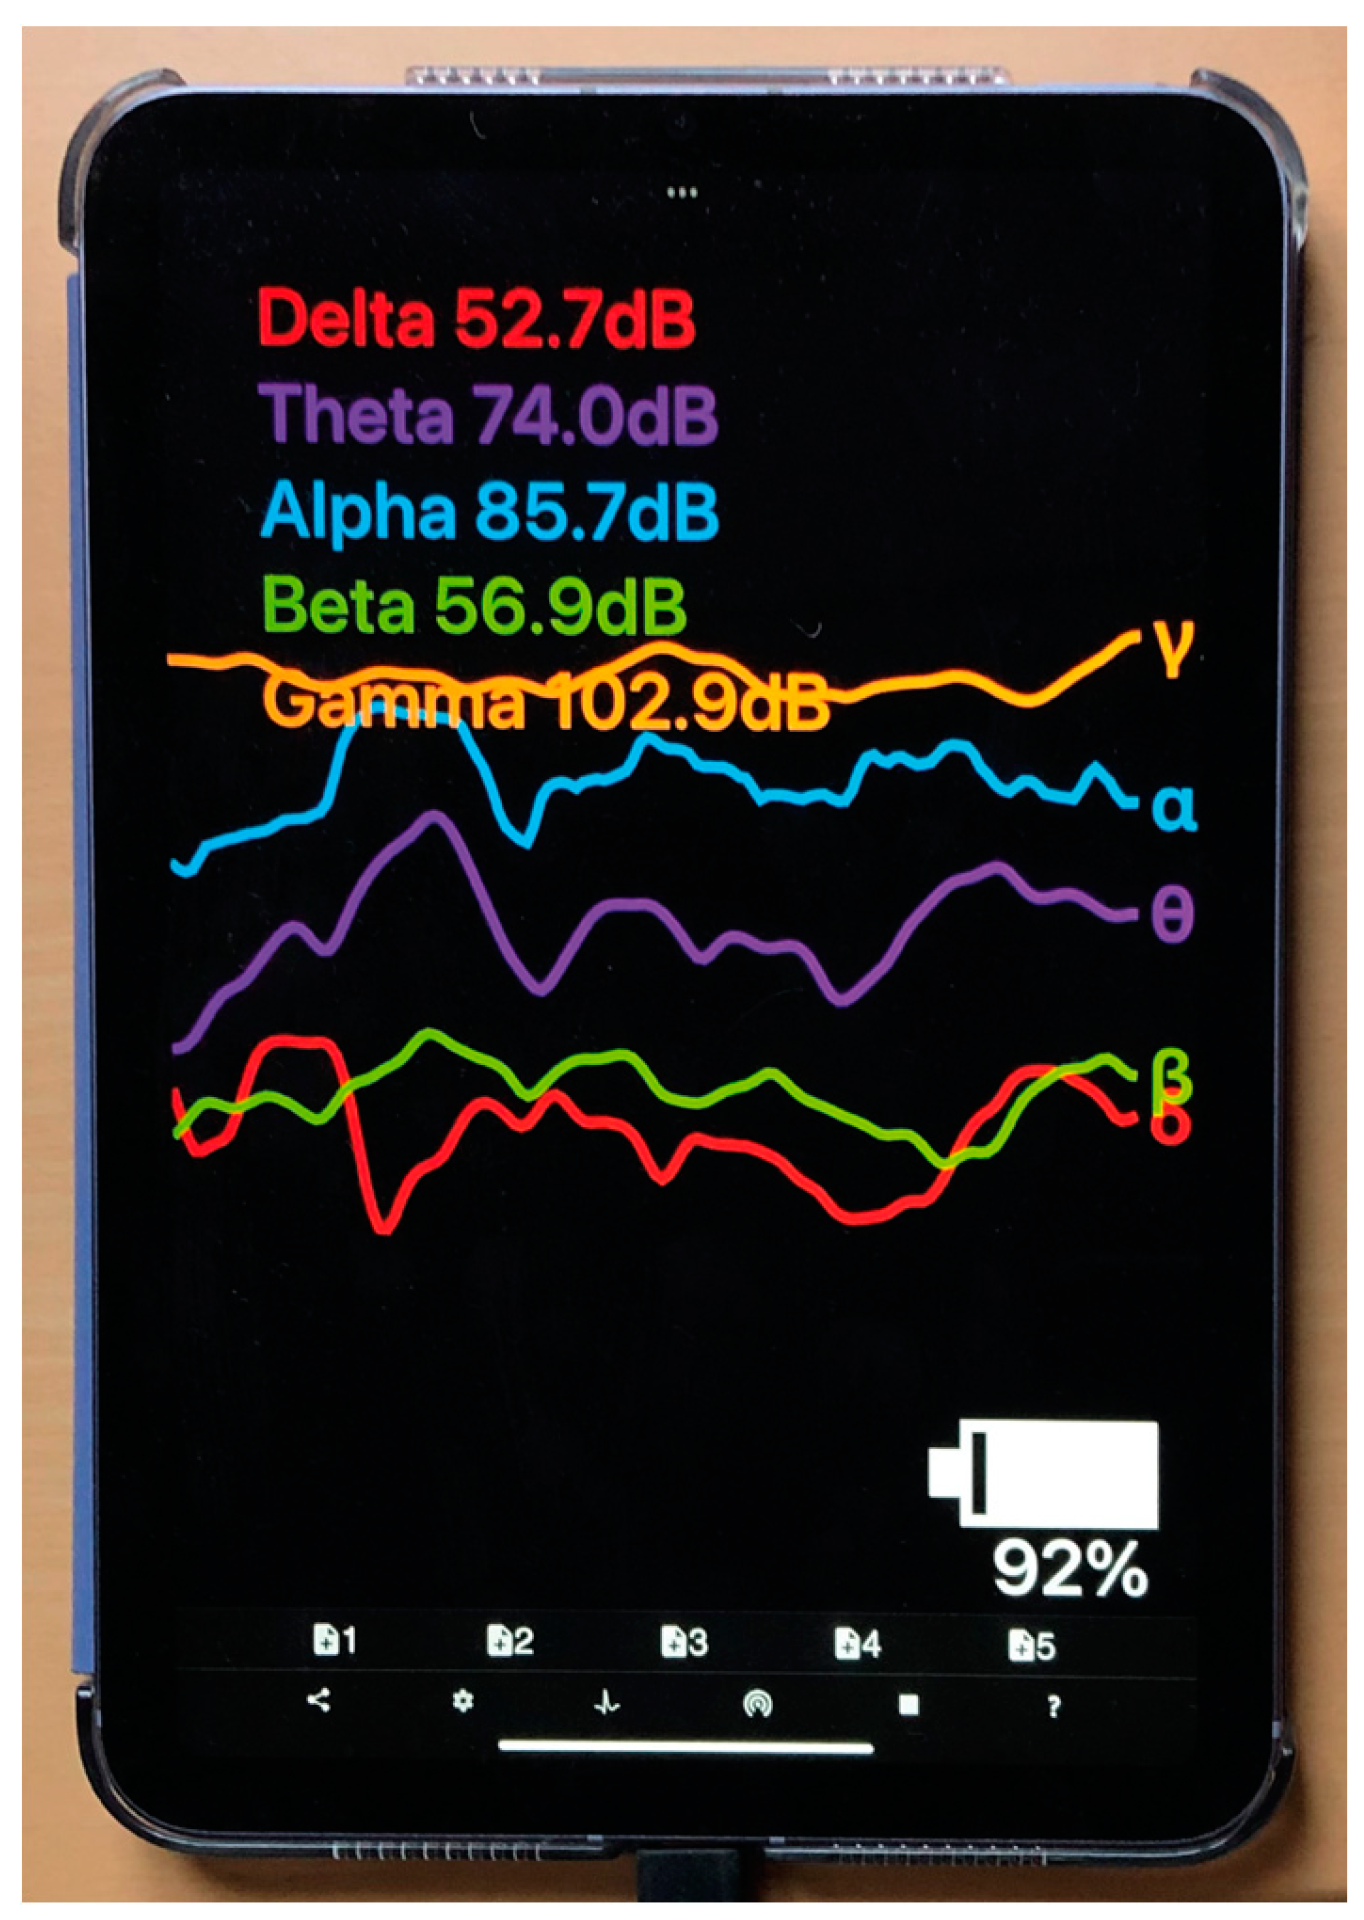
To visualise data, Mind Monitor conducts a spectral analysis at each of the four electrodes which filters the raw EEG data into five frequency bands: Delta (<4Hz), Theta (4-7Hz), Alpha (8-15Hz), Beta (16-31Hz), and Gamma (> 31Hz) [55]. Mind Monitor also automatically applies a 60Hz notch filter to raw values to reduce noise. Noisy data elements such as those around eye blinks and jaw clenches recorded by the Muse S (Gen 2) were extracted, and surrounding data channels were interpolated before the data was analysed.
The research assessed effects of the intervention on EEG using three dependent variables of cognitive stress: concentration was measured using the Theta/Beta Ratio (TBR); arousal was measured with the Beta/Alpha Ratio (BAR); and well-being was assessed using Frontal/Alpha Asymmetry (FAA). All parameters are discussed at length in section 3.1.
2.1.2. ECG Apparatus: Polar H10 Heart Rate Monitor
A Polar H10 chest strap was used to measure ECG as it offers optimal accuracy and smartphone connectivity [56]. The Polar H10 chest strap uses a sampling rate of 1000Hz and it is the gold standard for RR interval assessments [57] used by professional athletes and in research to automatically calculate HR and HRV values. This device was favoured because of its reliability and validity with respect to accurately recording HRV parameters [58]. The device was connected via bluetooth to the smartphone recording app Heart Rate Monitor [59].
ECG records sinus rhythm or the rhythm of the heart. The sinus node determines this by generating electrical signals that make the heartbeat. One cardiac cycle is called the PQRST complex which is a process that repeats in healthy humans to make a heartbeat. Figure 2 itemises each stage of a PQRST complex.
Anatomically, electrical signals emitted by the sinus node make the heart atria contract. These signals then move through the atrioventricular node and cause the ventricles to contract, as in Figure 3.
Electrical activity of the sinus node is defined by a balance of sympathetic nervous system activity (which accelerates it) and parasympathetic nervous system activity (which slows it). Fluctuations in blood pressure, heart rate and vascular tone are all determined by the sympathetic and parasympathetic nervous systems. This is an autonomic nervous system (ANS) state termed sympathovagal balance, that is dictated by sympathetic and parasympathetic influences. HRV is a measure of sympathovagal balance - it is a metric of the differences between successive RR intervals (the time gap between R’s) in a PQRST complex. An RR interval is the difference between successive R waves in a PQRST complex (see Figure 4). Figure 5 is an ECG recording of a participant during the study.
Parasympathetic activity is indicated by a high HRV reading while low HRV indicates sympathetic activity [60]. As HRV analysis is based on sinusoidal rhythm, potential artifacts and non-sinus events were cleaned from the data prior to analysis (elements removed were RR interval outliers, ectopic beats and arrhythmic events). Additional post-processing of the ECG data constituted time mapping the two data streams recorded by the Polar H10 (HR and HRV data). HR is recorded by the device once a second. HRV sampling rates changed, depending on how many data rows were recorded for each participant. To gain the HRV sampling rate, both data streams for each participant were time-aligned using the HR data as a baseline.
2.1.3. Questionnaire: Perceived Stress Scale PSS-10
The Perceived Stress Scale (PSS-10), developed by Cohen et al. (1983) [61], is a widely used 10-item questionnaire designed to evaluate stress levels in individuals. It assesses the extent to which individuals perceive their lives as unpredictable, uncontrollable, and overwhelming. It can be completed in five minutes, with respondents rating the frequency of their feelings on a Likert scale from 0 (“never”) to 5 (“very often”). All questions are formulated so that higher values indicate a higher level of perceived psychological stress. The final score is then derived by summing responses across all items, with higher scores indicating elevated levels of perceived stress. The maximum score is 50 and the minimum is 0.
The PSS-10 has been validated across adolescent and adult populations over the past 40 years. Lee’s (2012) [62] meta-analysis highlighted internal consistency of the questionnaire, revealing that Cronbach's alpha values (a measure of internal reliability) exceeded >.70 across 11 of the 12 studies available at that time. More recent empirical evidence shows it can be used in meaningful comparisons across ethnic and linguistic groups. The work of Baik et al. (2019) [63] demonstrates its effectiveness in facilitating stress-related comparisons between English and Spanish-speaking Americans. Normative data is also available for a number of countries. Denmark is not yet included, though its neighbours Germany [64] and Sweden are [65]. A validated Danish version of the questionnaire has been created by Eskildsen et al. (2015) [66] and the present study used the original English version.
2.1.4. Vibroacoustic Apparatus: Device & Audio
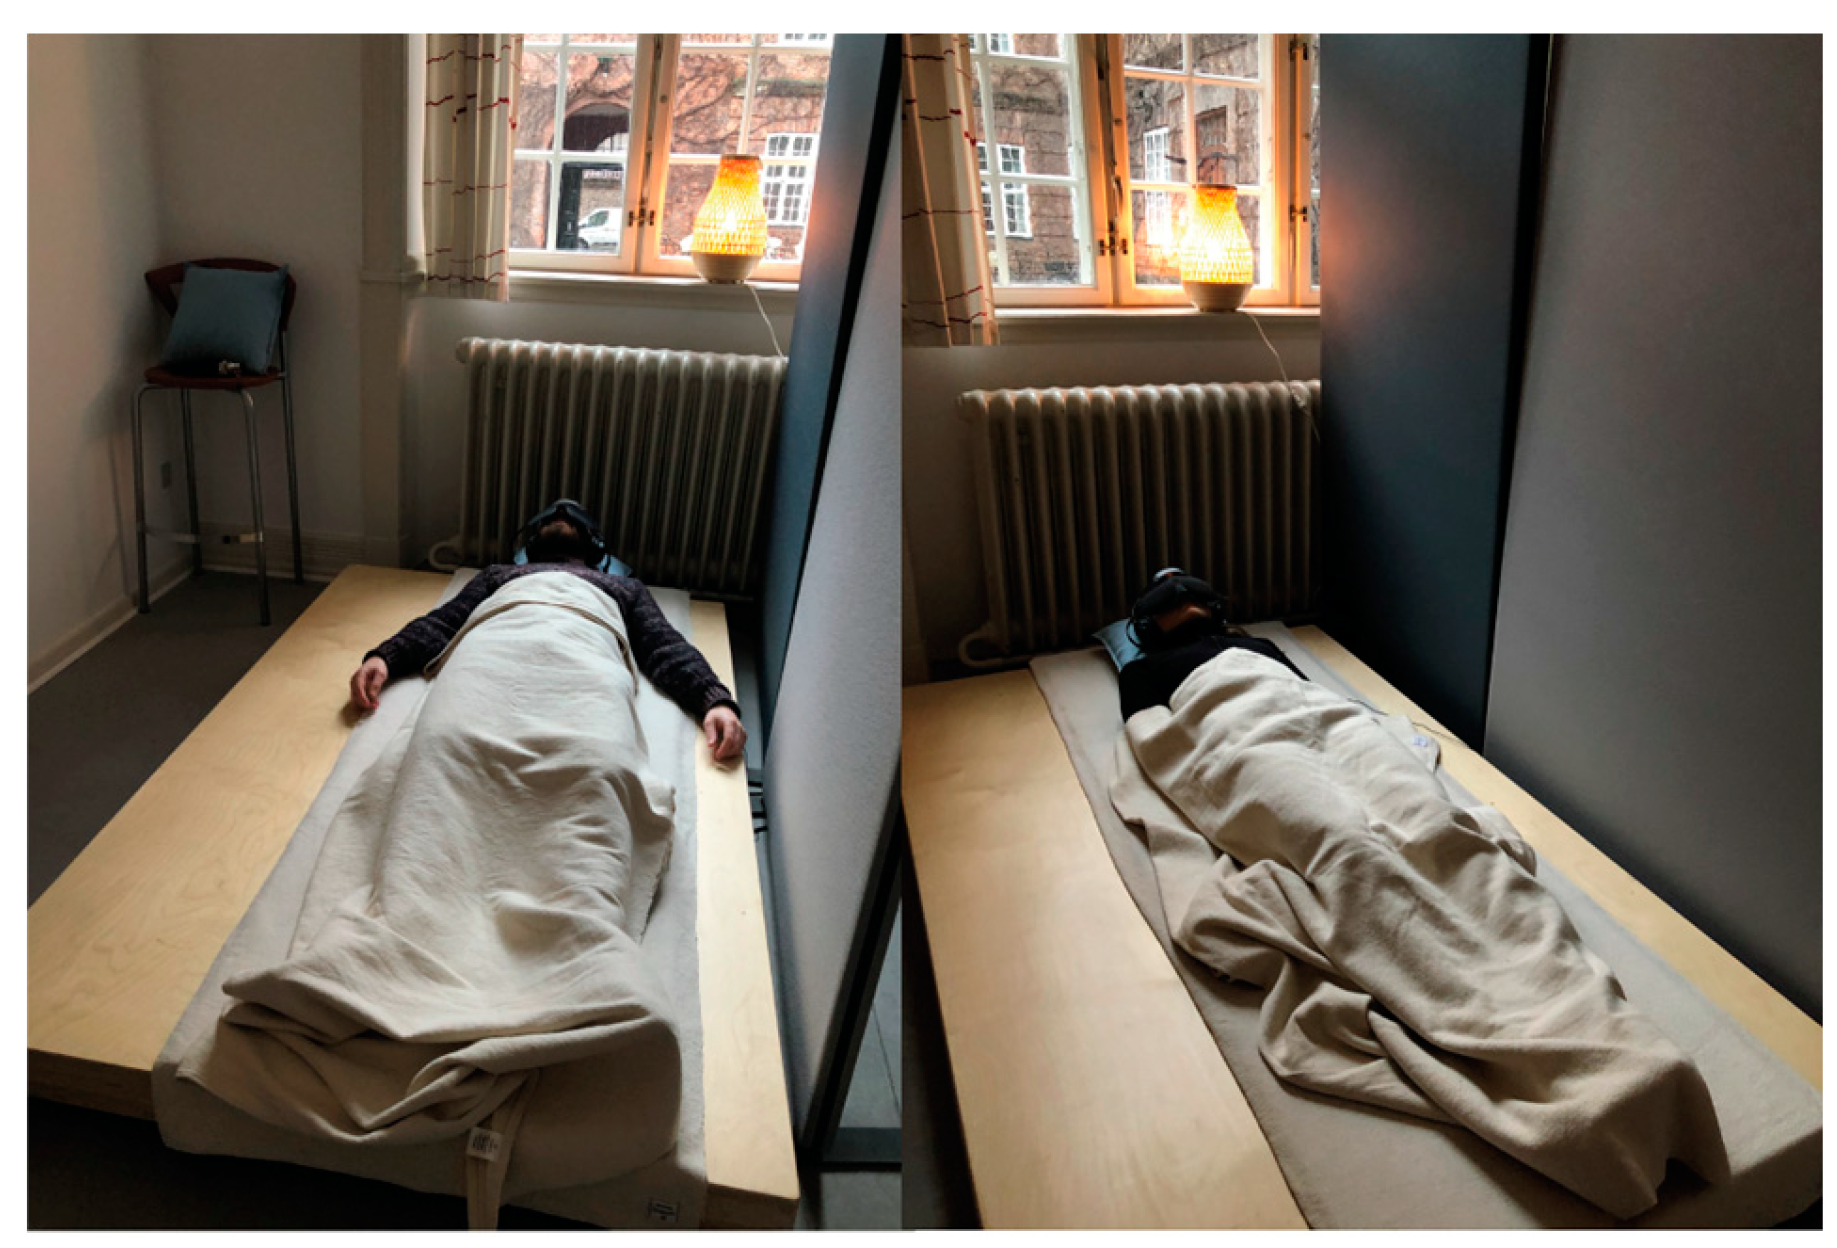
This study tests the efficacy of a VibroAcoustics Bass Module [38] on which participants lay in the supine position. The wooden device is the size of a single mattress and houses three transducer speakers with a frequency range between 20Hz-80Hz. A mobile phone was connected via aux to the module which played sound designed for the study. Participants listened to this through Bose QuietComfort 35 II noise cancelling headphones (see Image 3).
Image 3.
Participants in the research setting experiencing a VibroAcoustics Sound Massage (VSM).
A 45 minute soundscape was specifically designed with a restorative cognitive effect that featured live recordings of forest sounds, wind, water, rainfall and birdsong [67,68,69]. The isochronic tones (single tones of the same frequency at repeated intervals) occurring in these natural sounds improve cognitive wellness [70] and increase parasympathetic activity [71]. Field recordings from Denmark, Portugal, Spain, Israel and India featured mechanical industrial rhythms and Eastern instrumentation with a repetitive drone-like quality. These nature sounds and rhythms were heavily reverberated in postproduction and mixed together with electronic harmonies. The soundscape assimilated learnings from brain entrainment research that documents the cognitive effect of repetitive rhythmic sonic structures [72,73,74,75]. Integral for vibrotactile stimulation, the soundscape also featured 20-80Hz bass frequencies. These were of alternating tones with a repetitive rhythmic nature. The ‘ideal’ frequency for vibroacoustic stimulation remains contested, though 40Hz is postulated to be most efficacious. Either as a continuous sinusoidal wave or enmeshed into other sounds as in the present study soundscape, 40Hz consistently demonstrates the most advantageous physiological outcomes. Reasons for this are manifold: as transducers are less efficient at a lower range, low frequency vibrotactile sound must be greater than 27Hz to be physically perceived [76]; it may also be because brainwave entrainment occurs best at 40Hz, which is the lower end of the frequency range at which the gamma band oscillates [22,77]. This is because gamma brainwaves have the widest range, connecting both hemispheres and lobes. These oscillations are associated with consciousness, memory, emotion, heightened arousal, concentration, and sensory integration [78].
2.2. Method
2.2.1. Recruitment
Participants were recruited through social media advertisements. Exclusion criteria were: prior VSM experience and pre-existing mental health conditions and/or chronic pain. A random sample was selected from the applicants to participate in the study. 40 participants voluntarily took part: 13 males and 27 females between the ages of 20-35 years old, with a mean age of 28. Two participant data sets were excluded from analysis due to premature study termination.
2.2.2. Experimental Procedure
The research was conducted at the National Institute of Public Health in Copenhagen, Denmark. The study setting was prepared with sound-absorbing mobile wall panels and designed as a calm environment with soft light and furnishings. Participants wore the Polar H10 chest strap and Muse S (Gen 2) headset at all times throughout the study.
The study consisted of 6 stages: Normal Activity (NA), Prosody 1 (P1), Rest State (RS), Vibroacoustic Sound Massage (VSM), Post-Vibroacoustic Sound Massage (PVSM), and Prosody 2 (P2) (see Table 1). During the P1 and P2 stages, participants read a text aloud. Both stages are an assessment of speech prosody and are neither discussed nor analysed in the present paper. Results from these stages can be found in Fooks & Niebuhr (2024) [79].
To avoid priming biases it was only before each study stage participants were told what they were required to do. There was one exception to this to ensure data validity, between the VSM and PVSM stages. Before VSM, participants were instructed to continue laying on the module with their eyes closed afterwards for five minutes, or the duration of PVSM. PVSM measured EEG and ECG fluctuations immediately after VSM exposure, thus distracting participants before this stage would reduce result validity and increase noise in the data. Throughout data collection, live transcriptions were recorded by the researcher. Total study time was approximately 70 minutes, to accommodate a time buffer for preparation and questions. After the studies end, participants were invited to verbally share their experience, results from which are itemised in section 3.1.4 Qualitative data: First-person verbal accounts.
3. Results
3.1. Cognitive Stress (EEG)
Cognitive Stress is represented in the study by three dependent variables related to concentration or focus, arousal, and well-being. For this reason, three cognitive stress classifiers were used to analyse the EEG data: Theta/Beta Ratio (TBR), Beta/Alpha Ratio (BAR), and Frontal/Alpha Asymmetry (FAA).
The Theta/Beta Ratio (TBR) is a measure of concentration and focus. Negatively correlated with concentration, when TBR is low, individuals are concentrated. Higher TBR indicates mind-wondering or unfocused thought.
Participant arousal level was determined using the Beta/Alpha Ratio (BAR). Positively correlated with arousal, high BAR values indicate that individuals are more alert, while lower scores demonstrate less experienced arousal and more relaxation.
Finally, well-being was measured using the Frontal Alpha Asymmetry (FAA). Positively correlated with well-being, when greater well-being is experienced, FAA increases. Higher FAA values indicate a positive experience.
3.1.1. Theta/Beta Ratio (TBR) - Concentration and Focus
TBR is a calculation of the summed power of the theta band, divided by the beta band, from all four electrodes of the Muse S (Gen 2). The first exploratory analysis of the TBR data showed strongly different variances in the measurement data of the six stages. F-tests comparing how TBR measurements were distributed between pairs of stages confirmed that most variances of stages differed significantly from each other. Due to these heterogeneous variances, a repeated-measures ANOVA for the TBR data was not carried out. Instead its non-parametric counterpart, the Friedman test, was applied. The overall effect size of this test was estimated in terms of Kendall’s W. The Friedman test was conducted based on the six-level independent variable Stage (NA, P1, RS, VSM, PVSM, P2). It revealed a significant main effect of Stage on the average TBR levels across all participants (c²[5] = 14.714, p = 0.012, W=0.1), see Figure 6.
Additional pairwise comparisons in the form of Wilcoxon tests (with Bonferroni correction for multiple testing and r as effective-size indicator) showed that VSM (stage 4) differed significantly from stages P1 (stage 2) (W = 2.895, p = 0.004, r = 0.47), RS (stage 3) (W = 2.369, p = 0.018, r = 0.38), and P2 (stage 6) (W = -2.689, p = 0.007, r = 0.44), see Figure 7 for an overview. More specifically, participant TBR levels were lower during VSM stimulation (indicating higher concentration), compared to the resting stage (RS) that preceded the VSM, and the two text readings (P1 and P2). Post-VSM (PVSM) was unlike the subsequent P2 stage, as it was not characterised by a significant increase of TBR levels relative to the VSM stage.
3.1.2. Beta/Alpha Ratio (BAR) - Arousal
BAR is the summed power of the beta band divided by the alpha band, as recorded by all electrodes of the EEG device. An initial exploration of the data showed no violations for variance homogeneity (showing a normal distribution), so a one-way repeated-measures ANOVA was conducted for the BAR measurements. As shown in Figure 8, there were strong differences between BAR levels in each stage. Results show a successive decrease of participant BAR levels from the initial NA stage to the two stimulation-related stages VSM and PVSM. From PVSM to P2, BAR again increased to almost the same level as in the initial NA stage. Figure 8 shows that for all participants, arousal levels started high, and decreased considerably during RS, VSM and PVSM, before returning almost to the same level as when they began the study, during stage P2. Accordingly, the RM-ANOVA yielded a significant main effect of Stage on BAR measurements (F[5,160] = 29.588 , p < 0.001, hp² = 0.480).
Multiple pairwise comparisons of BAR levels between stages (with Bonferroni correction for multiple testing and Cohen’s d as measure of effect size) revealed that VSM (stage 4) differed significantly from the two reading stages P1 (t[37] = -7.161, p < 0.001, d = 0.53), and P2 (t[37] = -6.826, p < 0.001, d = 0.56). The VSM stage was associated with considerably lower BAR levels than P1 and P2, which indicates less arousal, as illustrated in Figure 9. The same was true for the initial NA stage (t[37] = -9.160, p < 0.001, d = 0.51). The BAR level during VSM stimulation was significantly lower than at the beginning of the experimental session during stage 1 (NA). In contrast, BAR level during the two resting stages, RS and PVSM, did not differ from the VSM stage. That is, BAR levels remained low in the stage before (RS), and in the stage following (PVSM), the VSM stimulation.
3.1.3. Frontal/Alpha Asymmetry (FAA) - Well-Being
To calculate FAA, the summed power (total energy) of the alpha band recorded at AF7 is divided by the summed power of the alpha band at AF8, and comparisons are drawn between the two. Due to a violation of variance homogeneity between the FAA measurements taken in the six stages, a Friedman test was conducted to analyse the FAA data. As illustrated in Figure 10, the FAA measurements differed between the stages more in terms of their variation than in terms of their mean levels. Accordingly, the Friedman test came out non-significant. Despite this, the VSM stage still stands out against the other stages in terms of its low variation in FAA measurements. A series of F-tests confirmed that FAA variance across participants was significantly lower during the VSM stage than during any other stage of the experimental session (with significance levels of at least F[37,14] = 0.111, p < 0.001).
3.1.4. Qualitative Data: First-Person Verbal Accounts
Purely descriptively, to connect quantitive EEG data with qualitative first-person verbal accounts, Table 2 features
transcriptions of participant responses immediately after the experimental procedure. TBR results are consistent with descriptions of cognitive entrainment, concentration and focus. BAR results are consistent with verbal accounts of cognitive arousal and relaxed disassociation, the latter regularly likened to a psychedelic experience. Although EEG FAA results were not significant, a reduction in variability of this metric is illustrated by verbal accounts of experienced themes of safety, security and comfort.
3.2. Physiological Stress (ECG)
Physiological Stress included two groups of dependent variables: one of heart rate itself (HR), and the other being its variability (HRV). HR data is addressed first.
3.2.1. Mean HR
The distribution and variance characteristics of the data allowed mean HR values to be analysed based on a one-way repeated-measures ANOVA. The main effect of Stages on participant heart rate levels was significant (F[5,160] = 4.232 , p < 0.001, hp² = 0.120). Figure 11 shows that participant heart rate levels decreased successively from around 80-90BPM during the NA (stage 1) and P1 (stage 2) stages, before reducing by about 15-20% to around 70BPM in RS (stage 3). From here, HR reduced even further to between 60-65BPM during the VSM (stage 4) and PVSM (stage 5) stages, which is an additional decrease of almost 15%. After PVSM, heart rate increased again in P2 (stage 6) when participants read a speech text excerpt for a second time.
Multiple pairwise comparisons of mean HR levels between stages (with Bonferroni correction for multiple testing and Cohen’s d as measure of effect size), revealed that each stage differs significantly from the preceding one. That is, the decrease from NA to P1 is significant (t[37] = 4.377, p < 0.001, d = 5.31), as is the one from P1 to RS (t[37] = 21.721, p < 0.001, d = 3.17). Most importantly, heart rate also decreased significantly from RS to VSM (t[37] = 6.422, p < 0.001, d = 5.39), while the VSM stage does not differ from PVSM. Alike TBR and BAR results, HR in the VSM stage differs from both of the reading stages P1 (t[37] = -17.862, p < 0.001, d = 5.80) and P2 (t[37] = -9.048, p < 0.001, d = 8.19). Figure 12 is an overview of all significant HR differences between the stages.
3.2.2. Mean HRV
The mean HRV data met all requirements to be statistically analysed in terms of a RM-ANOVA, based on the six-level fixed factor Stage. Alike mean HR, the main effect of Stage on mean HRV was significant (F[5,160] = 2.311 , p = 0.047, hp² = 0.069), albeit to a weaker degree than for mean HR. Figure 13 shows that HRV levels increased after RS (stage 3) by almost 30%, and only decreased again after PVSM, during P2 (stage 6).
Itemised in Figure 14, multiple pairwise t-tests (with Bonferroni correction for multiple testing and Cohen’s d as measure of effect size) show that HRV mean differed significantly between RS (stage 3) and VSM (stage 4) (t[37] = -12.404, p < 0.001, d = 100.64), as well as between PVSM (stage 5) and P2 (stage 6) (t[37] = 7.120, p < 0.001, d = 118.49). In addition, mean HRV levels during VSM (stage 4) were notably different from the two reading stages P1 (stage 2) (t[37] = 18.311, p < 0.001, d = 77.46), and P2 (stage 6) (t[37] = 6.424, p < 0.001, d = 113.51). A complete overview of significant pairwise comparisons is provided in Figure 14.
3.2.3. Sympathovagal Balance: LF/HF Ratio
To measure activity of the heart and cardiac system, time and frequency domain analysis is used. The LF/HF ratio is a frequency domain analysis metric from which the sympathovagal balance of the autonomic nervous system can be deduced [80]. This is a ratio between the spectral power of low frequencies (which are indicators of sympathetic activity), and the spectral power of high frequencies (which indicate parasympathetic activity). High LF/HF ratio indicates dominance of the sympathetic nervous system [81], and low LF/HF ratio implies parasympathetic activity and a relaxed response.
To analyse the LF/HF ratio data, the Friedman test was used as a non-parametric pendant of the RM-ANOVA. Again, Stage was the six-level independent variable. The main effect of Stage was significant (c²[5] = 60.647, p < 0.001, W=0.32). As seen in Figure 15, this main effect is primarily caused by a decrease in the ratio of about 35% from the first reading to the resting stage (P1 to RS). It then strongly decreased further by almost 60% from the resting stage (RS) to the VSM stimulation. According to the additional Wilcoxon tests that were carried out between the levels of Stage (with Bonferroni correction for multiple testing and r as effective-size indicator), both decreases were statistically significant (P1-RS: W = 2.207, p = 0.027, r = 0.36; RS-VSM: W = 3.495, p < 0.001, r = 0.57). Although the increase in the LF/HF ratio after PVSM (stage 5) was small, the difference between VSM (stage 4) and P2 (stage 6) was also significant (W = 2.023, p = 0.043, r = 0.33). This shows on average that the ratio was higher in the second reading stage (P2) than during the VSM. Figure 16 provides a summary of all significant differences in LF/HF ratios between the experiment stages.
3.2.4. Sympathetic Activity: SDNN and LF
To understand the sympathetic activity of participants across the study stages, two measures were implemented: SDNN (a time domain measure of the standard deviation of RR intervals) and LF (a frequency domain measure of the spectral power of low frequencies). Taking into account the distributional characteristics and variability of the data, the first measure, SDNN, was analysed based on a RM-ANOVA, while the second measure, LF, was analysed based on a Friedman test. In addition to the graphical summaries in Figure 17 and Figure 18, Table 3 summarises the results of the inferential statistics.
Table 3 shows the significant main effects of Stage found on both measures of sympathetic activity (SDNN and LF). In combination with Figure 17 and Figure 18, it can be seen that the effects go in opposite directions. For SDNN, there was a stepwise increase in measurements, specifically a tripartition. The first two stages, NA and P1, yielded similarly low SDNN levels. Then, SDNN went up to similar degrees during the next three stages RS, VSM and PVSM. The third and last increase occurred for the final P2 stage. Alike for many other measures, the key stimulation stage, VSM, differs from both reading stages P1 and P2, as well as from the initial stage of normal activity (NA), but not from the surrounding inactive stages RS and PVSM.
By contrast, LF measures did not increase but decreased under VSM stimulation and remained similarly low in the subsequent PVSM stage. Both VSM and PVSM yielded significantly lower LF values than the preceding resting stage (RS). The two reading stages (P1 and P2) caused on average higher participant LF levels than both the VSM stage and the following PVSM stage.
3.2.5. Parasympathetic Activity: RMSSD and HF
To determine how the six experimental stages affected participant parasympathetic activity, two metrics were used: RMSSD (a time domain indicator of beat-to-beat variability between adjacent RR intervals), and HF (a frequency domain metric measuring the spectral power of high frequencies). The data of both dependent variables violated the distributional characteristics required to conduct a RM-ANOVA, and so two Friedman tests were performed, results of which are summarised in Table 4. In addition, Figure 19 and Figure 20 provide boxplot summaries of the measurement differences across the six stages.
As shown in Table 4, the independent variable Stage had significant main effects on both dependent variables RMSSD and HF. The two effects were strong and also similar: RMSSD and HF levels were sustained for VSM (stage 4) and throughout the last two stages (PVSM and P2). This differed from the two preceding stages NA (stage 1) and P1 (stage 2). Unlike for most other measures, there was not a notable difference between VSM measurements of these metrics compared to the PVSM and P2 stages.
Figure 19 shows that RMSSD went up across the six stages. More specifically, it increased from the resting stage (RS) to the VSM stimulation stage. All three stages before VSM were statistically indistinguishable in terms of RMSSD. The same was true for the VSM stage and the two following stages.
For the HF measure, Figure 20 illustrates a significant change from the resting stage (RS) to the key stimulation stage (VSM) and the two subsequent stages (PVSM and P2). There is also a bipartition of the HF measurements across the six stages of the experiment. The bipartition is distinguished between the first three stages (NA, P1 and RS) and the last three stages of the study (VSM, PVSM and P2), as an increase in HF levels at the VSM stage and throughout the following two stages.
However, unlike RMSSD measurements, participant HF levels were already relatively high in the initial normal activity stage (NA), which is why no significant increase was found in HF levels between the NA and VSM stages.
3.3. Psychological Stress
To understand if VSM benefits individuals with higher perceived psychological stress, all quantitive dependent variables in Section 3.1 and Section 3.2 are considered: TBR, BAR, FAA, mean HR, mean HRV, LF/HF ratio, SDNN, LF, RMSSD, and HF. For each of these metrics, participant data was calculated individually - as the difference between the measured value during VSM (stage 4), compared to the measured value of the NA condition (stage 1). If VSM had a big effect on perceived psychological stress, then the difference in values between VSM and NA would be large. In contrast, if VSM stimulation had little to no influence on participant cognitive or cardiac activity, then the difference between the two conditions would be virtually 0.
Total PSS-10 scores from all 38 participants were individually correlated with their respective VSM-NA difference values. Due to the distributional characteristics of the data, a non-parametric Spearman’s Rho correlation was used. Table 5 summarises the results. There are two significant, negative correlations: one concerning SDNN, and the other of the LF measure. A note that parasympathetic activity is indicated by increased RMSSD and HF, and sympathetic activity is shown by reduced SDNN and LF values. Thus, both SDNN and LF are representative estimates of sympathetic nervous system activity. Negative correlations of SDNN and LF with PSS-10 scores, mean that participants with higher PSS-10 scores produced smaller VSM-NA difference values. Smaller VSM-NA difference values mean lower VSM values. Thus, the correlations can be summarised as follows: relative to the initial NA condition, the higher the perceived psychological stress level of a participant before VSM stimulation, the more the VSM stimulation reduced their sympathetic nervous system activity. It’s important to note that although sympathetic nervous system activity decreased, parasympathetic activity did not increase.
In addition to the correlations, a series of between-subjects comparisons were conducted using Mann-Whitney U-tests. Using the average score of all participants as a dividing threshold, each participant was separated into either a Low Stress or High Stress group. The Low Stress group were participants with a psychological stress score of less than or equal to 24 (on the scale of 0-50, N = 22). The High Stress group were those with a psychological stress score of 25 and higher (N=16). Results of the U-tests supported the correlations found. Participants with higher total stress scores (>=25) had significantly smaller VSM-NA difference values than those with lower total stress scores (<=24). This was true for both SDNN (U[22,16] = 249, z = 2.158, p = 0.031), and for LF (U[22,16] = 246, z = 2.070, p = 0.038).
The top two panels in Figure 21 illustrate how the two psychological-stress groups differ in SDNN and LF when their NA measurements are subtracted from their VSM measurements. Although results look similar initially, one aspect must be noted: in the case of LF (Figure 21 top right panel), the VSM-NA difference values dropped from an average of about 0 (Low Stress group) to a clearly negative value range (High Stress group). In contrast, the difference values for SDNN (Figure 21 top left panel) decreased from a positive value (Low Stress group) to a value of almost 0 (High Stress group). This means that although both SDNN and LF were significantly reduced by VSM stimulation, only LF values for the High Stress group fell below 0, thus back to the level of the initial NA stage. This indicates a positive effect of the VSM treatment in terms of reduced activity of the sympathetic nervous system for the High Stress group.
The two lower panels in Figure 21 show two further stress-group differences for the RMSSD and HF measures from which no significant correlations were obtained. The RMSSD difference values again relied on a U-test result (U[22,16] = 249, z = 2.158, p = 0.031) and the HF difference values could be analysed in a univariate ANOVA (F[1,36] = 4.958, p = 0.032, hp² = 0.121). Results of RMSSD and HF fell from a clearly positive range of values for the Low Stress group, to a range of values close to 0 for the High Stress group. This means that, compared to their initial NA values, VSM stimulation had essentially no effect on the High Stress group, in terms of increasing their RMSSD and HR values. In contrast, the Low Stress group did benefit from VSM exposure in the form of higher RMSSD and HR values (both of which are markers of parasympathetic activity).
4. Discussion
The aim of the study was to investigate the nature and effectiveness of a vibroacoustic technology called Vibroacoustic Sound Massage (VSM). The research tested a vibrotactile bed-like device [38] on which participants would lay in the supine position for a 45 minute stimulation. They were stimulated with both tactile vibration and acoustically through ambient soundscapes tailored to and time-aligned with these vibrations.
Three research questions were tested. Research Question One (RQ1) addressed effects of cognitive stress: How does VSM affect mental processing? Associated with this question was the following hypothesis (H1): VSM has positive effects on user concentration, relaxation, and well-being. During VSM stimulation participants were assumed to be more concentrated while in a more relaxed state: as less cognitively aroused or alert, and to feel improved overall well-being. In terms of EEG measures, this would mean a lower TBR level, a lower BAR level, and a higher FAA level.
Research Question Two (RQ2) assessed physiological stress: How does VSM affect the autonomic nervous system, vagal tone and heart rate? The corresponding hypothesis (H2) was: VSM would lower physiological stress, increasing parasympathetic, and decreasing sympathetic nervous system activity. With respect to the applied measures, this would manifest as an increase in mean HRV and a decrease in mean HR. Increased RMSSD and HF levels would also be expected, as well as reduced SDNN and LF levels.
Research Question Three (RQ3) dealt with psychological stress: Are participants with higher PSS-10 scores more impacted by VSM? The following hypothesis (H3) was put forward: VSM benefits individuals with higher perceived psychological stress. The assumption is that participants with higher PSS-10 scores (the High Stress group) would show more pronounced VSM effects in terms of (H1) and (H2).
The experimental sessions consisted of six stages. This was to enable thorough investigation of the three research questions and hypotheses from different angles, and to collect data beyond the three research questions and hypotheses addressed in the present paper, see Fooks & Niebuhr (2024) [79]. Stage 1 (NA) served as a control reference or baseline condition. As the research was conducted in Copenhagen, Denmark, it’s likely participants would have biked to the study location. NA enabled participant heart rates to return to a more normative restful state. However, NA required participants to simply sit and listen, which is not the most natural ‘normal activity’. Stage 2 (P1) matched the naturalness criterion more appropriately as a condition in which participants sat and read a text aloud. A study by Emanuel et al. (2008) [82] which also used students as the main participant group, showed that listening took up about the same amount of time in student everyday lives as reading and speaking. Therefore, P1 is regarded as a second and arguably more realistic baseline condition for a student participant sample. Stage 3 (RS) was a resting control state for participant HR, before the VSM stimulation in stage 4. Additionally, if and how the RS stage differed from the VSM stage and the two control stages of NA and P1 respectively, indicated whether VSM effects could be ascribed to the VSM stimulation itself, or whether results were simply the effect of several minutes of rest in a comfortable supine position with closed eyes. Stage 5 (PVSM) supported estimation of the sustainability of VSM stimulation effects: the differences between VSM and PVSM informed the degree to which VSM effects continued beyond the end of the stimulation itself. During stage 6 (P2), participants read aloud the same text as in P1. Neither the P1 nor P2 conditions were analysed in the present study, though a discussion of these results can be found in Fooks & Niebuhr (2024) [79].
4.1. Discussion of Cognitive-Stress Effects
Levels of participant TBR (Theta/Beta Ratio, a metric of concentration and focus) dropped significantly in the VSM stage, both in relation to the second reference condition P1 and the preceding resting condition RS. In the subsequent PVSM stage, TBR remained low, before increasing significantly again in the P2 stage. The following conclusions can be drawn from this: VSM had a concentration-enhancing effect. This effect was genuine as it differed in the same way from the RS stage as from the reference condition P1. The difference with the preceding RS stage indicated that lying on the device in a comfortable, supine position with eyes closed was not solely responsible for the VSM effect on TBR. The effect was sustained as the TBR level remained consistently low during the PVSM stage, while subsequent activity after this (during P2) reversed the effect. The reversal was complete, because TBR levels in P2 did not differ from those in the initial reference conditions NA and P1. These TBR results indicate that mind-wondering diminished and concentration or focus increased. This finding is supported by research showing that vibroacoustic stimulation can evoke a cognitive flow state [83]. Results from the present study don’t imply that participants were concentrated on daily tasks or practicalities, but rather that their focus was toward the experience of the VSM itself. Verbal first-person accounts are consistent with this, with participants reporting feeling creative and an ability to ‘zone’ in and out of thoughts (see Table 2). On many occasions a psychedelic trip-like state was described, alongside ‘seeing’ changes in light and colour in-sync with the music and vibration (see section 3.1.4 Qualitative data: First-person verbal accounts). Cognitively, VSM seems comparable to a 3D planetarium experience as participants were perceptually removed from everyday routine with their locus of attention toward an immersive experience. As their eyes were closed throughout, the only perceptual avenues participants were able to access were tactile and audible. TBR results and verbal accounts together indicate that the focal point of concentration was an embodied, immersive perceptual VSM experience. More research is required to better understand what attributes of VSM (auditory, tactile, or both) caused this outcome.
Participant BAR levels (Beta/Alpha Ratio, a metric of arousal) dropped significantly in the RS stage, remaining here during the VSM stage, and in the subsequent PVSM stage. All other surrounding activity stages (NA, P1 and P2) showed higher BAR levels. This leads to the following conclusions: an expected effect of VSM on BAR was found, that participants became less aroused and more relaxed. Crucially however, there is no evidence of a separate relaxation effect of VSM stimulation. That is, a diminished BAR level was sustained across the RS, VSM, and PVSM stages, which implies it was the combination of closed eyes and a quiet, lying position that caused lower BAR levels. Notably, there is no evidence in the data that VSM stimulation negatively interfered with the relaxation levels obtained by participants initially during the RS stage. This reduction in arousal and relaxation effect was completely reversed in the P2 stage, as the BAR level immediately rose back to the level of the two reference conditions NA and P1. With very little variation between participants, these BAR results indicate that all participants simultaneously remained relaxed during the RS, VSM, and PVSM stages.
There were no significant effects for the FAA level (Frontal/Alpha Asymmetry, a metric of well-being). This result indicates that neither the VSM stimulation nor the surrounding rest phases could demonstrably increase the well-being of participants. This result may be due to inter-individual participant variables, and a larger participant sample is required in future studies for result generalisability. Descriptively however, the average variability of FAA reduced. That is, participants with low levels of well-being prior to VSM exposure ended the study feeling a lot better, while participants starting the study with high levels of well-being, sustained this. A larger participant sample is required to gain statistically significant FAA results.
In summary, hypothesis 1 (H1) can be partially accepted. There is clear empirical evidence that VSM stimulation can positively influence cognitive stress and induce higher levels of concentration. VSM stimulation does not have a negative effect on relaxation, but the type and strength of the relaxation effect cannot be distinguished from other stages of rest when lying down with eyes closed. Well-being was not significantly increased through VSM stimulation, though variability of this metric was homogeneously reduced.
4.2. Discussion of Physiological-Stress Effects
Measurement parameters for physiological stress were multifaceted. As the essential effects on all were respectively similar they are discussed together. Most importantly, stimulation effects were obtained in the direction expected by hypothesis 2 (H2) (except for SDNN). Additionally, results indicate that many effects of VSM also stood out from the previous RS stage. This suggests that the VSM stimulation had genuine, beneficial effects on physiological stress that went beyond what could be achieved by a comfortable supine position and closed eyes alone. Participant heart rates decreased further in the VSM stage when compared to the RS stage, and a shift toward more parasympathetic than sympathetic autonomic nervous system activity was more pronounced in the VSM stage than in the previous RS stage. These results are significant, indicating that HRV is positively affected (reduced) during and after VSM exposure. Expectedly, though less categorically, the opposite is true for HR. HR was higher for the NA and P1 stages, decreased during RS, and dramatically dropped during VSM and PVSM. Increasing only marginally for P2, all participants were more physiologically relaxed at the end of the study than when they began. Mean HR during VSM and PVSM was comparable to that of a healthy sleeping adult (around 60 BPM), demonstrating that VSM induces a restful physiological state.
Hypothesis 2 anticipated an increase in HRV RMSSD and HF values (indicative of parasympathetic activity) which results reflect. Throughout NA, P1 and RS, lower levels of both metrics were sustained, before increasing during VSM and remaining high throughout the PVSM and P2 stages. This shows that VSM onset categorically increases RMSSD and HF. These results effectively illustrate that VSM increases parasympathetic activity. Less significantly affected were metrics of sympathetic activity. Results show LF marginally decreased, while SDNN in fact increased. Compatible with hypothesis 2, LF gradually decreased in NA, P1 and RS, and remained low throughout VSM and PVSM, before increasing again at P2. The rise during P2 could be due to the condition demanding concentrated reading. It’s likely that the stark contrast between a relaxed state and a focused reading task could have spiked sympathetic activity. Similarly, participants were reading aloud with a researcher present in the room, which had potential to heighten physiological and cognitive alertness. Alike LF, SDNN also decreased in NA, P1 and RS, before unexpectedly marginally increasing between VSM, PVSM and P2.
With regard to the sustainability of these beneficial effects of VSM stimulation, the results are as clear as they are homogeneous across all parameters. None of the physiological stress parameters showed a reversal of the RS-to-VSM changes in the PVSM stage. The positive physiological effects of VSM stimulation remained qualitatively and quantitatively intact even in the subsequent rest phase. Even when participants became active again during the P2 stage, most parameter levels did not bounce back to their original levels as in the reference conditions NA and/or P1. Among the parameters that partially retained the positive physiological effects of VSM stimulation in the P2 stage were mean HR, mean HRV, LF/HF ratio, LF, RMSSD and HF.
In summary, hypothesis 2 (H2) can be fully accepted. The only exception was the SDNN parameter, which did not evolve in the same direction as the LF parameter. It was not possible to determine why SDNN was an exception and why it differed even from its neighbouring measure LF. However, due to the complexity of the physiological stress measurements and the fact that the SDNN results were not only contradictory to LF and all other parameters but also weaker overall, there is no need to over-interpret SDNN results in the sense of them undermining (H2). This result may be due to the robustness of the metric with regards to sensitivity [84]. Future studies could limit themselves to HF and LF parameters to avoid similar result patterns, though as these have been shown to decline in human subjects with age [85], appropriate metrics need be implemented relative to study design.
4.3. Discussion of Psychological-Stress Effects
The data did not provide a consistent answer to whether people with high levels of psychological stress benefit more from VSM stimulation than others. There were two significant (negative) correlations of participant PSS-10 scores in line with this hypothesis (H3): the VSM-to-NA differences of both SDNN and LF (metrics of sympathetic activity). These results indicate that the higher a participants’ self-determined psychological stress level, the more VSM stimulation was able to reduce their SDNN and LF levels. However, correlations were weak and levels of explained variance were low. Additionally, it was only the VSM-to-NA differences of LF that fell on average below 0. This means that even though SDNN was negatively correlated with PSS-10 scores, SDNN levels for participants with high PSS-10 scores were still higher in the VSM than in the NA stage. When participant PSS-10 scores were high, VSM stimulation reduced only the LF metric below those of the NA stage. This result indicates that VSM has a less-profound effect on the parasympathetic activity of those in the High Stress group. Thus, High Stress participants responded less-well to VSM.
Additional pairwise comparisons between the High Stress and Low Stress groups revealed two further differences in RMSSD and HF (parasympathetic activity metrics). These differences suggest that participants with low PSS-10 scores benefitted more from VSM stimulation, experiencing more parasympathetic activity than participants with high PSS-10 scores. These results contradict hypothesis 3 (H3), which assumed that VSM would benefit individuals with higher perceived psychological stress, thus effects do not align with hypothesis 3. Overall, results are inconclusive with regard to hypothesis (H3), and are limited solely to measures of physiological stress. There were no effects at all for parameters of cognitive stress, thus the hypothesis must be rejected rather than accepted.
One possible explanation – to be dealt with in detail in future studies – could be that VSM stimulation does not have the same effect on all people, depending on their personal background and living conditions. For example, VSM could have a stronger and/or more positive effect on parasympathetic activity for people with lower PSS-10 scores, whereas for people with higher PSS-10 scores it has a stronger and/or more positive effect on sympathetic activity. That is, people who perceive their life predominantly as unpredictable, uncontrollable and overloading, could benefit from VSM by a mitigated “flight-and-flight” response rather than an enhanced “rest-and-digest” nervous system response.
The authors are currently conducting a follow-up study [86] that assesses the effects of inter-individual lifestyle differences on VSM stimulation. The research implements the International Physical Activity Questionnaire (IPAQ) [87] to understand how and if physical activity levels determine VSM efficacy (with respect to the regulatory effect of exercise on nervous system activity and HRV metrics). Additionally, the study aims to understand if participants who engage in higher levels of mindfulness are more or less affected by VSM. To this end, the study integrates a self-report measure of perceived mindfulness, the Freiburg Mindfulness Inventory (FMI-13) [88].
4.4. Relevance and Implications
In addition to a first study by the same authors evaluating effects of VSM on speech acoustics [79], this research is further evidence in favour of the effectiveness of VSM. While changes in speech are behaviour-based, this study directly quantifies the effects of VSM using EEG and ECG (both biosignals that do not demand behavioural manifestation). The present data shows, in greater detail than that of speech analysis, that VSM can reduce user cognitive stress and aid concentration. Additionally, the main positive effect of VSM concerns physiological stress, which is reduced by the modality. Contrary to effects on cognitive stress, a reduction in physiological stress from VSM lasts well beyond the stimulation period. Future research is required to more precisely determine how long this positive physiological-stress effect lasts.
It should be emphasised that the positive effect VSM has on physiological stress is of great social benefit, as physiological stress is a driving force for depression [89,90,91] and a number of cardiovascular diseases from hypertension to heart attacks to insomnia and obesity [92,93,94,95,96]. These results provide further evidence in support of the utility for vibroacoustic VSM technology.
The inventors of the VSM technology claim that it is “immediately relaxing [to] the mind and body, eliciting feel-good emotions, an increased state of well-being and improved mind-body connection” [97]. They further state that their technology is “legitimising the power of sound vibration therapy as an effective and non-invasive Vagus Nerve Stimulation (VNS), activating the parasympathetic nervous system, the ‘rest and digest’ state” [97], although results from this study are not entirely consistent with these claims. On the one hand, data clearly demonstrates an effective and non-invasive Vagus Nerve Stimulation (VNS), in addition to a resulting shift toward greater parasympathetic nervous system activity. On the other hand, the data also indicate that inter-individual differences determine the degree of its effectiveness as evidenced in PSS-10 scores. Additionally these findings, alike Fooks & Niebuhr’s (2024) speech-signal analysis [79], contain no objective (EEG) evidence of stimulated feel-good emotions or a heightened state of well-being. Of course, it is possible that the EEG measurements were not sensitive enough to support these claims with data; or it may be that the experimental study conditions could have affected VSM outcomes. With regards to the latter, all research conducted into vibroacoustic technology is limited outside of a clinical setting. Follow-up in-situ testing, extensive debriefing questionnaires, and/or a hospital-grade EEG device data would help resolve empirical uncertainties.
4.5. Limitations and Outlook
The present study was limited in a select few ways. Firstly, participant sample size was relatively small and focused mainly on a select group of educated participants (primarily young educated university students). This sample is evidently non-representative of the general public and thus results are not generalisable outside of this demographic. Importantly, these results are not representative of the future target customers for VSM. Thus, more research with a larger and more diverse participant pool need be conducted to gain broader, more nuanced insights into the modality and its affects, which is currently underway by the same authors.
Secondly, the present study also collected additional lifestyle meta-data (into exercise routines, sleeping and smoking habits, mindfulness practises like meditation, and perceived musicality insights), none of which was analysed here. An analysis of this collated with the results as discussed will aid further comprehension of VSM effects, which will be available in a future paper.
Thirdly, the 45 minute VSM stimulation time in the present study is not a practical duration for many; neither for individual users and/or if the technology is used in businesses for workday breaks. The authors are currently conducting a study using the same VSM technology with a shorter stimulation time of 20 minutes, to assess if effects are still present. Future research could be conducted to quantify at what point VSM effects are optimal, measuring both for their onset and duration. This would provide insight as to minimum stimulation time required for VSM, which would be beneficial both for end users and in future development of vibroacoustic products.
Fourthly, very limited speculative conclusions can be drawn from this data with respect to long-term effects. Future longitudinal studies need be conducted to better understand prolonged effects of vibroacoustic interventions.
Fifthly, additional studies specifically comparing vibroacoustic technology with Vagus Nerve Stimulation (VNS) need be conducted to define it either as an adjunct treatment or replacement with similarities and differences thoroughly defined between the two.
Lastly, the resting and stimulation stages RS, VSM and PVSM showed more significant differences overall to the P1 stage than to the NA stage. This indicates that P1 is a more appropriate reference control condition than NA, which is likely due to inter-individual participant variables. Future studies should consider even more accurate natural control baseline measures to be used as reference markers for all participants that sustain study ecological validity.
5. Conclusions
Overall, results from the present study show that VSM outcomes are not affected by age (within the participant sample age range between 20-35 years old). Hypothesis 1 was partially validated, as VSM effects concentration (TBR), arousal (BAR), and homogeneously reduced variability in participant well-being (FAA). Concentration (TBR) increased during VSM, with results indicating a reduction in mind-wondering and improved focus. Significant reductions in alertness and arousal show that VSM increased relaxation (BAR), in addition to the two rest conditions pre- and prior- the VSM study stage. Though significant results were not found with respect to well-being improvement (FAA), VSM homogeneously reduced variation of well-being for all participants. With respect to hypothesis 2, VSM increases parasympathetic activity (indicated by increased RMSSD and HF), and marginally decreases sympathetic activity (lowered LF and increased SDNN). Hypothesis 3 was disproven as PSS-10 scores indicated that VSM is no more effective for individuals experiencing High Stress compared to a Low Stress group. Unexpectedly, VSM increased parasympathetic activity for the Low Stress group. Collectively these results indicate that VSM effectively reduces physiological and cognitive stress, though it is no more effective for High Stress groups.
Implications for future research are broad, including: a broader participant sample size and age scope; alterations in stimulation length to assess whether shorter exposure has similar effects; longevity testing to measure for sustained longitudinal outcomes; inclusion of meta-data for comparison with EEG and ECG metrics; implementation of additional qualitative analysis tools such as questionnaires and first-person verbal accounts to deepen subjective insights; inclusion of musicality metrics like the Ollen Musical Sophistication Index (OMSI) and the Goldsmiths Musical Sophistication Index (Gold-MSI) to determine how individual ability and musical preference may affect VSM outcomes; measurement of different sounds, frequencies and rhythms to qualify the most effective outcomes of the intervention. Future implications for vibroacoustic development, may include the introduction of custom-made vibroacoustic soundscapes tailored for individual preferences and need.
Contemporary societal pressures and psychologically detrimental platforms (such as the likes of new technologies and social medias) together support rising discontent and global mental health diagnoses. Thus, new tools to reduce stress and improve sympathovagal balance that are cost-effective and non-invasive continue on a highly sought-after trajectory. Further development of vibroacoustic technology could leverage it as a viable tool to support shifting societal needs, with more research required to quantify its multifaceted effects.
Supplementary Materials
The following supporting information can be downloaded at: Preprints.org, Figures. Figure 1: Locations of nodes in the Muse S (Gen 2) electroencephalogram (EEG) headband, Figure 2: Description of a PQRST complex (and concurrent cardiac cycle) recorded by an electrocardiogram (ECG), Figure 3: Movement of electrical signals sent by the sinus node during a PQRST complex (one cardiac cycle), Figure 4: Visualisation of an ECG with RR intervals marked, Figure 5: A participant ECG recorded during the study. The horizontal axis shows beat-per-minute (BPM) values, Figure 6: Boxplot summary of TBR results for the six stages of the study, shown in chronological order from bottom to top. The horizontal axis shows dB ratios, Figure 7: Overview of the Wilcoxon TBR test results. Thick black lines show the significant differences between VSM and other stages (P1, RS, P2); dotted black lines indicate other significant TBR differences between stages (P1, PVSM, P2), Figure 8: Boxplot summary of BAR results for the six stages of the study, shown in chronological order from bottom to top. The horizontal axis shows dB ratios, Figure 9: Overview of the pairwise-comparisons t-test results. Thick black lines show the significant differences between VSM and other stages (NA, P1, P2); dotted black lines indicate other significant BAR differences between stages, Figure 10: Boxplot summary of FAA results for the six stages of the study, shown in chronological order from bottom to top. The horizontal axis shows dB values, Figure 11: Boxplot summary of mean HR results for the six stages of the study, shown in chronological order from bottom to top. The horizontal axis shows beat-per-minute (BPM) values, Figure 12: Overview of the pairwise-comparisons t-test results. Thick black lines show the significant differences between VSM and other stages (NA, P1, RS, P2); dotted black lines indicate other significant mean HR differences between stages, Figure 13: Boxplot summary of mean HRV results for the six stages of the study, shown in chronological order from bottom to top. The horizontal axis shows variability values in milliseconds, Figure 14: Overview of the pairwise-comparisons t-test results. Thick black lines show the significant differences between VSM and other stages (NA, P1, RS, P2); dotted black lines indicate other significant mean HRV differences between stages, Figure 15: Boxplot summary of LF/HF ratio results for the six stages of the study, shown in chronological order from bottom to top. The horizontal axis shows ratios of two Hz values, Figure 16: Overview of the pairwise-comparisons Wilcoxon test results. Thick black lines show the significant differences between VSM and other stages (NA, P1, RS, P2); dotted black lines indicate other significant LF/HF ratio differences between stages, Figure 17: Boxplot summary of SDNN results for the six stages of the study, shown in chronological order from bottom to top. The horizontal axis shows Hz values, Figure 18: Boxplot summary of LF results for the six stages of the study, shown in chronological order from bottom to top. The horizontal axis shows Hz values, Figure 19: Boxplot summary of RMSSD results for the six stages of the study, shown in chronological order from bottom to top. The horizontal axis shows dB values, Figure 20: Boxplot summary of HF results for the six stages of the study, shown in chronological order from bottom to top. The horizontal axis shows Hz values, Figure 21: Boxplot summary of HF results for the six stages of the study, shown in chronological order from bottom to top. The horizontal axis shows Hz values. Images. Image 1: Participant wearing a Muse S (Gen 2) EEG Headband, Image 2: Mind Monitor iPad application displaying live EEG data, Image 3: Participants in the research setting experiencing a VibroAcoustics Sound Massage (VSM). Tables. Table 1: Study design protocol itemised by study stage, Table 2: Transcribed participant quotes itemised by EEG relevancy, Table 3: Test statistics (left) and multiple-comparisons tests (right) for the two dependent variables SDNN (top) and LF (bottom), Table 4: Test statistics (left) and multiple-comparisons tests (right) for the two dependent variables RMSSD (top) and HF (bottom), Table 5: Results of the non-parametric correlations between the measures (dependent variables) of the experiment and the VSM-NA difference values of the 38 participants.
Author Contributions
Conceptualization, Charlotte Fooks; Methodology, Charlotte Fooks; Software, Oliver Niebuhr; Validation, Oliver Niebuhr; Formal Analysis, Oliver Niebuhr; Investigation, Charlotte Fooks; Resources, Oliver Niebuhr; Data Curation, Charlotte Fooks and Oliver Niebuhr; Writing – Original Draft Preparation, Charlotte Fooks; Writing – Review & Editing, Charlotte Fooks and Oliver Niebuhr; Visualization, Charlotte Fooks and Oliver Niebuhr; Supervision, Oliver Niebuhr; Project Administration, Charlotte Fooks; Funding Acquisition, Charlotte Fooks.
Funding
This research was funded by Danish Sound Cluster (DSC), CVR-40137319.
Institutional Review Board Statement
Ethical review and approval were waived for this study, in accordance with Retsinformation Decree on Medical Devices, pursuant to §§ 1-6 of Act No. 1046 of 17 December 2002 on medical equipment, as amended by § 109 of Act No.1180 of 12 December 2005. As a quality control efficacy study, this waiver is also in accordance with guideline no.11052 of 2 July 1999 on “Guidance on the introduction of new treatments in the healthcare system”. It is also in accordance with the National Videnskabsetisk Komité (NVK) health science and health data science research project guidelines. All personal information obtained was used in accordance with regulations in the Danish Data Protection Act and treated under Article 6, Paragraph 1, Litra A, and Article 9, Paragraph 2, Litra A.
Informed Consent Statement
Informed consent was obtained from all subjects involved in the study. All personal information obtained was used in accordance with regulations in the Danish Data Protection Act and treated under Article 6, Paragraph 1, Litra A, and Article 9, Paragraph 2, Litra A.
Data Availability Statement
The data presented in this study are available on request from the corresponding author due to signed participant confidentiality statements. Data may be obtained from the first author upon request.
Acknowledgments
Extensive gratitude is given to University of Southern Denmark (SDU), Copenhagen for the study location, Paul Fooks for preliminary data cleaning, Keve Márton Gonaczci for Python coding and Lily Baastrup for data collection assistance. Special thanks to the voluntary study participants.
Conflicts of Interest
The authors declare no conflict of interest. The funders had no role in the design of the study; in the collection, analyses, or interpretation of data; in the writing of the manuscript; or in the decision to publish the results.
References
- Nochaiwong, S.; Ruengorn, C.; Thavorn, K.; Hutton, B.; Awiphan, R.; Phosuya, C.; Ruanta, Y.; Wongpakaran, N.; Wongpakaran, T. Global Prevalence of Mental Health Issues Among the General Population During the Coronavirus Disease-2019 Pandemic: A Systematic Review and Meta-analysis. Sci Rep 2021, 11, 10173. [Google Scholar] [CrossRef] [PubMed]
- Gale, N. The Sociology of Traditional, Complementary and Alternative Medicine. Sociol Compass 2014, 8, 805–822. [Google Scholar] [CrossRef] [PubMed]
- Zou, L.; Sasaki, J.E.; Wei, G.X.; Huang, T.; Yeung, A.S.; Neto, O.B.; Chen, K.W.; Hui, S.S. Effects of Mind-Body Exercises (Tai Chi/Yoga) on Heart Rate Variability Parameters and Perceived Stress: A Systematic Review with Meta-Analysis of Randomized Controlled Trials. J Clin Med 2018, 7. [Google Scholar] [CrossRef] [PubMed]
- Danylova, T.V.; Shmarhun, V.M.; Vertel, A.V.; Matyushko, B.K.; Bondarenko, A.F.; Kychkyruk, T.; Petersen, J. Effects of the eastern mind-body practices on mental health during the covid-19 pandemic: When east meets west. Wiad Lek 2021, 74, 2850–2855. [Google Scholar] [CrossRef] [PubMed]
- Gangadhar, B.; Porandla, K. Yoga and Mental Health Services. Indian Journal of Psychiatry 2015, 57, 338–340. [Google Scholar] [CrossRef] [PubMed]
- Singphow, C.; Purohit, S.; Tekur, P.; Bista, S.; Panigrahy, S.N.; Raghuram, N.; Nagendra, H.R. Effect of Yoga on Stress, Anxiety, Depression, and Spinal Mobility in Computer Users with Chronic Low Back Pain. Int J Yoga 2022, 15, 114–121. [Google Scholar] [CrossRef] [PubMed]
- Chopra, D.; Stern, E.; Bushell, W.C.; Castle, R.D. Yoga and Pain: A Mind-Body Complex System. Front Pain Res (Lausanne) 2023, 4, 1075866. [Google Scholar] [CrossRef] [PubMed]
- Feneberg, A.C.; Nater, U.M. An Ecological Momentary Music Intervention for the Reduction of Acute Stress in Daily Life: A Mixed Methods Feasibility Study. Front Psychol 2022, 13, 927705. [Google Scholar] [CrossRef] [PubMed]
- Feneberg, A.C.; Stijovic, A.; Forbes, P.A.G.; Lamm, C.; Piperno, G.; Pronizius, E.; Silani, G.; Nater, U.M. Perceptions of Stress and Mood Associated With Listening to Music in Daily Life During the COVID-19 Lockdown. JAMA Netw Open 2023, 6, e2250382. [Google Scholar] [CrossRef] [PubMed]
- Valosek, L.; Wendt, S.; Link, J.; Abrams, A.; Hipps, J.; Grant, J.; Nidich, R.; Loiselle, M.; Nidich, S. Meditation Effective in Reducing Teacher Burnout and Improving Resilience: A Randomized Controlled Study. Frontiers in Education 2021, 6. [Google Scholar] [CrossRef]
- Breit, S.; Kupferberg, A.; Rogler, G.; Hasler, G. Vagus Nerve as Modulator of the Brain–Gut Axis in Psychiatric and Inflammatory Disorders. Frontiers in Psychiatry 2018, 9. [Google Scholar] [CrossRef] [PubMed]
- Gerritsen, R.J.S.; Band, G.P.H. Breath of Life: The Respiratory Vagal Stimulation Model of Contemplative Activity. Front Hum Neurosci 2018, 12, 397. [Google Scholar] [CrossRef] [PubMed]
- Kromenacker, B.W.; Sanova, A.A.; Marcus, F.I.; Allen, J.J.B.; Lane, R.D. Vagal Mediation of Low-Frequency Heart Rate Variability During Slow Yogic Breathing. Psychosom Med 2018, 80, 581–587. [Google Scholar] [CrossRef] [PubMed]
- Chesky, K.S.; Michel, D.E. The Music Vibration Table (MVT ): Developing a Technology and Conceptual Model for Pain Relief. Music Therapy Perspectives 1991, 9, 32–38. [Google Scholar] [CrossRef]
- Naghdi, L.; Ahonen, H.; Macario, P.; Bartel, L. The Effect of Low-Frequency Sound Stimulation on Patients with Fibromyalgia: A Clinical Study. Pain Research & Management 2015, 20, 21–27. [Google Scholar] [CrossRef] [PubMed]
- Rüütel, E.; Vinkel, I.; Eelmäe, P. The Effect of Short-Term Vibroacoustic Treatment on Spasticity and Perceived Health Condition of Patients with Spinal Cord and Brain Injuries. Music and Medicine 2017, 9, 202–208. [Google Scholar] [CrossRef]
- Campbell, E.; Burger, B.; Ala-Ruona, E. A Single-Case, Mixed Methods Study Exploring the Role of Music Listening in Vibroacoustic Treatment. Voices: A World Forum for Music Therapy 2019, 19, 27. [Google Scholar] [CrossRef]
- Hallihan, C.; Siegle, G.J. Effect of Vibroacoustic Stimulation on Athletes Recovering from Exercise. European Journal of Applied Physiology 2022, 122, 2427–2435. [Google Scholar] [CrossRef] [PubMed]
- Rüütel, E.; Ratnik, M.; Tamm, E.; Zilensk, H. The Experience of Vibroacoustic Therapy in the Therapeutic Intervention of Adolescent Girls. Nordic Journal of Music Therapy 2004, 13, 33–46. [Google Scholar] [CrossRef]
- Braun Janzen, T.; Al Shirawi, M.I.; Rotzinger, S.; Kennedy, S.H.; Bartel, L. A Pilot Study Investigating the Effect of Music-Based Intervention on Depression and Anhedonia. Frontiers in Psychology 2019, 10. [Google Scholar] [CrossRef]
- Karkkainen, M.; Mitsui, J. The Effects of Sound Based Vibration Treatment on the Human Mind and Body The Physioacoustic Method. Journal of International Society of Life Information Science 2006, 24, 155–164. [Google Scholar] [CrossRef] [PubMed]
- Kantor, J.; Campbell, E.A.; Kantorová, L.; Marečková, J.; Regec, V.; Karasová, K.; Sedláčková, D.; Klugar, M. Exploring Vibroacoustic Therapy in Adults Experiencing Pain: A Scoping Review. BMJ Open 2022, 12, e046591. [Google Scholar] [CrossRef] [PubMed]
- Campbell, E.; Hynynen, J.; Ala-Ruona, E. Vibroacoustic Treatment for Chronic Pain and Mood Disorders in a Specialised Healthcare Setting. Music and Medicine 2017, 9, 187–197. [Google Scholar] [CrossRef]
- Campbell, E.A.; Hynynen, J.; Burger, B.; Ala-Ruona, E. Exploring the Use of Vibroacoustic Treatment For Managing Chronic Pain and Comorbid Mood Disorders: A Mixed Methods Study. Nordic Journal of Music Therapy 2019, 28, 291–314. [Google Scholar] [CrossRef]
- Lehikoinen, P. The physioacoustic method. In Music Vibration and Health; Wigram, T., Dileo, C., Eds.; Jeffrey Books: Cherry Hill, NJ, 1997; pp. 206–216. [Google Scholar]
- Mosabbir, A.; Almeida, Q.J.; Ahonen, H. The Effects of Long-Term 40-Hz Physioacoustic Vibrations on Motor Impairments in Parkinson's Disease: A Double-Blinded Randomized Control Trial. Healthcare (Basel) 2020, 8. [Google Scholar] [CrossRef] [PubMed]
- Patrick, G. The Effects of Vibroacoustic Music on Symptom Reduction. IEEE Engineering in Medicine and Biology Magazine, 1999; 97–100. [Google Scholar]
- Skille, O. VibroAcoustic Therapy. Music Therapy 1989, 8, 61–77. [Google Scholar] [CrossRef]
- Delmastro, F.; Martino, F.D.; Dolciotti, C. Physiological Impact of Vibro-Acoustic Therapy on Stress and Emotions through Wearable Sensors. In Proceedings of the 2018 IEEE International Conference on Pervasive Computing and Communications Workshops (PerCom Workshops), 19-23 March, 2018; pp. 621–626. [Google Scholar]
- Kantor, J.; Vilímek, Z.; Vítězník, M.; Smrčka, P.; Campbell, E.A.; Bucharová, M.; Grohmannová, J.; Špinarová, G.; Janíčková, K.; Du, J.; et al. Effect of Low Frequency Sound Vibration on Acute Stress Response in University Students - Pilot Randomized Controlled Trial. Front Psychol 2022, 13, 980756. [Google Scholar] [CrossRef] [PubMed]
- Kantor, J.; Vilímek, Z.; Du, J.; Campbell, E. Effects of Vibroacoustic Therapy on Physiological Responses Related to Stress and its Measurements in Adults a Scoping Review Protocol. Zdravotnícke listy 2022, 10. [Google Scholar]
- Vilímek, Z.; Kantor, J.; Krejčí, J.; Janečka, Z.; Jedličková, Z.; Nekardová, A.; Botek, M.; Bucharová, M.; Campbell, E.A. The Effect of Low Frequency Sound on Heart Rate Variability and Subjective Perception: A Randomized Crossover Study. Healthcare (Basel) 2022, 10, 1024. [Google Scholar] [CrossRef]
- Brodsky, W. Post-Exposure Effects of Music-Generated Vibration and Whole-Body Acoustic Stimulation among Symphony Orchestra Musicians. Psychology of Music 2000, 28, 98–115. [Google Scholar] [CrossRef]
- Rüütel, E. The Psychophysiological Effects of Music and Vibroacoustic Stimulation. Nordic Journal of Music Therapy 2002, 11, 16–26. [Google Scholar] [CrossRef]
- Koike, Y.; Hoshitani, M.; Tabata, Y.; Seki, K.; Nishimura, R.; Kano, Y. Effects of Vibroacoustic Therapy on Elderly Nursing Home Residents with Depression. Journal of Physical Therapy Science 2012, 24, 291–294. [Google Scholar] [CrossRef]
- Cavallo, F.; Rovini, E.; Dolciotti, C.; Radi, L.; Ragione, R.D.; Bongioanni, P.; Fiorini, L. Physiological response to Vibro-Acoustic stimulation in healthy subjects: a preliminary study. In Proceedings of the 2020 42nd Annual International Conference of the IEEE Engineering in Medicine & Biology Society (EMBC), Montreal, Canada, 20-24 July 2020; 2020; pp. 5921–5924. [Google Scholar]
- Campbell, E.A.; Hynynen, J.; Burger, B.; Vainionpää, A.; Ala-Ruona, E. Vibroacoustic treatment to improve functioning and ability to work: a multidisciplinary approach to chronic pain rehabilitation. Disability and Rehabilitation 2021, 43, 2055–2070. [Google Scholar] [CrossRef] [PubMed]
- VibroAcoustics Bass Module. Available online: https://vibroacoustics.dk/product (accessed on 1st May 2024).
- Fernandez, M. Acoustics and Universal Movement. In Music Vibration and Health; Wigram, T., Dileo, C., Eds.; Jeffrey Books: Cherry Hill, NJ, 1997; pp. 11–26. [Google Scholar]
- Ala-Ruona, E.; Punkanen, M.; Campbell, E. Vibroacoustic Therapy: Conception, Development, and Future Directions. Musiikkiterapia 2015, 30, 48–71. [Google Scholar]
- Attar, E.T. Review of electroencephalography signals approaches for mental stress assessment. Neurosciences (Riyadh) 2022, 27, 209–215. [Google Scholar] [CrossRef] [PubMed]
- Akinrodoye, M.A.; Lui, F. Neuroanatomy, Somatic Nervous System. Available online: https://www.ncbi.nlm.nih.gov/books/NBK556027/ (accessed on 2nd May 2024).
- Waxenbaum, J.A.; Reddy, V.; Varacallo, M. Anatomy, Autonomic Nervous System. Available online: https://www.ncbi.nlm.nih.gov/books/NBK539845/ (accessed on 2nd May 2024).
- Balzarotti, S.; Biassoni, F.; Colombo, B.; Ciceri, M.R. Cardiac vagal control as a marker of emotion regulation in healthy adults: A review. Biological Psychology 2017, 130, 54–66. [Google Scholar] [CrossRef] [PubMed]
- Pavlov, V.A.; Tracey, K.J. The Vagus Nerve and the Inflammatory Reflex-Linking Immunity and Metabolism. Nat Rev Endocrinol 2012, 8, 743–754. [Google Scholar] [CrossRef] [PubMed]
- Wilfong, A.A.; Schultz, R.J. Vagus Nerve Stimulation for Treatment of Epilepsy in Rett Syndrome. Dev Med Child Neurol 2006, 48, 683–686. [Google Scholar] [CrossRef] [PubMed]
- Panebianco, M.; Rigby, A.; Marson, A.G. Vagus Nerve Stimulation for Focal Seizures. Cochrane Database Syst Rev 2022, 7, Cd002896. [Google Scholar] [CrossRef]
- Elger, G.; Hoppe, C.; Falkai, P.; Rush, A.J.; Elger, C.E. Vagus Nerve Stimulation is Associated with Mood Improvements in Epilepsy Patients. Epilepsy Res 2000, 42, 203–210. [Google Scholar] [CrossRef]
- Rush, A.J.; George, M.S.; Sackeim, H.A.; Marangell, L.B.; Husain, M.M.; Giller, C.; Nahas, Z.; Haines, S.; Simpson, R.K., Jr.; Goodman, R. Vagus Nerve Stimulation (VNS) for Treatment-Resistant Depressions: A Multicenter Study. Biol Psychiatry 2000, 47, 276–286. [Google Scholar] [CrossRef] [PubMed]
- Sobocki, J.; Fourtanier, G.; Estany, J.; Otal, P. Does Vagal Nerve Stimulation Affect Body Composition and Metabolism? Experimental Study of a New Potential Technique in Bariatric Surgery. Surgery 2006, 139, 209–216. [Google Scholar] [CrossRef] [PubMed]
- Silberstein, S.D.; Yuan, H.; Najib, U.; Ailani, J.; Morais, A.L.; Mathew, P.G.; Liebler, E.; Tassorelli, C.; Diener, H.C. Non-Invasive Vagus Nerve Stimulation for Primary Headache: A Clinical Update. Cephalalgia 2020, 40, 1370–1384. [Google Scholar] [CrossRef] [PubMed]
- Sigurdardóttir, G.A.; Nielsen, P.M.; Rønager, J.; Wang, A.G. A Pilot Study on High Amplitude Low Frequency-Music Impulse Stimulation as an Add-On Treatment for Depression. Brain Behav 2019, 9, e01399. [Google Scholar] [CrossRef] [PubMed]
- Peng, D.; Tong, W.; Collins, D.J.; Ibbotson, M.R.; Prawer, S.; Stamp, M. Mechanisms and Applications of Neuromodulation Using Surface Acoustic Waves-A Mini-Review. Front Neurosci 2021, 15, 629056. [Google Scholar] [CrossRef] [PubMed]
- MindMonitor Technical Manual. Available online: https://mind-monitor.com/Technical_Manual.php (accessed on 5th April 2023).
- Garcia-Moreno, F.M.; Bermudez-Edo, M.; Garrido, J.L.; Rodríguez-Fórtiz, M.J. Reducing Response Time in Motor Imagery Using A Headband and Deep Learning. Sensors 2020, 20, 6730. [Google Scholar] [CrossRef] [PubMed]
- Schaffarczyk, M.; Rogers, B.; Reer, R.; Gronwald, T. Validity of the Polar H10 Sensor for Heart Rate Variability Analysis during Resting State and Incremental Exercise in Recreational Men and Women. Sensors (Basel) 2022, 22. [Google Scholar] [CrossRef] [PubMed]
- Gilgen-Ammann, R.; Schweizer, T.; Wyss, T. RR interval signal quality of a heart rate monitor and an ECG Holter at rest and during exercise. Eur J Appl Physiol 2019, 119, 1525–1532. [Google Scholar] [CrossRef]
- Speer, K.E.; Semple, S.; Naumovski, N.; McKune, A.J. Measuring Heart Rate Variability Using Commercially Available Devices in Healthy Children: A Validity and Reliability Study. Eur J Investig Health Psychol Educ 2020, 10, 390–404. [Google Scholar] [CrossRef]
- Heart Rate Monitor. Available online: https://play.google.com/store/apps/details?id=com.bmi.hr_monitor&hl=en&gl=US (accessed on 20th May 2024).
- Tiwari, R.; Kumar, R.; Malik, S.; Raj, T.; Kumar, P. Analysis of Heart Rate Variability and Implication of Different Factors on Heart Rate Variability. Curr Cardiol Rev 2021, 17, e160721189770. [Google Scholar] [CrossRef]
- Cohen, S.; Kamarck, T.; Mermelstein, R. A Global Measure of Perceived Stress. Journal of Health and Social Behavior 1983, 24, 385–396. [Google Scholar] [CrossRef] [PubMed]
- Lee, E.H. Review of the psychometric evidence of the perceived stress scale. Asian Nurs Res (Korean Soc Nurs Sci) 2012, 6, 121–127. [Google Scholar] [CrossRef] [PubMed]
- Baik, S.H.; Fox, R.S.; Mills, S.D.; Roesch, S.C.; Sadler, G.R.; Klonoff, E.A.; Malcarne, V.L. Reliability and validity of the Perceived Stress Scale-10 in Hispanic Americans with English or Spanish language preference. J Health Psychol 2019, 24, 628–639. [Google Scholar] [CrossRef] [PubMed]
- Klein, E.M.; Brähler, E.; Dreier, M.; Reinecke, L.; Müller, K.W.; Schmutzer, G.; Wölfling, K.; Beutel, M.E. The German version of the Perceived Stress Scale – psychometric characteristics in a representative German community sample. BMC Psychiatry 2016, 16, 159. [Google Scholar] [CrossRef] [PubMed]
- Nordin, M.; Nordin, S. Psychometric evaluation and normative data of the Swedish version of the 10-item perceived stress scale. Scand J Psychol 2013, 54, 502–507. [Google Scholar] [CrossRef] [PubMed]
- Eskildsen, A.; Dalgaard, V.L.; Nielsen, K.J.; Andersen, J.H.; Zachariae, R.; Olsen, L.R.; Jørgensen, A.; Christiansen, D.H. Cross-cultural adaptation and validation of the Danish consensus version of the 10-item Perceived Stress Scale. Scand J Work Environ Health 2015, 41, 486–490. [Google Scholar] [CrossRef] [PubMed]
- Ulrich, R.S.; Simons, R.F.; Losito, B.D.; Fiorito, E.; Miles, M.A.; Zelson, M. Stress recovery during exposure to natural and urban environments. Journal of Environmental Psychology 1991, 11, 201–230. [Google Scholar] [CrossRef]
- Ratcliffe, E.; Gatersleben, B.; Sowden, P.T. Bird Sounds and their Contributions to Perceived Attention Restoration and Stress Recovery. Journal of Environmental Psychology 2013, 36, 221–228. [Google Scholar] [CrossRef]
- Buxton, R.T.; Pearson, A.L.; Allou, C.; Fristrup, K.; Wittemyer, G. A Synthesis of Health Benefits of Natural Sounds and their Distribution in National Parks. Proceedings of the National Academy of Sciences 2021, 118, e2013097118. [Google Scholar] [CrossRef]
- Ratcliffe, E. Sound and Soundscape in Restorative Natural Environments: A Narrative Literature Review. Frontiers in Psychology 2021, 12. [Google Scholar] [CrossRef]
- Gould van Praag, C.D.; Garfinkel, S.N.; Sparasci, O.; Mees, A.; Philippides, A.O.; Ware, M.; Ottaviani, C.; Critchley, H.D. Mind-Wandering and Alterations to Default Mode Network Connectivity when Listening to Naturalistic Versus Artificial Sounds. Scientific Reports 2017, 7, 45273. [Google Scholar] [CrossRef]
- Nozaradan, S. Exploring how musical rhythm entrains brain activity with electroencephalogram frequency-tagging. Philos Trans R Soc Lond B Biol Sci 2014, 369, 20130393. [Google Scholar] [CrossRef] [PubMed]
- Thaut, M.H.; McIntosh, G.C.; Hoemberg, V. Neurobiological Foundations of Neurologic Music Therapy: Rhythmic Entrainment and the Motor System. Front Psychol 2014, 5, 1185. [Google Scholar] [CrossRef] [PubMed]
- Engel, A.; Hoefle, S.; Monteiro, M.C.; Moll, J.; Keller, P.E. Neural Correlates of Listening to Varying Synchrony Between Beats in Samba Percussion and Relations to Feeling the Groove. Front Neurosci 2022, 16, 779964. [Google Scholar] [CrossRef]
- Stupacher, J.; Matthews, T.E.; Pando-Naude, V.; Foster Vander Elst, O.; Vuust, P. The Sweet Spot Between Predictability and Surprise: Musical Groove in Brain, Body, and Social Interactions. Front Psychol 2022, 13, 906190. [Google Scholar] [CrossRef]
- Bartel, L.R.; Chen, R.; Alain, C.; Ross, B. Vibroacoustic Stimulation and Brain Oscillation: From Basic Research to Clinical Application. Music and Medicine 2017, 9, 153. [Google Scholar] [CrossRef]
- Fries, P. Neuronal Gamma-Band Synchronization as a Fundamental Process in Cortical Computation. Annu Rev Neurosci 2009, 32, 209–224. [Google Scholar] [CrossRef] [PubMed]
- Jirakittayakorn, N.; Wongsawat, Y. Brain Responses to 40-Hz Binaural Beat and Effects on Emotion and Memory. International Journal of Psychophysiology 2017, 120, 96–107. [Google Scholar] [CrossRef]
- Fooks, C.; Niebuhr, O. Assessing Vibroacoustic Sound Massage Through The Biosignal of Human Speech: Evidence of Improved Wellbeing. In Proceedings of the IEEE International Conference on Acoustics, Speech and Signal Processing (ICASSP), Seoul, South Korea, 14-19 April 2024; 2024; pp. 11401–11405. [Google Scholar]
- Wang, H.-M.; Huang, S.-C. SDNN/RMSSD as a Surrogate for LF/HF: A Revised Investigation. Modelling and Simulation in Engineering 2012, 2012. [Google Scholar] [CrossRef]
- JP, S.F.G. An Overview of Heart Rate Variability Metrics and Norms. Front Public Health 2017, Sep 28. [Google Scholar] [CrossRef] [PubMed]
- Emanuel, R.; Adams, J.; Baker, K.; Daufin, E.K.; Ellington, C.; Fitts, E.; Himsel, J.; Holladay, L.; Okeowo, D. How College Students Spend Their Time Communicating. International Journal of Listening 2008, 22, 13–28. [Google Scholar] [CrossRef]
- Sandler, H.; Tamm, S.; Fendel, U.; Rose, M.; Klapp, B.F.; Bösel, R. Positive Emotional Experience: Induced by Vibroacoustic Stimulation Using a Body Monochord in Patients with Psychosomatic Disorders: Is Associated with an Increase in EEG-Theta and a Decrease in EEG-Alpha Power. Brain Topogr 2016, 29, 524–538. [Google Scholar] [CrossRef] [PubMed]
- Bourdillon, N.; Yazdani, S.; Vesin, J.M.; Schmitt, L.; Millet, G.P. RMSSD Is More Sensitive to Artifacts Than Frequency-Domain Parameters: Implication in Athletes' Monitoring. J Sports Sci Med 2022, 21, 260–266. [Google Scholar] [CrossRef] [PubMed]
- Massaro, S.; Pecchia, L. Heart Rate Variability (HRV) Analysis: A Methodology for Organizational Neuroscience. Organizational Research Methods 2019, 22, 354–393. [Google Scholar] [CrossRef]
- Fooks, C.; Niebuhr, O. Assessing Effects of Vibroacoustic Stimulation Compared to a Guided Mindfulness Meditation Using The Biosignal of Human Speech. 2025; manuscript in preparation; to be submitted. [Google Scholar]
- Craig, C.L.; Marshall, A.L.; Sjöström, M.; Bauman, A.E.; Booth, M.L.; Ainsworth, B.E.; Pratt, M.; Ekelund, U.; Yngve, A.; Sallis, J.F.; et al. International physical activity questionnaire: 12-country reliability and validity. Med Sci Sports Exerc 2003, 35, 1381–1395. [Google Scholar] [CrossRef] [PubMed]
- Sauer, S.; Walach, H.; Offenbächer, M.; Lynch, S.; Kohls, N. Measuring Mindfulness: A Rasch Analysis of the Freiburg Mindfulness Inventory. Religions 2011, 2, 693–706. [Google Scholar] [CrossRef]
- Kaske, E.A.; Chen, C.S.; Meyer, C.; Yang, F.; Ebitz, B.; Grissom, N.; Kapoor, A.; Darrow, D.P.; Herman, A.B. Prolonged Physiological Stress Is Associated With a Lower Rate of Exploratory Learning That Is Compounded by Depression. Biological Psychiatry: Cognitive Neuroscience and Neuroimaging 2023, 8, 703–711. [Google Scholar] [CrossRef]
- Whiston, A.; Igou, E.R.; Fortune, D.G.; Semkovska, M. Longitudinal interactions between residual symptoms and physiological stress in the remitted symptom network structure of depression. Acta Psychologica 2023, 241, 104078. [Google Scholar] [CrossRef] [PubMed]
- Pate, B.S.; Smiley, C.E.; Harrington, E.N.; Bielicki, B.H.; Davis, J.M.; Reagan, L.P.; Grillo, C.A.; Wood, S.K. Voluntary wheel running as a promising strategy to promote autonomic resilience to social stress in females: Vagal tone lies at the heart of the matter. Autonomic Neuroscience 2024, 253, 103175. [Google Scholar] [CrossRef] [PubMed]
- Satyjeet, F.; Naz, S.; Kumar, V.; Aung, N.H.; Bansari, K.; Irfan, S.; Rizwan, A. Psychological Stress as a Risk Factor for Cardiovascular Disease: A Case-Control Study. Cureus 2020, 12, e10757. [Google Scholar] [CrossRef]
- Kumar, R.; Rizvi, M.R.; Saraswat, S. Obesity and Stress: A Contingent Paralysis. Int J Prev Med 2022, 13, 95. [Google Scholar] [CrossRef]
- Dakanalis, A.; Mentzelou, M.; Papadopoulou, S.K.; Papandreou, D.; Spanoudaki, M.; Vasios, G.K.; Pavlidou, E.; Mantzorou, M.; Giaginis, C. The Association of Emotional Eating with Overweight/Obesity, Depression, Anxiety/Stress, and Dietary Patterns: A Review of the Current Clinical Evidence. Nutrients 2023, 15. [Google Scholar] [CrossRef] [PubMed]
- Moore, J.P. Interoceptive signals from the heart and coronary circulation in health and disease. Auton Neurosci 2024, 253, 103180. [Google Scholar] [CrossRef] [PubMed]
- Zhao, W.; Van Someren, E.J.W.; Xu, Z.; Ren, Z.; Tang, L.; Li, C.; Lei, X. Identifying the insomnia-related psychological issues associated with hyperarousal: A network perspective. International Journal of Psychophysiology 2024, 195, 112276. [Google Scholar] [CrossRef] [PubMed]
- Touch the Sound. Available online: https://vibroacoustics.dk/ (accessed on 1st May).
Figure 1.
Locations of nodes in the Muse S (Gen 2) electroencephalogram (EEG) headband.
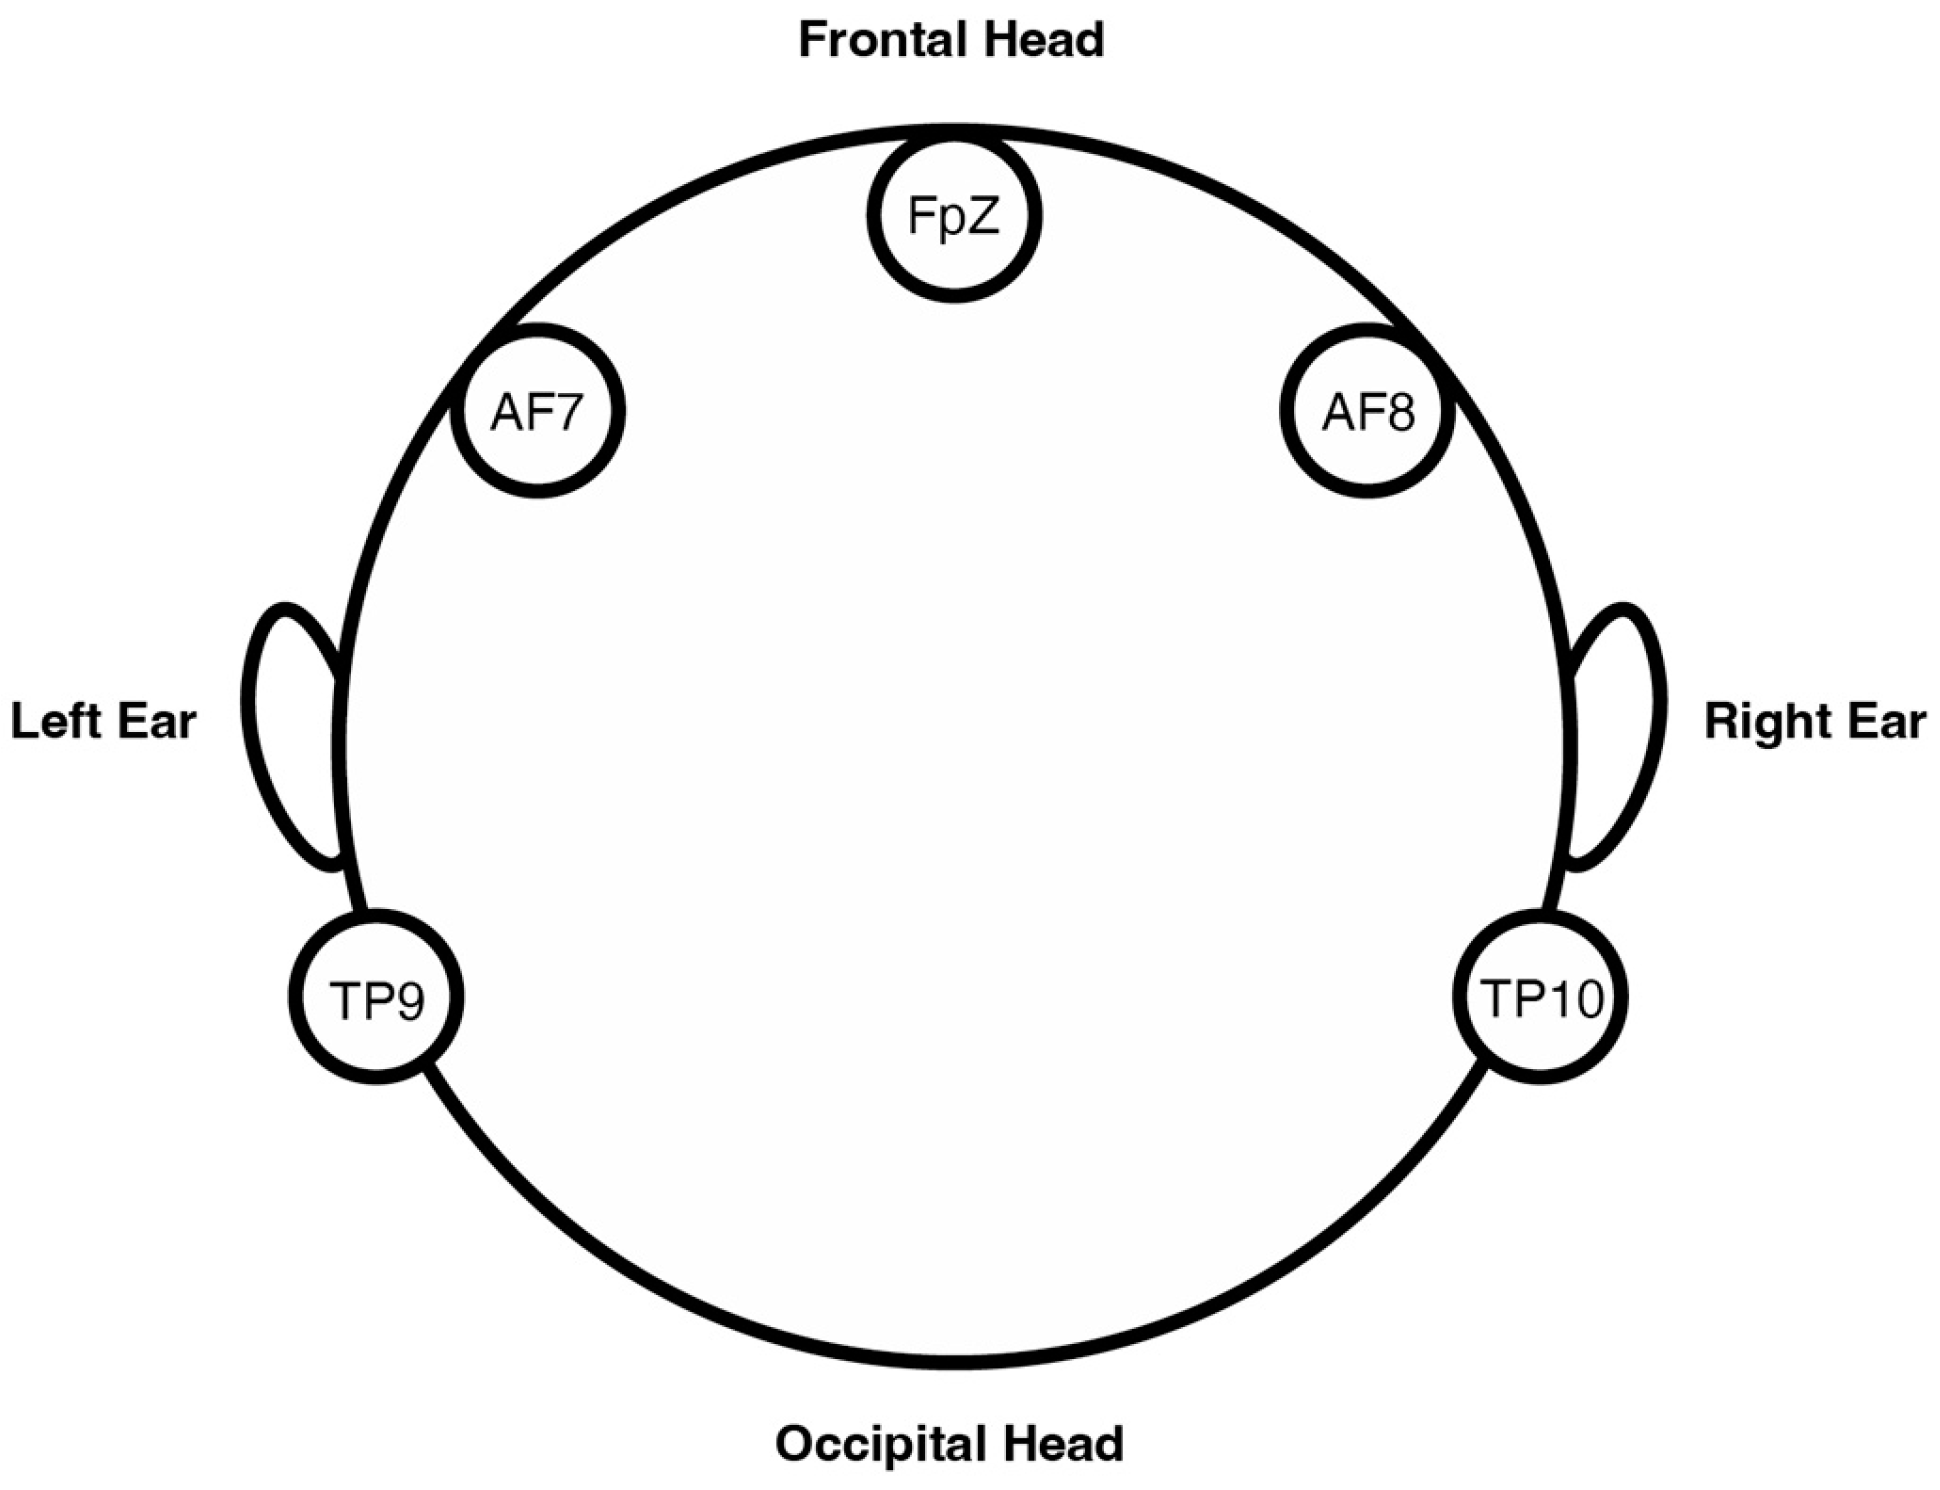
Figure 2.
Description of a PQRST complex (and concurrent cardiac cycle) recorded by an electrocardiogram (ECG).
Figure 2.
Description of a PQRST complex (and concurrent cardiac cycle) recorded by an electrocardiogram (ECG).
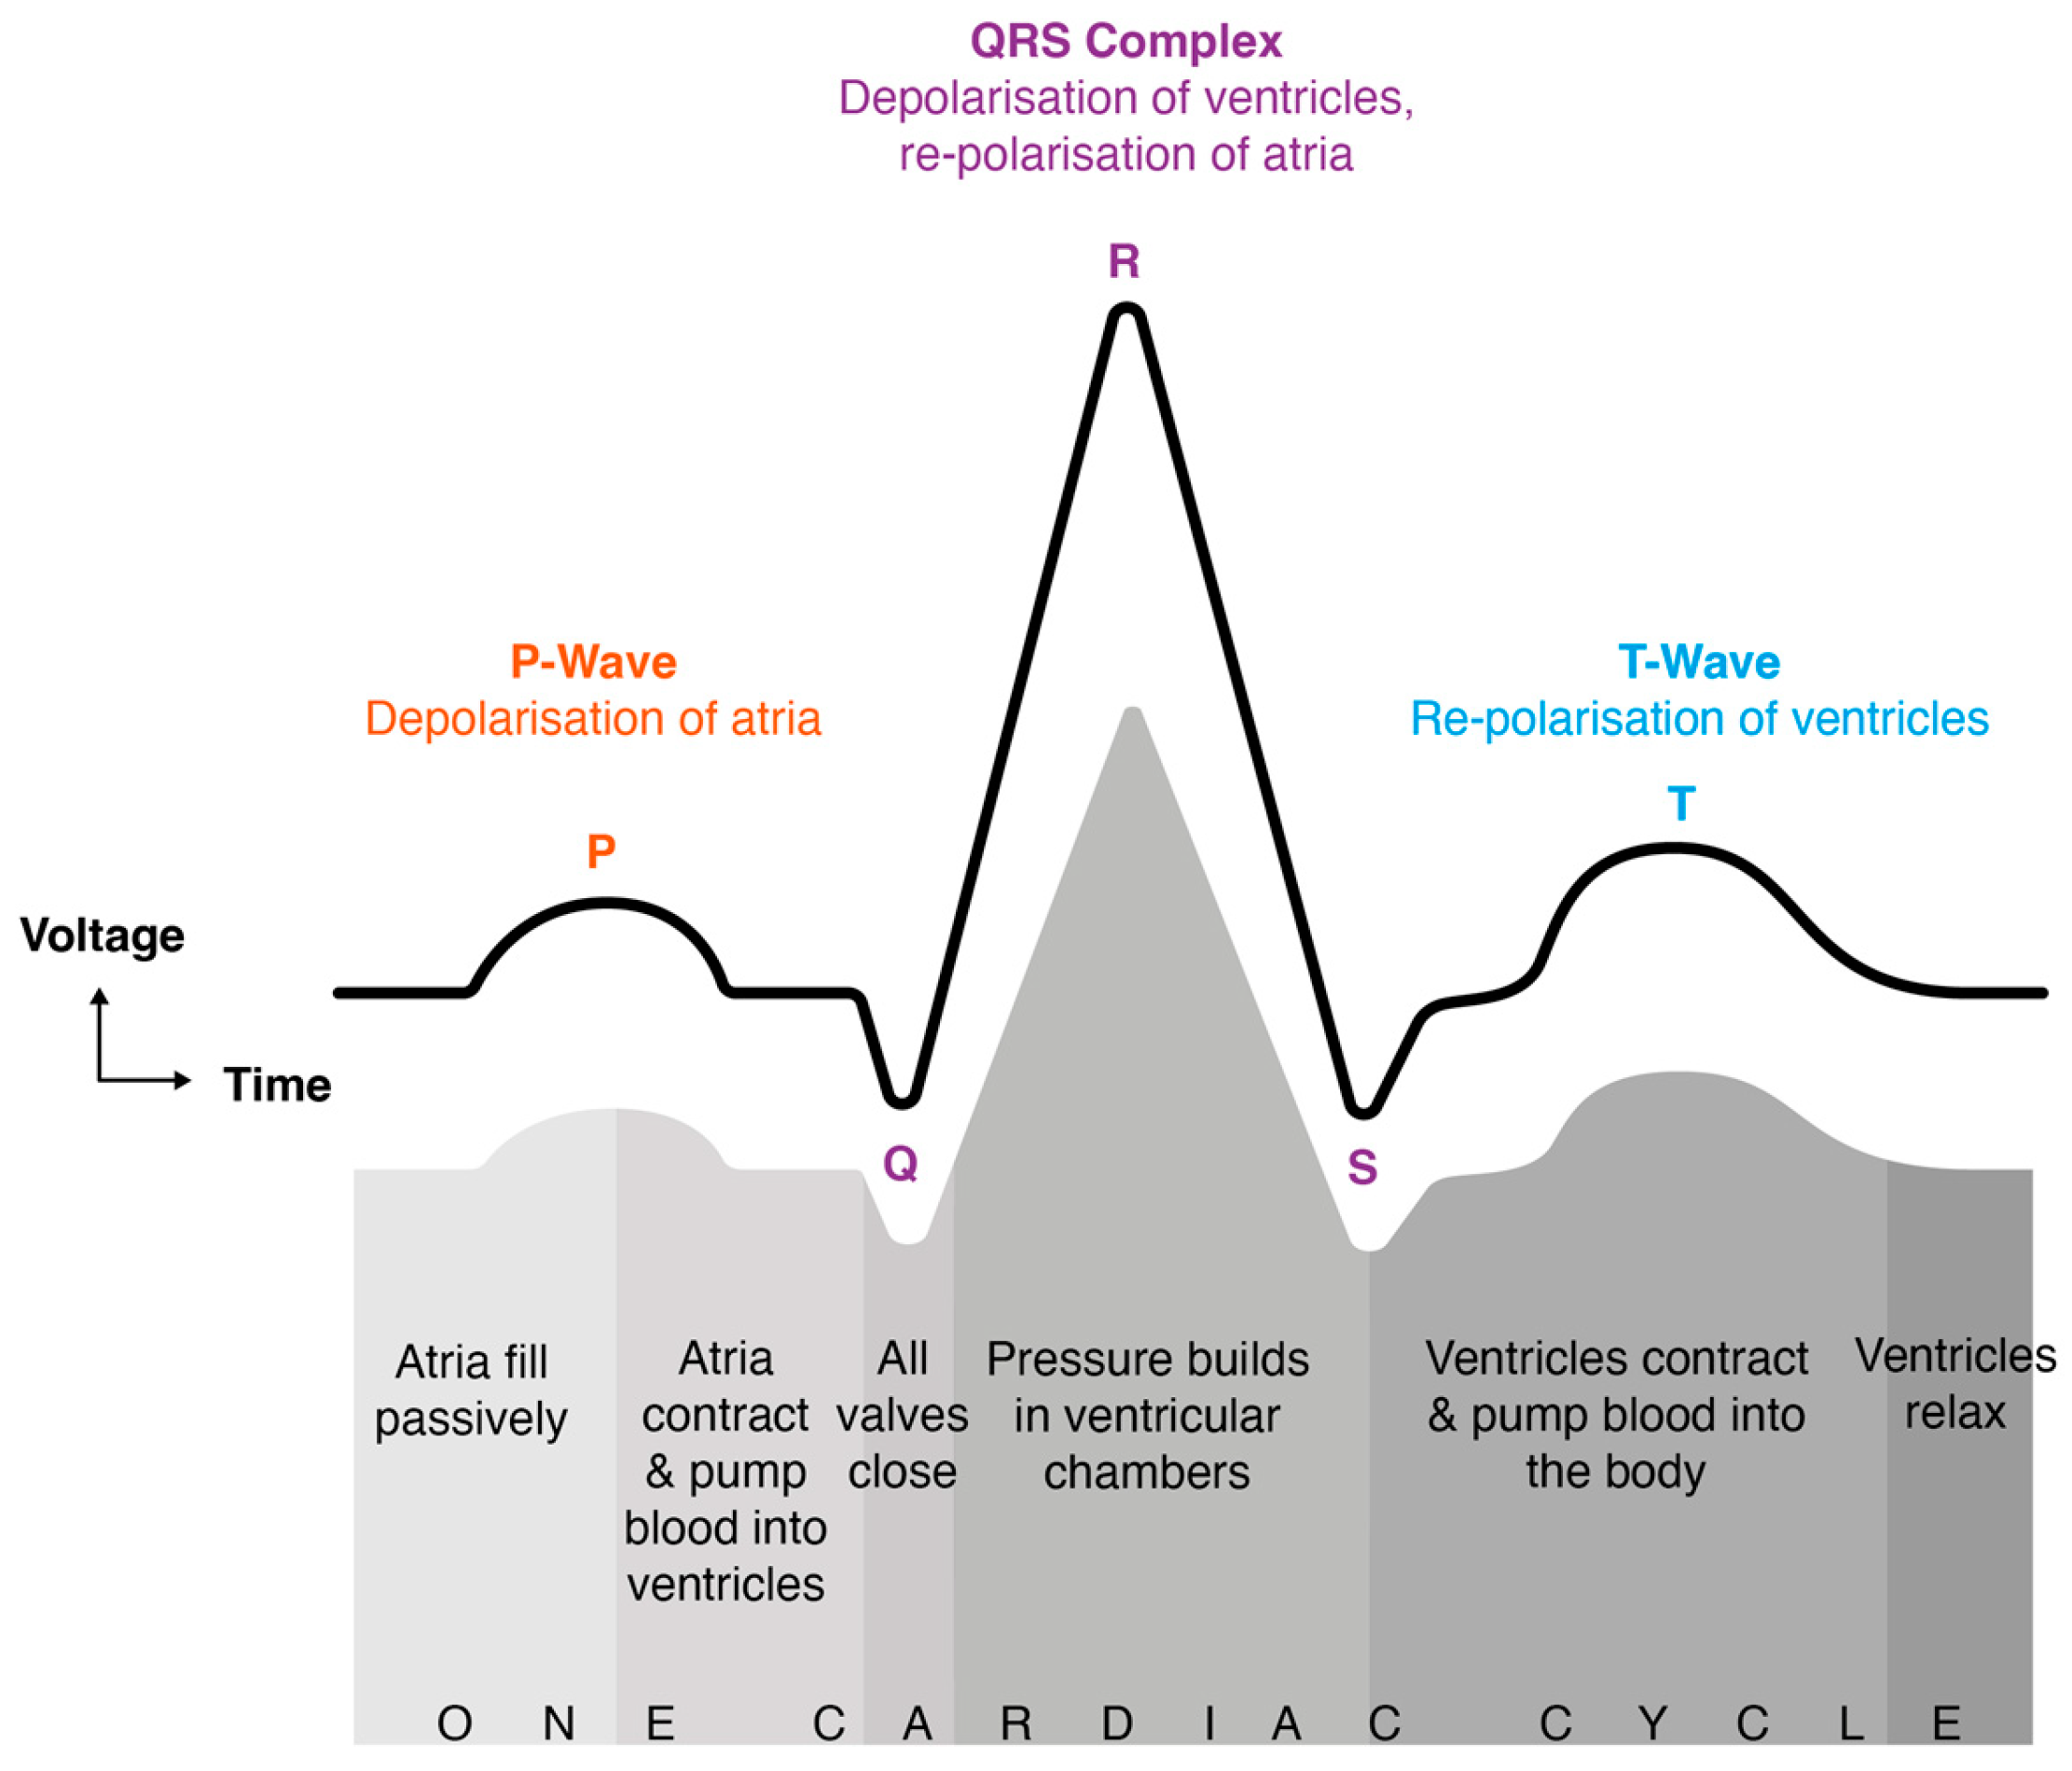
Figure 3.
Movement of electrical signals sent by the sinus node during a PQRST complex (one cardiac cycle).
Figure 3.
Movement of electrical signals sent by the sinus node during a PQRST complex (one cardiac cycle).
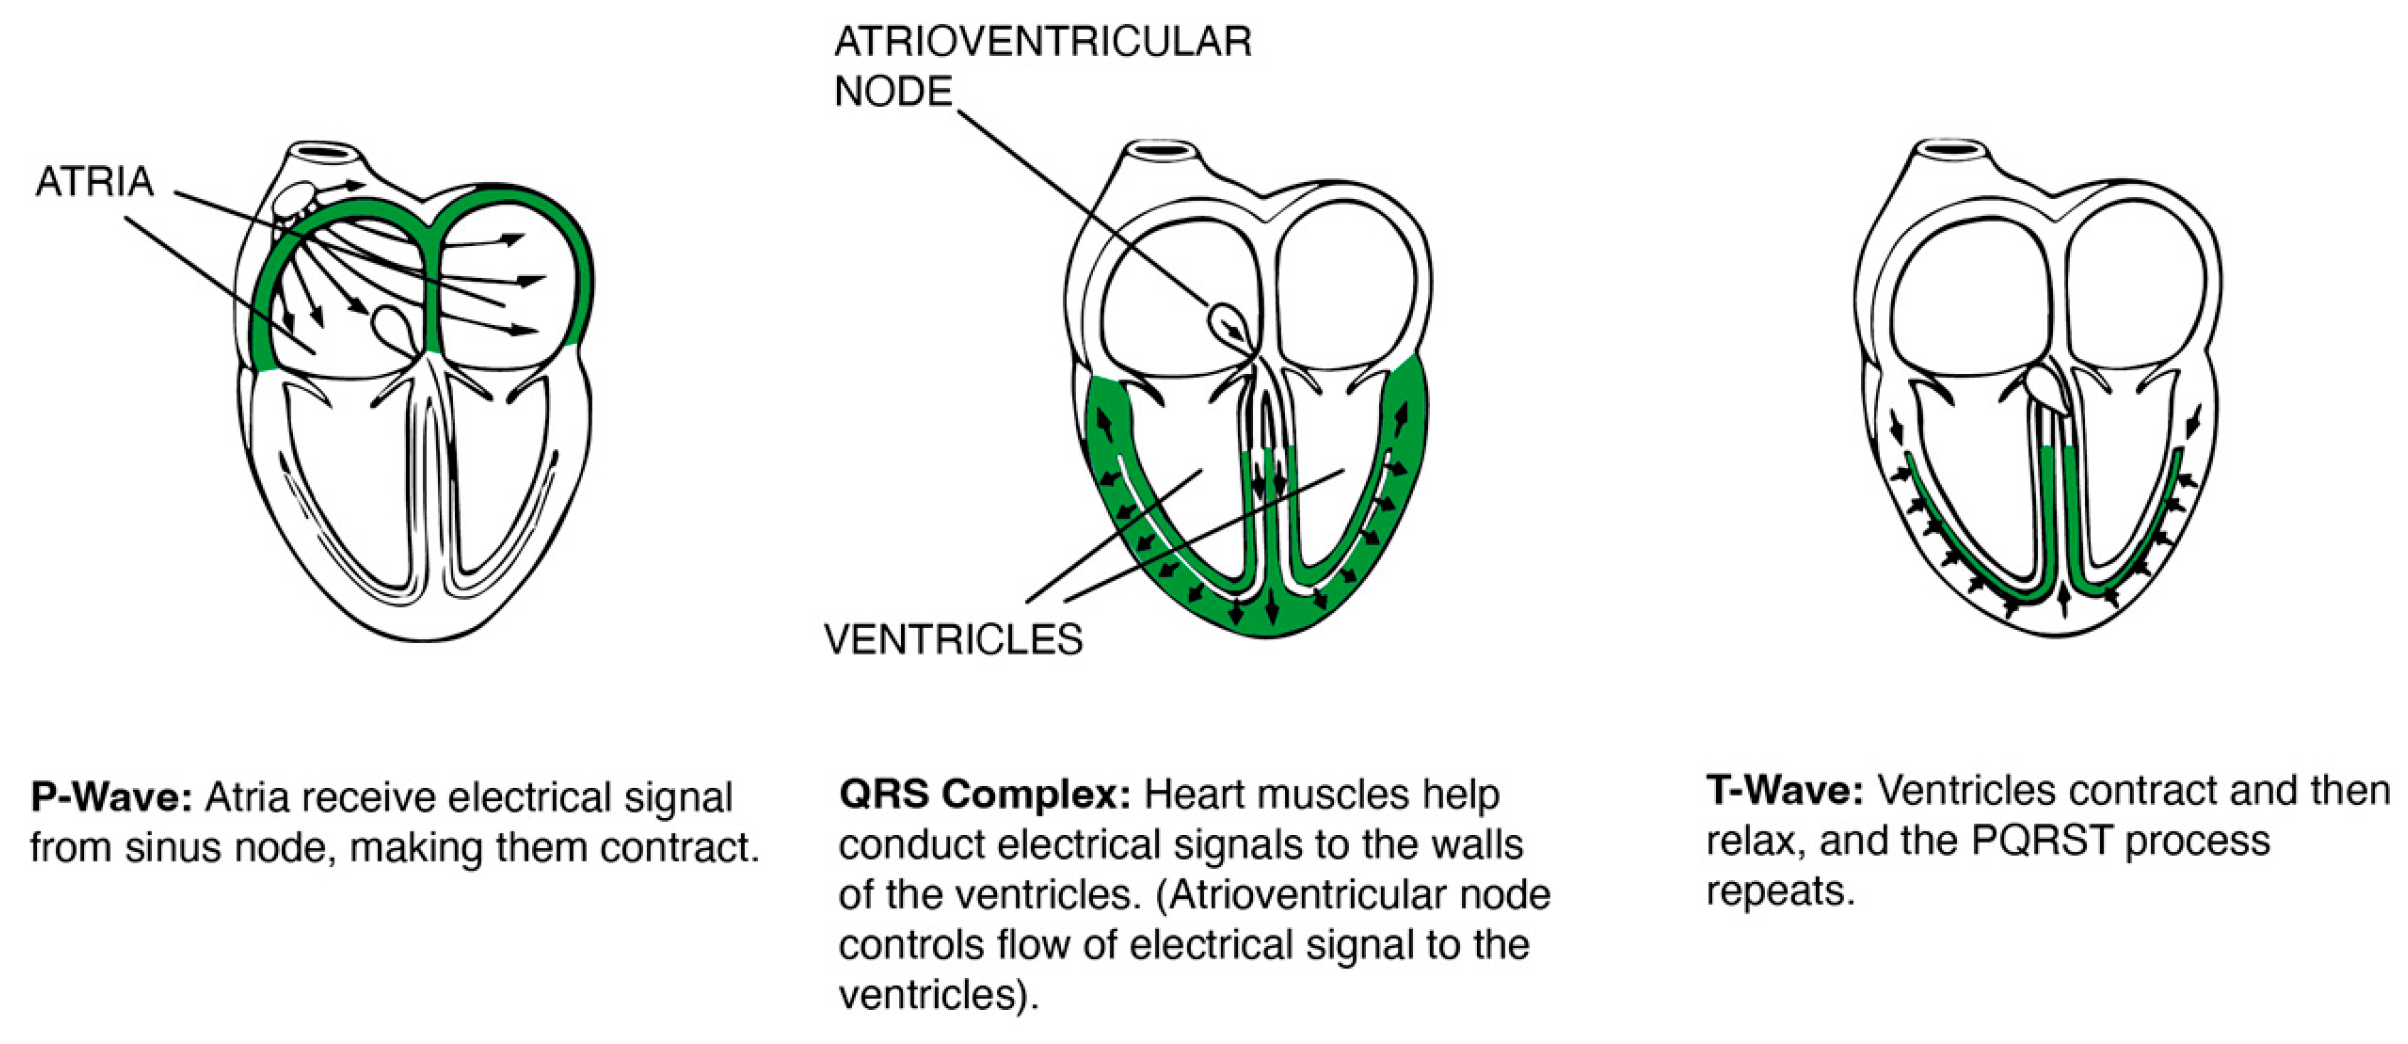
Figure 4.
Visualisation of an ECG with RR intervals marked.
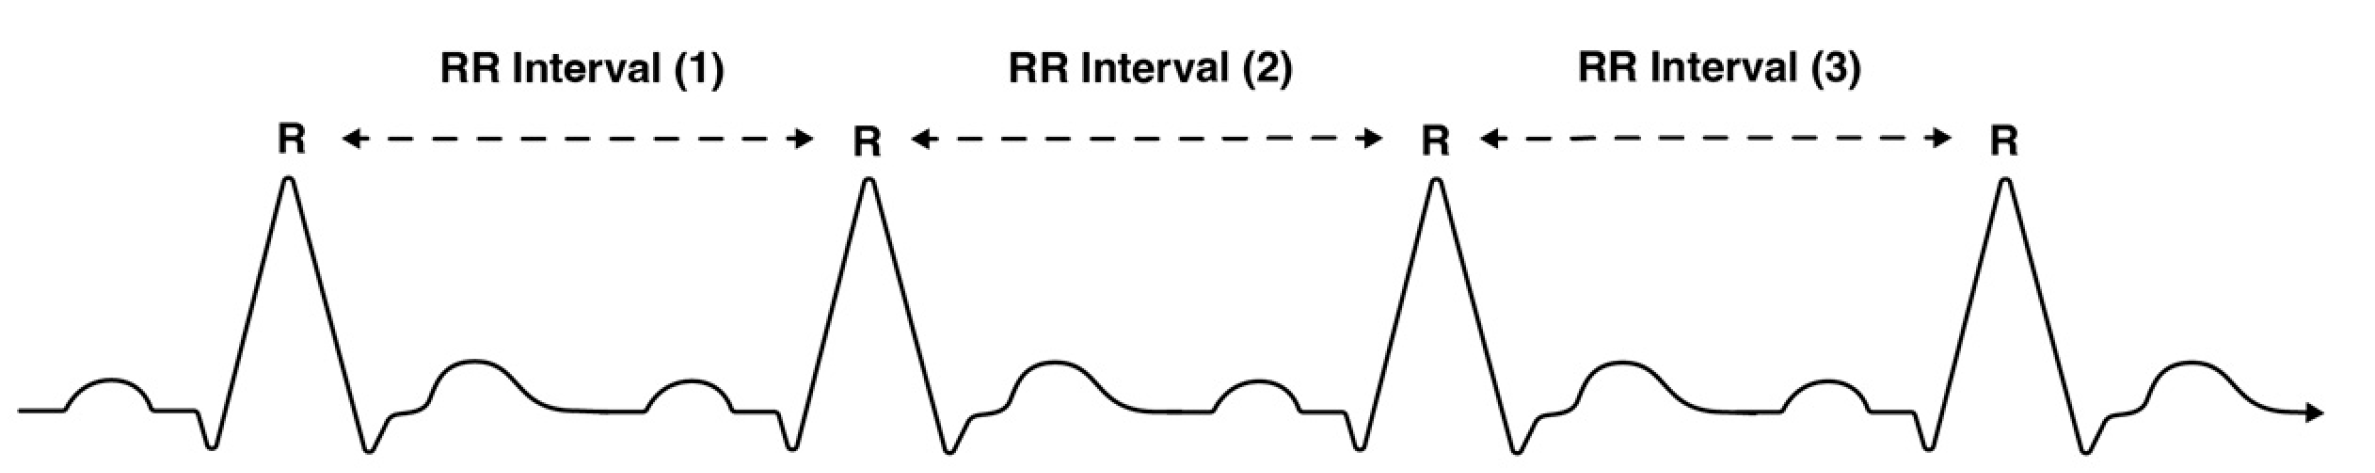
Figure 5.
A participant ECG recorded during the study. The horizontal axis shows beat-per-minute (BPM) values.
Figure 5.
A participant ECG recorded during the study. The horizontal axis shows beat-per-minute (BPM) values.
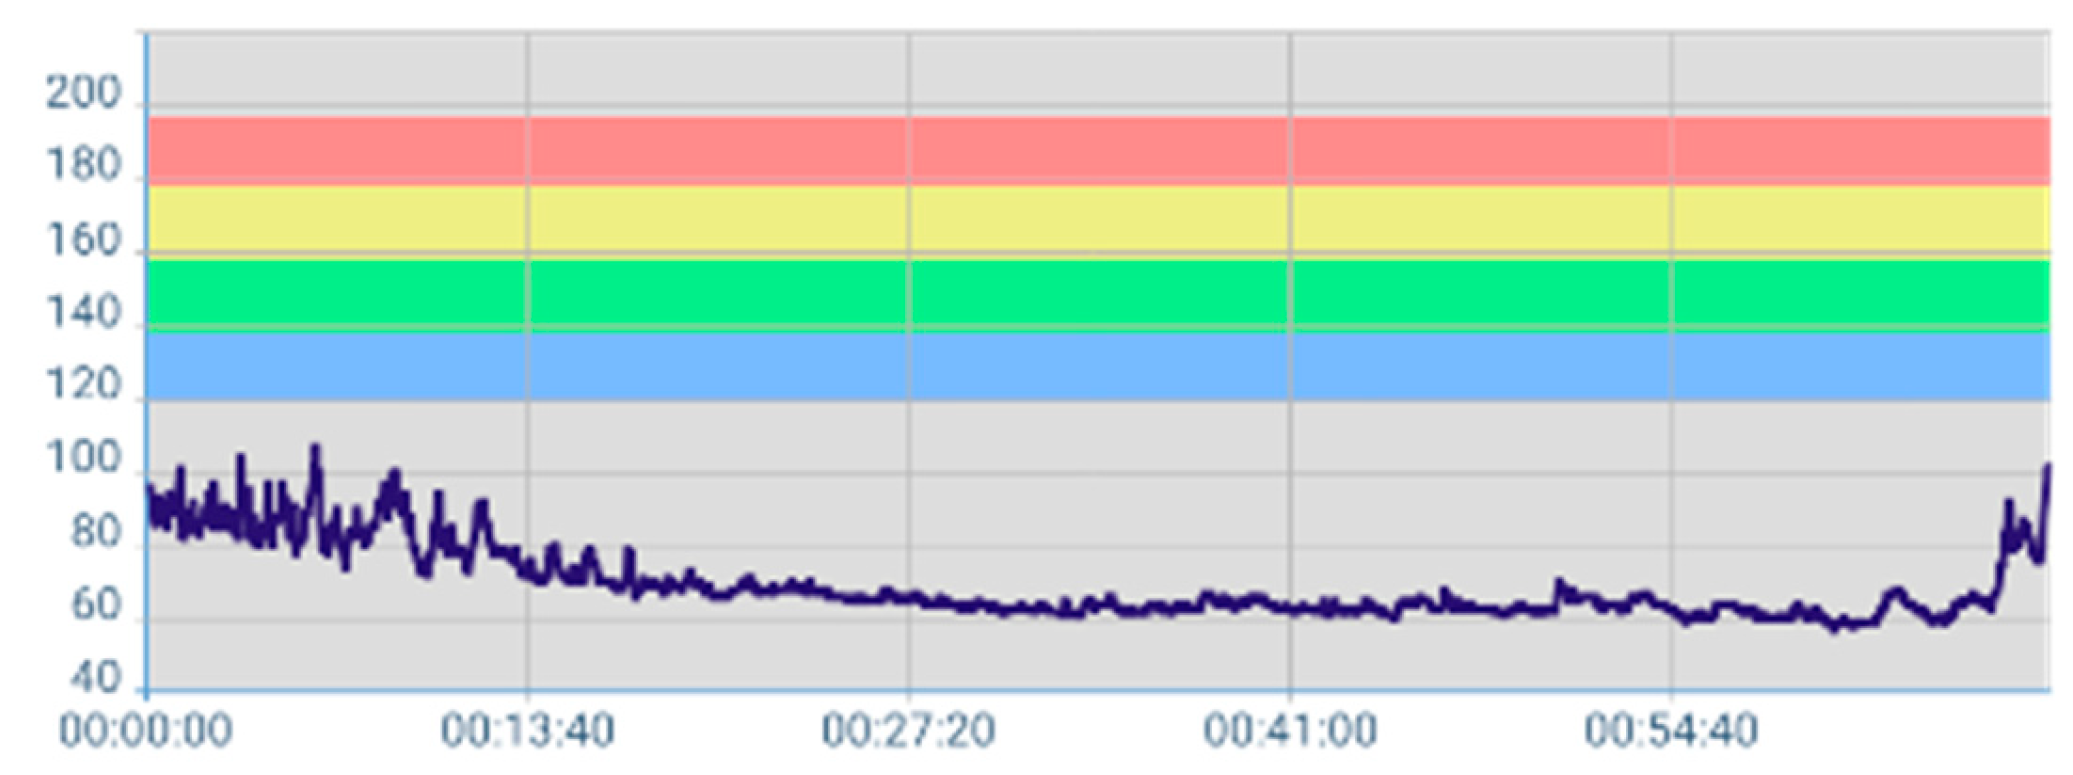
Figure 6.
Boxplot summary of TBR results for the six stages of the study, shown in chronological order from bottom to top. The horizontal axis shows dB ratios.
Figure 6.
Boxplot summary of TBR results for the six stages of the study, shown in chronological order from bottom to top. The horizontal axis shows dB ratios.
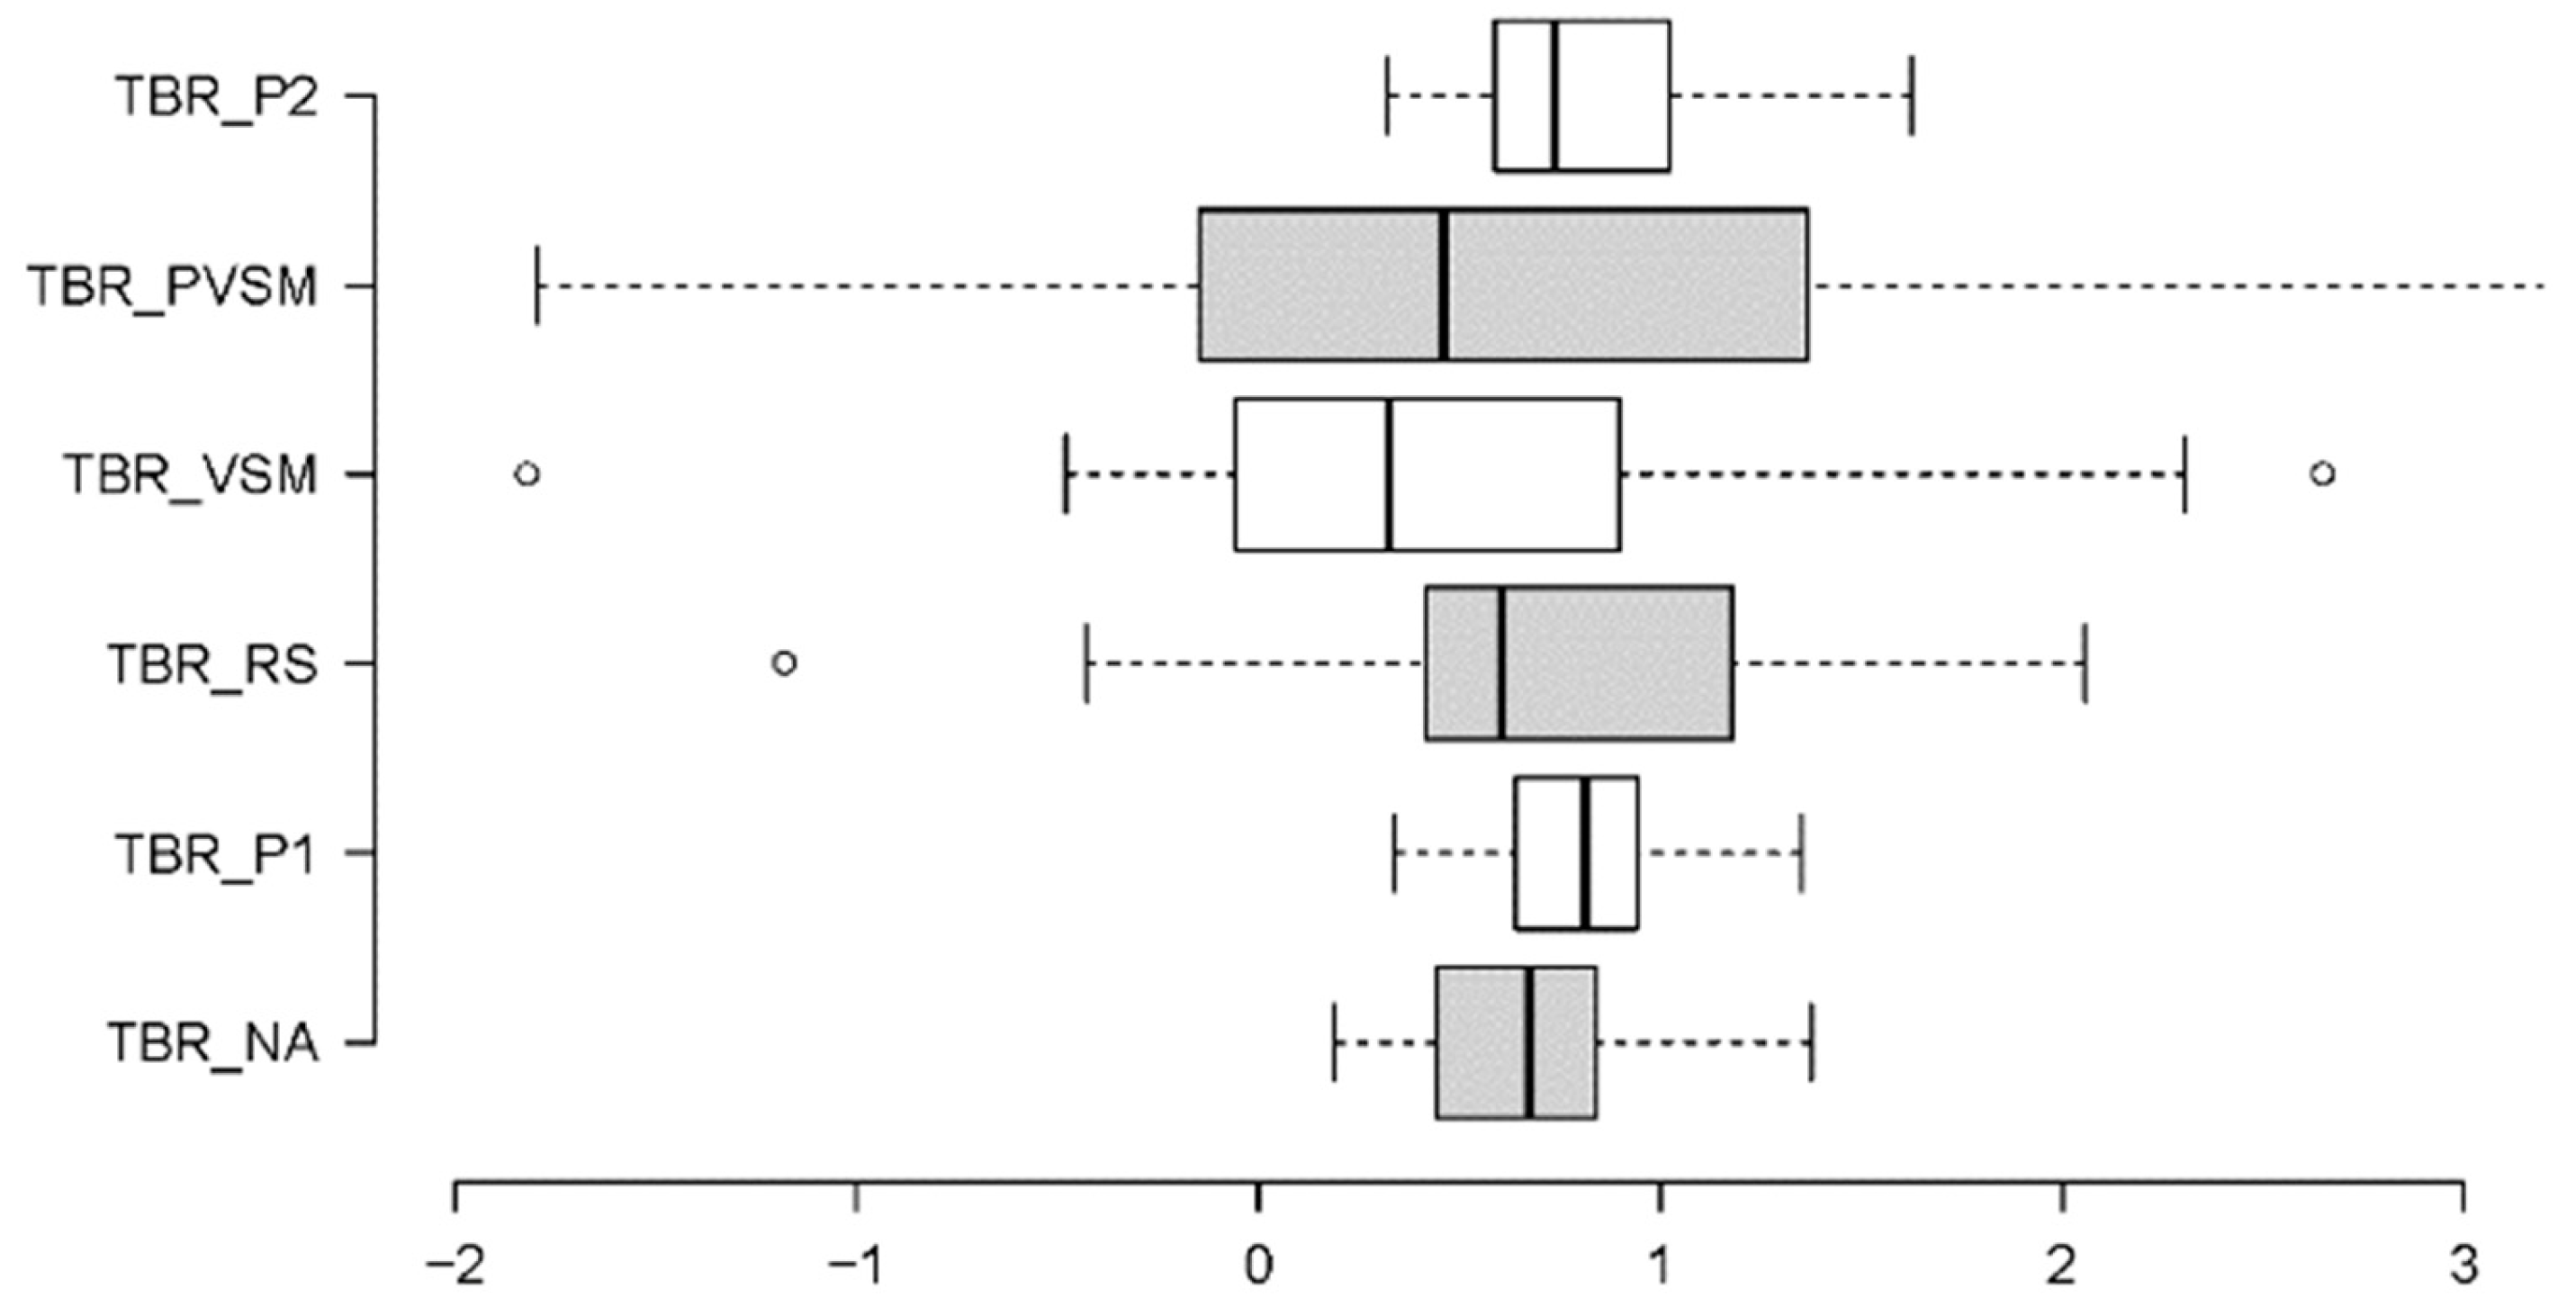
Figure 7.
Overview of the Wilcoxon TBR test results. Thick black lines show the significant differences between VSM and other stages (P1, RS, P2); dotted black lines indicate other significant TBR differences between stages (P1, PVSM, P2).
Figure 7.
Overview of the Wilcoxon TBR test results. Thick black lines show the significant differences between VSM and other stages (P1, RS, P2); dotted black lines indicate other significant TBR differences between stages (P1, PVSM, P2).
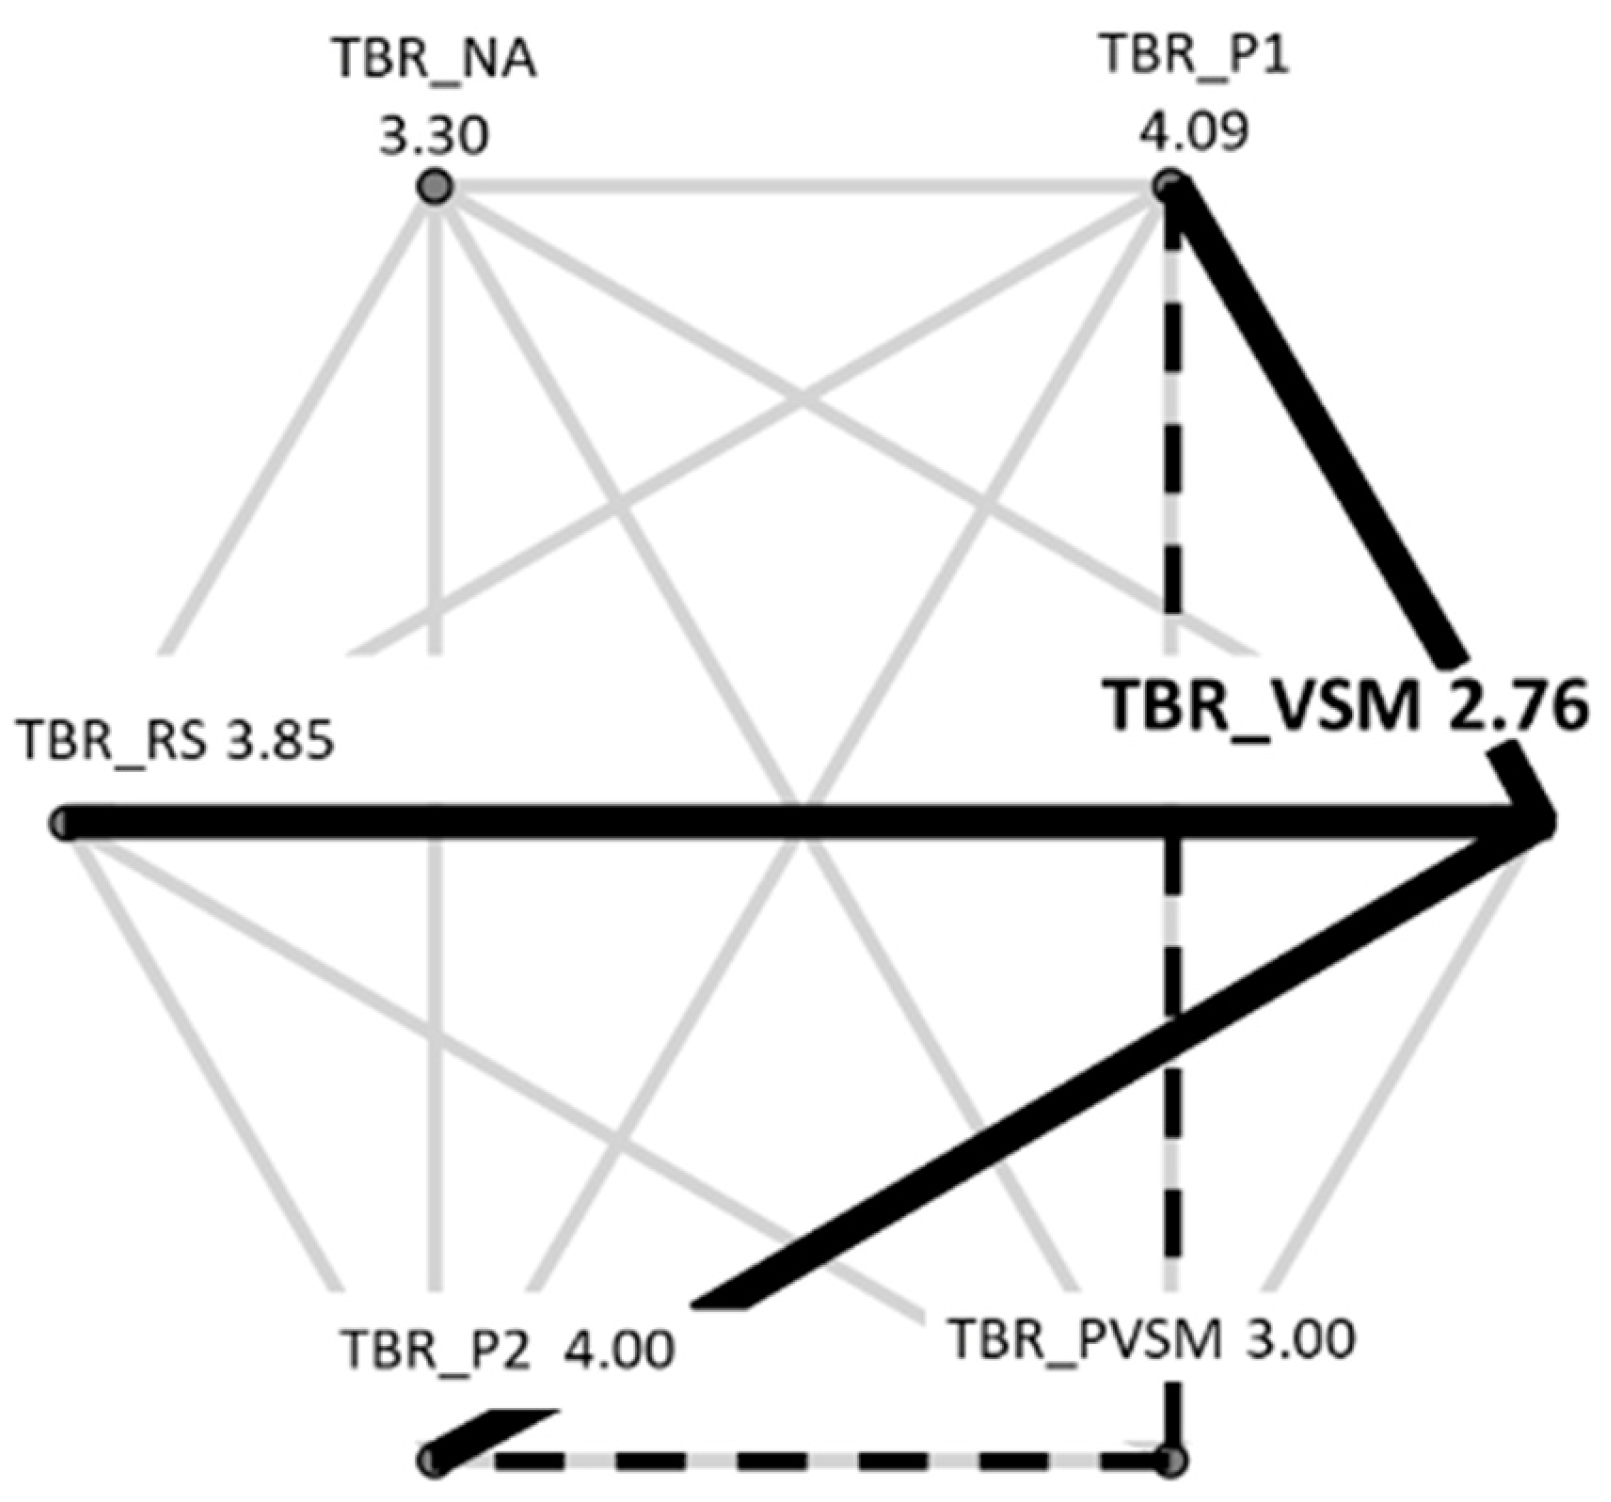
Figure 8.
Boxplot summary of BAR results for the six stages of the study, shown in chronological order from bottom to top. The horizontal axis shows dB ratios.
Figure 8.
Boxplot summary of BAR results for the six stages of the study, shown in chronological order from bottom to top. The horizontal axis shows dB ratios.
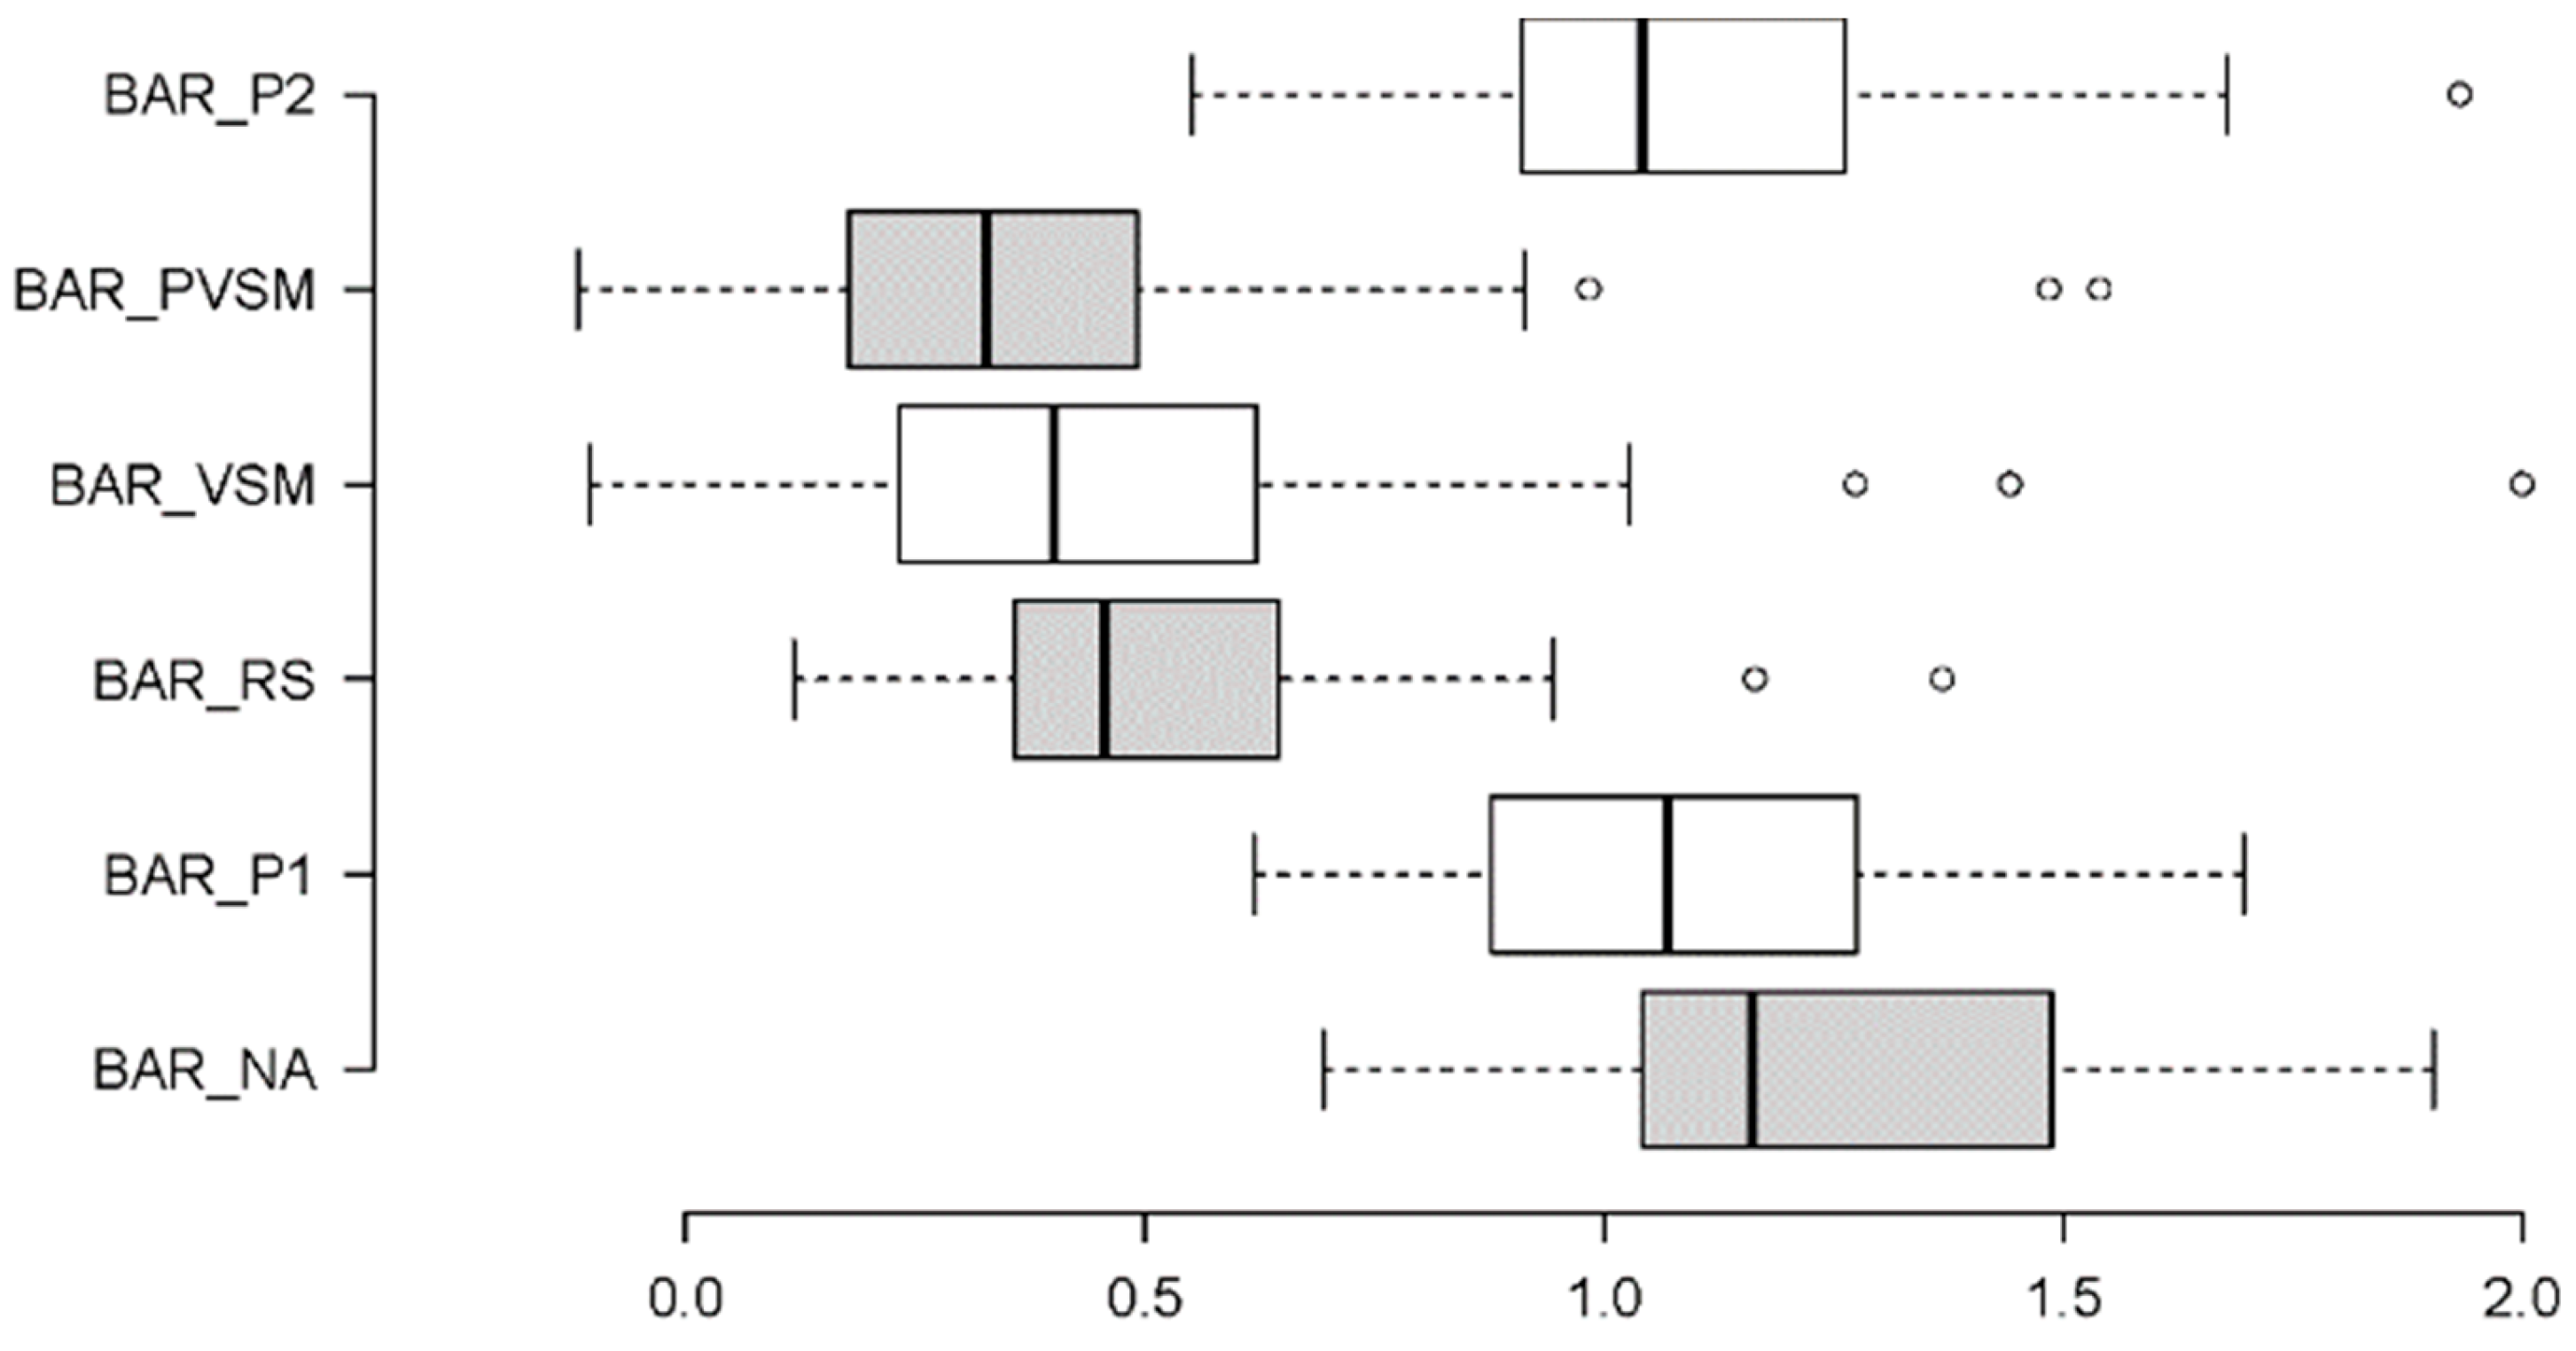
Figure 9.
Overview of the pairwise-comparisons t-test results. Thick black lines show the significant differences between VSM and other stages (NA, P1, P2); dotted black lines indicate other significant BAR differences between stages.
Figure 9.
Overview of the pairwise-comparisons t-test results. Thick black lines show the significant differences between VSM and other stages (NA, P1, P2); dotted black lines indicate other significant BAR differences between stages.
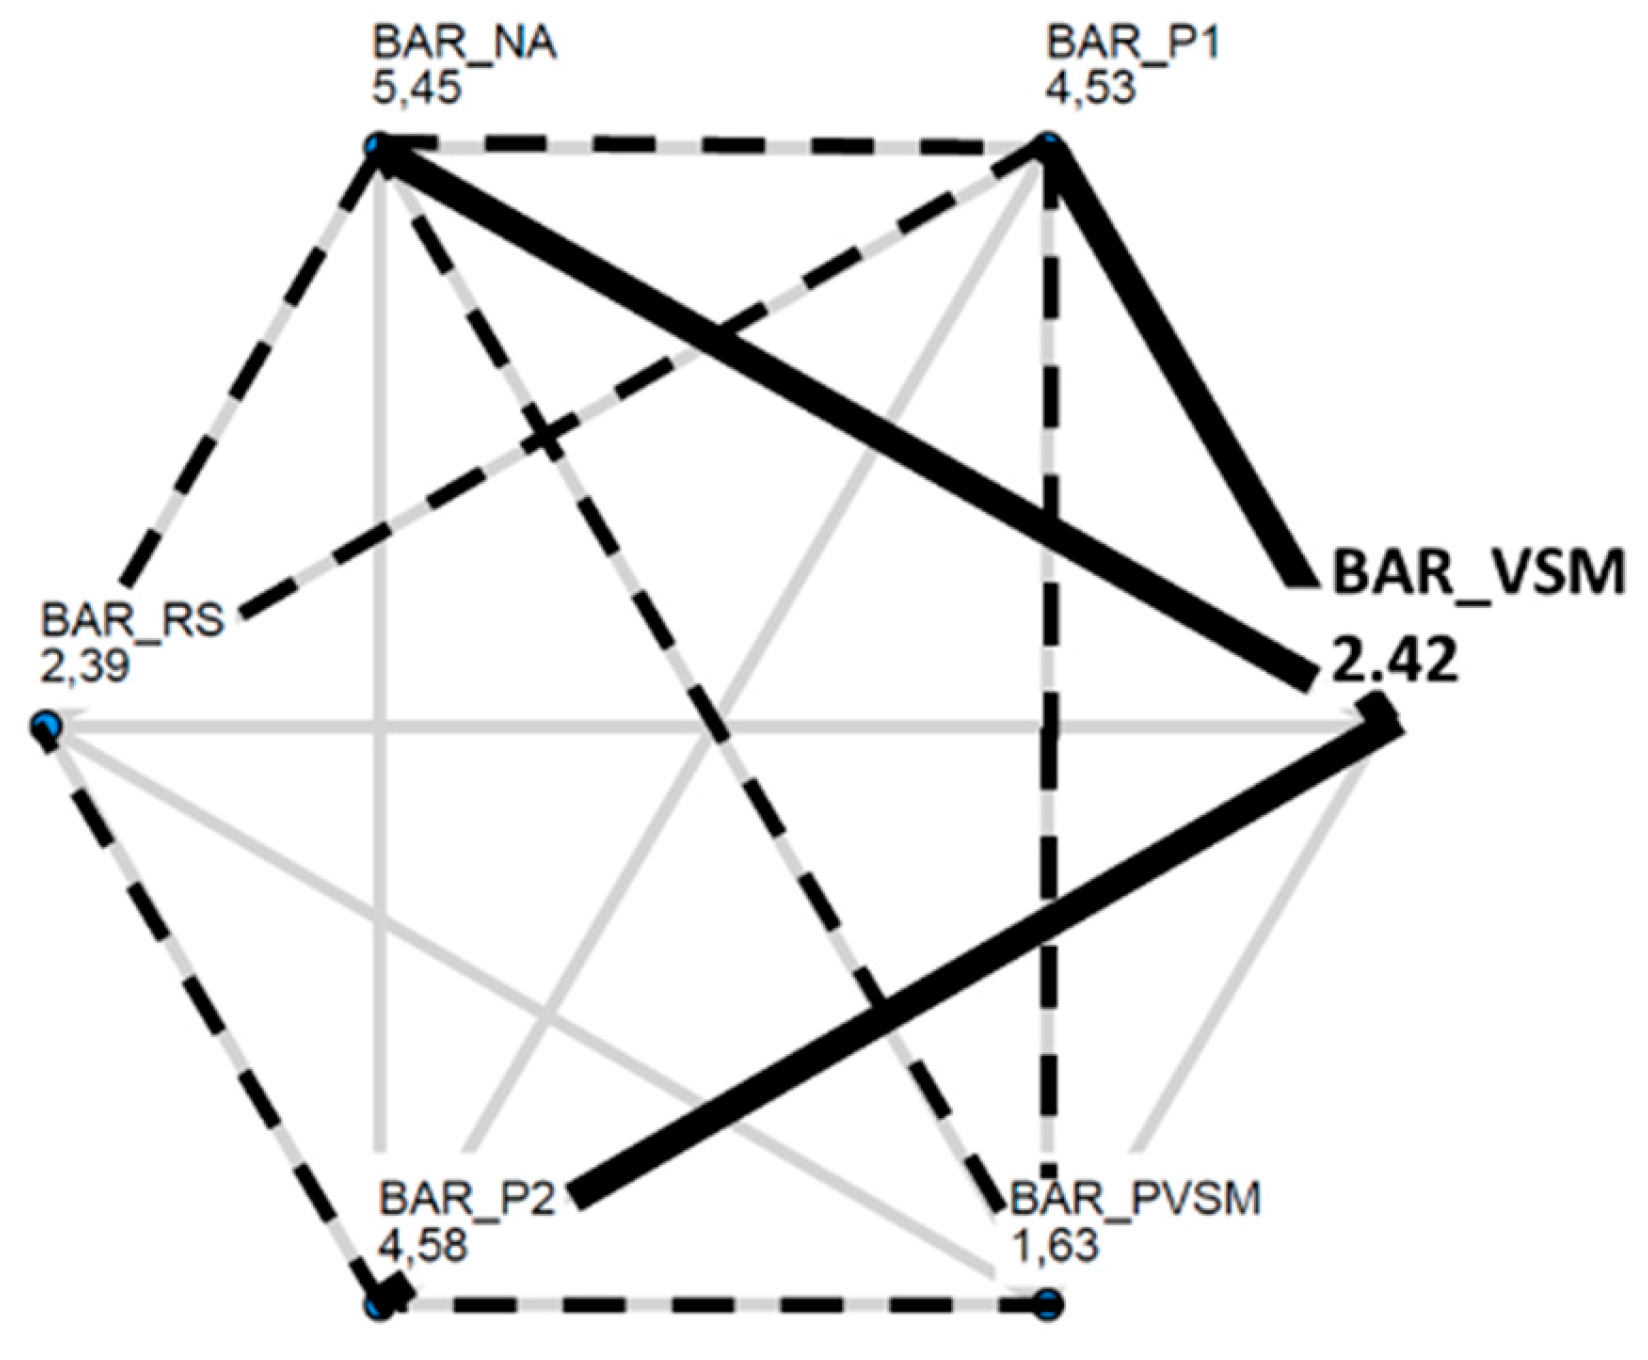
Figure 10.
Boxplot summary of FAA results for the six stages of the study, shown in chronological order from bottom to top. The horizontal axis shows dB values.
Figure 10.
Boxplot summary of FAA results for the six stages of the study, shown in chronological order from bottom to top. The horizontal axis shows dB values.
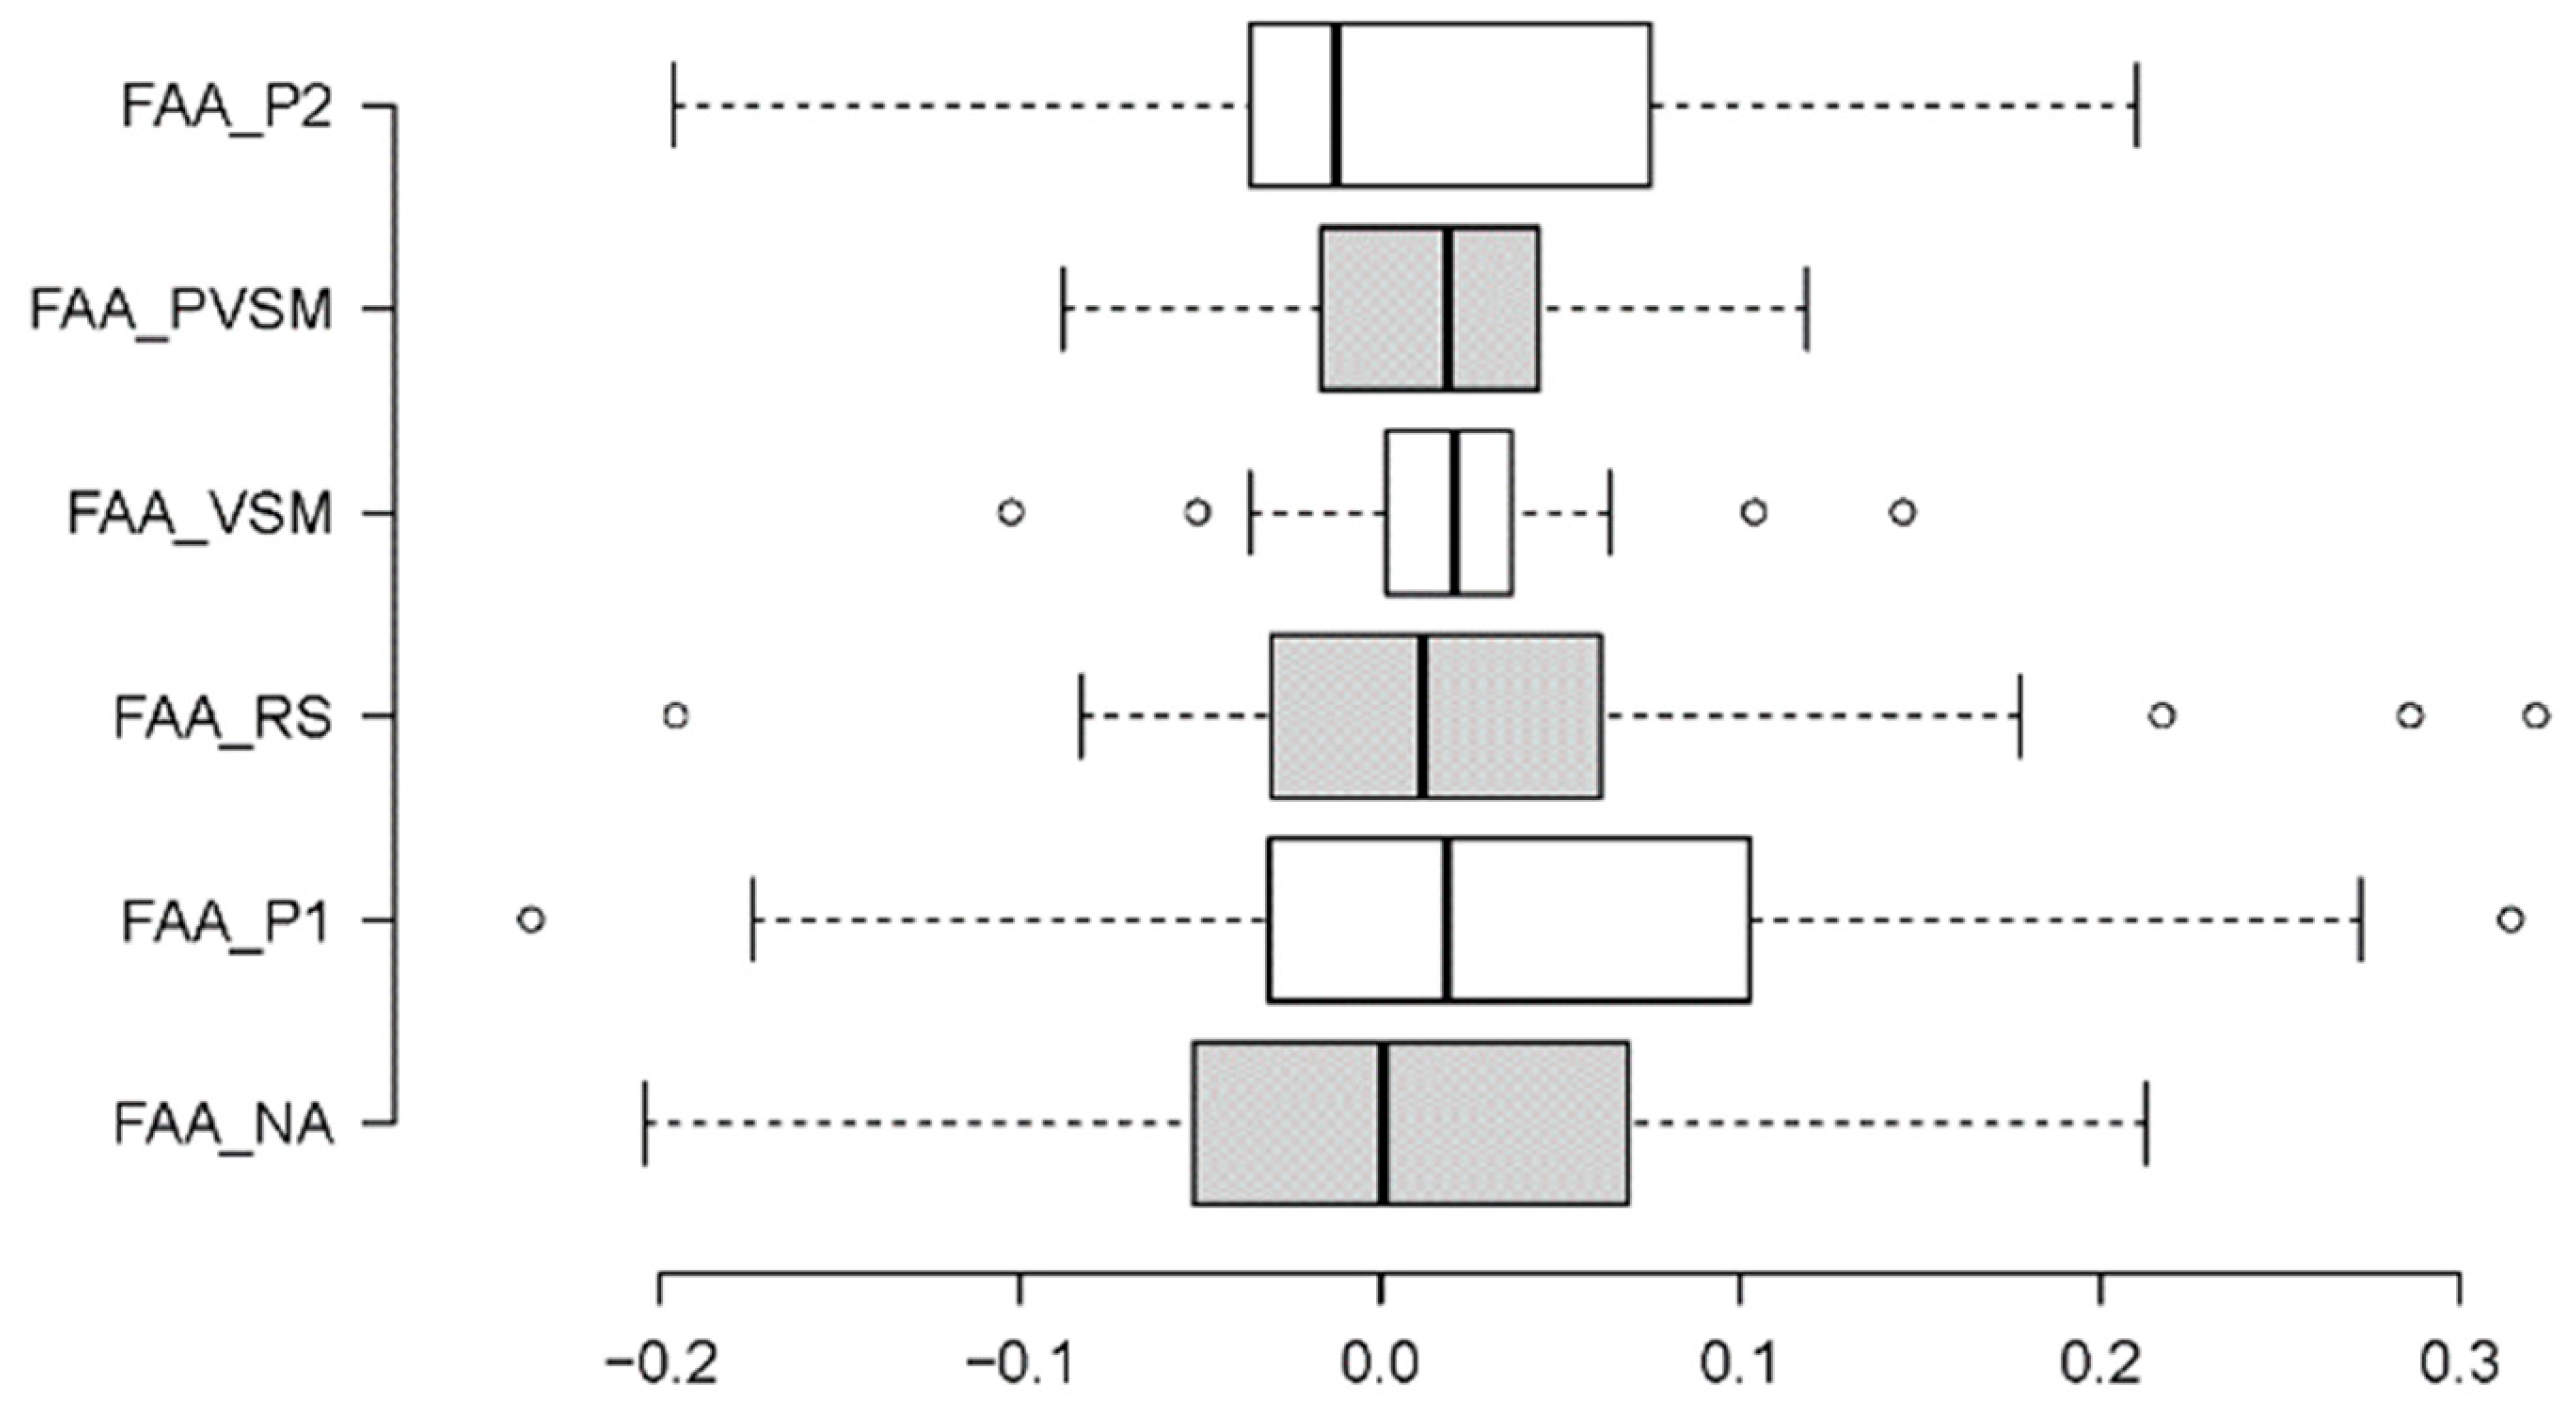
Figure 11.
Boxplot summary of mean HR results for the six stages of the study, shown in chronological order from bottom to top. The horizontal axis shows beat-per-minute (BPM) values.
Figure 11.
Boxplot summary of mean HR results for the six stages of the study, shown in chronological order from bottom to top. The horizontal axis shows beat-per-minute (BPM) values.
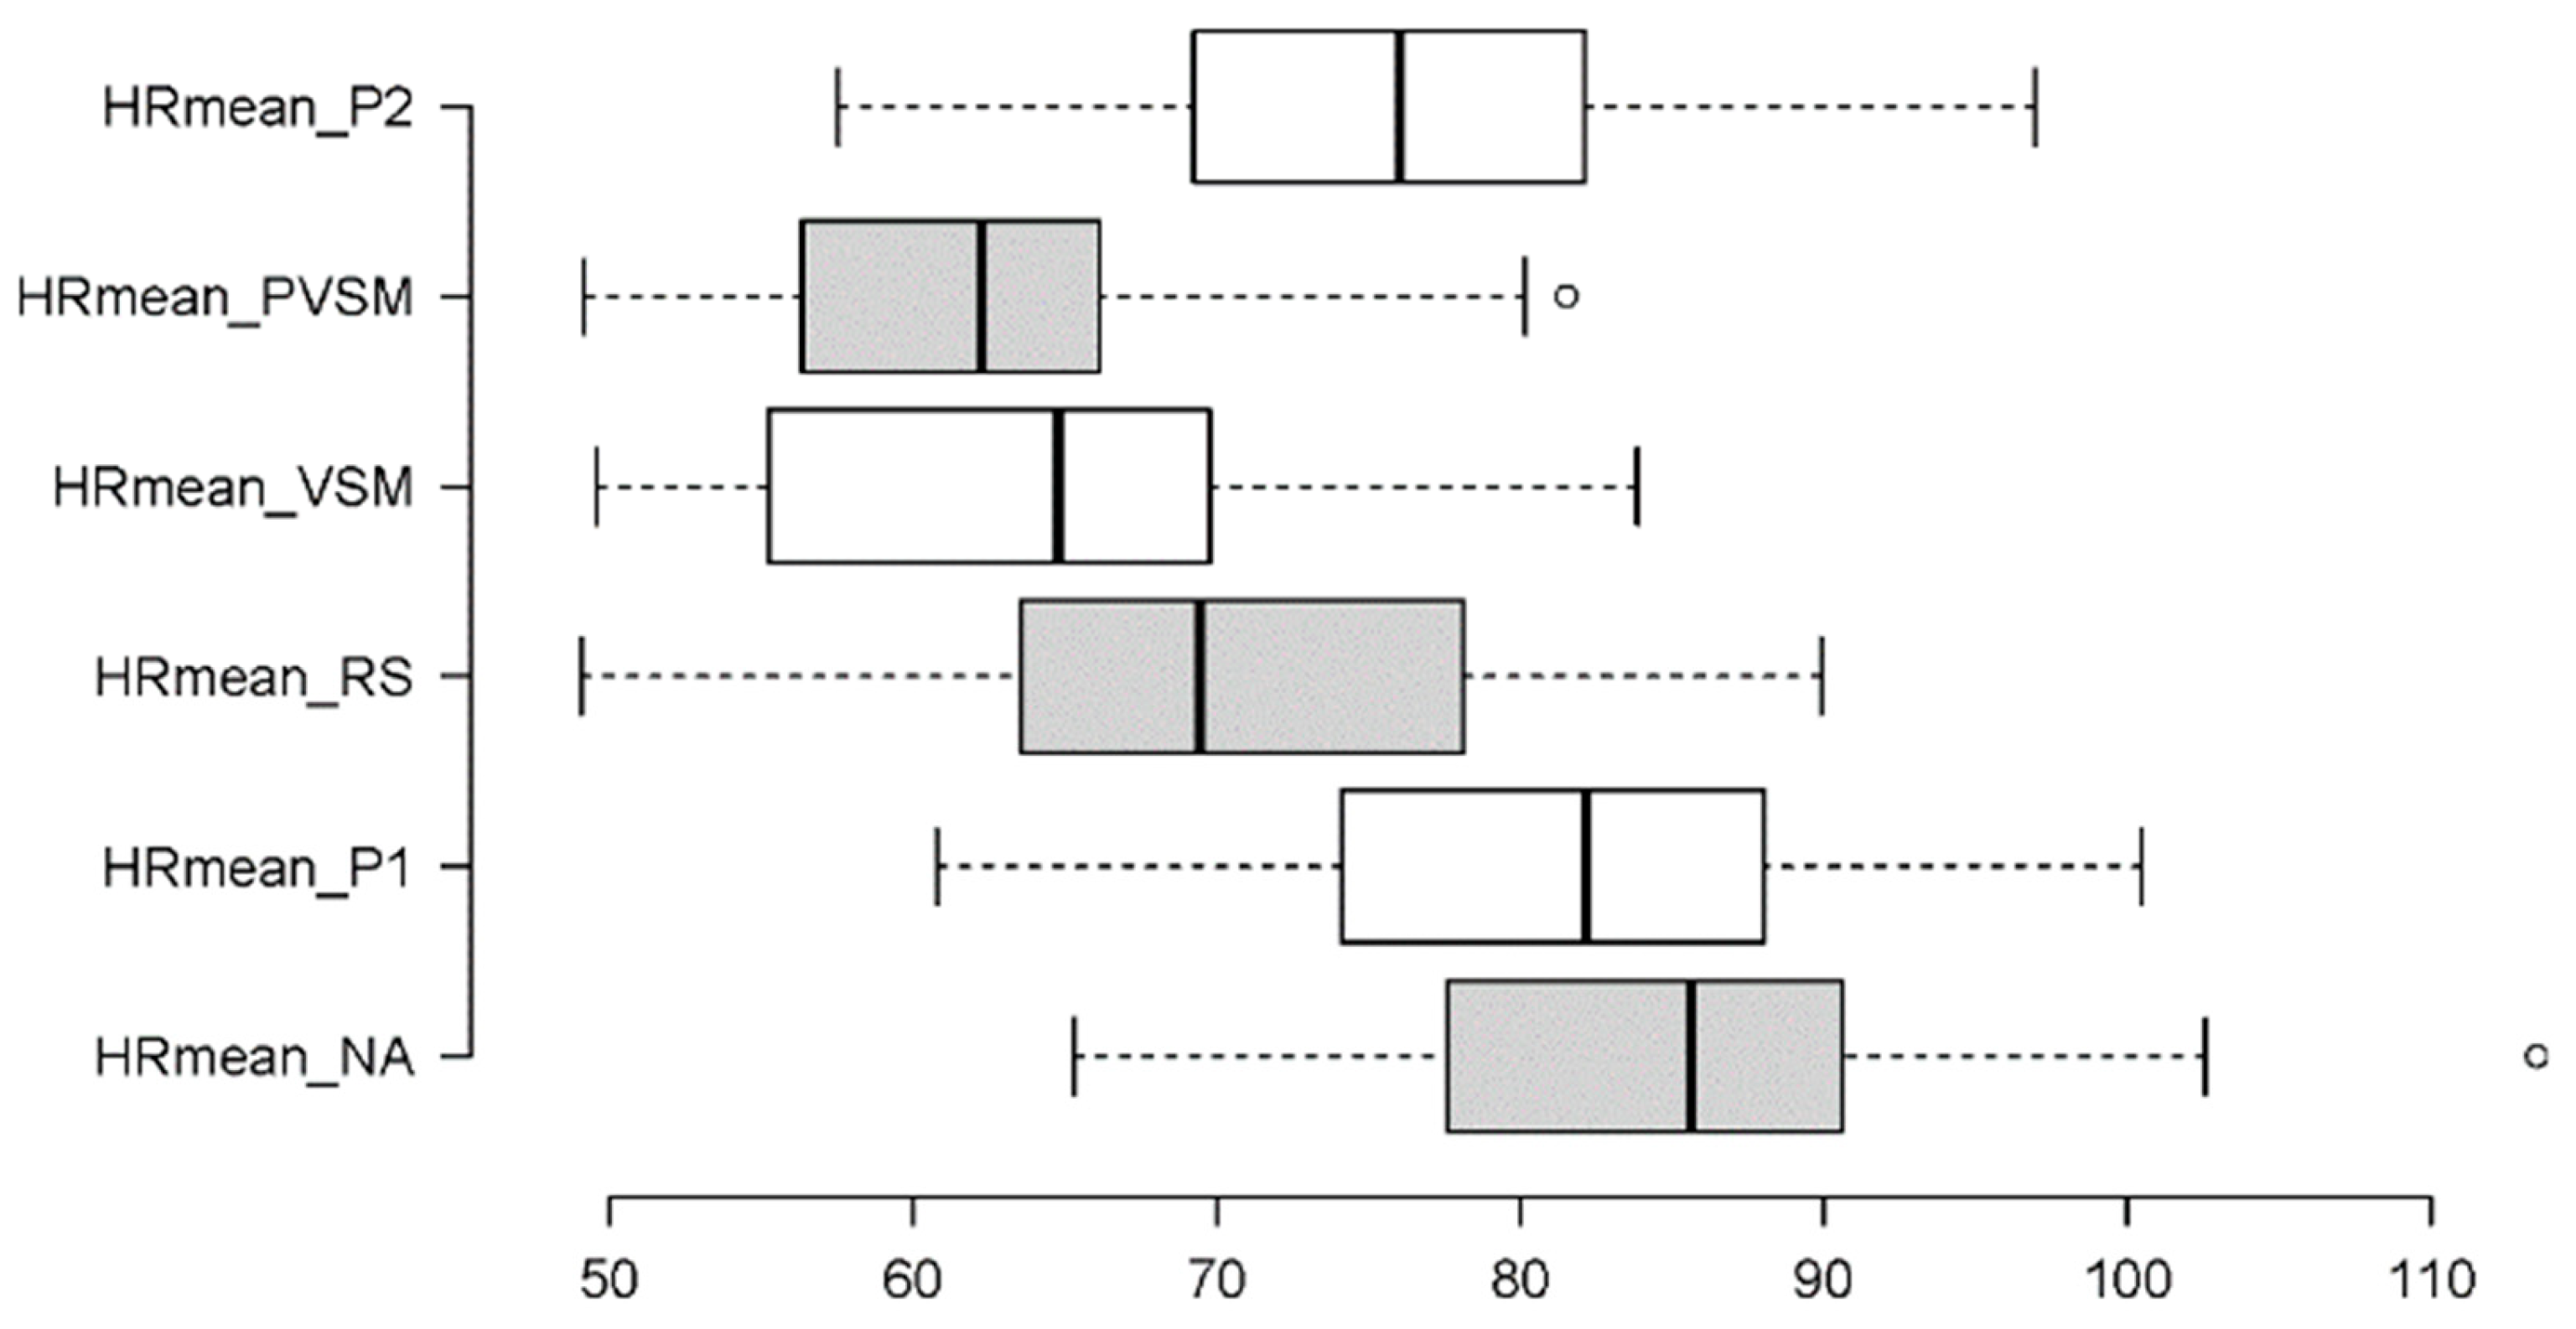
Figure 12.
Overview of the pairwise-comparisons t-test results. Thick black lines show the significant differences between VSM and other stages (NA, P1, RS, P2); dotted black lines indicate other significant mean HR differences between stages.
Figure 12.
Overview of the pairwise-comparisons t-test results. Thick black lines show the significant differences between VSM and other stages (NA, P1, RS, P2); dotted black lines indicate other significant mean HR differences between stages.
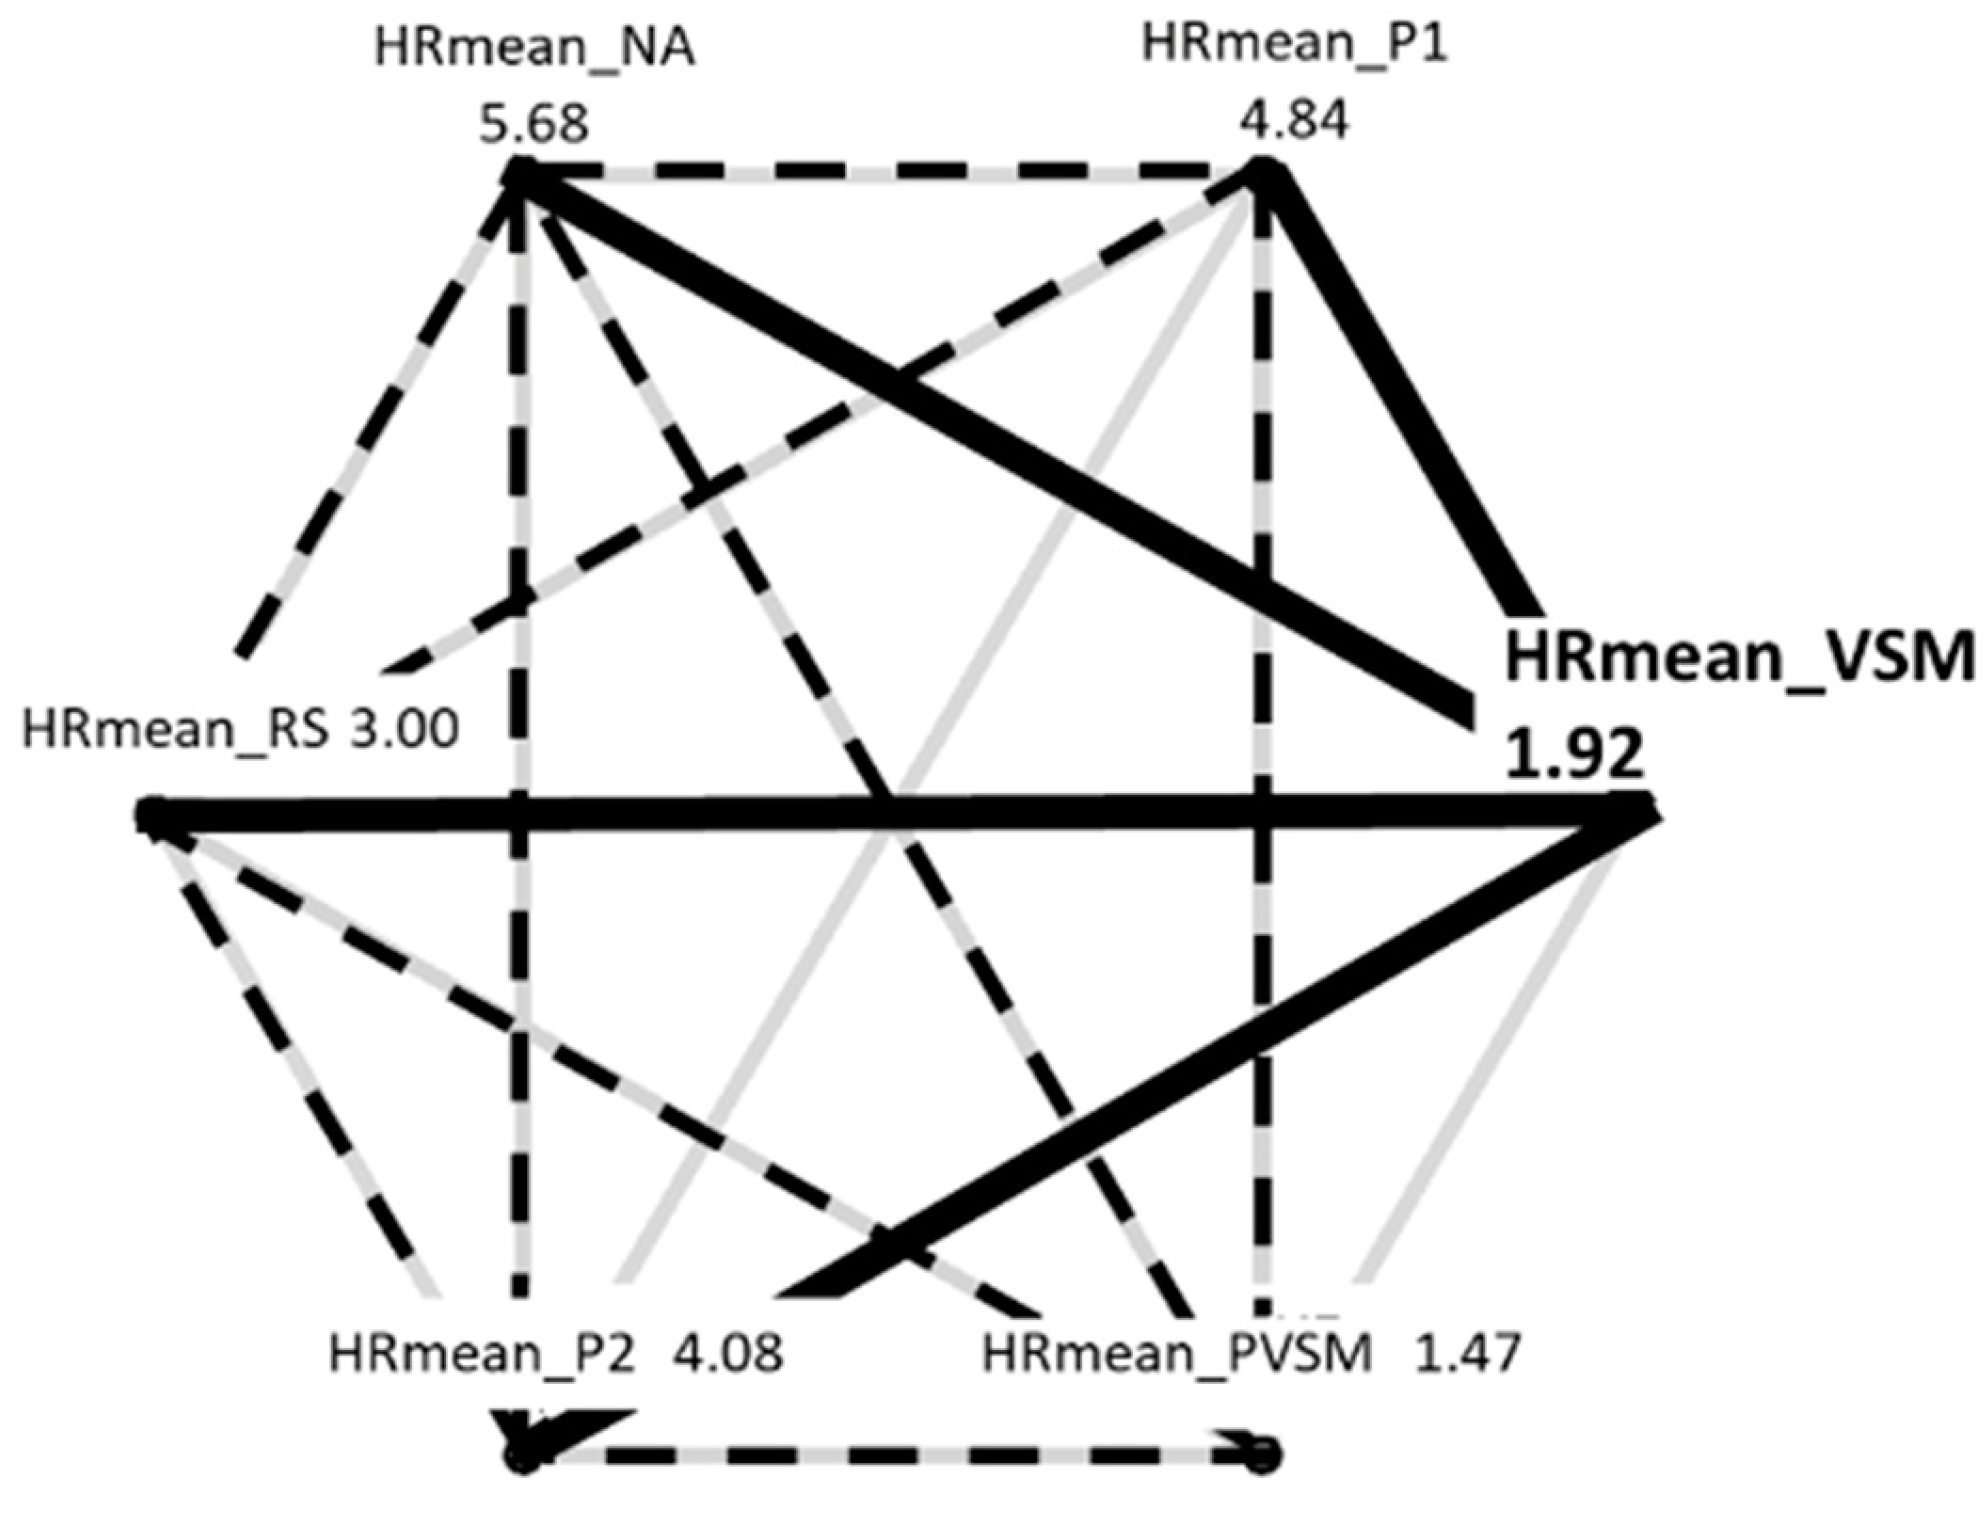
Figure 13.
Boxplot summary of mean HRV results for the six stages of the study, shown in chronological order from bottom to top. The horizontal axis shows variability values in milliseconds.
Figure 13.
Boxplot summary of mean HRV results for the six stages of the study, shown in chronological order from bottom to top. The horizontal axis shows variability values in milliseconds.
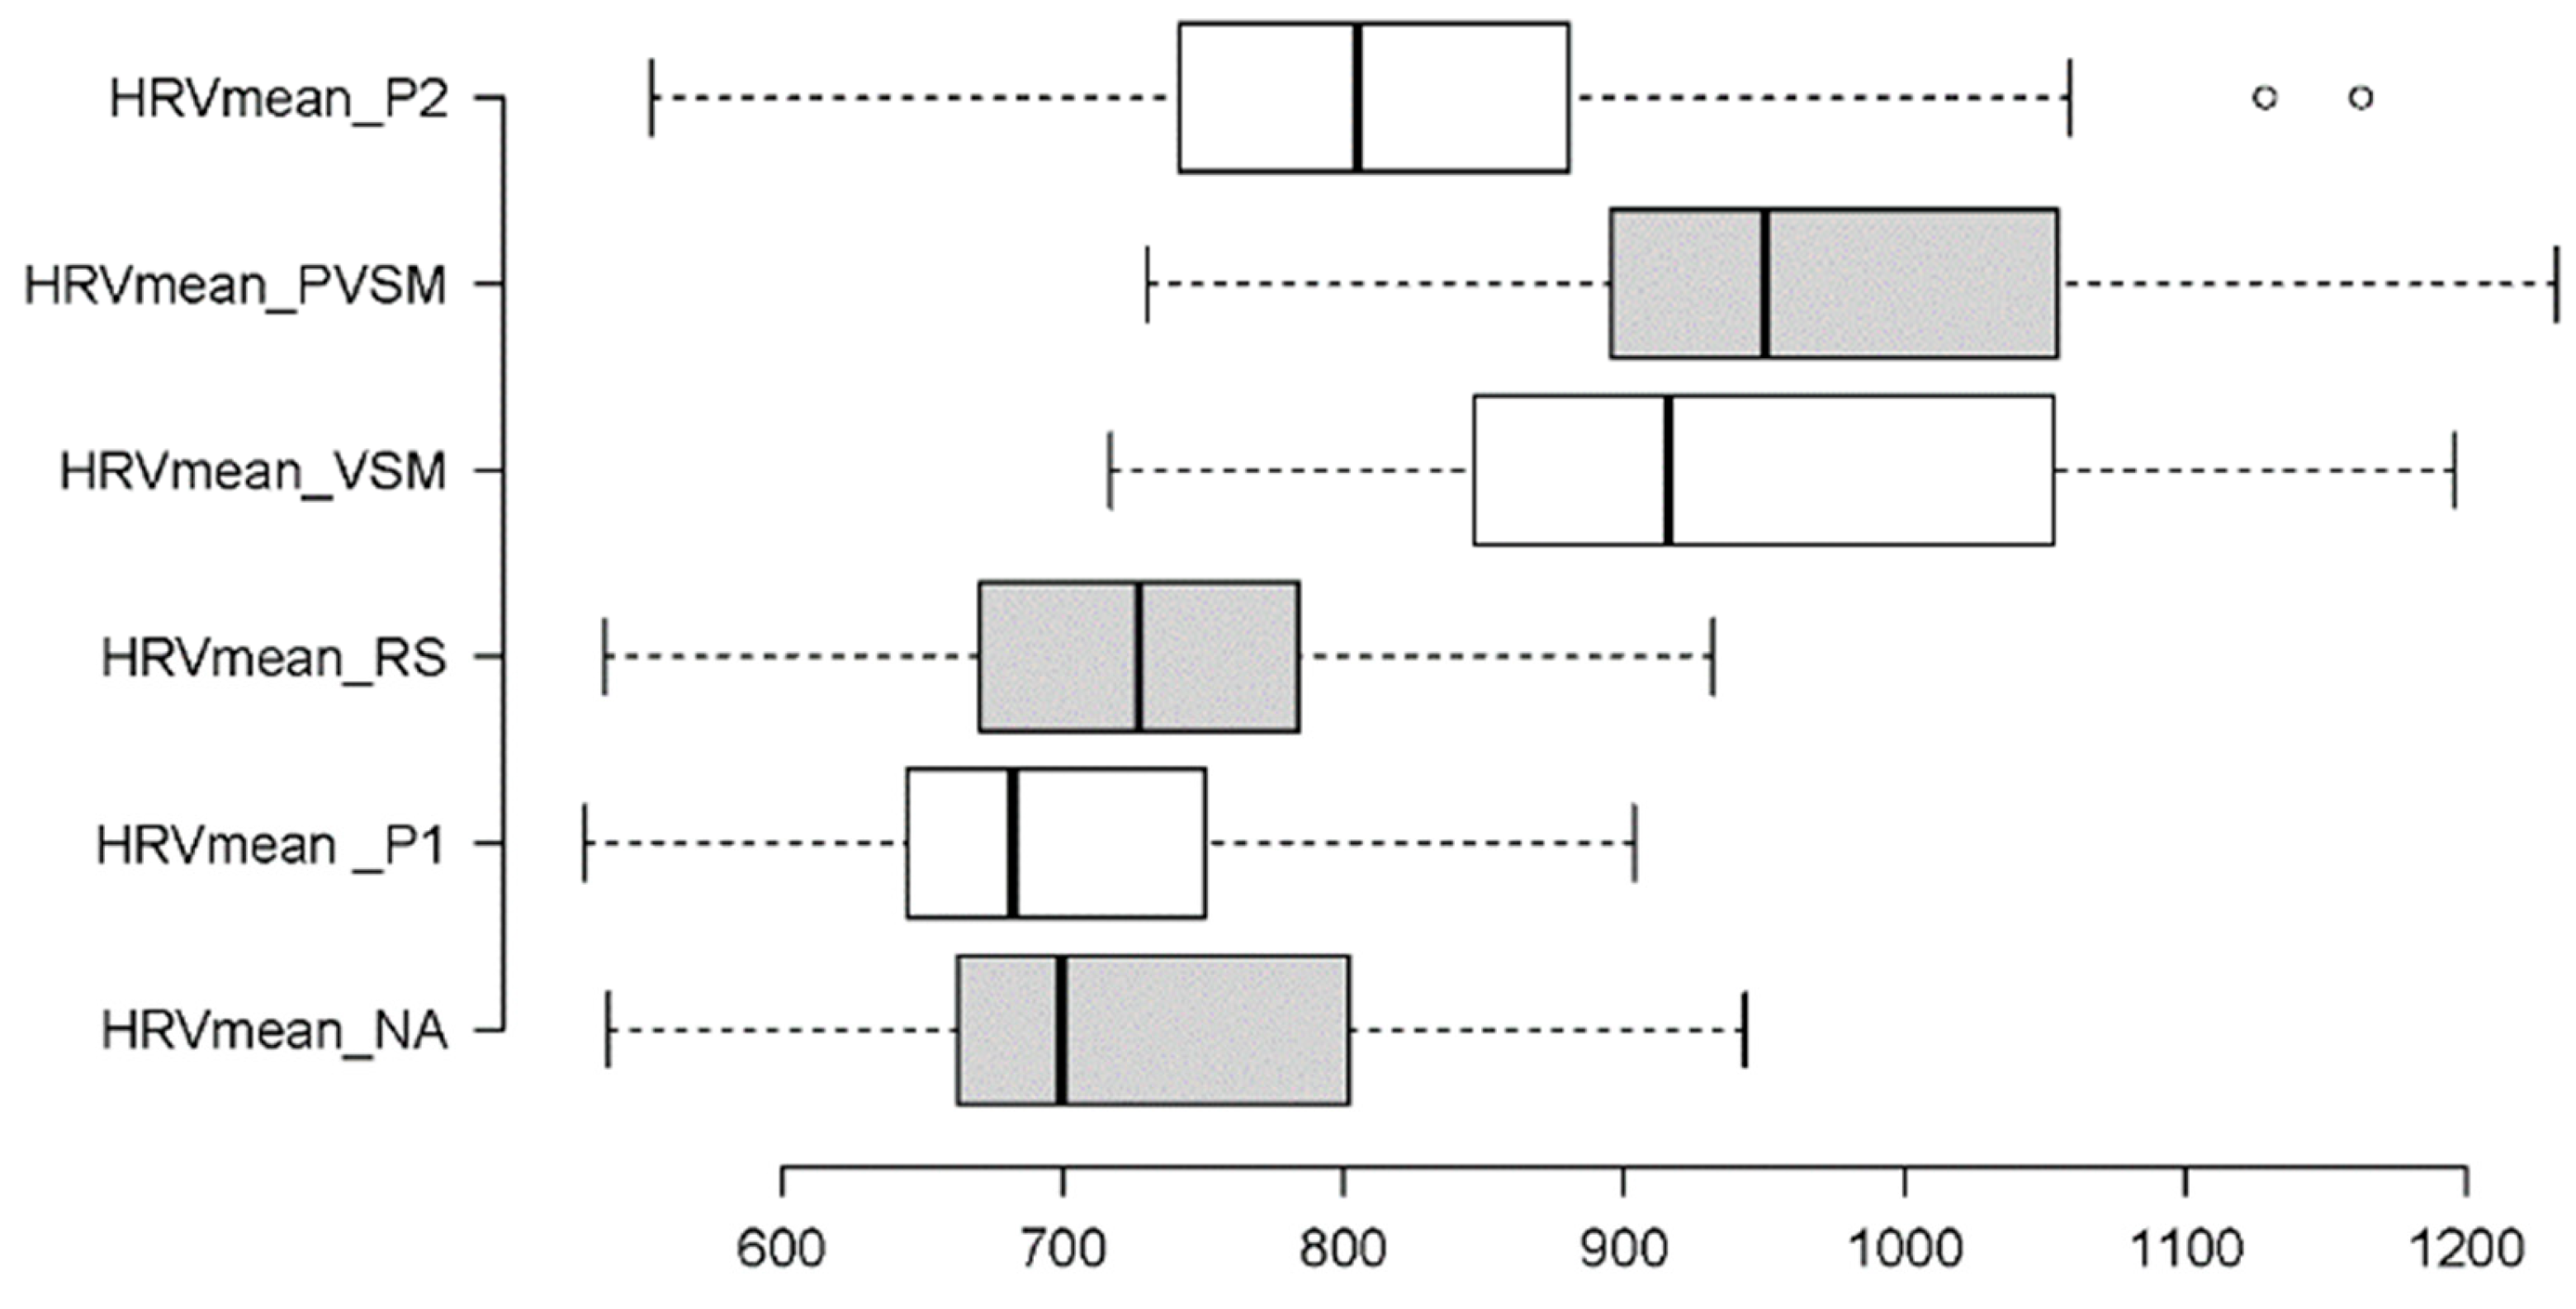
Figure 14.
Overview of the pairwise-comparisons t-test results. Thick black lines show the significant differences between VSM and other stages (NA, P1, RS, P2); dotted black lines indicate other significant mean HRV differences between stages.
Figure 14.
Overview of the pairwise-comparisons t-test results. Thick black lines show the significant differences between VSM and other stages (NA, P1, RS, P2); dotted black lines indicate other significant mean HRV differences between stages.
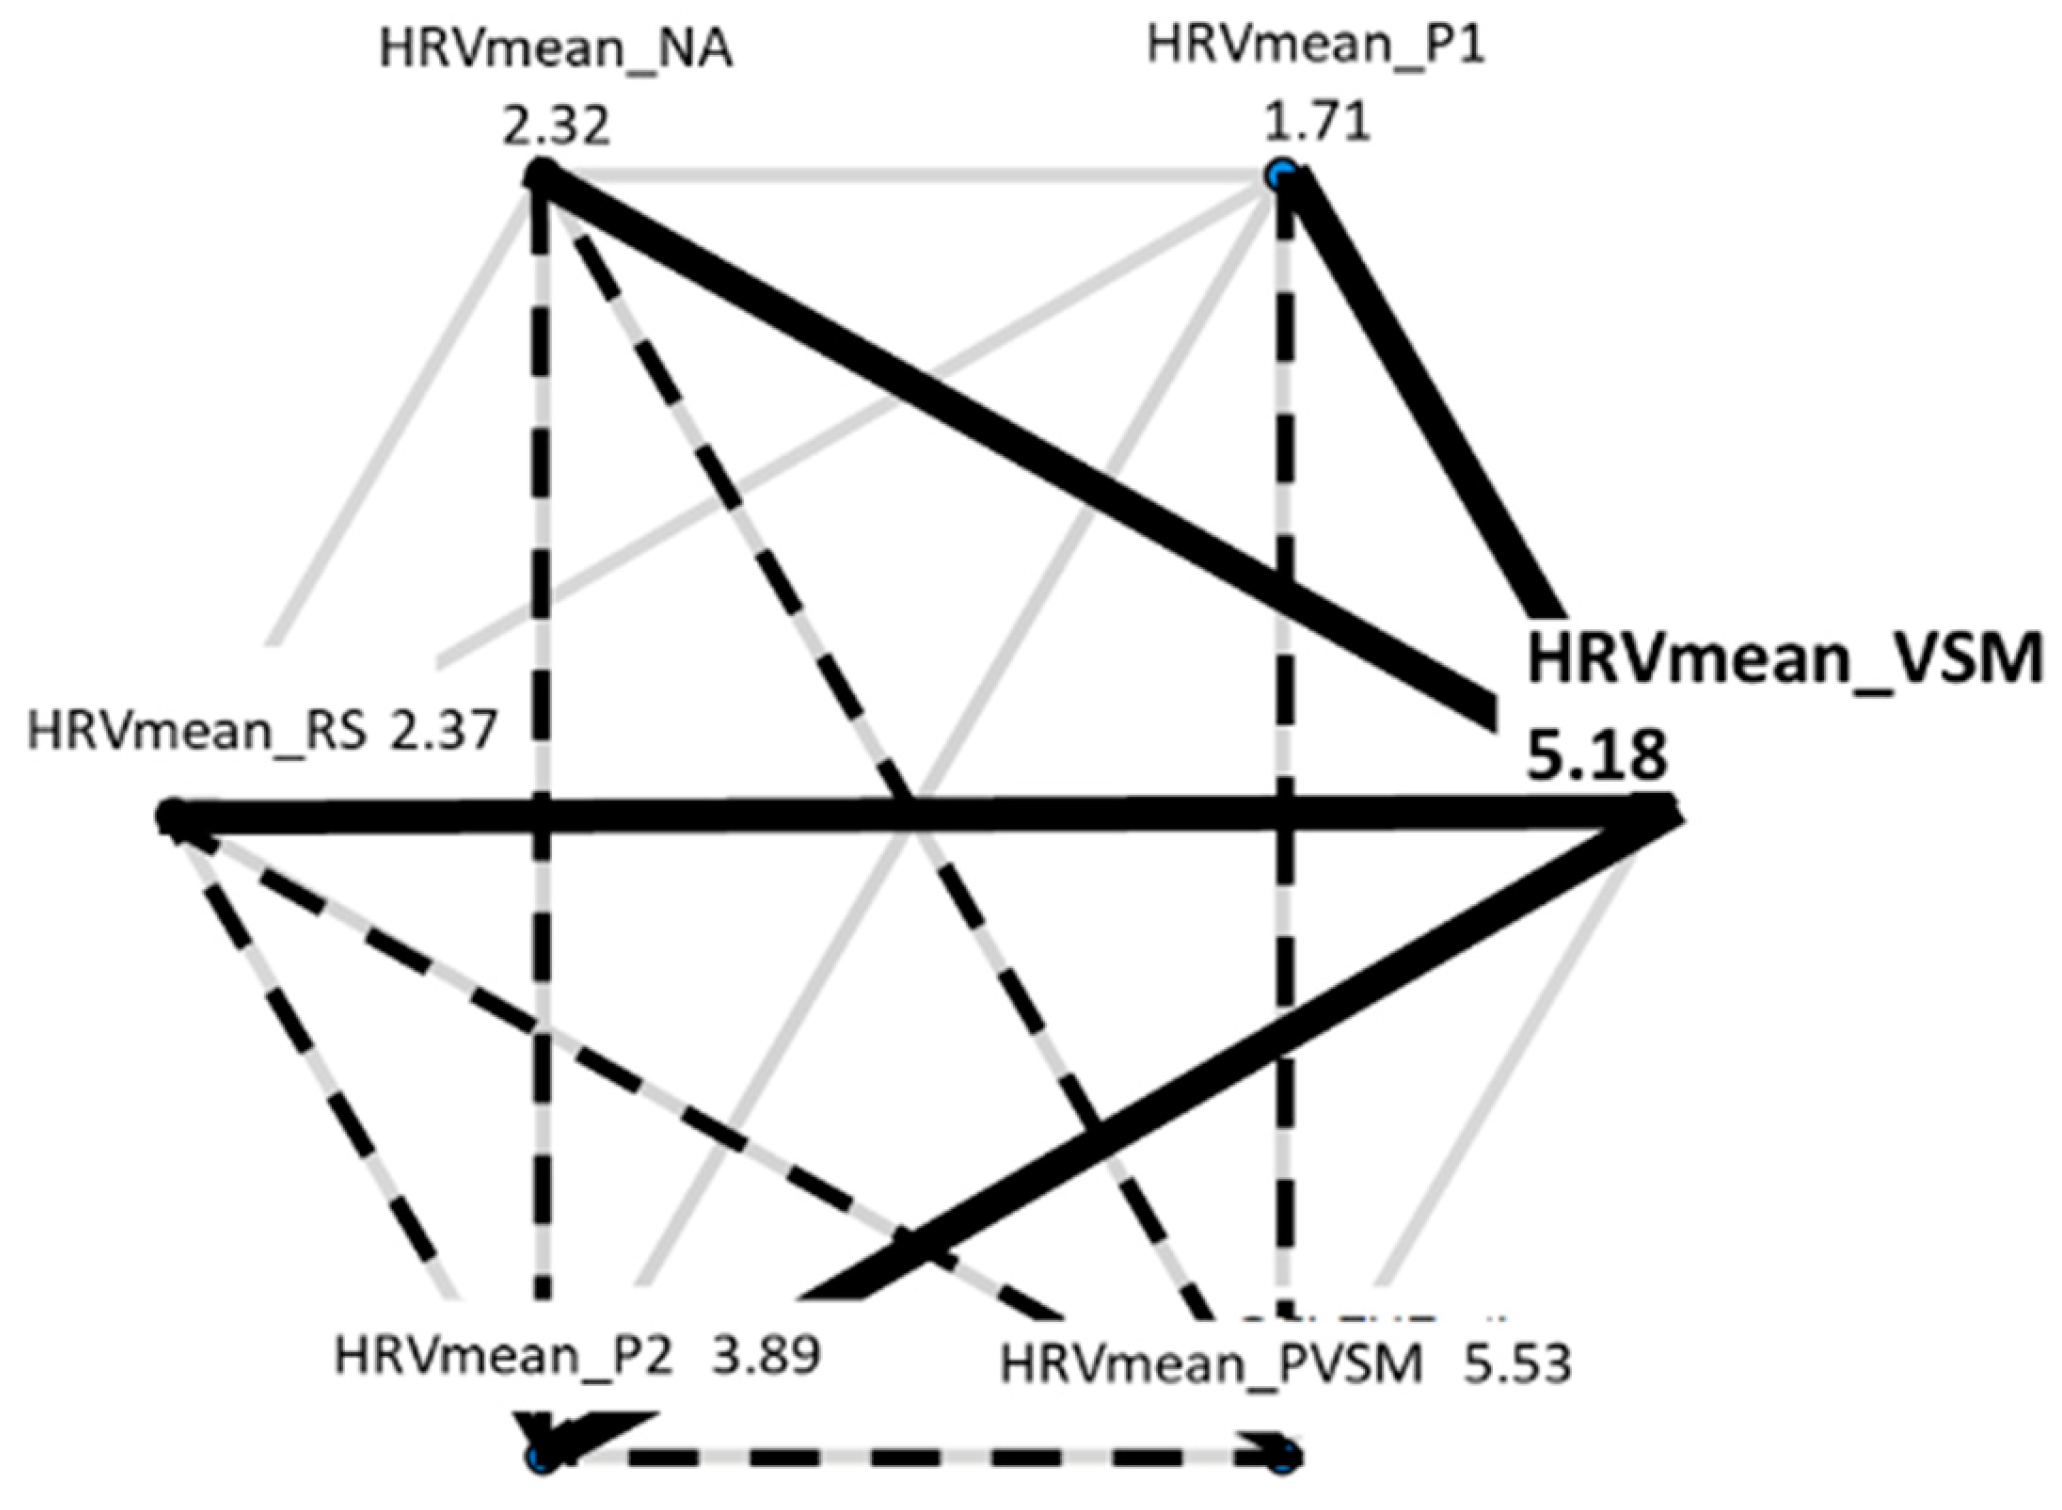
Figure 15.
Boxplot summary of LF/HF ratio results for the six stages of the study, shown in chronological order from bottom to top. The horizontal axis shows ratios of two Hz values.
Figure 15.
Boxplot summary of LF/HF ratio results for the six stages of the study, shown in chronological order from bottom to top. The horizontal axis shows ratios of two Hz values.
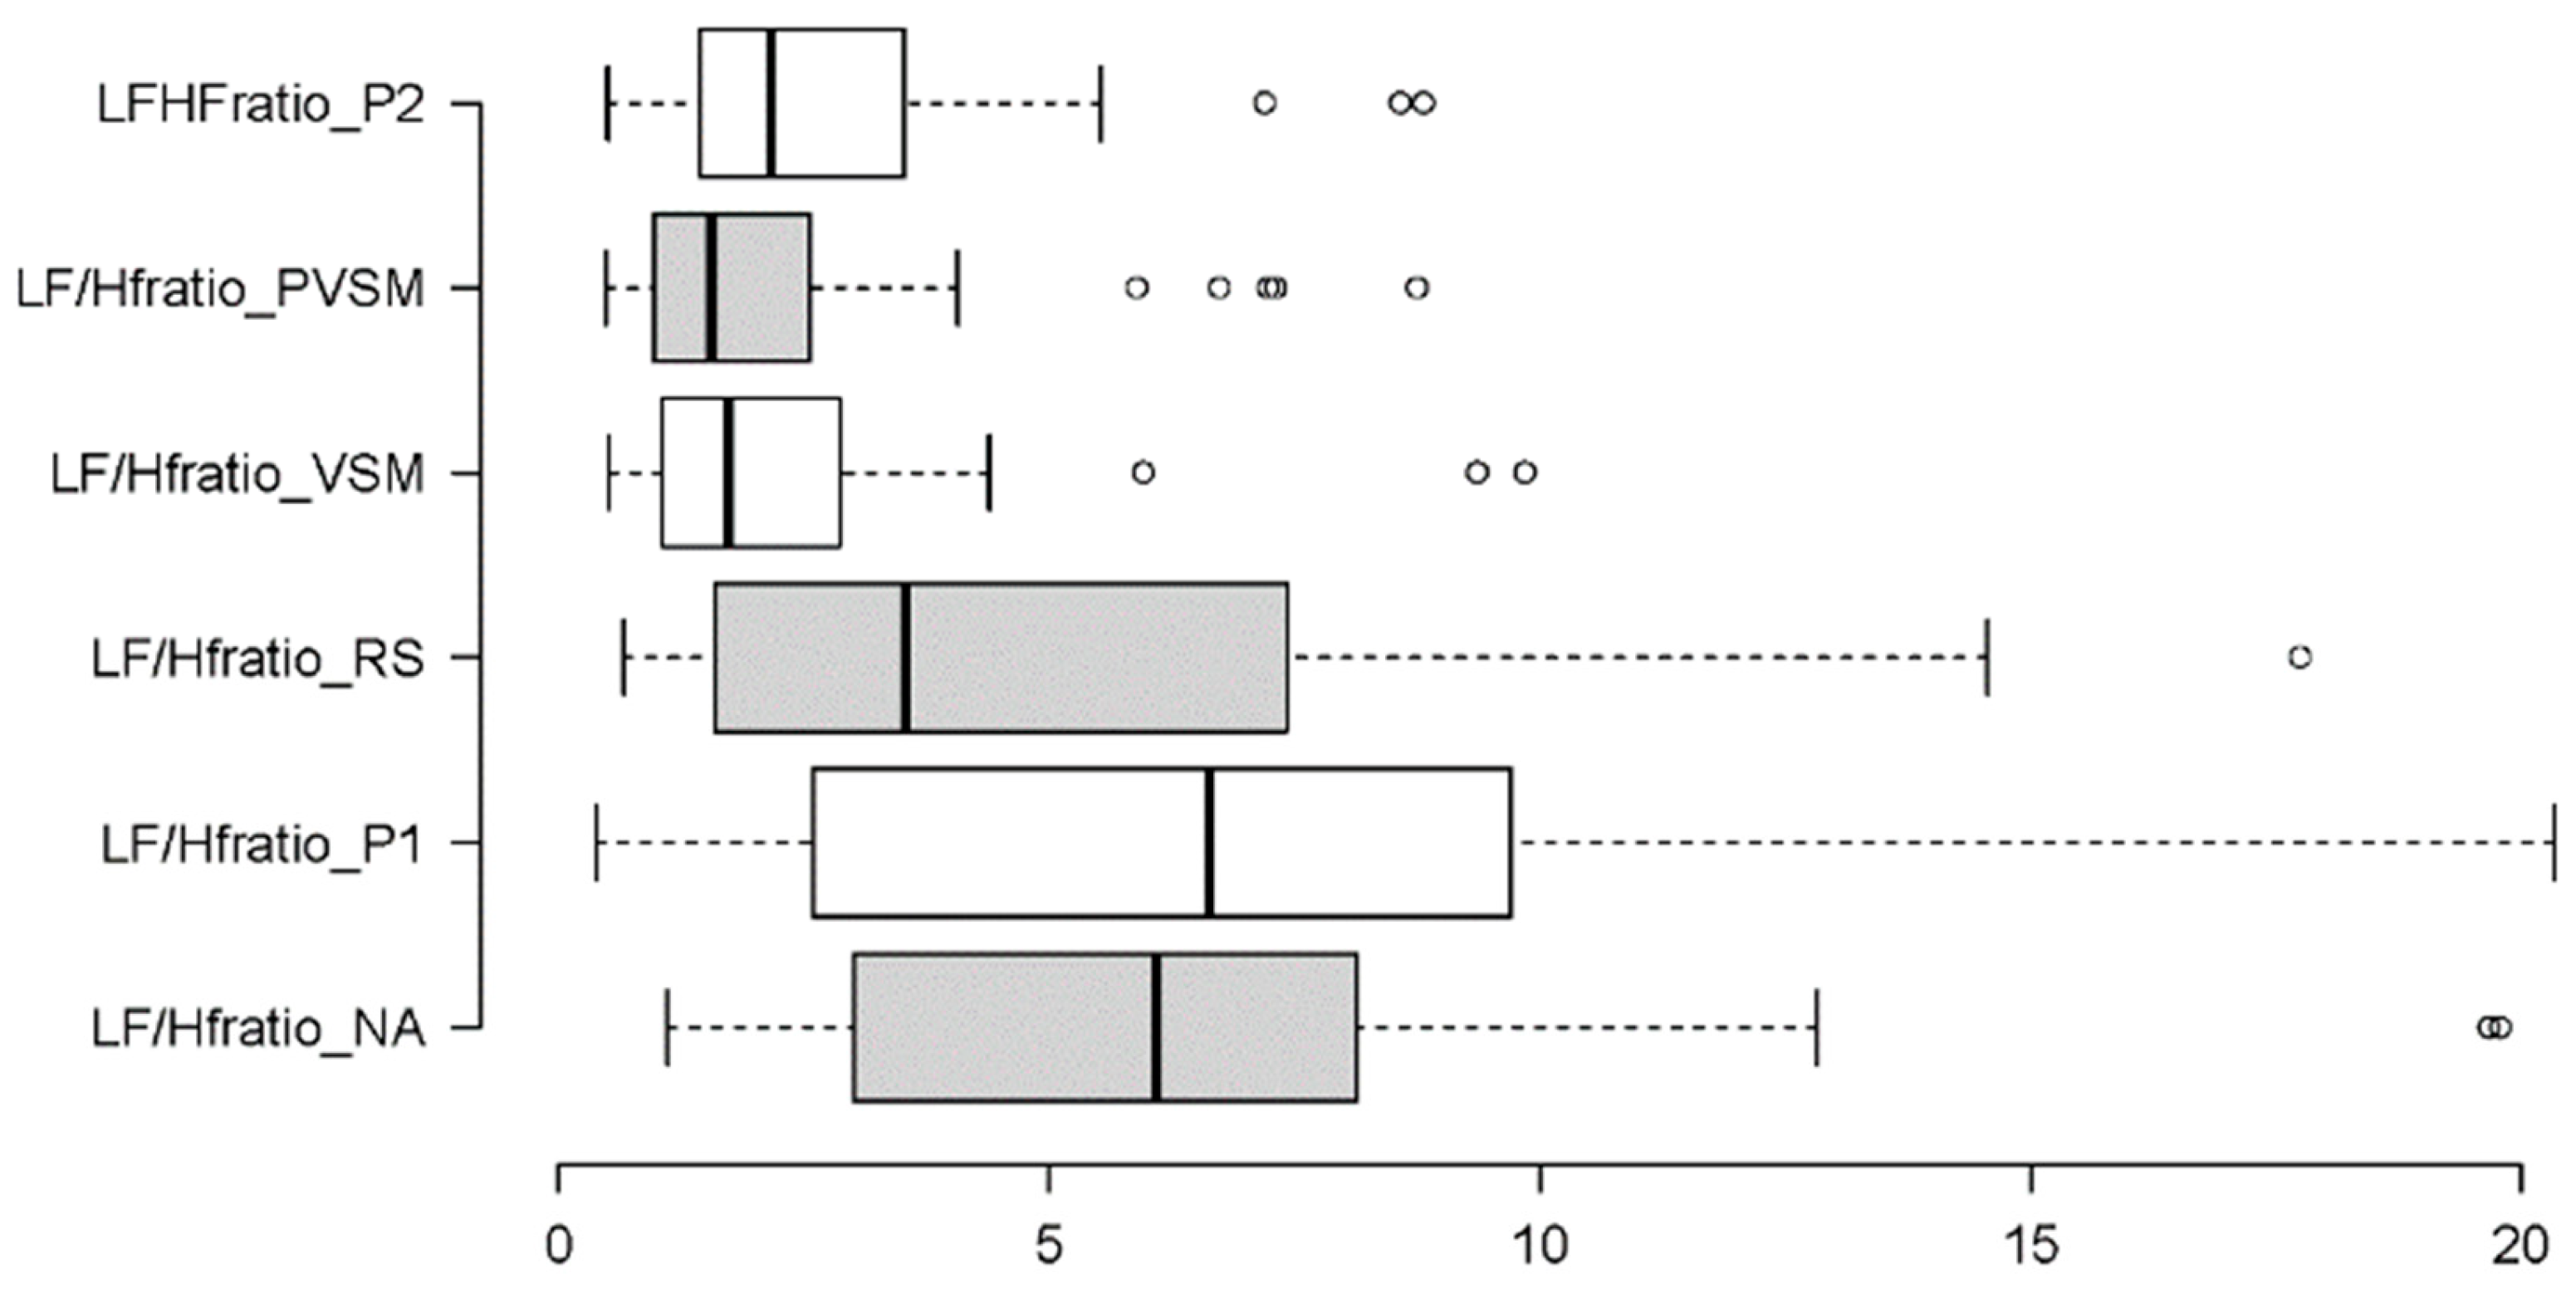
Figure 16.
Overview of the pairwise-comparisons Wilcoxon test results. Thick black lines show the significant differences between VSM and other stages (NA, P1, RS, P2); dotted black lines indicate other significant LF/HF ratio differences between stages.
Figure 16.
Overview of the pairwise-comparisons Wilcoxon test results. Thick black lines show the significant differences between VSM and other stages (NA, P1, RS, P2); dotted black lines indicate other significant LF/HF ratio differences between stages.
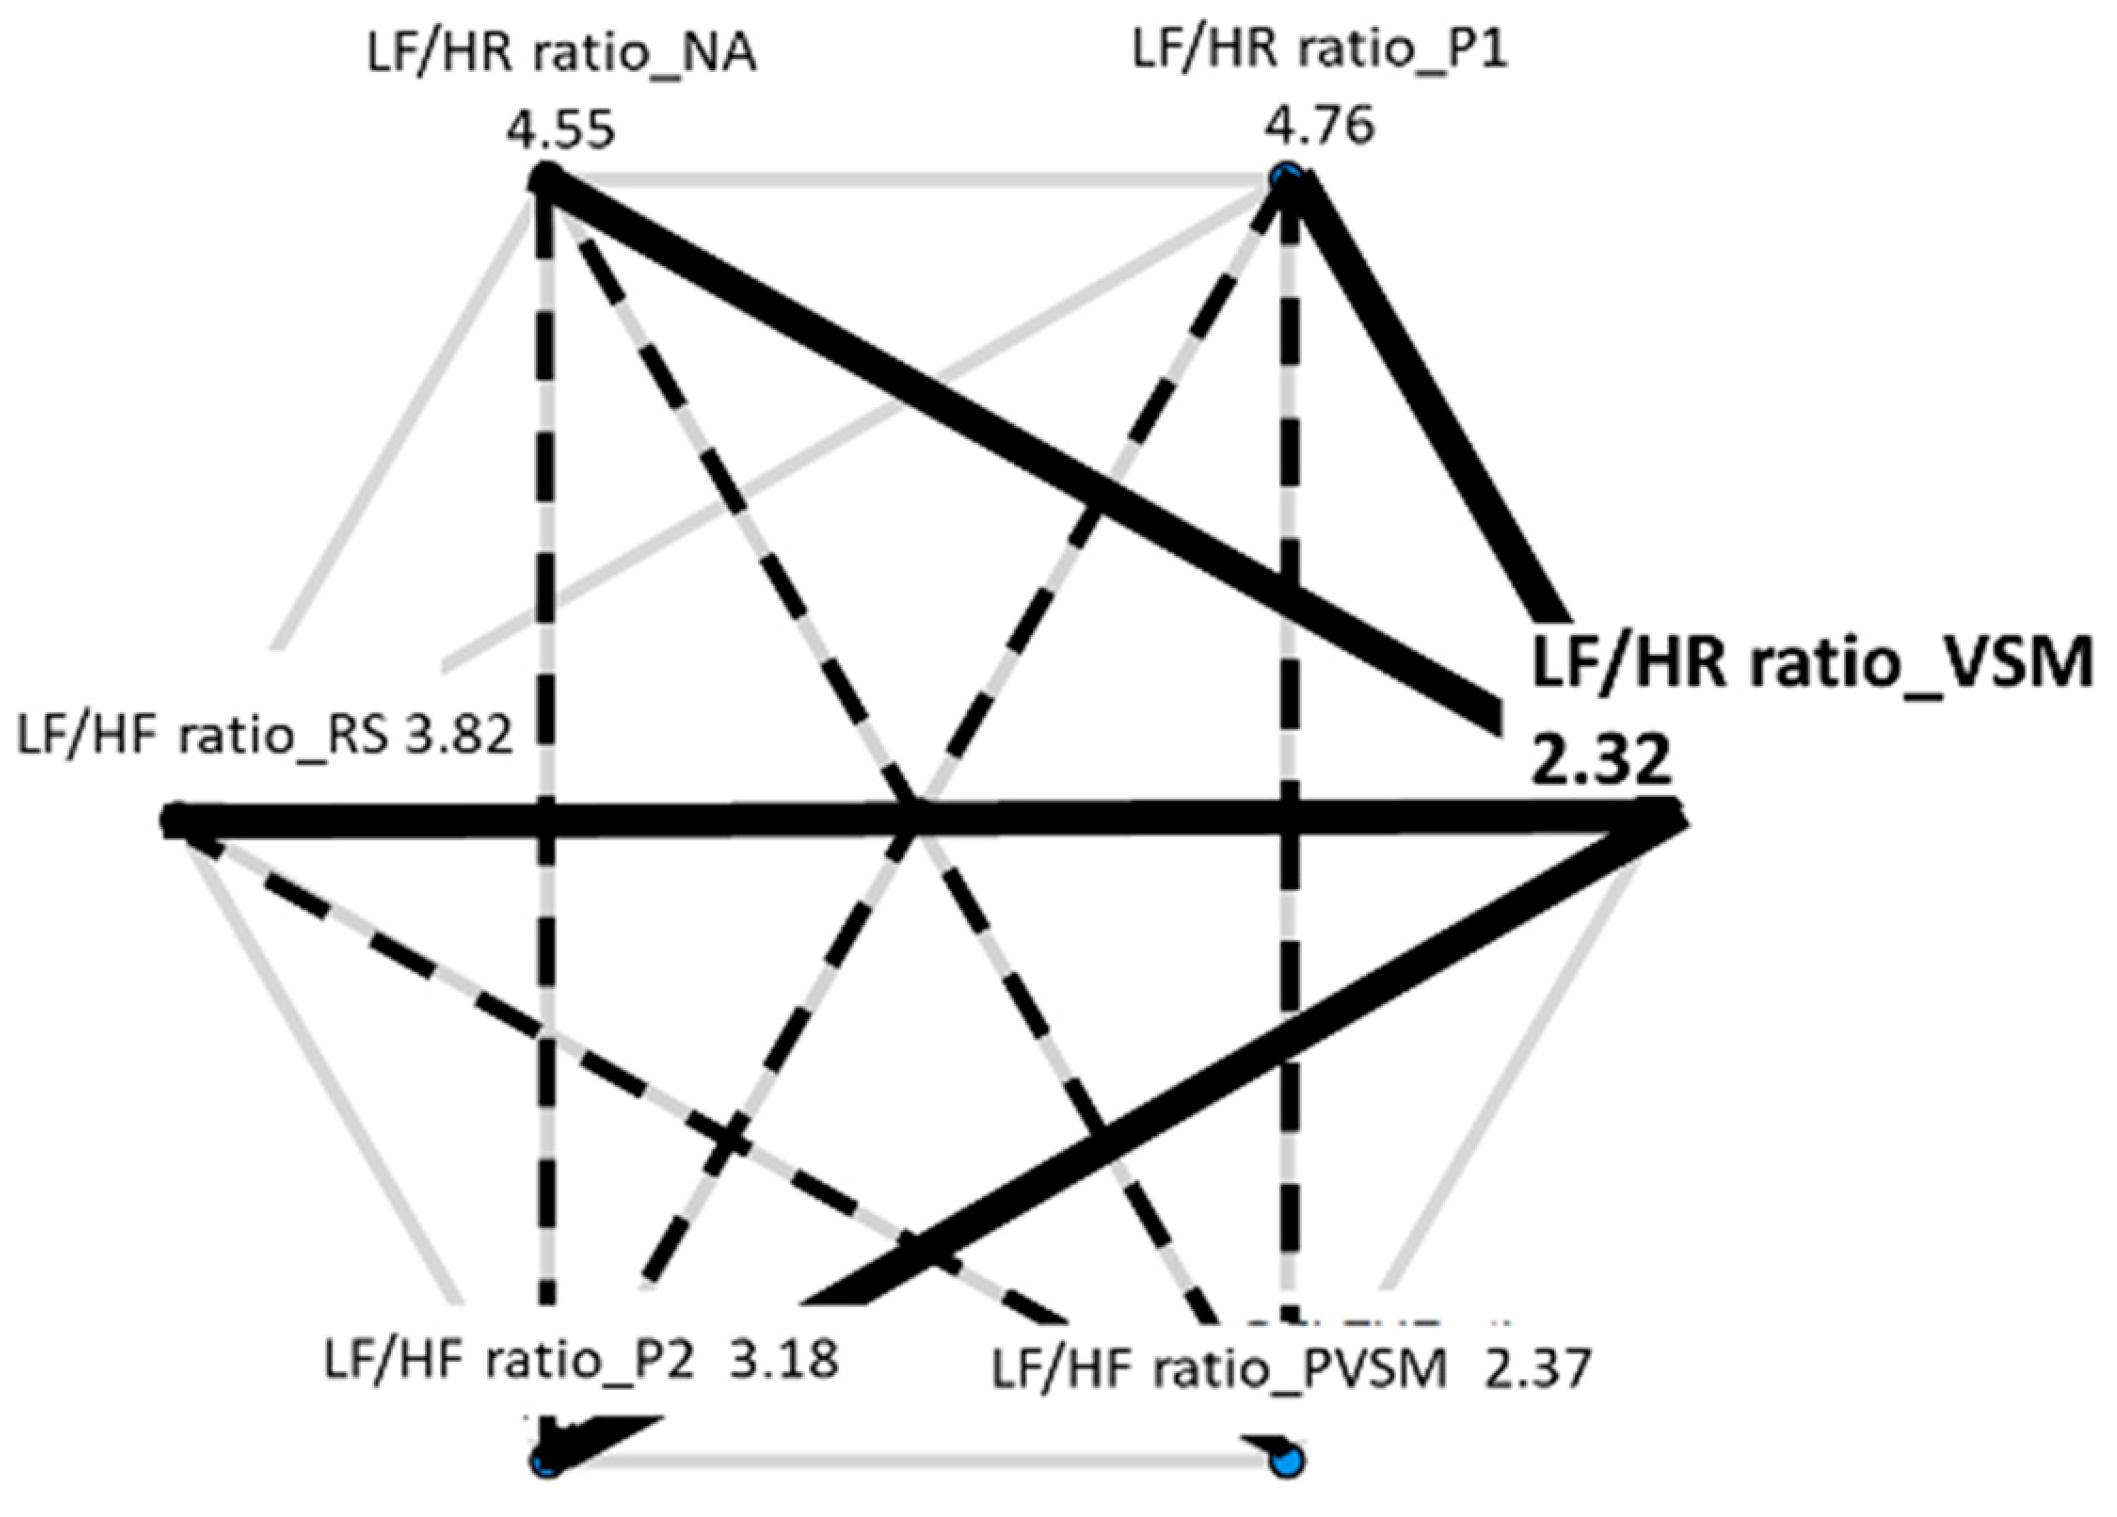
Figure 17.
Boxplot summary of SDNN results for the six stages of the study, shown in chronological order from bottom to top. The horizontal axis shows Hz values.
Figure 17.
Boxplot summary of SDNN results for the six stages of the study, shown in chronological order from bottom to top. The horizontal axis shows Hz values.
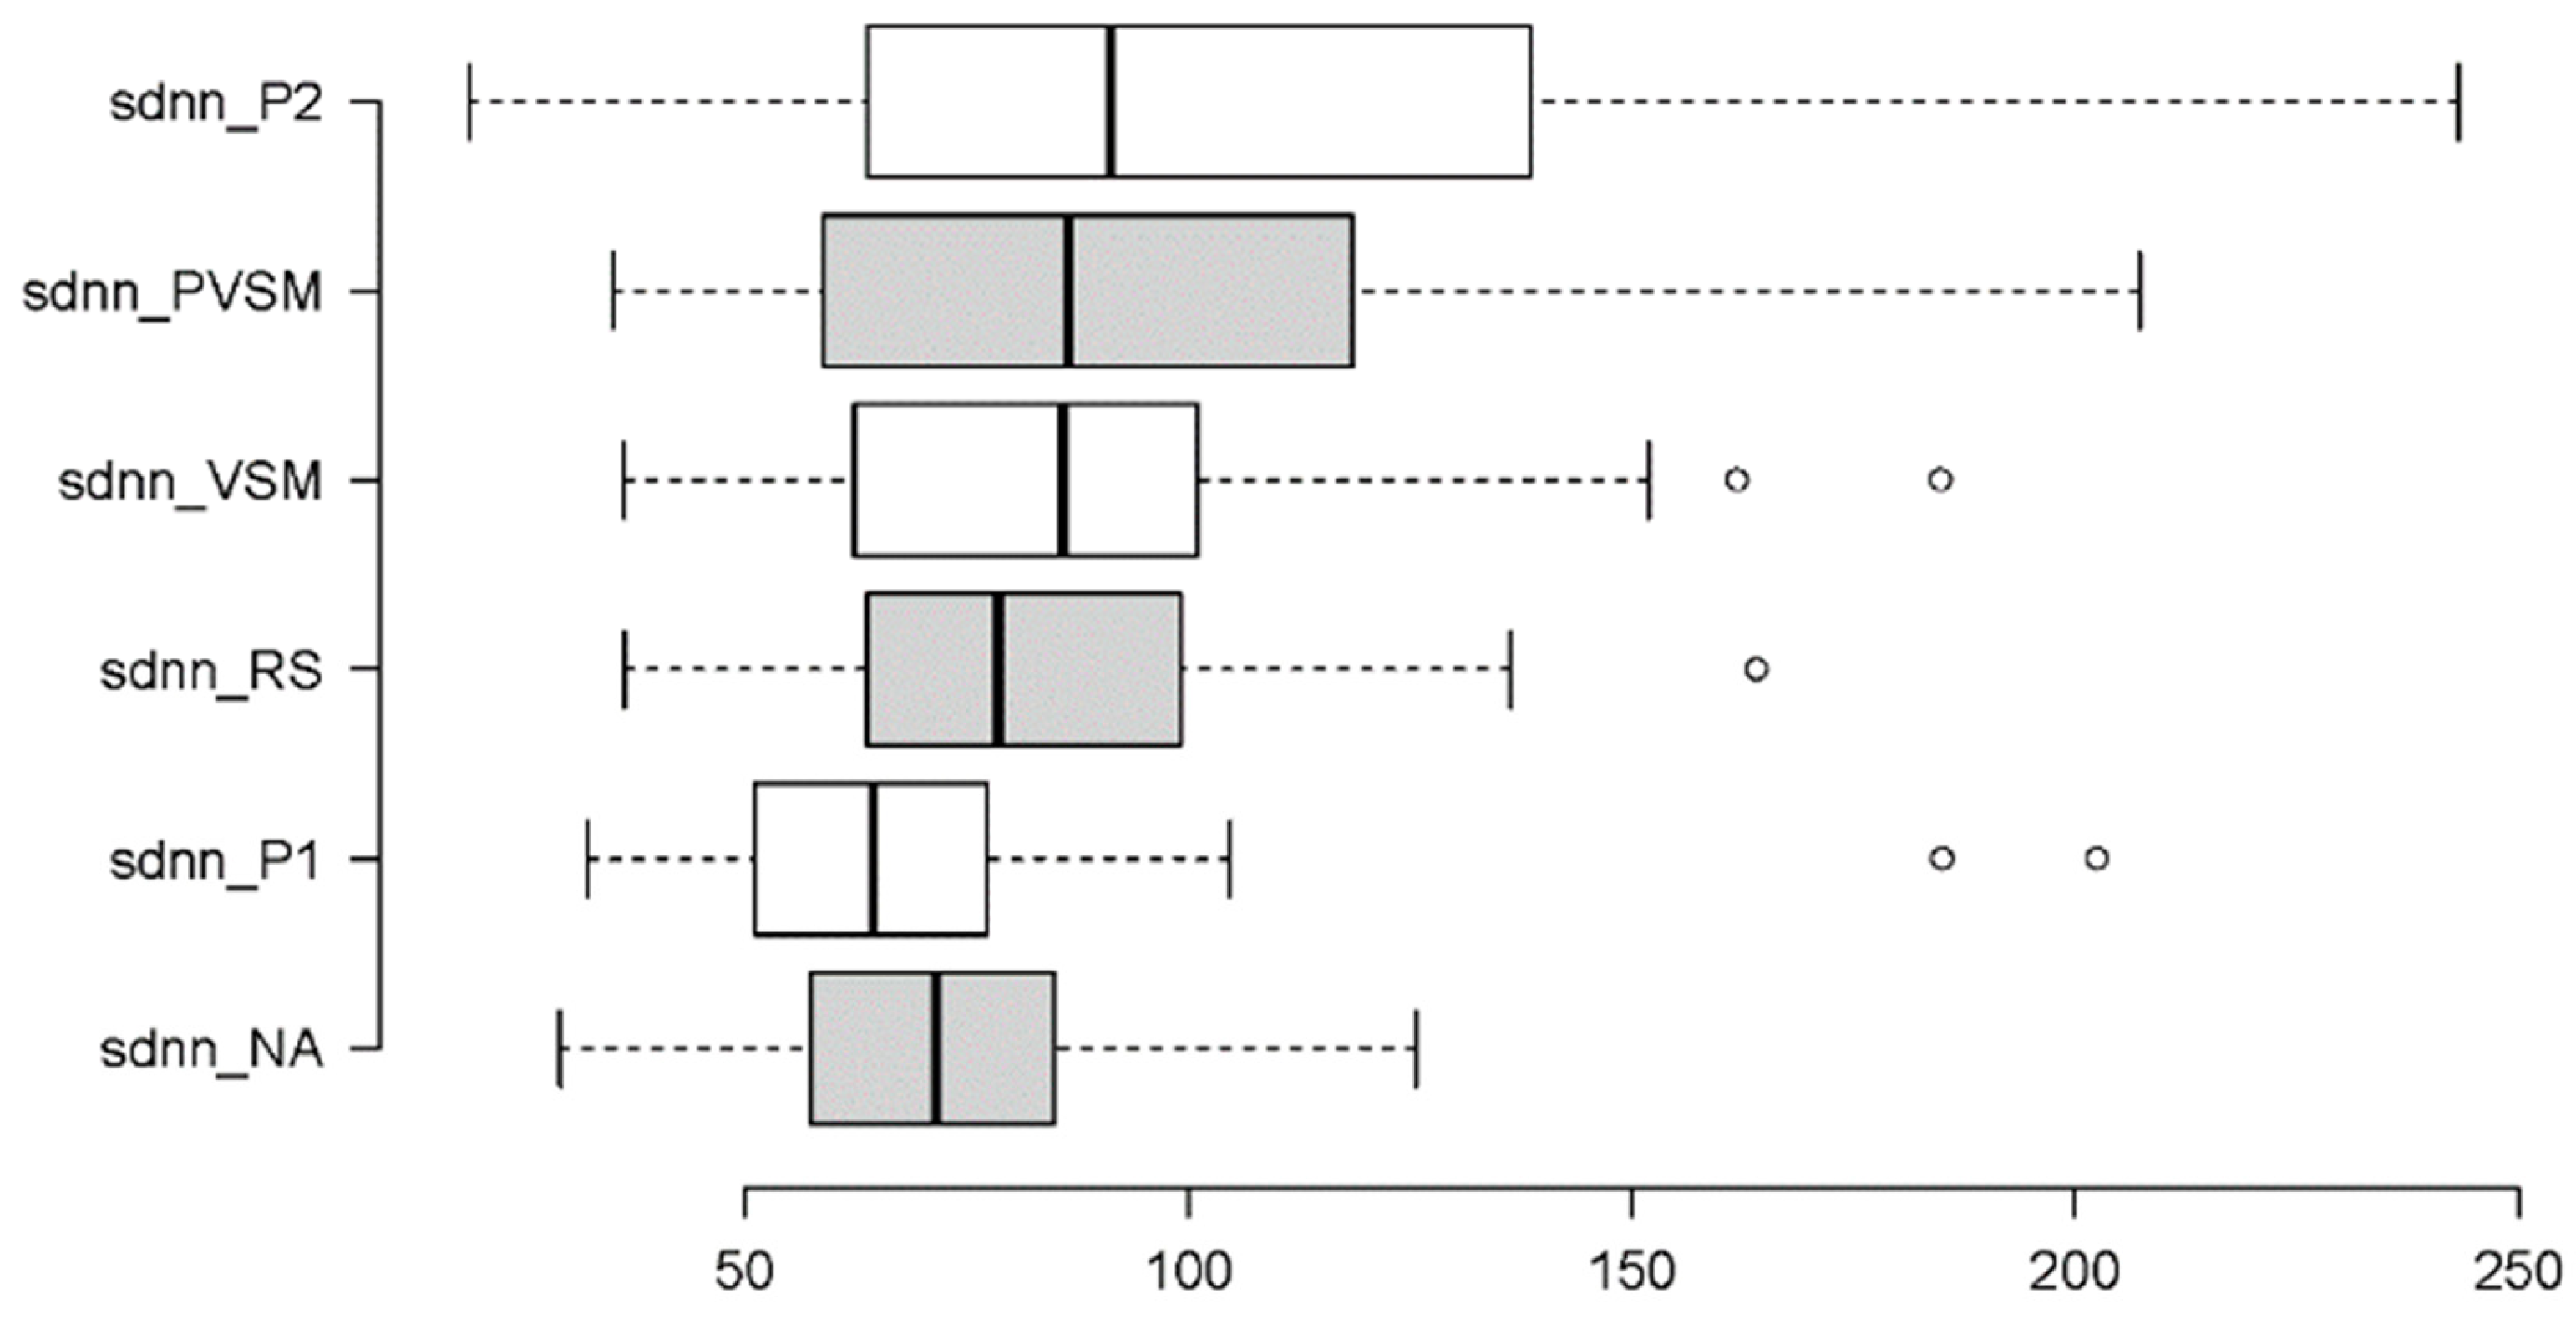
Figure 18.
Boxplot summary of LF results for the six stages of the study, shown in chronological order from bottom to top. The horizontal axis shows Hz values.
Figure 18.
Boxplot summary of LF results for the six stages of the study, shown in chronological order from bottom to top. The horizontal axis shows Hz values.
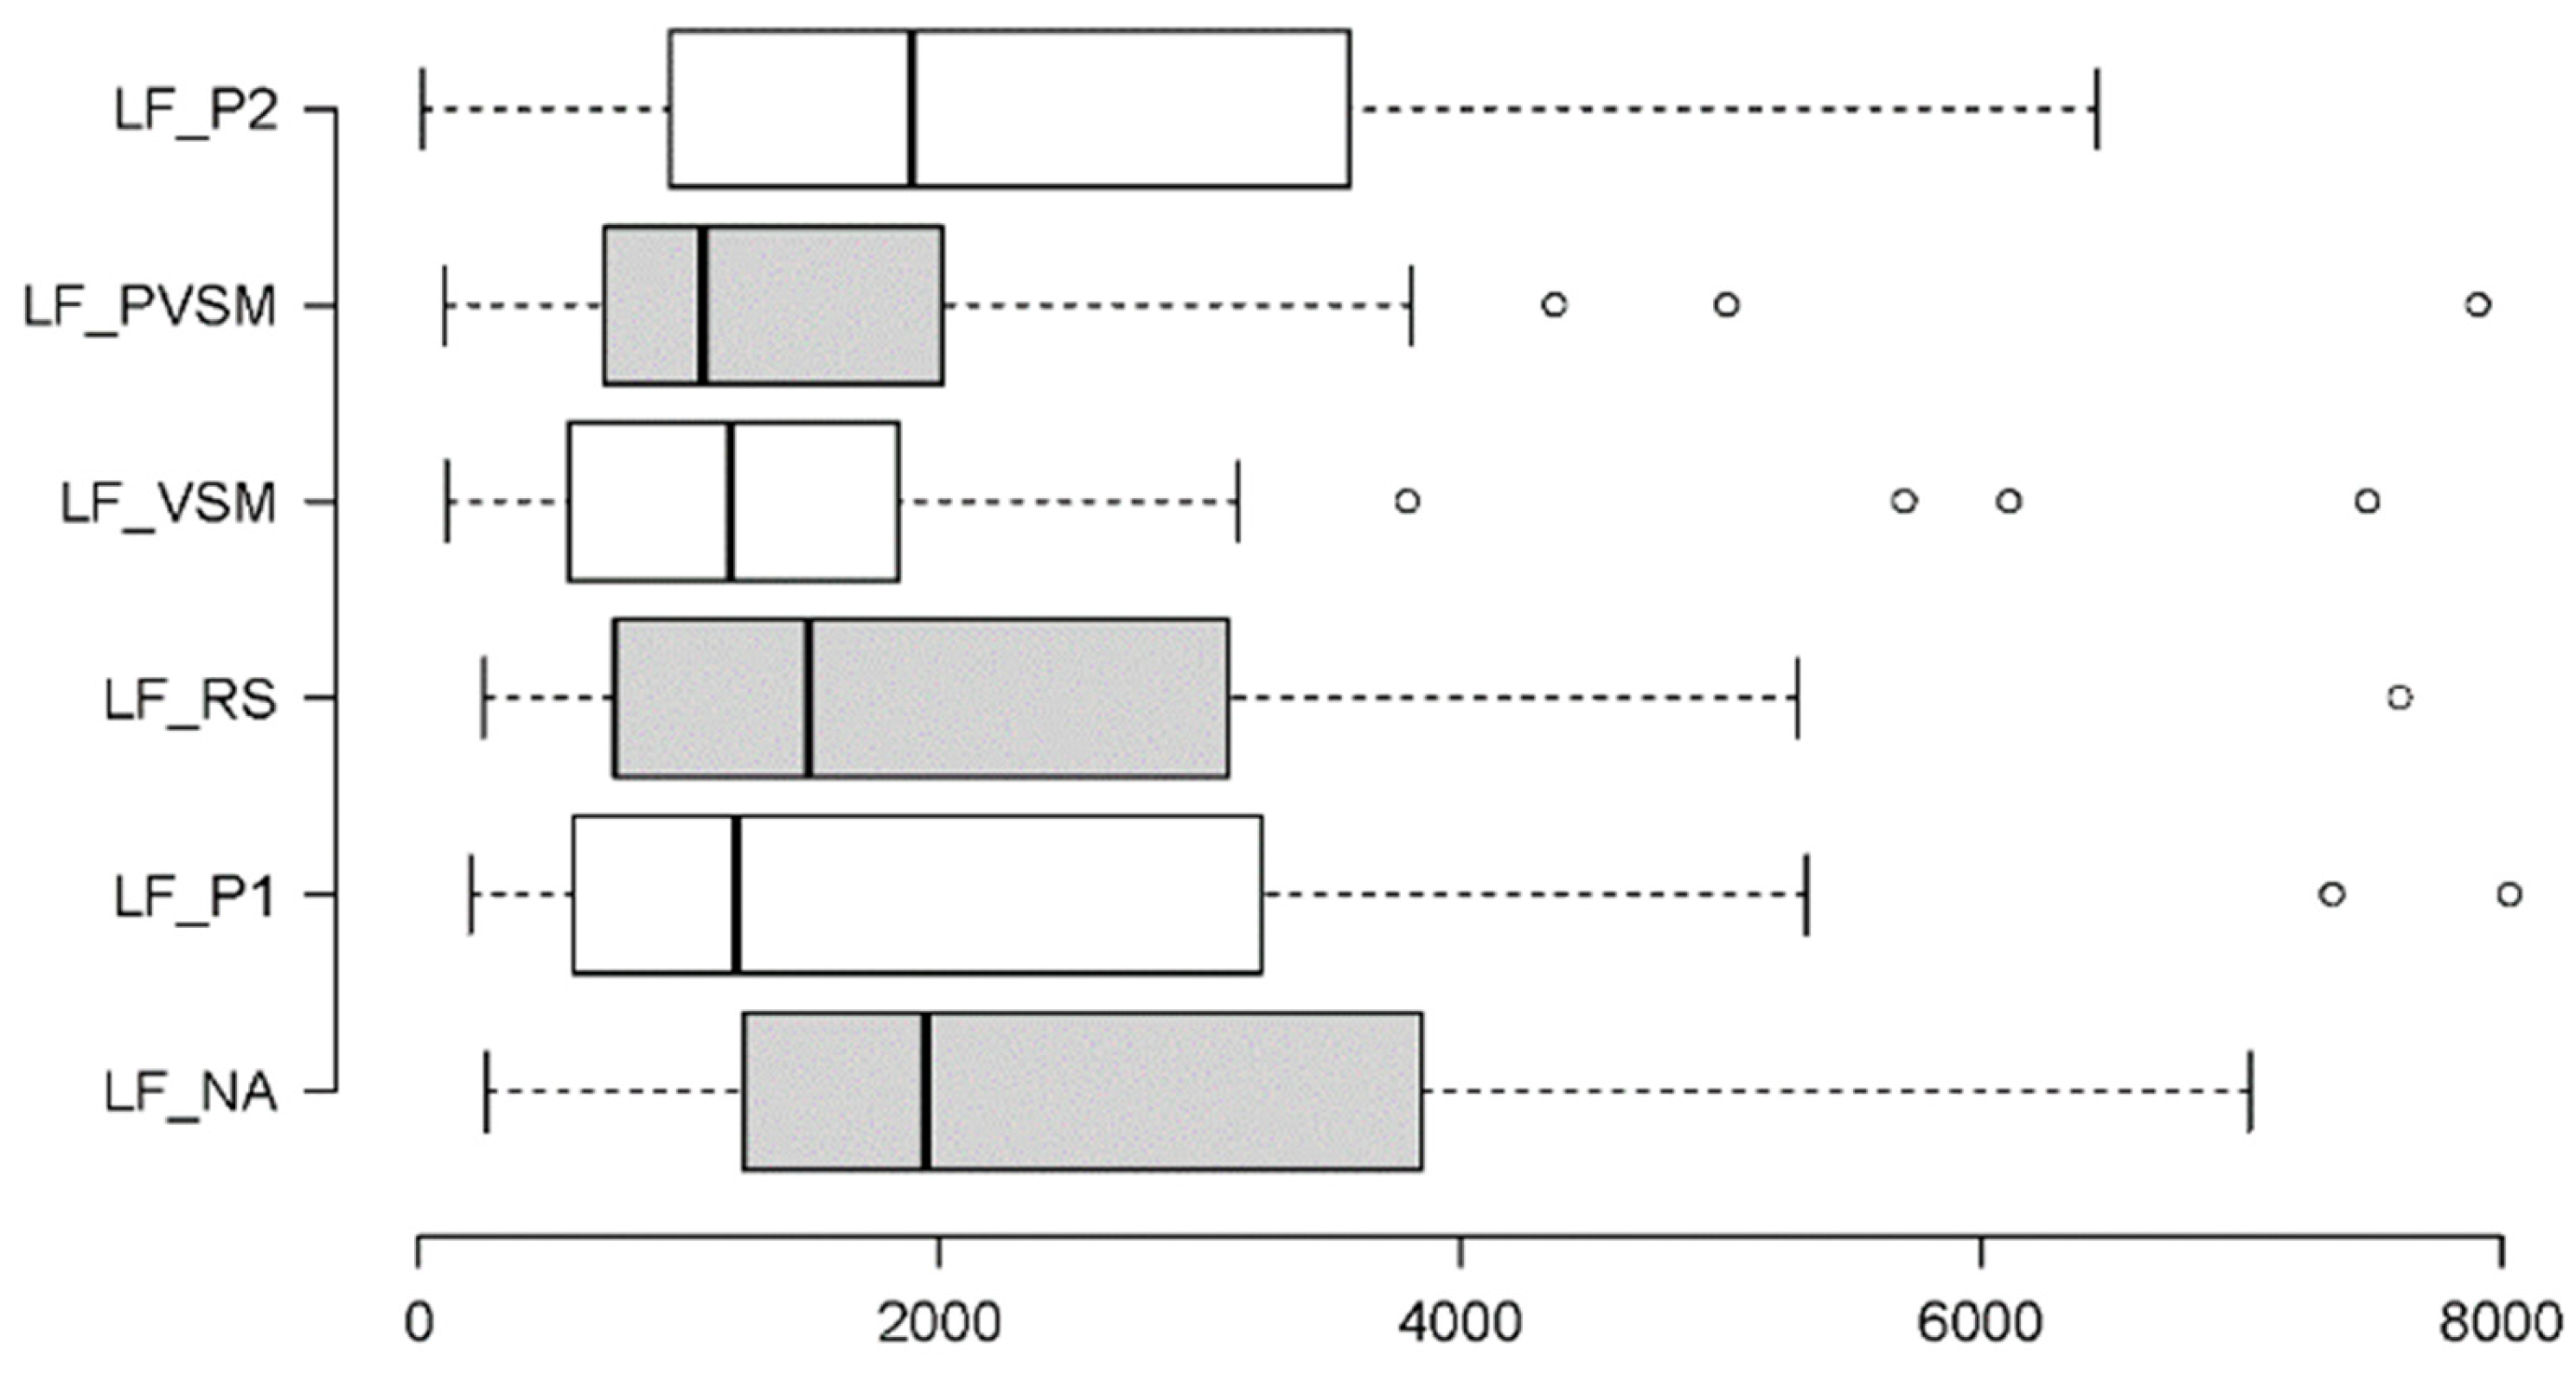
Figure 19.
Boxplot summary of RMSSD results for the six stages of the study, shown in chronological order from bottom to top. The horizontal axis shows dB values.
Figure 19.
Boxplot summary of RMSSD results for the six stages of the study, shown in chronological order from bottom to top. The horizontal axis shows dB values.
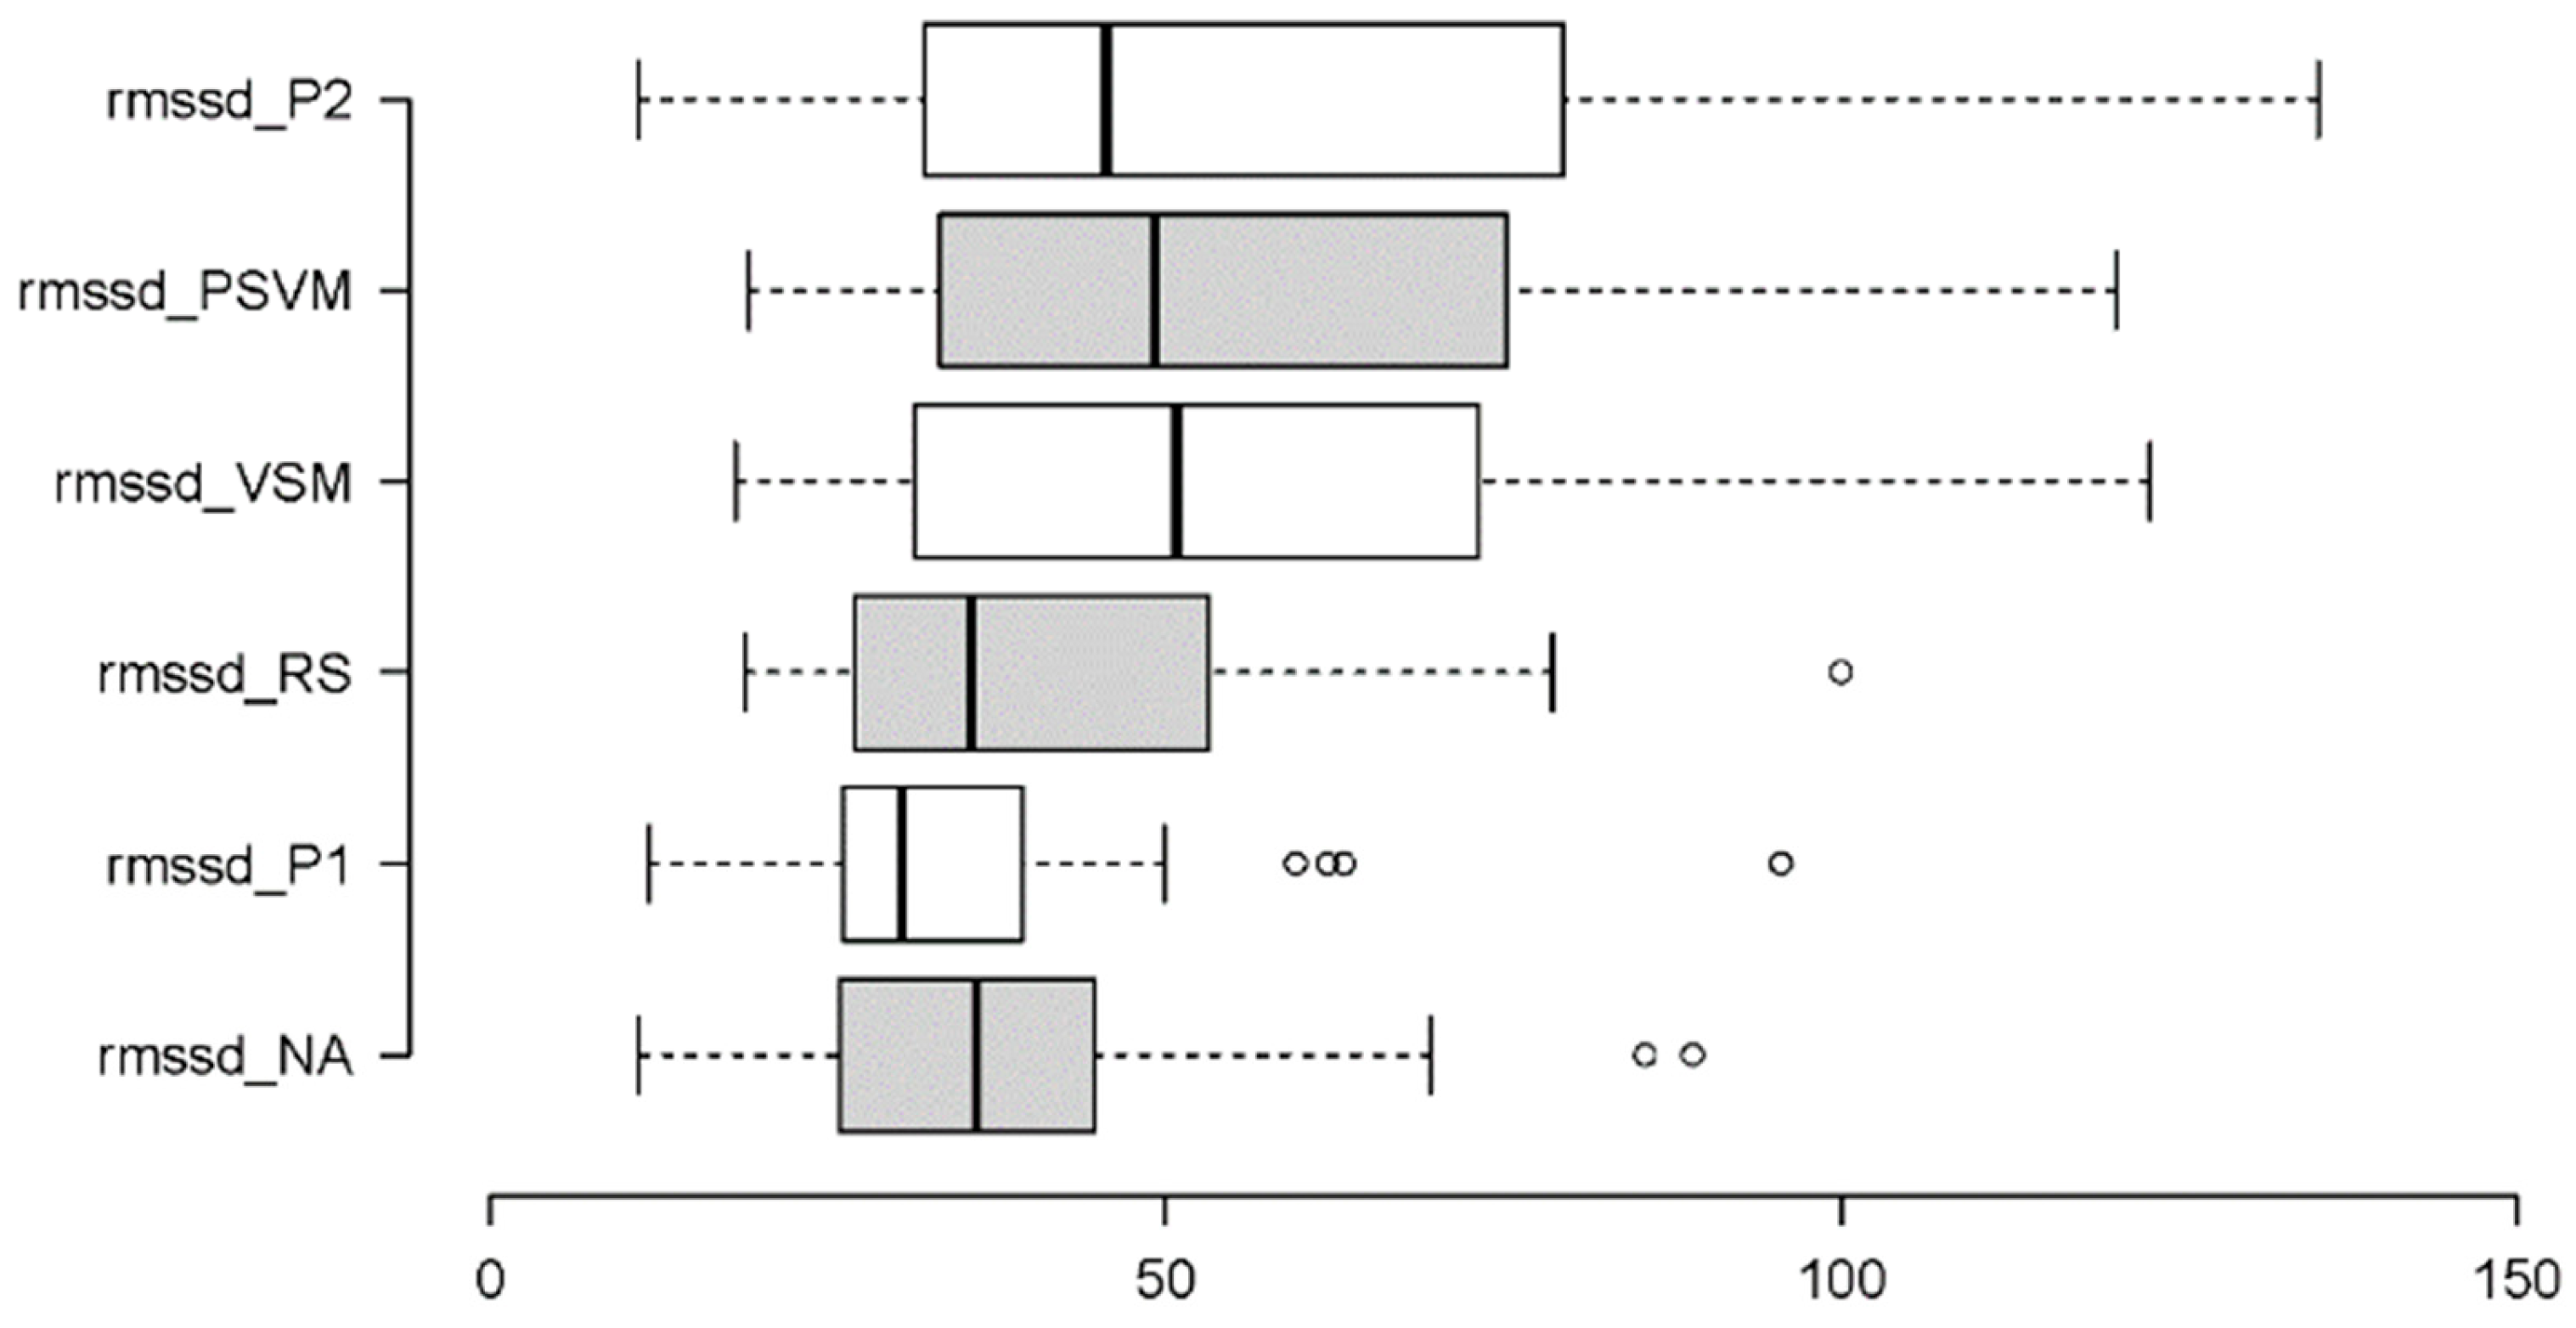
Figure 20.
Boxplot summary of HF results for the six stages of the study, shown in chronological order from bottom to top. The horizontal axis shows Hz values.
Figure 20.
Boxplot summary of HF results for the six stages of the study, shown in chronological order from bottom to top. The horizontal axis shows Hz values.
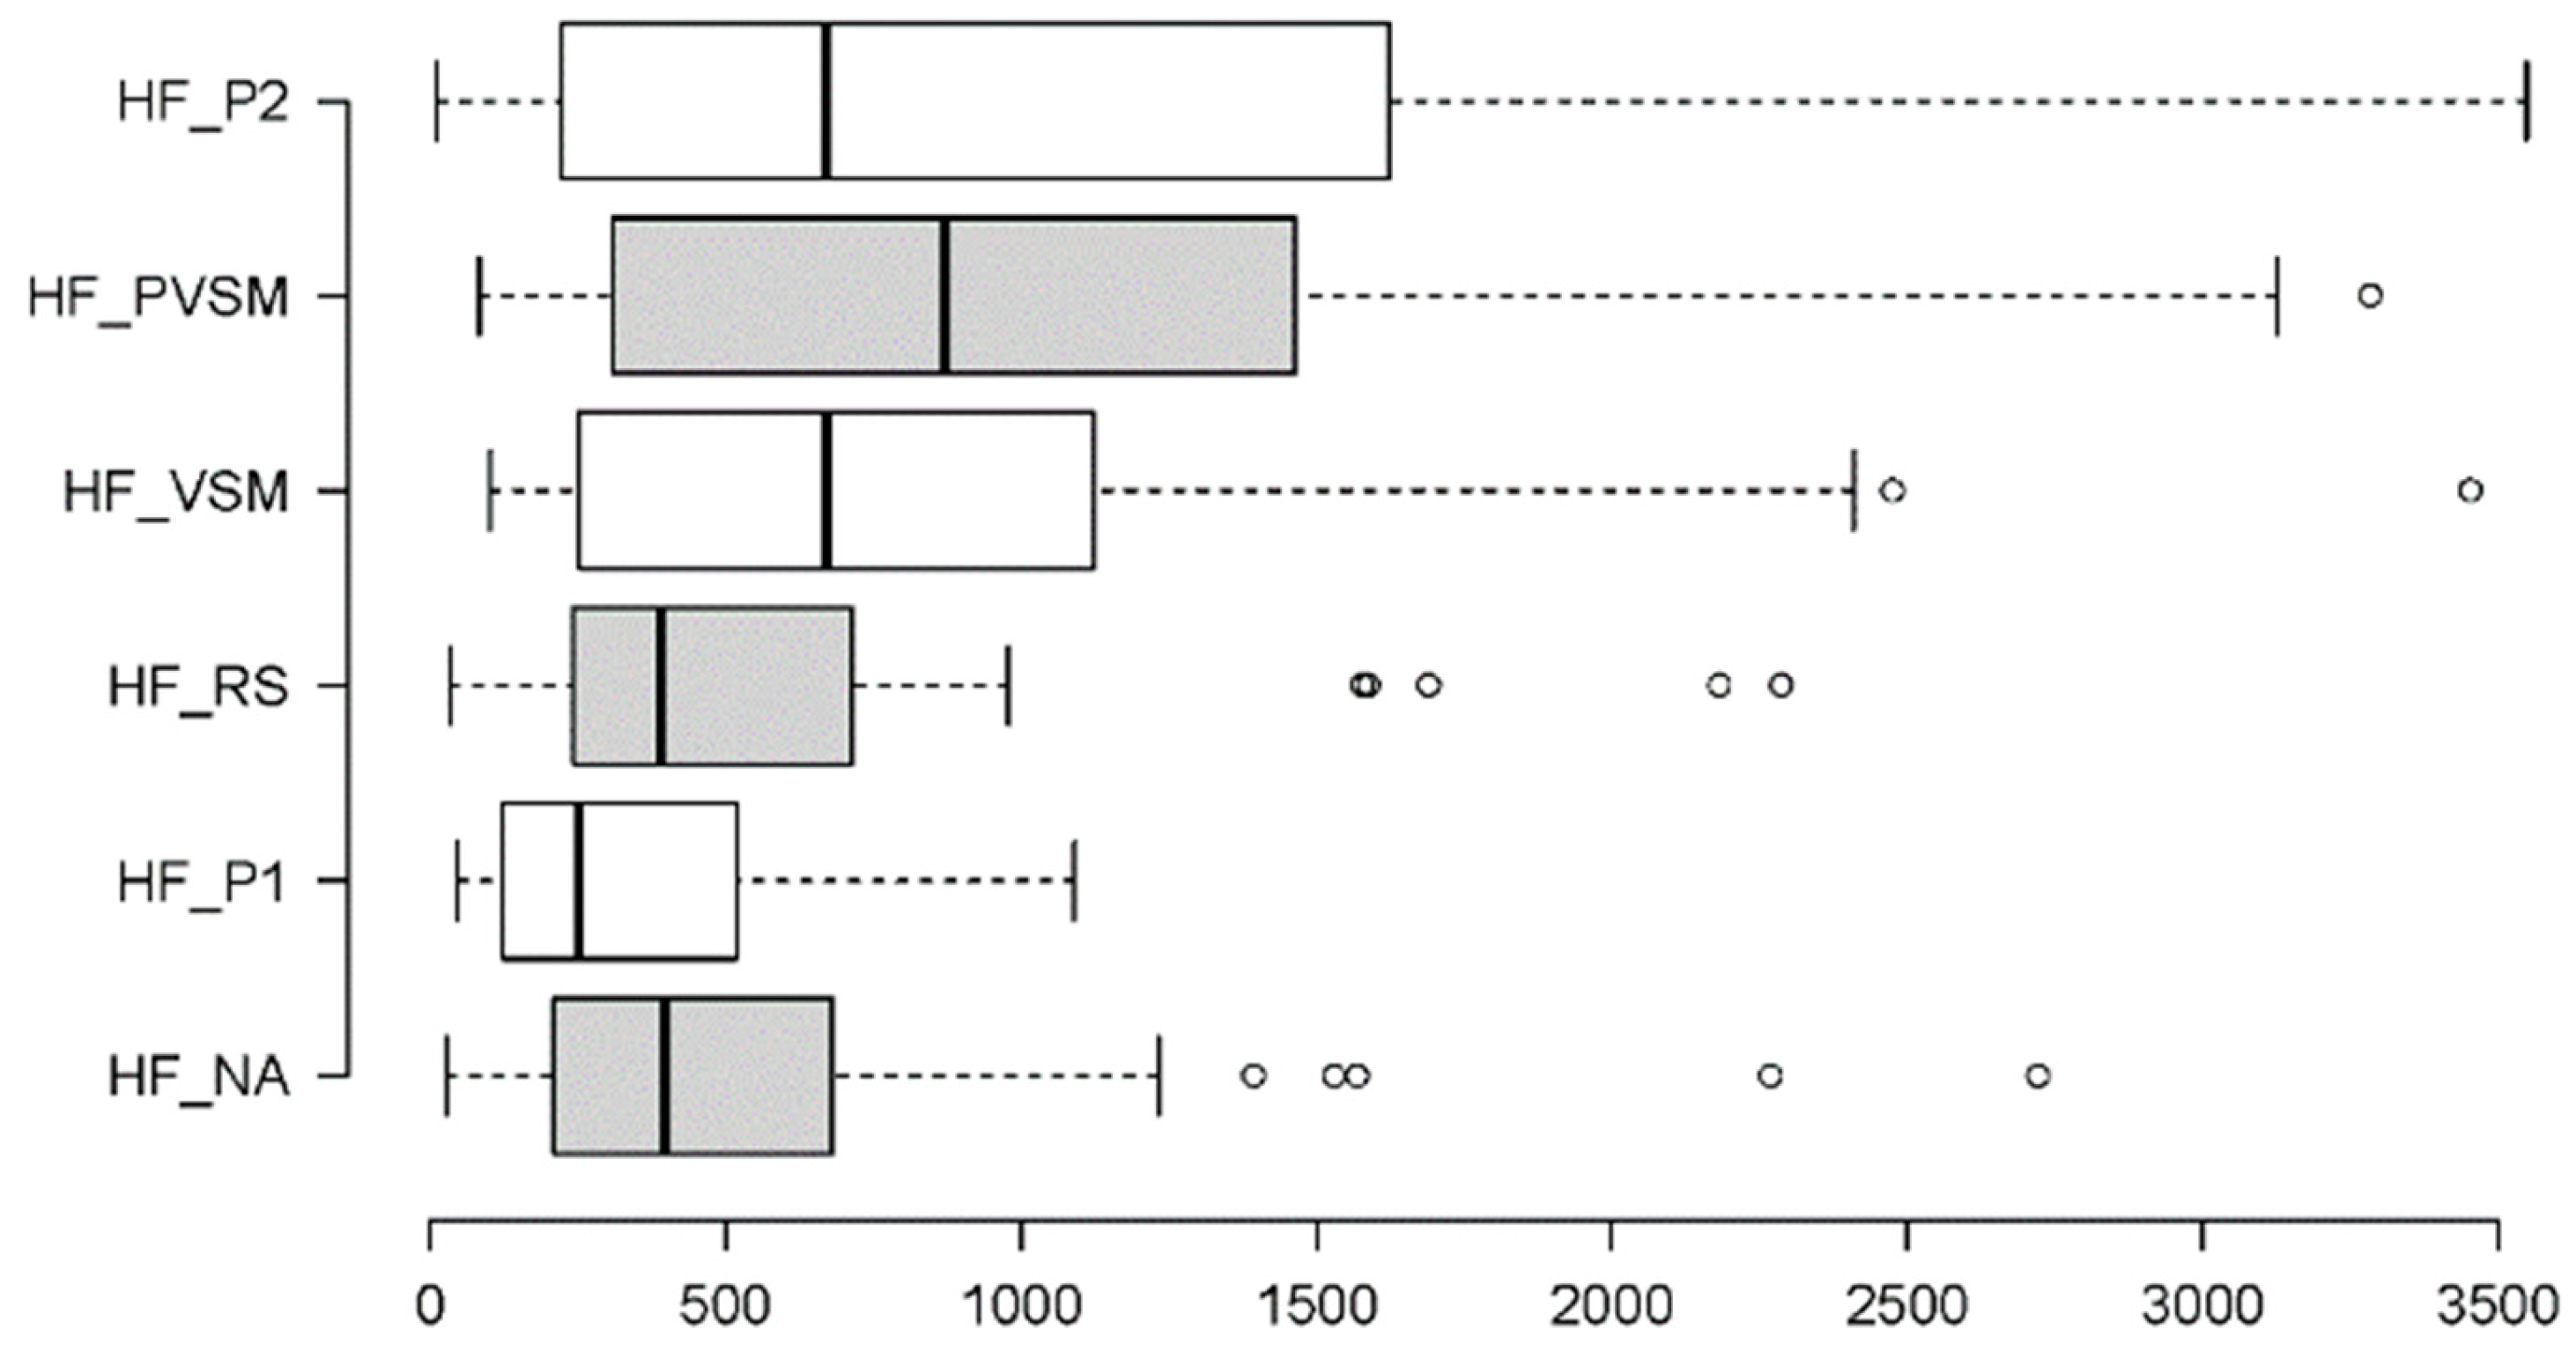
Figure 21.
Significant differences in physiological stress measures between participants with low levels (total scores <=24) and high levels (total scores >=25) of perceived psychological stress, estimated based on the PSS-10 questionnaire. SDNN (top left), LF (top right), RMSSD (bottom left), and HF (bottom right).
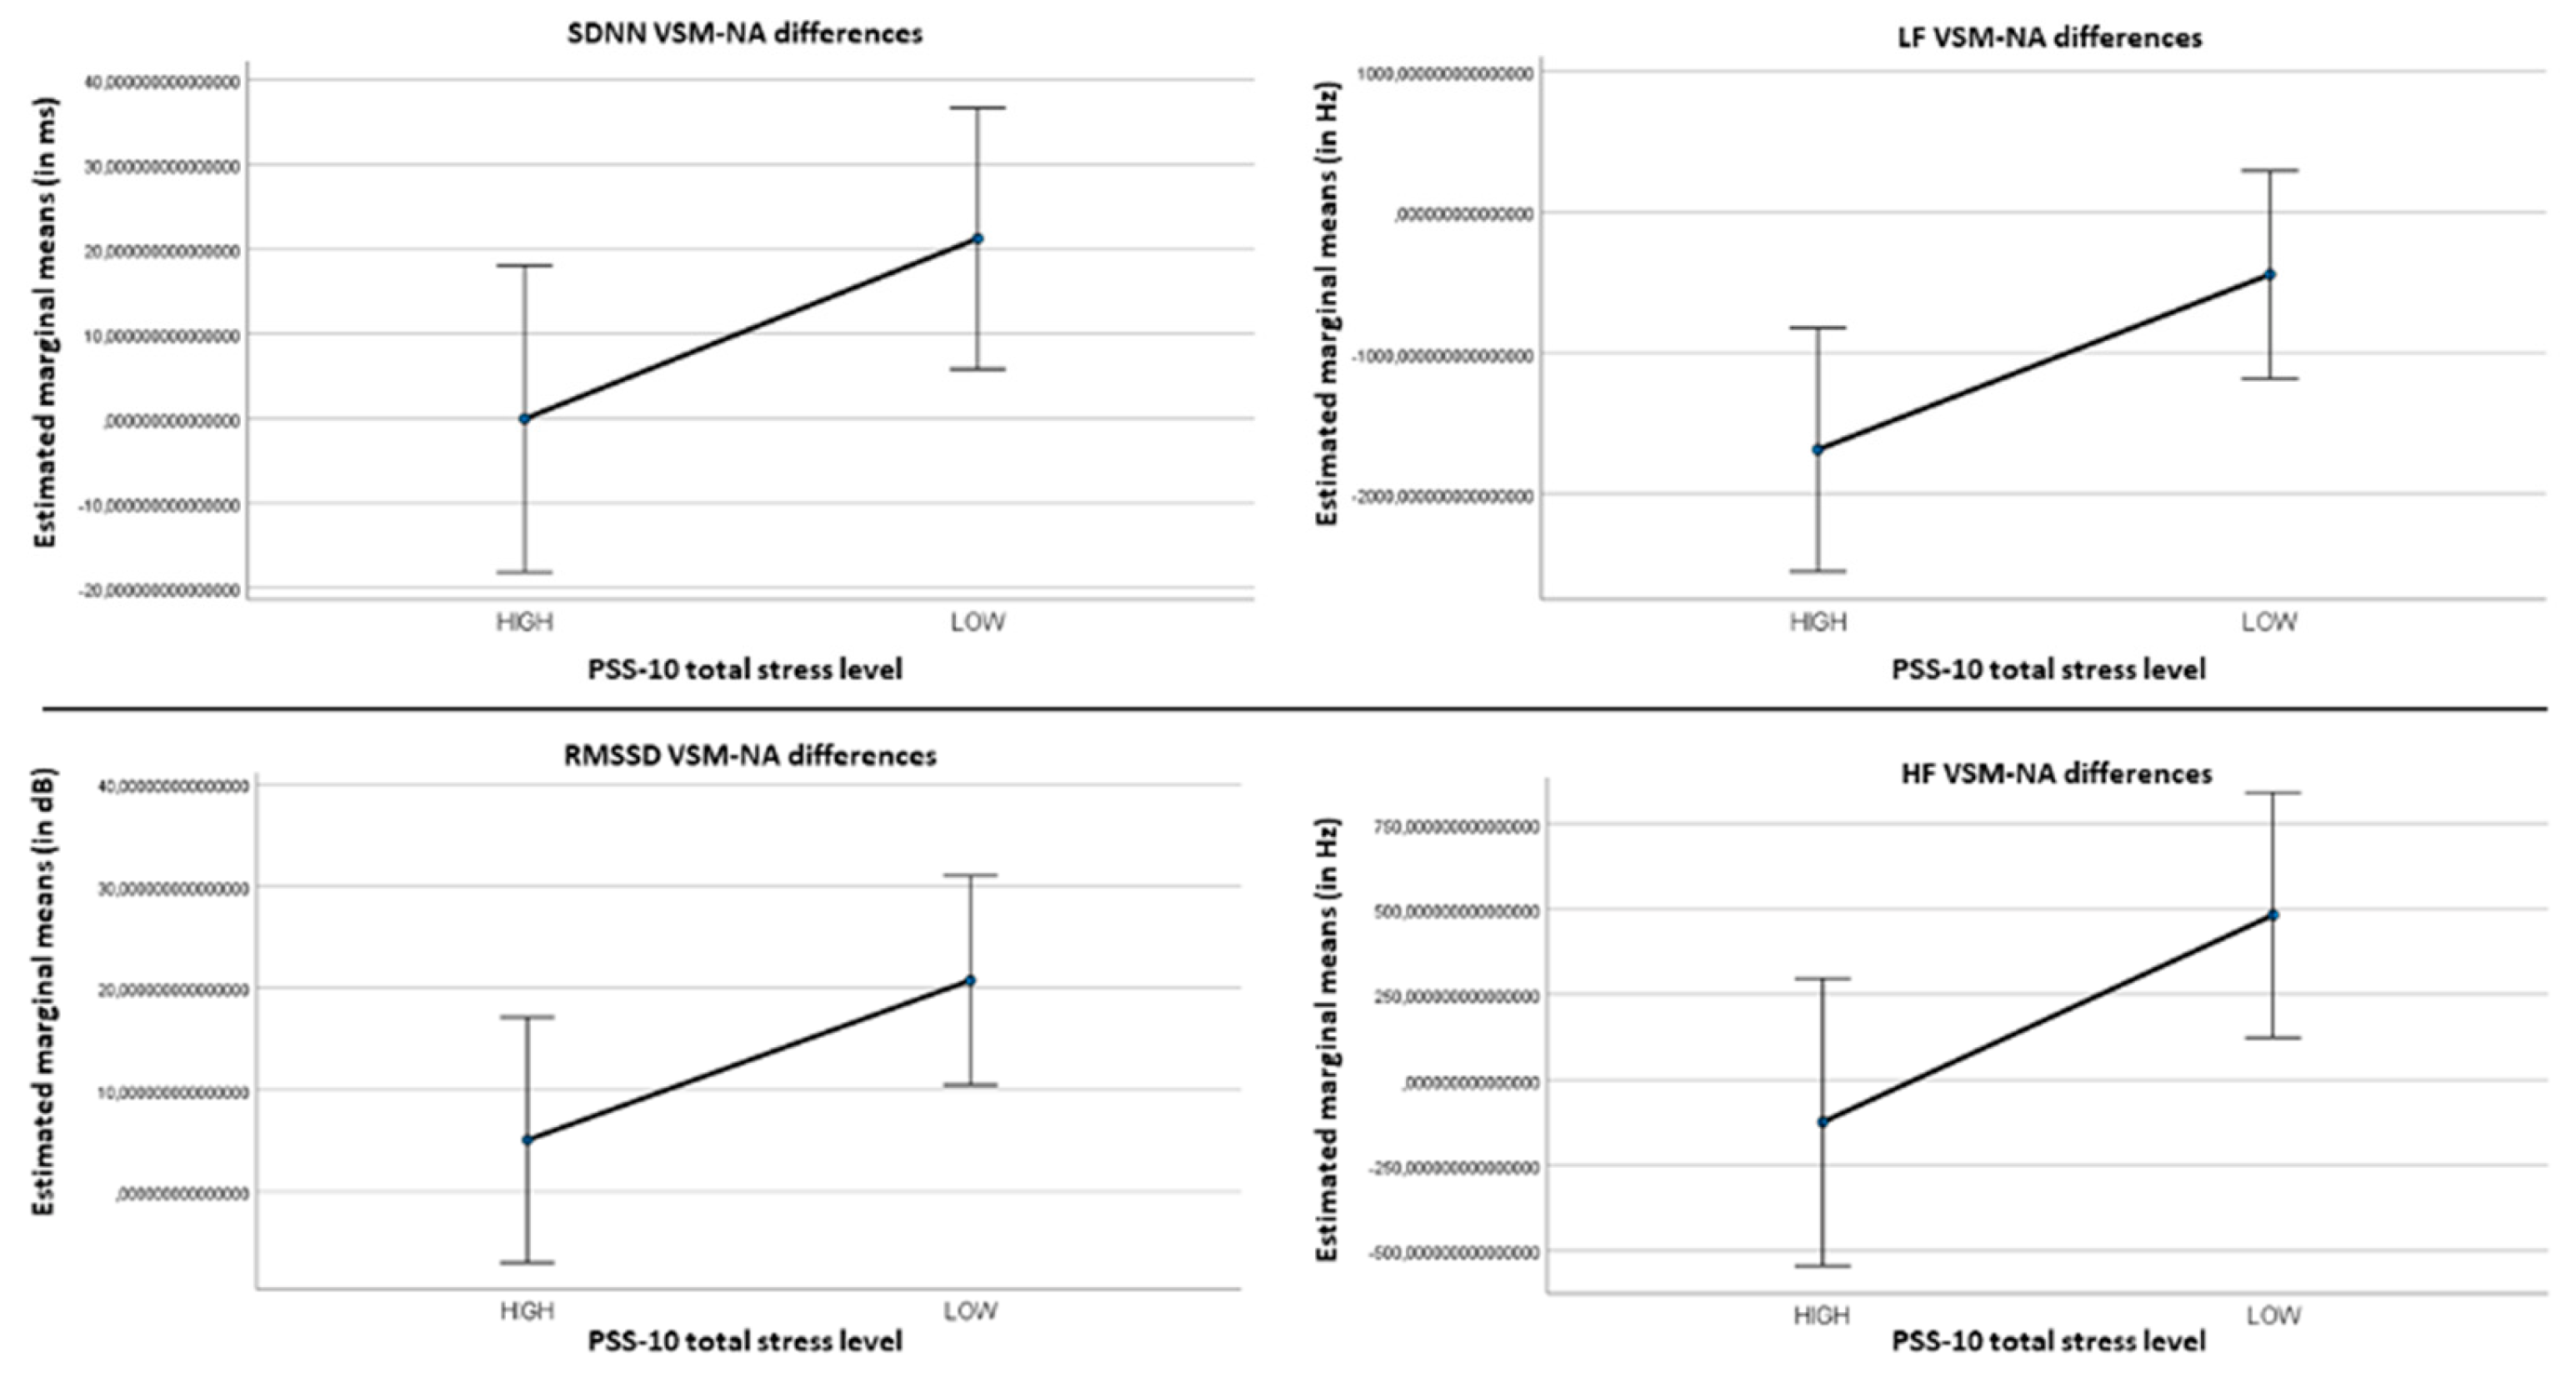

Table 1.
Study design protocol.
| Stage | Duration (minutes) | Eyes | Posture | Activity | Purpose |
|---|---|---|---|---|---|
| Stage 1 Normal Activity (NA) |
5 | Open | Sat, chair. | Study introduction. | Neutralise elevated heart rate. |
| Stage 2 Prosody 1 (P1) |
5 | Open | Sat, VSM module. | Reading speech passage. | Speech prosody analysis. (Not discussed). |
| Stage 3 Rest-State (RS) |
2 | Closed | Supine position, VSM module. |
No activity required. |
Control for basal heart rate, physiological stress and cognitive stress. |
| Stage 4 VSM Stimulation (VSM) |
45 | Closed | Supine position, VSM module. |
Vibroacoustic Sound Massage and vibrotactile soundscape. |
Independent variable. |
| Stage 5 Post-VSM (PVSM) |
5 | Closed | Supine position, VSM module. |
No activity required. | Durational measure for VSM effects. |
|
Stage 6 Prosody 2 (P2) |
5 | Open | Sat, VSM module. | Reading speech passage. | Speech prosody analysis. (Not discussed). |
Table 2.
EEG relevancy of first-person verbal accounts.
| Theta/Beta Ratio (TBR) - concentration and focus | Beta/Alpha Ratio (BAR) - arousal and relaxation | Frontal/Alpha Asymmetry (FAA) - well-being |
|---|---|---|
| “I craved rhythm, interesting how rhythm doesn’t come through aurally, but physically through vibrations, body craves it, then gets it” | “Not awake but not sleeping, in-between” | “Cathartic” |
| “Could really match my breath work” | “Hyperactive in my head, rested in my body” | “Really relaxing” |
| “Not thinking about anything, zone into how much my bodies feeling” | “Disconnected from my body” | “Extremely empowering” |
| “Zoning into sounds themselves” | ”Felt like flying translated into your body” | “Very pleasant” |
| “Sometimes my thoughts were somewhere else, going in and out of zones” | “After the vibrations it feels numb in a good way, you can’t feel the borders of your body” | “Felt familiar, reminded me of home” |
| “Mind wondering but still aware of a lot of things” | ” It felt liberating” | “I feel super calm and open” |
| “Pulled down again by thought” | ”Complete serenity” | “Clear mind-body connection” |
| “Distracted me from (ADHD) medication, thinking ‘what is happening with my body?’” | “Body felt super relaxed and calm” | “100% enjoyable” |
| “There were phases when I was really relaxed, couldn’t think about anything, then all of a sudden really aware” | “Feeling of wanting to transcend, feeling my whole - a unity between my mind and body” | “My tension and stress feels released” |
| “Once in a while came back to focusing on what’s going on, the music, vibrations” | “Takes away the racing mind” | “Sounds were very calming, especially the birds” |
| “Totally immersive” | “Feel like you’re floating” | “Nice waves sounds, all ambient relaxing sounds” |
| “Felt super creative” | “No idea what kind of state I was in” | “Felt like a weighted blanket - safe and comfortable” |
| “Saw shapes, forms and colours that followed the vibrations in music” | “Vibrations going through the body” | “The vibration resonated with my body deeply” |
| “I saw colours that made sense with the sounds” | “The stronger the vibration the more relaxed I was, I couldn’t think” | “Feel physically something in my body taken out of me - I feel very light” |
| “Don’t know where my head went, felt I was tripping” | “The more vibration, the less aware I was” | “A yummy space - feels like a good place - like you’re being mothered somehow” |
| “Felt like a psychedelic trip” | “Lost track of time” | “Felt like being in my mother’s womb - very safe” |
| “I felt medicated or drugged in some way” | “Seeing the sound waves going through my body in dancing waves” | “Delightful - reminded me of being a child” |
| “Blurred lines between otherness and myself” | ||
| “Felt I was letting go of thoughts, allowing the experience and sound to come over me lead to deep relaxation” | ||
| “Stimulated - really relaxing but intense at the same time” |
Table 3.
Test statistics (left) and multiple-comparisons tests (right) for the two dependent variables SDNN (top) and LF (bottom).
Table 3.
Test statistics (left) and multiple-comparisons tests (right) for the two dependent variables SDNN (top) and LF (bottom).
| Main effect of |
Test statistics |
p | Effect size | Sig. multiple comp. tests |
Test statistics |
p | Effect size |
|---|---|---|---|---|---|---|---|
| SDNN | F[5,160] = 7.267 | < 0.001 | ηp² = 0.164 | VSM vs. NA | t[37] = 2.062 | 0.046 | d = 36.78 |
| VSM vs. P1 | t[37] = 2.075 | 0.046 | d = 42.04 | ||||
| VSM vs. P2 | t[37] = -2.266 | 0.030 | d = 51.84 | ||||
| NA vs. PVSM | t[37] = 3.746 | 0.001 | d = 8.26 | ||||
| NA vs. P2 | t[37] = 3.463 | 0.001 | d = 7.81 | ||||
| P1 vs. RS | t[37] = 1.987 | 0.050 | d = 7.50 | ||||
| P1 vs. PVSM | t[37] = 4.459 | < 0.001 | d = 7.09 | ||||
| P1 vs. P2 | t[37] = 3.855 | < 0.001 | d = 7.18 | ||||
| RS vs. P2 | t[37] = 2.777 | 0.009 | d = 4.61 | ||||
| LF | χ²[5] = 21.038 | < 0.001 | W = 0.11 | VSM vs. NA | W = 4.108 | < 0.001 | r = 0.67 |
| VSM vs. P1 | W = 2.269 | 0.023 | r = 0.39 | ||||
| VSM vs. RS | W = 2.453 | 0.014 | r = 0.40 | ||||
| VSM vs. P2 | W = -3.004 | 0.003 | r = 0.49 | ||||
| PVSM vs. NA | W = 3.066 | 0.002 | r = 0.50 | ||||
| PVSM vs. P2 | W = -1.962 | 0.050 | r = 0.32 | ||||
Table 4.
Test statistics (left) and multiple-comparisons tests (right) for the two dependent variables RMSSD (top) and HF (bottom).
Table 4.
Test statistics (left) and multiple-comparisons tests (right) for the two dependent variables RMSSD (top) and HF (bottom).
| Main effect of | Test statistics |
p | Effect size | Sig. multiple comp. tests |
Test statistics |
p | Effect size |
|---|---|---|---|---|---|---|---|
| RMSSD | χ²[5] = 44.180 | < 0.001 | W = 0.24 | VSM vs. NA | W = 3.250 | < 0.001 | r = 0.53 |
| VSM vs. P1 | W = 3.740 | 0.023 | r = 0.61 | ||||
| VSM vs. RS | W = 2.453 | 0.014 | r = 0.40 | ||||
| NA vs. PVSM | W = 4.108 | < 0.001 | r = 0.67 | ||||
| NA vs. P2 | W = 4.599 | < 0.001 | r = 0.67 | ||||
| P1 vs. PVSM | W = 4.599 | < 0.001 | r = 0.75 | ||||
| P1 vs. P2 | W = 4.108 | < 0.001 | r = 0.75 | ||||
| RS vs. PVSM | W = -3.311 | < 0.001 | r = 0.54 | ||||
| RS vs. P2 | W = -3.311 | < 0.001 | r = 0.54 | ||||
| HF | χ²[5] = 37.263 | < 0.001 | W = 0.20 | VSM vs. P1 | W = 3.740 | < 0.001 | r = 0.61 |
| VSM vs. RS | W = 2.207 | 0.027 | r = 0.36 | ||||
| NA vs. PVSM | W = -2.942 | 0.003 | r = 0.48 | ||||
| NA vs. P2 | W = -2.820 | 0.005 | r = 0.46 | ||||
| P1 vs. PVSM | W = -4.660 | < 0.001 | r = 0.76 | ||||
| P1 vs. P2 | W = -4.782 | < 0.001 | r = 0.78 | ||||
| RS vs. PVSM | W = -3.250 | 0.002 | r = 0.53 | ||||
| RS vs. P2 | W = -3.127 | 0.001 | r = 0.51 | ||||
Table 5.
Results of the non-parametric correlations between the measures (dependent variables) of the experiment and the VSM-NA difference values of the 38 participants.
Table 5.
Results of the non-parametric correlations between the measures (dependent variables) of the experiment and the VSM-NA difference values of the 38 participants.
| Measure | TBR | BAR | FAA | HR mean | HRV mean | LF/HF ratio | SDNN | LF | RMSSD | HF |
|---|---|---|---|---|---|---|---|---|---|---|
| Rho [36] | 0.02 | 0.13 | -0.19 | 0.07 | -0.04 | -0.07 | -0.34* | -0.32* | -0.17 | -0.20 |
| p | 0.89 | 0.44 | 0.24 | 0.65 | 0.79 | 0.66 | 0.03 | 0.05 | 0.31 | 0.23 |
Disclaimer/Publisher’s Note: The statements, opinions and data contained in all publications are solely those of the individual author(s) and contributor(s) and not of MDPI and/or the editor(s). MDPI and/or the editor(s) disclaim responsibility for any injury to people or property resulting from any ideas, methods, instructions or products referred to in the content. |
© 2024 by the authors. Licensee MDPI, Basel, Switzerland. This article is an open access article distributed under the terms and conditions of the Creative Commons Attribution (CC BY) license (http://creativecommons.org/licenses/by/4.0/).
Copyright: This open access article is published under a Creative Commons CC BY 4.0 license, which permit the free download, distribution, and reuse, provided that the author and preprint are cited in any reuse.


