Submitted:
01 June 2024
Posted:
03 June 2024
You are already at the latest version
Abstract
The aim of this manuscript is to synthesize and characterize novel silylated Sm3+ and Eu3+ complexes and incorporate them into mesoporous silica nanoparticles (MSNs) and dense silica nanoparticles (DSNs). Sm3+ and Eu3+ ion complexes were chosen for their strong UV-visible emission, deep-red luminescence, and effective interaction with bidentate organic ligands, such as 2-thenoyltrifluoroacetone (tta) and 1,10-phenanthroline (phen). Silylated ligands were employed as coupling agents to form covalent bonds between the complexes and an oxide matrix via a conventional sol-gel process. This approach aims to enhance the thermal stability and photophysical properties of the resulting hybrid material compared to free complexes. The new silylated-bidentate ligand complexes, using tta and phen as organic ligands and 3-chloropropyltriethoxysilane as the silylating agent, were characterized by FTIR, luminescence spectroscopy, and luminescence decay. After incorporation into silica nanoparticles, the hybrid materials were characterized by SEM, TEM, DLS, zeta potential, SAXS, porosity, surface area measurements, luminescence spectroscopy, and MTT assay. The results confirm the successful synthesis of new luminescent silylated complexes with high luminescence intensity and their incorporation into silica nanoparticles.
Keywords:
hybrid materials
; mesoporous silica nanoparticles
; dense silica nanoparticles
; silylated complexes
1. Introduction
Silylated lanthanide complexes are complexes of lanthanide ions (elements in the lanthanide series, such as europium or neodymium) with organic silicon compounds called "silylating agents".[1] These complexes are important in various fields, including materials science and biochemistry. In materials science, they are used in displays and optical data storage [2], while in biochemistry they are used as probes for imaging and sensing in living systems. [3]
The specific properties of a silylated lanthanide complex depend on the lanthanide ion and the silylating agent used, silylated complexes of lanthanides can offer several advantages [4], particularly when incorporated into materials for applications such as luminescence, biolabeling, and sensing. Among these advantages it is possible to mention its chemical stability [5], versatile functionalization, enhanced luminescent properties [2], minimized non-radiative decay [6], and customizable surface chemistry.
Despite the advantages, currently, only a small number of studies have reported the synthesis, characterization, and application of silylated complexes. One of these works is the synthesis of a novel betadiketonate ligand with a trimethoxysilyl group, along with its highly luminescent Europium(III) complex, used to create luminescent silica-based hybrids with varied particle types, demonstrating high grafting ratios and potential for numerous applications as reported by Duarte et al. (2012)[5]. Another work is from Aguiar et al. (2016) [4], where three silica gel-based organic–inorganic hybrid materials functionalized with various silanes and EDTA derivatives were synthesized and used to create new luminescent lanthanide complexes, displaying efficient red and green emissions with potential applications as red and green phosphors. Also, Cousiné et al. (2012) [1] reported a series of luminescent Ru(II) complexes with monosilylated-dipyridine ligands were synthesized, fully characterized, and covalently attached to silica nanoparticles, resulting in hybrids with varying luminescence properties and sizes, depending on whether the complexes were incorporated inside the nanoparticles or grafted onto their surface.
Encapsulating complexes in a nanoparticle can provide several advantages, such as: protection of the complex from the surrounding environment, which can improve its stability and shelf-life; targeted delivery of the complex to a specific cell or tissue. [7] The silica nanoparticles can be functionalized with specific molecules or peptides that can bind to receptors on the surface of cells or tissues, allowing for targeted delivery; enhanced fluorescence intensity. [8] Encapsulating the complex in a nanoparticle can increase the fluorescence intensity, making it more sensitive for imaging applications; and, biocompatibility. [7]
It is important to note that the encapsulation process, the size and the shape of the nanoparticles, and the conditions need to be optimized to ensure the stability of the complex and the desired properties of the nanoparticles. [7,9] Also, the biocompatibility and toxicity of the final nanoparticles should be evaluated before using them in vivo. [9]
Therefore, silica nanoparticles offer several significant advantages as carriers for biolabeling, theranostics applications, and many others in healthy areas. [10,11,12] Overall, the unique properties of silica nanoparticles, including their biocompatibility, functionalizability, high loading capacity, and stability, make them highly suitable for advanced biolabeling and theranostics applications, improving the diagnosis and treatment of various diseases. [8] Additionally, nanoparticles are biocompatible and non-toxic, making them suitable for use in biological systems.
Then, the aim of this work is to synthesize new Sm3+ and Eu3+silylated complexes to contribute to silylated-lanthanide complexes and hybrids studies, and then to develop new luminescent probes for biolabeling and theranostic applications.
2. Results
2.1. Ligand Silylation and Synthesis of Silylated Sm3+ and Eu3+ Complexes
FTIR spectra, in the Figure S1, confirms the achievement of the silylated complexes. Band assignment of spectra shows that characteristic bands of ligands (tta and phen) and Si groups of silylating agent used in the reactions are present, like as 1420 cm-1 (ν C=N), 1188 cm-1 (ρ S-O-CH3), 1146 cm-1 (ν Si-O), 926 cm-1 (δ Si-O-C), and 717 cm-1 (δ CF3). [1,3,5]
Figure 1 presents the excitation and emission spectra for both Sm(tta-Si)3(phen)2 and Sm(phen-Si)3(tta)2 complexes. The luminescence of the Sm3+ ion occurs in three regions of the visible electromagnetic spectrum, 560 nm (4G5/2→6H5/2), 595 nm (4G5/2→6H7/2), and 645 nm (4G5/2→6H9/2). The emission peaks correspond to the transitions from the 4G5/2 level to different J levels, with the 6H (6HJ: J = 5/2 – 15/2) and 4F (4FJ: J = 5/2 – 11/2). The most intense transition is 4G5/2→6H9/2 (645 nm) of magnetic dipole character. [13] Here, for both Sm(tta-Si)3(phen)2 and Sm(phen-Si)3(tta)2 complexes these transitions appears slightly shifted in 565 nm (4G5/2→6H5/2), 605 nm (4G5/2→6H7/2), 648 nm (4G5/2→6H9/2), and 708 nm (4G5/2→6H11/2). The most common transitions in the excitation spectrum of the Sm3+ ions are weak, generally overshadowed by the organic ligand bands. [13] Nevertheless, here, the 6H5/2→6P5/2 (418 nm) and 6H5/2→6G7/2 (461 nm) transitions remain visible and slightly shifted in the excitation spectra.
For the three obtained silylated complexes of Eu3+, the excitation and emission spectra are presented in Figure 2. In this study, the excitation spectrum was centered at a wavelength of 613 nm, corresponding to the 5D0→7F2 transition of the Eu3+ ion. This transition, dominant and more intense compared to others in the emission spectrum, suggests a site with reduced symmetry without an inversion center. [14] Other transitions typically observed for this ion in the emission spectrum are also attributed to 5D0→7FJ (J= 0-4): 5D0→7F0 (580 nm); 5D0→7F1 (594 nm); 5D0→7F3 (650 nm); and 5D0→7F4 (701 nm). [14] These transitions correspond to the intra-energetic level 4f6 of the Eu3+ ion. [15] The dipole-magnetic transition 5D0→7F1 is known to be allowed and insensitive to the chemical environment, whereas 5D0→7F2 is forbidden and hypersensitive to the environment. When the Eu3+ ion is doped, for instance, this transition indicates high symmetry with an inversion center, whereas when it is inserted into inorganic matrices, it exhibits reduced symmetry sites. [14] If the 5D0→7F2 transition is much more intense than 5D0→7F1, then the complex will emit pure red light. [16]
The luminescence decay is a parameter crucially important because it provides information about the efficiency and dynamics of the luminescent process in lanthanide complexes. Long luminescence lifetimes are often observed in lanthanide complexes due to the forbidden nature of f-f transitions, which leads to slow radiative decay rates. Herein, the observed luminescence lifetime for the Sm3+ and Eu3+ silylated complexes synthesized (Table 1) varied between 0.070 ms (Sm3+ complexes) to > 0.50 ms (Eu3+ complexes) values.
The shape of the emission spectrum, i.e., the ratios of integrated emission intensities I(5D0→7FJ, J = 0 to 4) to I(5D0→7F1) may be used to calculate the radiative rate, the Arad = ∑A0→J and the Ω2 and Ω4 Judd-Ofelt intensity parameters, which give indications about the average local field at the europium ion. Details of the calculation have been given by Ćirić et al. (2019). [17] The experimental intensity parameters were also calculated, and the results (Table 2) obtained for the complexes were very similar, the high values found for Ω2 traduces the high intensity of the hypersensitive transition 5D0→7F2 and means that the site occupied by the Eu3+ ion is not centrosymmetric, and that the ligand field is strongly polarizing. The other value of interest is the 5D0 radiative lifetime τrad. By comparing the observed lifetime (τexp) with the radiative one, the 5D0 emission quantum efficiency (q = τexp/τrad) is calculated. The luminescence decay curves, with emission monitored at 5D0→7F2, could be fitted by a monoexponentially decay function. These found values for q suggests that the coordination sphere of the europium is here stabilized by intramolecular interactions of the nearby ethoxy functions of the pending group of the tta and phen ligands. [5]
2.2. Silica Nanoparticles Containing Silylated Sm3+ and Eu3+ Complexes
After characterizing the synthesized silylated complexes of Sm3+ and Eu3+, only Sm(tta-Si)3(phen)2 and Eu(tta-Si)3(phen) were the selected complexes for the next step of incorporation into the silica nanoparticles.
Observing Table 3, it is noticeable that the mesoporous silica nanoparticles containing the complexes Sm(tta-Si)3(phen)2 and Eu(tta-Si)3(phen) have very similar Dh values. The insertion of the complexes does not significantly alter their size, which ranges between 250 and 280 nm. In contrast, the dense silica nanoparticles containing the complexes Sm(tta-Si)3(phen)2 and Eu(tta-Si)3(phen) have very similar Dh values, varying from 40 to 90 nm. Regarding the obtained ZP values, it is noted that this set of nanoparticles is not stable in deionized water at pH 6.5, as all the ZP values fall between +30 mV and -30 mV. Therefore, they tend to aggregate in the medium, which explains the high Dh values.
The SAXS curves presented in Figure S2 are characteristic of hexagonal MCM-41 material with a well-organized mesostructure [18], showing visible diffraction peaks d(100), d(110), d(200), and d(210) for the mesoporous SiO2 curve. These diffraction peaks correspond to the correlation distances from the center of one pore to another in porous materials. With the information on the pore correlation distances, it is possible to outline a profile of how the porous network is organized on the material's surface. For MCM-41 type mesoporous silica, the pore organization profile on its surface is hexagonal. It is noted that when the complexes are incorporated into the silica particles, there is a shift in the diffraction peaks compared to the diffraction peaks of the mesoporous SiO2 sample without complexes. The intensity of these peaks decreases, and the d(200) and d(210) peaks disappear in the SiO2m@Sm(tta-Si)3(phen)2 curve, and d(210) disappears in the SiO2m@Eu(tta-Si)3(phen) curve, confirming the successful incorporation of the complexes into the silica nanoparticles. The electron density on the particle surface changes with the incorporation of the complexes, and the diffraction pattern is thus altered.
According to Table 4, the specific surface area calculated was 913.3 m² g−1 for the MSNs with average pore size found of 4.78 nm, and total pore volume estimated of 1.09 cm³ g−1, while the nanoparticles containing the silylated complexes showed lower values for these parameters, which confirms the other results (SAXS, DLS and ZP) that the incorporation of these complexes into the silica nanoparticles was successful.
In the TEM images shown in Figure 3, the MSNs (a) and DSNs (b) are presented. For the MSNs, the image reveals the well-ordered pore structure of the nanoparticles, evidenced by the contrast differences, confirming the SAXS analysis results. The scale also indicates that the nanoparticles have a size arrangement close to 100 nm, which is smaller than the Dh estimated by the DLS analysis. For the DSNs, the image exhibits particle size smaller than 50 nm and high level aggregation, confirming the obtained results in DLS measurements.
Figure 4 and Figure 5 show images of SiO2m@Sm(tta-Si)3(phen)2 and SiO2m@Eu(tta-Si)3(phen) with their respective EDX analyses and particle size distribution histograms. It is observed that the morphology of the nanoparticles varies from spherical to oval. The nanoparticles appear aggregated, which was already evidenced by the previously presented DLS and ZP measurements. Here, the estimated size of the NPs is smaller (130 - 150 nm) than the size found in the DLS measurements (230 - 280 nm). The EDX microanalysis reveals the presence of Ln3+ ions in smaller proportions than Si and O, as expected, confirming the successful incorporation of the complexes into the MSNs.
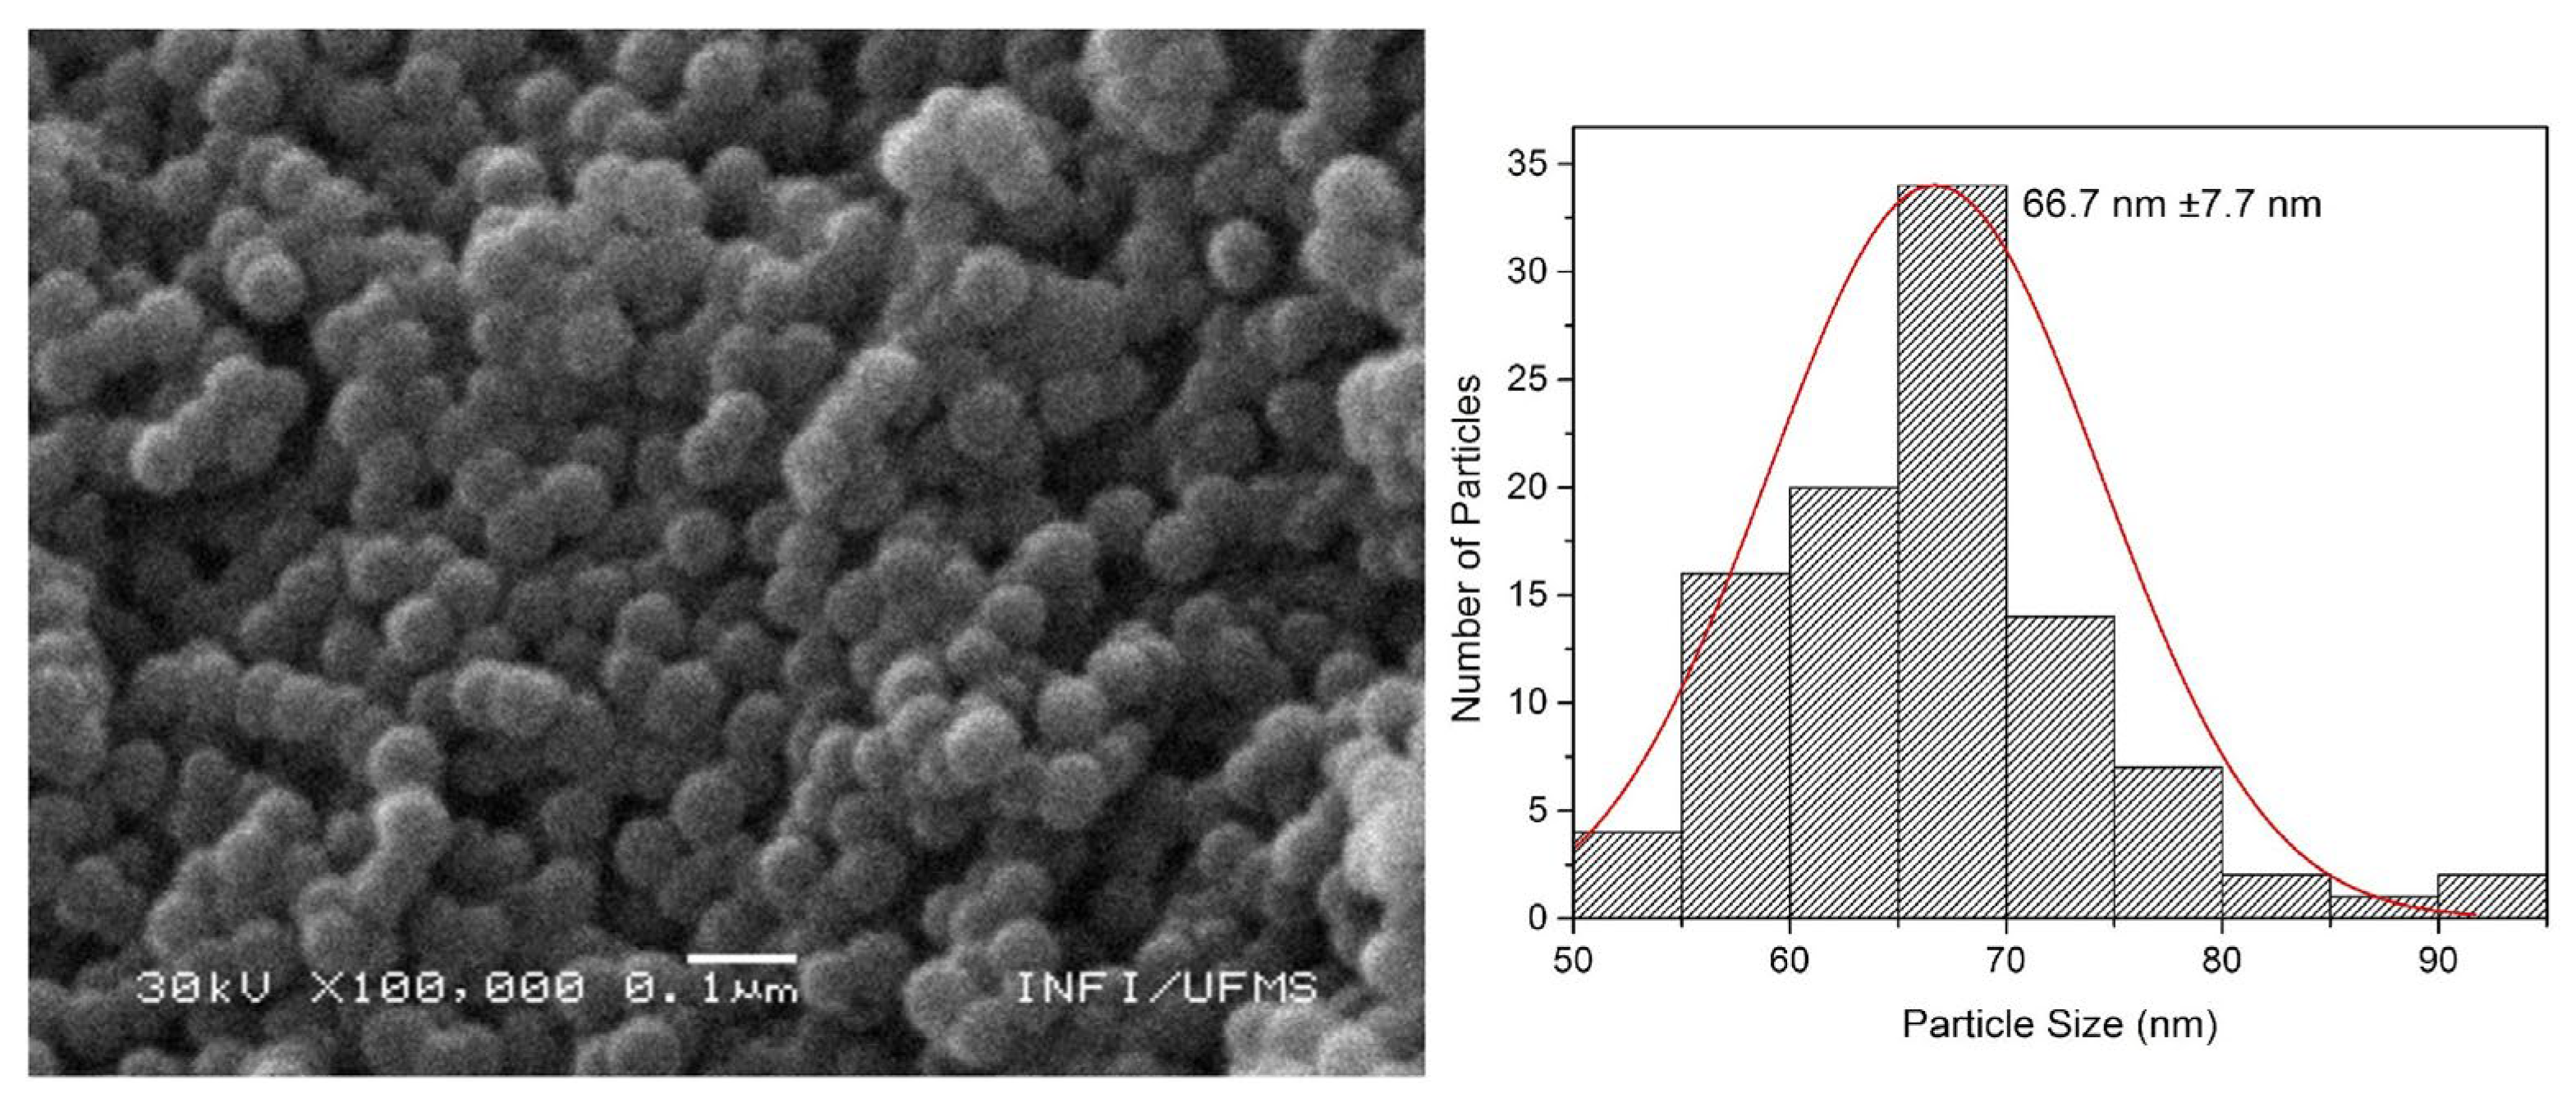
The SEM images presented in Figure 6 and Figure 7 correspond respectively to SiO2d@Sm(tta-Si)3(phen)2, and SiO2d@Eu(tta-Si)3(phen), with their respective size distribution histograms. The morphology of the nanoparticles before (seen by TEM image in Figure 3b) and after the insertion of the complexes remains practically unchanged, exhibiting a spherical pattern. All samples appear aggregated, which is corroborated by the DLS and ZP results. Despite this, the observed particle size (55 - 70 nm) is very similar to that determined by DLS measurements (40 - 80 nm), as the size determined by DLS is apparent due to the Dh and can vary larger or smaller compared to the actual size.
The luminescence measurements performed on the nanoparticles incorporated with Sm3+ and Eu3+ silylated complexes, when incorporated in the MSNs do not show very significant differences compared to the same free complexes characterized (Figures S3 and S4). An exception, however, observed for SiO2d@Eu(tta-Si)3(phen) appears to have undergone significant deterioration during its incorporation into the dense silica nanoparticles (Figure S5), while SiO2d@Sm(tta-Si)3(phen)2 did not showed any luminescence at all.
Cell death occurred with the increase in concentration of Sm3+ and Eu3+ complexes (Figure S6) in all tested cell lines, with a greater reduction in cell viability starting at a concentration of 10.96 µg mL-1. Among the tumor cells, the most sensitive to the Sm3+ and Eu3+ complexes were the A431 line (Table 5). The NIH3T3 cell line was the least sensitive to the tested complexes. SiO2m@Eu(tta-Si)3(phen) caused cell death starting at a concentration of 10.98 µg mL-1 (Figure S7a), with tumor lines being more sensitive, causing the death of more than 50% of the cells. SiO2m@Eu(tta-Si)3(phen) showed low toxicity to the NIH3T3 line compared to the tested tumor lines, with about 40% cell death, which is evidenced by the higher IC50 value (Table 5). SiO2m@Sm(tta-Si)3(phen)2 (Figure S7b) caused a maximum of 25% cell death at most tested concentrations. At concentrations above 90 µg mL-1, cell death reached 50%, with the B16F10 line being the most sensitive (Table 5).
3. Discussion
Fluorescence and emission intensity of Ln3+ complexes significantly increase upon the insertion of a second organic ligand, which acts as an energy donor, thereby enhancing fluorescence intensity in Ln3+ binary complexes (synergistic effect). This enhancement assists in completing the coordination sphere of Ln3+ ions. [15] As a result, most of the designed complexes feature two ligands. The Sm3+ ion emits in three regions of the visible electromagnetic spectrum: green at 560 nm (4G5/2→6H5/2), orange at 595 nm (4G5/2→6H7/2), and red at 645 nm (4G5/2→6H9/2). These emission peaks correspond to f-f transitions from the 4G5/2 level to different J levels with 6H terms (6HJ, J= 5/2 to 15/2) and 4G (4GJ, J= 5/2 to 11/2). The most intense transition is the 4G5/2→6H9/2 (645 nm), which has a dipole electric character and is hypersensitive [13], while the others are 4G5/2→6H5/2 (magnetic dipole), 4G5/2→6H7/2 (magnetic dipole), and 4G5/2→6H11/2 (705 nm, magnetic dipole), which typically broaden. [13,19,20,21] The most common excitation transitions for the Sm3+ ion is 6H5/2→4D3/2 (360 nm), 6H5/2→4D1/2 (375 nm), and 6H5/2→6P5/2 (405 nm), which appear as narrow peaks with weak intensity. These transitions are often masked by the absorption bands of the organic ligands, with only the 6H5/2→4M19/2 (465 nm) transition being observed in the complexes presented here. [13]
Eu3+ complexes, in general, exhibit high quantum efficiency and a versatile coordination environment. [16] Due to these properties, we used this ion in this work. The most intense and dominant transition in the emission spectrum for the Eu3+ ion is 5D0→7F2 (613 nm). This transition indicates a site of reduced symmetry without an inversion center. [14] Other transition peaks correspond to the is 5D0→7FJ (J = 0 to 4): is 5D0→7F0 (580 nm), is 5D0→7F1 (594 nm), is 5D0→7F3 (650 nm), and is 5D0→7F4 (701 nm) (CHOI et al., 2015), which are related to the intra-energetic level 4f6 of the Eu3+ ion. (LI et al., 2013) The transition with dipole magnetic character, is 5D0→7F1, is known to be allowed and hypersensitive to the environment. If the 5D0→7F2 transition is more intense than the 5D0→7F1 transition, then the complex will emit pure red light [16], as observed in our silylated complexes. In the excitation spectra, a broad band can be observed, which is related to the energy transfer from the oxygen/nitrogen 2p orbitals in the ligands to the 4f empty orbital of the Eu3+ ion. [16]
In DLS, Dh can be defined as the size of a rigid particle that diffuses through the medium in the same way as the particle being measured, assuming a hydration layer around it. This is because, in solution, a particle is not completely spherical; it is dynamic and solvated. Therefore, the diameter measured by the equipment will be an indicative apparent size calculated from the diffusion properties of the particles. The measured volume percentage relates to the distribution of the relative proportion of various components in a sample based on their mass and volume. This means it represents the quantity of particles in the peaks of highest intensity of measured Dh. [22]
The Zeta Potential (ZP) is a key indicator of particle stability in colloidal suspensions, as it shows the degree of electrostatic dispersion between adjacent, similarly charged particles. In very small particles, a high ZP value indicates good stability, meaning they will not aggregate easily in the medium. When the ZP value is low, the attractive forces in the medium may overcome the particle repulsion, breaking the dispersion and causing the particles to aggregate, indicating low stability in the medium. Generally, particles with ZP values between +30 mV and -30 mV are considered unstable, while particles with values greater than ±30 mV are considered stable. [22]
The most important factor directly influencing ZP values is pH, as the addition of acid or base to the suspension and/or dispersion changes the particle charge in the medium, consequently altering the ZP value of the particles. Another consideration is that we can easily confirm the different stages in the development of these NPs through the different ZP values obtained. As new compounds are added to the silica NPs, the ZP value shifts from smaller negative values to higher positive values in mV, then drops to smaller but positive values. This behavior is different from that observed in mesoporous silica NPs, as they are different types of silica and the Ln3+ complexes are incorporated differently in each type of silica.
4. Materials and Methods
Tetrahydrofuran anhydrous (THF), 3-chloropropyl-triethoxysilane (CPTS), sodium hydrate (NaH), 2-thenoyltrifluoroacetone (TTA), 1,0-phenanthroline monohydrate (1,10-phen), and phosphate buffer saline (PBS) were purchased from Sigma Aldrich. Dimethyl sulfoxide (DMSO, 99.9%) from J.T Baker; ethanol anhydrous from Dinâmica; Dulbecco’s Modified Eagle Medium (DMEM) containing 10% fetal bovine serum (FBS) from Gibco; Trypsin/EDTA from Gibco; Bovine serum albumin (BSA) from Life Technologies; penicillin, streptomycin 100 µg/mL - STR/PEN from Life Technologies; (3-(4,5-dimethylthiazol-2-yl)-2,5-diphenyltetrazolium bromide (MTT) from Life Technologies; and Nitrogen gas from White Martins. All reagents were of analytical grade and were used as received without further purification and throughout the experiments Milli-Q grade water (Millipore system) was used. Samarium nitrate, Sm(NO3)3, and Europium nitrate, Eu(NO3)3, solutions were obtained by salts of Samarium and Europium Oxide, whose purity is higher than 99%.
4.1. Ligand Silylation with 3-chloropropyl-triethoxysilane (CPTS)
To obtain silylated complexes of Sm3+ and Eu3+, the organic ligand 2-thenoyltrifluoroacetone (tta) and 1,10-phenanthroline monohydrate (phen) were modified by a silylation reaction. Based on experimental procedures of Qiao and Yan (2009) [23], and Duarte et al. (2012) [5], these syntheses were performed with modifications on reactants amount, temperature of synthesis and using 3-chloropropyltriethoxysilane (3-CPTS) as silylating agent.
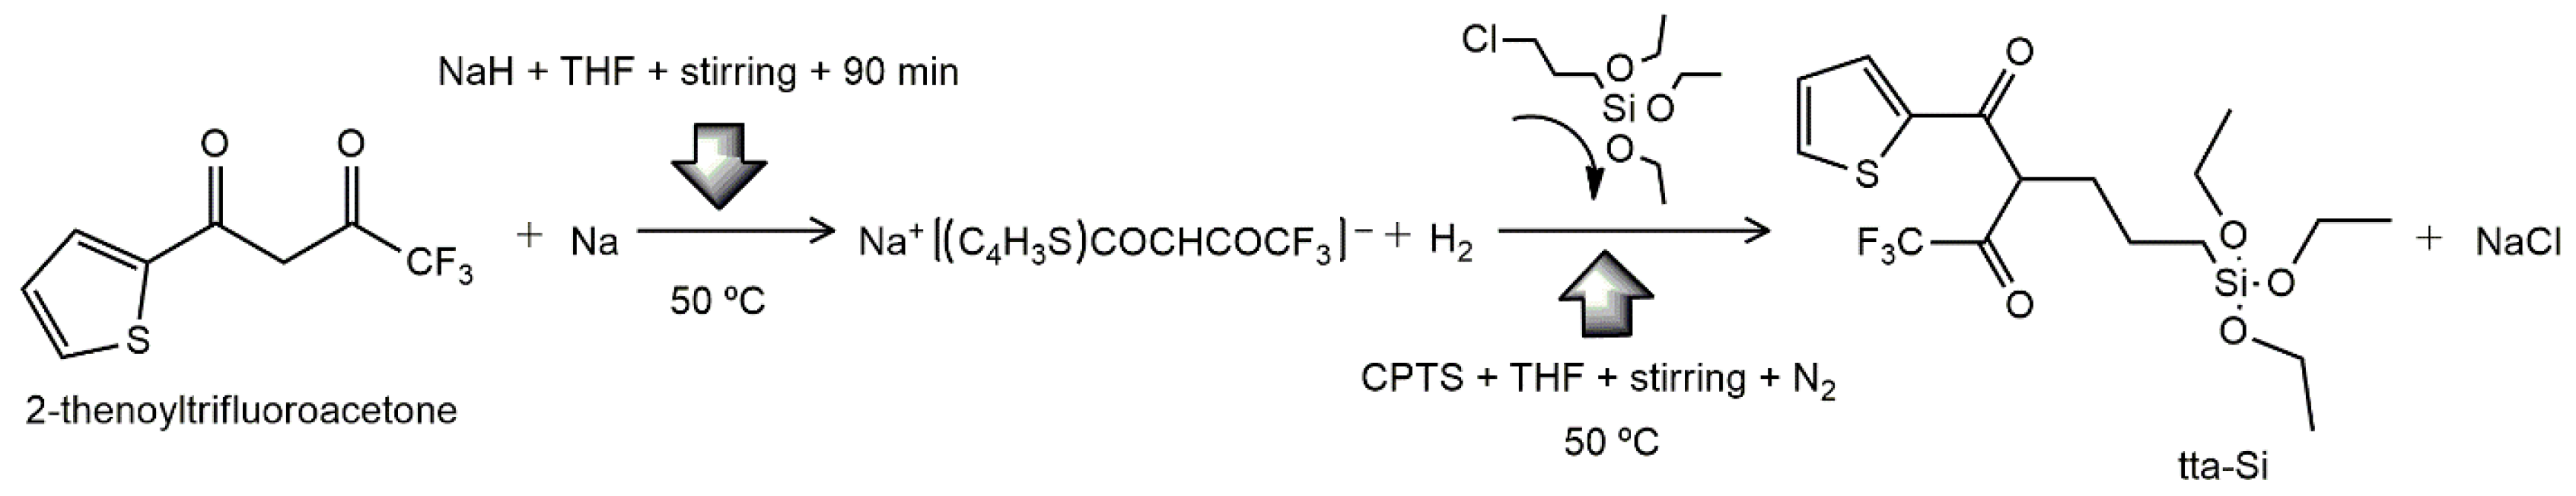
Then, in a dry flash, 2 mmol of tta were added to 20 mL of anhydrous tetrahydrofuran under stirring at 50 °C. After, 2 mmol of sodium hydrate (NaH) were slowly added to the mixture under the N2 atmosphere. The mixture was stirred over 90 min, under N2 atmosphere at 50 °C. Finally, 2 mmol of 3-CPTS were added dropwise to reaction. This step was kept by 18 h, under stirring, N2 atmosphere at 50 °C. The obtained product was washed with diethyl ether, filtered and dry under vacuum overnight at 30 °C. The Scheme 1 represents tta modification. Mass yield was 63.88%.
Same procedure was used for 1,10-phenanthroline modification, except temperature which was increased to 60 °C (seen in the Scheme 2). Mass yield was 40.55 %.
4.2. Synthesis of Silylated Sm3+ and Eu3+ Complexes
Silylated Sm3+ complexes were aimed with a 10-coordination number (ligand:metal ratio), since this coordination sphere is the most probable for Sm3+. Whereas silylated Eu3+ complexes were aimed with an 8-coordination number, most probable coordination sphere for Eu3+.
Basically, silylated complexes were performed by mixing of silylated ligand, non silylated ligand, Ln(NO3)3 solution (where Ln= Sm or Eu), and anhydrous ethanol. All reactions were maintained by 18 h, under stirring, N2 atmosphere and 50 °C. At the end of each complex synthesis, the solvent was evaporated, the precipitate was washed with pentane and diethyl ether, and dried under vacuum overnight at 30 °C.
Average mass yield varied widely, and the values were: 42.05% for Sm(tta-Si)3(phen)2; 28.31% for Sm(phen-Si)3(tta)2; 63.14% for Eu(tta-Si)3(phen); 56.1% for Eu(phen-Si)3(tta); and 41.06% for Eu(tta-Si)2(phen-Si)2.
4.3. Synthesis of Mesoporous Silica Nanoparticles (MSNs)
The synthesis procedure used was inspired by the work of He et al. (2010) [24], in which sodium hydroxide (NaOH) and cetyltrimethylammonium bromide (CTAB) were mixed in distilled water. The mixture was then kept under constant stirring at 80 °C. Subsequently, tetraethyl orthosilicate (TEOS), a silica precursor, was added dropwise. The mixture was kept under vigorous stirring for 20 hours at 80 °C. Finally, the resulting precipitated material was centrifuged and washed several times with distilled water. The centrifuged product was dried in an oven at 50 – 70 °C and then calcined to completely remove the surfactant. [3]
4.4. Insertion of Ln3+ Silylated Complexes into MSNs (SiO2m@silylated Complex)
We used a modified protocol based on the one we previously proposed [25]. Calcined mesoporous silica nanoparticles and Sm(tta-Si)3(phen)2 were mixed in ethanol. This mixture was kept under agitation for 24 h at room temperature. Finally, the product was centrifuged and dried under vacuum at room temperature to avoid degradation of the complex. The supernatant was not discarded to perform chemical analysis by titration. The same procedure was used for the insertion of the Eu(tta-Si)3(phen) complex into the MSNs.
4.5. Synthesis of Dense Silica Nanoparticles (DSNs)
The synthesis of these nanoparticles utilized a reverse microemulsion reaction of water in oil. According to Zhao et al. (2004) [26] and Cousinié et al. (2012) [1], the operational protocol involved reacting cyclohexane (oil phase), n-octanol (reaction co-solvent), and Triton X-100 under vigorous stirring for 15 min to create and stabilize the microemulsion. Deionized water was then added dropwise to avoid breaking the microemulsion. Very vigorous stirring (1050 rpm) for 20 min was required to stabilize the microemulsion. Then, TEOS was added dropwise, followed by 10 minutes of vigorous stirring. Finally, ammonium hydroxide (NH4OH, 25%) was added dropwise. The reaction was maintained under vigorous stirring at 1050 rpm for 24 h at 22 °C.
At the end of the process, acetone was added to the reaction flask, and the mixture was stirred for 15 min at 1050 rpm to allow the acetone to "break" the microemulsion. The mixture was then left to rest for 2 h to ensure the decantation of the DSNs. The precipitated product was dialyzed in deionized water for 3 days in a thermostatic bath under stirring with periodic water changes. After dialysis, the DSNs were centrifuged and washed several times with ethanol, deionized water, acetonitrile, and diethyl ether, and finally dried in a vacuum oven for 12 h at 40 °C.
4.6. Insertion of Ln3+ Silylated Complexes into DSNs (SiO2d@silylated Complex)
The insertion of Sm(tta-Si)3(phen)2 and Eu(tta-Si)3(phen) complexes into DSNs was carried out during the synthesis of the NPs by co-precipitation. The complexes were pre-solubilized in the portion of deionized water used in the reaction and added to the mixture during the water addition step. The other steps of the procedure are described in Section 2.4.
4.7. Characterization
Fourier Transform Infrared Spectroscopy (FTIR): The FTIR spectra were obtained by a Nicolet iS5 model from Thermo Fisher Scientific, ranging from 4000-400 cm-1, 4 cm-1 of resolution, 100 scans min-1, and diluted in KBr pellets with 1% (w/w) final concentration.
Luminescence Spectroscopy and Luminescence Decay: were performed using a spectrofluorimetric Horiba Jobin-Yvon FluoroLog-3 with Xe lamp of 450 W, as excitation source, monochromator iHR-320, under the same instrumental conditions for all samples. The samples are used in a solid state, the signals were normalized by excitation lamp power, and the emissions were corrected (slit and increment values are shown in each spectrum graphic). For luminescence decay, a pulsed Xe lamp was used, the most intense transition was used as λem, for Sm3+ complexes the transition was 4G5/2→6H9/2 (650 nm) and for Eu3+ complexes the transition was 5D0→7F2 (612 nm). Data acquisition parameters were the same for all samples: integration time between pulses of 0.01 ms, initial delay of 0.005 ms, maximum delay of 2 ms, cycling time of 51 ms, number of pulses of 150 per cycle.
Dynamic Light Scattering (DLS) and Zeta Potential (ZP): DLS and ZP measurements were performed to determine the hydrodynamic diameter (DH) and surface charge of the nanoparticles, respectively. These measurements were carried out using a Malvern Instruments Zetasizer Nano ZS Series device, with deionized water as the dispersing solvent and using appropriate cuvettes for each type of measurement.
Small-Angle X-ray Scattering (SAXS): The SAXS spectra of the MSNs and SiO2m@silylated complex nanoparticles were obtained using an INEL XRG3D instrument. The SAXS signal of the nanoparticles (NPs) was obtained with X-rays produced by a Cu anode. Measurements were carried out with a 1x1 mm beam, and an image plate detector located 38 cm from the sample, with an acquisition time of 1 h. In the measurement device, the beam formatting is provided by Kirkpatrick-Baez mirrors, followed by two crossed slits (horizontal and vertical). This technique provides information on the pore arrangement in the NPs, through X-ray scattering due to differences in the electronic densities of the atoms composing the NPs, making it possible to confirm the modification and insertion of complexes into the mesoporous silica NPs by analyzing changes in the spectra.
Porosity and Surface Area Measurements: Surface area measurements by the Brunauer-Emmett-Teller (BET) method and porosity measurements by the Barrett-Joyner-Halenda (BJH) method were obtained using N2 adsorption-desorption to determine the pore size and shape, as well as the surface area of the NPs. These measurements were conducted using a Micromeritics ASAP2020 porosimeter.
Scanning and Transmission Electron Microscopy (SEM and TEM) and Energy-Dispersive X-ray Spectroscopy (EDX): Transmission Electron Microscopy (TEM) images were taken using a Phillips CM20 high-voltage microscope operating at up to 200 kV, with a LaB6 electron source. The samples were dispersed in ethanol and sonicated before deposition and drying on Cu grids coated with a carbon film (300 mesh), specific for TEM imaging. In addition to TEM images, scanning electron microscopy with energy-dispersive X-ray spectroscopy (SEM/EDX) images were also obtained using a JEOL JSM-6380LV microscope with an attached Thermo Scientific Noran System Six EDX spectrometer. Powder samples were deposited on carbon tape without any prior preparation, and after EDX measurements, they were sputter-coated with Au to achieve better contrast in the images.
MTT Assay for Cytotoxicity and Cell Viability: The cells used in this assay were NIH-3T3 adherent cell lines (healthy murine fibroblast cells), 4T1 (mammary carcinoma BALB/cfC3H mice), B16F10 (murine melanoma), and A431 (human epidermoid carcinoma), kindly supplied by the Laboratory of Nanobiotechnology at the Genetic and Morphology Department of the Institute of Biology, University of Brasília, Brasília-DF, Brazil. The assay methodology carried out was based on Mosmann (1983) [27]. The cells were cultured in Dulbecco's Modified Eagle's Medium (DMEM) supplemented with 10% fetal bovine serum (FBS) and 1% antibiotics (Penicillin/Streptomycin), all from Gibco® by Life Technologies, maintained in an incubator at 37 °C with 5% CO2. For the experiments, the cells were detached from the culture flasks using trypsin-EDTA (0.05%), also from Gibco® by Life Technologies, for 3 min in the incubator, collected in 15 mL conical tubes, centrifuged at 2000 rpm for 3 min, resuspended in DMEM, counted using a Neubauer chamber, and plated in 96-well plates at a cell concentration of 3.103 cells per well. After 24 h of plating, the cells were incubated with culture medium containing different concentrations (25 μg mL-1; 20 μg mL-1; 15 μg mL-1; 10 μg mL-1; and 5 μg mL-1) of the complexes: Sm(tta-Si)3(phen)2 and Eu(tta-Si)3(phen); and the NPs of: SiO2m@Sm(tta-Si)3(phen)2, SiO2m@Eu(tta-Si)3(phen), SiO2d@Sm(tta-Si)3(phen)2, SiO2d@Eu(tta-Si)3(phen), dispersed in a maximum of 1% dimethyl sulfoxide (DMSO), in triplicate, for a period of 24 h. Supplemented DMEM medium was used as a negative control. After the incubation period, the medium was discarded, and each well was washed by adding a phosphate-buffered saline (PBS) solution. After washing, 150 μL of MTT solution (10% MTT in PBS at 5 mg mL-1 and 90% DMEM) was added, and the plates were returned to the incubator for 2 h for metabolization. After 2 h, the liquid was removed, and 100 μL of DMSO was added to elute the formazan crystals. Absorbance at 595 nm was analyzed using a spectrophotometer (Spectramax M2, Molecular Devices, USA). Absorbance was used as an index of cell viability, and the results were expressed as percentages relative to the control groups after 24 h of treatment. For greater reliability, all experiments were performed in triplicate.
5. Conclusions
We synthesized novel luminescent lanthanide complexes, specifically of europium and samarium. Subsequently, we covalently incorporated these complexes into dense or mesoporous silica nanoparticles. We then characterized these new biomarkers using various physicochemical techniques, including luminescence spectroscopy. Finally, we conducted preliminary MTT assays demonstrating robust cell viability after 24 hours of exposure to our nanoparticles in healthy cell cultures.
Supplementary Materials
The following supporting information can be downloaded at: Preprints.org.
Author Contributions
For research articles with several authors, a short paragraph specifying their individual contributions must be provided. The following statements should be used “Conceptualization, J.J. and M.A.U.M.; methodology, J.J. and S.R.S.; software, J.J., D.B. and S.R.S.; validation, J.J. and S.R.S.; formal analysis, J.J., D.B., K.F.D.P.S., S.R.S., A.P.D., M.V., R.B.A., G.R.C., A.L.P., J.R.R.A., and M.A.U.M.; investigation, J.J.; resources, J.J., D.B., K.F.D.P.S., S.R.S., A.P.D., M.V., R.B.A., G.R.C., A.L.P., J.R.R.A., and M.A.U.M.; data curation, J.J., D.B. and S.R.S.; writing—original draft preparation, J.J. writing—review and editing, J.J., A.L.P., J.R.R.A., and M.A.U.M.; visualization, M.V..; supervision, M.V. and M.A.U.M.; project administration, M.A.U.M.; funding acquisition, M.A.U.M. All authors have read and agreed to the published version of the manuscript.”
Funding
Please add: This research was funded by Universidade Federal de Mato Grosso do Sul. This study was financed in part by the Coordenação de Aperfeiçoamento de Pessoal de Nível Superior—Brasil (CAPES)—Finance Code 001 and CAPES-PrInt, Finance Code 88881.311799/2018-01. The authors are also grateful to the Conselho Nacional de Desenvolvimento Científico e Tecnológico—Brasil (CNPq)—Finance Code 420852/2018-2 and Fundação de Apoio ao Desenvolvimento do Ensino, Ciência e Tecnologia do Estado de Mato Grosso do Sul—Brasil (FUNDECT-MS)—grants 036/2017 PPSUS-MS (59/300.074/2017) for providing financial support for undertaking this project.
Data Availability Statement
Not applicable.
Acknowledgments
The authors thanks Teófilo Fernando Mazon Cardoso for providing the FTIR analysis.
Conflicts of Interest
The authors declare no conflicts of interest.
References
- Cousinié, S.; Mauline, L.; Gressier, M.; Kandibanda, S.R.; Datas, L.; Reber, C.; Menu, M.-J. Bulk or surface grafted silylated Ru(ii) complexes on silica as luminescent nanomaterials. New J. Chem. 2012, 36, 1355–1367, . [CrossRef]
- Li, P.; Li, H. Recent progress in the lanthanide-complexes based luminescent hybrid materials. Co-ord. Chem. Rev. 2021, 441, . [CrossRef]
- Lechevallier, S.; Jorge, J.; Silveira, R.M.; Ratel-Ramond, N.; Neumeyer, D.; Menu, M.J.; Gressier, M.; Marçal, A.L.; Rocha, A.L.; Martines, M.A.U.; et al. Luminescence Properties of Mesoporous Silica Nanoparticles Encapsulating Different Europium Complexes: Application for Biolabelling. J. Nanomater. 2013, 2013, 1–11, . [CrossRef]
- Aguiar, F.P.; Costa, I.F.; Espínola, J.G.P.; Faustino, W.M.; Moura, J.L.; Brito, H.F.; Paolini, T.B.; Felinto, M.C.F.; Teotonio, E.E. Luminescent hybrid materials functionalized with lanthanide ethylenodiaminotetraacetate complexes containing β-diketonate as antenna ligands. J. Lumin- 2016, 170, 538–546, . [CrossRef]
- Duarte, A.P.; Gressier, M.; Menu, M.-J.; Dexpert-Ghys, J.; Caiut, J.M.A.; Ribeiro, S.J.L. Structural and Luminescence Properties of Silica-Based Hybrids Containing New Silylated-Diketonato Europium(III) Complex. J. Phys. Chem. C 2011, 116, 505–515, . [CrossRef]
- Li, Q-P; Yan, B. Multi-walled carbon nanotube-based ternary rare earth (Eu3+, Tb3+) hybrid materials with organically modified silica–oxygen bridge. J Colloid Interface Sci, 2012, 380, 67-74.
- Marques, S.S.; Segundo, M.A. Nanometrics goes beyond the size: Assessment of nanoparticle concentration and encapsulation efficiency in nanocarriers. TrAC Trends Anal. Chem. 2024, 174, . [CrossRef]
- Narayan, R.; Nayak, U.Y.; Raichur, A.M.; Garg, S. Mesoporous Silica Nanoparticles: A Comprehensive Review on Synthesis and Recent Advances. Pharmaceutics 2018, 10, 118, doi:10.3390/pharmaceutics10030118.
- Lérida-Viso, A.; Estepa-Fernández, A.; García-Fernández, A.; Martí-Centelles, V.; Martínez-Máñez, R. Biosafety of mesoporous silica nanoparticles; towards clinical translation. Adv. Drug Deliv. Rev. 2023, 201, 115049, . [CrossRef]
- Bhatane, D.; Pamshong, S.R.; Sarnaik, S.; A, P.; Alexander, A. Potential applications of mesoporous silica nanoparticles for the treatment of neurological disorders. J. Drug Deliv. Sci. Technol. 2023, 89, . [CrossRef]
- Jafari, S.; Derakhshankhah, H.; Alaei, L.; Fattahi, A.; Varnamkhasti, B.S.; Saboury, A.A. Mesoporous silica nanoparticles for therapeutic/diagnostic applications. Biomed. Pharmacother. 2018, 109, 1100–1111, . [CrossRef]
- Abbasi, M.; Ghoran, S.H.; Niakan, M.H.; Jamali, K.; Moeini, Z.; Jangjou, A.; Izadpanah, P.; Amani, A.M. Mesoporous silica nanoparticle: Heralding a brighter future in cancer nanomedicine. Microporous Mesoporous Mater. 2021, 319, 110967, . [CrossRef]
- Zaitoun, M.; Momani, K.; Jaradat, Q.; Qurashi, I. Synthesis and luminescence properties of encapsulated sol–gel glass samarium complexes. Spectrochim. Acta Part A: Mol. Biomol. Spectrosc. 2013, 115, 810–814, . [CrossRef]
- Choi, Y.I.; Yoon, Y.; Kang, Y.-G.; Sohn Y. Photoluminescence imaging of Eu(III) and Tb(III)-embedded SiO2nanostructures. J Lumin, 2015, 158, 27-31.
- Li, W.-X.; Feng, S.-Y.; Liu, Y.; Zhang, J.; Xin, X.-D.; Ao, B.-Y.; Li, Y.-J. Fluorescence enhancement of samarium (III) perchlorate by 1,10-phenanthroline on Phenylnaphthoylmethyl sulfoxide complex and luminescence mechanism. J. Lumin- 2013, 143, 746–753, . [CrossRef]
- Chen, Y.; Wu, S.; Xing, Z.; Cao, S.; Geng, X.; Yang, Y.; Xiao, L. Synthesis, structural characterization and luminescent properties of a novel europium ternary complex Eu(2-A-4-CBA)3phen. J. Alloy. Compd. 2015, 649, 699–703, . [CrossRef]
- Ćirić, A.; Stojadinović, S.; Sekulić, M.; Dramićanin, M.D. JOES: An application software for Judd-Ofelt analysis from Eu3+ emission spectra. J. Lumin- 2018, 205, 351–356, . [CrossRef]
- Sheppard, D.; Maitland, C.; Buckley, C. Preliminary results of hydrogen adsorption and SAXS modelling of mesoporous silica: MCM-41. J. Alloy. Compd. 2005, 404-406, 405–408, . [CrossRef]
- Lunstroot, K.; Nokemann, P.; Van Hecke, K.; Van Meervelt, L.; Görller-Walrand, C.; Binnemans, K.; Driesen, K. Visible and Near-Infrared Emission by Samarium(III) Containing Ionic Liquid Mixtures. Inorg Chem, 2009, 48, 3018-3026.
- Dyrba, M.; Miclea, P.-T.; Schweizer, S. Surface plasmons for fluorescence enhancement in Sm-doped borate glasses. Radiat. Meas. 2010, 45, 314–316, . [CrossRef]
- Nehra, K.; Dalal, A.; Hooda, A.; Bhagwan, S.; Saini, R.K.; Mari, B.; Kumar, S.; Singh, D. Lanthanides β-diketonate complexes as energy-efficient emissive materials: A review. J. Mol. Struct. 2021, 1249, 131531, . [CrossRef]
- Bhattacharjee, S. DLS and zeta potential - What they are and what they are not? J Control Release, 2016, 235, 337-351.
- Qiao, X.-F.; Yan, B. Luminescent polymeric hybrids functionalized by β-diketone with silicon–oxygen networks and carbon chains: Assembly and characterization. Eur. Polym. J. 2009, 45, 2002–2010, . [CrossRef]
- He, Q.; Zhang, J.; Shi, J.; Zhu, Z.; Zhang, L.; Bu, W.; Guo, L.; Chen, Y. The effect of PEGylation of mesoporous silica nanoparticles on nonspecific binding of serum proteins and cellular responses. Biomaterials 2010, 31, 1085–1092, . [CrossRef]
- Jorge, J; Verelst, M; Castro, GR; Martines, MAU. Effect of silica surface on luminescence properties of Tb3+-glutamic acid. Int J Research Pharm Chem, 2013, 3(2), 184-191.
- Zhao, X.; Bagwe, R.P.; Tan, W. Development of Organic-Dye-Doped Silica Nanoparticles in a Reverse Microemulsion. Adv. Mater. 2004, 16, 173–176, . [CrossRef]
- Mosmann, T. Rapid colorimetric assay for cellular growth and survival: Application to proliferation and cytotoxicity assays. J. Immunol. Methods 1983, 65, 55–63. [CrossRef]
Figure 1.
Luminescence spectra (excitation - left, and emission - right) of the Sm(tta-Si)3(phen)2 and Sm(phen-Si)3(tta)2 complexes, acquired with slit widths exc/em = 2/2 mm; increment = 0.5 nm; speed = 0.1 s.
Figure 1.
Luminescence spectra (excitation - left, and emission - right) of the Sm(tta-Si)3(phen)2 and Sm(phen-Si)3(tta)2 complexes, acquired with slit widths exc/em = 2/2 mm; increment = 0.5 nm; speed = 0.1 s.
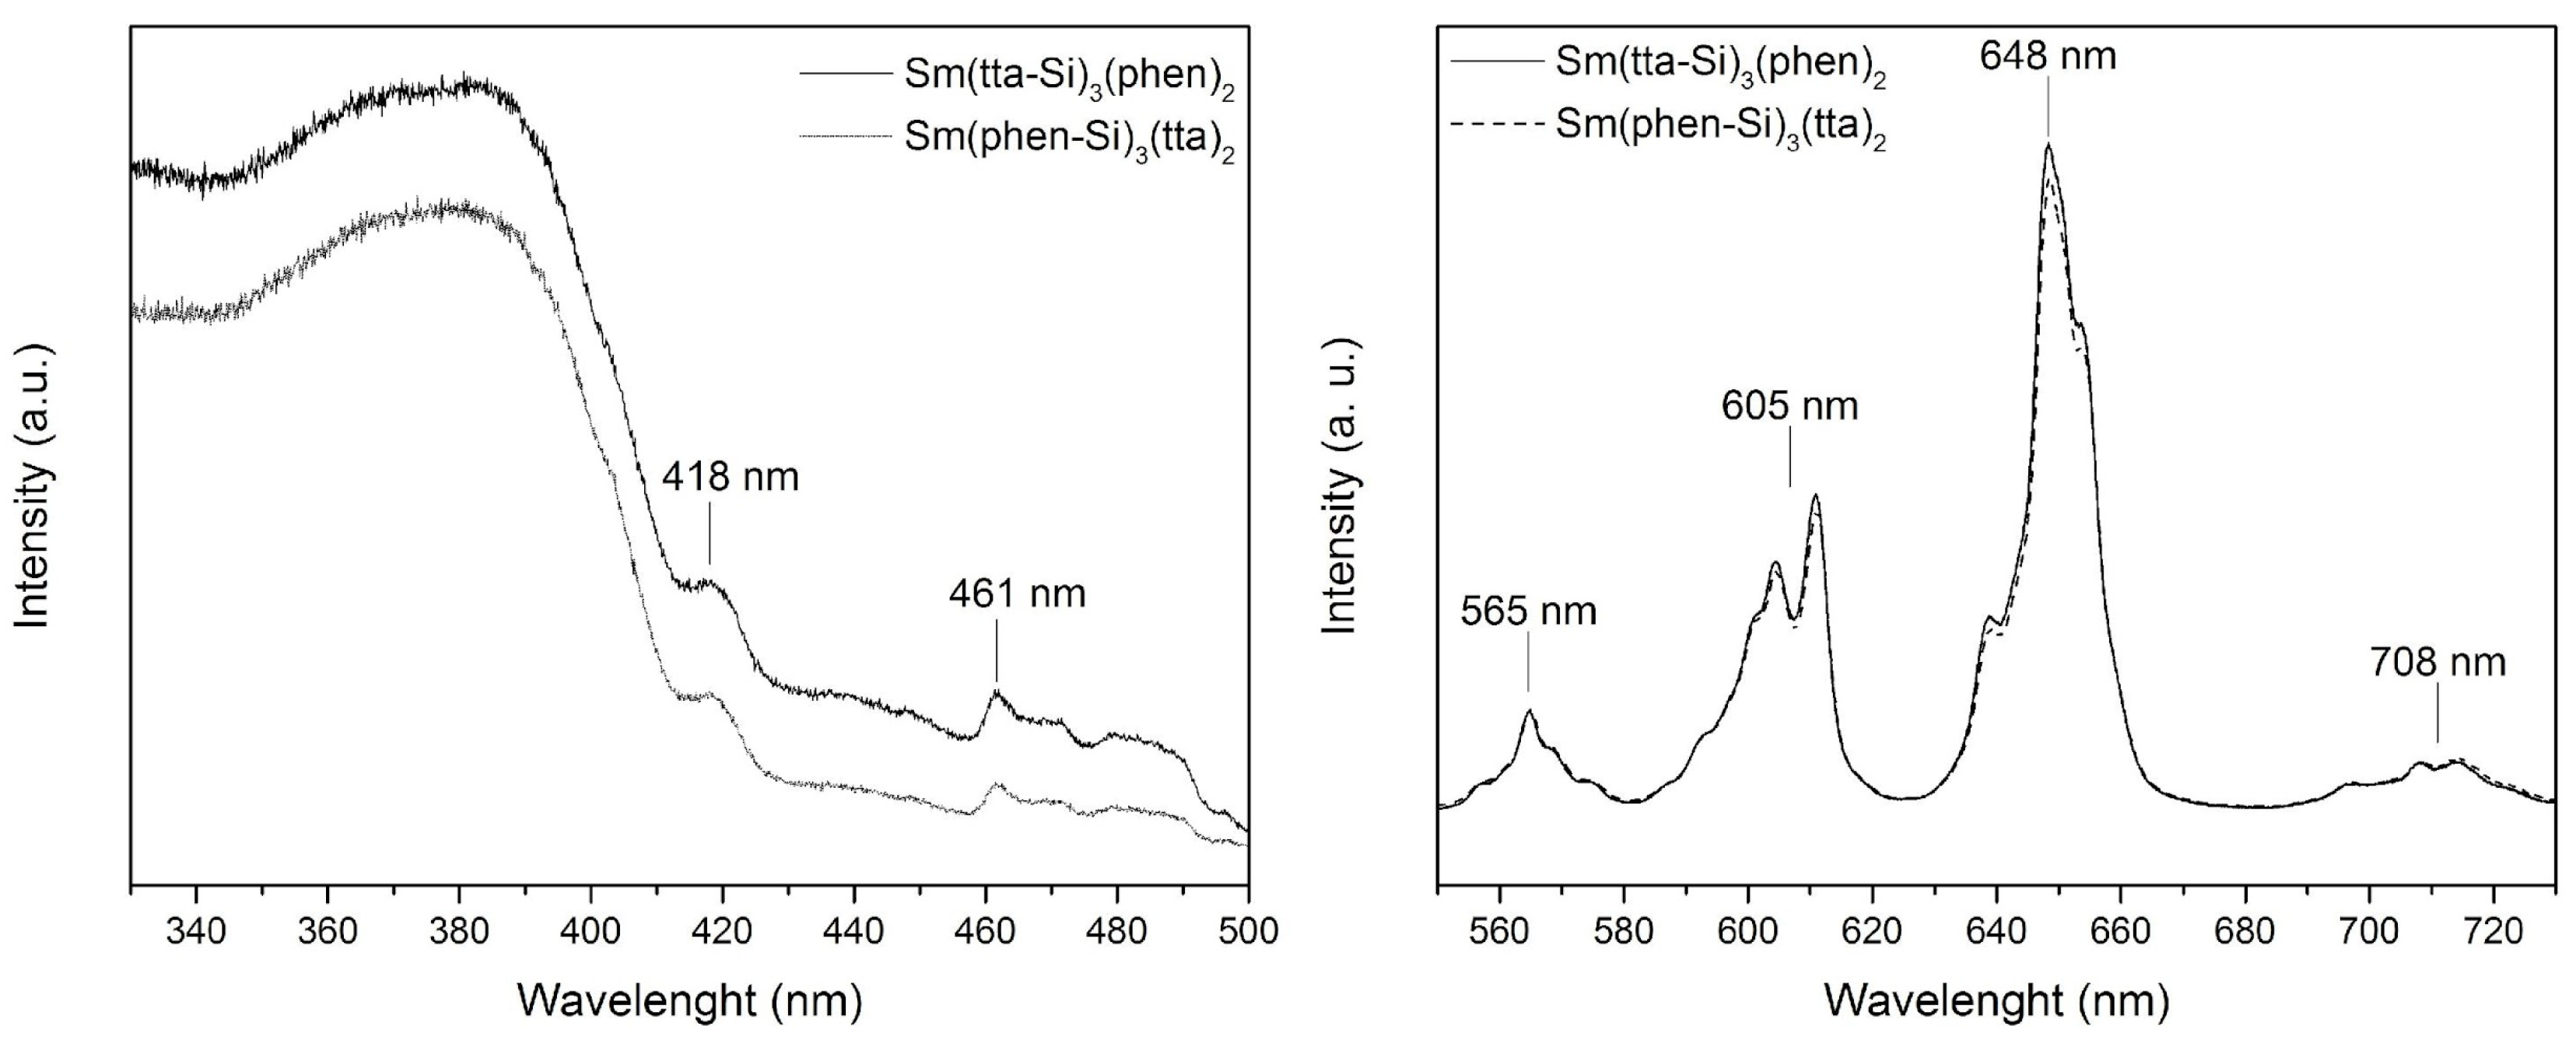
Figure 2.
Luminescence spectra (excitation - left, and emission - right) of the Eu(tta-Si)3(phen), Eu(phen-Si)3(tta), and Eu(tta-Si)2(phen-Si)2 complexes, acquired with slit widths exc/em = 2/2 mm; increment = 1 nm; speed = 0.1 s.
Figure 2.
Luminescence spectra (excitation - left, and emission - right) of the Eu(tta-Si)3(phen), Eu(phen-Si)3(tta), and Eu(tta-Si)2(phen-Si)2 complexes, acquired with slit widths exc/em = 2/2 mm; increment = 1 nm; speed = 0.1 s.
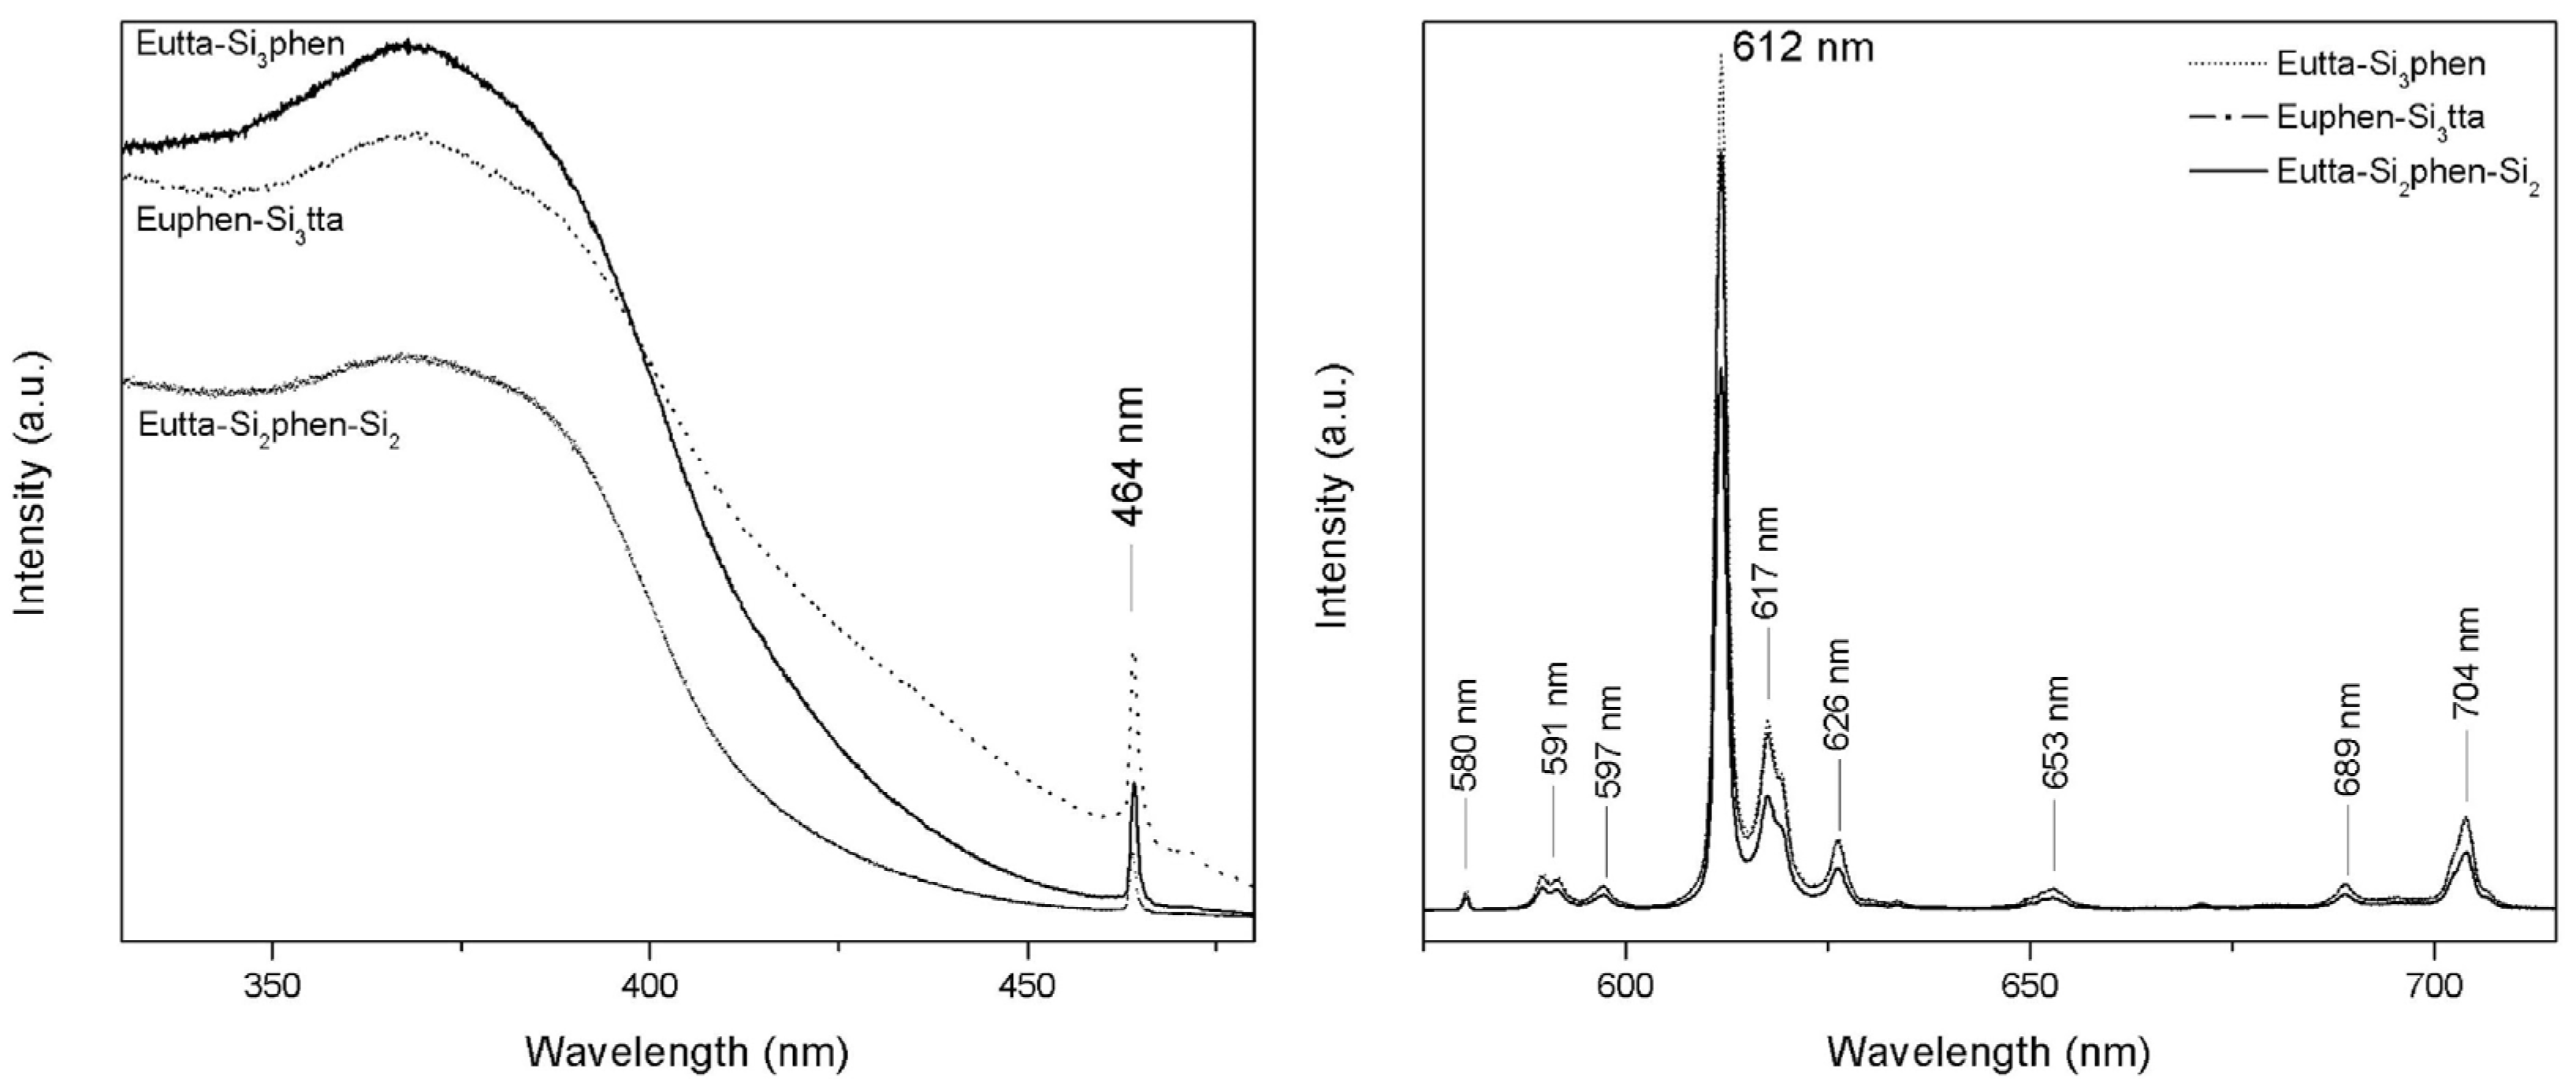
Figure 3.
Images of the (a) MSNs from Transmission Electron Microscopy, obtained at 66 kV, and (b) DSNs from Transmission Electron Microscopy, obtained at 115 kV.
Figure 3.
Images of the (a) MSNs from Transmission Electron Microscopy, obtained at 66 kV, and (b) DSNs from Transmission Electron Microscopy, obtained at 115 kV.
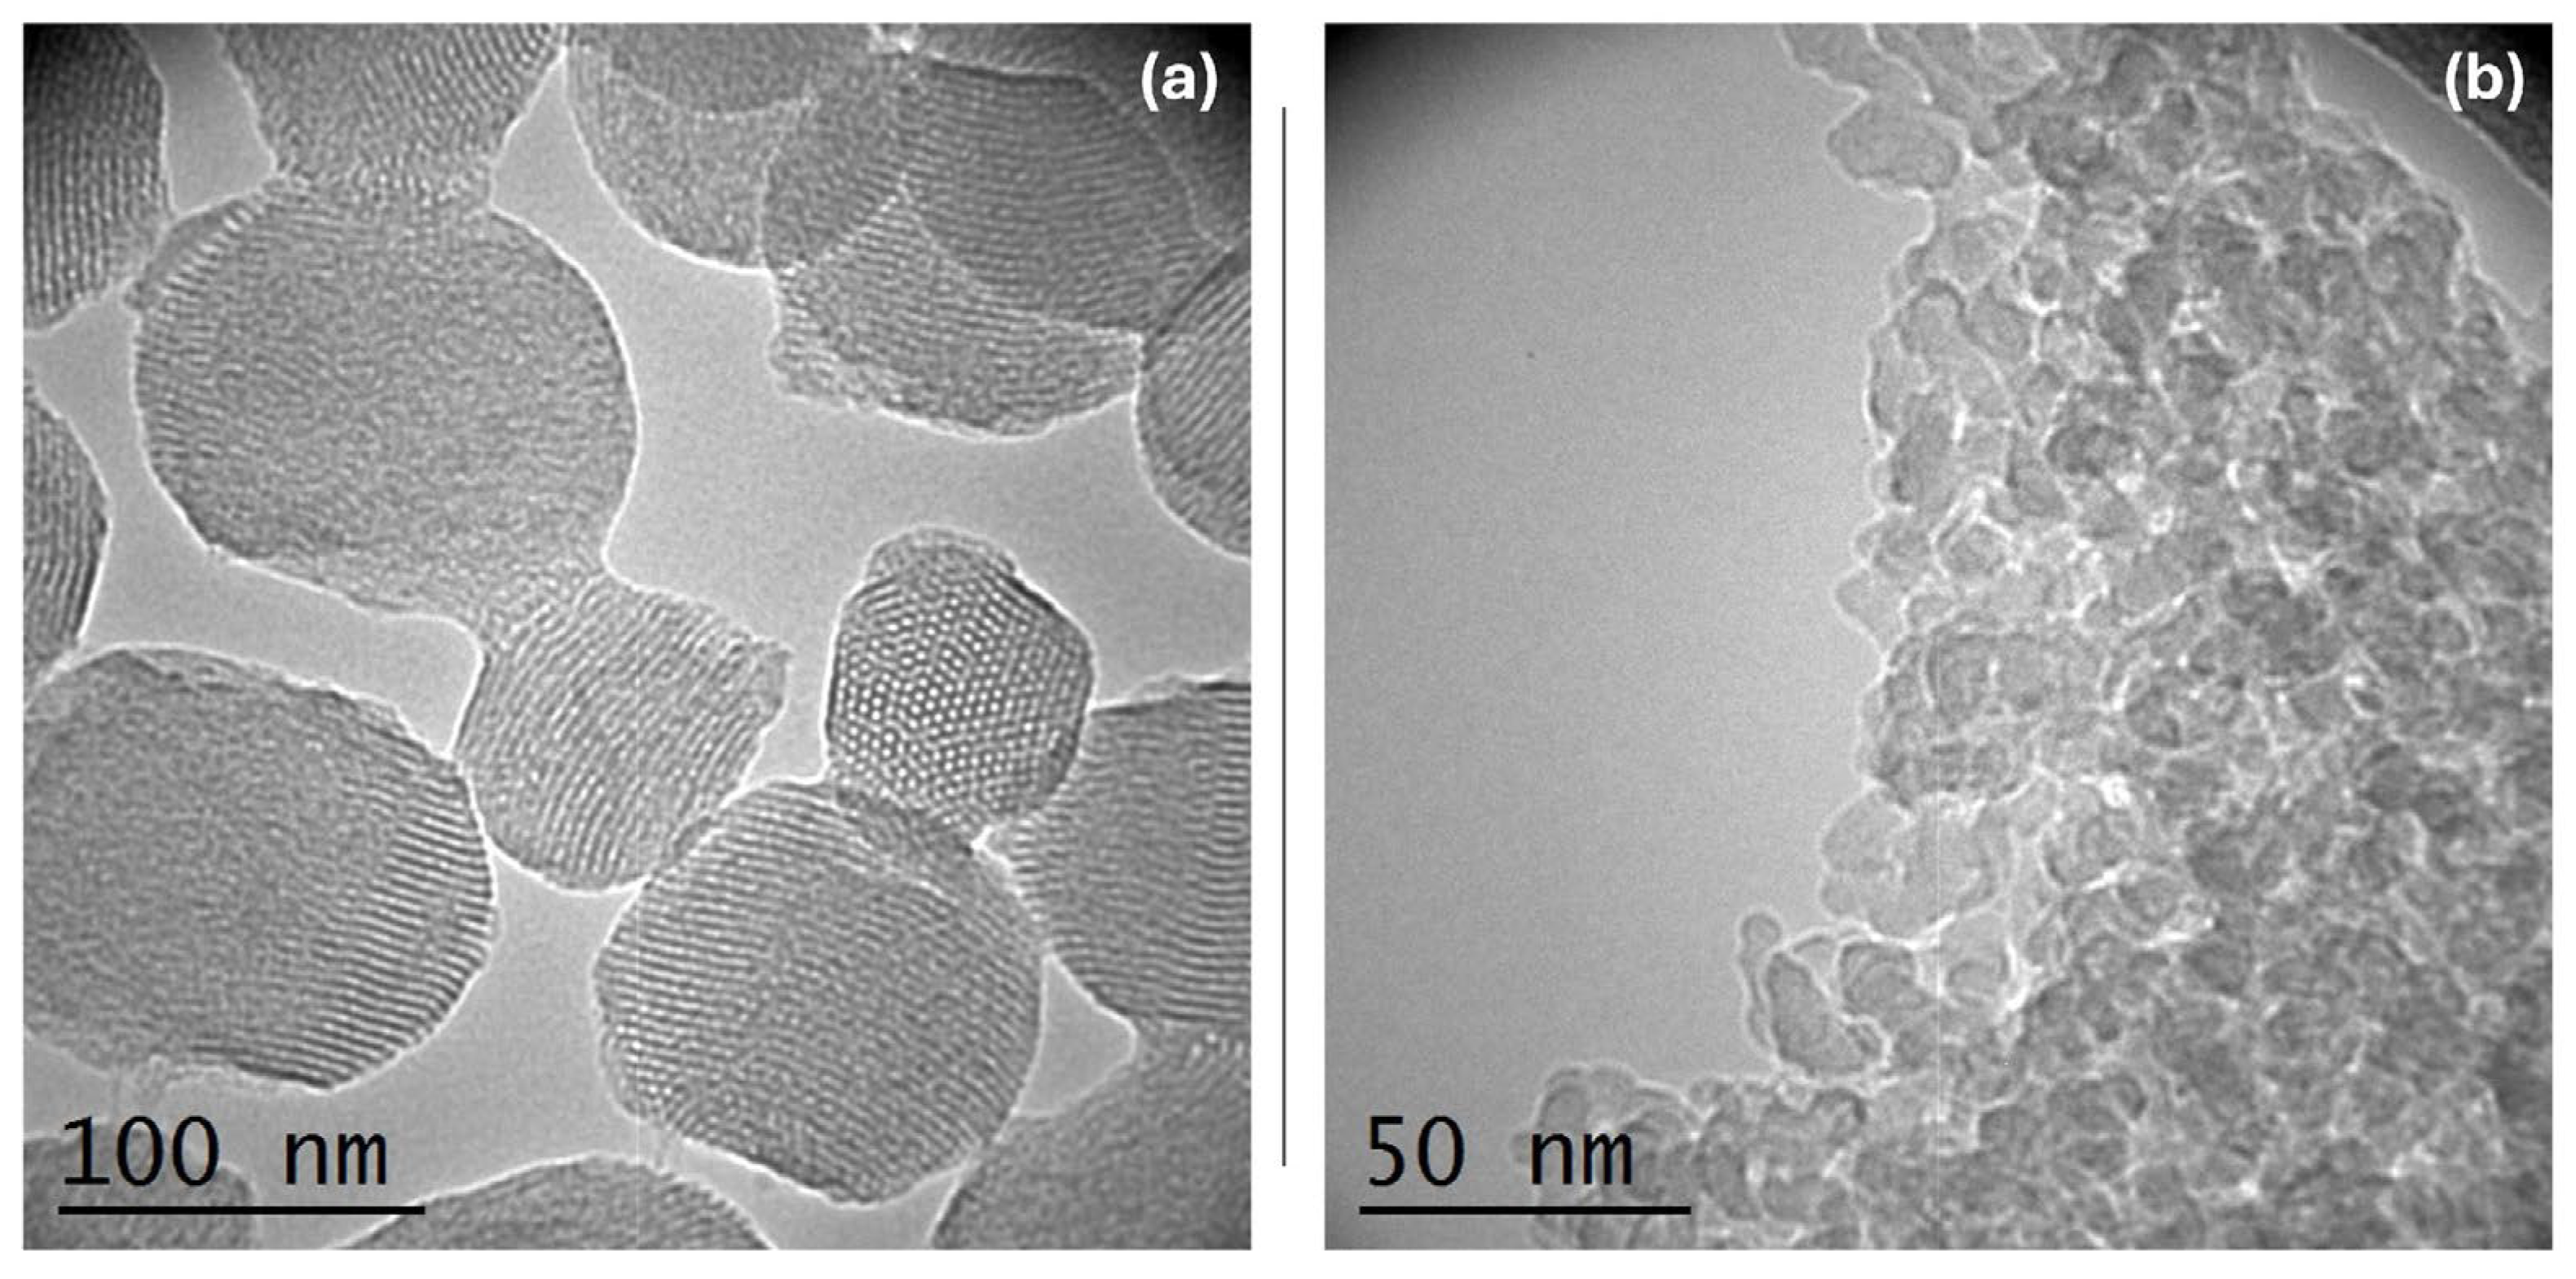
Figure 4.
SEM image with a Histogram of the size distribution versus the number of nanoparticles counted, and EDX analysis of SiO2m@Sm(tta-Si)3(phen)2.
Figure 4.
SEM image with a Histogram of the size distribution versus the number of nanoparticles counted, and EDX analysis of SiO2m@Sm(tta-Si)3(phen)2.
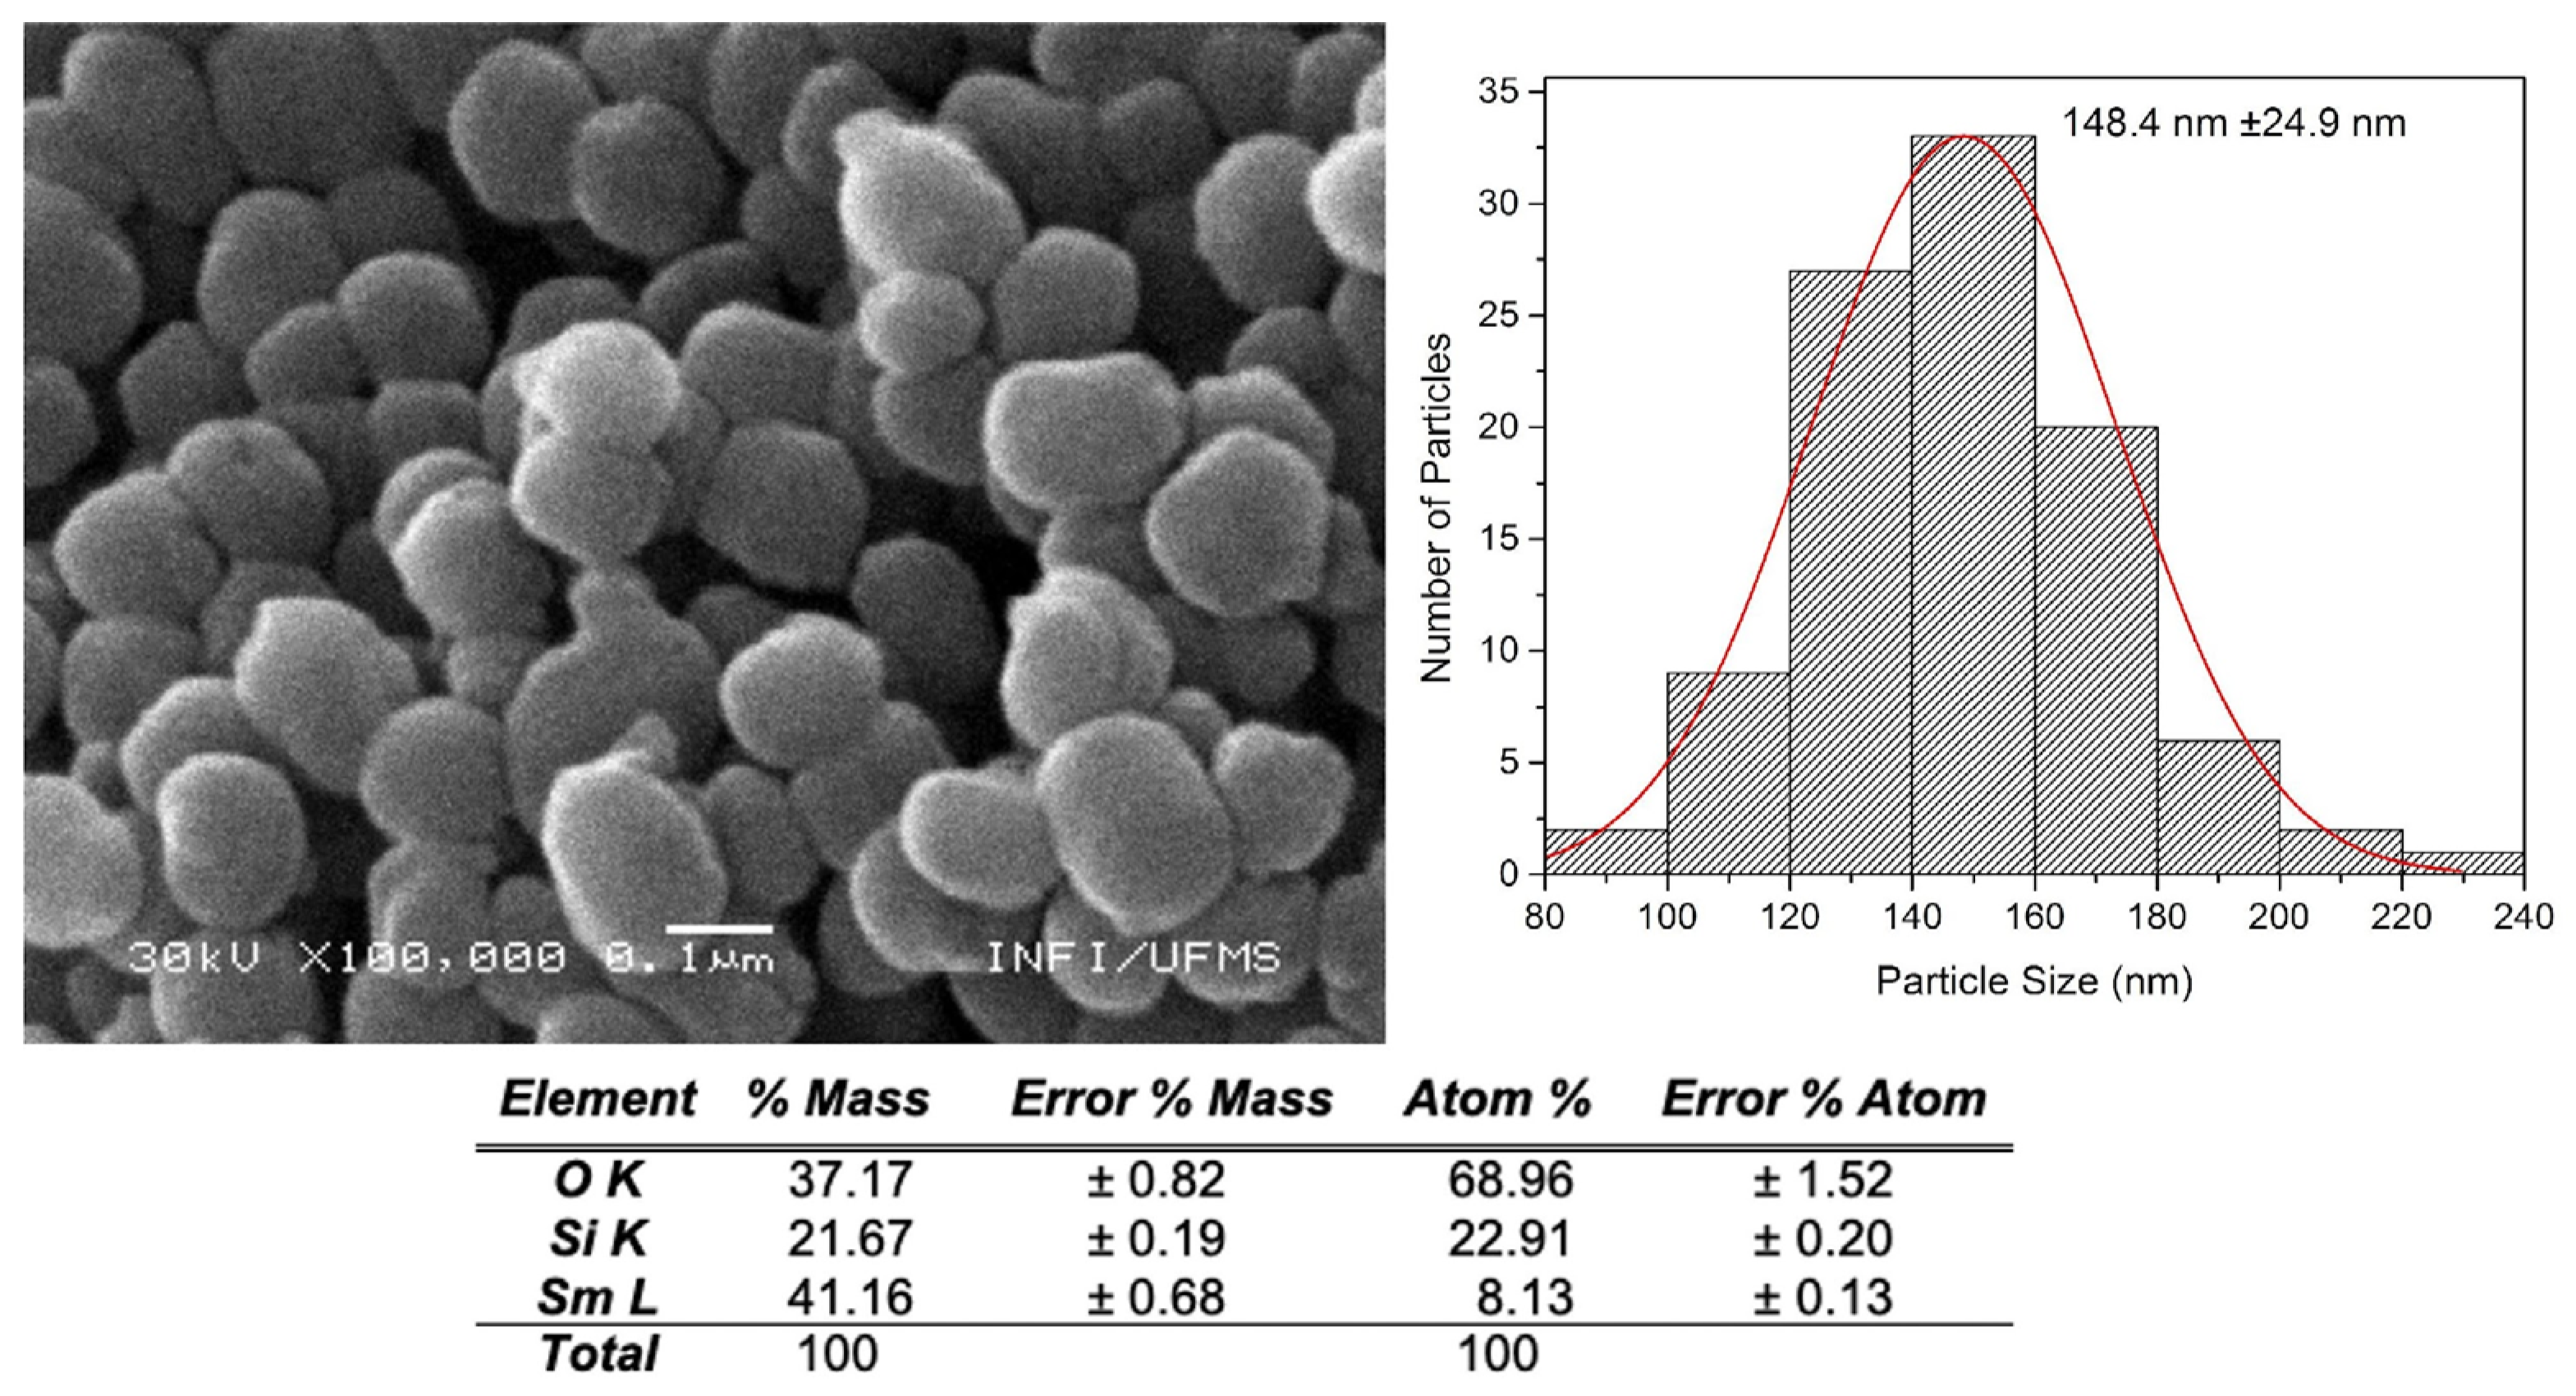
Figure 5.
SEM image with a Histogram of the size distribution versus the number of nanoparticles counted, and EDX analysis of SiO2m@Eu(tta-Si)3(phen).
Figure 5.
SEM image with a Histogram of the size distribution versus the number of nanoparticles counted, and EDX analysis of SiO2m@Eu(tta-Si)3(phen).
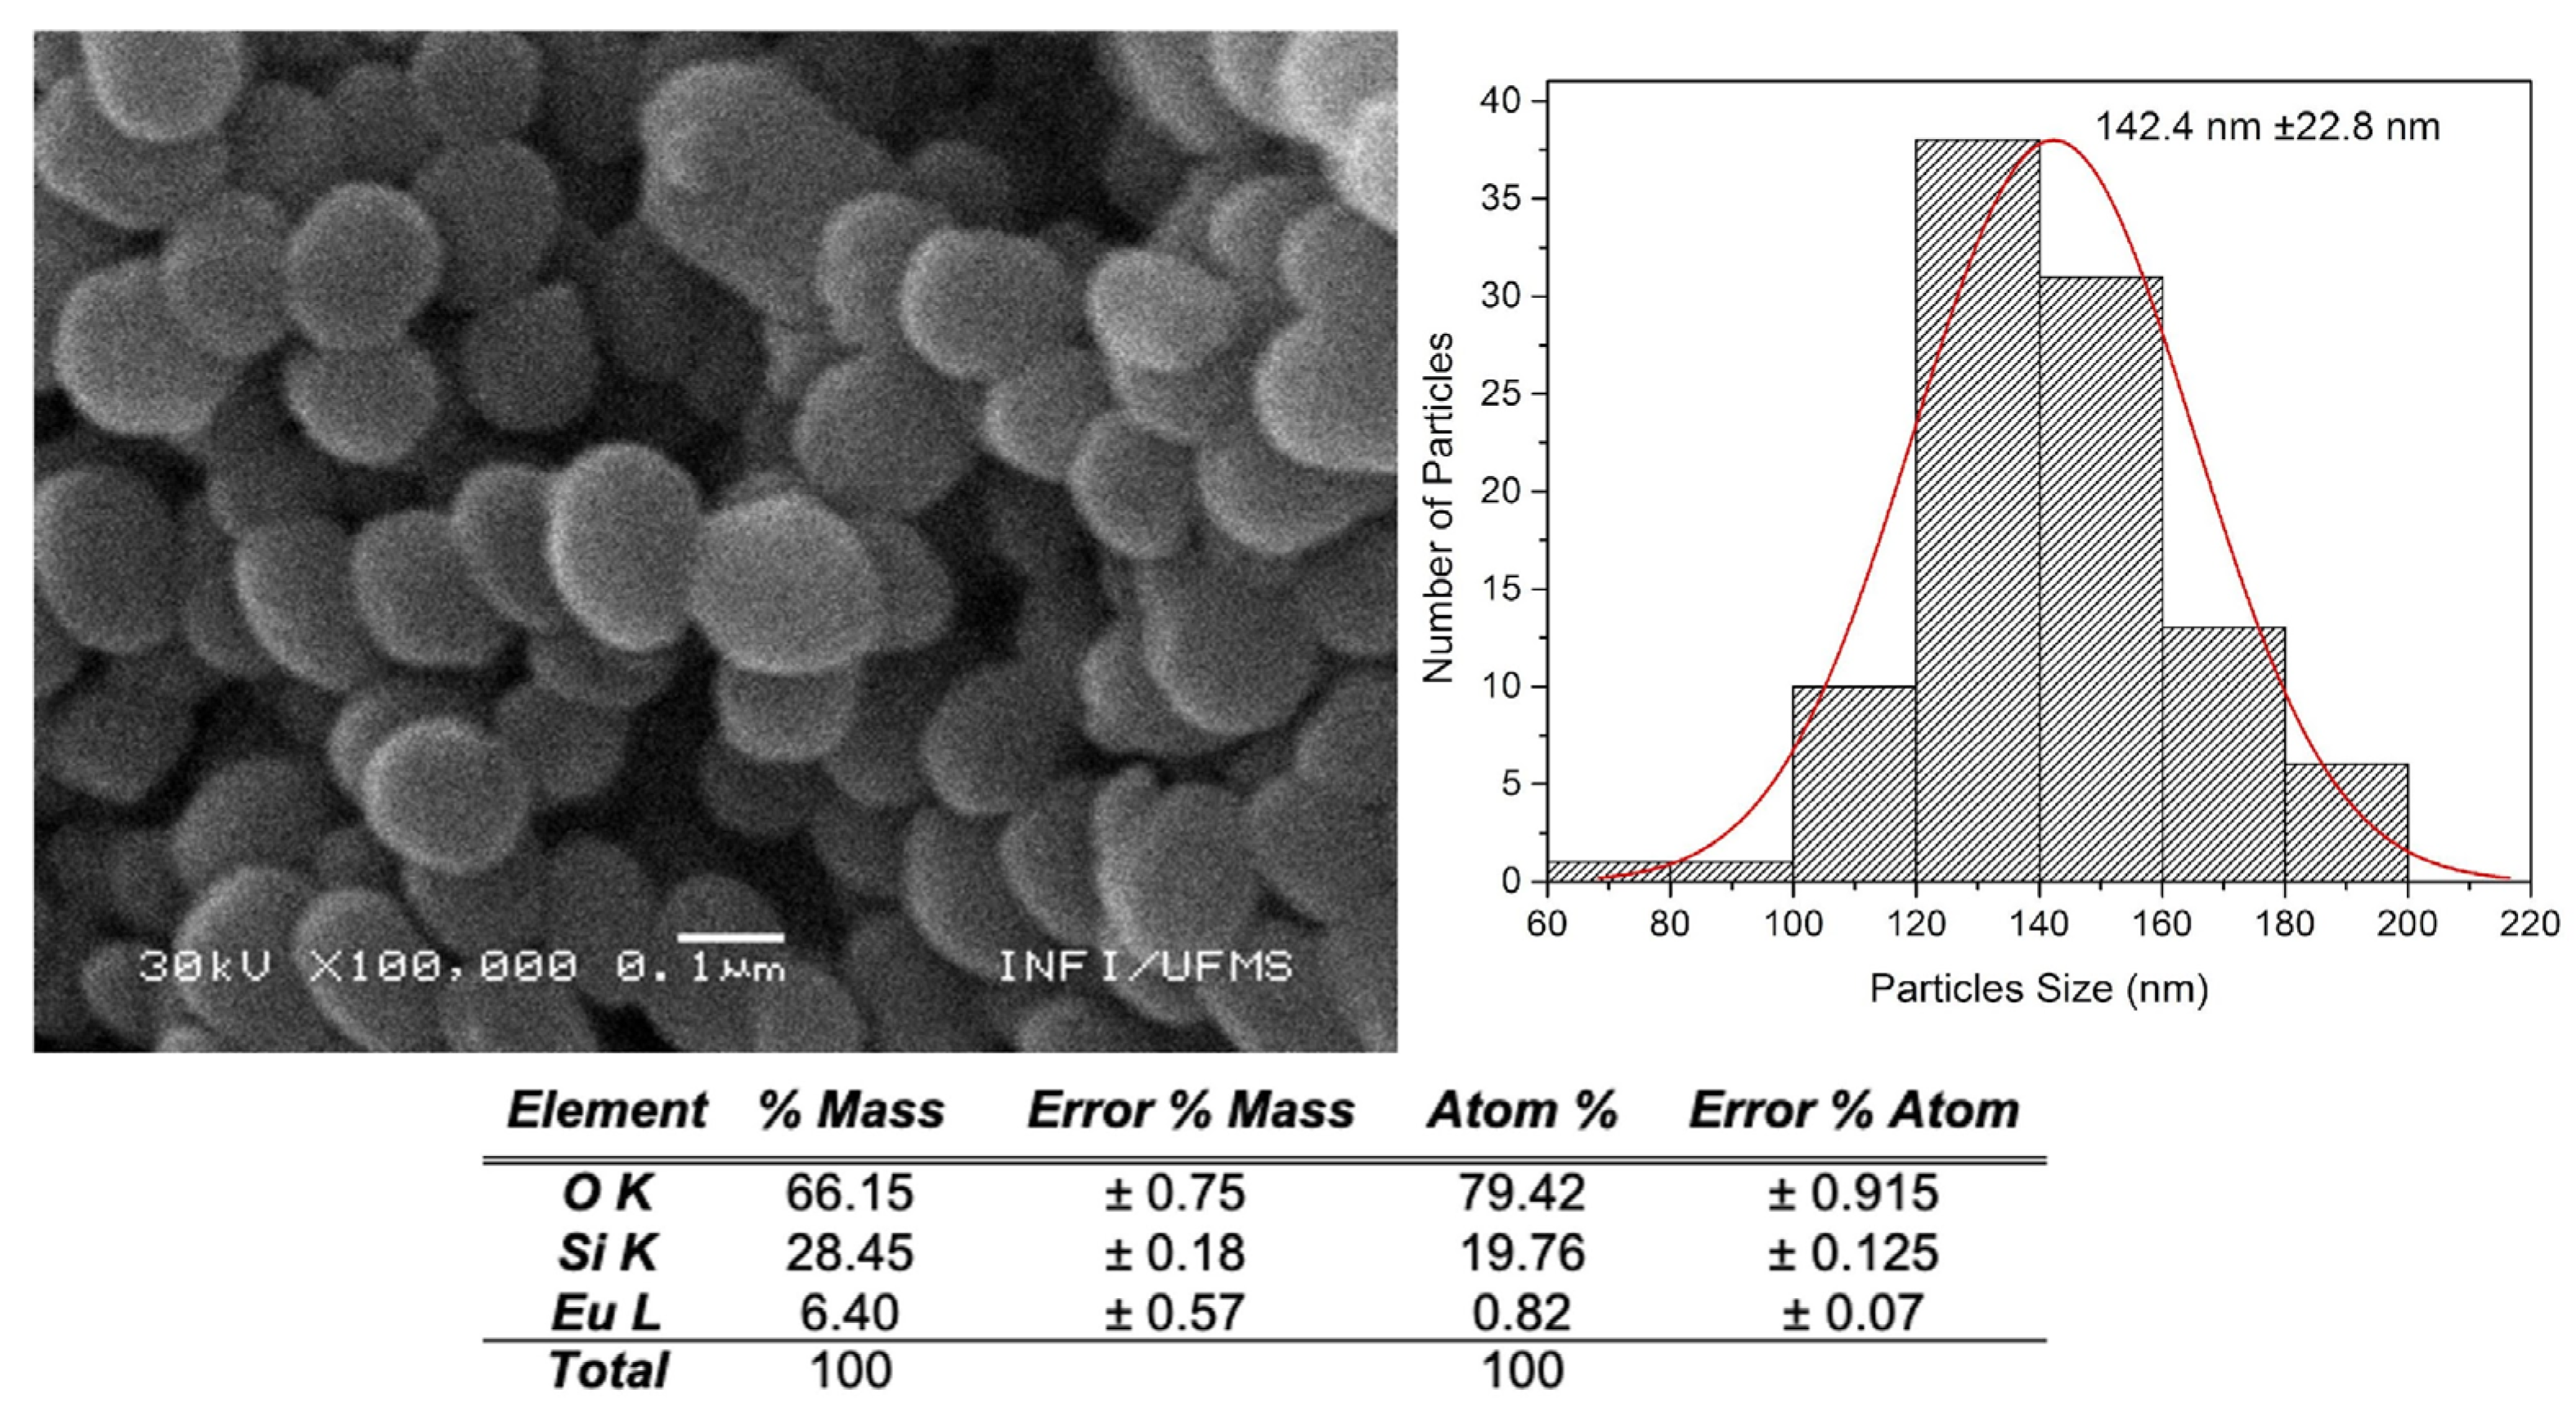
Figure 6.
SEM image with a Histogram of the size distribution versus the number of nanoparticles counted of SiO2d@Sm(tta-Si)3(phen)2.
Figure 6.
SEM image with a Histogram of the size distribution versus the number of nanoparticles counted of SiO2d@Sm(tta-Si)3(phen)2.
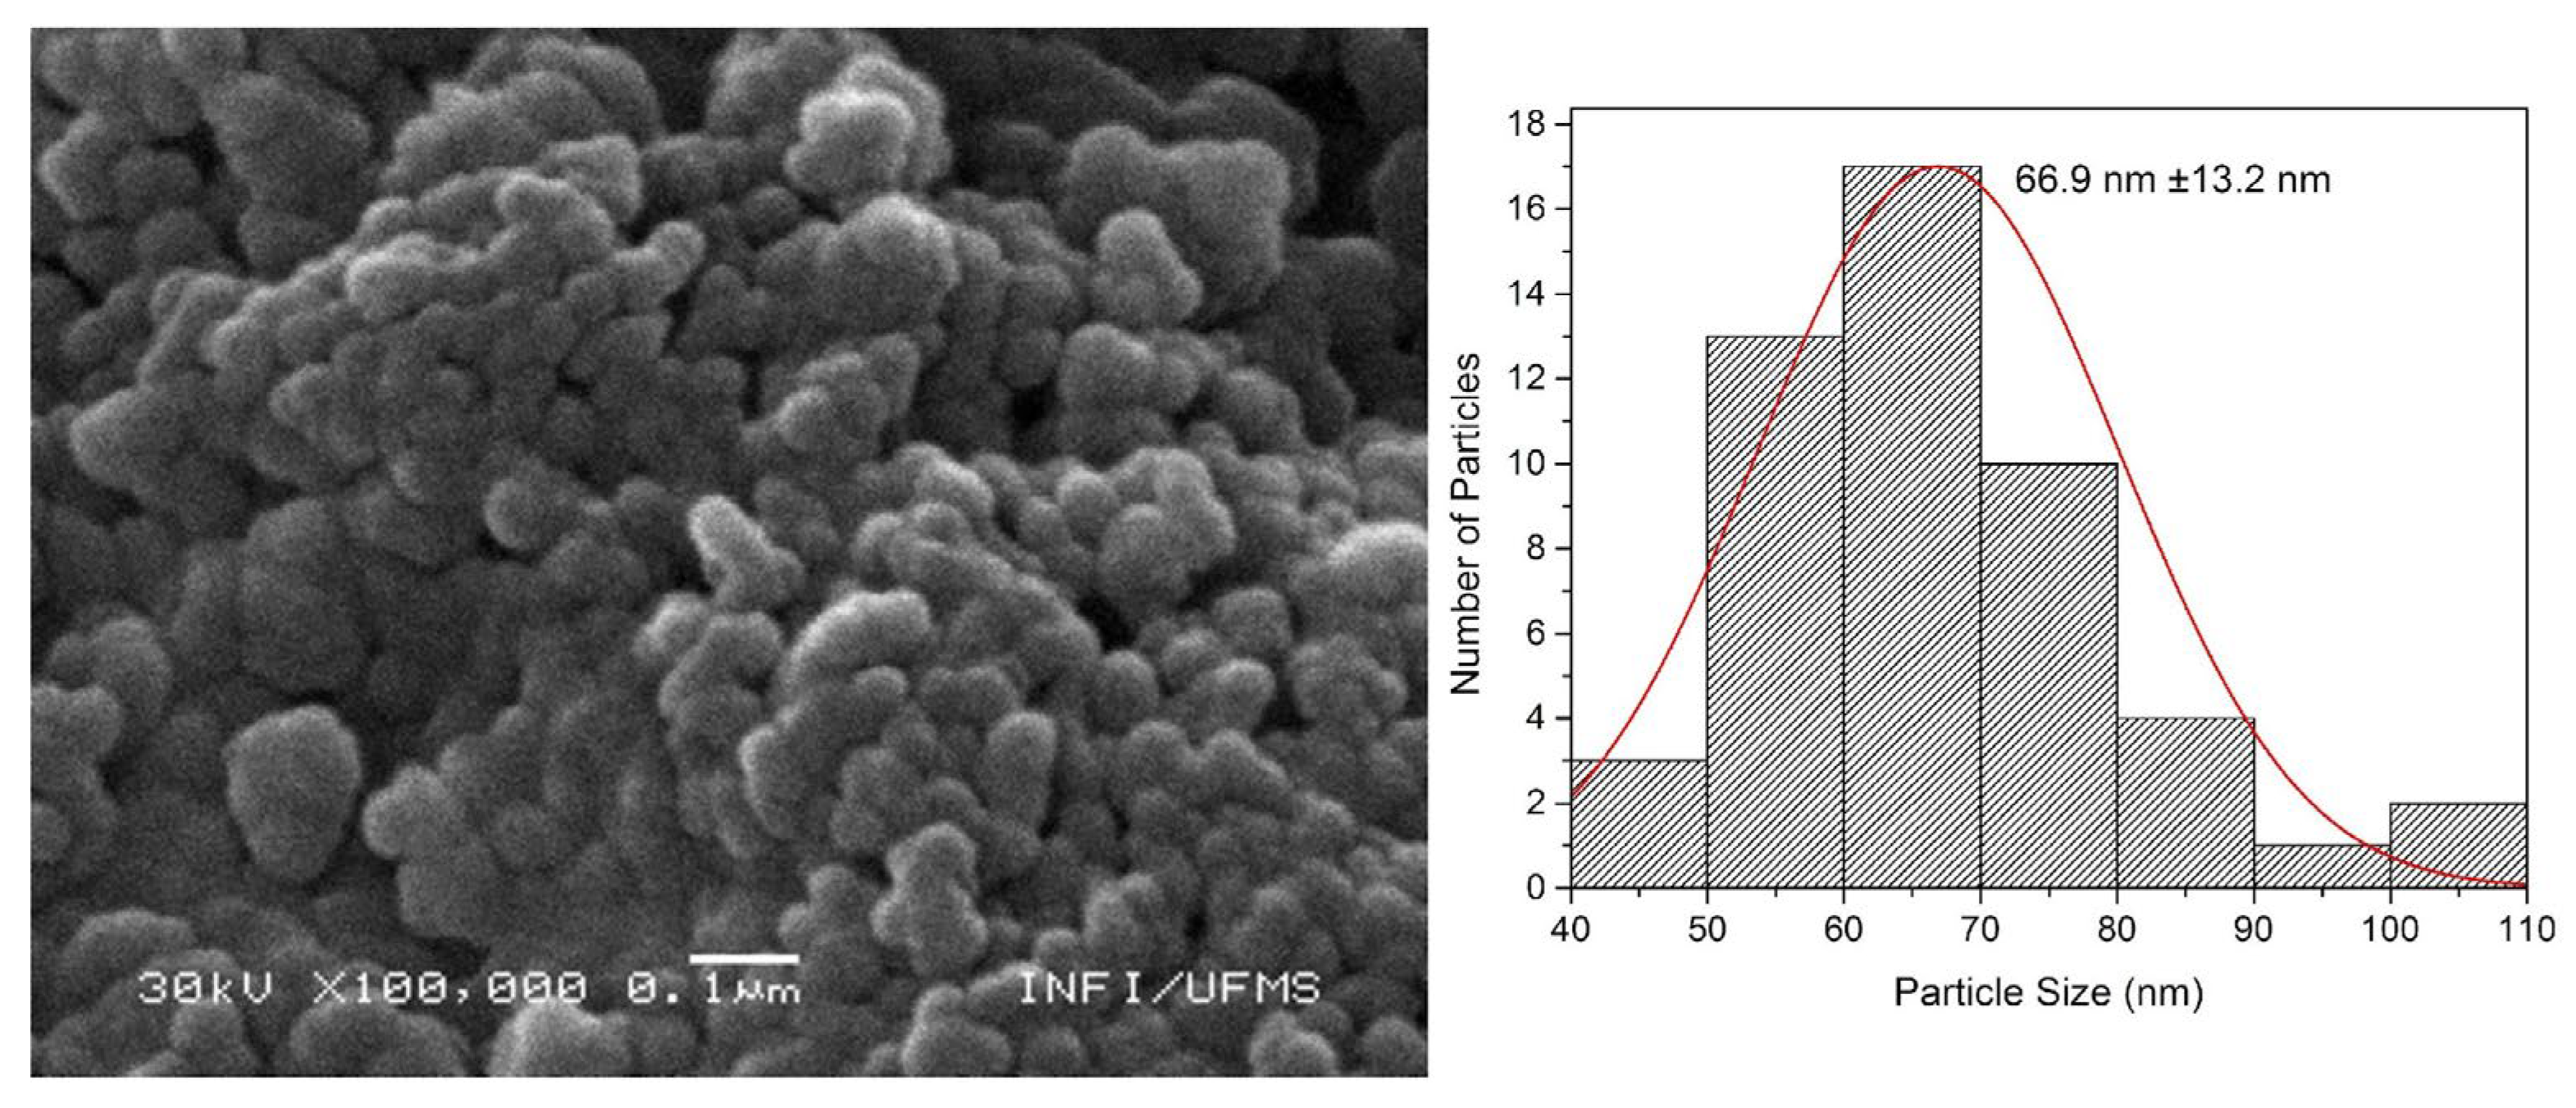
Figure 7.
SEM image with a Histogram of the size distribution versus the number of nanoparticles counted of SiO2d@Eu(tta-Si)3(phen).
Figure 7.
SEM image with a Histogram of the size distribution versus the number of nanoparticles counted of SiO2d@Eu(tta-Si)3(phen).
Scheme 1.
Synthesis of tta-Si from reaction between 2-thenoyltrifluoroacetone (tta) and 3-chloropropyltriethoxysilane (3-CPTS) as silylating agent.
Scheme 1.
Synthesis of tta-Si from reaction between 2-thenoyltrifluoroacetone (tta) and 3-chloropropyltriethoxysilane (3-CPTS) as silylating agent.
Scheme 2.
Synthesis of phen-Si from reaction between 1,10-phenanthroline monohydrate (phen) and 3-chloropropyltriethoxysilane (3-CPTS) as silylating agent.
Scheme 2.
Synthesis of phen-Si from reaction between 1,10-phenanthroline monohydrate (phen) and 3-chloropropyltriethoxysilane (3-CPTS) as silylating agent.
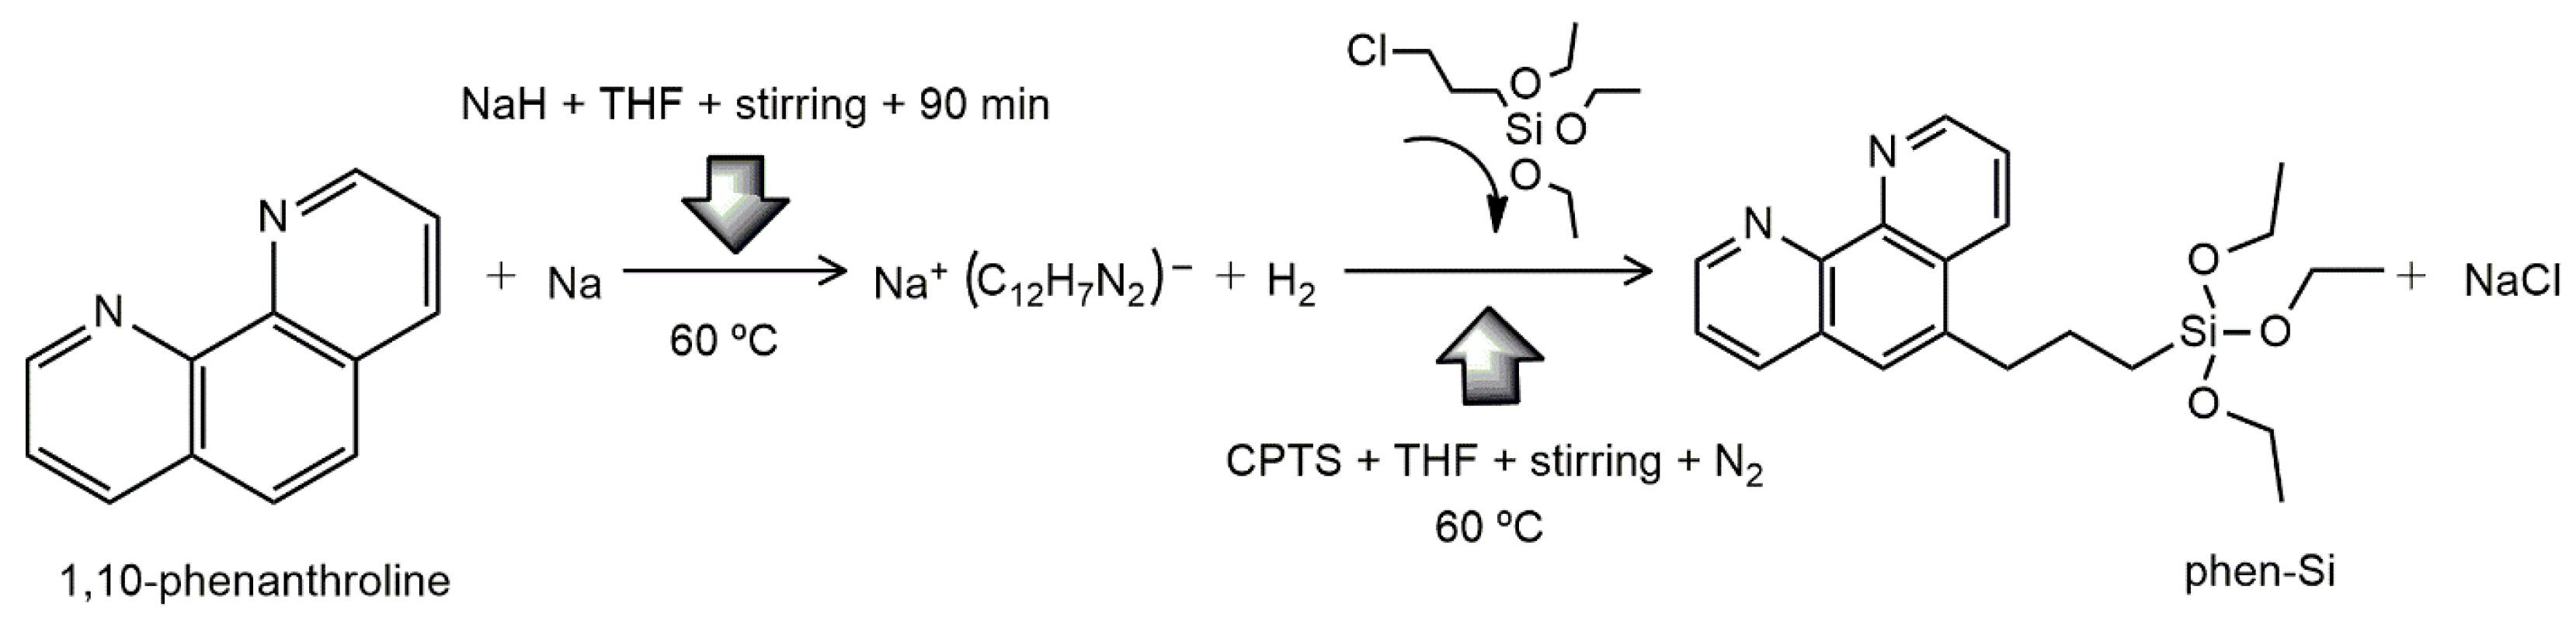

Table 1.
Experimental Lifetimes (τexp) acquired for the Sm3+ and Eu3+ silylated complexes obtained.
| Silylated Complex | τexp(ms) | Observed Transition |
|---|---|---|
| Sm(tta-Si)3(phen)2 | 0.070 | 4G5/2→6H9/21 |
| Sm(phen-Si)3(tta)2 | 0.071 | |
| Eu(tta-Si)3(phen) | 0.80 | 5D0→7F22 |
| Eu(phen-Si)3(tta) | 0.72 | |
| Eu(tta-Si)2(phen-Si)2 | 0.59 |
1 Fexc3/Fem 2; 150 flash count; initial time 0.005 nm; inc 0.01 nm. 2 Fexc/em 1; 150 flash count; initial time 0.005 nm; inc 0.01 nm.
Table 2.
Judd-Ofelt Intensity Parameters (Ω2, Ω4), Radiative Rates (Arad), Radiative and Experimental Lifetimes (τrad, τexp), and Quantum Efficiencies (q).
Table 2.
Judd-Ofelt Intensity Parameters (Ω2, Ω4), Radiative Rates (Arad), Radiative and Experimental Lifetimes (τrad, τexp), and Quantum Efficiencies (q).
| Silylated Complex* | Ω2 (x10-20 cm2) | Ω4 (x10-20 cm2) | Arad (s-1) | τexp (ms) | q |
|---|---|---|---|---|---|
| Eu(tta-Si)3(phen) | 18.20 | 6.63 | 248.7 | 3.21 | 0.80 |
| Eu(phen-Si)3(tta) | 18.34 | 6.56 | 250.7 | 3.19 | 0.72 |
| Eu(tta-Si)2(phen-Si)2 | 17.97 | 6.78 | 245.7 | 3.23 | 0.59 |
*Values obtained using JOES software developed by Ćirić et al. (2019) [17].
Table 3.
DLS values for the hydrodynamic diameter and Zeta Potential (ZP) of mesoporous silica nanoparticles (MSNs and DSNs) and silica nanoparticles containing the complexes Sm(tta-Si)3(phen)2 and Eu(tta-Si)3(phen).
Table 3.
DLS values for the hydrodynamic diameter and Zeta Potential (ZP) of mesoporous silica nanoparticles (MSNs and DSNs) and silica nanoparticles containing the complexes Sm(tta-Si)3(phen)2 and Eu(tta-Si)3(phen).
| Sample | Dh (nm) | ZP (mV)* |
|---|---|---|
| MSNs | 230 ±86 | -24,3 ±8,7 |
| SiO2m@Sm(tta-Si)3(phen)2 | 280 ±48 | -15,3 ±5,3 |
| SiO2m@Eu(tta-Si)3(phen) | 255 ±47 | -14,3 ±5,4 |
| DSNs | 79 ±64 | -11,5 ±7,0 |
| SiO2d@Sm(tta-Si)3(phen)2 | 43 ±6 | -26,1 ±6,83 |
| SiO2d@Eu(tta-Si)3(phen) | 76 ±21 | -15,7 ±4,57 |
* Dh denotes Hydrodynamic Diameter. ZP values obtained in pH 6.5.
Table 4.
Values for porosity and surface area measurements of the MSNs, SiO2m@Sm(tta-Si)3(phen)2, SiO2m@Eu(tta-Si)3(phen), SiO2d@Sm(tta-Si)3(phen)2, and SiO2d@Eu(tta-Si)3(phen).
Table 4.
Values for porosity and surface area measurements of the MSNs, SiO2m@Sm(tta-Si)3(phen)2, SiO2m@Eu(tta-Si)3(phen), SiO2d@Sm(tta-Si)3(phen)2, and SiO2d@Eu(tta-Si)3(phen).
| Sample | as,BET(m2 g-1)* | Dpores (nm) | Vpores (p/po) (cm3 g-1) | apore,BJH (m2 g-1)** |
|---|---|---|---|---|
| MSNs | 913.29 | 4.78 | 1.09 | 962.75 |
| SiO2m@Sm(tta-Si)3(phen)2 | 408.43 | 4.15 | 0.42 | 269.74 |
| SiO2m@Eu(tta-Si)3(phen) | 442.36 | 4.16 | 0.46 | 403.33 |
| SiO2d@Sm(tta-Si)3(phen)2 | 157.07 | 11.29 | 0.44 | 159.46 |
| SiO2d@Eu(tta-Si)3(phen) | 229.69 | 7.86 | 0.45 | 242.78 |
* Values of surface area measurements acquired using Brunauer-Emmett-Teller (BET) method. ** Values of porosity measurements acquired using Barrett-Joyner-Halenda (BJH) method.
Table 5.
IC50 values of Sm(tta-Si)3(phen)2, Eu(tta-Si)3(phen), SiO2m@Sm(tta-Si)3(phen)2, and SiO2m@Eu(tta-Si)3(phen) on NIH-3T3 (healthy murine fibroblast cells), 4T1 (mammary carcinoma BALB/cfC3H mice), B16F10 (murine melanoma), and A431 (human epidermoid carcinoma) cell lines after 24 hours of treatment.
| Sample* | Cell lines (IC50 µg mL-1) | |||
|---|---|---|---|---|
| 4T1 | B16F10 | A431 | NIH-3T3 | |
| Eu(tta-Si)3(phen) | 30.8 | 45.3 | 15.3 | 87.0 |
| SiO2m@Sm(tta-Si)3(phen)2 | 40.9 | 49.9 | 24.7 | 108.8 |
| Sm(tta-Si)3(phen)2 | 34.6 | 24.9 | 9.8 | - |
| SiO2m@Eu(tta-Si)3(phen) | 195.3 | 169.6 | 102.7 | 236.5 |
*All samples were dissolved in DMSO before preparing the solutions at the concentrations specified in the table, in supplemented culture medium.
Disclaimer/Publisher’s Note: The statements, opinions and data contained in all publications are solely those of the individual author(s) and contributor(s) and not of MDPI and/or the editor(s). MDPI and/or the editor(s) disclaim responsibility for any injury to people or property resulting from any ideas, methods, instructions or products referred to in the content. |
© 2024 by the authors. Licensee MDPI, Basel, Switzerland. This article is an open access article distributed under the terms and conditions of the Creative Commons Attribution (CC BY) license (http://creativecommons.org/licenses/by/4.0/).
Copyright: This open access article is published under a Creative Commons CC BY 4.0 license, which permit the free download, distribution, and reuse, provided that the author and preprint are cited in any reuse.


