

Submitted:
01 June 2024
Posted:
03 June 2024
You are already at the latest version
Abstract
The increasing deployment of intermittent renewable energy sources necessitates effective methods for balancing the electrical grid to ensure stability and safety. Energy storage systems that can store excess electrical power during periods of low demand and release it during high demand are crucial for both short-term and long-term applications. Power-to-Gas is an innovative energy storage solution that converts surplus renewable electricity into gas fuels, such as hydrogen, which can be stored and used later. This hydrogen can serve multiple purposes, including energy storage and as fuel for transportation modes like cars, trams, trains, and buses. While most hydrogen today is derived from fossil fuels, solid-oxide electrolysis (SOE) offers a cleaner alternative by producing hydrogen without harmful emissions. SOE is also the most efficient method of electrolysis. This study aims to determine the operational parameters for an SOE system, including lower heating value (LHV)-based efficiency and total input power, using a mathematical model. Results are presented for three different operating temperatures and four different steam utilization ratios. The paper is structured as follows: the introduction provides the context and motivation for the study; the second section outlines the fundamentals of electrolysis and its various types; the third section delves into solid-oxide electrolysis and electrolyser systems; the fourth section describes the methodology, including the mathematical formulation and simulation software used; the fifth section presents the calculation results and conclusions; and the final section summarizes the findings.
Keywords:
energy storage
; hydrogen
; electrolysis
; solid-oxide
; SOE
; fuel cells
1. Introduction
The modern world faces numerous environmental challenges, among which the greenhouse effect, driven by increasing levels of greenhouse gases such as CO2, stands out. The energy and transport sectors are the primary contributors to global CO2 emissions. Between 1970 and 2010, emissions from energy production tripled, while those from transportation doubled [1]. In addition to greenhouse gas emissions, many cities grapple with smog, largely attributed to "low emission" sources and the transport sector. Transitioning to alternative fuels offers a potential partial solution to these issues. Hydrogen, for instance, is an environmentally friendly fuel because it generates zero emissions when its chemical energy is converted into electricity or heat; the only byproduct is pure water.
Currently, hydrogen is utilized in both the energy and transport sectors, although its share as an energy carrier remains low compared to other technologies and fuels. In transportation, hydrogen powers various vehicles, such as cars, trucks, trams, and buses, through fuel cells that produce electricity. Additionally, hydrogen and fuel cells are used in power generation to produce both electrical and thermal energy. Fuel cells can also incorporate reformers to utilize other gases like methane, although this process does release emissions. However, the high efficiency of fuel cells ensures these emissions are minimal.
Hydrogen is also a highly attractive energy storage medium due to its high energy density when compressed to high pressures. However, unlike fossil fuels, hydrogen must be produced before use. Electrolysis, a method gaining significant attention, particularly in conjunction with Renewable Energy Sources (RES), is a promising technique for hydrogen production. This method is integral to the Power-to-Gas (P2G) technology, which involves generating electricity from RES, using it to produce hydrogen or methane, and subsequently storing it. Some proposals suggest utilizing existing gas infrastructure for the storage and transportation of hydrogen or methane. Hydrogen produced through P2G could also serve as a fuel for local vehicles, including cars, trams, and buses.
Currently, around 95% of global hydrogen production is achieved through steam methane reforming, a method that generates emissions and results in limited purity levels of the hydrogen produced. In contrast, the electrolysis process yields hydrogen of very high purity and, when coupled with Renewable Energy Sources (RES), is completely free of emissions. Among electrolysis methods, high-temperature solid oxide electrolysis stands out for its potential efficiency, although it is not yet fully developed and requires further research to reach a high maturity level.
At present, hydrogen is primarily produced for use in the chemical industry, and global demand for hydrogen has been rising steadily, with expectations for continued growth [2]. Energy storage technologies currently face limitations due to low technological maturity, particularly for grid-scale applications and long-duration storage, where hydro pumped storage plants are the only widely used solution. However, this method is constrained by geographical factors, necessitating the development of novel technologies.
Storing energy in the form of chemical energy in hydrogen is viable for both small and large-scale applications. The Power-to-Gas (P2G) concept involves producing gas from electricity for energy storage, which can significantly contribute to achieving a decarbonized and emissions-free economy when coupled with RES. The gas produced in this process is hydrogen, which can be further converted into other gases such as methane through the Sabatier reaction. The resulting fuel can drive power systems, such as fuel cells, according to the Gas-to-Power (G2P) concept, and can also be used for automotive purposes.
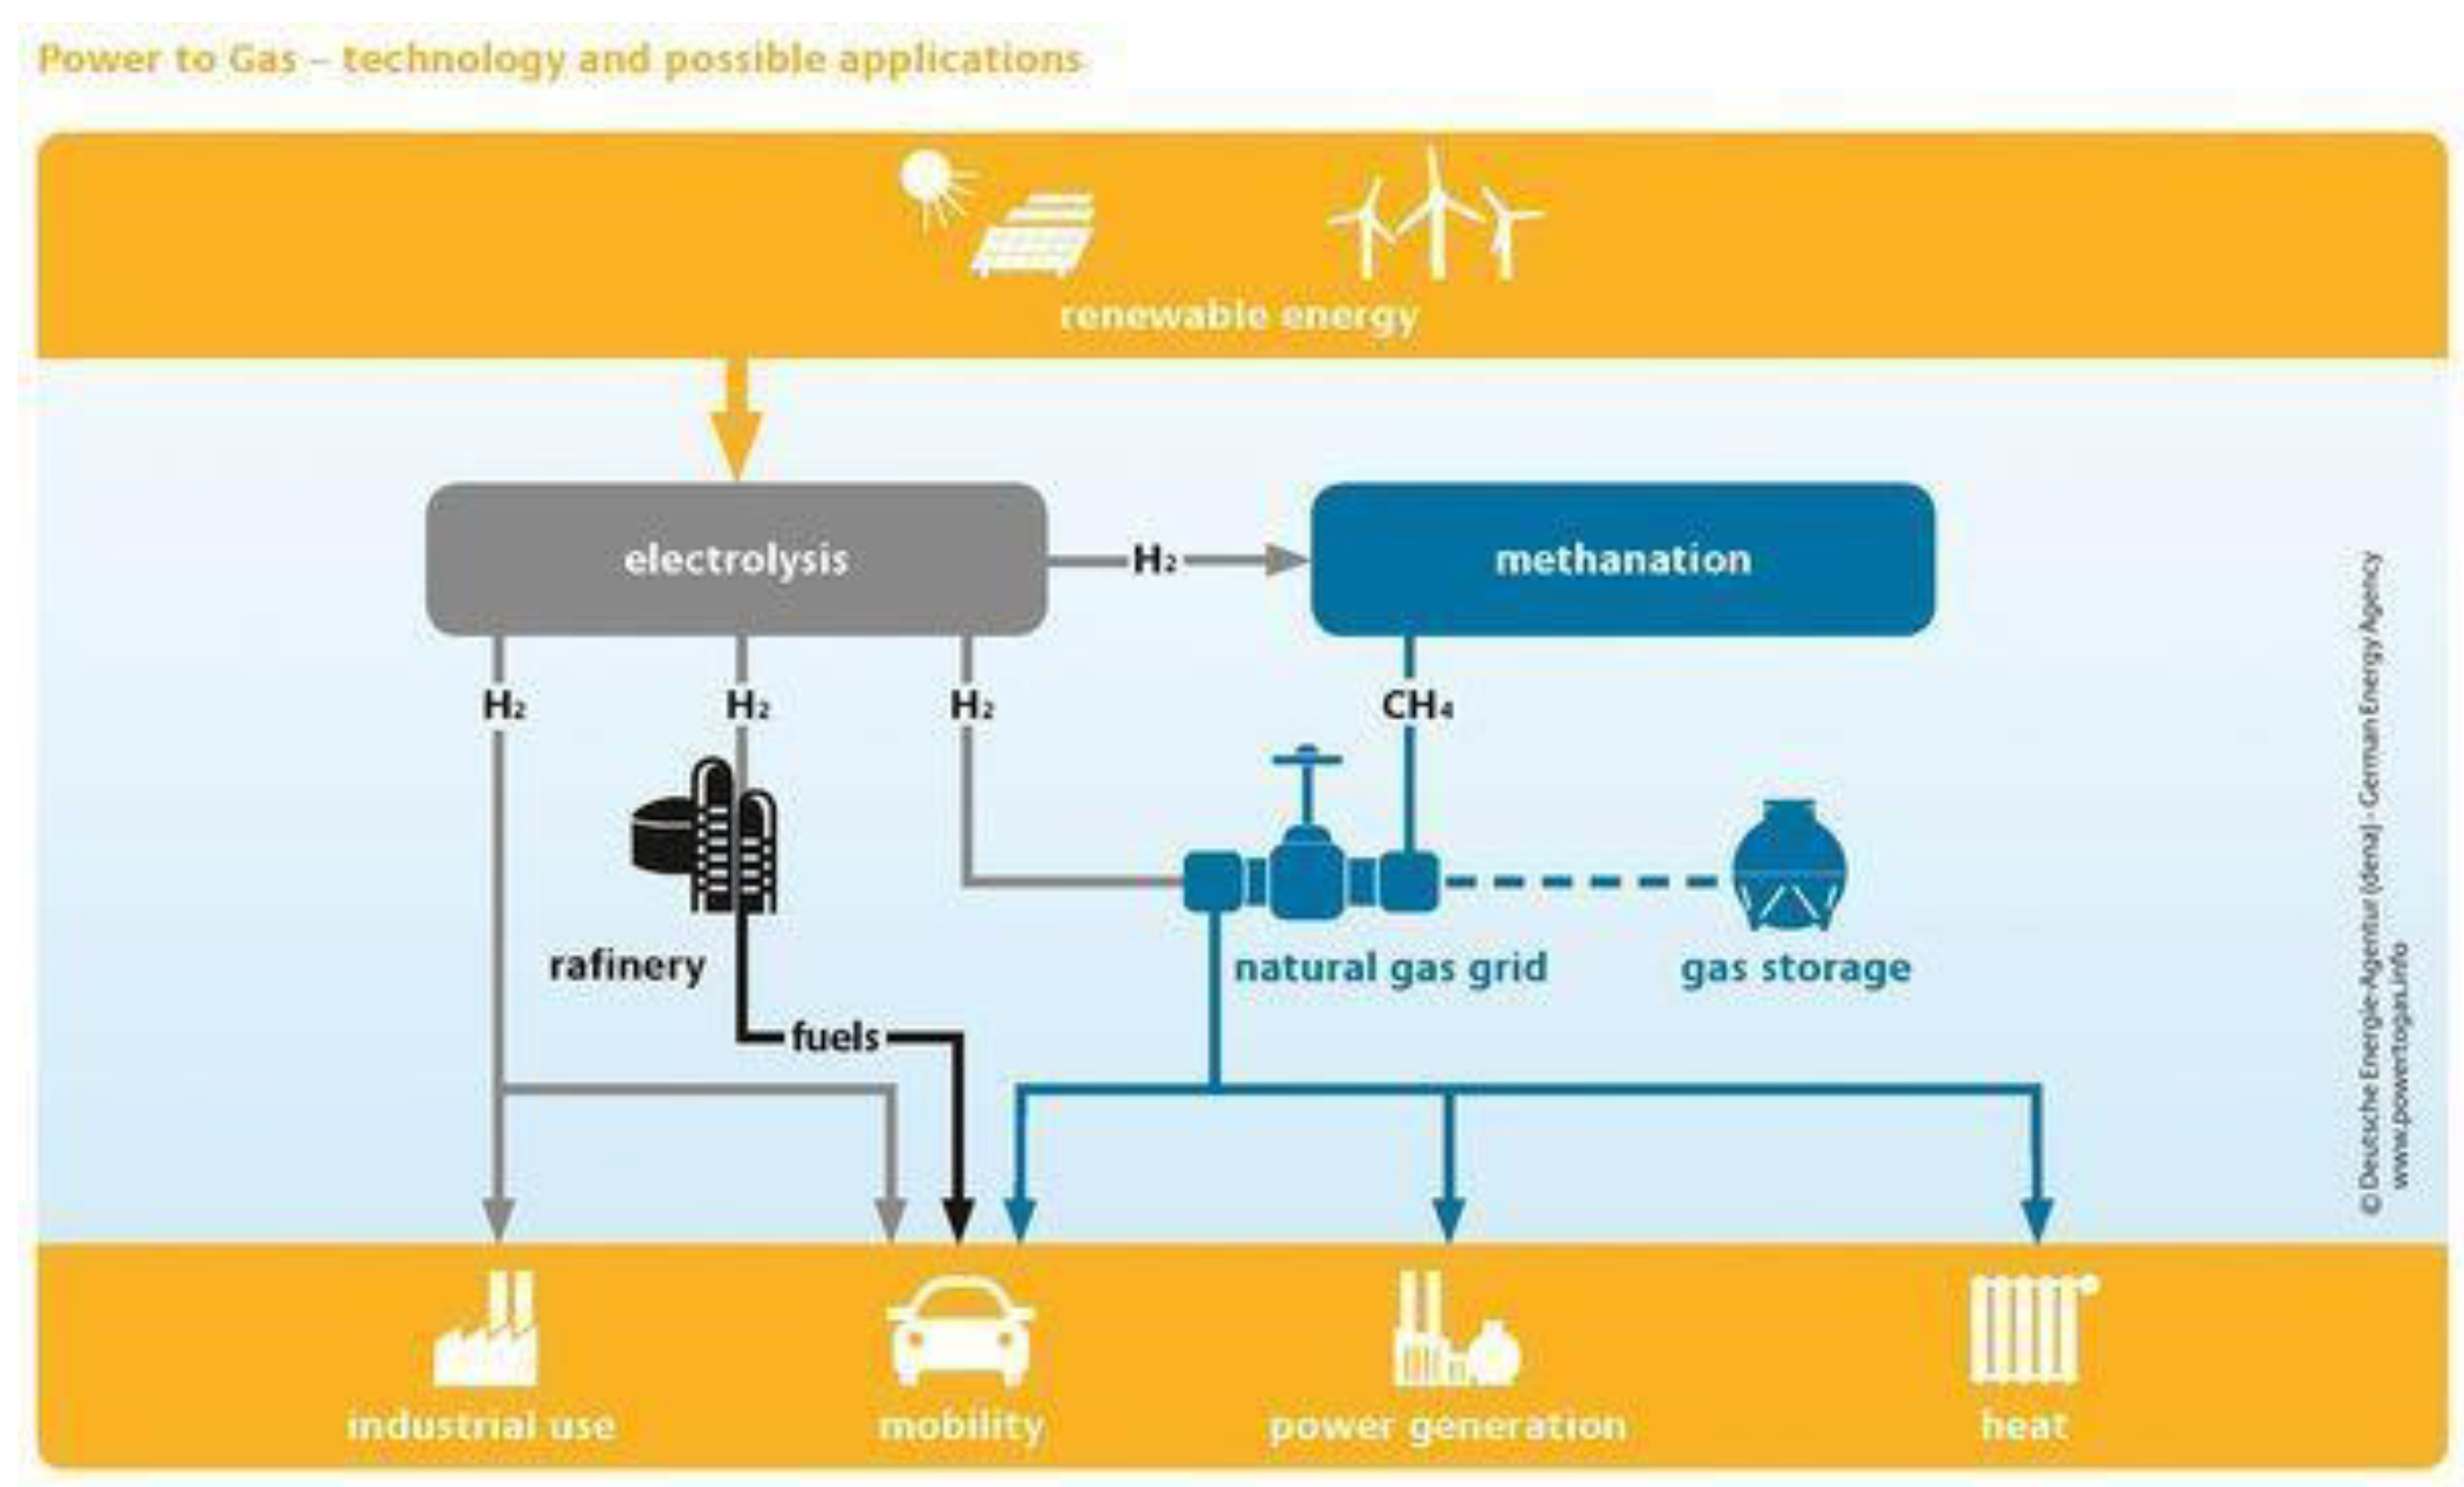
Methane produced via P2G can be injected into existing gas pipelines without the need for infrastructure modifications required for pure hydrogen. Alternatively, hydrogen can be mixed with natural gas for use in existing pipelines. A schematic of the potential applications of P2G and G2P technology is illustrated in Figure 1.
Figure 1.
Power-to-Gas and Gas-to-Power scheme [3].
Figure 1.
Power-to-Gas and Gas-to-Power scheme [3].
The Power-to-Gas (P2G) concept receives support from numerous institutions, both private and public. A notable example is the Fuel Cells and Hydrogen Joint Undertaking (FCH JU), a European public-private partnership dedicated to supporting hydrogen-related activities aimed at achieving an emissions-free economy, particularly in the energy and transport sectors [4].
The development of efficient and convenient P2G technology is crucial, especially as hydrogen-fueled transportation gains popularity. In several countries, hydrogen-powered cars are already in everyday use. For instance, Japan currently has 2,400 hydrogen cars and 101 fueling stations, with government plans to increase these numbers to 40,000 cars and 180 stations by 2020 [5]. The first mass-produced hydrogen fuel cell car, the Toyota Mirai, was introduced in 2014. It can store up to 5 kg of hydrogen at a pressure of 70 MPa, with an output power of 114 kW, allowing for a maximum speed of 178 km/h [6]. Japan has also pioneered the concept of a "Hydrogen Society," an economy where the primary energy carrier is clean hydrogen. Home-scale combined heat and power (CHP) fuel cell units, such as the ENE-FARM series by Aisin Seki, are already in use, providing electrical and thermal power for households, with excess power fed back into the grid. These units achieve an electrical efficiency of 46.5% and an overall efficiency of 90%, with a nominal power output of 700 W [7].
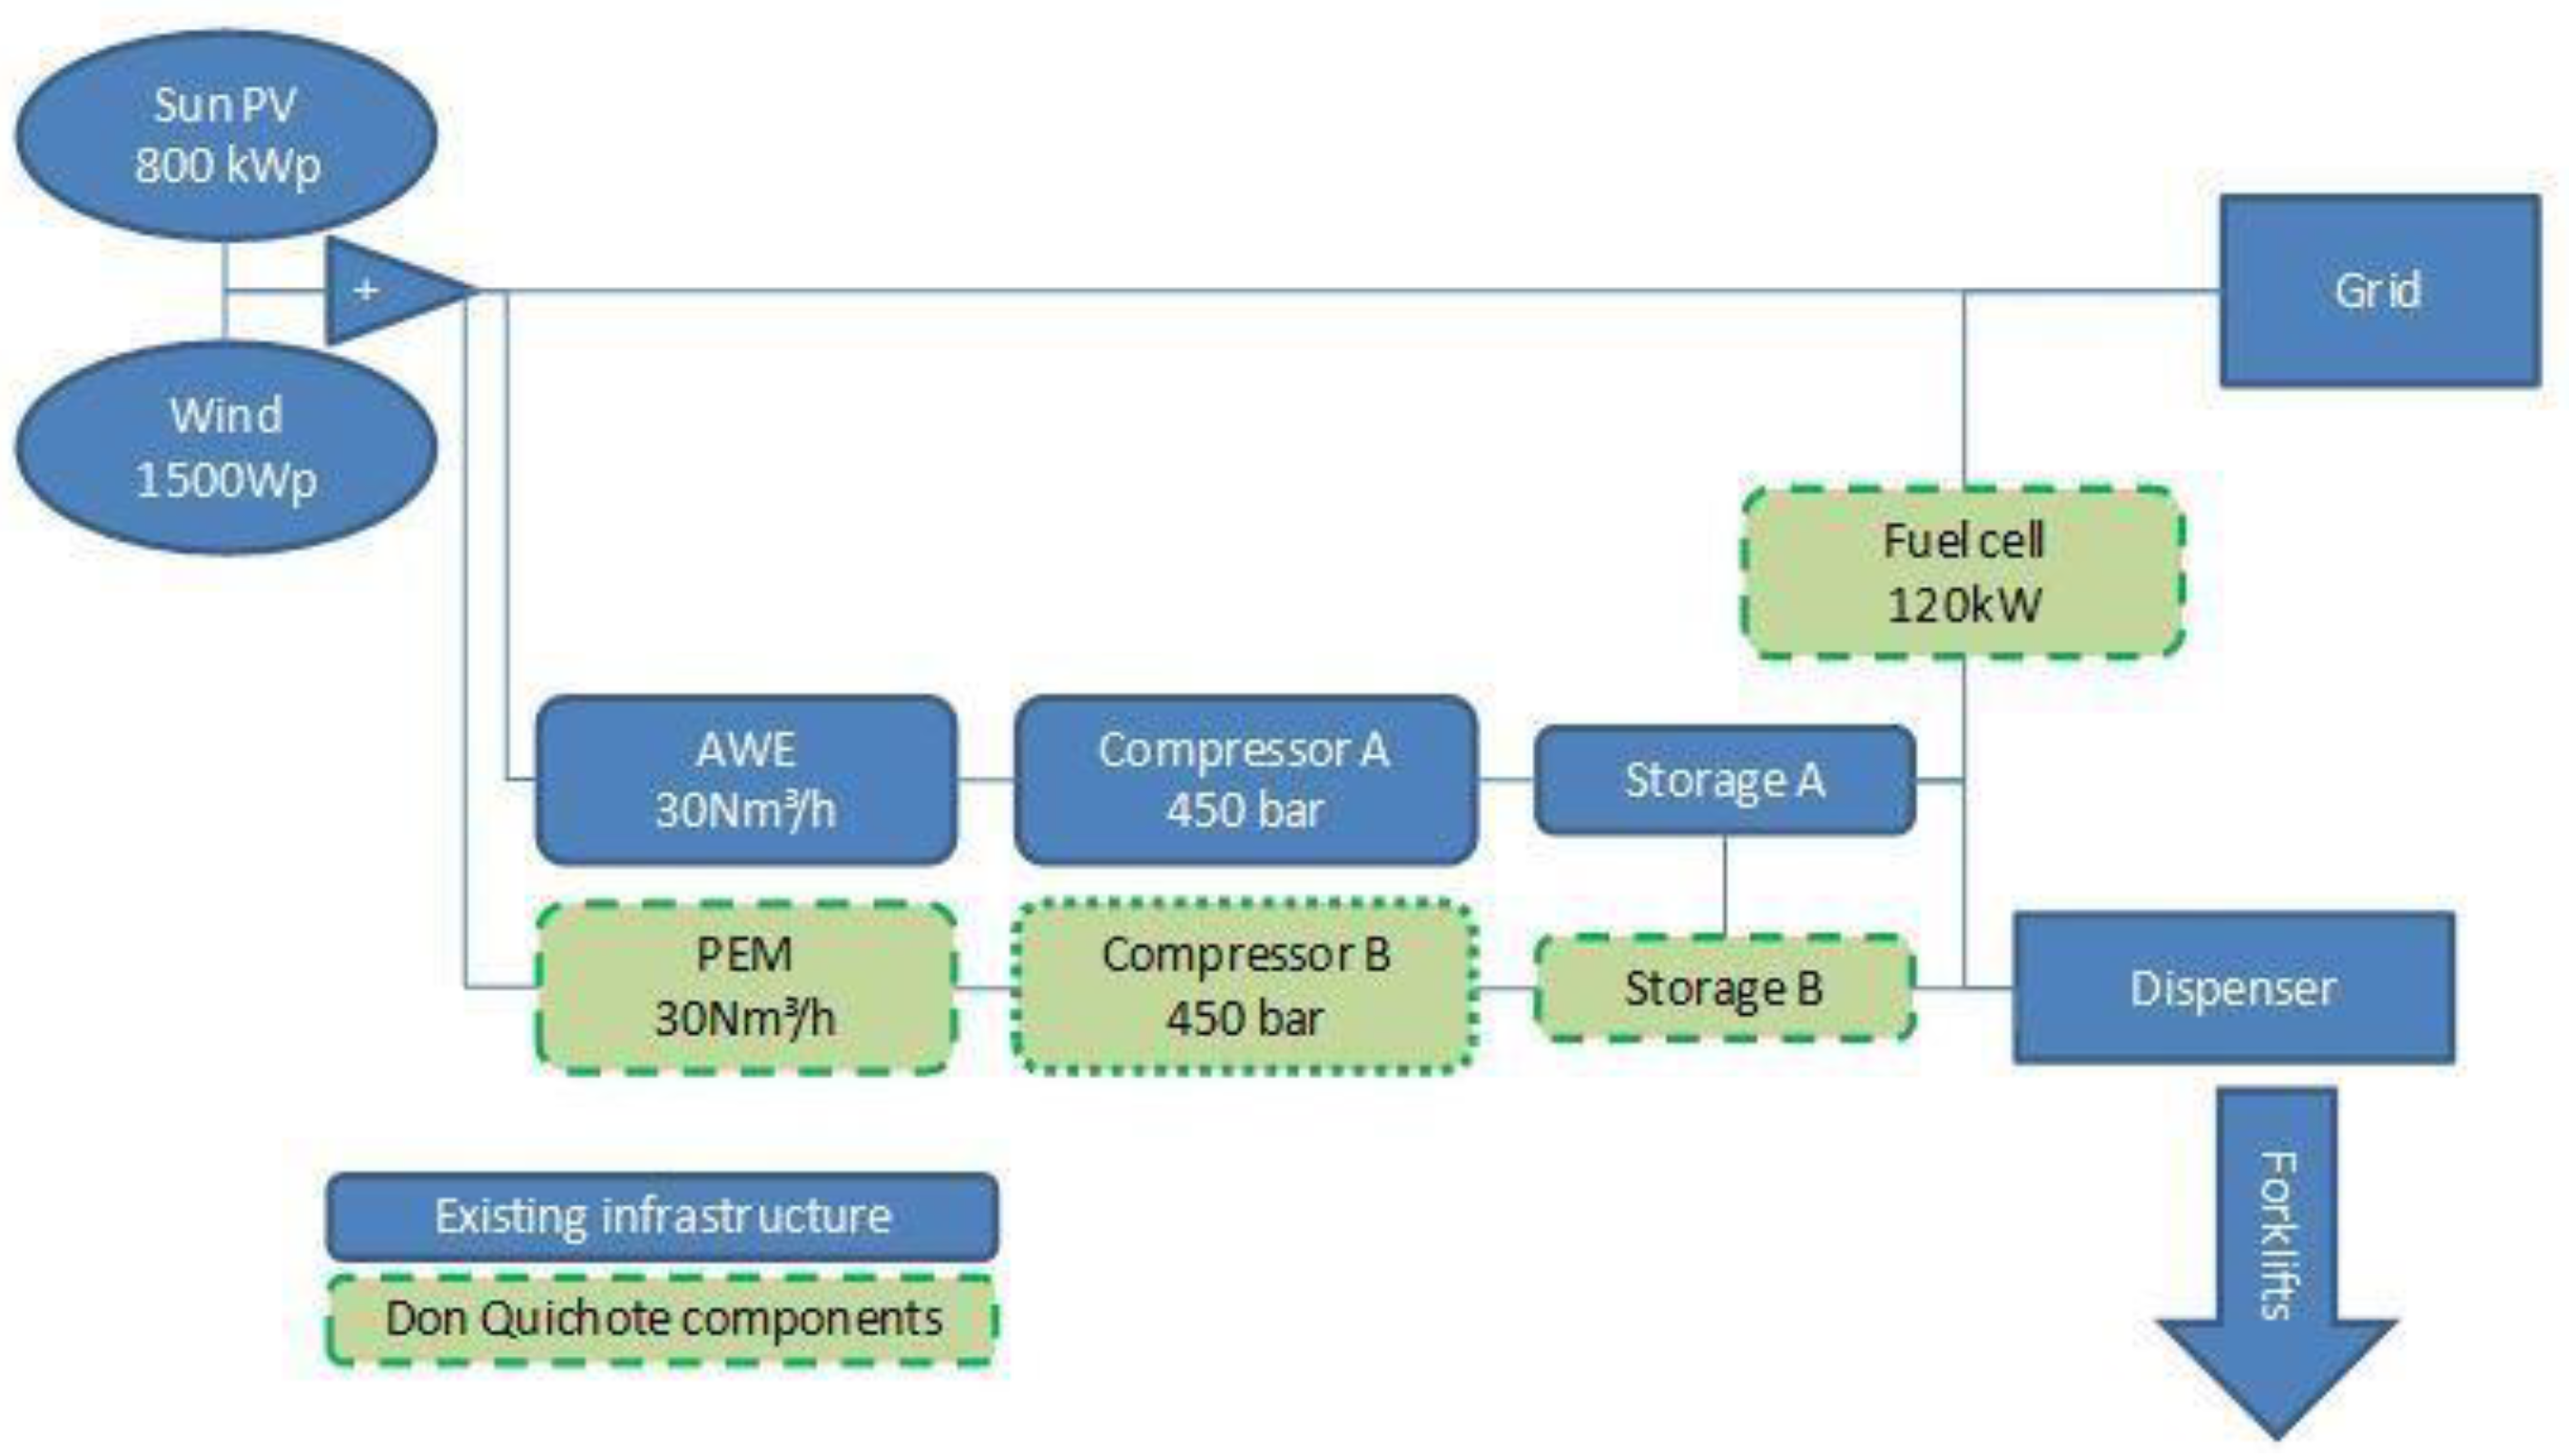
Europe hosts numerous P2G projects employing various types of electrolysis and producing different fuels. One notable project is Don Quichote, located in Hall, Belgium. This project's primary objective is to produce hydrogen to meet the energy needs (both automotive and power) of a distribution center owned by the local retail company Colruyt Group. The existing installation includes an alkaline electrolyzer, compressor, and storage system. Prior to Don Quichote, electricity generated from solar and wind sources was converted into hydrogen and used to fuel forklifts at the center. The project's main goal was to add a new type of electrolyzer, along with a compression and storage system, and to incorporate fuel cells that produce electricity for the grid [8]. A schematic of the project is presented in Figure 1.
Figure 1.
Scheme of Don Quichote installation [8].
Figure 1.
Scheme of Don Quichote installation [8].
BioCat is a Danish Power-to-Gas (P2G) project where the final fuel is methane, which is injected into the existing gas grid. The project's objective is to build and test a grid-scale P2G installation for real-life energy storage applications. The facility is located at Biogas Park Avedore in Hvidovre, Denmark. Hydrogen production is achieved using an S1000 alkaline electrolyzer with a total power capacity of 1 MW, provided by Hydrogenics Europe N.V. The electrolyzer operates only during periods of low energy prices, indicating surplus energy available for storage, and this requires a sophisticated advanced trading strategy. Additionally, the electrolyzer performs a frequency regulation role in the local grid. Subsequently, hydrogen and CO2 from the local biogas upgrading system are supplied to the methanation unit. Methane is produced via biological methanation, employing methanogenic archaea and a proprietary bioreactor developed by Electrochaea.dk ApS. The methane is then injected into the gas grid at a pressure of 4 bars. The project, which ran from 2014 to 2016, had a total cost of EUR 6.7 million, with 55% of the funding sourced from public money [9].
The primary challenge faced by hydrogen technologies today is the overall economic cost of implementation, which remains higher than that of fossil fuel-based technologies or other energy storage systems such as lithium-ion batteries for small-scale applications and hydro-pumped storage for grid-scale applications. Hydrogen-based storage technologies exhibit low round-trip efficiency (up to 50%), especially when compared to other technologies; small-scale lithium-ion batteries achieve efficiencies of up to 90%, and hydro-pumped storage reaches efficiencies of 80% [10].
2. Electrolysis
2.1. Introduction to Water Electrolysis
Electrolysis is an electrochemical process that produces hydrogen and oxygen from water using an electric current. Several types of electrolyzers have been developed, including proton exchange membrane (PEM) electrolyzers, alkaline electrolyzers, and high-temperature solid oxide electrolyzers (SOE). The overall electrolysis reaction can be represented as follows:
In 1833-1834, Michael Faraday formulated the laws of electrolysis, which provide a quantitative description of the process occurring during electrochemical reactions, fundamentally based on the law of mass conservation:
where: m, kg is the mass of the substance released, M, kg/mol is the molar mass of the substance produced, Q, C is the total electric charge passed, n, is the number of electrons involved in the reaction, F, C/mol is Faraday’s constant.
Electrolysis requires an input of energy. For low-temperature processes, this energy is solely electrical. In high-temperature electrolysis, both electrical energy and heat are required. The energy needed to decompose one mole of water is its enthalpy of formation :
where: represents the electrical energy, represents the thermal energy.
Under standard conditions, the electrical work required to split one mole of water is:
where: , V is the standard thermodynamic voltage (for water at 25°C, V).
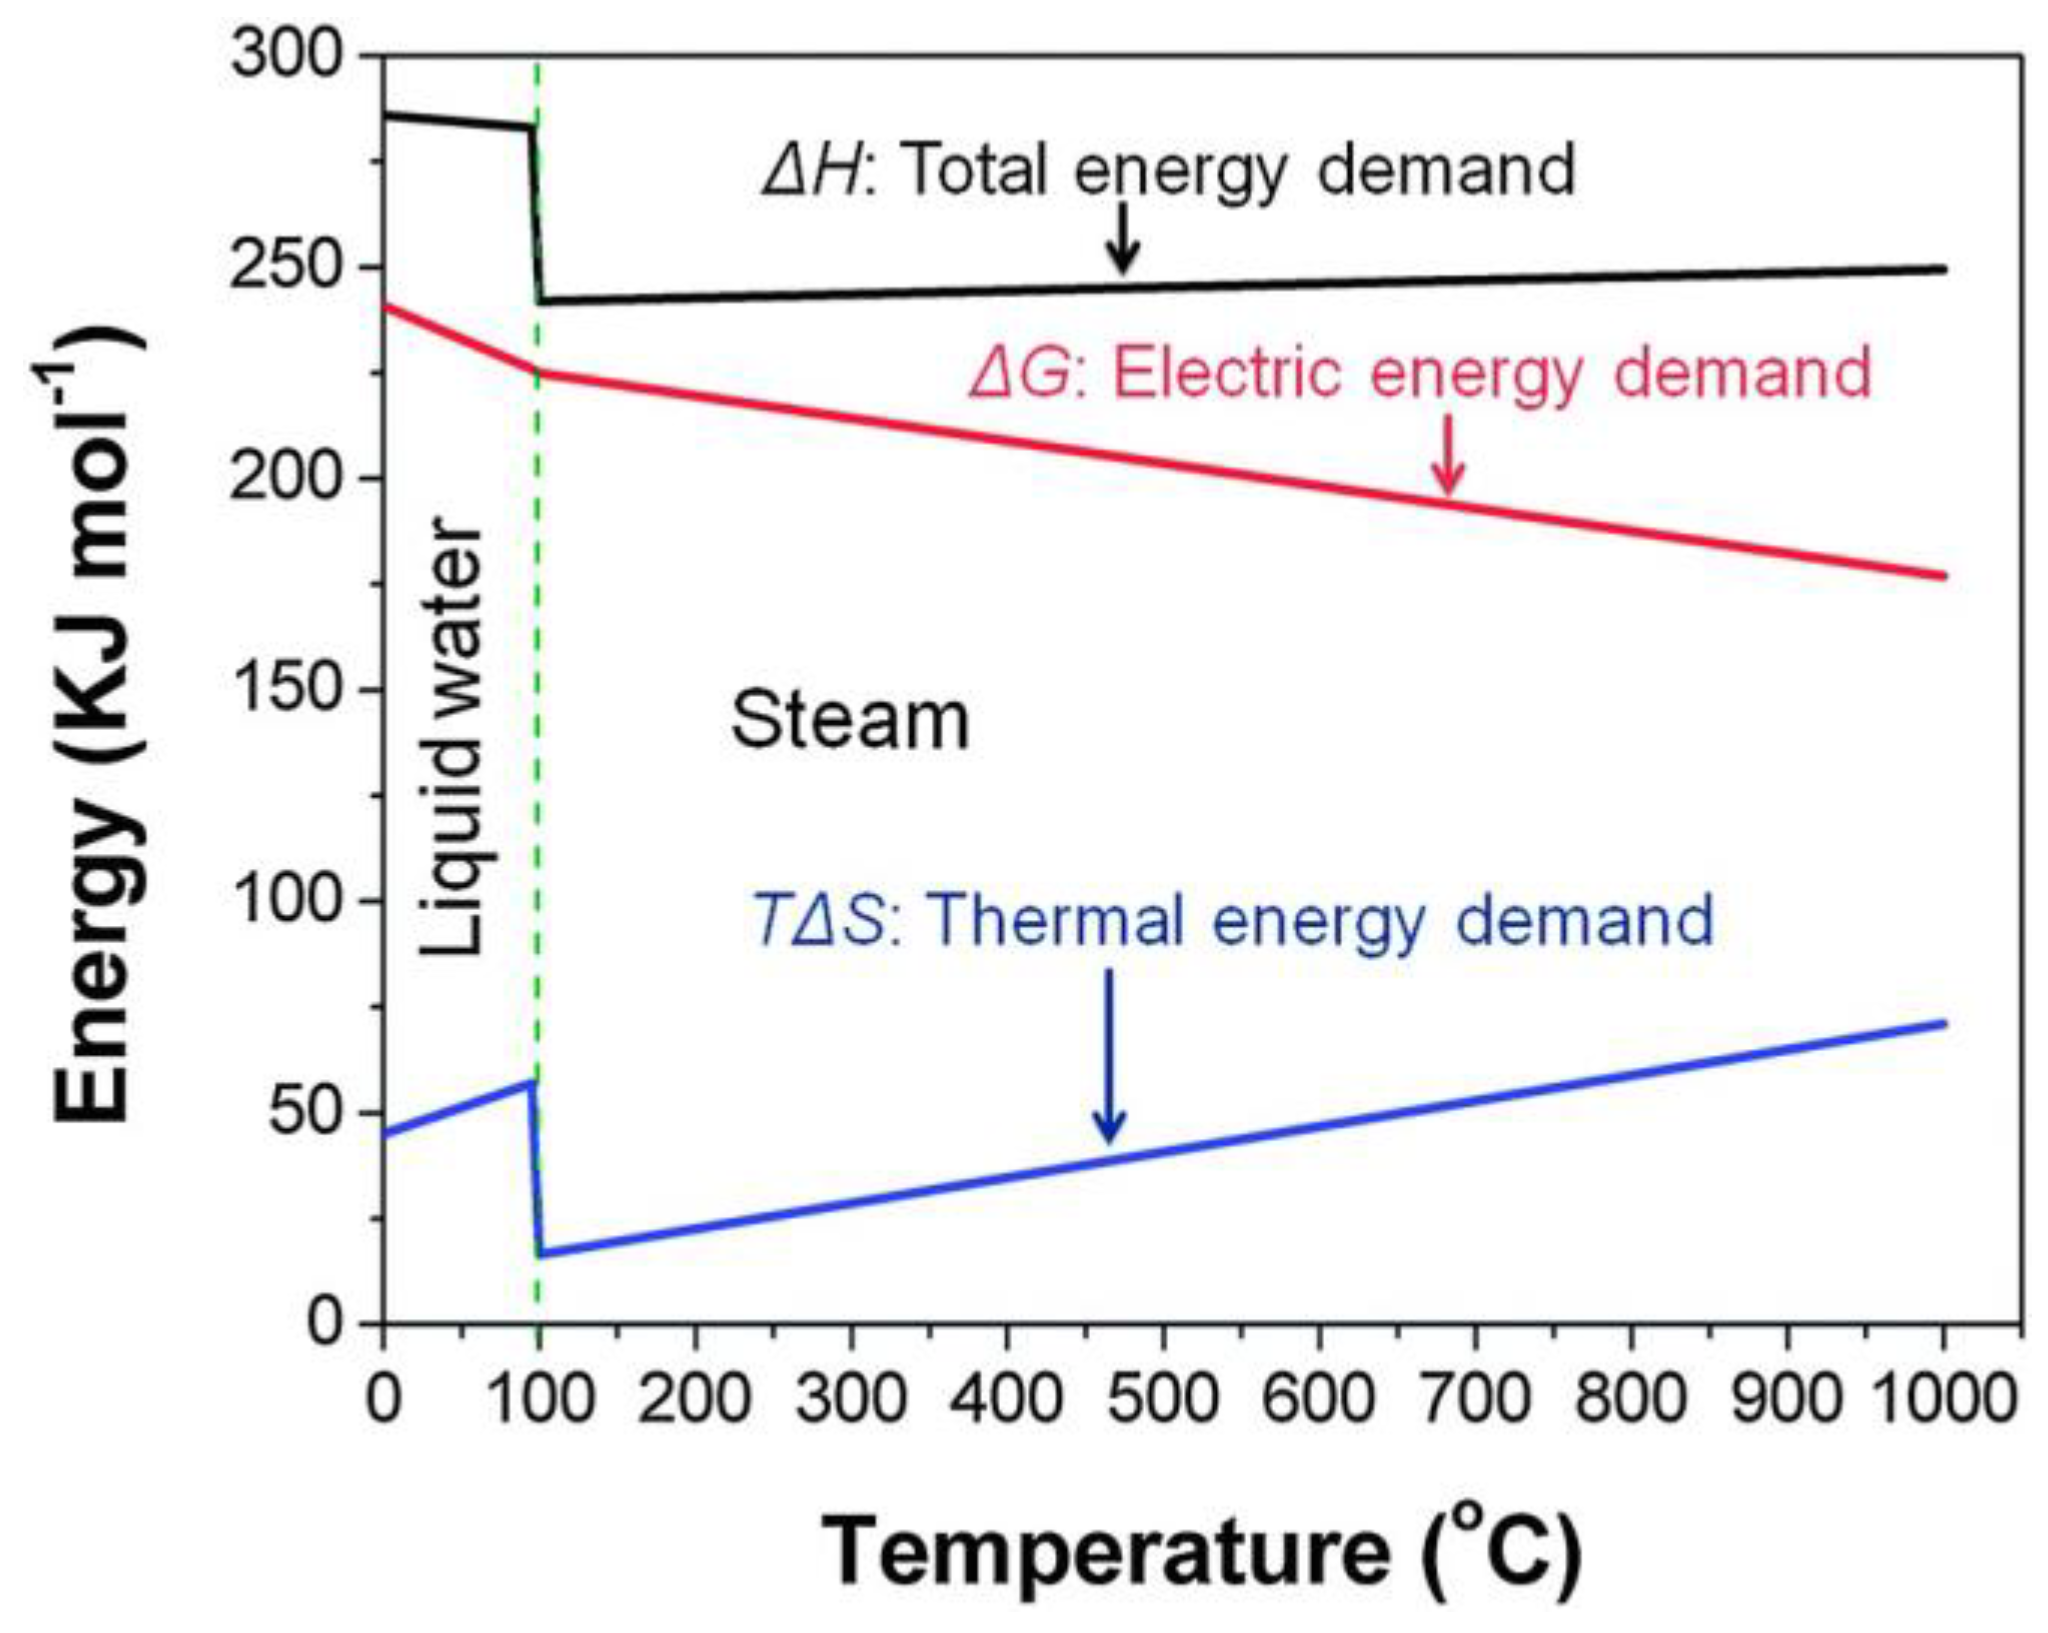
According to the second law of thermodynamics, the enthalpy of formation can be provided as both thermal and electrical energy. Figure 1 illustrates the energy requirements for electrolysis as a function of temperature. The abrupt changes around 100°C are associated with the evaporation of water. As the operational temperature increases, the total energy demand slightly rises, but the ratio of electrical to thermal energy decreases more rapidly. Thus, at higher temperatures, electrolysis requires less electrical energy and more thermal energy.
There exists a thermo-neutral potential in the electrolysis process, which is the voltage level for a given operational temperature where the electric power supplied generates sufficient heat through the Joule effect, making additional heat unnecessary. At this point, all the heat demand is met solely by the electrical energy stream, rendering the process adiabatic with a constant temperature. The thermo-neutral potential is defined as:
To calculate the open circuit voltage for SOE, the Nernst equation is used. For a hydrogen cell, it is expressed as:
where are the partial pressures of hydrogen, oxygen, and water, respectively.
For voltages between the open circuit voltage (EOCV) and , additional heat energy must be supplied. For voltages higher than the thermo-neutral potential, the reaction becomes exothermic due to the Joule heating effect, resulting in heat release.
Figure 1.
Energy required for electrolysis [11].
Figure 1.
Energy required for electrolysis [11].
The efficiency of a device is a critical factor in any energy application. The electrical efficiency of electrolysis can be defined as the ratio of the useful energy output from the system to the electrical energy input. The useful energy is the heating value of the produced hydrogen multiplied by its flow rate, while the electrical energy input is the product of the current and voltage of the system.
where: LHV– lower heating value of hydrogen, – output mass flow rate of hydrogen, I – electric current of the electrolysis, E – electrolysis voltage.
2.2. Solid Oxide Electrolysis and Electrolysers
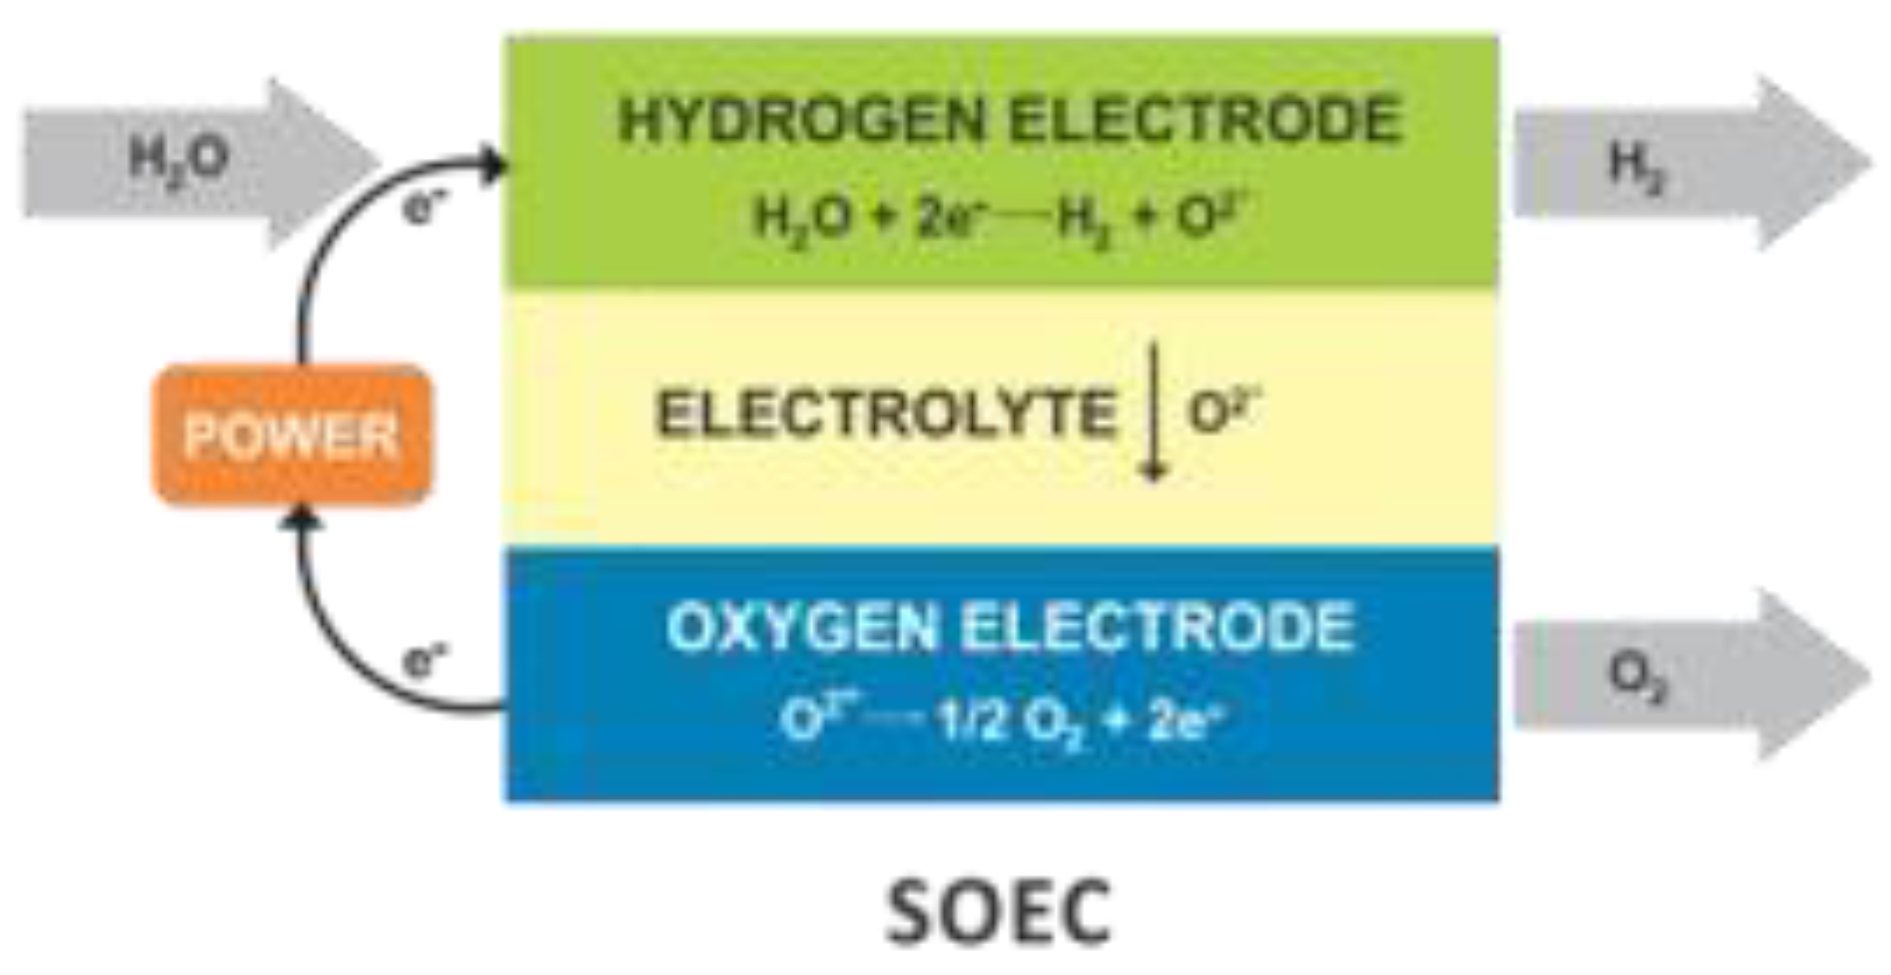
Solid oxide electrolysis (SOE) typically occurs at temperatures between 800 and 1000°C. Theoretically, electrical efficiencies close to 100% are possible. A typical solid oxide electrolysis cell consists of three basic layers: two electrodes (anode and cathode) and an electrolyte that separates them. The electrolyte functions as an electrical insulator and an excellent ion conductor. The reaction at the cathode involves steam reduction:
𝐻2𝑂(𝑔) + 2𝑒− → 𝐻2(𝑔) + 𝑂2−
The oxygen ions are transferred through the solid electrolyte to the anode, where molecular oxygen is produced:
𝑂2− − 2𝑒− → 0.5 𝑂2
Scheme of SOE is presented in the Figure 8.
Figure 1.
Scheme of SOE cell [12].
Figure 1.
Scheme of SOE cell [12].
The operation of a solid oxide electrolysis (SOE) cell is also associated with the occurrence of losses, which can be categorized into three types: ohmic losses, activation losses, and reactant transport losses. These losses are illustrated on the voltage-current characteristic curve in Figure 1.
Figure 1.
SOC losses [13].
Figure 1.
SOC losses [13].
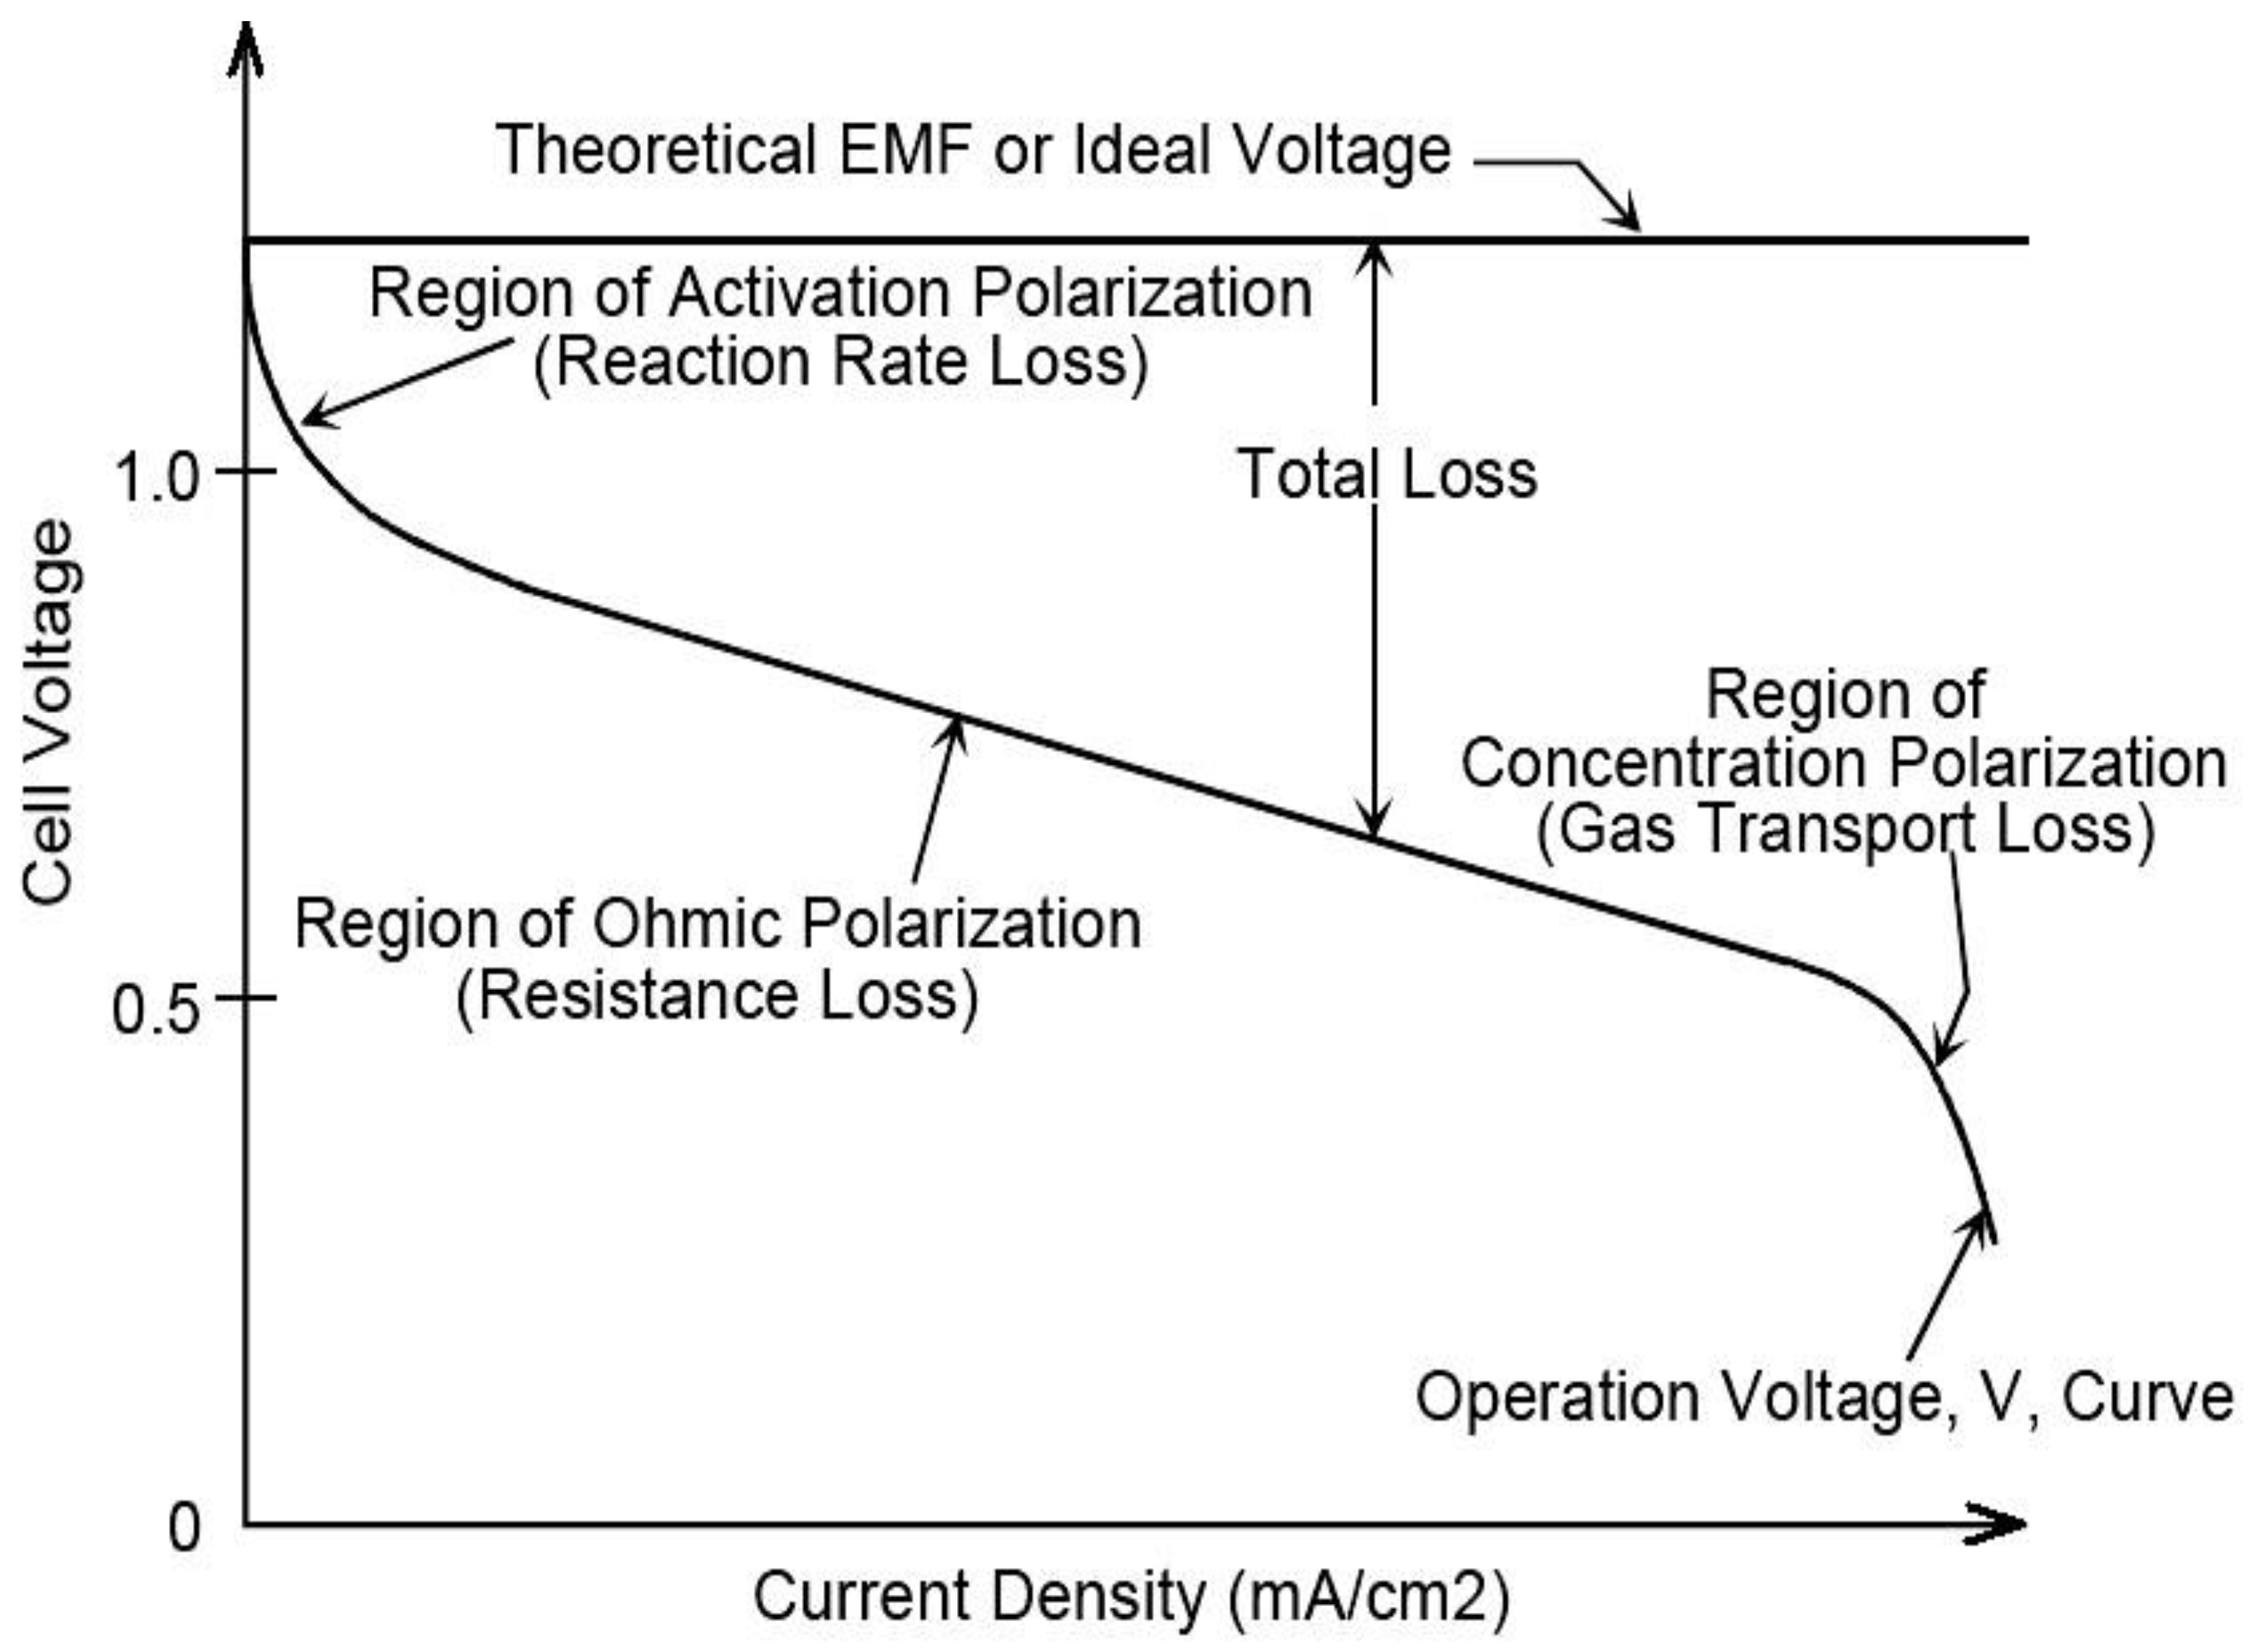
Electrochemical reaction activation losses arise because some energy must be supplied to the reactants to overcome the potential barrier for the reaction to commence. These losses are most significant near the open circuit voltage and decrease at higher operating temperatures, as the reactants already possess more thermal energy.
Ohmic losses are due to the ionic and electronic resistances of the cell components. These losses depend on the temperature, the materials of the cell components, and the current, varying linearly with current.
Transport losses result from the limited ability of the electrode materials to transport species to the electrolyte contact zone. These losses depend on the current density and the porosity of the electrode material.
A solid oxide electrolyzer can be considered as one mode of operation of a solid oxide cell (SOC). The second mode is the solid oxide fuel cell (SOFC), which performs the opposite process, generating electricity and heat from hydrogen and oxygen. The voltage-current characteristics of these two modes are presented in Figure 1.
Figure 1.
E-i curve for SOE and SOFC [14].
Figure 1.
E-i curve for SOE and SOFC [14].
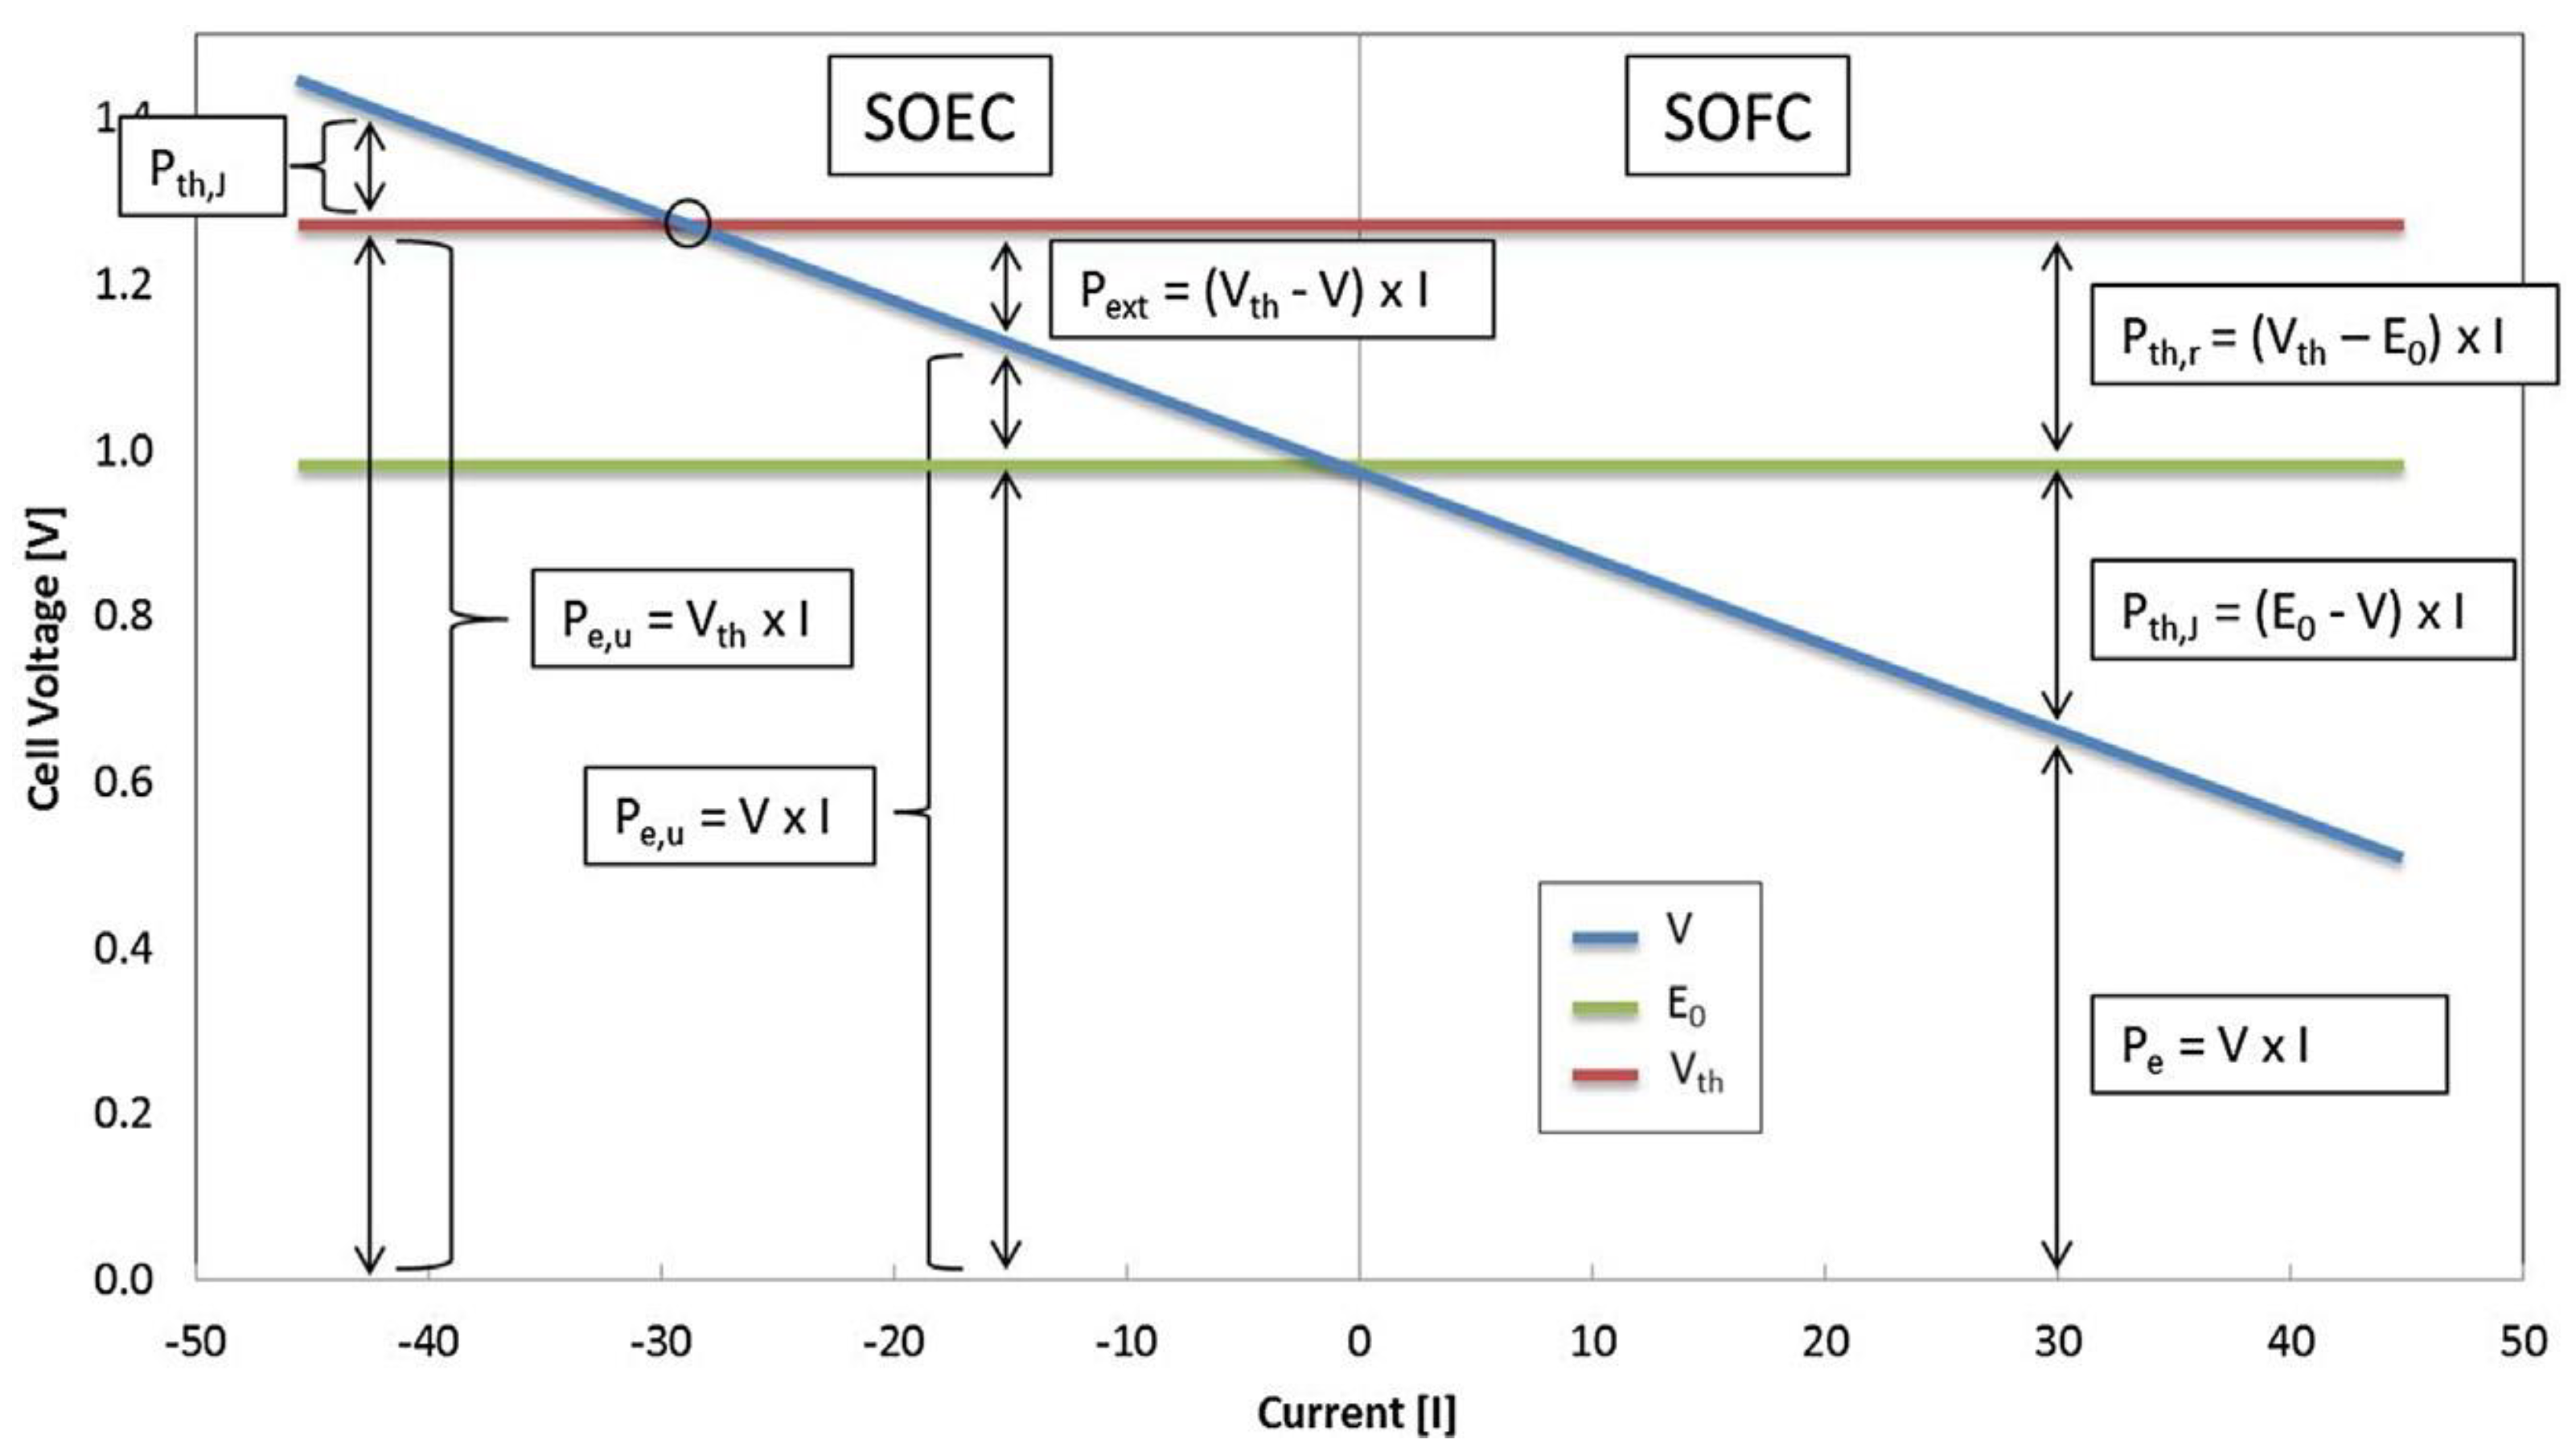
The blue line represents the voltage at a given current, either drawn from or supplied to the cell. The green line indicates the open circuit voltage (EOC), which is the voltage at zero current flow. EOC can be considered the minimum voltage in SOE mode and the maximum voltage in SOFC operation. The red line represents the level of the thermo-neutral potential for the SOC.
In the given scenario, the current at the thermo-neutral potential is around -30 A. Between this value and zero, the electrical power delivered to the cell is Pe,u, However, for the reaction to occur, additional energy (Pext) must be supplied, making the total energy delivered equal to the red line, which represents the thermo-neutral potential. When the cell's voltage equals the thermo-neutral potential, the electric energy delivered and the heat generated by the Joule effect balance the energy requirements of the process.
Above the thermo-neutral potential, the Joule effect generates more heat than is needed, and this excess heat can be either utilized for other purposes or simply wasted. In SOFC mode, the voltage decreases, and the heat generated by the Joule effect steadily increases with rising current.
2.3. SOE Cell’s Design
The electrolyte material in SOE cells must have excellent ion transport characteristics. The most commonly used electrolyte is yttria-stabilized zirconia (YSZ). Due to the higher resistances compared to alkaline and proton exchange membranes, very thin layers of the electrolyte (down to 4 µm) are used to minimize ohmic losses. Additionally, a good electrolyte must have a thermal expansion coefficient similar to that of the other cell components, such as the electrodes. This similarity is essential because the cells operate at high temperatures (800-1000°C), and differing expansion rates could cause the electrolyte to separate from other layers during the initial heating process. The electrolyte must also have very low porosity to prevent the flow of reactants through it.
The electrode material must also meet several criteria. It should have good electron and ion conductivity and a thermal expansion coefficient that matches the electrolyte. For the cathode material, appropriate porosity is crucial to allow the free flow of oxygen molecules to the contact zone with the electrolyte. In SOE cells, the cathode material is typically lanthanum strontium manganite (LSM), while the anode is usually composed of nickel oxides mixed with YSZ.
SOE cells can have different shapes (quadratic and circular) and sizes. Their construction usually follows one of three forms, depending on the type of mechanical support: electrolyte support, anode support, and metal support. The anode support cell is the most commonly used. In this design, the anode layer is divided into two sub-layers: an anode functional layer and an anode support layer, with the latter being much thicker.
Historically, the first solid oxide electrolysis cells were tubular in shape. These cells were developed at Dornier Systems Co. in the early 1960s and subsequently at Westinghouse.
2.4. Reported Power-to-X Installation Based on SOE
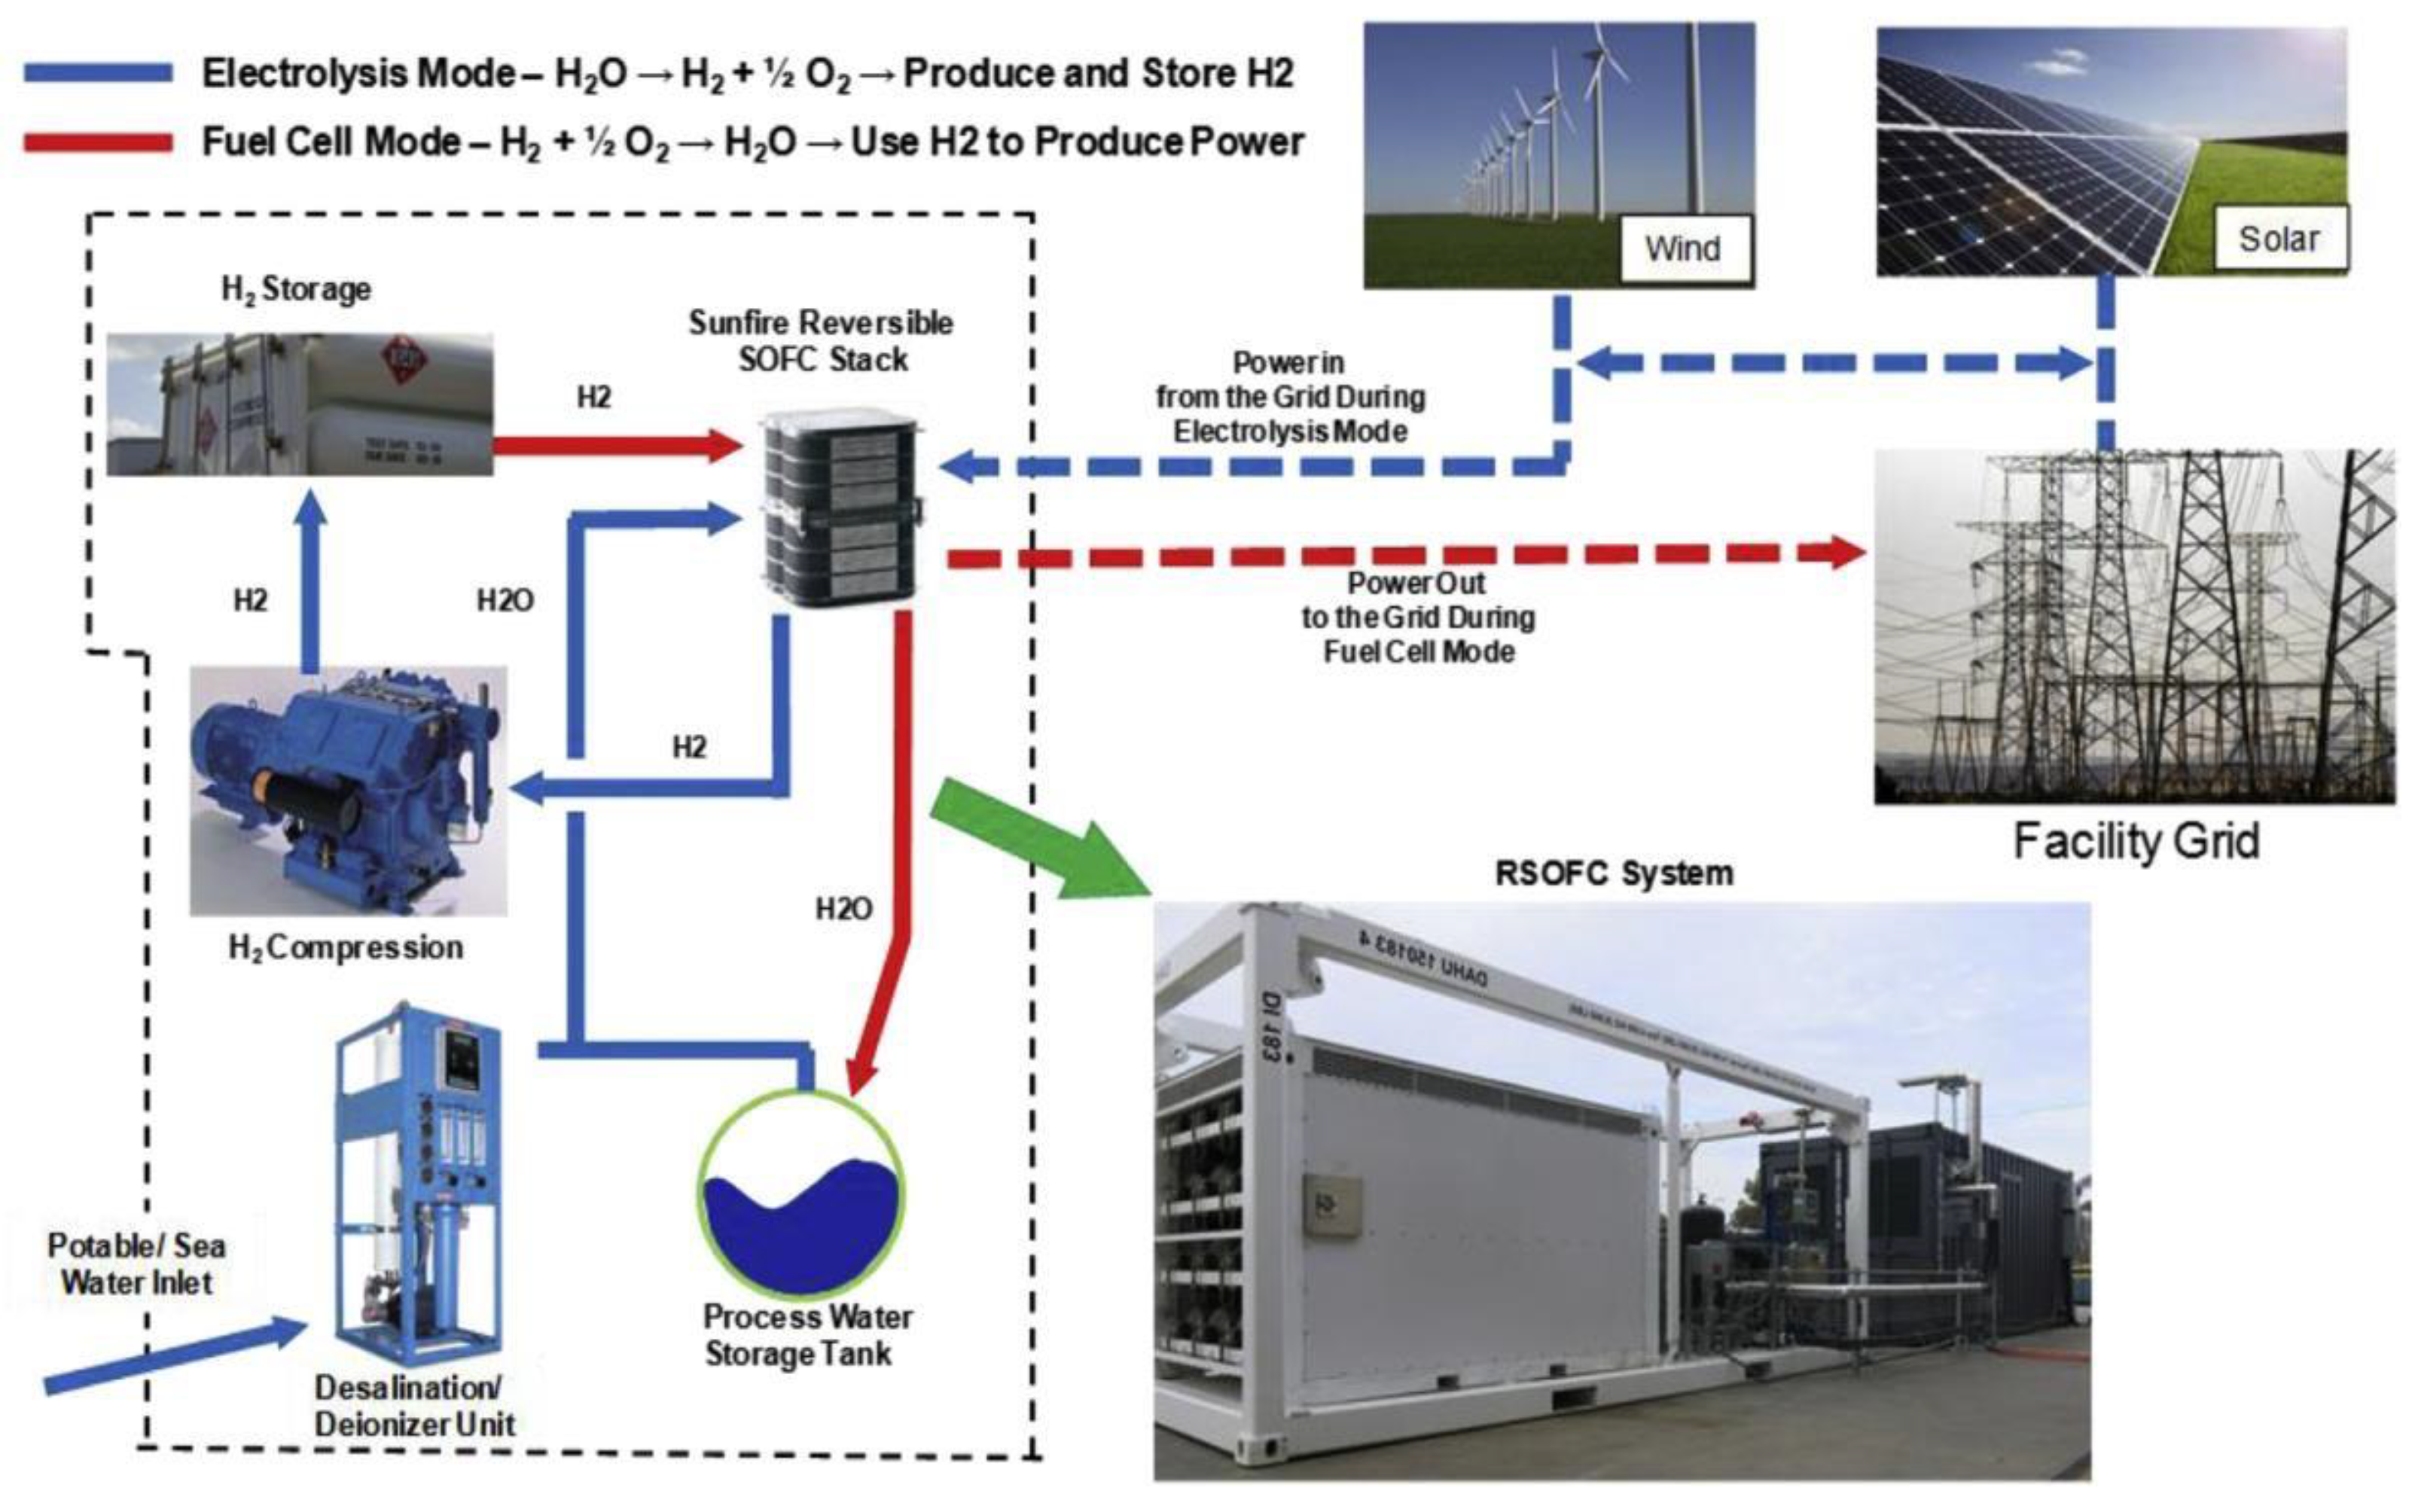
In 2015, a project aimed at creating the first fully operational and grid-tied solid oxide electrolysis cell (SOEC) and solid oxide fuel cell (SOFC) installation for energy storage began as a collaboration between Boeing and Sunfire, located in Huntington Beach, California, USA. The project was tested while connected to the Southern California Edison grid. The scheme of the installation is presented in Figure 1.
In this setup, electrical energy from renewable energy sources (solar or wind) and from the grid is used to produce hydrogen in the SOE mode of Sunfire’s reversible SOC stack (RSOC). After compression, the hydrogen is stored in a tank. When there is a need for energy, the mode of operation switches to SOFC (energy generation), and hydrogen from the tank is supplied to the RSOC stack to produce electricity. Sunfire’s RSOC produces 50 kW of electrical power in SOFC mode and requires 120 kW in SOE mode. The storage tanks and compression systems were developed by Boeing. The hydrogen production rate is 3.5 kg/h. The efficiency of the SOEC mode, relative to the lower heating value (LHV), was found to be 60.5%, while the SOFC mode achieved an efficiency of 49.2%. However, further improvements in efficiency levels are possible [2].
Figure 1.
Boeing and Sunfire's RSOC project's scheme [15].
Figure 1.
Boeing and Sunfire's RSOC project's scheme [15].
Sunfire's next step is its participation in the project named Green Industrial Hydrogen, funded by the Fuel Cells and Hydrogen Joint Undertaking (FCH JU). The project has several key objectives:
- -
- Achieving an overall LHV efficiency above 80%
- -
- Scaling SOEC to 150 kWAC of power input
- -
- Reaching a lifetime of at least 10,000 hours with a degradation rate below 1% per 1,000 hours
The project is located at an iron-and-steel factory owned by Salzgitter Flachstahl GmbH in Germany. The scheme of the installation is presented in Figure 1.
Figure 1.
RSOC installation in Salzgitter's iron-and-steel factory [16].
Figure 1.
RSOC installation in Salzgitter's iron-and-steel factory [16].
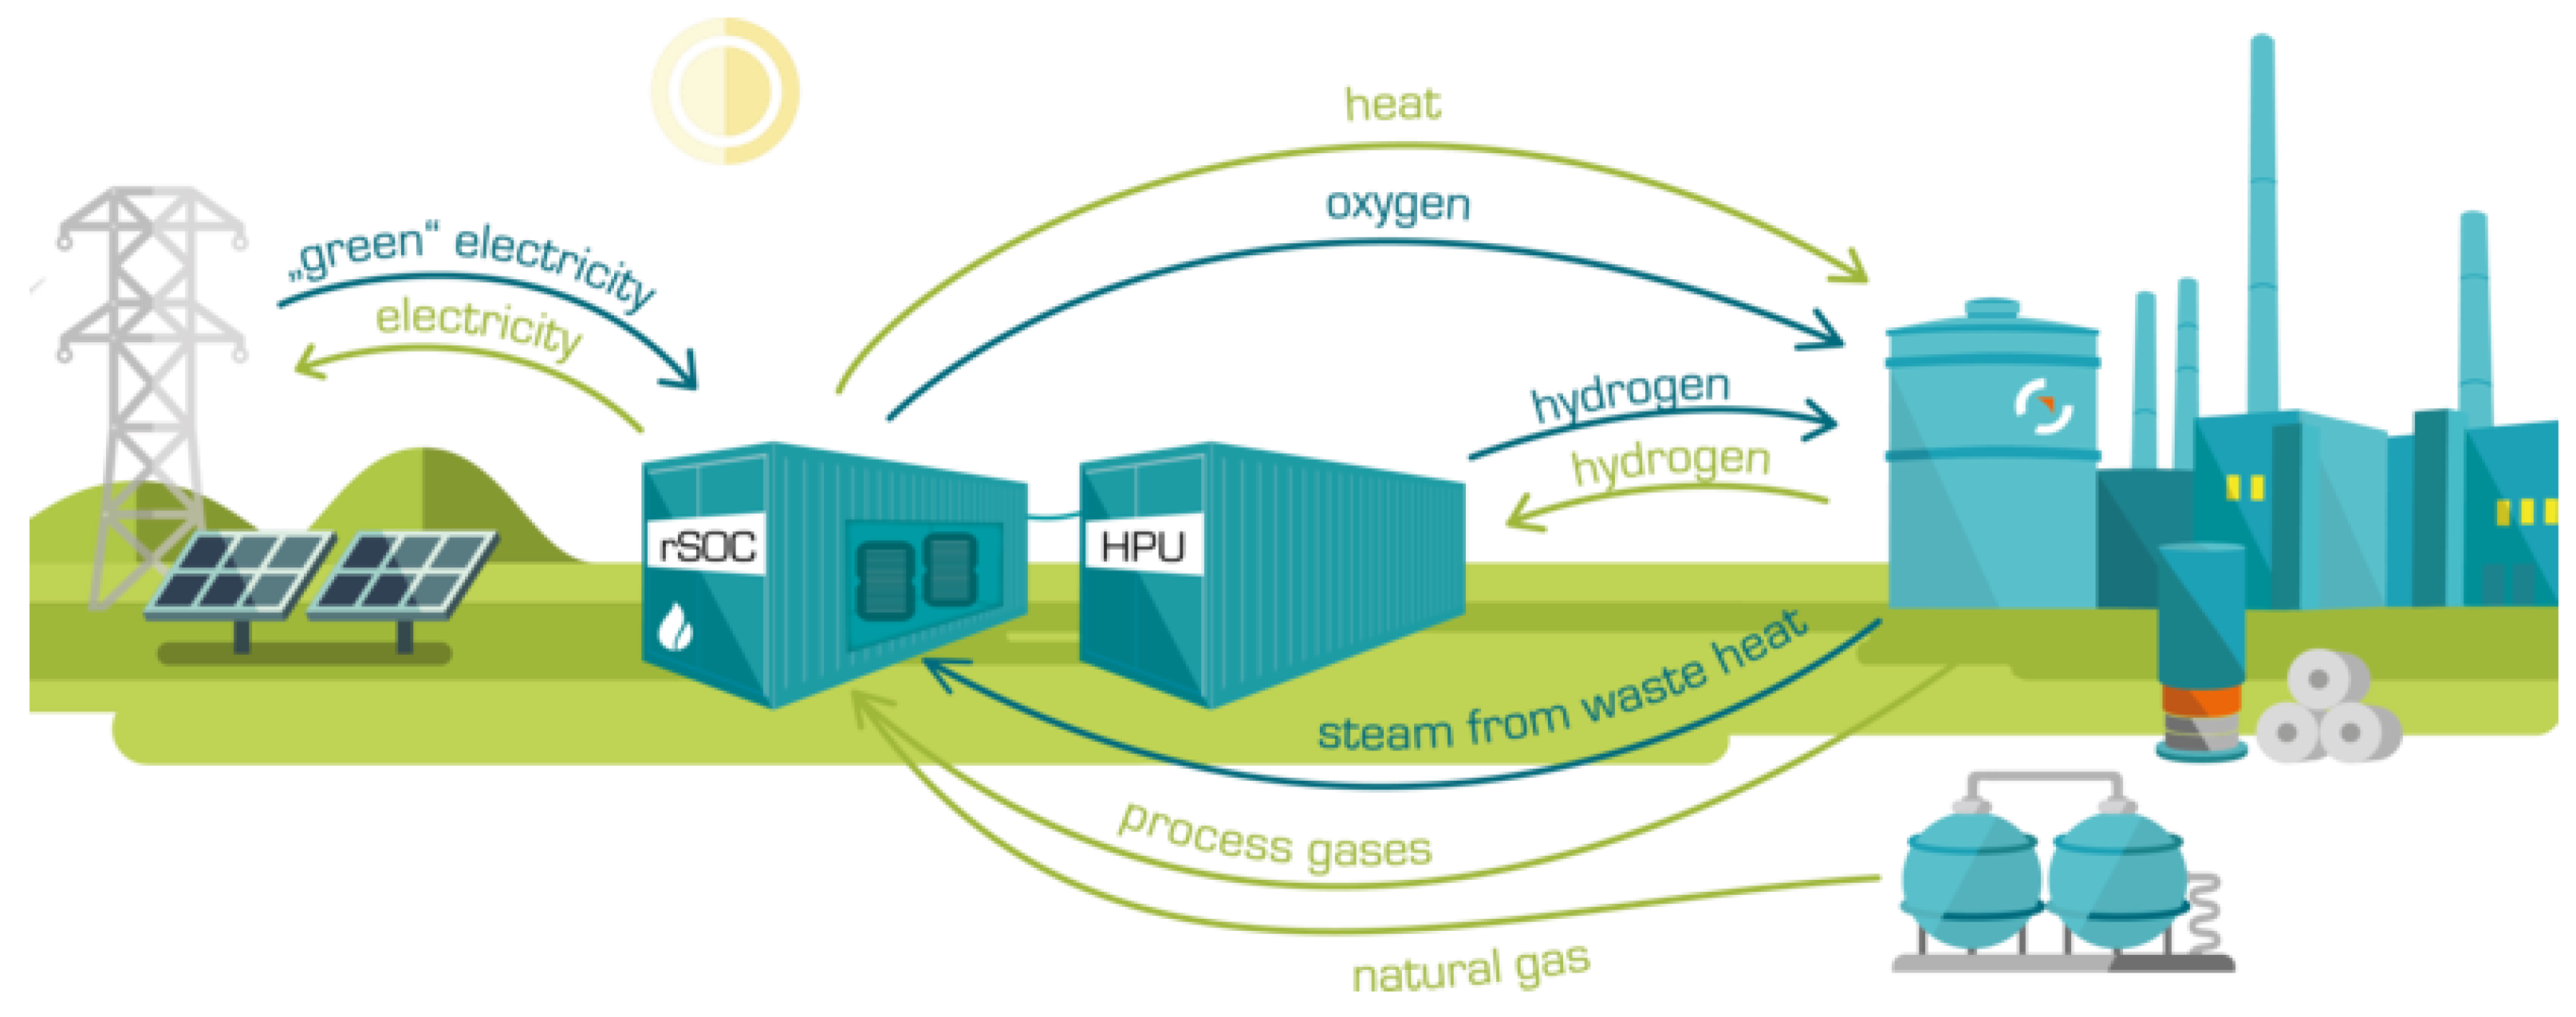
In SOEC mode, the system produces hydrogen using hot steam heated by waste heat from the factory. Electricity is supplied from renewable energy sources and the grid. In SOFC mode, hydrogen, process gas, and natural gas are used as fuels. The hydrogen must be sufficiently clean and compressed to 8 bar, tasks managed by the Hydrogen Processing Unit (HPU) visible in the scheme.
When cheap renewable energy is available, the system operates in SOEC mode. When electricity prices are high, the system switches to SOFC mode, using hydrogen to produce electric power. The presented RSOC system contains a total of 1,440 cells (48 stacks, 30 cells each). The system's maximum hydrogen production rate is 40 Nm³/h, and its maximum power output in SOFC mode is 30 kWAC. This power output is achieved using hydrogen, while fueling the cells with natural gas produces only 25 kWAC. However, the efficiency of fuel cells using natural gas is slightly higher (50%) compared to hydrogen (48%).
Before reaching the cells, gases are heated to the required temperature in two Gas Processing Units (GPUs). For fuels other than hydrogen, reforming occurs in the GPUs. During testing, the highest electrolysis power intake was found to be 200 kWAC, making it the world's largest SOEC unit [2].
3. Methodology
The Description of the System
The SOE system consists of a stack of cells connected in series and various ancillary devices necessary for the system's proper operation, such as heaters, blowers, pumps, and heat exchangers. These components are essential for generating steam and heating it to the required operating temperature, as well as for recovering heat from gases exiting the stack and transferring it to incoming reactants.
The SOE stack in this system is modeled with 750 cells, each having an active area of 16 cm². The system scheme, which is a modified version of the system proposed in [17], is presented in Figure 1.
Figure 1.
Scheme of the system. Based on [17].
Figure 1.
Scheme of the system. Based on [17].
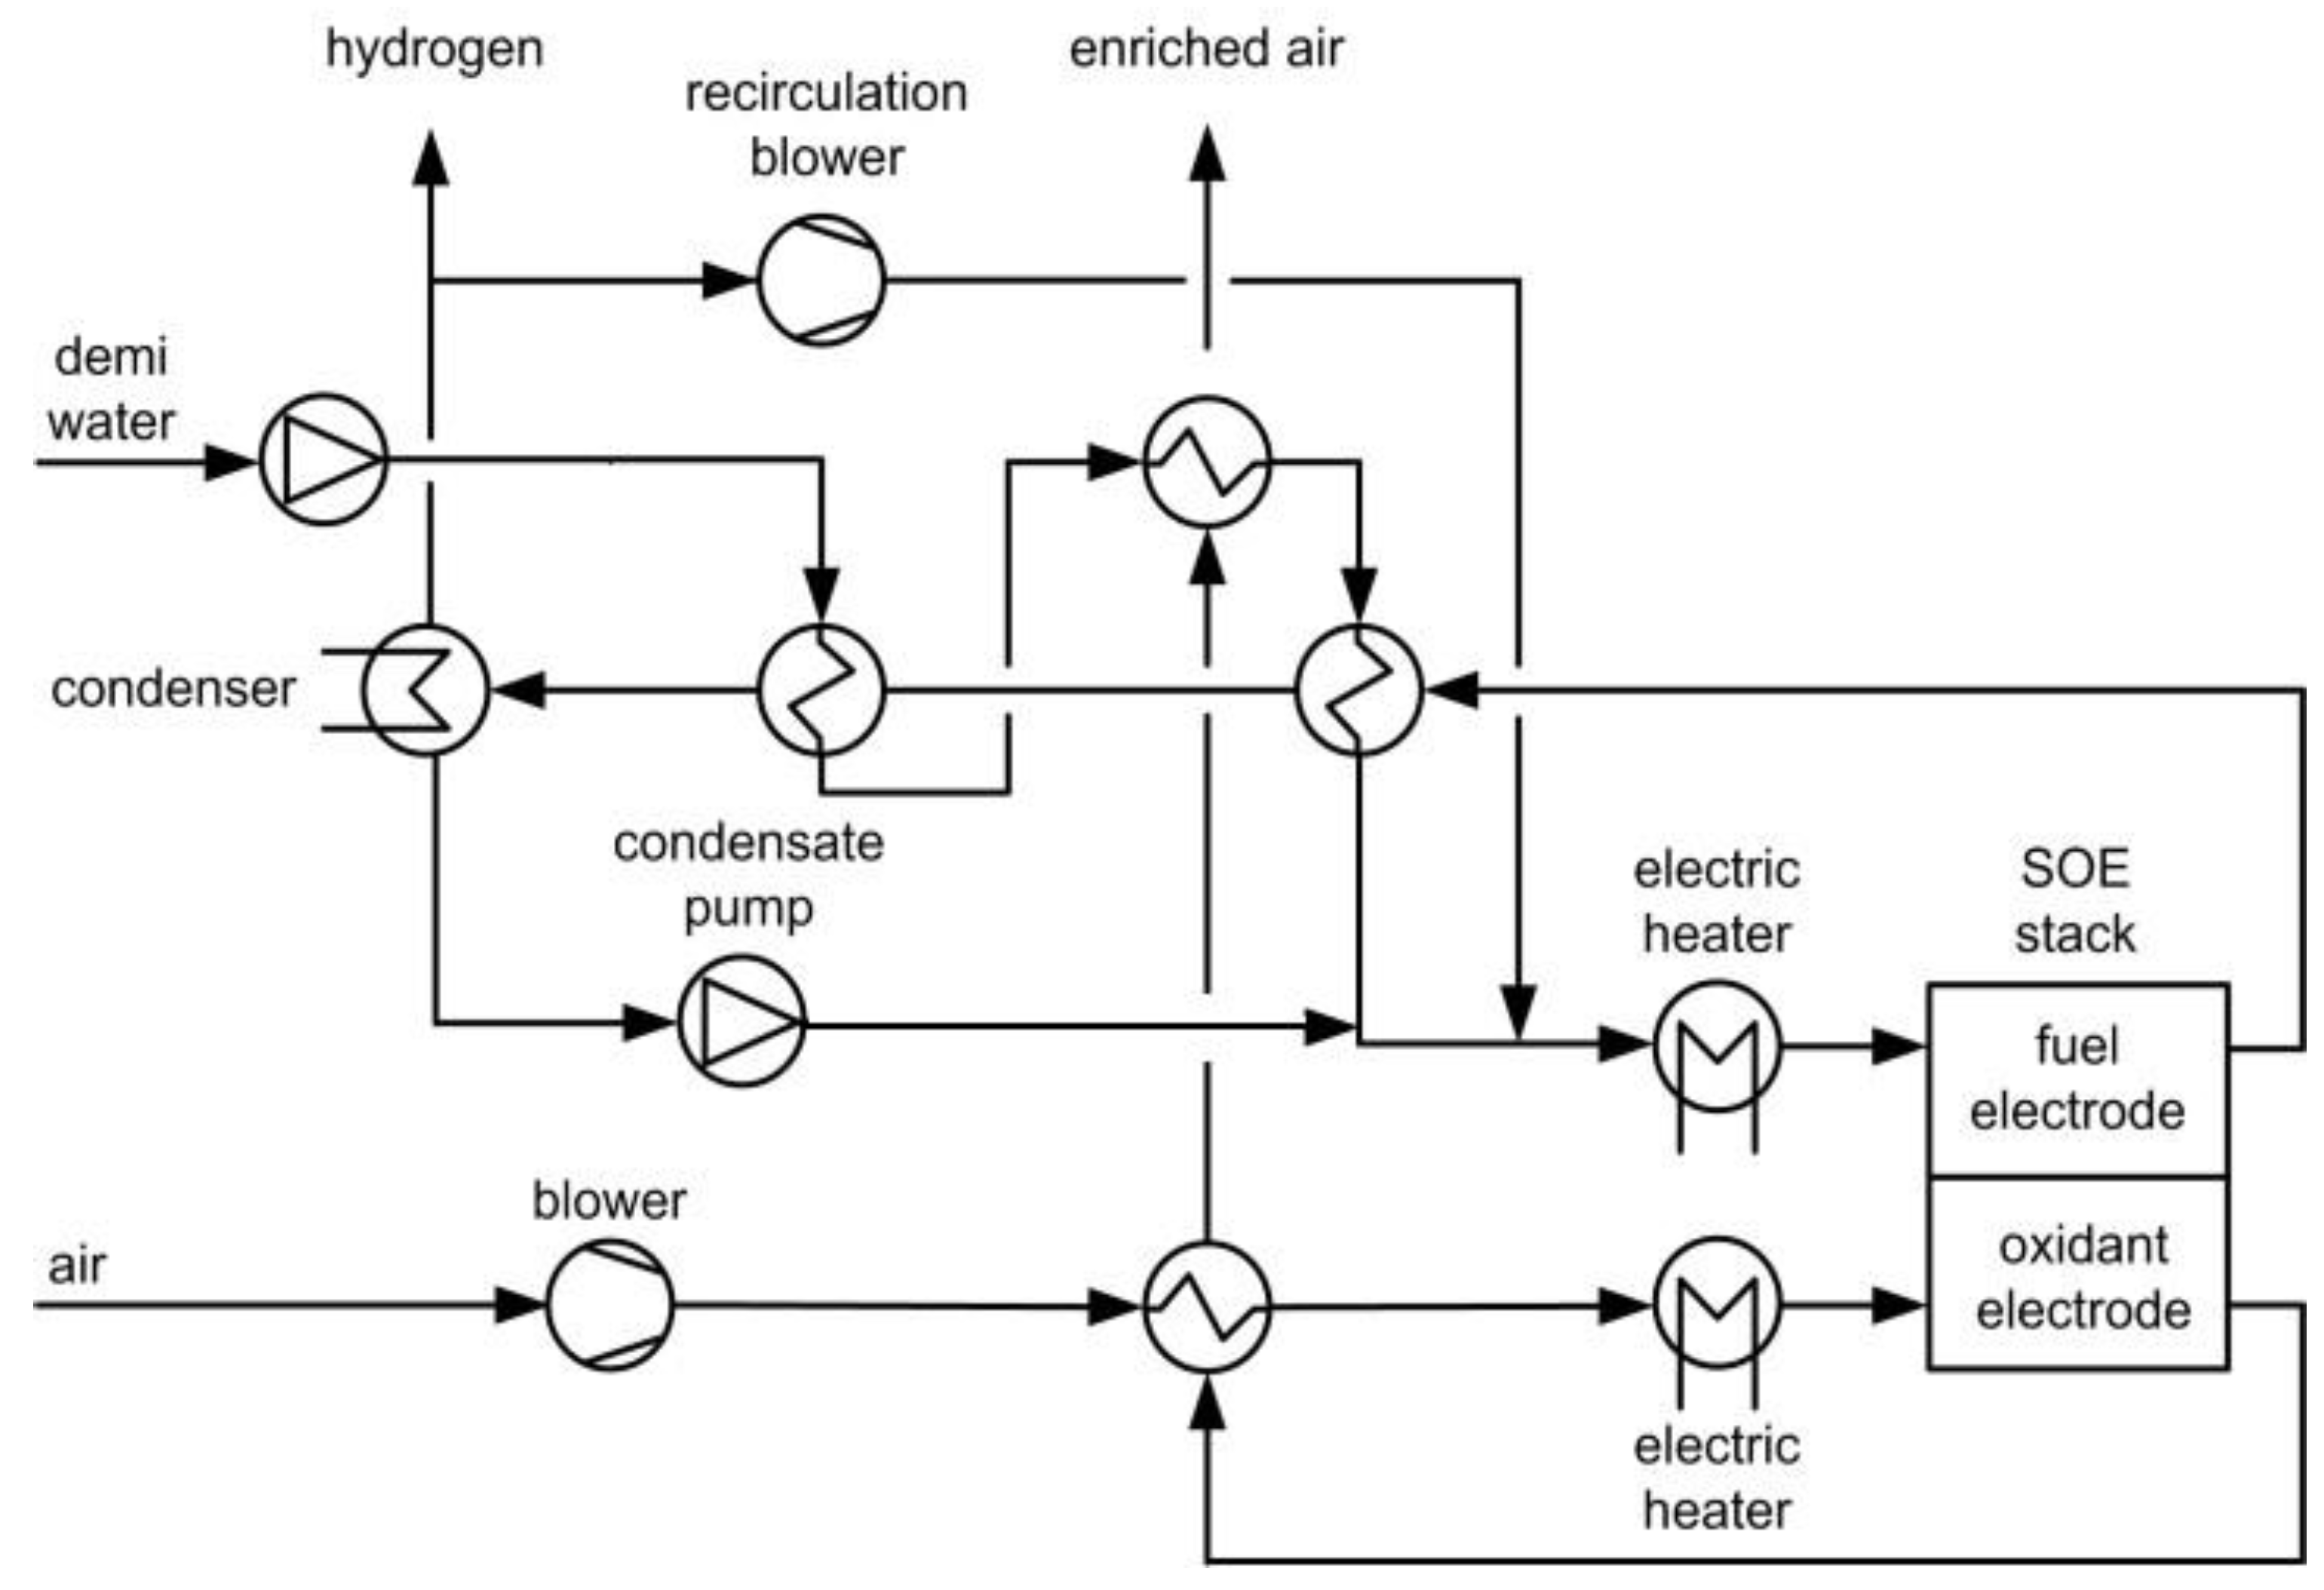
The "SOEC" element represents the electrolyzer stack model, which is connected to streams of a steam/hydrogen mixture and the oxidant, air. Electric heaters raise the temperature of the incoming streams to the required level. The stream leaving the oxidant electrode is enriched air at a significantly higher temperature than ambient air, enabling it to be used to preheat both the incoming steam and air streams in heat recovery exchangers. The stream leaving the fuel electrode is also utilized in thermal recuperation, transferring its heat to a water stream, which eventually evaporates.
The gases from the fuel electrode, a mixture of steam and hydrogen, need to be separated. The first step involves cooling the stream so the steam condenses, allowing easy separation from the hydrogen. Cooling is achieved using an external water stream with an initial temperature of 8°C. The hydrogen is then divided into two streams: one being the final product of the SOE system, and the other recirculated. Recirculating hydrogen in the incoming stream helps limit chemical degradation of the electrode’s surface material.
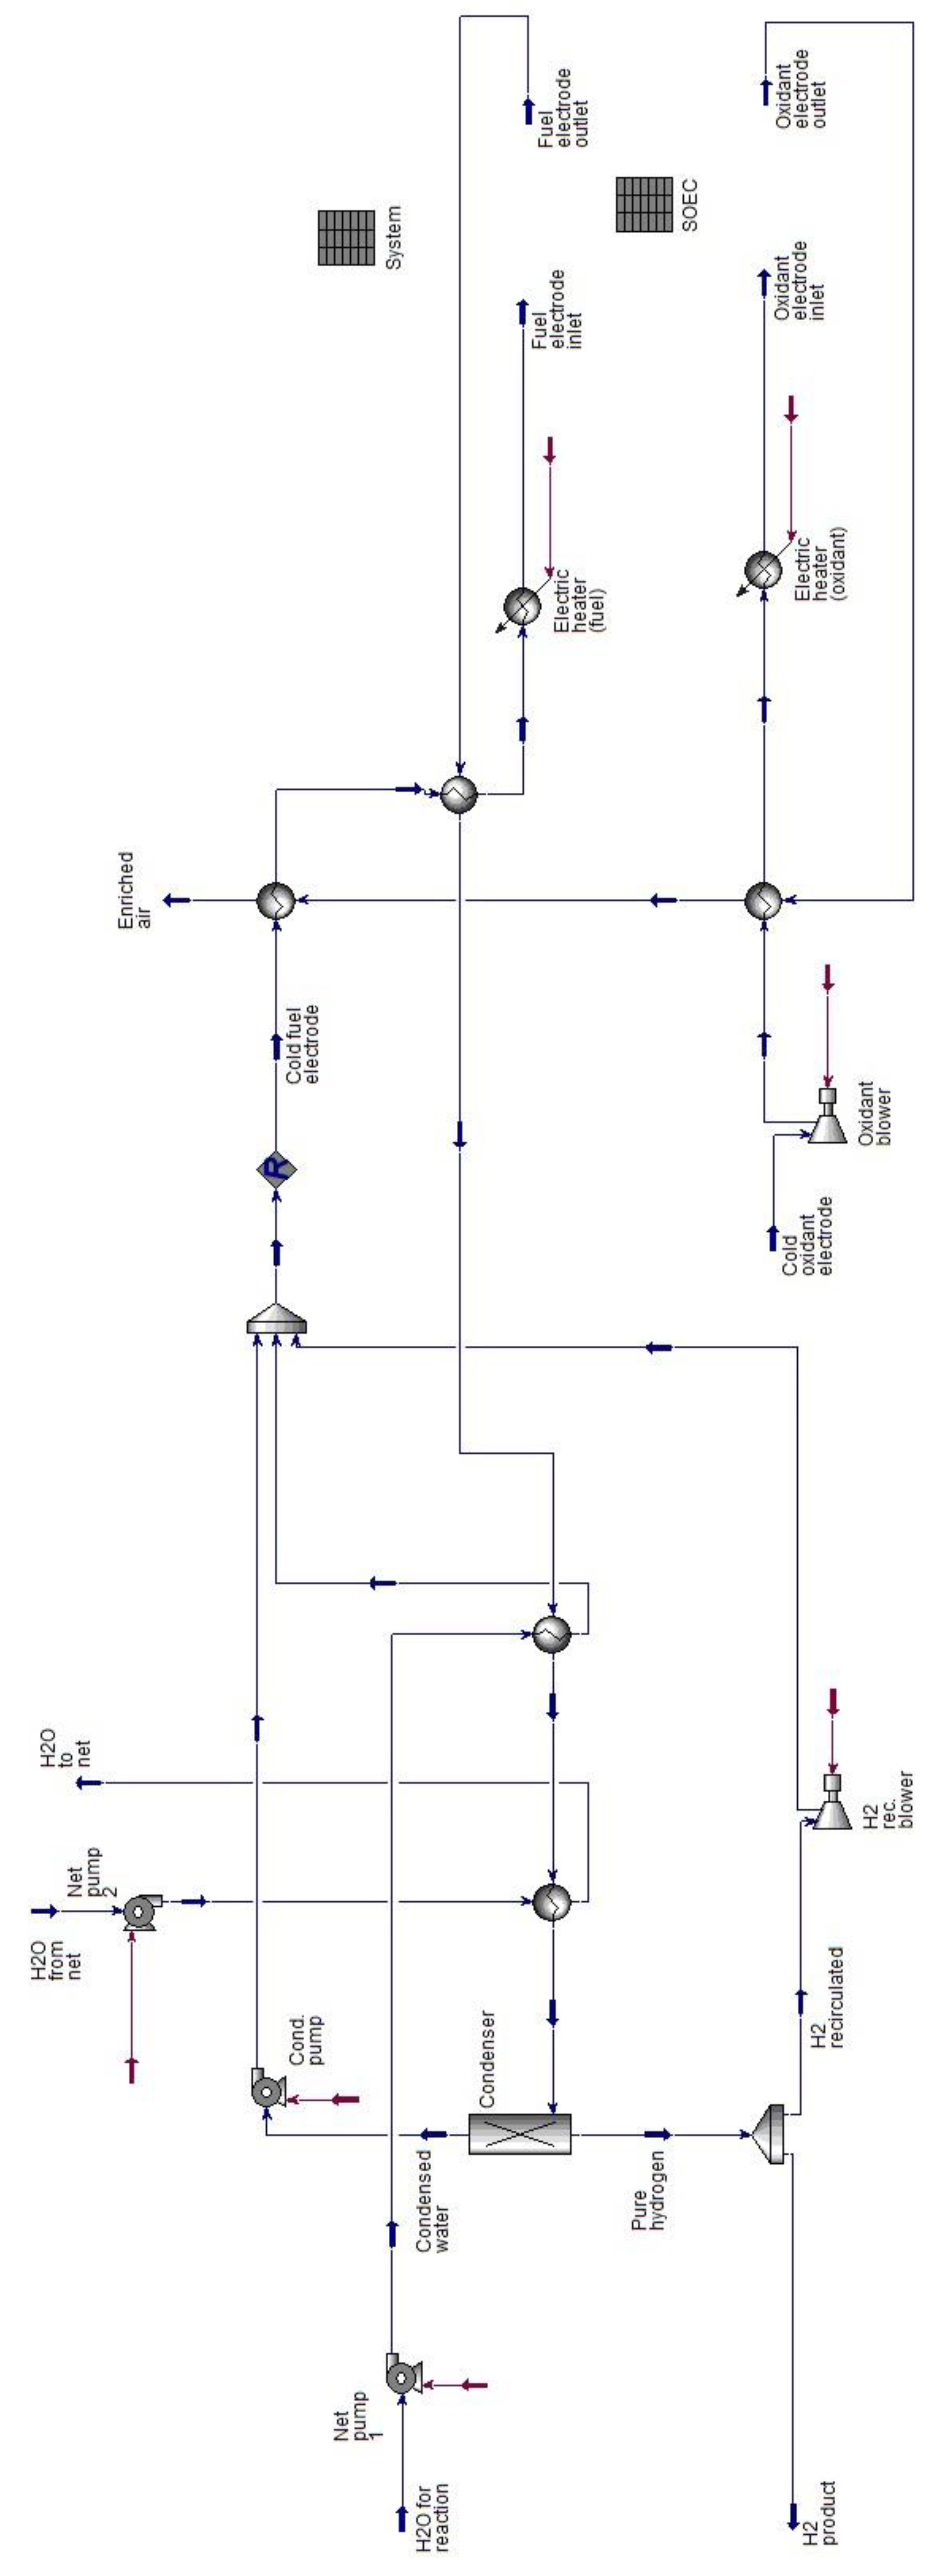
The mathematical model of the analyzed electrolyzer system (Figure 13) comprises two parts. The model of the electrolyzer stack itself was created using an analytical approach and mathematical formulation, implemented in Aspen HYSYS 8.8 as a spreadsheet element. The other components of the entire electrolyzer system, such as heat exchangers, pumps, and blowers, are standard HYSYS models. The "SOE" element, which contains all the mathematical formulas modeling the behavior of the solid oxide electrolyzer cell, is integrated with the other system components. This setup enables automated simulations that provide all the necessary data for performance maps.
The Aspen HYSYS model of the installation is presented in Figure 1. The "SOEC" element is a spreadsheet where all electrochemical calculations are conducted. The "System" spreadsheet is used to obtain the results of the simulations. Other elements in the model mimic the behavior of real physical devices, such as pumps and blowers.
Figure 1.
Scheme of the installation in Aspen HYSYS.
4. Results of Simulations
Simulations were conducted for each temperature (700, 750, and 800°C) and each steam utilization factor (50%, 60%, 70%, and 80%), totaling 12 cases. For each case, voltage, total input power, LHV efficiency, and the ratio of Balance of Plant (BoP) to total power were calculated for current densities between -1.5 and -0.1 A/cm² (negative current values indicate operation in SOE mode).
Figure 1.
Voltage-Current curve for operating temperature 700°C.
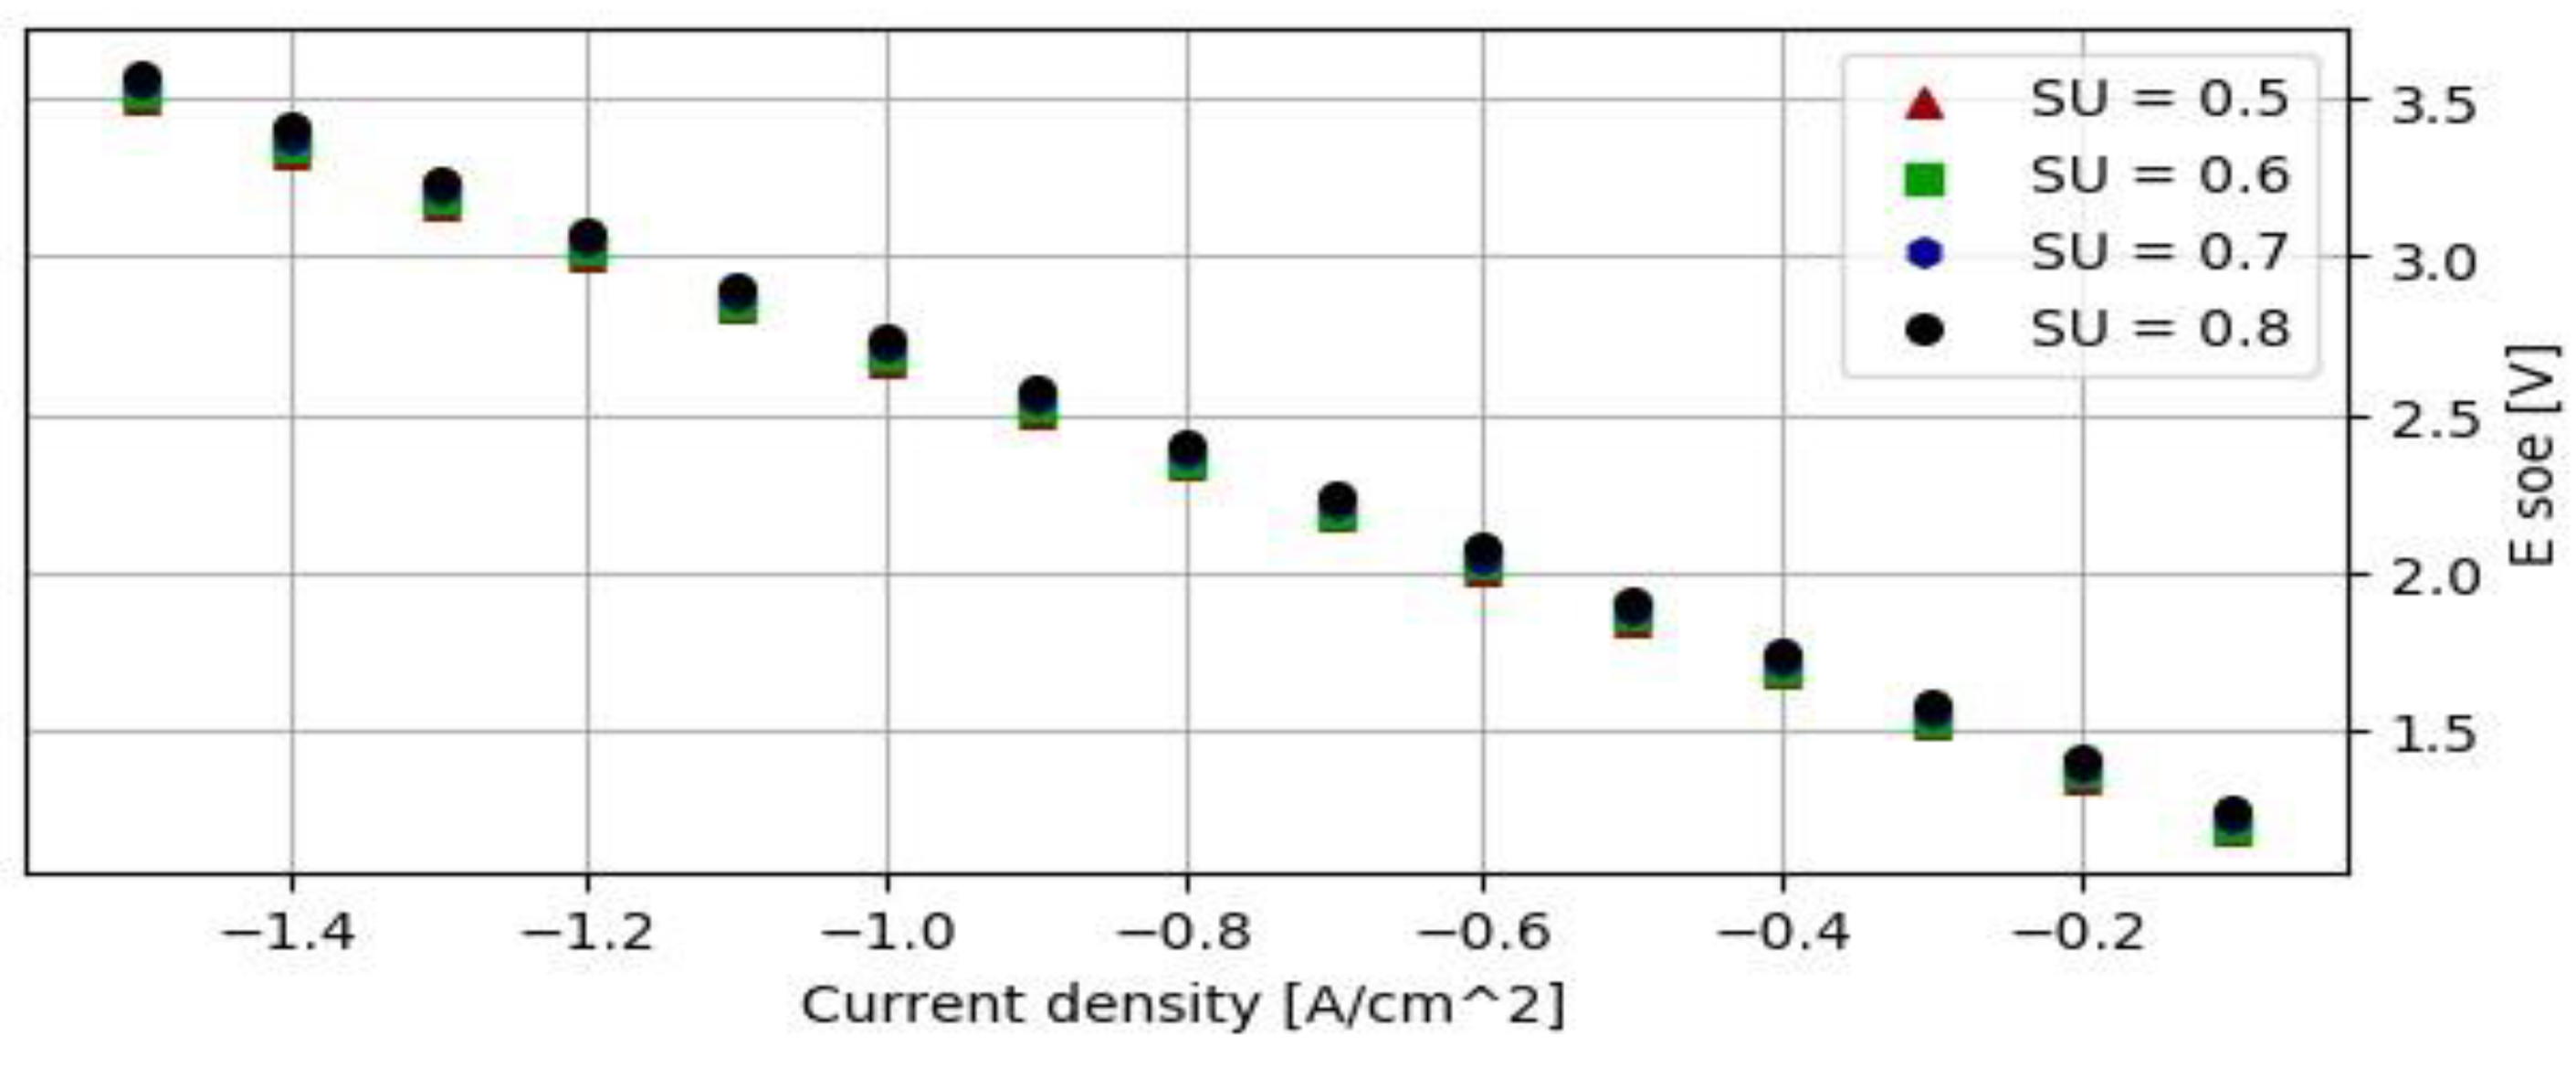
The voltage values across the entire current density range are very similar for a given temperature and different levels of steam utilization (SU). They decrease from 3.57 V at a current density of -1.5 A/cm² to 1.18 V at -0.1 A/cm². In practical applications, SOEC cells are not exposed to voltages over 1.5 V due to the high degradation rate over time. Therefore, at an operating temperature of 700°C, the current density should not exceed -0.3 A/cm² to avoid excessive degradation.
Figure 1.
Efficiency of the system at 700°C.
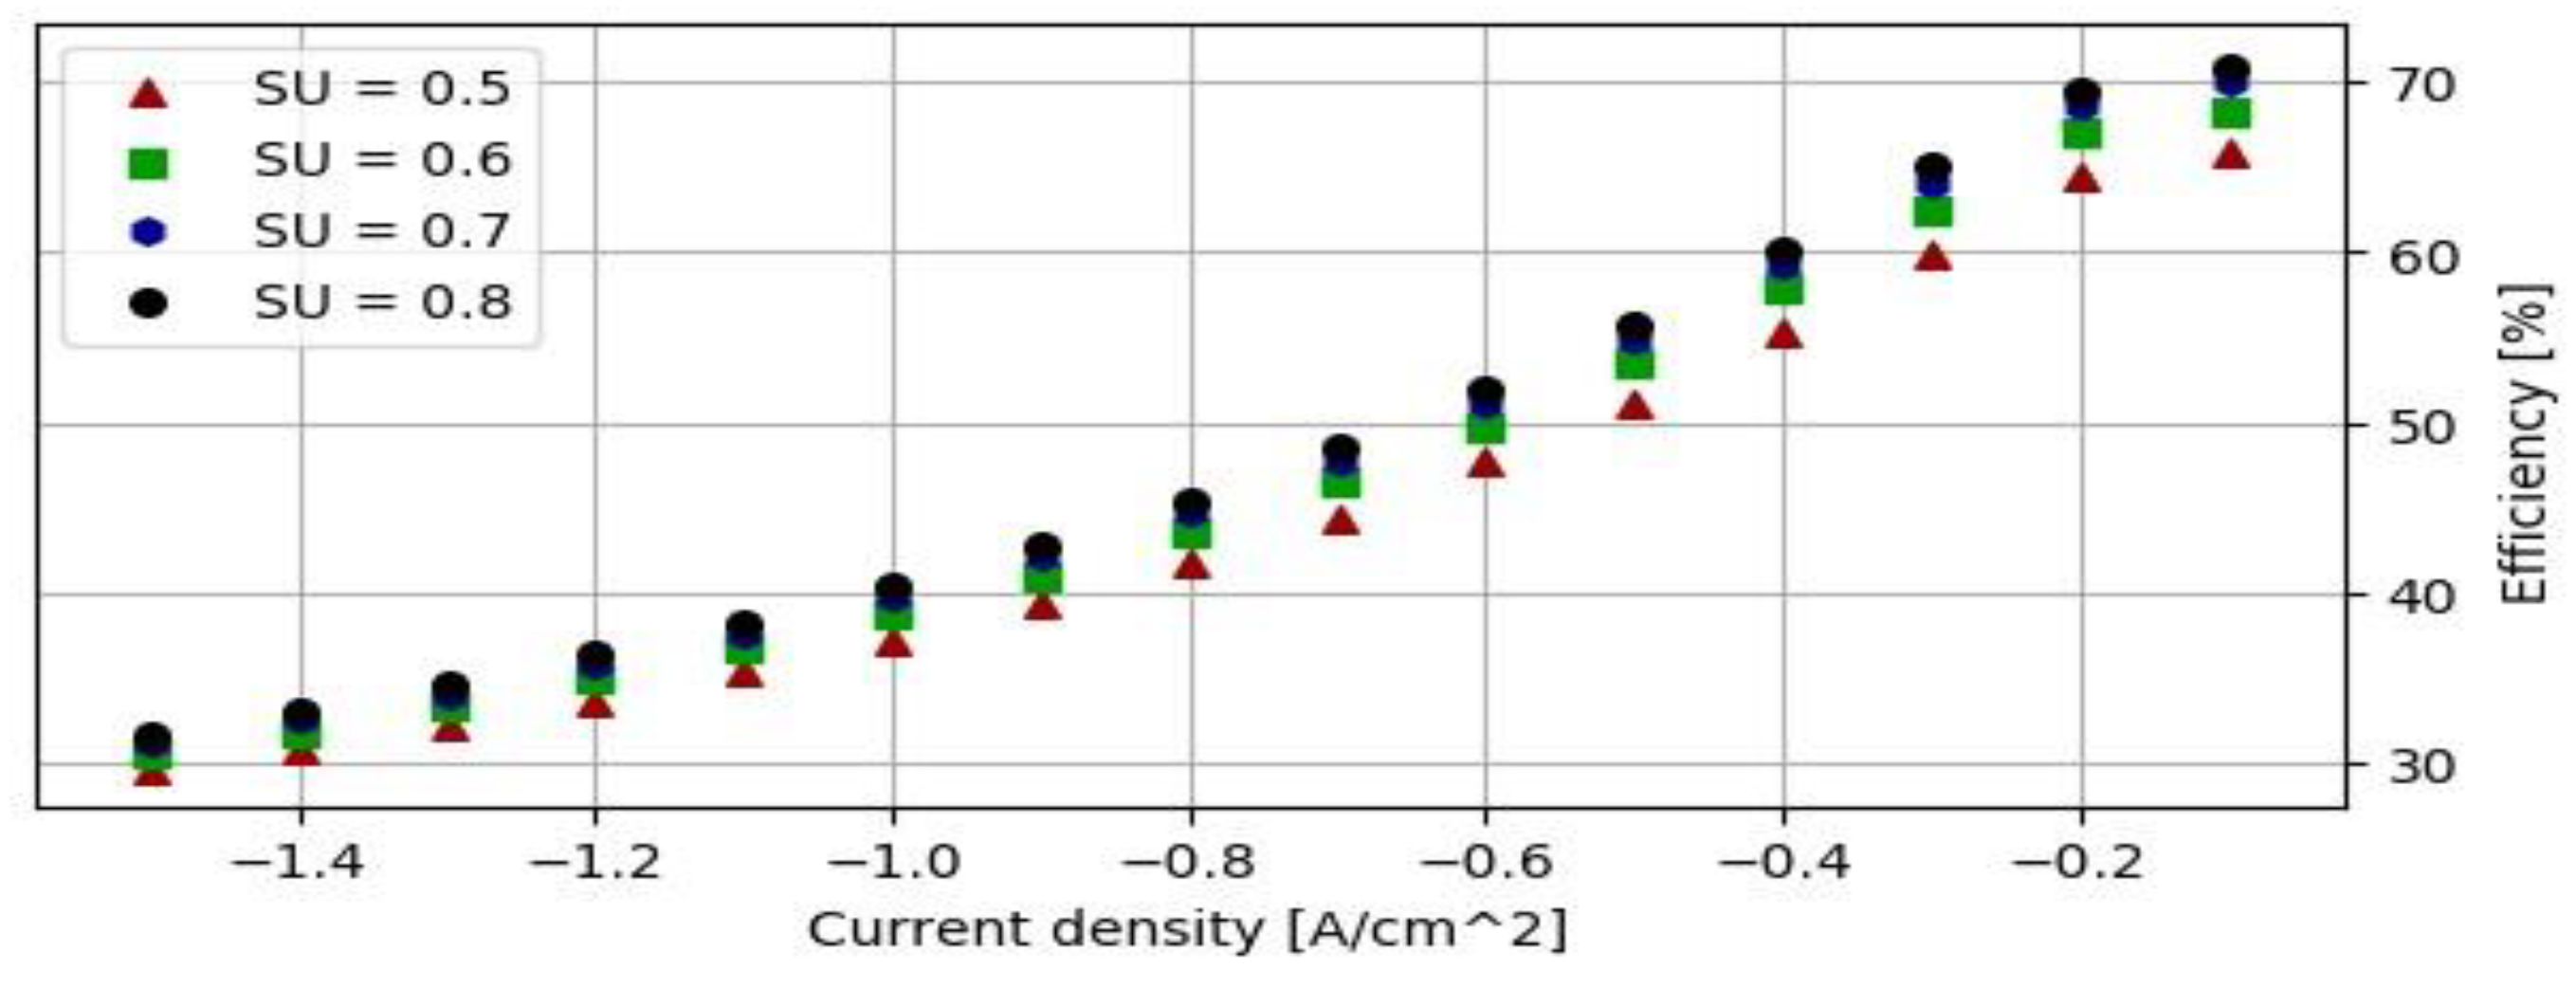
Figure 1.
Efficiency of a system working at 700°C.
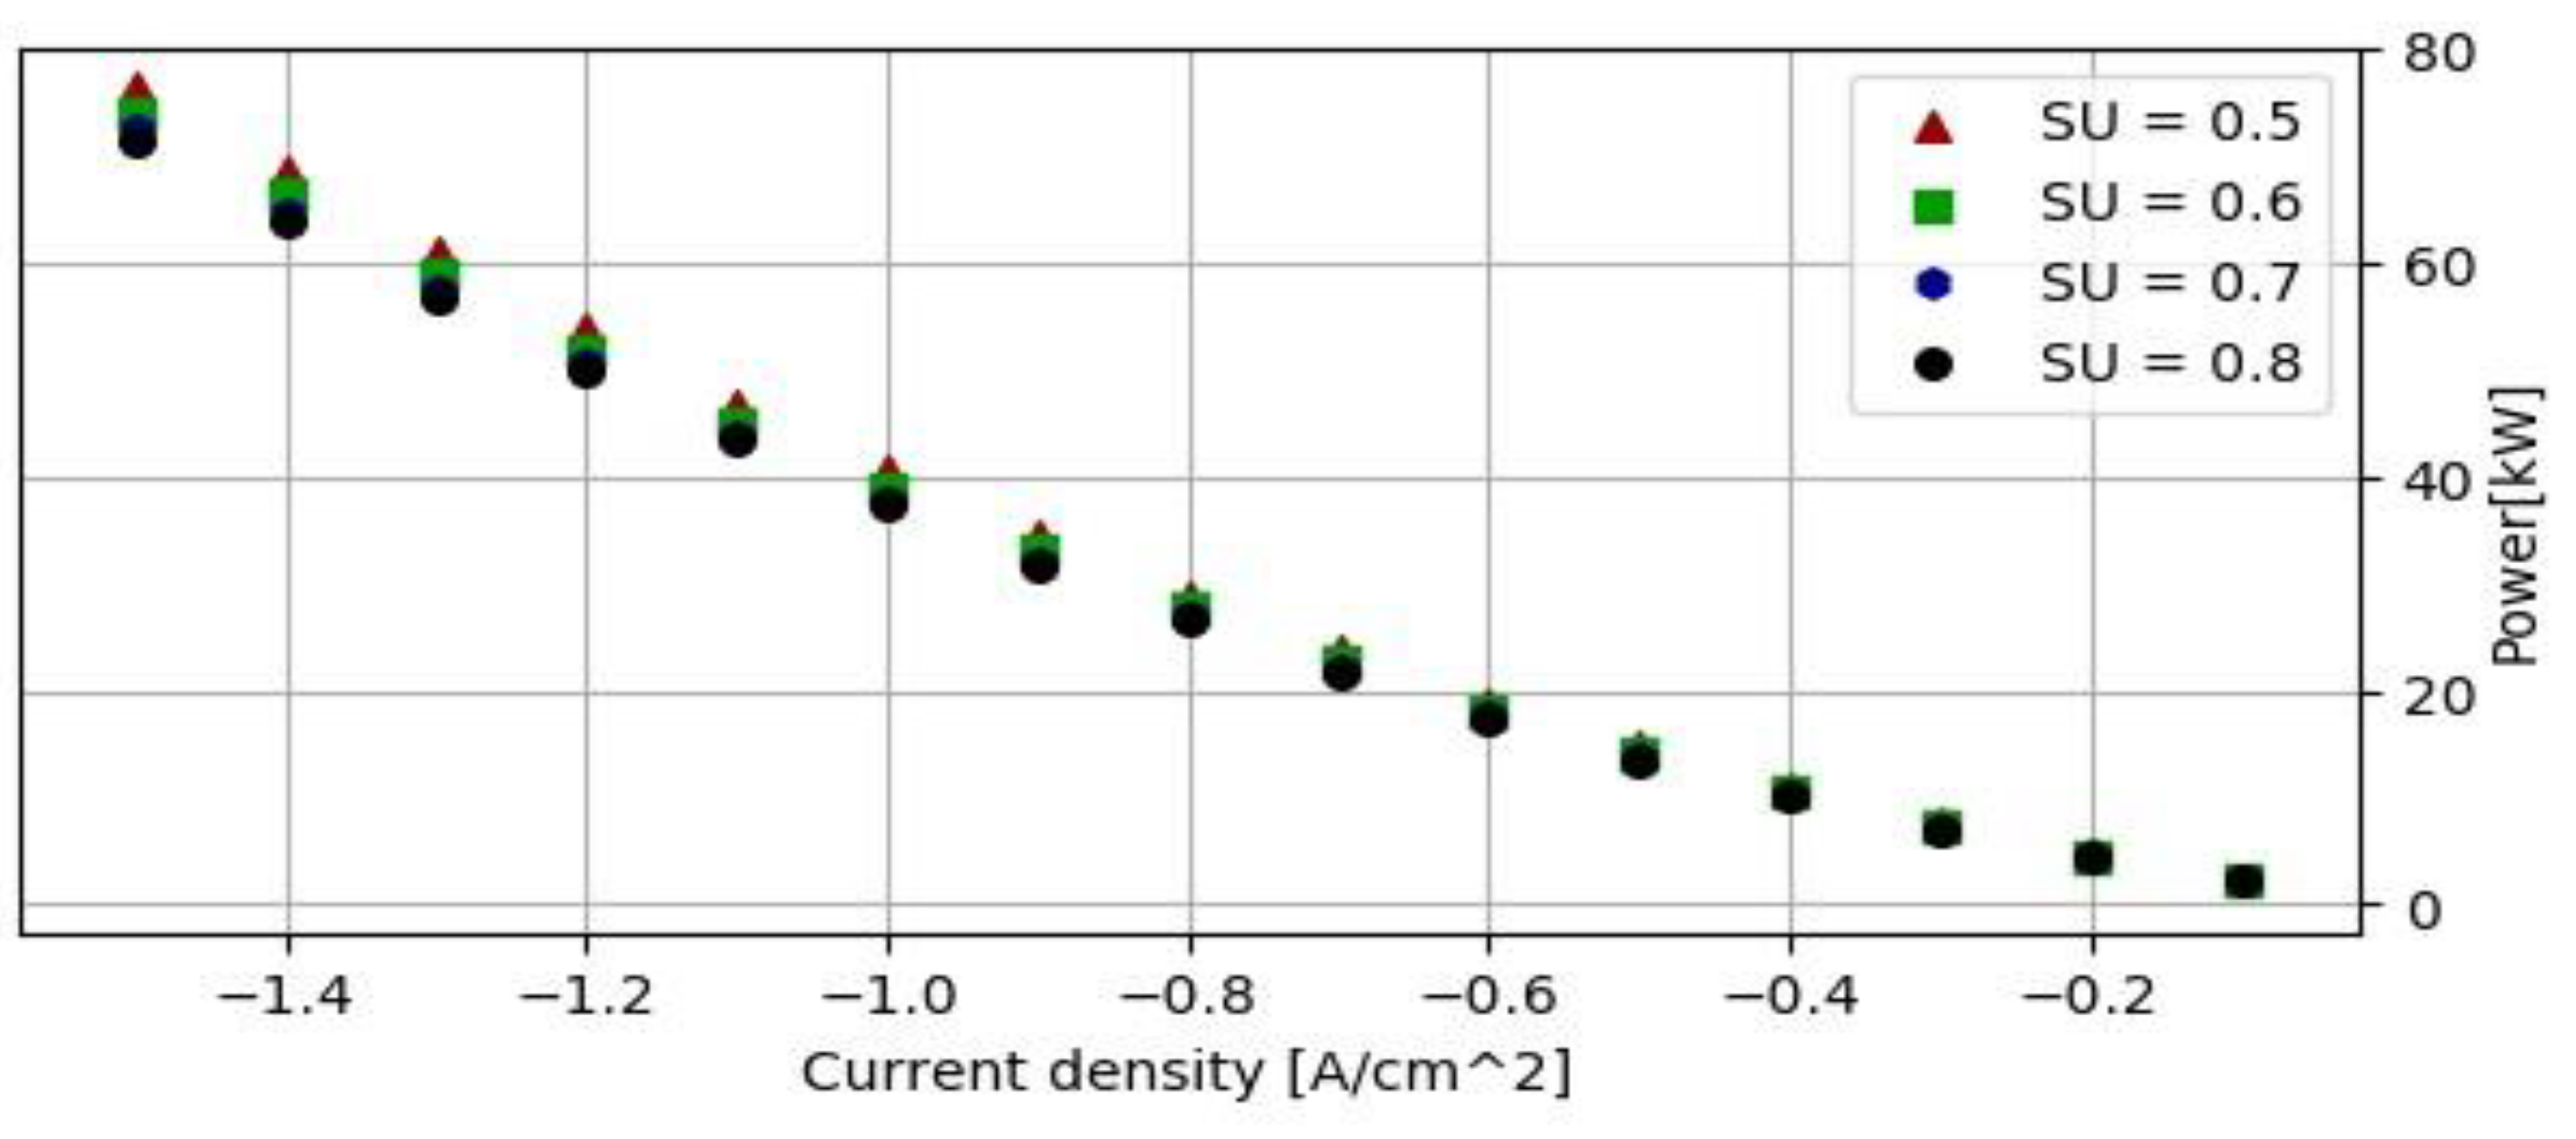
For all analyzed values of steam utilization (SU), the total power input varies significantly across the entire simulated range of current density. For a nominal power of 25 kW (measured at 700°C), the maximum obtained power is over 76.29 kW for an SU of 0.5 and a current density of -1.5 A/cm², while the minimum value is 2.12 kW for an SU of 0.8 and a current density of -0.1 A/cm². Generally, higher SU requires higher input power. Power decreases with decreasing current density, and the differences between values for different steam utilizations also diminish with decreasing current density.
LHV efficiency steadily increases as the current density approaches 0 A/cm². However, the rate of increase slows down at low current density values. The reason for this will be analyzed using the BoP/P ratio later in this chapter. LHV efficiencies vary between 30% and 70%, with higher values observed for higher steam utilization ratios. The differences between efficiencies for particular SU values become more pronounced as the current density decreases.
Figure 1.
Ratio of BoP to total power input at 700°C.
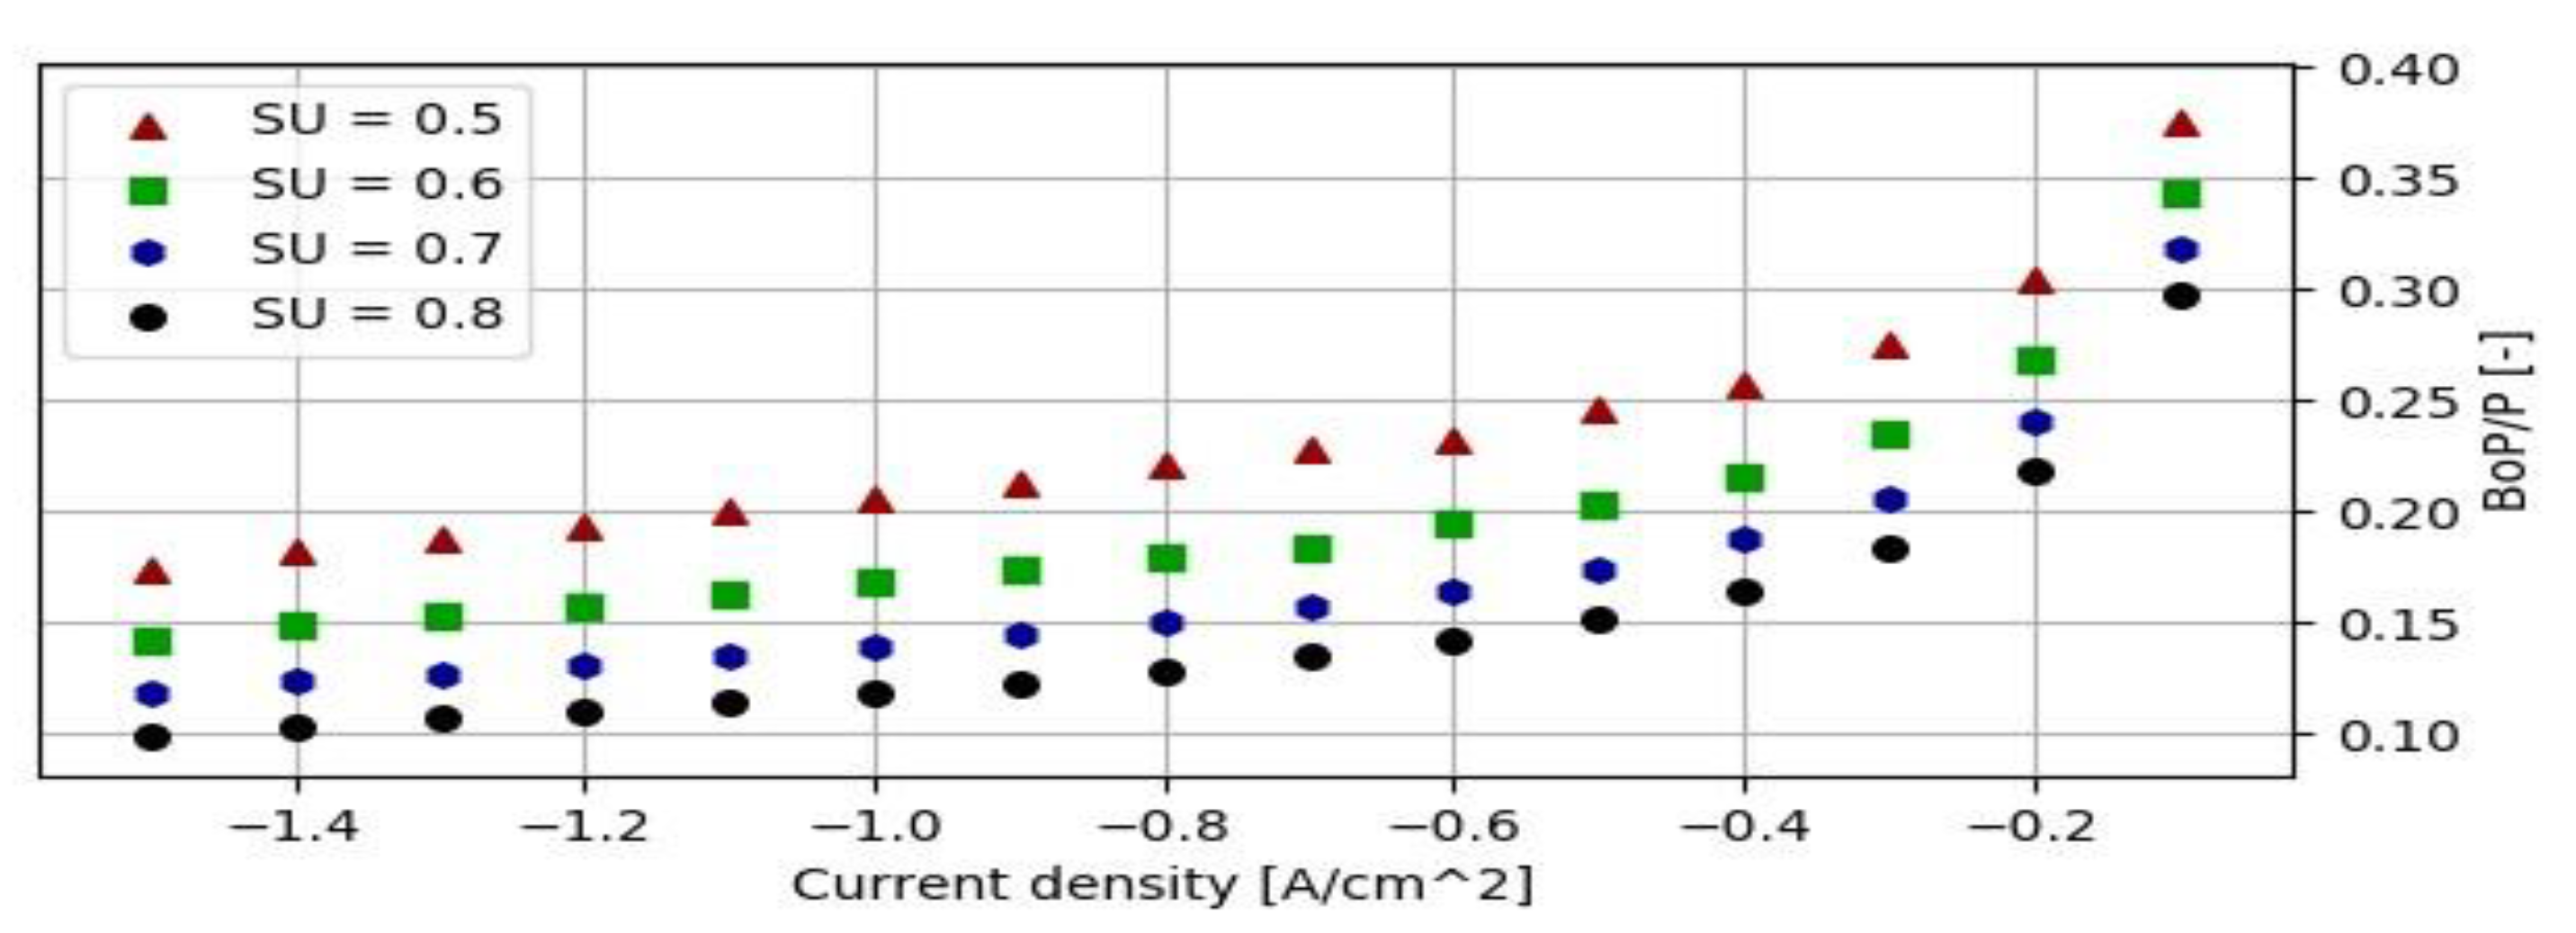
The share of the Balance of Plant (BoP) in total power consumption steadily increases with decreasing current for all steam utilization factor values. The range of the ratio's values is between 0.1 and 0.37. A sudden increase can be observed between -0.2 and -0.1 A/cm² for all SUs. This is caused by the inefficient operation of the system’s devices, such as blowers, which were forced to operate in extreme regions of their characteristic maps. For the given parameter set, the hydrogen blower was working at a very low volumetric flow, resulting in an efficiency decrease to 6%. The air blower was operating at an even lower efficiency of around 4.5%. The working point for a steam utilization value of 0.5 is marked as a red dot in Figure 1. This inefficiency is also reflected in the system's efficiency graph, where the last point is lower than anticipated due to the significantly higher required power input.
Figure 1.
Working point of air blower for -0.1 A/cm2.
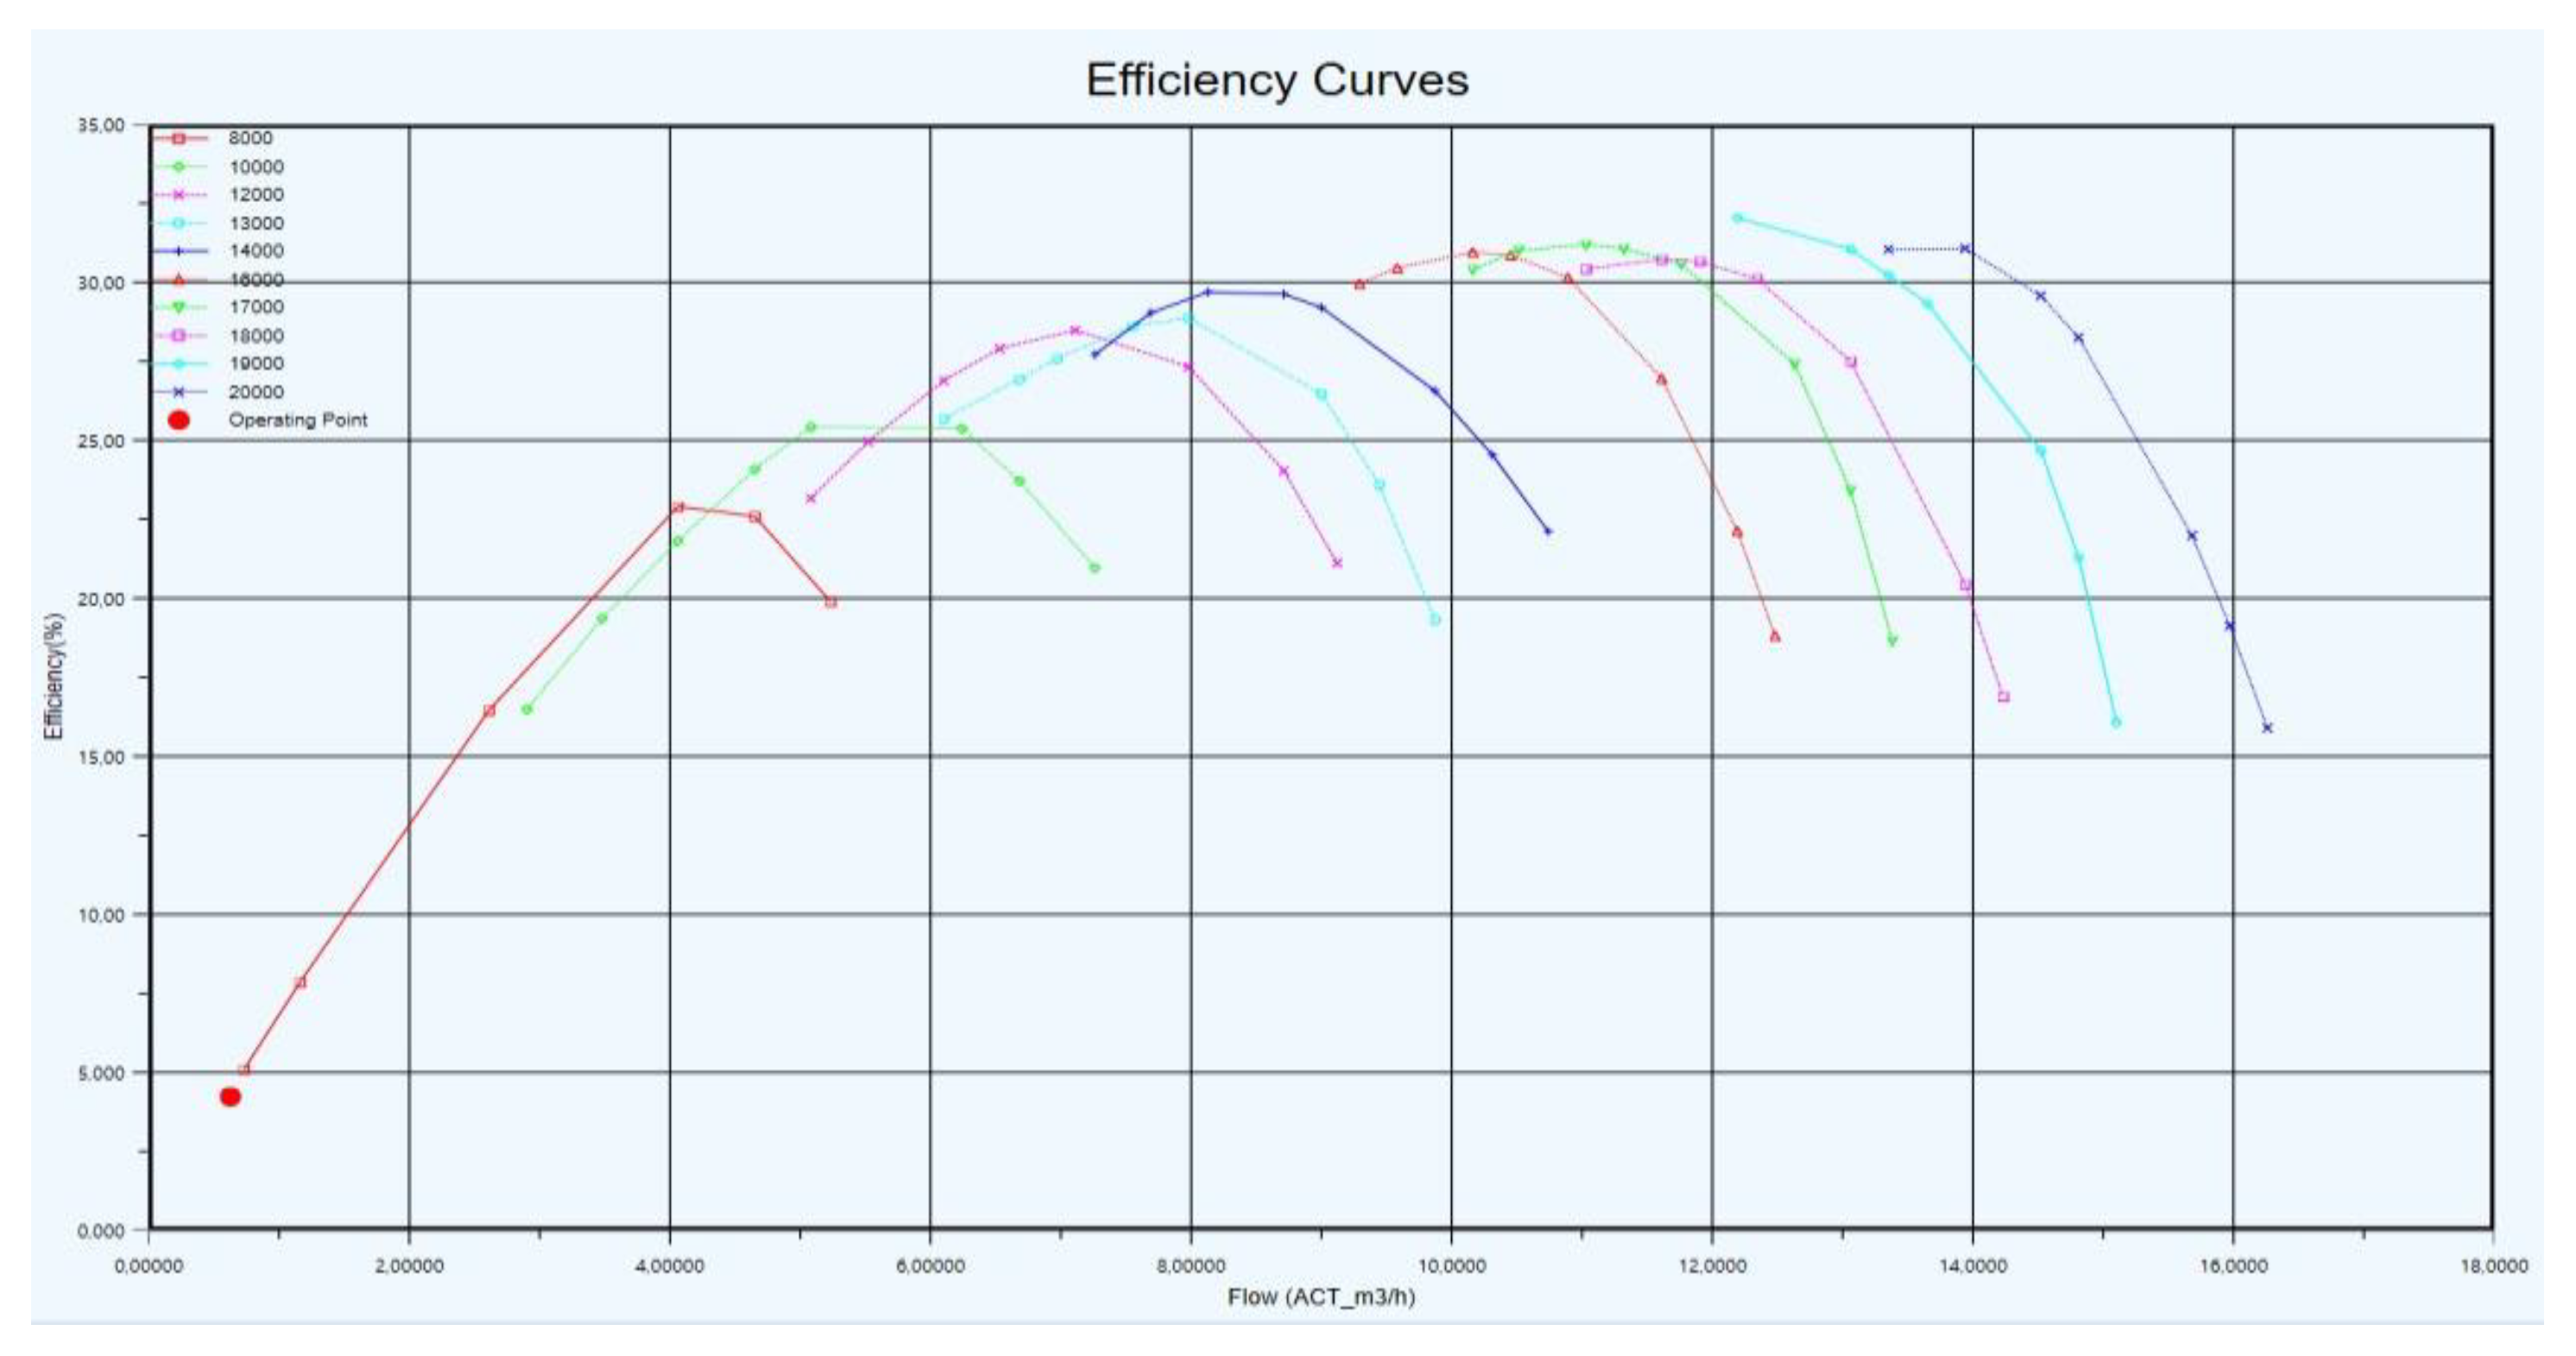
Figure 1.
Voltage-Current curve for operating temperature 750°C.
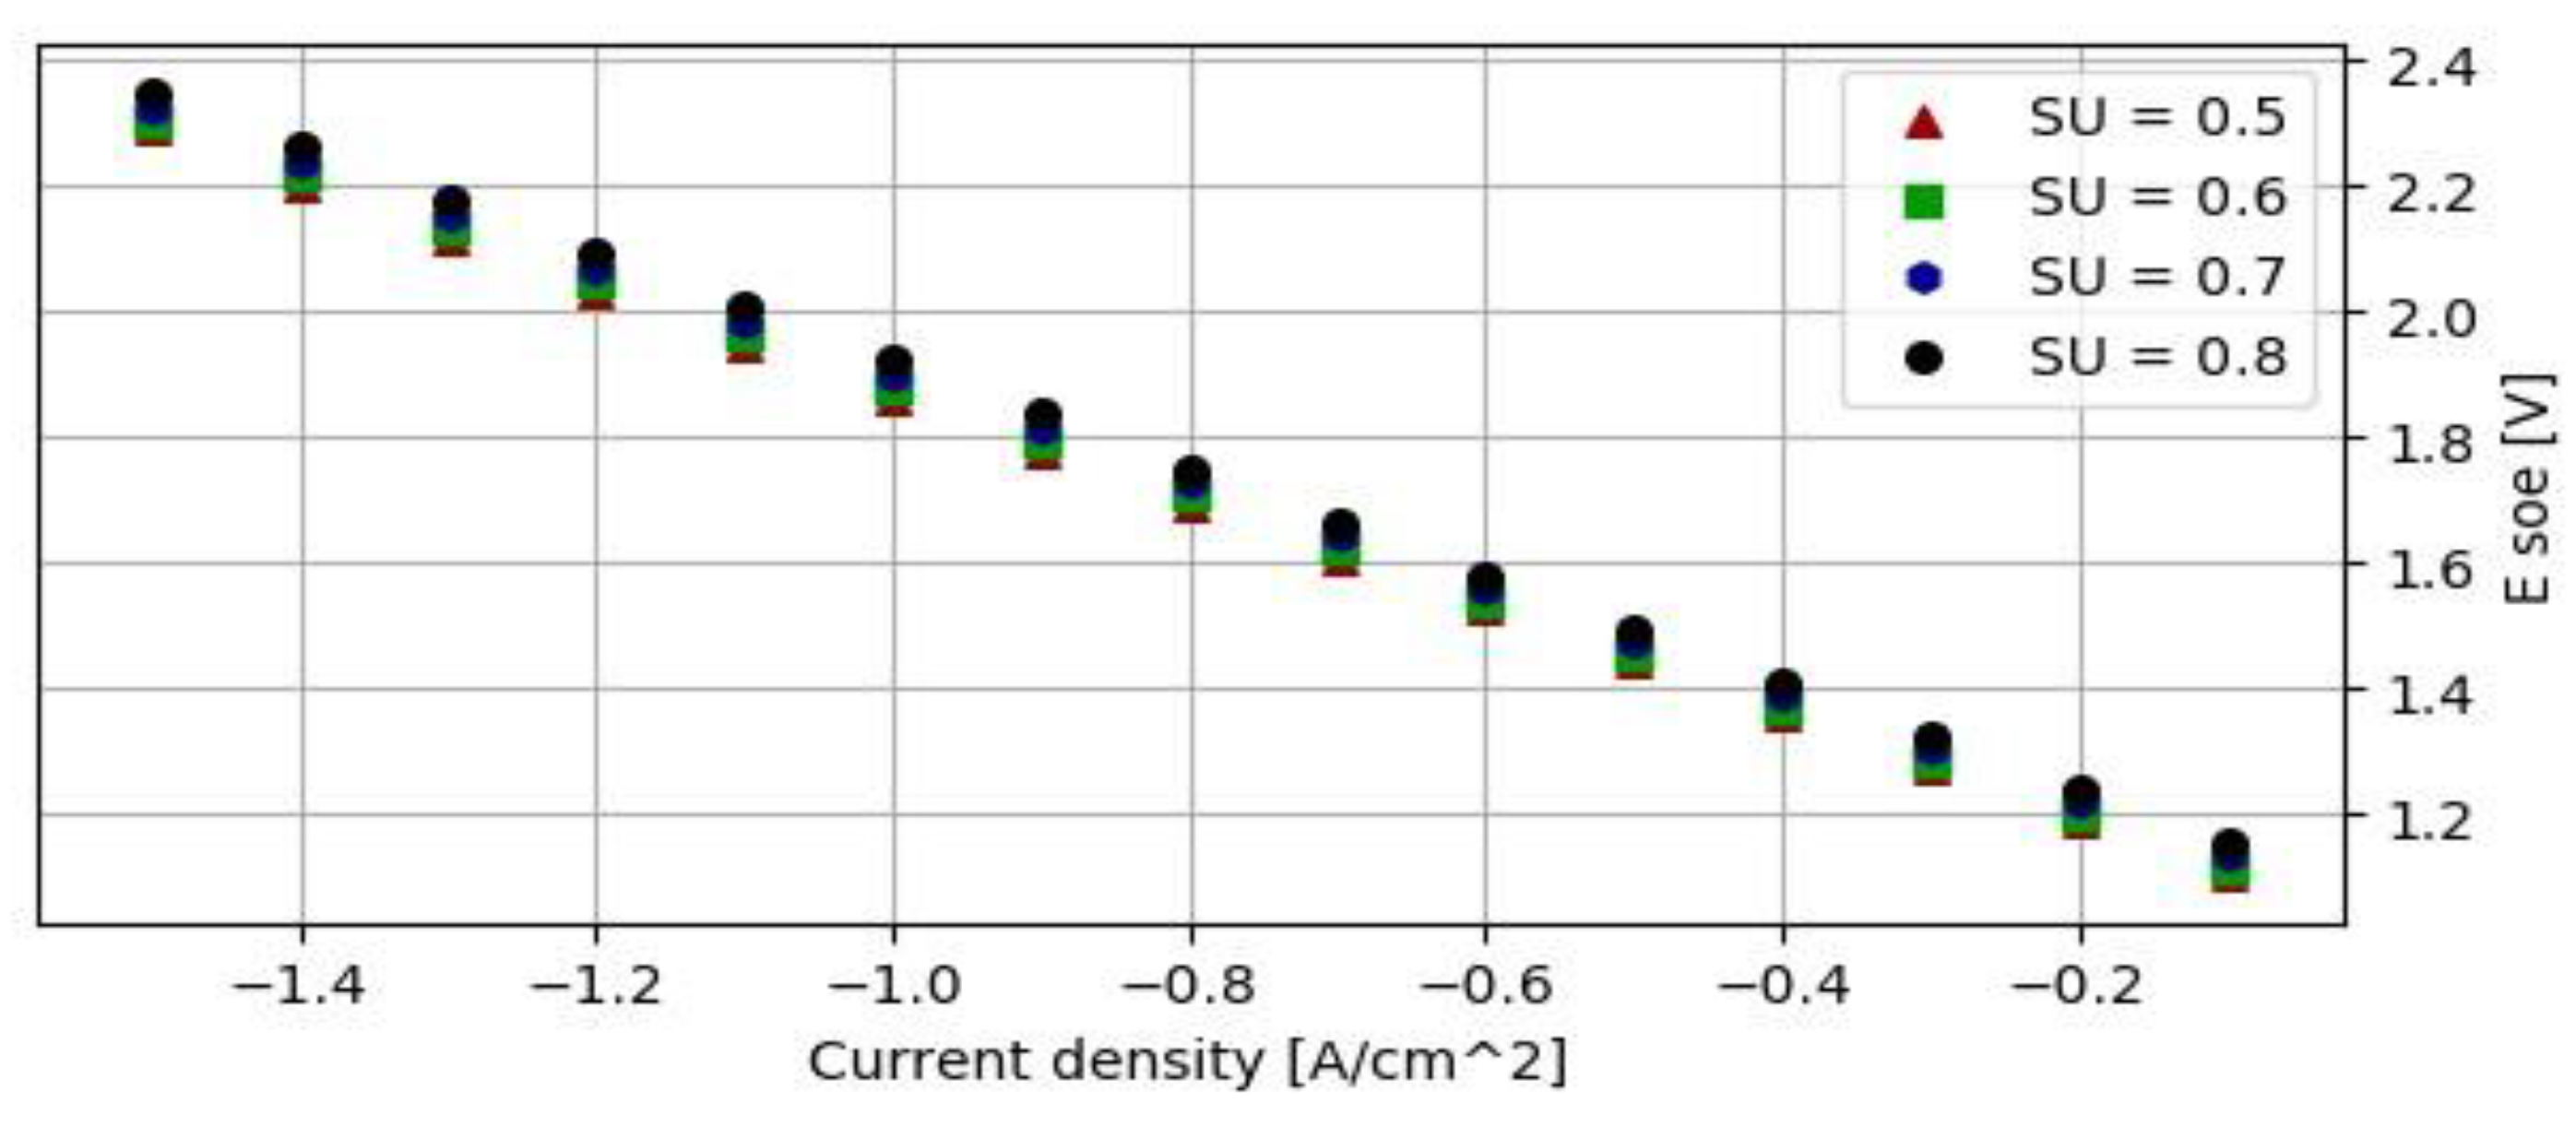
As expected, the voltage values are lower at higher temperatures. The maximum SOE voltage obtained at -1.5 A/cm² is 2.34 V for SU=0.8, compared to 3.57 V at 700°C. The differences in voltage for different SU levels are also very small. At the current temperature of 750°C, the SOE cell should operate with current densities higher than -0.6 A/cm².
Figure 1.
Total power input of the installation at 750°C.
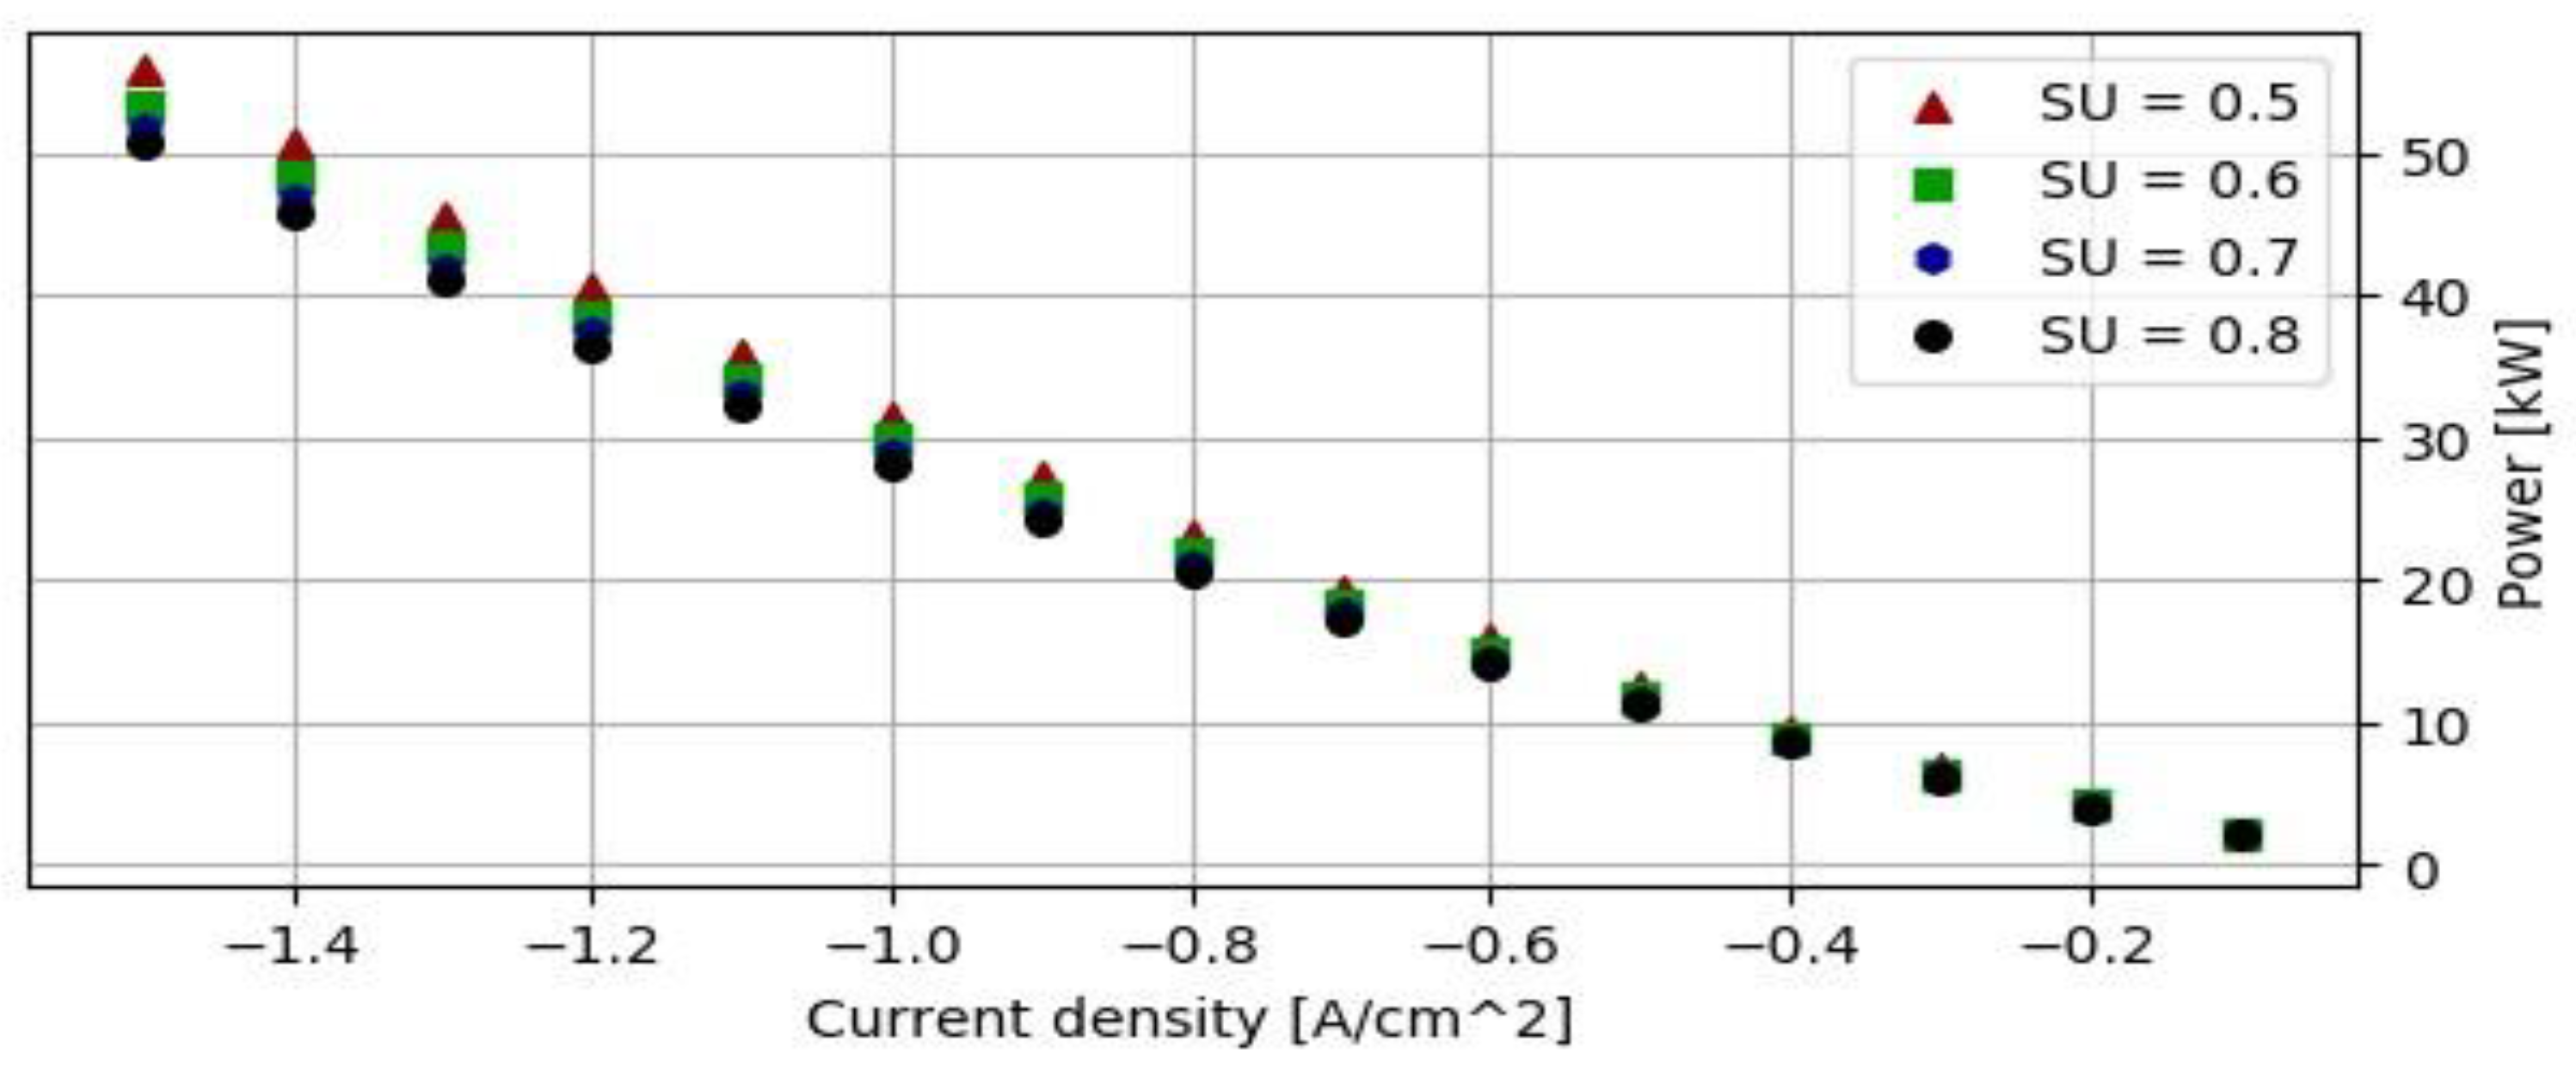
At 750°C, the total power input ranges from 55.8 kW for SU=0.5 at -1.5 A/cm² to 2.02 kW for SU=0.8 at -0.1 A/cm². The required power is lower than that at an operating temperature of 700°C, where the maximum was 76.29 kW. Similar to the previous observations, a lower steam utilization ratio necessitates a higher power input.
Figure 1.
Efficiency of the system at 750°C.
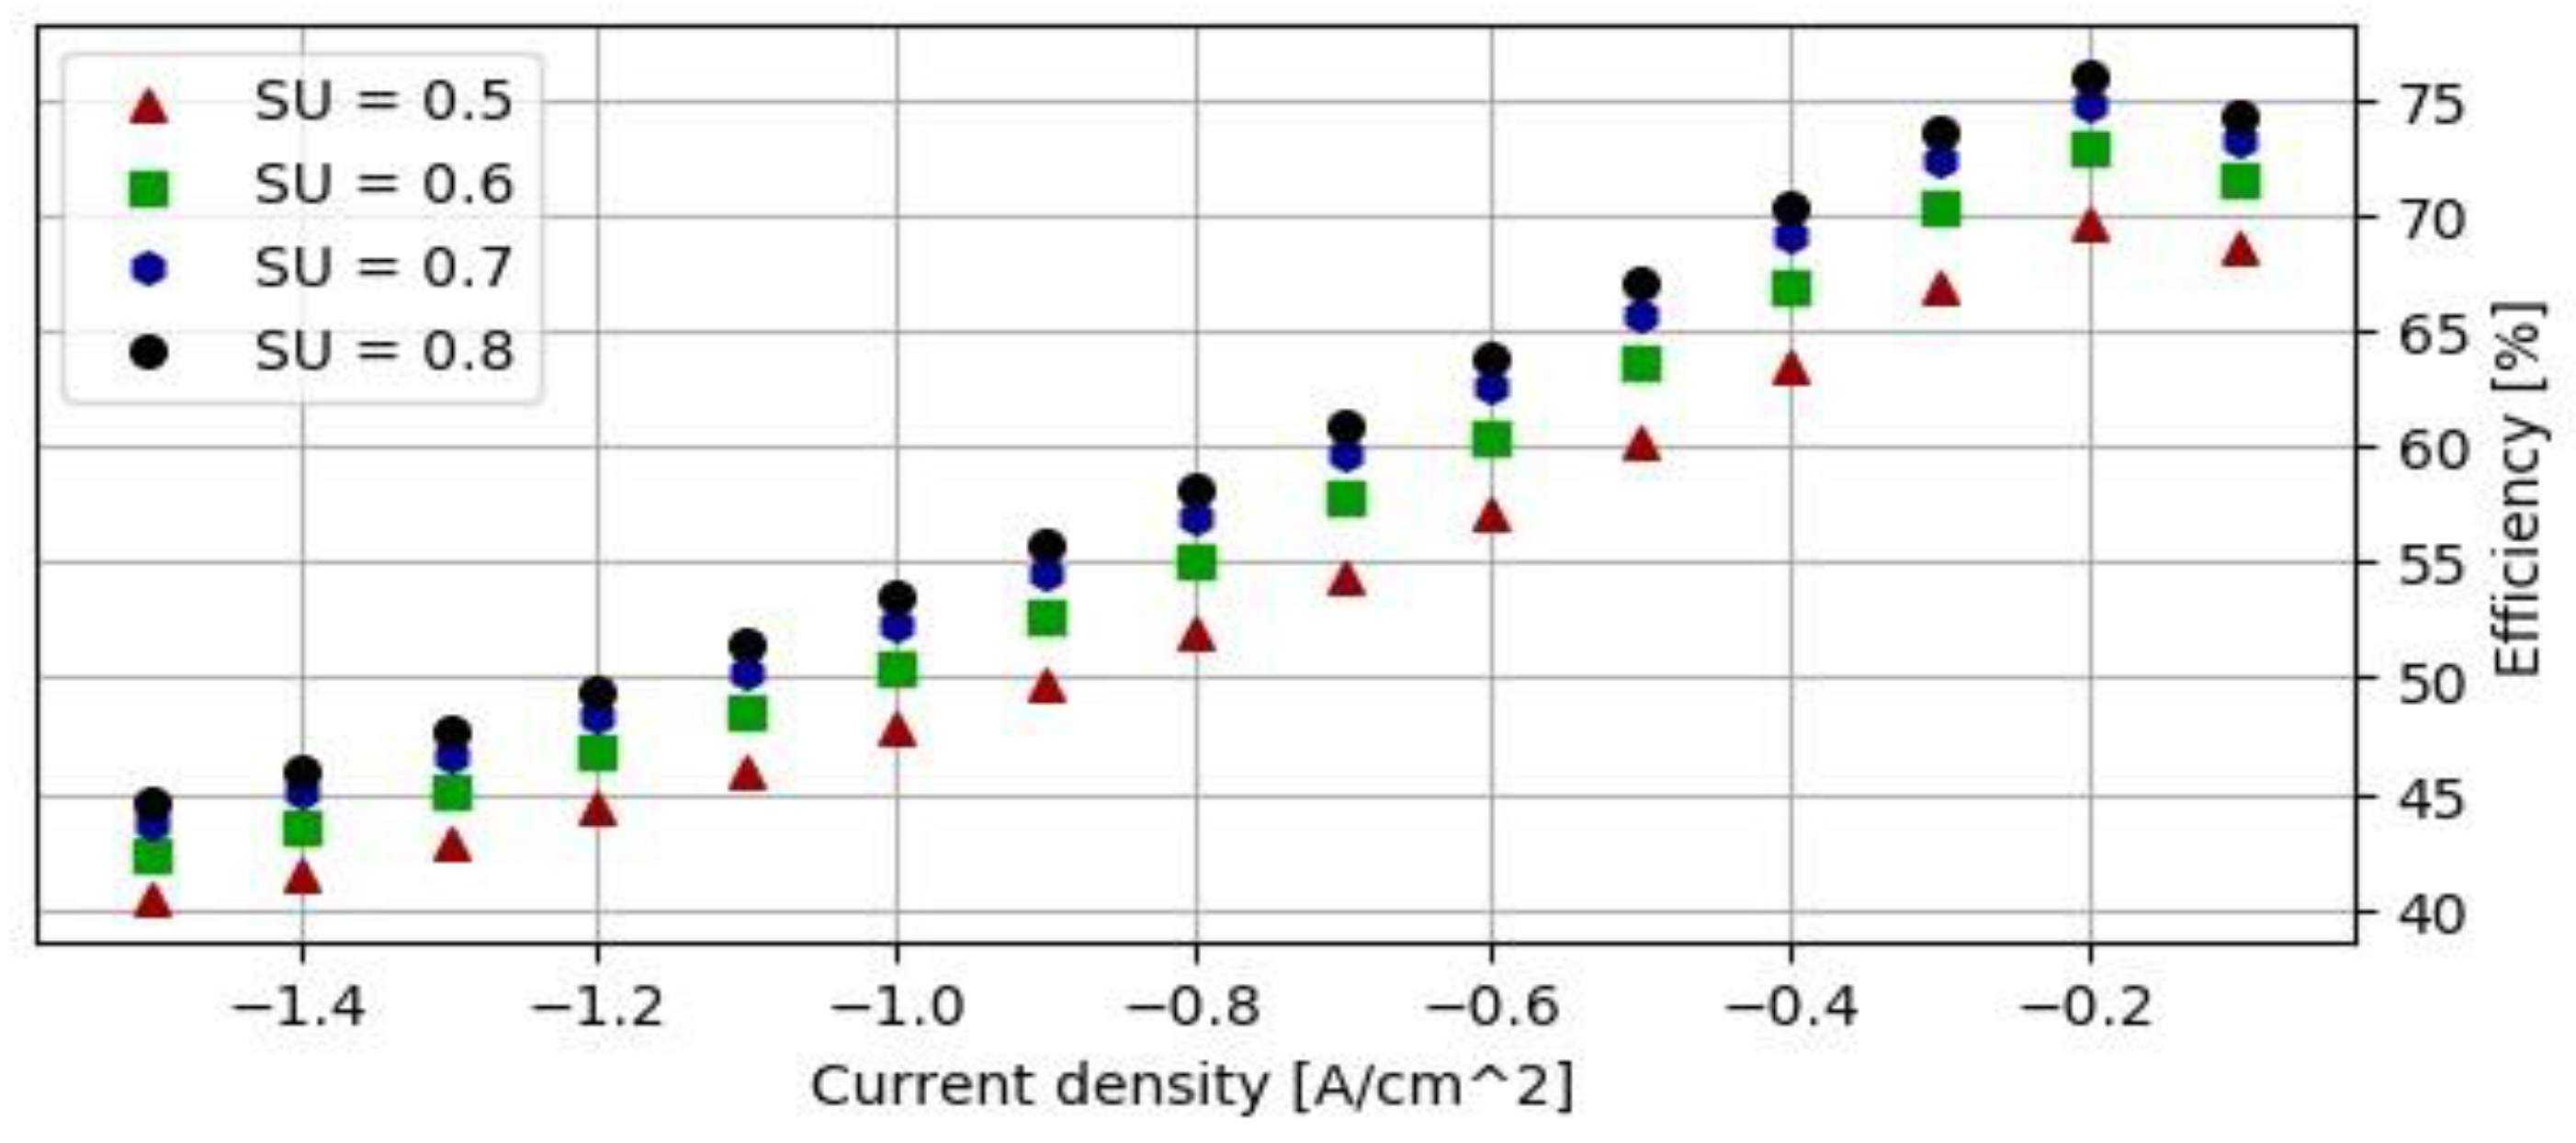
LHV efficiency increases from 40% for SU=0.5 at -1.5 A/cm² to 74% for SU=0.8 at -0.1 A/cm². However, the efficiency for the last case at -0.1 A/cm² is not the maximum observed. The highest efficiency was actually at a higher current density of -0.2 A/cm². A similar effect was observed at 700°C, related to the low efficiency of the system’s devices for the given set of parameters. However, at the lower temperature, the efficiency did not decrease in the last step; the rate of increase was simply smaller.
Figure 1.
Ratio of BoP to total power input at 800°C.
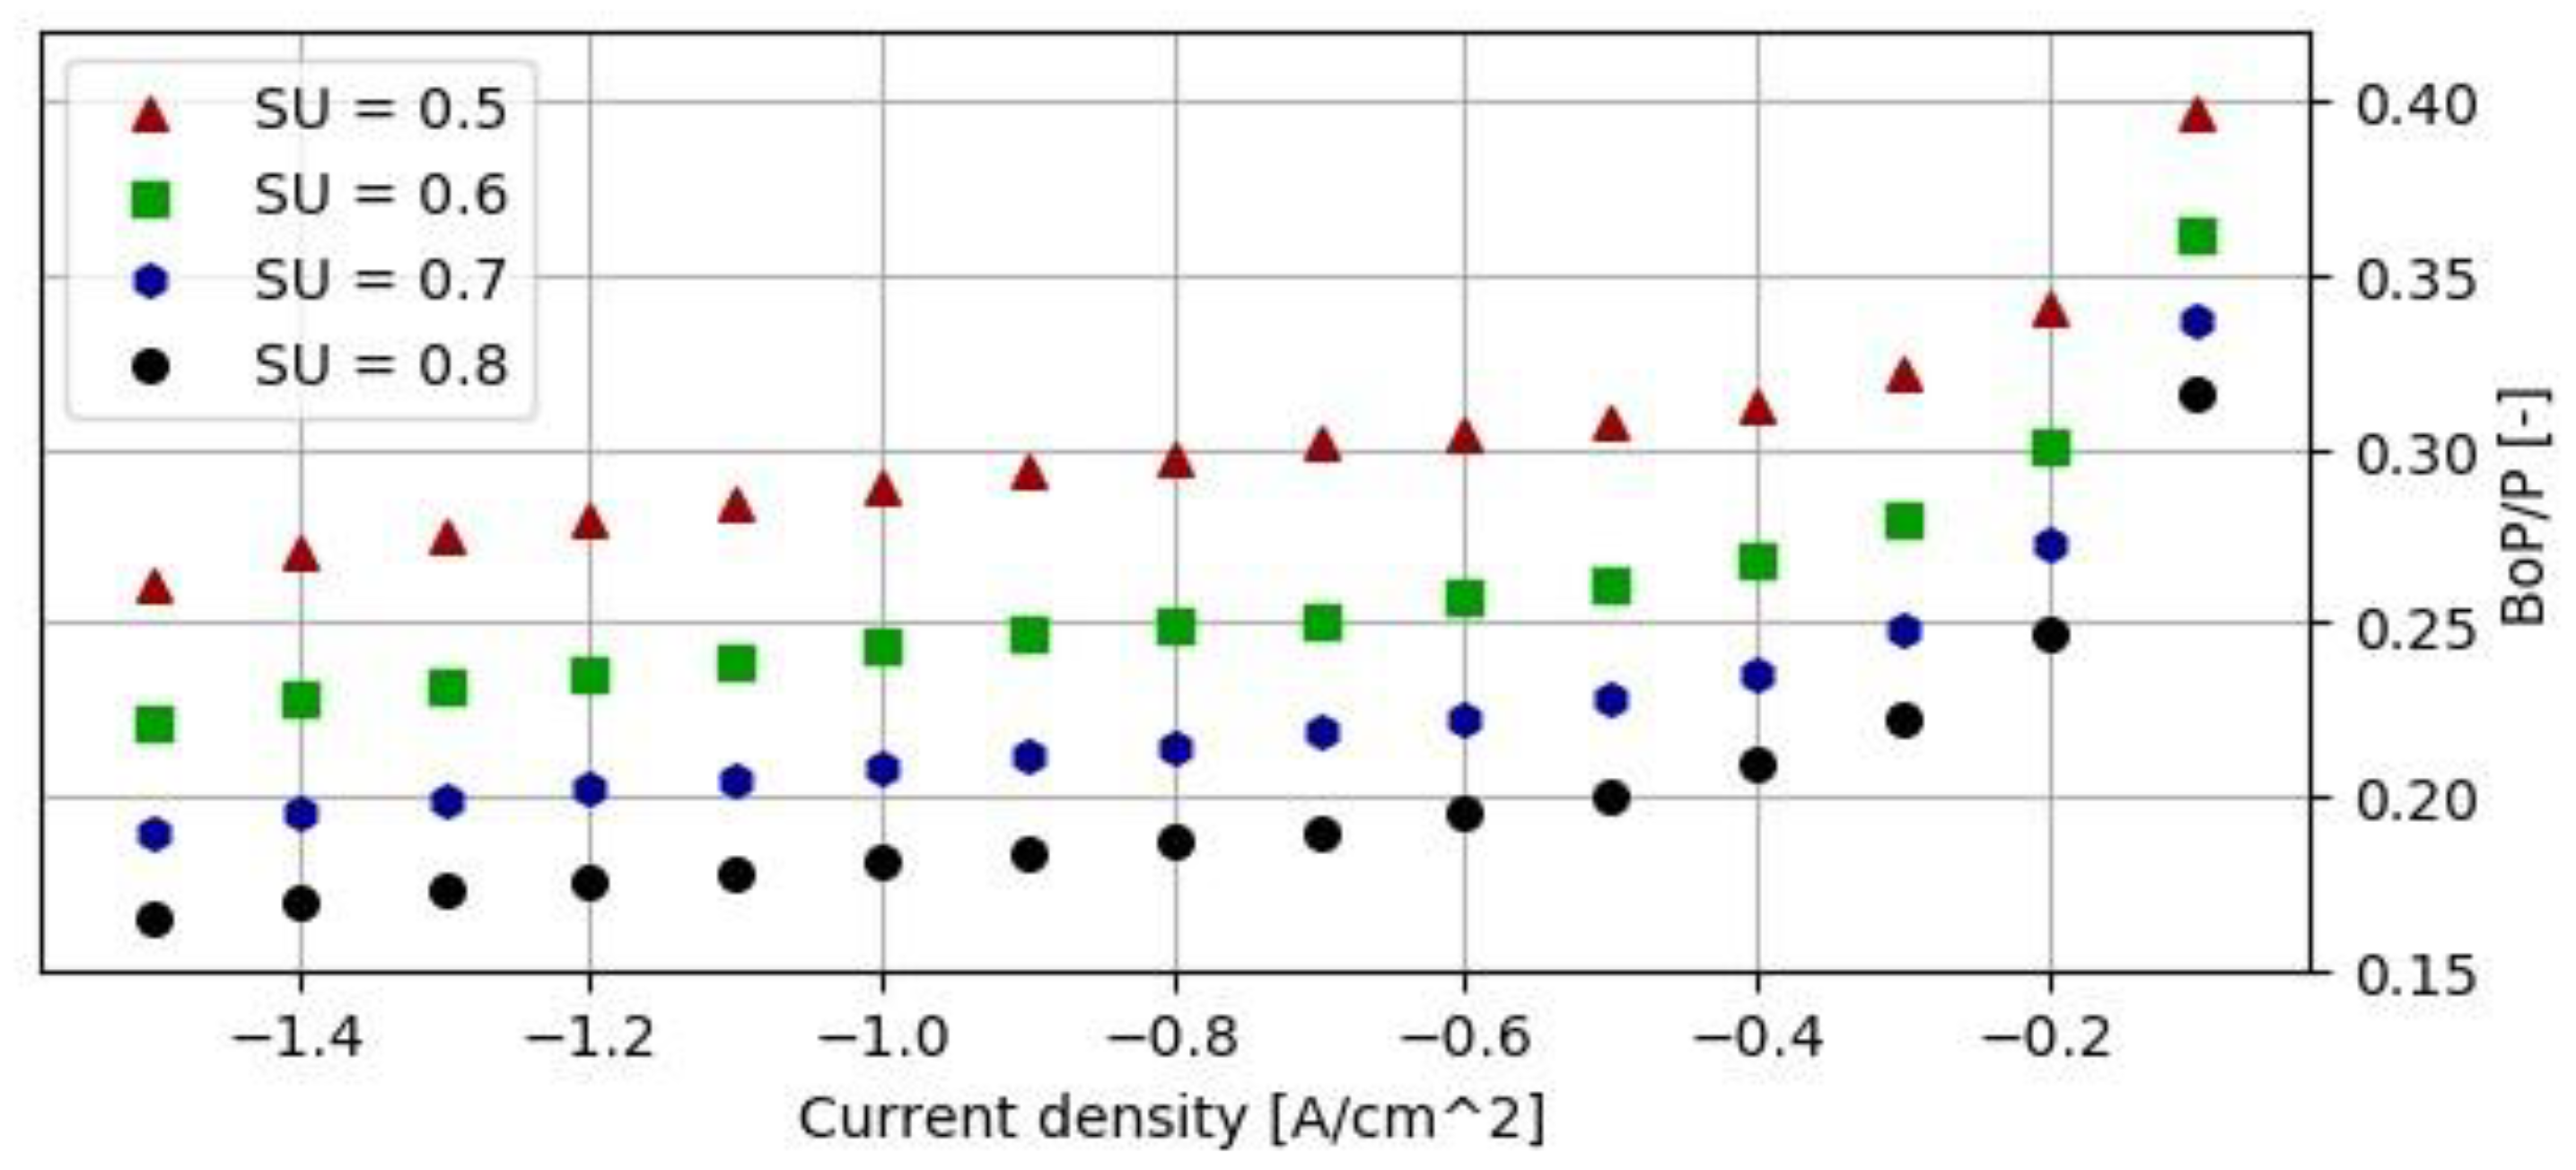
The share of Balance of Plant (BoP) in total power input increases as current density decreases, ranging from 0.17 for SU=0.8 at -1.5 A/cm² to 0.39 for SU=0.5 at -0.1 A/cm². Once again, a sudden increase is observed at the end of the analyzed range, specifically at a current density of -0.1 A/cm². This is related to the increased power consumption by the blowers, which are operating in their inefficient regions.
Figure 1.
Voltage-Current curve for operating temperature 800°C.
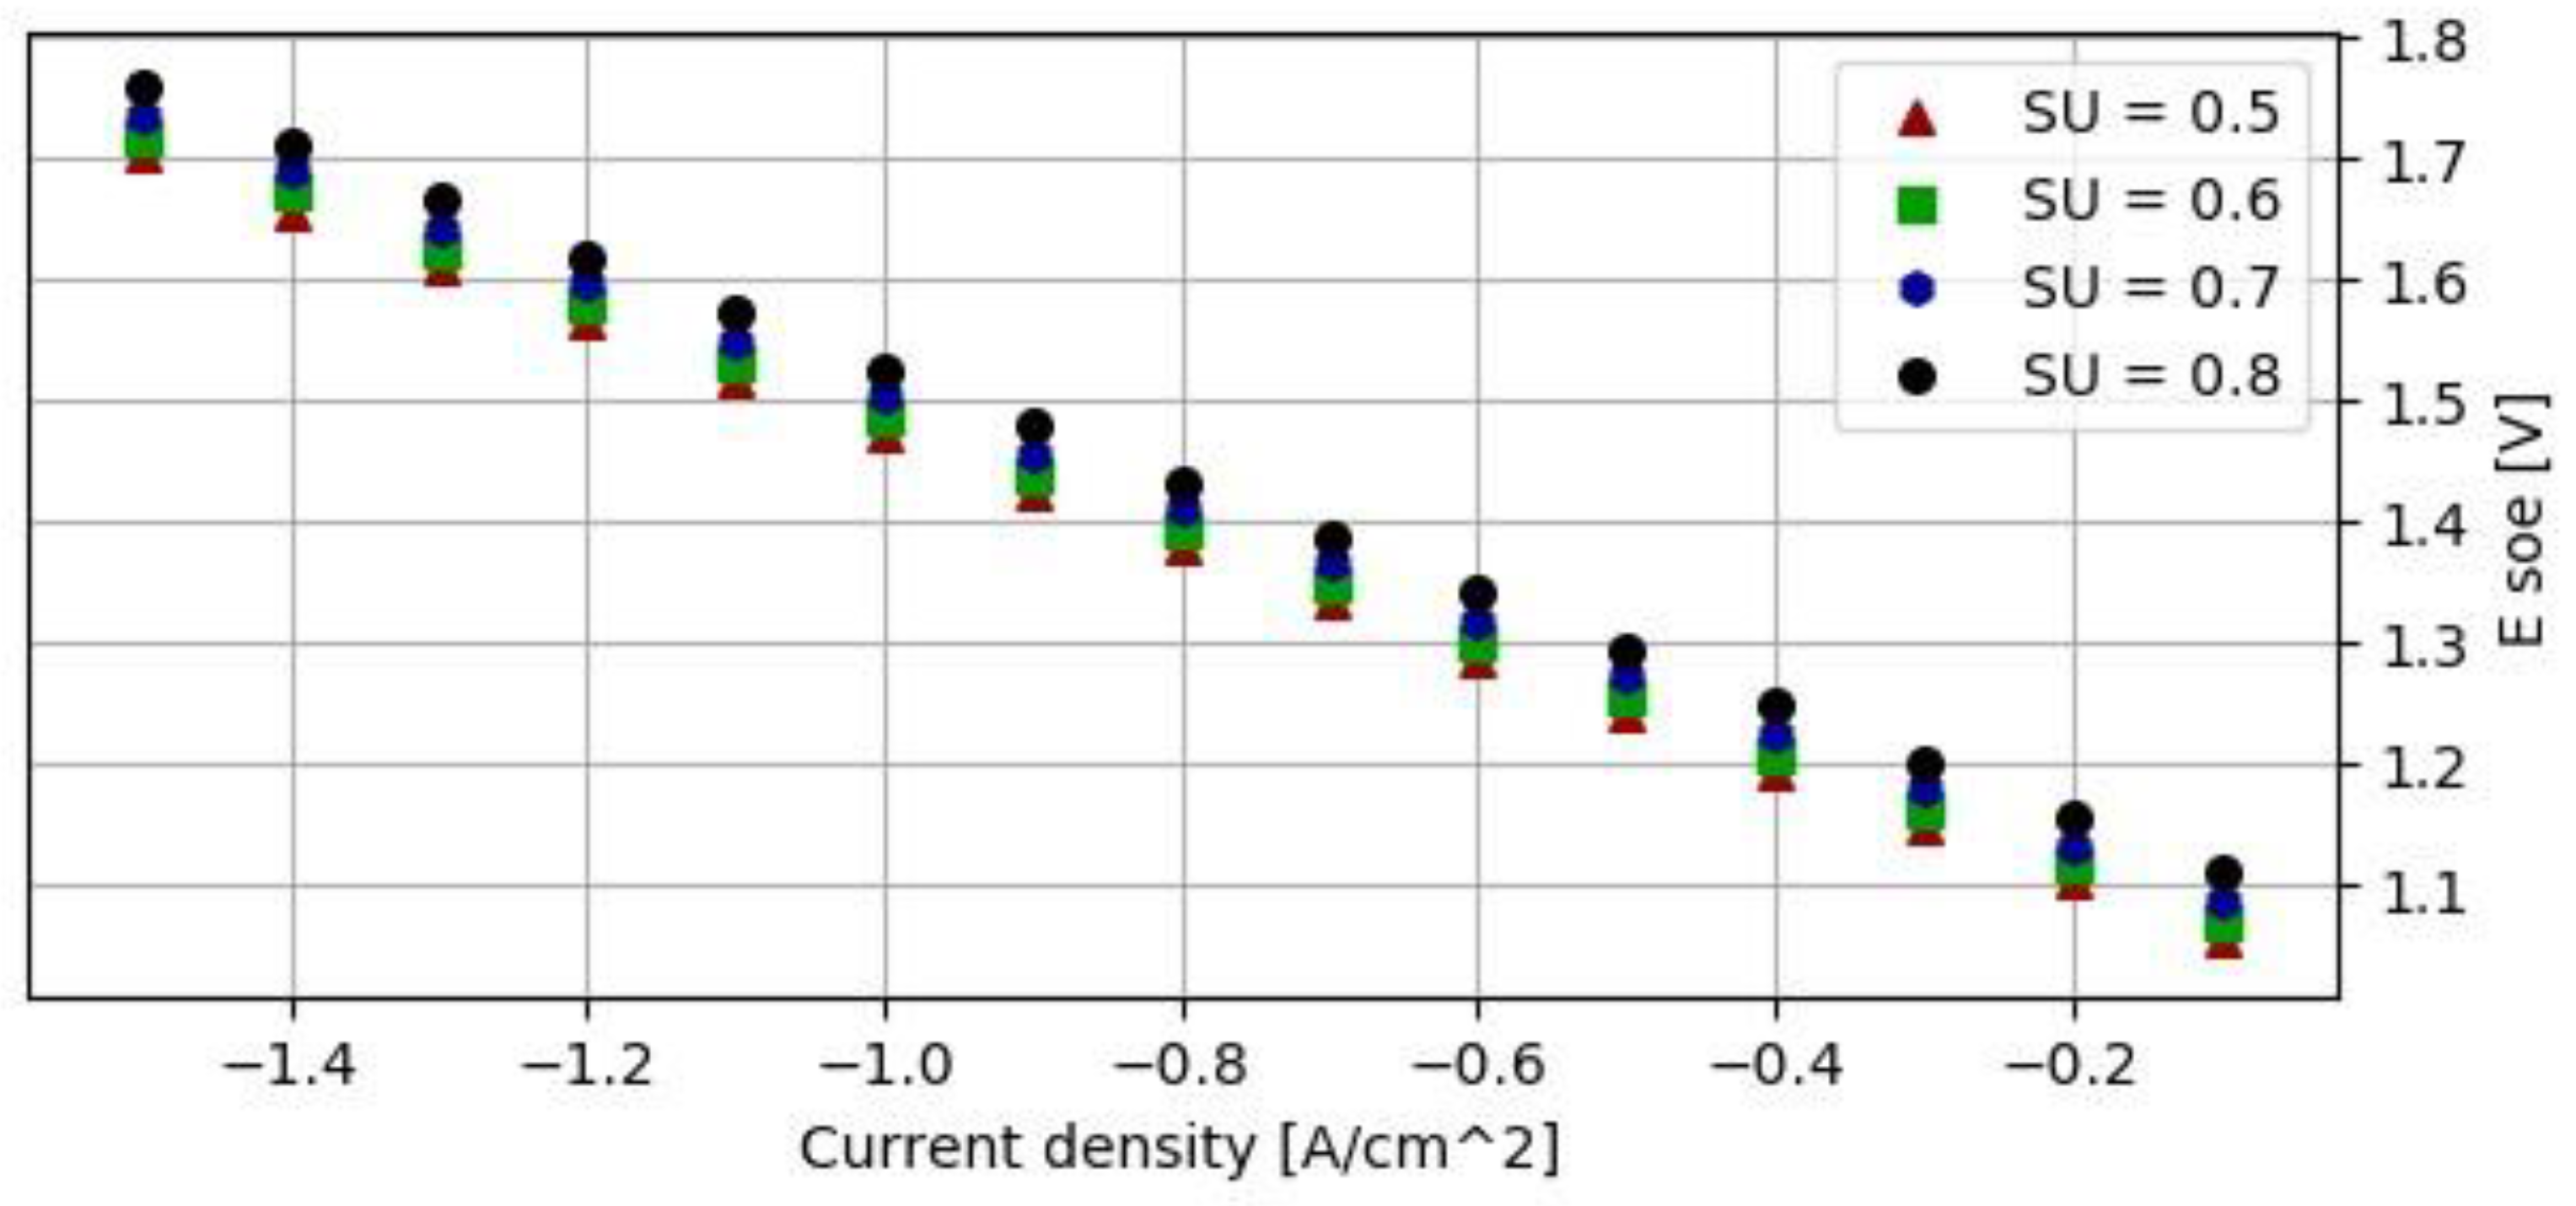
The voltage-current curve for 800°C shows the lowest voltage values among the analyzed temperatures. Higher voltages are observed for higher steam utilization (SU) ratios, although the differences remain small. The maximum voltage for SU=0.8 at -1.5 A/cm² is 1.76 V. To protect the cell from rapid degradation, operation at 800°C should not extend below -1 A/cm².
Figure 1.
Total power input of the installation at 800°C.
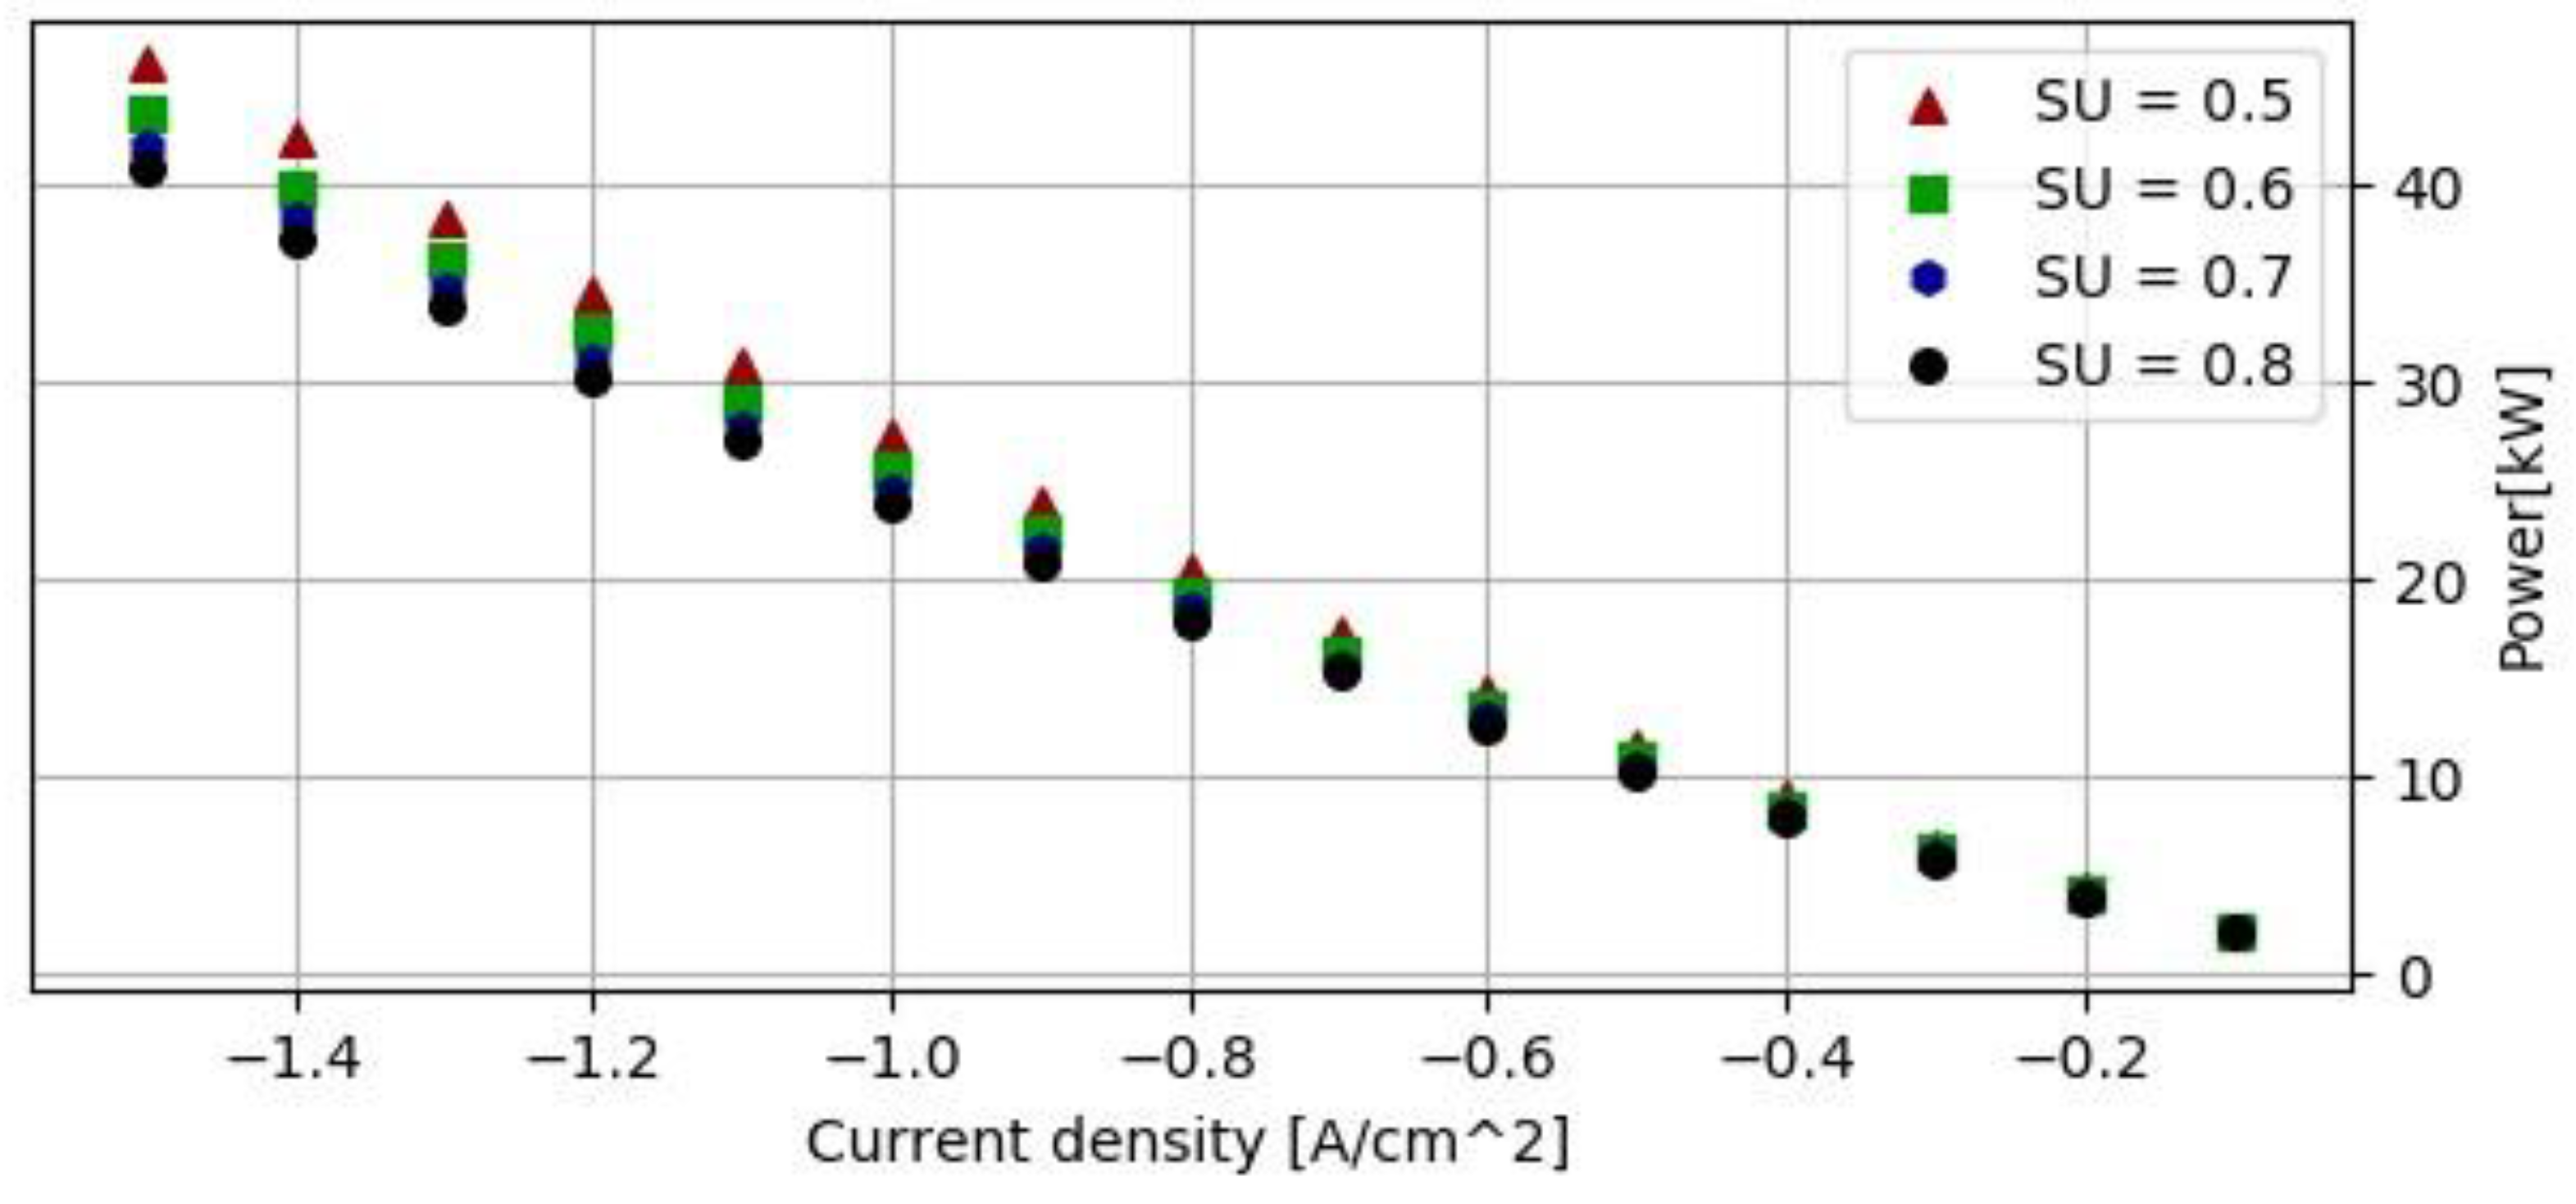
At 800°C, the power requirements are again lower than for the previous cases, as explained by the theory described in Chapter 3.1. The highest power values are observed for SU=0.5 and the lowest for SU=0.8. Power values decrease from 46.1 kW for SU=0.5 at -1.5 A/cm² to 1.97 kW for SU=0.8 at -0.1 A/cm².
Figure 1.
Efficiency of the system at 800°C.
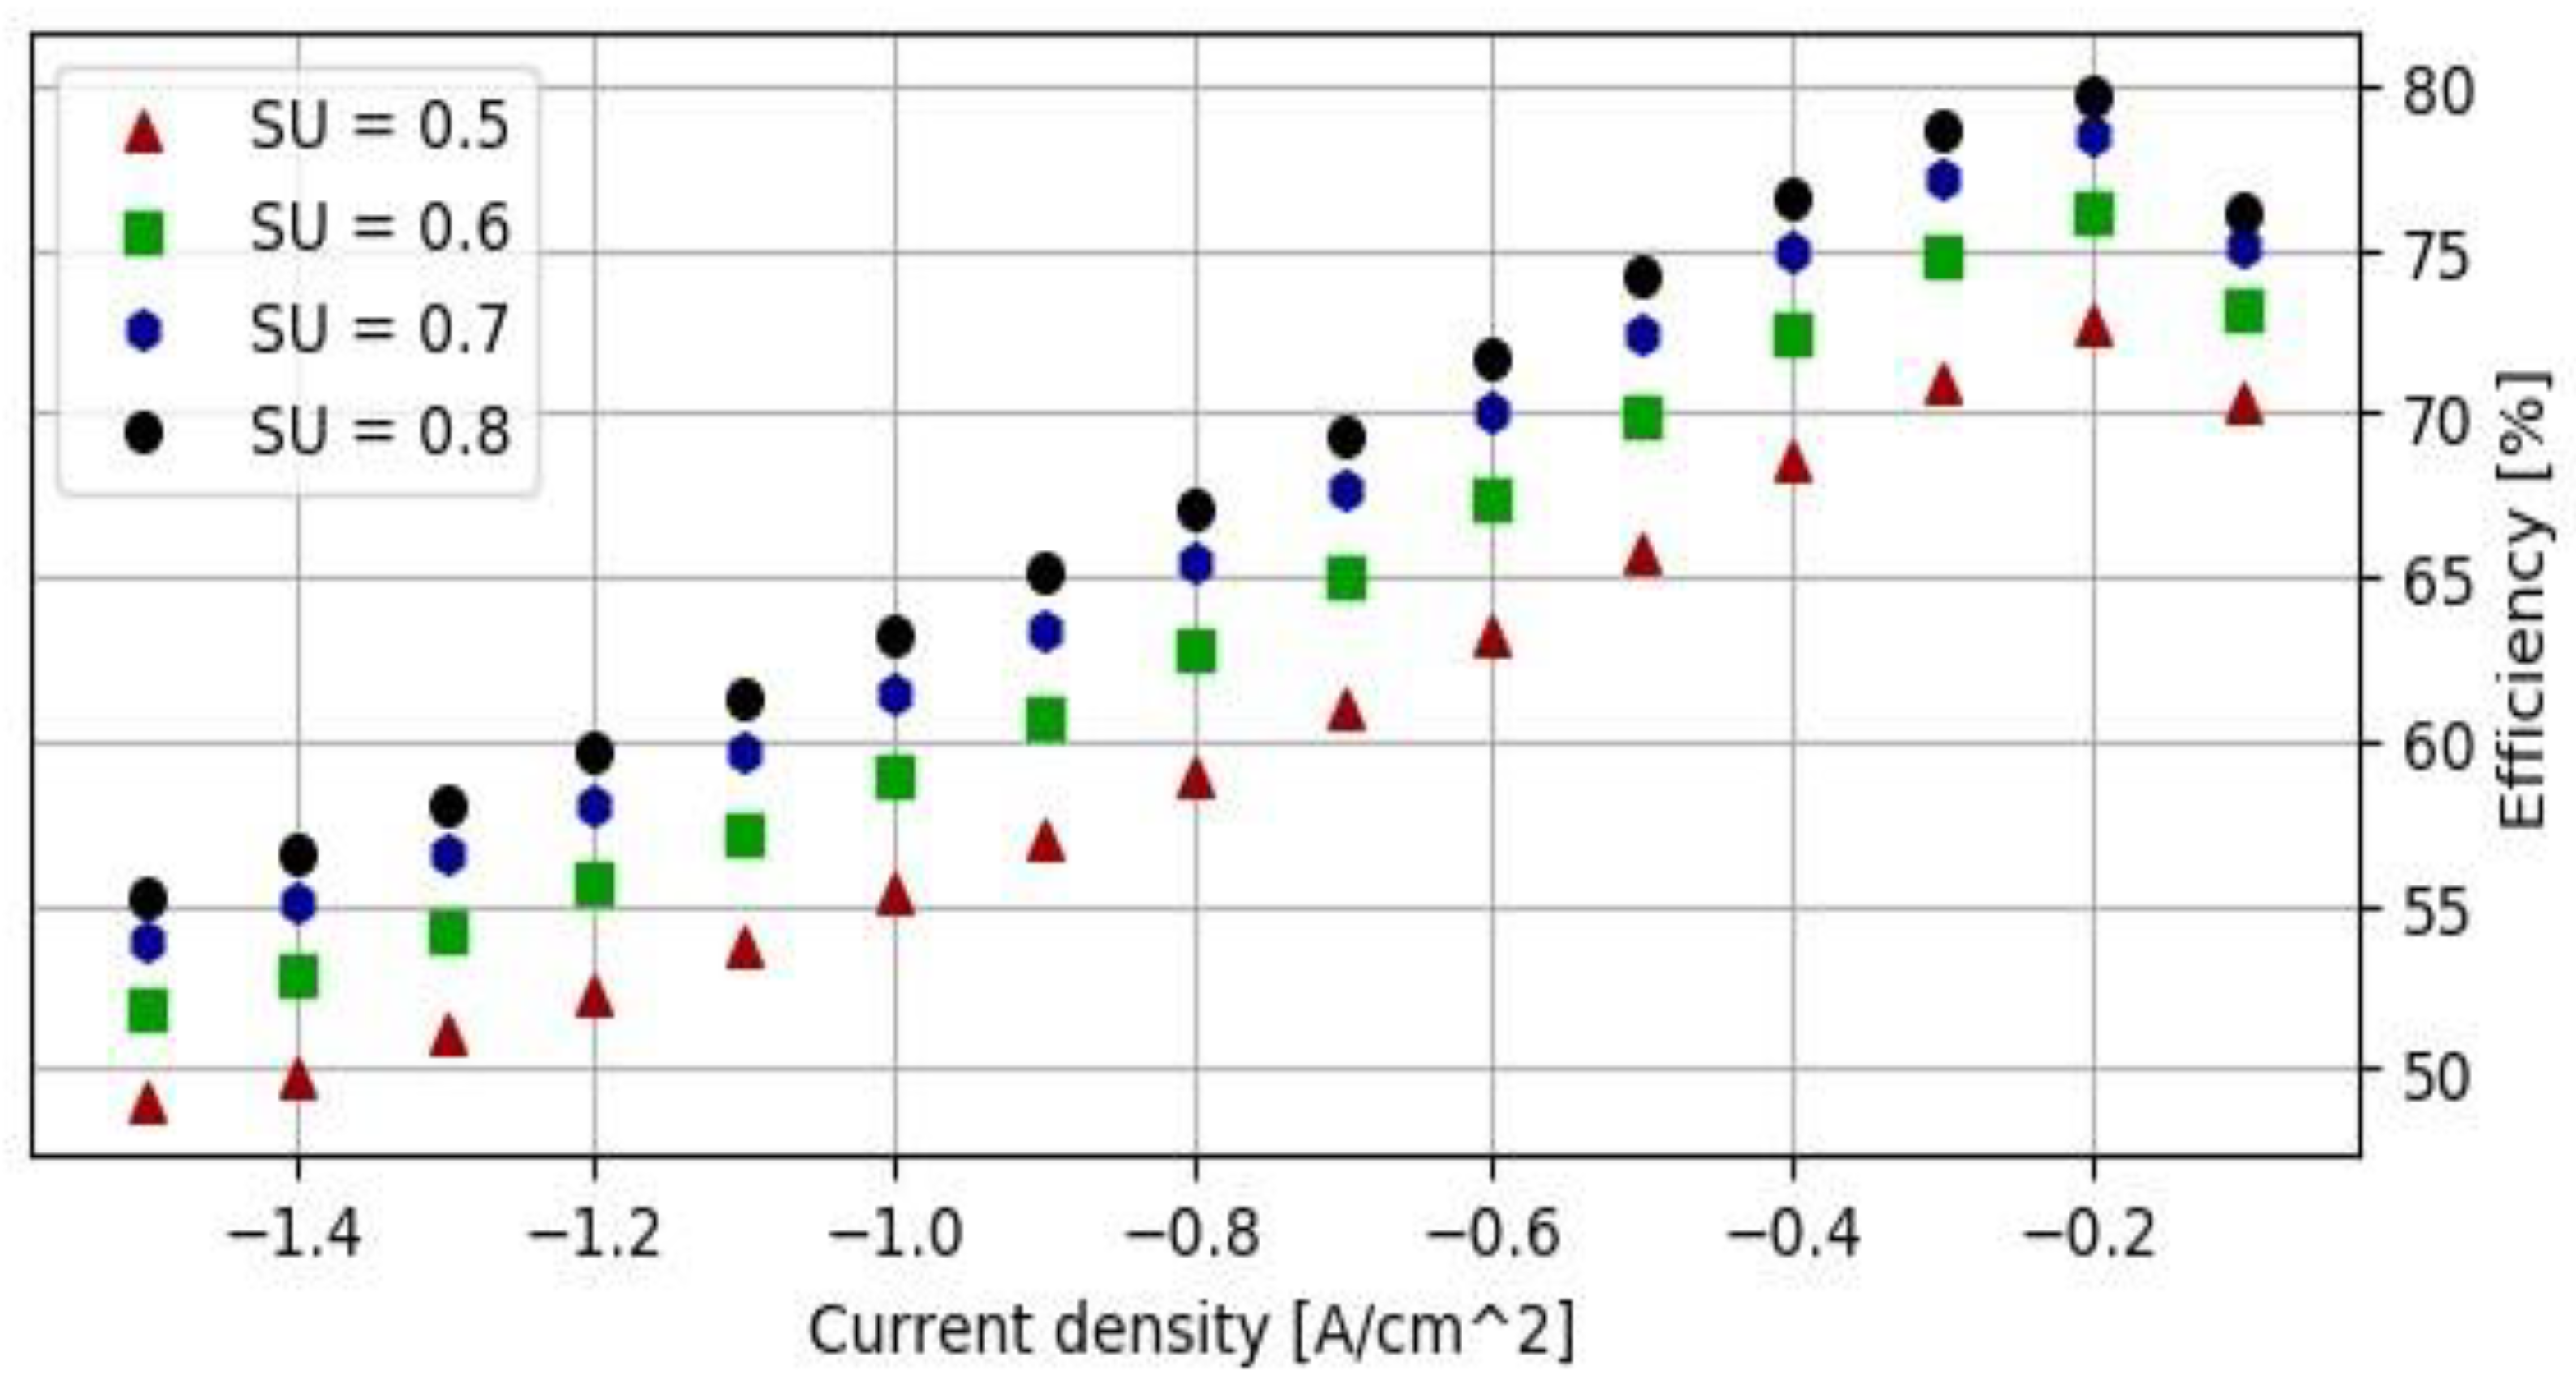
The efficiencies obtained at 800°C are the highest among all the analyzed cases. However, as observed in previous cases, there is a peak at -0.2 A/cm², followed by a slight decline. The highest efficiency was found for SU=0.8 at -0.2 A/cm², with a value of 79.73%.
Figure 1.
Ratio of BoP to total power input at 800°C.
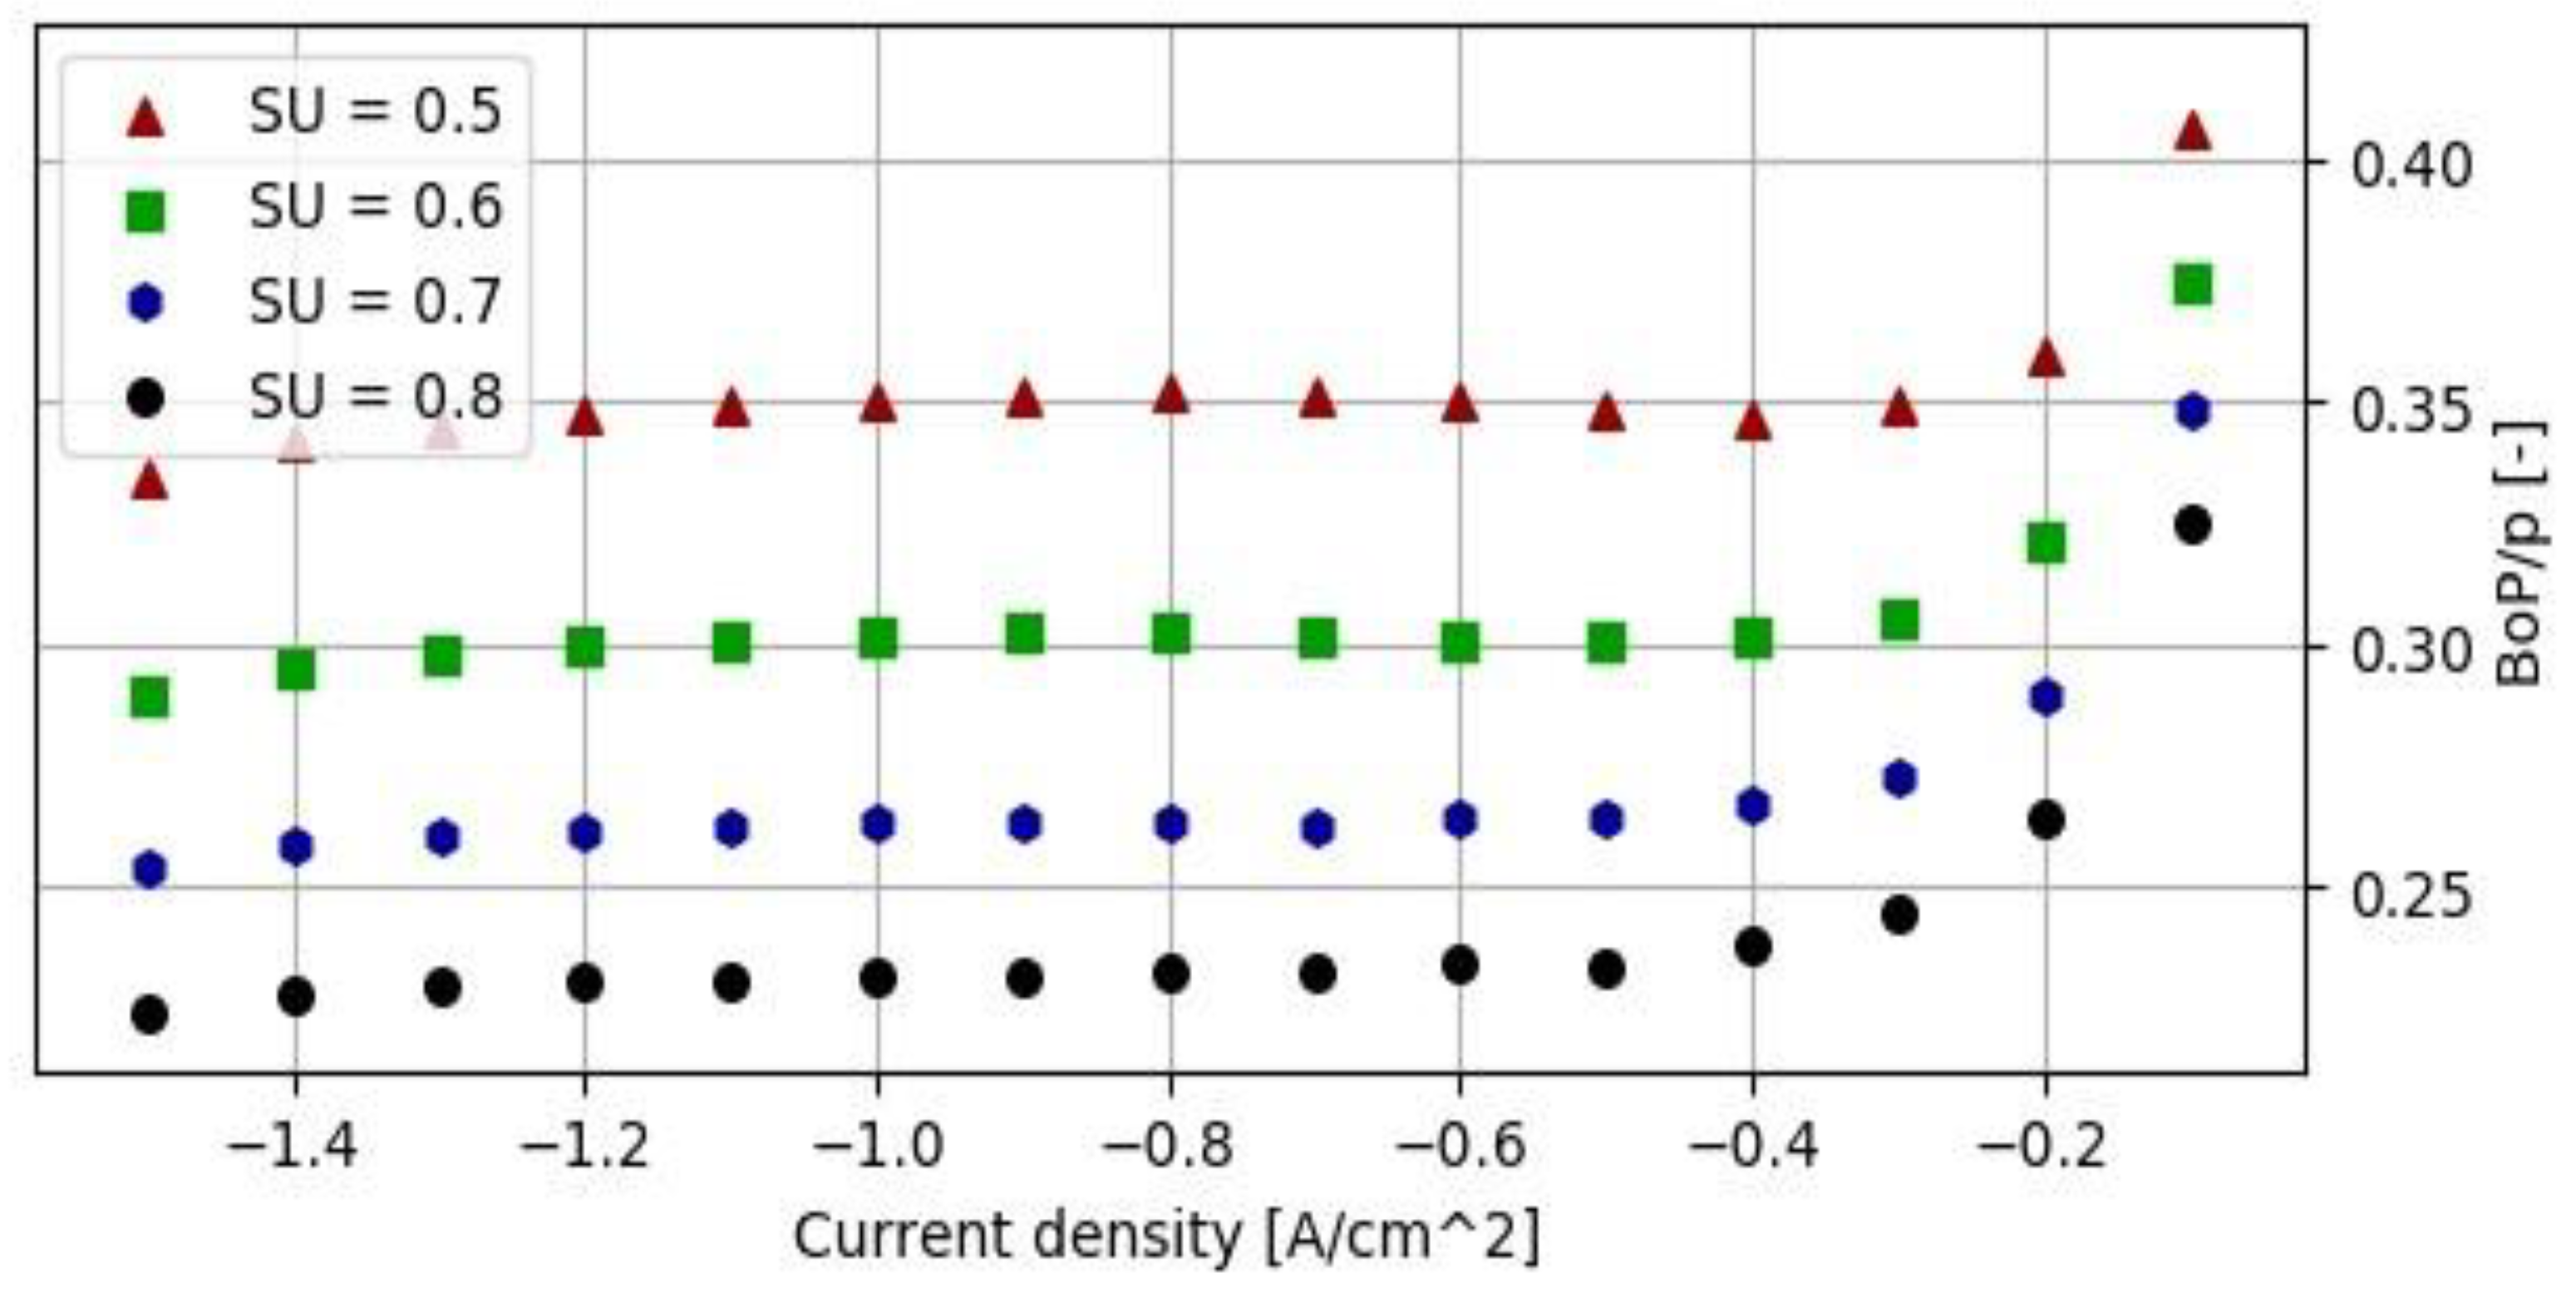
The share of BoP in the total power consumption of the system at 800°C again shows a rising trend, but the graph is much flatter than for previous temperatures. This indicates that at higher temperatures, the SU value has a lower impact on the share of BoP in total power consumption. For all values of current density and SU, the share is concentrated around 0.3. The exception is at a current density of -0.1 A/cm², where a sudden rise is observed.
For all different temperature values, the BoP/P ratio is lowest for the highest steam utilization factor. As a result, the total power consumption is also lowest for the highest SU values, and consequently, the efficiency is higher for higher values of steam utilization.
5. Discussion
Power-to-Gas (P2G) systems are suitable for both long-term and short-term energy storage applications. If efficient and economically viable P2G technologies are developed, hydrogen could become a major energy carrier in the so-called “hydrogen society.” As an energy carrier, hydrogen can be utilized in both the energy and transportation sectors. One emission-free method of producing hydrogen is electrolysis. Among the three major types of electrolysis, solid-oxide electrolysis (SOE) is the most promising, particularly considering the overall efficiency of the system.
From an energy efficiency perspective, the best parameters to operate an electrolyzer are those that yield the highest LHV efficiency, as identified through simulations. However, determining the most efficient operating conditions in real-world applications is more complex. As demonstrated in previous chapters, operating at the point of highest efficiency (almost 80% at 800°C) corresponds to a current density of -0.2 A/cm². This low current density results in a very low mass flow of produced hydrogen. The power input at this point is 3.77 kW, which is significantly lower than the nominal point.
Operating at this high-efficiency point would require over five times more installed power capacity compared to operating at the same SU and a current density of -0.8 A/cm², with an efficiency of around 60%, to produce the same amount of hydrogen. This sixfold increase in installed capacity translates to six times more investment funding. Given the limited lifetime of the device, this could result in financial losses due to an undersized installation. The difference in efficiency between these two points might not be sufficient to offset the increased investment costs over the system’s lifetime.
A detailed analysis should be conducted, considering both capital expenditures (CAPEX) and operational expenditures (OPEX), as well as the expected system lifetime. Only with such an analysis can a truly efficient operating point for an SOEC system be determined.
Finding the optimal point also requires considering other constraints. One of the primary constraints is the operating voltage. Voltages above 1.5 V can quickly increase cell degradation, so values are typically kept below this level. Fortunately, operating at the most efficient temperature level is associated with lower voltages. From a CAPEX perspective, the most efficient parameters are 800°C and a current density of -1 A/cm². The model clearly shows that increasing the operating temperature decreases the required total power input and consequently increases the efficiency of the system for all current density values.
However, the maximum operating temperature is also limited by economic constraints, such as the need for high-temperature-resistant and expensive materials in the stack’s design. The rise in the cost of SOEC components with increasing operational temperature is another aspect to consider when determining the optimal operating point for SOEC systems.
6. Summary
This work analyzes a solid oxide electrolysis (SOE) system with significant potential for Power-to-Gas technology development. Efficient and emission-free production of pure hydrogen is crucial for achieving carbon-free energy and transportation sectors. Current methods for hydrogen production typically rely on fossil fuels, releasing carbon dioxide into the atmosphere and thus failing to be considered clean. Additionally, hydrogen produced from fossil fuels is not as pure as that obtained through electrolysis.
The main objective of this work was to determine the operational parameters for a solid oxide electrolysis cell (SOEC) system under different conditions. The input parameters were temperature (700, 750, and 800°C) and steam utilization factor (0.5, 0.6, 0.7, and 0.8), resulting in 12 cases. For each case, different current density values were simulated, ranging from -1.5 to -0.1 A/cm². The data obtained included the voltage of the SOE, total electric power consumption, LHV-based efficiency, and the ratio of Balance of Plant (BoP) to total power. To achieve these objectives, a mathematical model of the SOEC was first created and then implemented into Aspen HYSYS software, incorporating elements of the thermal management system, such as heat exchangers, blowers, and electric heaters. Simulations were then conducted for all described cases.
The results indicate that the most efficient operation occurs at higher temperatures. However, other factors must be considered when identifying the optimal operating point, such as temperature and voltage limitations. Operating at extreme conditions, such as very low current densities (-0.1 A/cm²), can negatively impact the system's efficiency due to the inefficient operation of auxiliary devices like air and hydrogen blowers. The highest achieved efficiency was nearly 80% (800°C, 0.8 SU, and -0.2 A/cm²). However, this efficiency is attained at very low current densities, resulting in minimal hydrogen production. Therefore, the installed power of the system would need to be significantly higher than for higher current values, leading to much higher investment costs that might not be recouped given the limited lifetime of the installation. Conversely, higher hydrogen production (with lower efficiency) is also constrained by the voltage level, which should not exceed -1.5 V.
In conclusion, finding the optimal operating point for an SOEC system requires considering many different aspects, including efficiency, current density, temperature, voltage limitations, and economic factors such as investment and operational costs.
Funding
Studies were funded by Warsaw University of Technology under the program Excellence Initiative: Research University (ID-UB). The project is co-financed by Polish National Center for Research and Development of Operational Programme Smart Growth, 2014-2020 Application for project co-funding within Sectoral Programme PBSE Priority Axis Priority Axis I: Supporting R&D carried out by enterprises, Application no.: POIR.01.02.00-00-0281/16.
Conflicts of Interest
The authors declare no conflicts of interest.
References
- Kupecki, J.; Milewski, J.; Edenhofer, O.; Pichs-Madruga, R.; Sokona, Y.; Farahani, E.; et al. Climate Change 2014: Mitigation of Climate Change. Contribution of Working Group III to the Fifth Assessment Report of the Intergovernmental Panel on Climate Change. Int J Hydrogen Energy 2018, 83, 171–178. [Google Scholar] [CrossRef]
- Posdziech, O.; et al. Efficient hydrogen production for industry and electricity storage via high-temperature electrolysis. Int J Hydrogen Energy 2018. [Google Scholar] [CrossRef]
- Introduction to Power-to-Gas n.d.
- 4. Fuel Cells and Hydrogen Joint Undertaking n.d.
- Japan car giants team up on hydrogen stations n.d.
- Santos, D.M.F.; Sequeira, C.A.C.; Figueiredo, J.L.; Bi, L.; Boulfrada, S.; Traversa, E.; et al. Toyota Mirai Technical Specifications. Int J Hydrogen Energy 2014, 4, 9457–9466. [Google Scholar] [CrossRef]
- Japanese group unveils SOFC ENE-Farm residential cogen unit. Fuel Cells Bull 2012, 4, 4.
- Don Quichote Project n.d.
- BioCat Project n.d.
- Aneke, M.; Wang, M. Energy storage technologies and real life applications – A state of the art review. Applied Energy 2016, 179, 350–377. [Google Scholar] [CrossRef]
- Bi, L.; Boulfrada, S.; Traversa, E. Steam electrolysis by solid oxide electrolysis cells (SOECs) with proton-conducting oxides. Chem Soc Rev 2014, 43, 8255–8270. [Google Scholar] [CrossRef] [PubMed]
- H2e Power Technology n.d.
- Larminie, J.; Dicks, A. Fuel Cell Systems Explained; John Wiley: New York, 2000. [Google Scholar]
- Penchini, D.; Cinti, G.; Discepoli, G.; Desideri, U. Theoretical study and performance evaluation of hydrogen production by 200 W solid oxide electrolyzer stack. Int J Hydrogen Energy 2014, 39, 9457–9466. [Google Scholar] [CrossRef]
- Mermelstein, J.; Posdziech, O. Development and demonstration of a novel reversible SOFC system, for utility and micro grid Energy storage. Fuel Cell 2017, 17, 562. [Google Scholar] [CrossRef]
- Green Industrial Hydrogen Project n.d.
- Kupecki, J.; Motyliński, K.; Skrzypkiewicz, M.; Naumovich, E.; Brouwer, J. Energy analysis of 10kW-class power-to-gas system based on solid oxide electrolysis (SOE) stack. 5th Int. Conf. Contemp. Probl. Therm. Eng. (CPOTE Poland, 2018.
Disclaimer/Publisher’s Note: The statements, opinions and data contained in all publications are solely those of the individual author(s) and contributor(s) and not of MDPI and/or the editor(s). MDPI and/or the editor(s) disclaim responsibility for any injury to people or property resulting from any ideas, methods, instructions or products referred to in the content. |
© 2024 by the authors. Licensee MDPI, Basel, Switzerland. This article is an open access article distributed under the terms and conditions of the Creative Commons Attribution (CC BY) license (http://creativecommons.org/licenses/by/4.0/).
Copyright: This open access article is published under a Creative Commons CC BY 4.0 license, which permit the free download, distribution, and reuse, provided that the author and preprint are cited in any reuse.