
Submitted:
03 June 2024
Posted:
04 June 2024
You are already at the latest version
Abstract
Atmospheric pollens were investigated using the Lanzoni VPSS 2000 device for 2 years between 2012 and 2013 in the Sarıkamış district of Kars province, one of the highest regions of Türkiye. A total of 37909 pollen grains were collected; 15,298 pollen grains in 2012 and 22611 pollen grains in 2013. Out of 43 identified taxa, 21 were arboreal and 22 were non arboreal. Pollen from arboreal plants accounted for 36.34% (13778 pollen) of the total, while pollen from non arboreal plants accounted for 63.56% (24095 pollen). The most frequent arboreal plants pollen in the Sarıkamış atmosphere were Pinaceae (29.79%), Cupressaceae/Taxaceae (2.54%), and Morus (1.30%). The main non arboreal plants pollen in the atmosphere of Sarıkamış were Poaceae (44.60%), Artemisia (2.98%), Amaranthaceae (2.79%), Rumex (2.41%), Urticaceae (2.33%), Plantago (2.19%), and Boraginaceae (1.40%). The maximum pollen concentration was observed in June.
Keywords:
atmospheric pollen
; pollen calendar
; Sarıkamış
1. Introduction
Pollination of plants occurs in a variety of ways, including hydrophilia (water), anemophilia (wind), ornithophilia (birds), crypterophilia (bats), and entomophilia (insects) [1]. Although there are few plants pollinated by wind, the pollen produced by these plants causes diseases such as allergic rhinitis and allergic conjunctivitis in humans [2]. The diseases originating from pollen have become a significant issue in recent years [3]. Aeropalynological studies identify these plants that cause allergies in humans.
The pollen concentration and diversity of a region are associated with plant species in that region and the species in the surrounding area. Pollen concentrations in the atmosphere change over time in the atmosphere due to meteorological, ecological and geographical factors [4],[5],[6],[7],[8]. Since pollen have different sizes, they cause various diseases in humans. In general, small-sized pollen cause various allergic reactions in humans as they quickly move through the respiratory system. The most common allergic reactions caused by pollen include hay fever, asthma, rhinitis, and conjunctivitis [9].
The aim of this investigation was to identify the types of allergenic pollen and their concentrations in the atmosphere of Sarıkamış district of Kars province, situated at an elevation of 2225 meters, which is among the highest places in Türkiye. Located within the Iran-Turan phytogeographic region, in this area has not previously undergone any aeropalynological studies. We aimed to determine the beginning and ending periods of the pollen seasons of the dominant pollen, the duration of the pollen seasons, the number of risky days for susceptible individuals by volumetric method. The objective of our investigation was to examine the association between the data collected and a diverse set of meteorological factors, such as daily temperature, wind speed, humidity, and total precipitation.
2. Materials and Methods
Sarıkamış is located in the Erzurum-Kars section of the Eastern Anatolia Region and is surrounded by Kağızman (Kars) in the east, Eleşkirt (Ağrı) in the south, Horasan (Erzurum) in the southwest, Narman (Erzurum) in the west, Şenkaya (Erzurum) in the northwest, and Selim (Kars) in the north (Figure 1). Its surface area is 1751 km², and 37000-hectare of it is covered with Pinus slyvestris forests. It is located between 40°18' N and 42°31' E. Its altitude above sea level is also 2225 m. The main plant species include Pinaceae, Quercus, Artemisia, and Cupressaceae/Taxaceae [10].
In the study conducted by volumetric method, a Hirst-type volumetric pollen trap (Lanzoni VPPS 2010) was used. The pollen trap was placed on the roof of a building approximately 5 meters high in the center of Sarıkamış and samples were collected between January 1, 2012, and December 31, 2013. Weekly samples were brought to the laboratory and converted into daily preparations by dividing them into 7 equal parts of 48 mm. The samples were turned into daily preparations using the Woodhouse method. The pollen grains were identified under Leica light microscope at a magnification of 400X, and their abundance in 1 m3 of air was quantified according to the methodology recommended by the REA (Spanish Aerobiological Network) [12]. The daily variations and main pollen seasons of the pollen were determined by calculating according to Andersen's method [13]. The threshold values for daily m3 of pollen in the air for sensitive individuals were calculated according to REA [12]. The average pollen counts were correlated with parameters such as the mean temperature, relative humidity, and total precipitation obtained from the Turkish Meteorological Directorate. The relationship between meteorological factors and pollen counts was evaluated using the Spearman’s correlation test in SPSS 20.
3. Results
A total of 43 taxa were identified in the atmosphere of Sarıkamış throughout the two-year study. There were 21 arboreal plants and 22 non arboreal plants out of 43 taxa. A total of 37909 pollen was counted, 15298 pollen in 2012 and 22611 pollen/m3 in 2013. 33.83% (13778 pollen) of the total pollen amounts belonged to arboreal plants, 63.56% (24095 pollen) to non arboreal plants and 0.09% (36 pollen) to unidentified plants. Tables showed the monthly pollen amounts of arboreal and non arboreal plants throughout the two-year study (Table 1). It was determined that pollen was observed in the atmosphere from March to December. 92.51% of the total pollen was found in June, July and August. The highest taxon diversity was observed in June with 32 taxa and 53.83% of the total pollen was recorded in June. In both years, arboreal plants were heavily found in the atmosphere in May and June, and non arboreal plants in June and July. The counts of pollen species in the atmosphere were demonstrated in the form of a pollen calendar (Figure 2). The most common pollen species of arboreal plants found in the atmosphere of Sarıkamış were Pinaceae (29.79%, 11292 pollen), Cupressaceae/Taxaceae (2.54%, 961 pollen) and Morus (1.30%, 492 pollen). These accounted for 33.62% of the total pollen amount. Non arboreal plants that abound in Sarıkamış atmosphere were Poaceae (44.60%, 16908 pollen), Artemisia (2.98%, 1130 pollen), Amaranthaceae (2.79%, 1056 pollen), Rumex (2.41%, 912 pollen), Urticaceae (2.33%, 884 pollen), Plantago (2.19%, 832 pollen) ve Boraginaceae (1.40%, 531 pollen), which accounted for 58.70% of the total pollen. Table 1 presents the densities of the dominant taxa in the atmosphere in 2012-2013.
The majority of pollen detected in the atmosphere is from the Poaceae family of plants, also known as grasses, constituting 44.60% of the total pollen concentration. The maximum concentration of Poaceae pollen was observed in June (20.65%) and July (19.88%) (Table 2). The main pollen season lasted for 91 days from June 4th to August 31st in 2012 and for 73 days from June 4th to August 16th in 2013. It was determined that there were 26 risky days for sensitive individuals in 2012 and 36 risky days in 2013 (Table 3).
The arboreal taxon with the highest concentration was the Pinaceae family, comprising 29.79% of the total pollen count and reaching maximum concentration in June (26.66%) (Table 2). The main pollen season spanned 43 days from May 30th to July 12th in 2012 and 45 days from June 1st to July 16th in 2013. It was found that the number of high-risk days for sensitive individuals was 16 and 27 in 2012 and 2013, respectively (Table 3).
The third highest taxon, Artemisia, contributed to 2.98% of the total pollen and displayed its peak concentration during July (1.50%) and August (1.22%) (Table 2). The main pollen season spanned 79 days from 11th July to 28th August in 2012 and 75 days from 10th July to 23rd August in 2013. The duration of risk exposure for individuals with pollen allergies was identified as 3 days in 2012 and 4 days in 2013 (Table 3).
Amaranthaceae accounted for 2.79% of the total pollen, with the maximum density occurring in August (1.55%) (Table 2). The main pollen season was found to last for 99 days between June 14 and September 21 in 2012, and for 94 days between June 9 and September 11 in 2013. When we look at the number of risky days for sensitive individuals, there were 3 days in 2012 and 1 day in 2013 (Table 3).
Cupressaceae/Taxaceae constituted 2.54% of the total pollen and demonstrated peak concentrations in May (0.86%) and June (0.94%) (Table 2). The primary pollen season for this taxon extended for 120 days, from April 3 to August 1 in 2012, and for 140 days, from April 24 to September 11 in 2013. No risk period was observed in 2012, but one day with a risk of exposure to allergenic pollen was identified in 2013 (Table 3).
Rumex represented 2.41% of the total pollen, with the highest concentration occurring in June (1.31%) (Table 2). The main pollen season was determined to last 91 days between May 2 and August 1 in 2012, and 73 days between May 30 and July 25 in 2013. The number of days considered risky for susceptible individuals was 1 in 2012 and 2 in 2013 (Table 3).
Urticaceae constituted 2.33% of the total pollen, with peak concentration in July (1.06%) (Table 2). The main pollen season was identified to span over 96 days from May 23 to August 27 in 2012, and 90 days from May 29 to August 27 in 2013. The number of days posing a risk to susceptible individuals was eight in 2012 and one in 2013 (Table 3).
Plantago accounted for 2.19% of the total pollen and exhibited the highest concentration in June (0.78%) and July (0.92%) (Table 2). The main pollen season persisted for 96 days between June 8 and September 12, 2012, and for 87 days between June 3 and August 29, 2013. No days were detected as being risky for sensitive individuals in 2012, whereas one day was detected in 2013 (Table 3).
Boraginaceae constituted 1.40% of the total pollen, with the highest concentration observed in July (0.65%) (Table 2). The main pollen season lasted for 82 days between June 10 and August 31 in 2012 and for 75 days between June 9 and August 23 in 2013. The number of days with a risk of allergic symptoms for sensitive individuals was found to be 1 in 2012 and 9 in 2013 (Table 3).
Morus was responsible for 1.30% of the overall pollen. Its peak concentration occurred in August (1.28%) (Table 2). The main pollen season spanned 13 days between August 9 and August 22 in 2012 and 21 days between August 7 and August 28 in 2013. The number of days posing a risk to individuals with hypersensitivity was established as three in 2012 and four in 2013 (Table 3).
Meteorological data including mean temperature, mean relative humidity, mean wind speed, and total precipitation for the years 2012 and 2013 are presented in Table 4. No significant differences were observed in meteorological factors between the two years. During the two-year study, monthly mean temperature ranged between -9.9°C and 17.4°C. Pollen was not detected in the atmosphere during most of January, February, and March when the temperature dropped below 0°C. Mean relative humidity fluctuated between 51.9% and 81.2%, with an annual average of 66.1%. Total precipitation ranged from 0 mm to 74.6 mm. Mean wind speed varied between 1 m/s and 3.7 m/s, with a significant increase observed only in July 2013 (Table 4).
In this study, the relationship between the daily total pollen amounts of the taxa Amaranthaceae, Artemisia, Boraginaceae, Cupressaceae/Taxaceae, Morus, Plantago, Pinaceae, Poaceae, Rumex, and Urticaceae, which were among the most abundant taxa in the atmosphere of Sarıkamış, Kars province in 2012 and 2013, and meteorological factors including daily mean temperature, daily mean relative humidity, daily mean wind velocity, and daily mean precipitation was investigated using Spearman’s correlation analysis. According to the analysis results of the average data obtained during 2012 and 2013, a statistically significant positive correlation (p<0.01) was found between the daily total pollen count and temperature and wind speed. A statistically significant negative correlation (p<0.01) was detected between the daily total pollen count and relative humidity. No significant correlation was found between the daily pollen count and precipitation. A positive correlation (p<0.01) was determined between Poaceae, Pinaceae, Urticaceae, Amaranthaceae, Artemisia, and Rumex pollen counts and temperature. A statistically significant positive correlation (p<0.05) was found between Plantago pollen counts and temperature. No significant correlation was found between Cupressaceae/Taxaceae, Morus, and Boraginaceae pollen counts and temperature. A positive correlation (p<0.01) was found between Plantago and Boraginaceae pollen counts and relative humidity, and a negative correlation (p<0.01) was found between the daily pollen count and Cupressaceae/Taxaceae pollen counts and relative humidity. A statistically significant positive correlation (p<0.01) was detected between wind speed and Poaceae, Urticaceae, and Artemisia pollen counts. A negative correlation (p<0.05) was found between Artemisia pollen counts and precipitation (Table 5).
4. Discussion
This study aimed to identify pollen types in the atmosphere of Sarıkamış, which is the highest-altitude region in Türkiye, using Lanzoni VPSS during the years 2012-2013. A total of 43 taxa were identified in the study. Unlike other aeropalynological studies conducted in Türkiye and elsewhere, pollen grains from non-arboreal plants were found to be dominant with a density of 59.71%, due to the vegetation type, climate, and geographical structure of the study area. In similar studies conducted in Türkiye and around the world, non-arboreal plant pollen was found to be more abundant than arboreal plant pollen, with a density of 59.28% in Bitlis [14], 63.57% in Kars [15], 83% in India-Jaipur [16], 60.3% in the Netherlands-Leiden [17], 55% in Italy-Trentino [18], and 52% in Portugal-Porto [19].
The pollen concentrations, pollen calendar, average concentrations of dominant pollen in two years, and the main pollen seasons of dominant pollen, as well as the number of risky days for allergic patients, are presented in tables for arboreal and non-arboreal plants. Due to temperatures below 0°C, pollen could not be detected in the atmosphere in January and February. However, pollen was observed starting from the end of March as temperatures began to rise. The dominant arboreal plant pollen were Pinaceae (29.79%), Cupressaceae/Taxaceae (2.54%), and Morus (1.30%). The concentration of arboreal plant pollen started to increase in May and reached its maximum level in June in regions such as Mardin-Kızıltepe [20] and Kayseri [21], thanks to the density of Pinaceae and Cupressaceae/Taxaceae taxa. Arboreal plants pollen were observed in the atmosphere, albeit to a lesser extent, in all months until December. The pollen of non-arboreal plants, like that of arboreal plants, increased in May and reached the maximum level in June; the concentration persisted in July, and their pollen appeared in the atmosphere until the end of the year. Dominant non-arboreal taxa were Poaceae (44.60%), Artemisia (2.98%), Amaranthaceae (2.79%), Rumex (2.41%), Urticaceae (2.33%), Plantago (2.19%), and Boraginaceae (1.40%).
Poaceae is the taxon with the highest density identified in the study area and is one of the most significant causes of various allergic diseases associated with pollen allergy worldwide. The non-arboreal plant family Poaceae, which is wind-pollinated and whose pollen is prevalent in the atmosphere, has a long flowering and pollination period. As in our study, Poaceae was identified as the highest density non-arboreal taxon in Bitlis at 25.19% [14], Mardin at 21.21% [22], and Van at 20.94% [4]. Similarly, high densities have been recorded in other parts of the world, such as 31.3% in Buenos Aires, Argentina [23], 42% in Jaipur, India [16], 39.5% in Lugo, Spain [24], and 32.85% in Lagos, Nigeria [25]. The main pollen season lasts an average of 70 days, and the number of risky days over two years is 62, posing a risk to people sensitive to Poaceae, which is a significant cause of various allergic diseases associated with pollen allergy worldwide.
Artemisia, with a concentration of 2.98% in the present study, showed similarities with data obtained from studies conducted in Ardahan (%) [26], Isparta (%) [27], and Trabzon [28] in Türkiye, as well as Holland-Leiden (%) [17], Hungary [29], and Delhi-India [30] worldwide. It was observed that Artemisia pollen reached high concentrations in the summer months, similar to Europe and Türkiye.
During summer and autumn, the Amaranthaceae pollen, one of the most significant allergens, has been reported as the main pollen type in Aksaray [31], Afyon [32], Tekirdağ [33], Konya [34], and Van [4] regions of Türkiye. Rumex and Urticaceae were identified with densities above 2% in the atmosphere of Sarıkamış. Similar densities were reported in Madrid [35], Vigo [36], and Lugo [24], Spain, and in Bitlis [14], Van [4], Trabzon [28], and Tekirdağ [33] regions of Türkiye. The highest concentration of Rumex were observed in June, while Urticaceae reached the highest densities in July.
Although Plantago is considered an important allergen in many countries, its allergic effect cannot be fully understood as its flowering period overlaps with members of the Poaceae family and symptoms increase during the same period. Plantago pollen was recorded intensively in June and July in the study area, similar to Poaceae. It was determined that Plantago had high densities in studies conducted in Iran-Turan Region, such as Bitlis [14], Van [4], Aksaray [31], Konya [34], Mardin [22] and Elazığ [37], as well as in other parts of the world, such as El Hadjar-Algeria [38], Bratislava-Slovakia [39], and Cordoba-Spain [40]. Boraginaceae pollen, about which little information is available regarding its allergic effect, was not found to be dominant in any study conducted in Türkiye, but was recorded as a dominant pollen in Funchal - Portugal [41] at 3.80% and in India-Calcutta [42] at 3.20%, as in the present study.
The Pinaceae pollen, which is the highest in concentration among arboreal plants pollen, has been reported as the main pollen type in Eskişehir-Sivrihisar (69.31%) [43], Kütahya (51.56%) [44], Eskişehir (48.13%) [45], Kastamonu (42.9%) [46], Ankara (32.43%) [47], China-Yunnan (38.7%) [48], Spain-Nerja (25.04%) [49] and Spain-Vigo (25.1%) [36]. Although the main pollen season lasts for about 5 months in both years, the total number of high-risk days is 43. This is mainly due to the fact that the majority of Pinaceae pollen is observed in June.
Cupressaceae/Taxaceae, an important allergen, was identified as the second dominant arboreal plant pollen type in Türkiye, mainly recorded as the primary pollen type in Adana [50], Hatay [51], Antalya [52], Istanbul [53], and Aydın-Kuşadası [54]. Morus, a pollen type that causes moderate allergic reactions, is detected with pollen density in Sarıkamış and is found to have similar densities in Van [4], Bitlis [14], Afyon [32], Kütahya [44], Kazakhstan-Bishkek [55], Canada-Toronto [56], and Taiwan-Taichung [57].
Previous studies conducted in various regions have shown that Poaceae, Pinaceae, Artemisia, Amaranthaceae, Cupressaceae/Taxaceae, Rumex, Urticaceae, and Plantago pollen are dominant pollen types in different regions, such as Pinaceae, Cupressaceae/Taxaceae, Poaceae, Amaranthaceae, Plantago, Urticaceae in Konya [34], Cupressaceae/Taxaceae, Poaceae, Pinus, Amaranthaceae in Mardin [22], and Poaceae, Cupressaceae, Amaranthaceae, Plantago in Van [4], Poaceae, Cupressaceae, Pinaceae, Plantago in Madrid [35], Urticaceae, Poaceae, Cupressaceae, Pinaceae in Funchal city [41].
In the two-year study, the duration of pollen seasons for allergenic pollen ranged from 13 to 140 days. The total number of risky days for dominant pollen was found to be 147. 92.51% of the total pollen count was observed during summer months. The main reason for this is that temperatures are below 0°C in winter months and the average temperature suddenly begins to increase in summer months.
As in many studies, our study also found a positive correlation between the concentrations of Poaceae, Pinaceae, Urticaceae, Amaranthaceae, Artemisia, Rumex, and Plantago pollen and daily temperature. should discuss the results and how they can be interpreted from the perspective of previous studies and of the working hypotheses. The findings and their implications should be discussed in the broadest context possible. Future research directions may also be highlighted.
5. Conclusions
This This two-year study identified a total of 37909 pollen/m3 belonging to 21 arboreal and 22 non arboreal plant taxa. Contrary to many similar studies conducted in Türkiye, non arboreal plant pollen was found to be abundant while arboreal plant pollen was scarce. This is mainly due to the fact that arboreal plants, which are known to produce large amounts of pollen during winter and late autumn, are not very prevalent in the study area due to low temperatures during these seasons, the altitude of the study area being above 2000 meters, and minimal temperature differences between day and night throughout the year. As a result of this study, the pollination periods, daily, monthly, and yearly amounts of pollen, which are among the most important allergens in Sarıkamış, have been determined, and a pollen calendar for Sarıkamış has been prepared. The data obtained from the study is thought to be beneficial for sensitive individuals, visitors, and allergy specialists living in the region.
Author Contributions
S.A. and M.K.A. contributed to the design and implementation of the research, to the analysis of the results and to the writing of the manuscript.
Funding
This research received no external funding.
Data Availability Statement
Not applicable.
Conflicts of Interest
The authors declare no conflicts of interest.
References
- Ünal, M. Bitki Angiosperm Embriyolojisi,6th ed.;, Nobel: Ankara, Türkiye, 2013.
- Isaac, S. To what extent do airborne fungal spores contribute to respiratory disease and allergic reactions in humans?. Mycologist, 1996, 10(1), 31-32. [CrossRef]
- D'amato, G.; Liccardi, G. Pollen-related allergy in the European Mediterranean area. Clin. Exp. Allergy., 1994, 24(3).
- Bicakci, A.; Tosunoglu, A.; Altunoglu, M.K.; Saatcioglu, G.; Keser, A.M.; Ozgokce, F. An Aeropalynological survey in the city of Van, a high altitudinal region, East Anatolia-Turkey. Aerobiologia, 2017, 33, 93–108. [CrossRef]
- Romano, B. Pollen monitoring in Perugia and information about aerobiological data. Aerobiologia, 1988, 4, 20-26. [CrossRef]
- Latorre, F.; Bianchi, M.M. Relación entre aeropolen y vegetation arbórea en Mar del Plata (Argentina). Polen, 1997, 8, 43–59.
- Benninghoff W.S. Aerobiology and its significance to biogeography and ecology. Grana, 1991, 30, 364–372. [CrossRef]
- Chanda S. Presidential address: Aerobiology Science in progress. Grana, 1991, 30, 5–8.
- Lacey, J.; Dutkiewicz, J. Bioaerosols and occupational lung disease. J. Aerosol Sci., 1994, 25(8), 1371-1404. [CrossRef]
- Yılmaz, M.N. Flora of Kafkas University, M. Sc. Thesis, Kafkas University, Kars, 2012.
- https://www.google.com/maps/@40.6059461,32.5481882,6z?hl=en&entry=ttu.20.05.2024.
- Galán, C.; Cariñanos, P.; Alcázar, P.; Dominguez-Vilches, E. Spanish aerobiology network (REA) management andquality manual. Servicio de Publicaciones Universidad de Córdoba, 2007.
- Andersen, T.B. A model to predict the beginning of the pollen season. Grana, 1991, 30, 269–275. [CrossRef]
- Celenk, S.; Bicakci, A. Aerobiological investigation in Bitlis, Turkey. AAEM, 2005, 12(1), 87-93.
- Akdogan, G.E. Determination of atmospheric pollen grains in Kars province by volumetric method. Phd Thesis, Kafkas University, Kars, 2017.
- Singh, N.; Singh, U.; Singh, D.; Daya, M.; Singh, V. Correlation of pollen counts and number of hospital visits of asthmatic and allergic rhinitis patients. Lung India, 2017, 34(2), 127-131. [CrossRef]
- Spieksma, F. T. M. Airborne pollen concentrations in Leiden, The Netherlands, 1977–1981: III. Herbs and weeds flowering in the summer. Grana, 1986, 25(1), 47-54.
- Cristofori, A.; Cristofolini, F.; Gottardini, E. Twenty years of aerobiological monitoring in Trentino (Italy): assessment and evaluation of airborne pollen variability. Aerobiologia, 2010, 26(3), 253-261. [CrossRef]
- Ribeiro, H.; Abreu, I. A 10-year survey of allergenic airborne pollen in the city of Porto (Portugal). Aerobiologia, 2014, 30, 333-344. [CrossRef]
- Potoğlu-Erkara İ.; Osoydan, K.; Karataş, M. Relationship between meteorological factors and airborne pollen grains of Kızıltepe (Mardin), Turkey. JABS, 2016, 10(1), 33-40.
- İnce, A.; Kart, L.; Demir, R.; Özyurt, M.S. Allergenic pollen in the atmosphere of Kayseri, Turkey. Asian Pac J Allergy Immunol, 2004, 22, 123-32.
- Tosunoglu, A.; Saatcioglu, G.; Bekil, S.; Malyer, H.; Bicakci, A. Atmospheric pollen spectrum in Stone City, Mardin; the northern border of Mesopotamia/SE-Turkey. Environ. Monit. Assess., 2018, 190, 635. [CrossRef]
- Murray, M. G.; Scoffield, R. L.; Galán, C.; Villamil, C. B. Airborne pollen sampling in a wildlife reserve in the south of Buenos Aires province, Argentina. Aerobiologia, 2007, 23, 107-117. [CrossRef]
- Rodriguez-Rajo, F. J.; Jato, V.; Aira, M. J. Pollen content in the atmosphere of Lugo (NW Spain) with reference to meteorological factors (1999–2001). Aerobiologia, 2003, 19, 213-225.
- Adeniyi, T. A.; Adeonipekun, P. A.; Olowokudejo, J. D.; Akande, I. S. Airborne pollen records of Shomolu local government area in Lagos State. Not. Sci. Biol., 2014, 6(4), 428-432.
- Çetin, E.; Altunoğlu, M. K.; Akdoğan, G.E.; Akpınar, S. Ardahan ili atmosferik polenlerinin belirlenmesi. KAUFBED, 2015, 8(2), 80-94.
- Bıçakçı, A.; Akkaya, A.; Malyer, H.; Ünlü, M.; Sapan, N. Pollen calendar of Isparta, Turkey. Isr. J. Plant Sci., 2000, 48(1), 67-70.
- Altunoğlu, M.K.; Şahin, Ü.; Karataş, M.; Yılmaz, S.; Akpınar, S.; Akdoğan, G.E.; Bıçakçı, A. Determination of allergenic pollens in the atmosphere of Trabzon province by volumetric method. JIST, 2022, 12(3), 1364-1374.
- Kadocsa, E.; Juhász, M. Study of airborne pollen composition and allergen spectrum of hay fever patients in South Hungary (1990–1999). Aerobiologia, 2002, 18, 203-209. [CrossRef]
- Singh, A. B.; Pandit, T.; Dahiya, P. Changes in airborne pollen concentrations in Delhi, India. Grana, 2003, 42(3), 168-177. [CrossRef]
- Şafak, F. 2022. Investigation of pollens and spores in Aksaray provincial central atmosphere by volumetric methods. Phd Thesis, ANKARA University, Ankara, 2022.
- Bıcakcı, A.; Ergun, S.; Tatlidil, S.; Malyer, H.; Özyurt, S.; Akkaya, A.; Sapan, N. Airborne pollen grains of Afyon, Turkey. Acta Bot. Sin., 2002, 44(11), 1371-1375.
- Erkan, P.; Biçakçi, A.; Aybeke, M. Analysis of airborne pollen fall in Tekirdag, Turkey. Asthma Allergy Immunol., 2010, 8, 46-54.
- Temizer, İ.K.; Doğan, C.; Artac, H.; Reisli, I.; Pekcan, S. Pollen grains in the atmosphere of Konya (Turkey) and their relationship with meteorological factors, in 2008. Turkish J. Bot., 2012, 36(4), 344-357. [CrossRef]
- Subiza, J.; Jerezb, M.; Jiméneza, J. A.; Narganes, M. J.; Cabrera, M.; Varela, S.; Subiza, E. Allergenic pollen and pollinosis in Madrid. AAAAI, 1995, 96(1), 15-23. [CrossRef]
- Belmonte, J.; Roure, J. M.; March, X. Aerobiology of Vigo, North-Western Spain: atmospheric pollen spectrum and annual dynamics of the most important taxa, and their clinical importance for allergy. Aerobiologia, 1998, 14, 155-163. [CrossRef]
- Kilic, M.; Altunoğlu, M. K.; Akpınar, S.; Akdoğan, G. E.; Taskın, E. Relationship between airborne pollen and skin prick test results in Elazığ, Turkey. Aerobiologia, 2019, 35, 593-604. [CrossRef]
- Necib, A.; Boughediri, L. Airborne pollen in the El-Hadjar town (Algeria NE). Aerobiologia, 2016, 32(2), 277-288. [CrossRef]
- Ščevková, J.; Dušička, J.; Mičieta, K. Aerobiological analysis of airborne pollen and fungal spore fall in Bratislava in 2015. Acta F. R. N. U. C. Botanica, 2015, 50, 3-8.
- Alcázar, P.; Galán, C.; Cariñanos, P.; Domínguez-Vilches, E. A new adhesive for airborne pollen sampling in Spain. Aerobiologia, 2003, 19, 57-61. [CrossRef]
- Camacho, I. C. Airborne pollen in Funchal city,(Madeira Island, Portugal)-First pollinic calendar and allergic risk assessment. AAEM, 2015, 22(4). [CrossRef]
- Mandal, J.; Chakraborty, P.; Roy, I.; Chatterjee, S.; Gupta-Bhattacharya, S. Prevalence of allergenic pollen grains in the aerosol of the city of Calcutta, India: a two year study. Aerobiologia, 2008, 24, 151-164. [CrossRef]
- Potoglu-Erkara, I. Concentrations of airborne pollen grains in Sivrihisar (Eskisehir), Turkey. Environ. Mon. Assess., 2008, 138, 81–91. [CrossRef]
- Bıçakcı, A.; Benlioğlu, O. N.; Erdoğan, D. Airborne pollen concentration in Kütahya. Turkish J. Bot., 1999, 23, 75-81.
- Erkara, I. P.; Pehlıvan, S.; Tokur, S. Concentrations of airborne pollen grains in Eskisehir City (Turkey). JABS, 2007, 1(1), 33-42.
- Çeter, T.; Pinar, N. M.; Güney, K.; Yildiz, A.; Aşcı, B.; Smith, M. A 2-year aeropalynological survey of allergenic pollen in the atmosphere of Kastamonu, Turkey. Aerobiologia, 2012, 28, 355-366. [CrossRef]
- Pinar, N. M.; Şakiyan, N.; İnceoğlu, Ö.; Kaplan, A. A one-year aeropalynological study at Ankara, Turkey. Aerobiologia, 1999, 15, 307–310. [CrossRef]
- Fang, R.; Xie, S.; Wei, F. Pollen survey and clinical research in Yunnan, China. Aerobiologia, 2001, 17(2), 165-169. [CrossRef]
- Docampo, S.; Recio, M.; Trigo, M. M.; Melgar, M.; Cabezudo, B. Risk of pollen allergy in Nerja (southern Spain): a pollen calendar. Aerobiologia, 2007, 23, 189-199. [CrossRef]
- Altintaş, D. U.; Karakoç, G. B.; Yilmaz, M.; Pinar, M.; Kendirli, S. G.; Çakan, H. Relationship between pollen counts and weather variables in East-Mediterranean Coast of Turkey. J. Immunol. Res., 2004, 11, 87-96. [CrossRef]
- Tosunoglu, A.; Ilcim, A.; Malyer, H.; Bicakci, A. Aeropalynological spectrum of Hatay, Turkey, the eastern coast of the Mediterranean Sea. Aerobiologia, 2018, 34, 557-572. [CrossRef]
- Tosunoglu, A.; Altunoglu, M. K.; Bicakci, A.; Kilic, O.; Gonca, T.; Yilmazer, I.; Saatcioglu, G.; Akkaya, A.; Celenk, S.; Canitez, Y.; Malyer, H.; Sapan, N. Atmospheric pollen concentrations in Antalya, South Turkey. Aerobiologia, 2015, 31, 99-109. [CrossRef]
- Celenk, S.; Bicakci, A.; Tamay, Z.; Guler, N.; Altunoglu, M. K.; Canitez, Y.; Malyer, H.; Sapan, N. Airborne pollen in European and Asian parts of Istanbul. Environ. Monit. Assess., 2010, 164, 391–402. [CrossRef]
- Tosunoğlu, A.; Yenigün, A.; Bicakci, A.; Eliacik, K. Airborne pollen content of Kuşadası. Turkish J. Bot., 2013, 37(2), 297-305. [CrossRef]
- Kobzar, V. N. Aeropalynological monitoring in Bishkek, Kyrgyzstan. Aerobiologia, 1999, 15(2), 149-153. [CrossRef]
- Rogers, C. A. An aeropalynological study of metropolitan Toronto. Aerobiologia, 1997, 13, 243-257. [CrossRef]
- Tsou, C. H.; Tseng, J.; Lin, R. F.; Hong, H. Y. Aeropalynological investigation in Taichung, Taiwan, 1993-1995. Bot. Bull. Acad. Sin., 1997, 38.
Figure 1.
Location of the pollen monitoring site in Sarıkamış, Türkiye [11].
Figure 1.
Location of the pollen monitoring site in Sarıkamış, Türkiye [11].
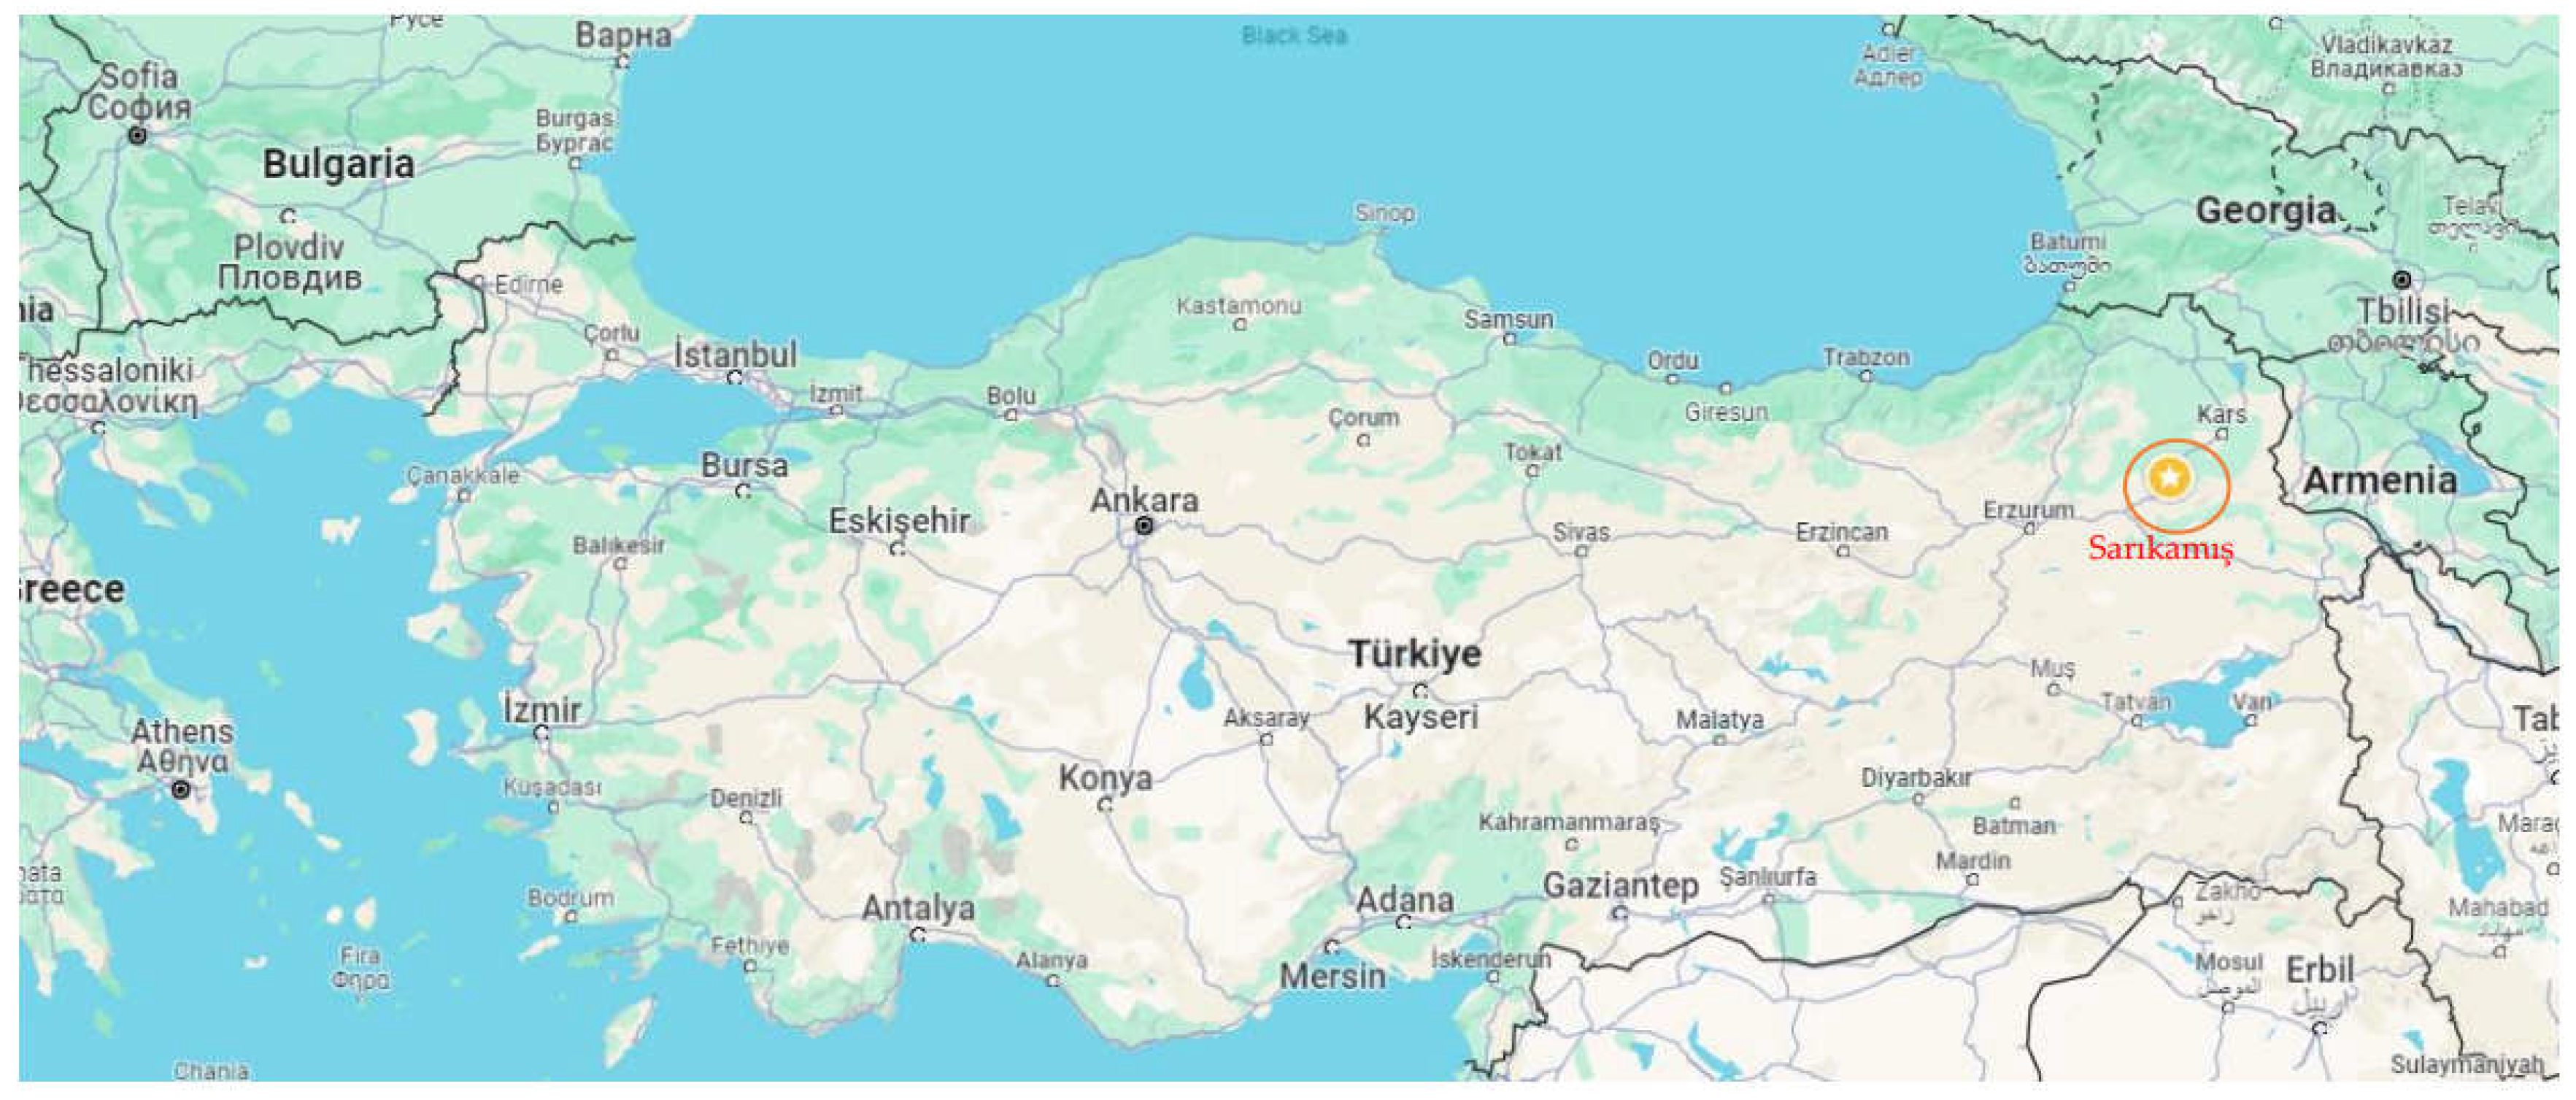
Figure 2.
Pollen calendar of Sarıkamış (years 2012–2013).
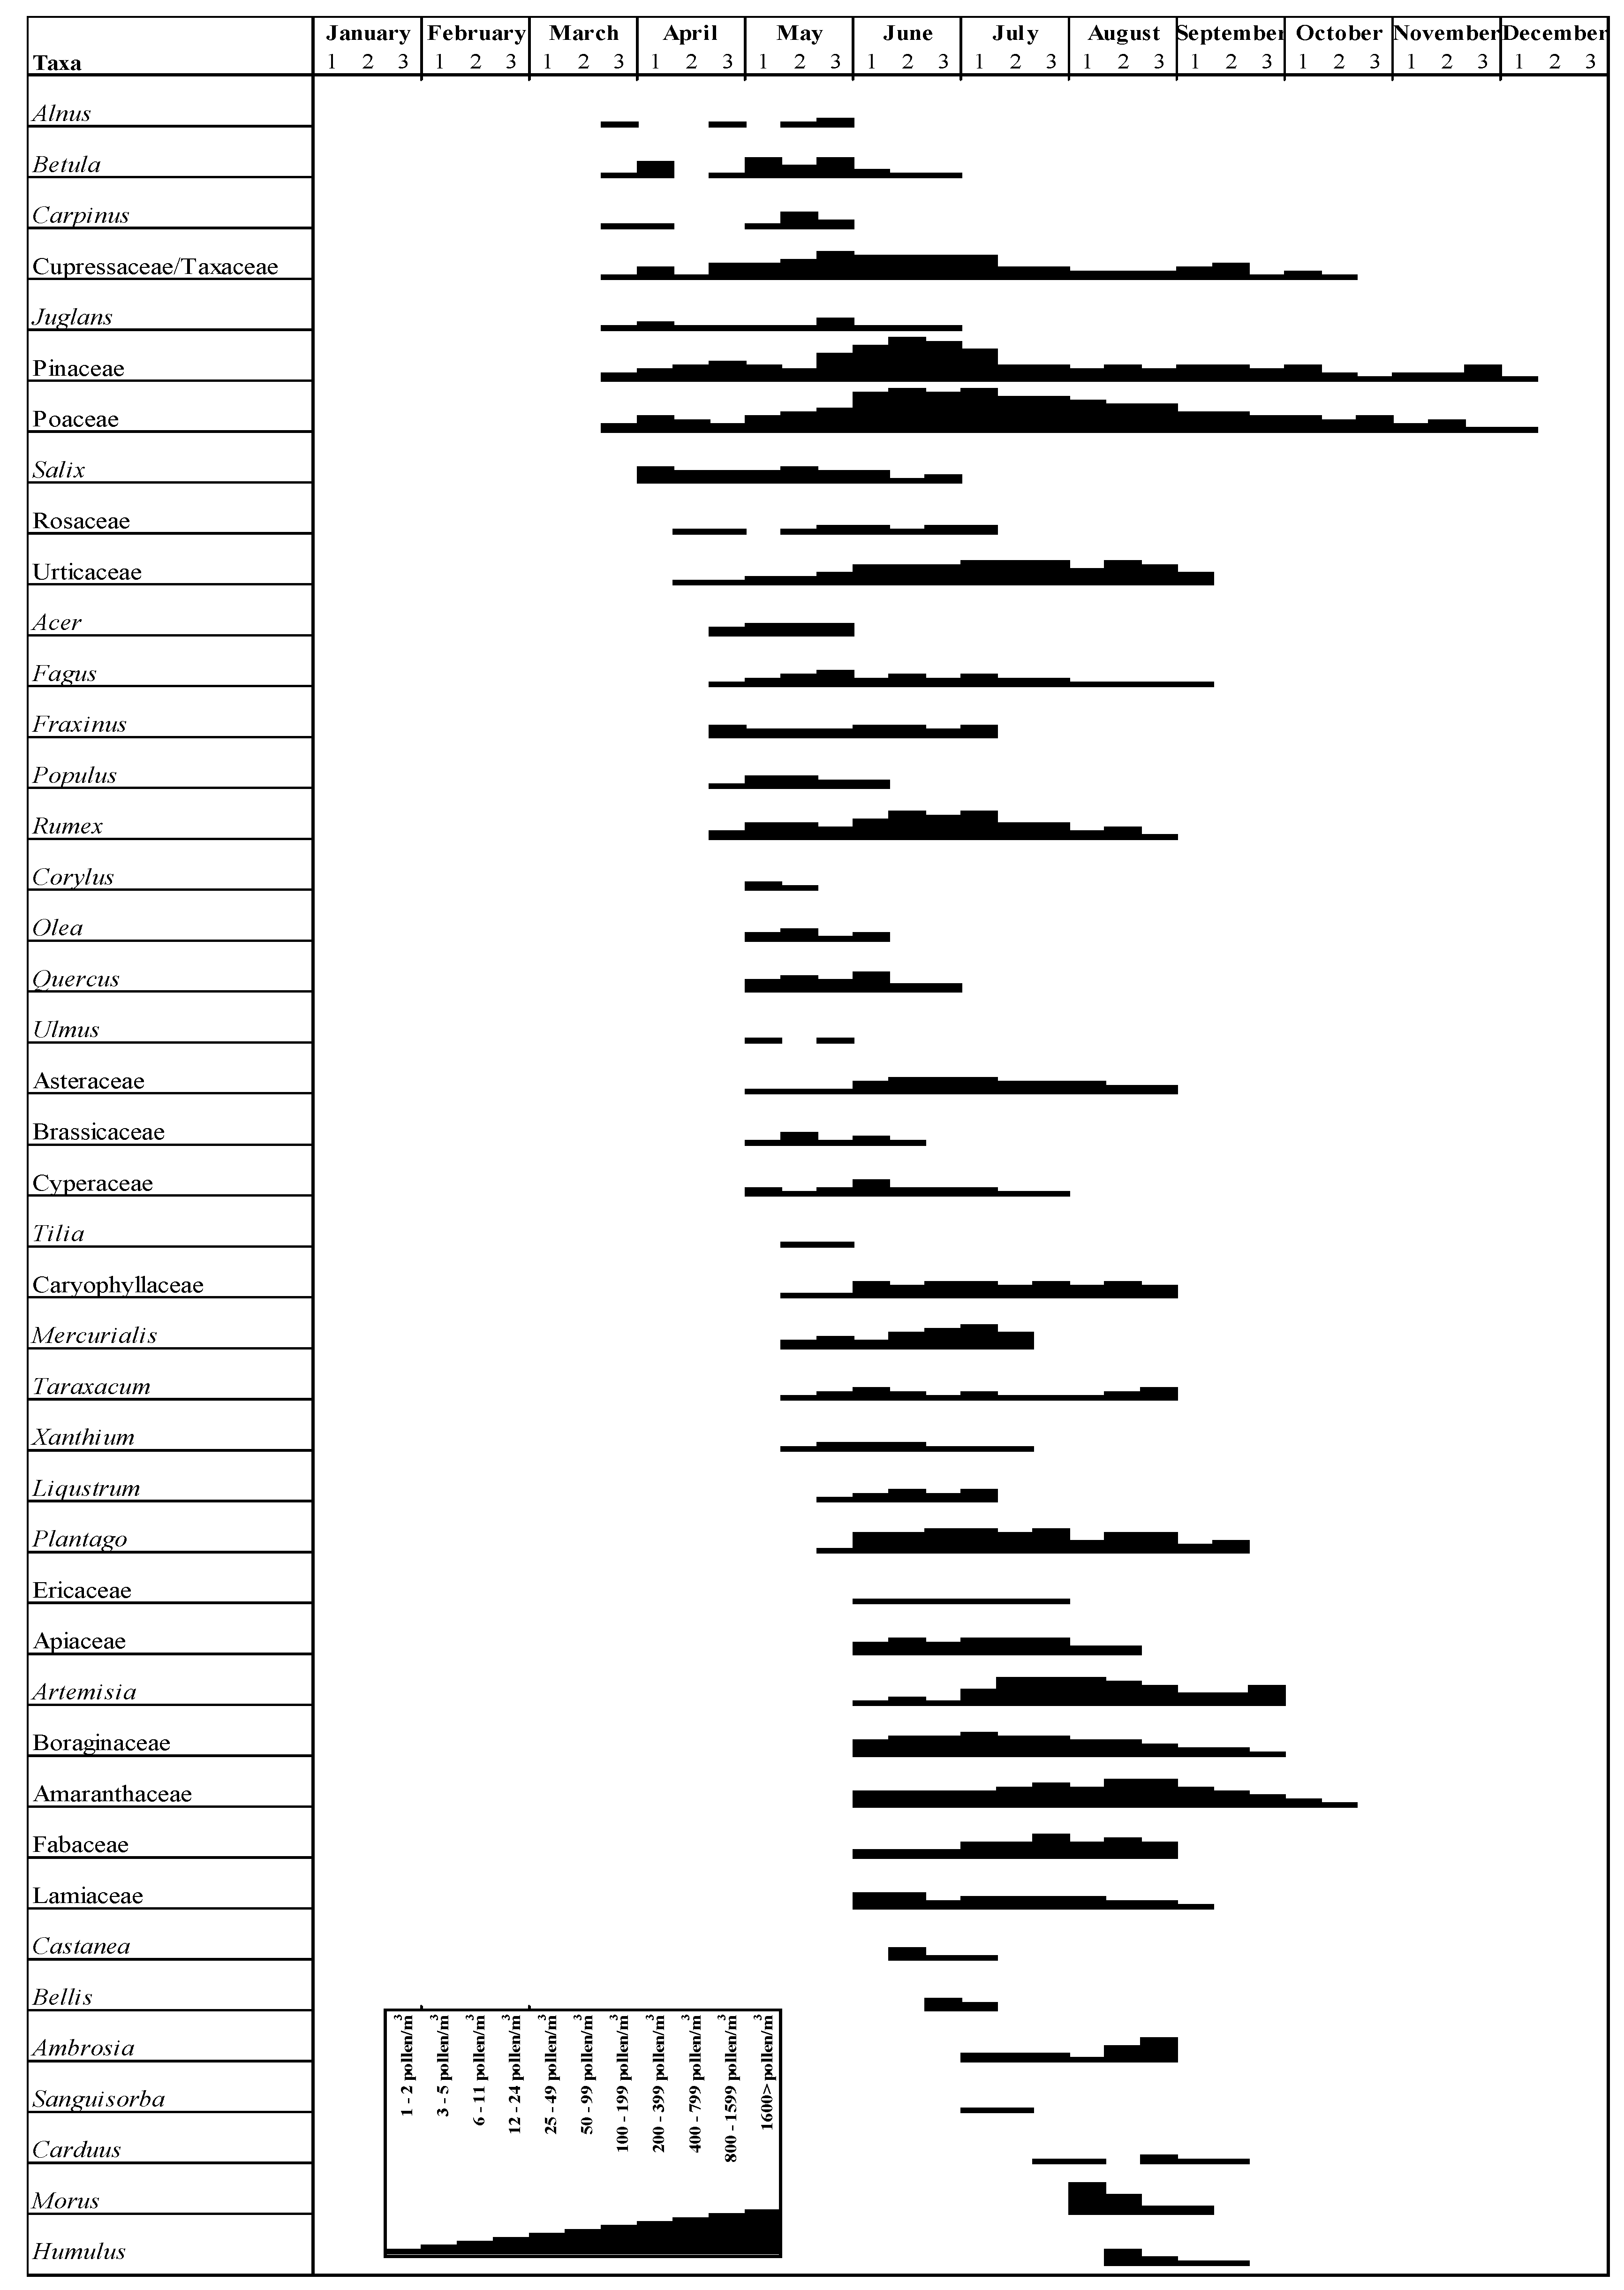

Table 1.
Annual pollen counts and percentage of pollen taxa recorded in Sarıkamış atmosphere (2012-2013).
Table 1.
Annual pollen counts and percentage of pollen taxa recorded in Sarıkamış atmosphere (2012-2013).
| 2012 | 2013 | Mean | |||||
| Taxa | Total | % | Total | % | Total | % | |
| Arboreal plants | Pinaceae | 4973 | 32,51 | 6319 | 27,95 | 5646 | 29,79 |
| Cupressaceae/Taxaceae | 472 | 3,09 | 489 | 2,16 | 481 | 2,54 | |
| Morus | 197 | 1,29 | 295 | 1,30 | 246 | 1,30 | |
| Betula | 41 | 0,27 | 167 | 0,74 | 104 | 0,55 | |
| Quercus | 71 | 0,46 | 72 | 0,32 | 72 | 0,38 | |
| Salix | 80 | 0,52 | 54 | 0,24 | 67 | 0,35 | |
| Fagus | 47 | 0,31 | 71 | 0,31 | 59 | 0,31 | |
| Fraxinus | 42 | 0,27 | 39 | 0,17 | 41 | 0,21 | |
| Carpinus | 2 | 0,01 | 63 | 0,28 | 33 | 0,17 | |
| Acer | 49 | 0,32 | 0 | 0,00 | 25 | 0,13 | |
| Populus | 42 | 0,27 | 4 | 0,02 | 23 | 0,12 | |
| Rosaceae | 20 | 0,13 | 14 | 0,06 | 17 | 0,09 | |
| Liqustrum | 17 | 0,11 | 23 | 0,10 | 20 | 0,11 | |
| Juglans | 17 | 0,11 | 20 | 0,09 | 19 | 0,10 | |
| Olea | 23 | 0,15 | 4 | 0,02 | 14 | 0,07 | |
| Castanea | 16 | 0,10 | 1 | 0,00 | 9 | 0,04 | |
| Alnus | 1 | 0,01 | 10 | 0,04 | 6 | 0,03 | |
| Ericaceae | 5 | 0,03 | 5 | 0,02 | 5 | 0,03 | |
| Corylus | 9 | 0,06 | 0 | 0,00 | 5 | 0,02 | |
| Tilia | 2 | 0,01 | 0 | 0,00 | 1 | 0,01 | |
| Ulmus | 2 | 0,01 | 0 | 0,00 | 1 | 0,01 | |
| Arboreal plants | 6128 | 40,06 | 7650 | 33,83 | 6889 | 36,34 | |
| Non arboreal plants | Poaceae | 5482 | 35,83 | 11426 | 50,53 | 8454 | 44,60 |
| Artemisia | 492 | 3,22 | 638 | 2,82 | 565 | 2,98 | |
| Amaranthaceae | 568 | 3,71 | 488 | 2,16 | 528 | 2,79 | |
| Rumex | 452 | 2,95 | 460 | 2,03 | 456 | 2,41 | |
| Urticaceae | 579 | 3,78 | 305 | 1,35 | 442 | 2,33 | |
| Plantago | 284 | 1,86 | 548 | 2,42 | 416 | 2,19 | |
| Boraginaceae | 216 | 1,41 | 315 | 1,39 | 266 | 1,40 | |
| Fabaceae | 256 | 1,67 | 119 | 0,53 | 188 | 0,99 | |
| Mercurialis | 217 | 1,42 | 129 | 0,57 | 173 | 0,91 | |
| Caryophyllaceae | 117 | 0,76 | 110 | 0,49 | 114 | 0,60 | |
| Apiaceae | 75 | 0,49 | 123 | 0,54 | 99 | 0,52 | |
| Asteraceae | 97 | 0,63 | 80 | 0,35 | 89 | 0,47 | |
| Lamiaceae | 51 | 0,33 | 98 | 0,43 | 75 | 0,39 | |
| Ambrosia | 46 | 0,30 | 38 | 0,17 | 42 | 0,22 | |
| Cyperaceae | 47 | 0,31 | 32 | 0,14 | 40 | 0,21 | |
| Taraxacum | 34 | 0,22 | 34 | 0,15 | 34 | 0,18 | |
| Humulus | 35 | 0,23 | 4 | 0,02 | 20 | 0,10 | |
| Bellis | 32 | 0,21 | 0 | 0,00 | 16 | 0,08 | |
| Brassicaceae | 27 | 0,18 | 0 | 0,00 | 14 | 0,07 | |
| Xanthium | 18 | 0,12 | 6 | 0,03 | 12 | 0,06 | |
| Carduus | 8 | 0,05 | 5 | 0,02 | 7 | 0,03 | |
| Sanguisorba | 2 | 0,01 | 2 | 0,01 | 2 | 0,01 | |
| Non arboreal plants | 9135 | 59,71 | 14960 | 66,16 | 12048 | 63,56 | |
| Unidentified | 35 | 0,23 | 1 | 0,00 | 18 | 0,09 | |
| Total | 15298 | 100,00 | 22611 | 100,00 | 18955 | 100,00 | |
Table 2.
Monthly variation of dominant pollen types observed in Sarıkamış atmosphere during 2012–2013 and monthly % of pollen according to the annual sum.
Table 2.
Monthly variation of dominant pollen types observed in Sarıkamış atmosphere during 2012–2013 and monthly % of pollen according to the annual sum.
| Taxa | Jan. | Feb. | Mar. | Apr. | May | Jun. | Jul. | Aug. | Sep. | Oct. | Nov. | Dec. | Total | |
|---|---|---|---|---|---|---|---|---|---|---|---|---|---|---|
| Poaceae | 2012 | 0.03 | 0.24 | 0.68 | 14.22 | 16.75 | 2.99 | 0.51 | 0.28 | 0.13 | 0.01 | 35.83 | ||
| 2013 | 0.02 | 0.15 | 0.74 | 25.00 | 22.00 | 2.12 | 0.33 | 0.17 | 0.004 | 50.53 | ||||
| Mean | 0.02 | 0.18 | 0.71 | 20.65 | 19.88 | 2.47 | 0.40 | 0.22 | 0.05 | 0.01 | 44.60 | |||
| Pinaceae | 2012 | 0.03 | 0.42 | 0.53 | 29.77 | 1.12 | 0.22 | 0.16 | 0.09 | 0.16 | 0.01 | 32.51 | ||
| 2013 | 0.02 | 0.28 | 0.77 | 24.56 | 1.69 | 0.16 | 0.27 | 0.11 | 0.07 | 0.01 | 27.95 | |||
| Mean | 0.03 | 0.34 | 0.67 | 26.66 | 1.46 | 0.18 | 0.23 | 0.10 | 0.11 | 0.01 | 29.79 | |||
| Artemisia | 2012 | 0.05 | 1.41 | 1.39 | 0.38 | 3.22 | ||||||||
| 2013 | 0.02 | 1.56 | 1.11 | 0.13 | 2.82 | |||||||||
| Mean | 0.03 | 1.50 | 1.22 | 0.23 | 2.98 | |||||||||
| Amaranthaceae | 2012 | 0.22 | 0.78 | 2.18 | 0.48 | 0.05 | 3.71 | |||||||
| 2013 | 0.31 | 0.60 | 1.11 | 0.12 | 0.01 | 2.16 | ||||||||
| Mean | 0.28 | 0.67 | 1.55 | 0.27 | 0.03 | 2.79 | ||||||||
| Cupressaceae/ Taxaceae | 2012 | 0.01 | 0.22 | 0.86 | 1.51 | 0.40 | 0.07 | 0.01 | 3.09 | |||||
| 2013 | 0.00 | 0.06 | 0.86 | 0.56 | 0.38 | 0.04 | 0.22 | 0.04 | 2.16 | |||||
| Mean | 0.01 | 0.13 | 0.86 | 0.94 | 0.39 | 0.06 | 0.13 | 0.03 | 2.54 | |||||
| Rumex | 2012 | 0.04 | 0.46 | 1.56 | 0.82 | 0.08 | 2.95 | |||||||
| 2013 | 0.00 | 0.07 | 1.14 | 0.79 | 0.04 | 2.03 | ||||||||
| Mean | 0.02 | 0.22 | 1.31 | 0.80 | 0.06 | 2.41 | ||||||||
| Urticaceae | 2012 | 0.01 | 0.13 | 0.92 | 1.62 | 1.06 | 0.05 | 3.78 | ||||||
| 2013 | 0.00 | 0.06 | 0.38 | 0.68 | 0.21 | 0.02 | 1.35 | |||||||
| Mean | 0.01 | 0.09 | 0.60 | 1.06 | 0.55 | 0.03 | 2.33 | |||||||
| Plantago | 2012 | 0.01 | 0.38 | 0.82 | 0.56 | 0.08 | 1.86 | |||||||
| 2013 | 1.05 | 0.99 | 0.33 | 0.06 | 2.42 | |||||||||
| Mean | 0.01 | 0.78 | 0.92 | 0.42 | 0.07 | 2.19 | ||||||||
| Boraginaceae | 2012 | 0.32 | 0.71 | 0.34 | 0.04 | 1.41 | ||||||||
| 2013 | 0.62 | 0.60 | 0.14 | 0.04 | 1.39 | |||||||||
| Mean | 0.50 | 0.65 | 0.22 | 0.04 | 1.40 | |||||||||
| Morus | 2012 | 1.29 | 1.29 | |||||||||||
| 2013 | 1.28 | 0.03 | 1.30 | |||||||||||
| Mean | 1.28 | 0.02 | 1.30 | |||||||||||
| Others | 2012 | 0.03 | 0.44 | 2.48 | 2.32 | 3.26 | 1.78 | 0.03 | 10.35 | |||||
| 2013 | 0.02 | 0.24 | 1.45 | 1.93 | 1.71 | 0.49 | 0.04 | 5.87 | ||||||
| Mean | 0.03 | 0.32 | 1.86 | 2.09 | 2.34 | 1.01 | 0.03 | 7.68 | ||||||
| Total | 2012 | 0.10 | 1.37 | 5.15 | 51.26 | 27.68 | 11.97 | 1.73 | 0.42 | 0.29 | 0.02 | 100.00 | ||
| 2013 | 0.07 | 0.74 | 3.93 | 55.57 | 30.99 | 7.03 | 1.25 | 0.34 | 0.07 | 0.01 | 100.00 | |||
| Mean | 0.08 | 1.00 | 4.42 | 53.83 | 29.66 | 9.02 | 1.44 | 0.37 | 0.16 | 0.02 | 100.00 |
Table 3.
Characteristics of the main pollen season (MPS) for the most essential taxa (start and end dates), season length (days), and maximum values of monthly pollen concentration (pollen/m3).
Table 3.
Characteristics of the main pollen season (MPS) for the most essential taxa (start and end dates), season length (days), and maximum values of monthly pollen concentration (pollen/m3).
| 2012 | 2013 | ||
| Poaceae | Main pollen season | 01.06 - 31.08 | 04.06 - 16.08 |
| Main pollen season length (days) | 91 | 73 | |
| Maximum daily pollen/m3 | 12 July - 358 | 01 July - 719 | |
| Number of days with risk | 26 | 36 | |
| Pinaceae | Main pollen season | 30.05 - 12.07 | 01.06 - 16.07 |
| Main pollen season length (days) | 43 | 45 | |
| Maximum daily pollen/m3 | 17 June - 812 | 27 June - 687 | |
| Number of days with risk | 16 | 27 | |
| Artemisia | Main pollen season | 11.07 - 28.09 | 10.07 - 23.09 |
| Main pollen season length (days) | 79 | 75 | |
| Maximum daily pollen/m3 | 27 July - 35 | 16 July - 38 | |
| Number of days with risk | 3 | 4 | |
| Amaranthaceae | Main pollen season | 14.06 - 21.09 | 09.06 - 11.09 |
| Main pollen season length (days) | 99 | 94 | |
| Maximum daily pollen/m3 | 12 August - 34 | 28 August - 26 | |
| Number of days with risk | 3 | 1 | |
|
Cupressaceae/ Taxaceae |
Main pollen season | 3.04 - 01.08 | 24.04 - 11.009 |
| Main pollen season length (days) | 101 | 140 | |
| Maximum daily pollen/m3 | 18 May - 31 | 27 May - 102 | |
| Number of days with risk | - | 1 | |
| Rumex | Main pollen season | 02.05 - 01.08 | 30.05 - 25.07 |
| Main pollen season length (days) | 91 | 56 | |
| Maximum daily pollen/m3 | 17 June - 33 | 01 July - 87 | |
| Number of days with risk | 1 | 2 | |
| Urticaceae | Main pollen season | 23.05 - 27.08 | 29.05 - 27.08 |
| Main pollen season length (days) | 96 | 90 | |
| Maximum daily pollen/m3 | 22 July - 26 | 18 July - 18 | |
| Number of days with risk | 8 | 1 | |
| Plantago | Main pollen season | 08.06 - 12.09 | 03.06 - 29.08 |
| Main pollen season length (days) | 96 | 87 | |
| Maximum daily pollen/m3 | 11 July - 10 | 01 July - 34 | |
| Number of days with risk | - | 1 | |
| Boraginaceae | Main pollen season | 10.06 - 31.08 | 09.06 - 23.08 |
| Main pollen season length (days) | 82 | 75 | |
| Maximum daily pollen/m3 | 26 July - 12 | 18 June - 22 | |
| Number of days with risk | 1 | 9 | |
| Morus | Main pollen season | 09.08 - 22.08 | 07.08 - 28.08 |
| Main pollen season length (days) | 13 | 21 | |
| Maximum daily pollen/m3 | 09 August - 39 | 11 August - 42 | |
| Number of days with risk | 3 | 4 |
Table 4.
Mean monthly meteorological data recorded in Sarıkamış, obtained from the State Meteorological Service of Türkiye.
Table 4.
Mean monthly meteorological data recorded in Sarıkamış, obtained from the State Meteorological Service of Türkiye.
| Meteotological Data | Year | Jan. | Feb. | Mar. | Apr. | May | Jun. | Jul. | Aug. | Sep. | Oct. | Nov. | Dec. | Annual Average |
| Monthly Average Relative Humidity (%) | 2012 | 78.9 | 73.3 | 68.9 | 68.3 | 71.1 | 57.4 | 65.6 | 51.9 | 56.9 | 70.9 | 76.5 | 81.2 | 64.5 |
| 2013 | 75 | 79.2 | 70.1 | 65.7 | 65.8 | 64.2 | 65.6 | 61.8 | 55 | 60.6 | 77 | 71.1 | 67.6 | |
| Monthly Average Wind Speed (m/sn) | 2012 | 1.4 | 1.3 | 1.9 | 1.6 | 1.2 | 2.5 | 3.7 | 1.6 | 1 | 0.9 | 1.1 | 1.2 | 1.6 |
| 2013 | 1.5 | 1.3 | 1.9 | 1.5 | 1.5 | 1.2 | 1.3 | 1.1 | 1.1 | 1.2 | 1.1 | 1.2 | 1.3 | |
| Monthly Average Temperature (oC) | 2012 | -7.3 | -9.9 | -6.1 | 5.5 | 9.3 | 14.1 | 11.8 | 17.4 | 12.7 | 7.5 | 2.7 | -5.6 | 4.3 |
| 2013 | -7.3 | -5 | -1.2 | 5.1 | 9.3 | 12.6 | 15.7 | 15.3 | 11.8 | 4.4 | 1.6 | -9.7 | 4.4 | |
| Monthly Total Precipitation (mm) | 2012 | 20.8 | 36.8 | 14 | 26.6 | 40 | 19 | 0.2 | 1.4 | 16.6 | 36.2 | 3.6 | 0 | 17.9 |
| 2013 | 0 | 0 | 0.4 | 74.6 | 36.8 | 50.6 | 4.8 | 3.8 | 19.8 | 23.4 | 1.4 | 3.2 | 18.2 |
Table 5.
Spearman’s correlation analysis between daily total pollen concentration and meteorological data.
Table 5.
Spearman’s correlation analysis between daily total pollen concentration and meteorological data.
| Taxa | Daily Temperature | Daily Relative Humidity | Daily Wind Speed | Daily Precipitation | |
|---|---|---|---|---|---|
| Daily Total Polen | .680** | -.121** | .137** | -.121 | |
| Poaceae | .580** | .015 | .182** | -.170 | |
| Pinaceae | .154** | .013 | .039 | .094 | |
| Urticaceae | .404** | .088 | .247** | -.019 | |
| Amaranthaceae | .311** | .025 | .071 | .130 | |
| Artemisia | .334** | -.014 | .315** | -.363* | |
| Cupressaceae/Taxaceae | .121 | -.202** | -.093 | -.081 | |
| Rumex | .212** | .089 | .081 | .157 | |
| Plantago | .150* | .227** | .130 | -.015 | |
| Boraginaceae | .096 | .205** | .088 | .189 | |
| Morus | .142 | -.126 | -.161 | -.028 | |
| ** Correlation is significant at the 0.01 level (2-tailed) | |||||
| * Correlation is significant at the 0.05 level (2-tailed) | |||||
Disclaimer/Publisher’s Note: The statements, opinions and data contained in all publications are solely those of the individual author(s) and contributor(s) and not of MDPI and/or the editor(s). MDPI and/or the editor(s) disclaim responsibility for any injury to people or property resulting from any ideas, methods, instructions or products referred to in the content. |
© 2024 by the authors. Licensee MDPI, Basel, Switzerland. This article is an open access article distributed under the terms and conditions of the Creative Commons Attribution (CC BY) license (http://creativecommons.org/licenses/by/4.0/).
Copyright: This open access article is published under a Creative Commons CC BY 4.0 license, which permit the free download, distribution, and reuse, provided that the author and preprint are cited in any reuse.


