Submitted:
28 May 2024
Posted:
28 May 2024
You are already at the latest version
Abstract
Background: This study aimed to examine the effect of 7-Ketositosterol (7-KSS), on sphingomyelin/ceramide metabolites and apoptosis in human breast MCF-7 and human liver HepG2 cancer cells. Methods: Anti-proliferative effects of 7-KSS treatment were assessed at different concentrations and periods. Cell viability was assessed through MTT analysis, whereas the levels of sphingosine-1-phosphate (S1P), sphingomyelins (SMs), and ceramides (CERs) were measured using LC-MS/MS. Phosphorylated 44/42 ERK1/2 and NF-kB p65 (Ser536) protein levels were measured by western blot analysis and immunofluorescence staining. Apoptosis was evaluated by TUNEL staining and flow cytometric assessment of annexin-V and propidium iodide (PI) labeling. Results: Treatment with 7-KSS significantly decreased cell survival, S1P, p-44/42 ERK1/2, and p-NF-κBp65 protein levels in cancer cells compared to controls. A substantial rise was detected in intracellular amounts of C16-C24 CERs and apoptosis in cancer cells incubated with 7-KSS. Conclusions: 7-KSS stimulated ceramide accumulation and apoptosis while decreasing cell proliferation via downregulating S1P, p-44/42 ERK1/2 and p-NF-κBp65 protein levels.
Keywords:
7-Ketositosterol
; ceramide
; apoptosis
; ERK
Introduction
The protective effects of dietary plant sterols in different cancers have been reported by recent studies [1,2]. 7-Ketositosterol (7-KSS) is a natural substance derived from oxidized plant sterols [3], also named phytosterols. Phytosterols resemble cholesterol and are generally known for their ability to help lower cholesterol levels in humans by blocking the absorption of cholesterol in the intestines [4]. Common phytosterols include beta-sitosterol which is one of the most abundant phytosterol found in plants such as nuts, seeds, fruits, and vegetables. It's known for its cholesterol-lowering effects and is often used as a dietary supplement for managing cholesterol levels [5]. Campesterol is another common phytosterol found in various plant oils, seeds, and nuts. Like beta-sitosterol, campesterol also has cholesterol-lowering properties [6]. Stigmasterol is found in soybeans, vegetables, and various grains. Stigmasterol is structurally like cholesterol and has been studied for its potential role in reducing cholesterol levels and inflammation [6]. Brassicasterol is predominantly found in brassica vegetables like broccoli, brussels sprouts, and cabbage. Brassicasterol has also been studied for its cholesterol-lowering effects. There is some evidence to suggest that phytosterols may modulate immune function, although more research is needed in this area [6].
Some studies suggest that phytosterols may possess anti-inflammatory properties, which could be beneficial for conditions associated with inflammation, such as arthritis and cardiovascular diseases [7]. Phytosterols may act as antioxidants, helping to neutralize harmful free radicals in the body and reduce oxidative stress, which is implicated in various diseases and aging processes [7]. In the context of cancer, phytosterols have attracted some interest because of their structural similarity to cholesterol and potential to reduce the risk of certain cancers through various mechanisms, such as reducing inflammation, modulating immune responses, or interfering with cancer cell growth pathways [8].
Phytosterols contain double bonds in their chemical structure, making them susceptible to oxidation [9]. Free radicals can abstract hydrogen atoms from the double bonds, leading to the formation of phytosterol oxidation products (POPs) [9]. Transition metal ions such as iron and copper can catalyze the oxidation of phytosterols by facilitating the generation of reactive oxygen species. Exposure to light, particularly ultraviolet (UV) radiation, can promote the oxidation of phytosterols. The oxidation of phytosterols can result in the formation of various oxidation products, including hydroperoxides, epoxides, aldehydes and ketones [9]. These oxidized phytosterols may have altered chemical properties and reduced biological activity compared to their unoxidized counterparts. Moreover, some oxidation products may have cytotoxic effects [10,11]. 7-Ketositosterol itself is a specific oxidation product of beta-sitosterol. It is reported to be the most abundant POP in commercial spreads [12]. Previous studies have shown that 7-KSS was cytotoxic and apoptotic in HepG2 human liver cancer cells [10]. Phytosterols boost ceramide levels in human prostate, colon, and breast cancer cells [13]. The increase in ceramide levels block cell proliferation, activate caspases and lead to apoptosis in cancer cells [14].
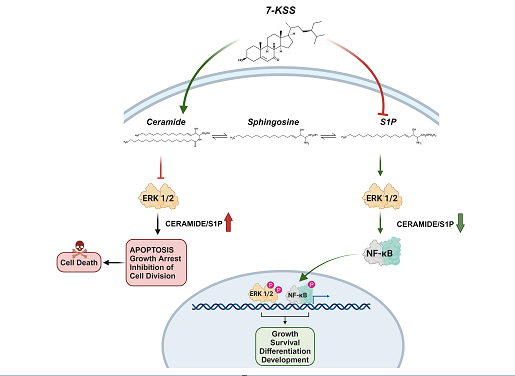
Extracellular signal-regulated kinases (ERK), also known as mitogen-activated protein kinases (MAPK), show an important function in cancer pathogenesis [15]. Phytosterols have been clearly recognized in the regulation of ERK signaling [16]. It is also known that ceramide inhibits ERKs consisting of ERK1 and ERK2 [17]. The ERK proteins get an input from the upstream toll-like receptor 4 (TLR4) which stimulates activated protein 1 (AP1) signaling pathway leading to the expression of genes and inflammatory mediators related with cell cycle regulation [18]. Nuclear Factor kappa B (NF-κB) and ERKs are described to adjust the expression of the cell cycle genes causing an increase in cell growth, proliferation, and angiogenesis [19]. Numerous phytosterols inhibit tumor growth and diminish the tumor microenvironment by preventing the activation of the NF-kB and ERK signaling, as well as production of cytokines [16].
The biological significance of 7-KSS is still an area of research, and it is not as well-known or understood as other related compounds. In this study, we investigated the anti-proliferative and anticancer efficacy of 7-KSS in human breast (MCF-7) and liver (HepG2) cancer cells by measuring intracellular sphingolipid metabolite levels and apoptosis. Studies have reported that TLR-4 is expressed in both cancer cell lines [20,21]. Thus, we also determined the effects of 7-KSS on downstream effectors of the ERK signaling pathway by determining phospho-NF-κB and phospho-ERK protein levels. We report herein that 7-KSS can increase ceramide levels, induce apoptosis and inhibit cell proliferation by blocking phosphorylation of ERK and NF-κB in human liver and breast cancer cells.
Materials and Methods
Cell Culture
Human breast cancer (MCF-7) and human liver cancer (HepG2) cell lines were obtained from American Type Culture Collection (ATCC; Manassas, VA, USA). MCF-7 cells were cultured using Dulbecco's Modified Eagle's Medium (DMEM)–F12 (Biowest; Cat.#L0092, Nuaillé, France) containing 10% (v/v) heat-inactivated fetal bovine serum (FBS) (Gibco, Life Technologies, Grand Island, NY, USA), 100 U/mL penicillin, 100 μg/mL streptomycin (Gibco), amphotericin B (5 μg/100 mL, Gibco) and 1% 2.5 mM L-Glutamine. HepG2 cells were cultured with DMEM high glucose medium (Sigma; Cat.#D5648, St. Louis, MO, USA) containing 3.7 g/L sodium bicarbonate (Sigma-Aldrich), 10% (v/v) FBS, 100 U/mL penicillin, 100 μg/mL streptomycin, 1% sodium pyruvate (Gibco) and 5 μg/100 mL amphotericin B. The cells were propagated in the incubator at 37°C with 5% CO2 and 95% humidified air. When cells reach 80% confluency, they were passaged by removal from the flask surface using trypsin-EDTA (0.05% Trypsin/0.02% EDTA; Gibco) and suspended into new flasks.
7-Ketositosterol Treatment
The 7-KSS used in our study was commercially available (MW= 428.7 g/mol; Cayman, Cat.#37189 Ann Arbor, MI, USA). 5 mg of 7-KSS was dissolved in 1 ml of DMSO to prepare an 11.66 mM stock solution. An intermediate stock of 1 mM was formed with cell culture medium. The final concentrations of 7-KSS used in MTT [3-(4,5-dimethylthiazol-2-yl)-2,5-diphenyltetrazolium bromide] analysis was 5, 10, 15, 30 μM. MTT analysis data was used to determine the final dose and duration of 7-KSS administration in MCF-7 and HepG2 cells.
MTT Analysis
MCF-7 and HepG2 cells were transferred to 96 well plates. Cells were incubated overnight to adhere, and later treated with culture medium containing 1 μL/mL DMSO or 5-30 μM 7-KSS. At the end of 12, 18 and 24 hour incubation periods, MTT protocol was started. MTT (Gold Biotechnology Inc., St. Louis, MO, USA) was dissolved in PBS (5 mg/mL) and passed through a 0.22 μm pore filter. Incubation medium was withdrawn and fresh medium (90 μL) and MTT (10 μL) were added to the wells. Following the 2 hours MTT incubation (at 37°C), purple formazan crystals formed and 100 μL of DMSO was added. Absorbance was measured by a spectrophotometric plate redear at 570 and 690 nm. The absorbance formed in the control group was calculated to represent 100% cell viability [Cell viability (%) = (Abs sample/ Abs control) x 100]. Three different experimental groups were formed for each cell line. Control, DMSO (1 μL/mL) and 7-KSS (MCF-7 and HepG2 cells incubated with 30 μM 7-KSS for 24 h)
Immunofluorescent Staining
MCF-7 and HepG2 cells were transferred to chamber slides (100,000 cells/well) (Merck Millipore, Cork, Ireland). The chamber slides were incubated at 37°C, 5% CO2 incubator overnight for cells to adhere. The culture medium was replaced with treatment medium when cells reached 70% confluency and incubation was carried out for 24 h. The medium was withdrawn and washed twice (0.01 M cold PBS). Then, freshly prepared 250μL of 4% paraformaldehyde was added and cells were fixed at room temperature for 10 minutes. The fixation solution was aspirated, and cells were washed 2 times with PBS buffer. For the permeabilization process, 0.2% Triton X-100 (SigmaAldrich, St. Louis, MO, USA) was prepared in 300 μL of PBS and was added and incubated for 30 minutes at room temperature. Cells were washed with cold PBS 5 times and 5% normal goat serum (NGS; Vector Laboratories, Burlingame, CA, USA) was added for blocking. The blocking solution was withdrawn, and cells were treated with phospho-p44/42 ERK1/2 (1:200 dilution, Cat.#9101, Cell Signalling Tech., Massachusetts, USA), phospho-NF-kB p65 (1:200 dilution, Cat.#AF2006, Affinity Biosciences, Jiangsu, China) and PCNA (1:200 dilution, Cat.#bs-0754R, Bioss Antibodies Inc., Massachusetts, USA) antibodies at 200 μl per well overnight at 4°C without washing. The next day, the chamber slides were washed 5 times at room temperature with PBS and incubated at room temperature for 45 min with Alexa Fluor-488 conjugated goat anti-rabbit (1:1000, Cat.#ab150077 Abcam, Cambridge, UK) secondary antibody at 200 μl per well in the dark room. After 3 washes with PBS, the chamber slide assembly was separated and a drop of DAPI (Vector Laboratories Inc., Burlingame, CA, USA) was dripped onto the slide for nucleus staining and closed with a coverslip without air bubbles. Slides were evaluated via a fluorescence microscope (Olympus IX81, Tokyo, Japan) at 20x magnification. Alexa Flour was imaged at 488 nm excitation and 505-525 nm emission, while DAPI was imaged at 350 nm excitation and 440-460 nm emission wavelengths. Fluorescence intensity in HepG2 and MCF-7 cells was determined by NIH ImageJ 1.53e software. Validated total cell fluorescence (CTCF) for single cell in each group was determined by the formula CTCF = Integrated Density - (Area of the selected cell X Background mean fluorescence).
Enzyme-Linked Immunosorbent Assay
Proliferating cell nuclear antigen (PCNA) measurements were performed with a non-competitive sandwich ELISA kit (ELK Biotechnology; Denver, USA, Cat.#ELK5141). MCF-7 and HepG2 cells were dosed according to the study groups and the collected cells (107 cells/mL) were suspended in PBS and subjected to ultrasonication followed by centrifuged at 2-8°C for 10 min at 1500 × g. PCNA measurements were performed in supernatants following manufacturer's instructions. The concentration of PCNA in the samples were determined at 450 nm via a PCNA standard curve and given as ng/mg protein.
Phospo-ERK analysis were performed with a non-competitive sandwich ELISA kit (ELK Biotechnology; Denver, USA, Cat.#ELK8541). MCF-7 and HepG2 cells were dosed according to the study groups and the collected cells (107 cells/mL) were suspended in PBS and subjected to ultrasonication followed by centrifuged at 2-8°C for 10 min at 1500 × g. Phospo-ERK measurements were performed in supernatants following manufacturer's instructions. The concentration of p-ERK in the samples were determined at 450 nm via a p-ERK standard curve and reported as pg/mg protein.
Phospho-NFκB p65 (ser536) measurements were performed with a non-competitive sandwich ELISA kit (BT Lab, Bioassay Technology Laboratory; Shanghai, China, Cat.#E4753Hu) according to manufacturer's instructions. MCF-7 and HepG2 cells were dosed according to the study groups and the collected cells (106cells/mL) were suspended in PBS and subjected to ultrasonication followed by centrifuged at 2-8°C for 20 min at 1500 × g. The concentration of p-NFκB p65 (ser536) in the samples were determined at 450 nm via a standard curve and reported as pg/mg protein.
Western Blot Analysis
Western Blot analysis was performed as previously described [22]. 2-mercaptoethanol was added to Laemmli sample buffer (Cat.# 161-0737, BioRad Laboratories Inc. USA) prior to mixing with cell lysates obtained from treatment groups. Proteins were denatured at 100 °C and 30 µl sample (30 µg protein) was separated on 12% Mini-protean TGX precast electrophoresis gels (Cat.#4561043, BioRad Laboratories Inc. USA). Trans-Blot SD Semi-Dry Transfer Cell (BioRad Laboratories Inc. USA) was used to transfer proteins from gels and immobilize them on nitrocellulose membranes which were than immersed in 10 ml of blocking buffer [2% bovine serum albumin (BSA) in PBS] at room temperature for 5 min. Primary antibodies were diluted in blocking buffer and applied for 1 hour at room temperature. Primary antibodies were phospho-44/42 ERK1/2 (1:1000 dilution, Cat.#9101, Cell Signalling Tech., Massachusetts, USA), phospho-NF-kB p65 (Ser536) (1:500 dilution, Cat.#AF2006, Affinity Biosciences, Jiangsu, China), NF-κB p65 (1:2000 dilution, Cat.#ab16502, Abcam Limited, Cambridge, UK), ERK1/2 (1:2000 dilution, Cat.#AF0155 , Affinity Biosciences, Jiangsu, China) and beta Actin (1:1000 dilution, Cat.#ab8227, Abcam Limited, Cambridge, UK). Blots were washed in 10 ml Tris Buffered Saline (TBS) with 0.05% Tween 20 for 5 min for a total of five times. Secondary antibody, Goat Anti-Rabbit IgG HRP-conjugate (1:10000 dilution, Cat.# 632131, Sigma-Aldrich, St. Louis, MO, USA) was applied for 1 hour at room temperature and blots were washed in 10 ml TBS with 0.05% Tween 20 for 5 min for a total of five times. Immunoreactive bands were visualized by ECL reagent (Amersham Pharmacia Biotech, Buckinghamshire, UK). All Western blots were quantified by image analysis using NIH ImageJ 1.53e software.
Determination of Apoptotic Cells
One-Step TUNEL Test Kit (Elabscience, Cat#E-CK-A320, Houston, Texas, USA) was used to detect apoptotic cells. Terminal Deoxynucleotidyl Transferase (TdT) can catalyze the addition of fluorescein labeled dUTP to the exposed 3'-OH ends of the broken DNA. All reagents and samples were prepared in accordance with the test kit procedure. MCF-7 and HepG2 cells were transferred to chamber slides at approximately 100,000 cells per well. The culture medium was replaced with treatment medium when cells reached 70% confluency and incubation was carried out for 24 h. Positive control group was treated with DNase I, cutting off DNA to produce exposed 3'-OH ends. 100 μL DNase I solution (200 U/mL) was applied, and cells were incubated at 37°C for 30 min. The slides were washed with PBS 3 times, 5 min each time. For negative controls cells were incubated with DNase I buffer at room temperature for 5 minutes and washed with PBS 3 times, 5 min each time. After the experimental groups completed the penetration step, 100 μL of TdT balancing buffer was added and slides were incubated at 37°C for 25 min. At the end of the period, 50 μL of labeling working solution was added to each slide and incubated at 37°C for 60 minutes in a humidified environment. The negative control labeling working solution did not contain TdT enzyme. At the end of the incubation period the slides were washed with PBS 3 times, 5 min each time. The chambers were separated, wiped with a napkin, a drop of DAPI was dripped onto the slides, and a clean coverslip was sealed without air bubbles. The fluorescence intensity of the slides was then visualized under a fully automated Olympus BX61 microscope and analyzed using Image J software (NIH).
The apoptotic effects of 7-ketositosterol on liver cancer and breast cancer cells were also evaluated with FITC-conjugated annexin-V and PI apoptosis kit (Elabscience: #E-CK-A211, Elabscience, Texas, USA). Cell groups were established as previously described. At the end of the applications, the media were discarded. After the washing process, trypsinization was applied to remove the cells on the flask surface. To remove the cells from the trypsin-containing solution, the supernatant was discarded after centrifugation at 125 x g for 5 minutes at +4°C. Cells were suspended with PBS and 1x10⁶ cells were transferred to the flow cytometry tube. Centrifugation was carried out at 125 x g for 5 minutes and the supernatant was removed. The cells were suspended with 500 µL annexin-V binding buffer. 5 µL FITC-labeled annexin-V and 5 µL PI reagents were added to the cells and incubated for 20 minutes at room temperature. At the end of the incubation, fluorescent conjugated cells were quickly analyzed on flow cytometry device (FACS Canto II, BD Bioscience, San Jose, CA, USA) at appropriate device settings. BD FACS Diva 6.1.3 software (BD Biosciences) was used for analysis.
Mass Spectrometric Sphingolipid Measurements
One ml of HepG2 and MCF-7 cell lysates (10 mg protein/ml), were prepared by adding 2 μl of 5 µg/ml IS stock solution. After tubes were vortexed, chloroform: methanol (1:2, v/v) was added, sonicated for 30 seconds and vortexed for 5 min with the addition of 100 μl of distilled water. The resulting mixture was kept at room temperature for 30 minutes and after incubation, it was centrifuged for 5 minutes at 2000 x g to obtain supernatants. 125 μl of chloroform and 125 μl of distilled water were added to the supernatants, vortexed and kept at room temperature for 30 minutes. After incubation, approximately 500 μl of the top-organic layer was transferred to a new glass tube and the volatilization process was carried out under a constant flow of nitrogen. The dried residues were dissolved in methanol:formic acid (100 µl; 99.9:0.1) and samples were transferred to insert vials and made ready for LC-MS/MS measurements. LC-MS/MS measurements were carried out as previously described [23].
Protein Measurements
Protein concentrations were measured at 595 nm using a modified Bradford assay with Pierce Bradford Plus Protein Assay Reagent (Thermo Fisher Scientific Cat.# 23238, Thermo Fisher, Waltham, MA USA) and bovine serum albumin as the standard.
Statistical Analysis
The data were analyzed using the GraphPad Prism 9.00 and SigmaPlot for Windows statistical program (Systat Software, Inc.) A p value <0.05 was accepted as statistically significant. The figure and table legends describe the statistical analysis for each measurement in detail. A normality test was performed prior to comparing the groups via the statistical analysis. When data were not normally distributed, we performed a nonparametric test.
Results
Cell Viability Analysis
Viability analysis following 24 hour 7-KSS treatment was performed in cancer cells and non-cancerous BJ fibroblasts (Figure 1). Treatment of MCF-7 cells with 5, 10, or 15 μM 7-KSS did not significantly affect cell viability over time. It was observed that 30 μM 7-KSS application significantly reduced cell viability in breast cancer cells by approximately 30% in 24 hours (Figure 1A). Incubation of liver cancer cells with 5-30 μM 7-KSS for 12-18 h did not significantly affect cell viability compared to control and DMSO groups (Figure 1B). HepG2 cell viability was reduced significantly by approximately 25% after 24 h, 30 μM 7-KSS treatment. It was determined that 5-30 μM 7-KSS administration in non-cancerous BJ fibroblast cell line did not significantly affect cell viability at 24 hours (Figure 1C).
Proliferating Cell Nuclear Antigen Levels
Figure 2A and Figure 3A shows PCNA immunofluorescence staining in MCF-7 and HepG2 cells incubated with 30 µM 7-KSS for 24 hours, respectively. Quantitation of PCNA fluorescence staining showed that PCNA protein was significantly suppressed in MCF-7 cells (Figure 2D) and HepG2 cells (Figure 3D) treated with 7-KSS compared to control and DMSO groups. ELISA analysis of PCNA protein levels in MCF-7 (Figure 2E) and HepG2 (Figure 3E) cells confirmed immunofluorescence staining and showed that the amount of PCNA protein was meaningly reduced in cancer cells incubated with 30 µM 7-KSS for 24 hours vs. control and DMSO groups.
Sphingolipid Levels
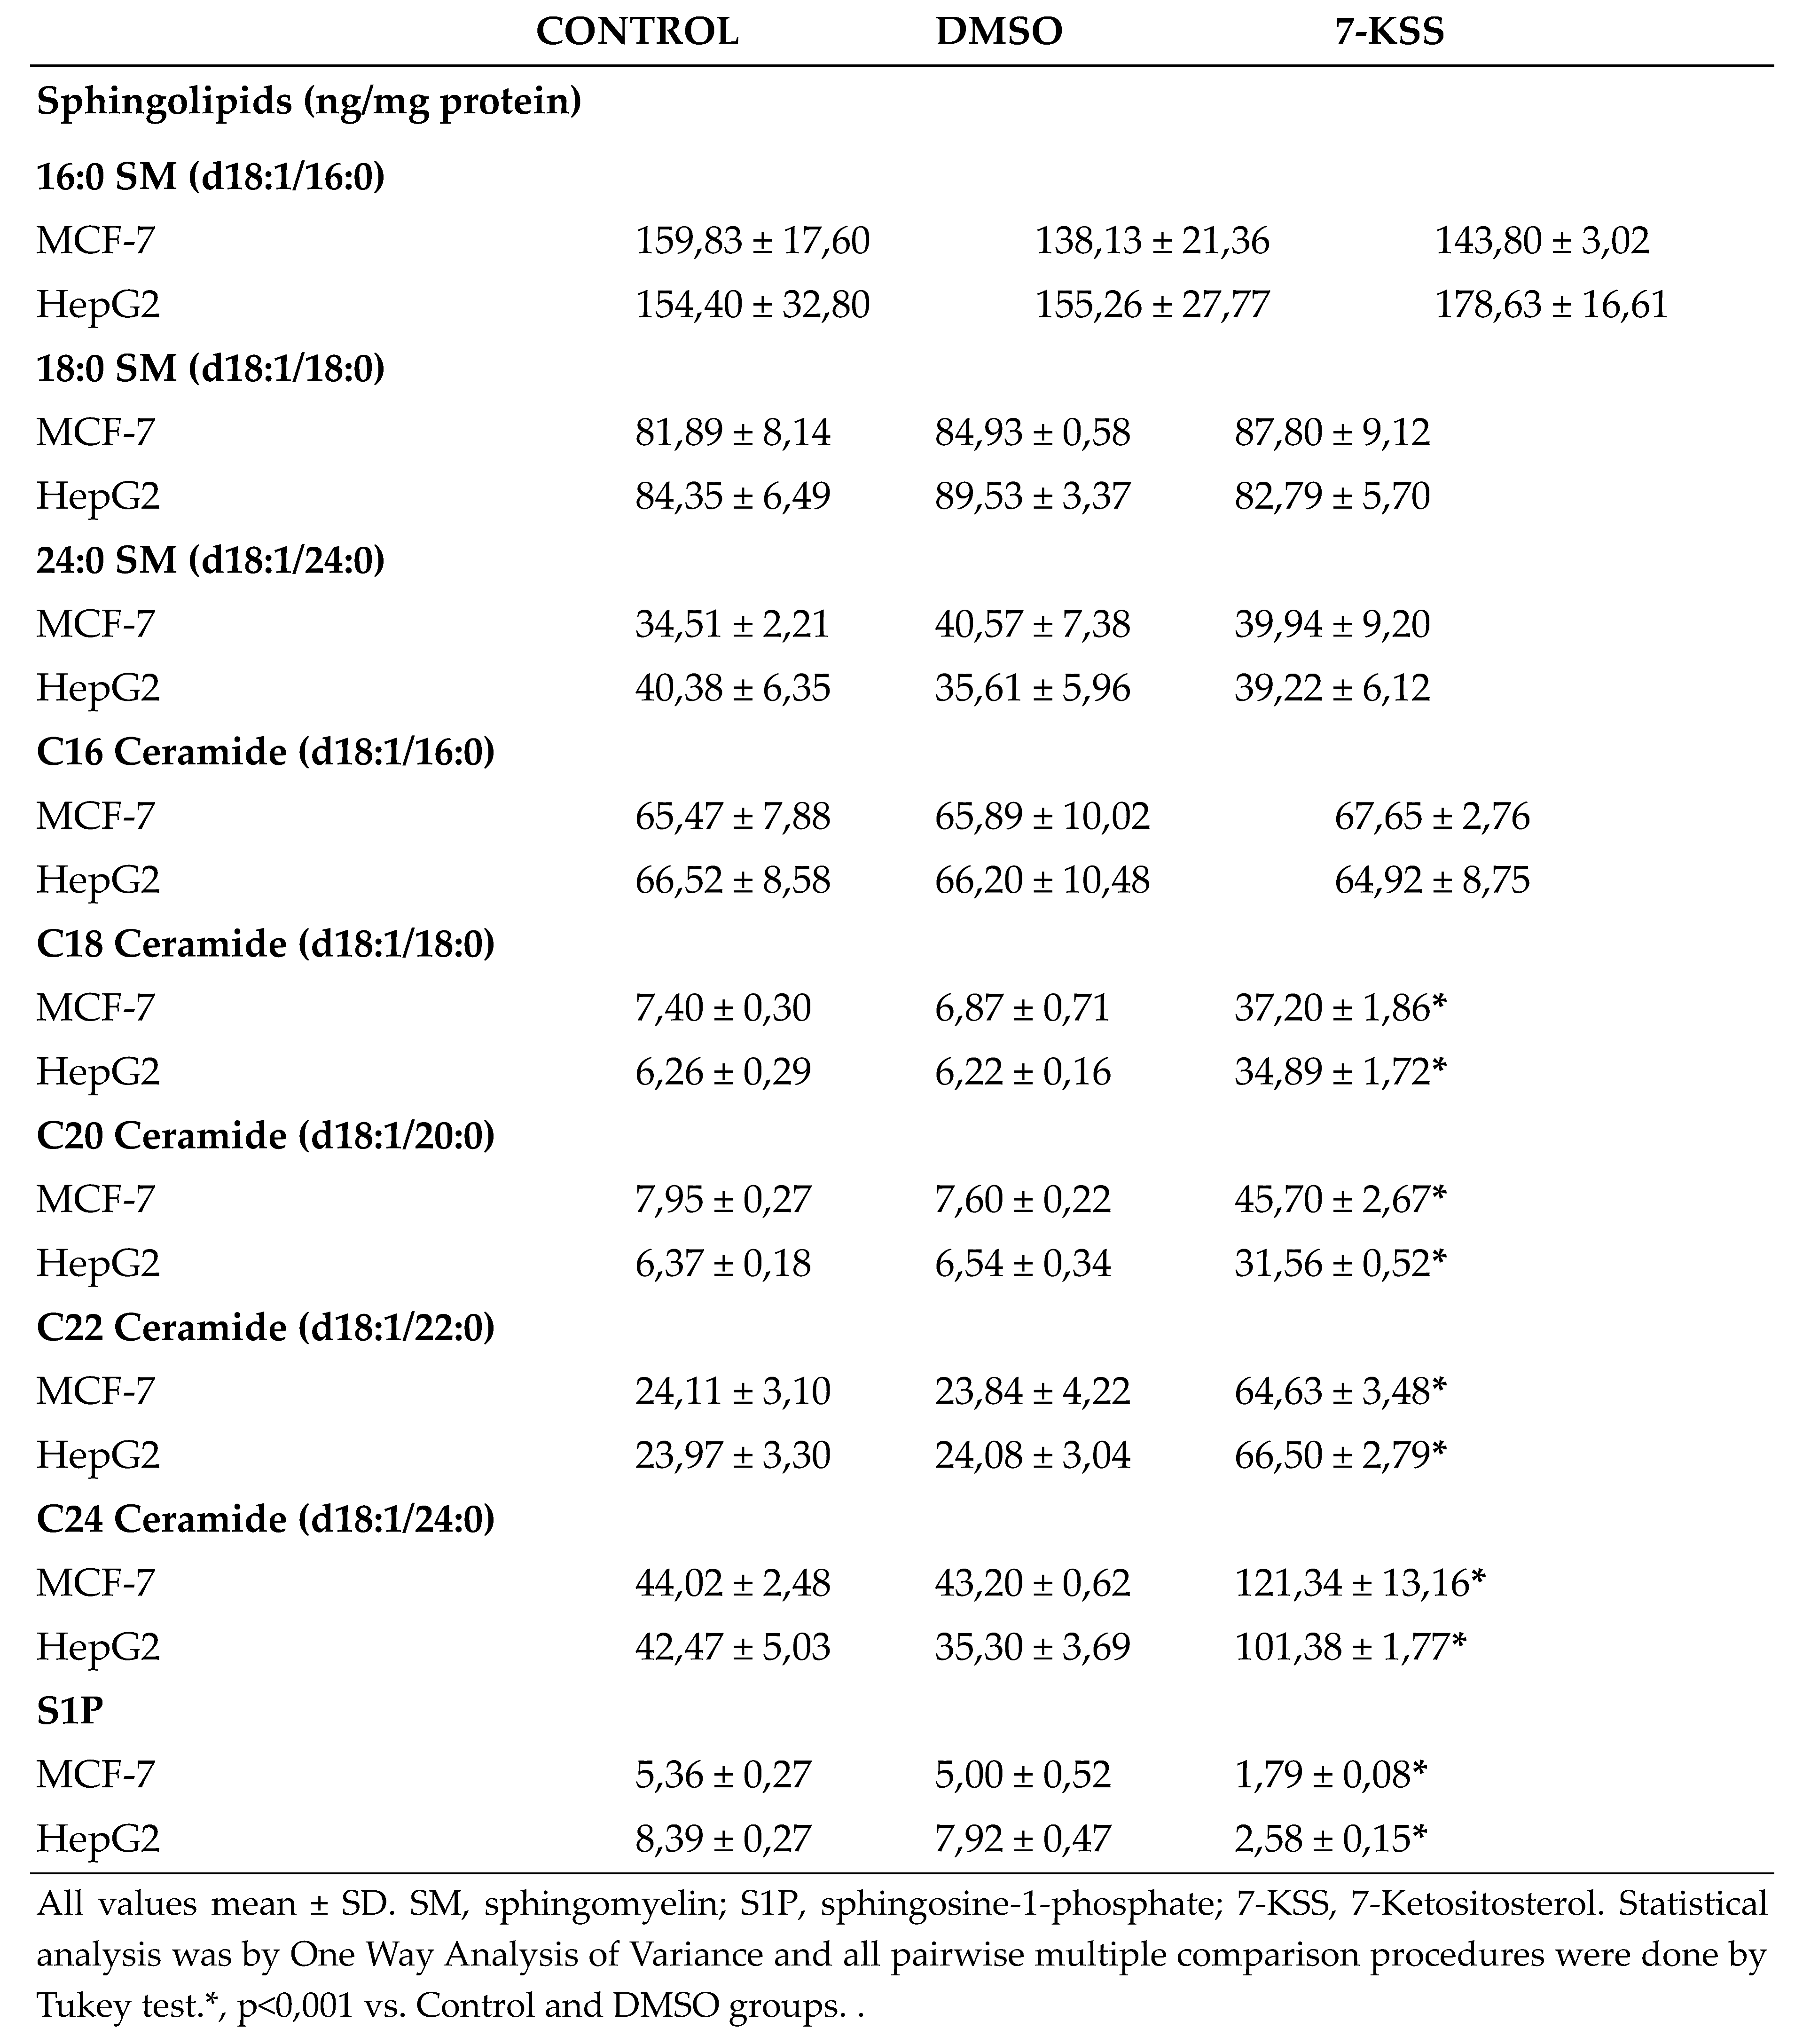
Sphingolipid levels measured in cancer cells are shown in Table 1. A meaningful rise was detected in endogenous C18-C24 CERs levels in MCF-7 and HepG2 cells treated with 30 µM 7-KSS for 24 hours, compared to control and DMSO groups. Incubation with 30 µM 7-KSS for 24 hours, considerably reduced S1P levels in cancer cells.
All values mean ± SD. SM, sphingomyelin; S1P, sphingosine-1-phosphate; 7-KSS, 7-Ketositosterol. Statistical analysis was by One Way Analysis of Variance and all pairwise multiple comparison procedures were done by Tukey test.*, p<0,001 vs. Control and DMSO groups. .
Phospo-ERK and Phospho-NFκB p65 Protein Levels
Figure 2A and Figure 3A shows immunofluorescent staining of p-ERK and p-NF-κB in MCF-7 and HepG2 cells treated with 30 µM 7-KSS for 24 hours, respectively. Quantitation of p-ERK and p-NF-κB fluorescence staining showed that the phosphorylated proteins were significantly suppressed in MCF-7 cells (Figure 2B,C) and HepG2 cells (Figure 3B,C) treated with 7-KSS compared to control and DMSO groups. Western blot analysis also confirmed immunofluorescence staining of p-ERK and p-NF-κB in cancer cells (Figure 4A). Significantly decreased p-ERK/Total ERK and p-NFκBp65/Total NFκBp65 ratio in both cancer cells agreed with immunofluorescence data (Figure 4B-E). ELISA analysis of p-ERK and p-NF-κB protein levels in MCF-7 (Figure 4F,H) and HepG2 (Figure 4G and I) cells confirmed immunofluorescence and western blot analysis and showed that phosphorylated proteins were significantly reduced in cancer cells incubated with 30 µM 7-KSS for 24 hours compared to the control and DMSO groups.
Apoptosis
TUNEL analysis showed a significant increase of apoptosis in cancer cells treated with 30 µM 7-KSS for 24 hours (Figure 5A). Quantitation of apoptosis via fluorescence staining showed a significant increase in apoptotic MCF-7 (Figure 5B) and HepG2 (Figure 5C) cells treated with 7-KSS compared to the control and DMSO groups. Figure 5D displays illustrative plots from HepG2 and MCF-7 cells. In individual squares, the left inferior corner displays living cells (annexin V negative/PI negative), the left higher corner displays early apoptotic cells (annexin V positive), right higher corner indicates necrotic-late apoptotic cells (annexin V positive/PI positive), and the right inferior corner (PI positive) characterizes necrotic cells. Annexin V is a protein that has a high affinity for phosphatidylserine (PS), a phospholipid normally found on the inner leaflet of the plasma membrane. During apoptosis, PS is translocated from the inner to the outer leaflet of the plasma membrane, exposing it to the extracellular environment. Annexin V can bind specifically to PS. PI is a fluorescent dye that attaches to DNA but is unable to penetrate live cells possessing intact membranes. Nonetheless, it can infiltrate cells with compromised membranes, like those in late apoptosis or necrosis. Consequently, employing both Annexin V and PI staining allows differentiation between live cells, early apoptotic, late apoptotic, and necrotic cells. The flow cytometric quantification of annexin V–FITC labelling in MCF-7 and HepG2 cells is presented in Figure 5E,F, respectively. Treatment with 7-KSS significantly increased the number of early and late apoptotic cells compared to the control.
Discussion
The findings of the current investigation revealed that treatment of MCF-7 and HepG2 cancer cells with 5-15 μM 7-KSS did not significantly alter cell viability over a 24 hour period. Cancer cell viability was reduced significantly after 24 hour 30 μM 7-KSS treatment. Our result is in accord with a study showing that the critical 7-KSS concentration to accomplish subtoxic injury in HepG2 cells at 24 h was 30 μM [8]. Another study treated U937 human lung lymphoblastic cells with beta-sitosterol oxides and reported that after 12 h, the survival of cells incubated with 120 µM beta-sitosterol oxides was decreased by approximately 50 % compared to control [24]. Providentially, in the situation of noncancerous cells, 7-KSS caused no toxic effect even at 30 μM, signifying negligeable cytotoxicity for normal tissues.
A meaningful rise was detected in intracellular quantities of C18-C24 ceramides in HepG2 and MCF-7 cells incubated with cytotoxic amounts of 7-KSS for 24 h, relative to controls. This is the first study evaluating the effect of 7-KSS on endogenous sphingolipid levels in breast and liver cancer cells. Our findings agree with an earlier report indicating that beta-sitosterol action boosted ceramide amounts in HT-29 colon cancer cells [25]. Likewise, 16 µM beta-sitosterol was administered to LNCaP human prostate cancer cells and it was reported to cause apoptosis which was in adjunct to a significant increase in ceramide production [26]. Investigators also studied the outcome of nutritional β-sitosterol on cell growth and ceramide levels in MCF-7 and MDA-MB-231 human breast cancer cells. The findings showed that beta-sitosterol activated de novo synthesis of ceramide by increasing serine palmitoyl transferase activity [27]. We also detected that treatment with 30 µM 7-KSS for 24 hours, considerably reduced S1P levels in cancer cells. To the best of our knowledge, this study is the first to report reduced S1P levels in cancer cells treated with 7-KSS. Functional sphingolipid metabolites such as ceramide and S1P have vital functions in the action of numerous biological pathways that are central to cancer pathogenesis. Current knowledge on biologically active sphingolipid synthesis recognizes their vital roles in both cancer development and advancement. Ceramide, a key component in sphingolipid metabolism, acts as a tumor-suppressing molecule, triggering anti-proliferative and apoptotic reactions in numerous cancerous cells [28]. On the contrary, S1P brings on reactions that make it a cancer supporting lipid.
We have seen that phosphorylated 44/42 ERK1/2 and phosphorylated NF-kB p65 (Ser536) proteins were significantly suppressed in cancer cells treated with 7-KSS compared to the control groups. To the best of our knowledge, this is the first study reporting that 7-KSS down regulates phosphorylation of ERK1/2 and NFκB in cancer cells. It is however known that 7-alpha-OH-beta-sitosterol, an uncommon biological phytosterol oxide, caused decreased cell viability in MCF-7 cells by means of apoptosis through down regulation of the ERK1/2 signaling pathway [29]. Fucosterol, a phytosterol commonly obtained from marine algae and numerous plant types, was also found to inhibit the expression of phosphorylated ERK1/2 with no evident consequences on the expression on ERK1/2 [30]. Phospho-44/42 ERK1/2, also known as phosphorylated extracellular signal-regulated kinases 1 and 2, are crucial components of the MAPK signaling pathway [31]. Aberrant phosphorylation of ERK1/2 is pointed to pathogenesis of tumor development and growth; thus, ERK1/2 has been identified as a potential therapeutic target for cancer [31]. This pathway plays a fundamental role in regulating various cellular processes including cell proliferation, differentiation, survival, and apoptosis. ERK1/2 phosphorylation is closely associated with cell proliferation and growth [32]. Phosphorylated ERK1/2 signaling is also implicated in the process of cellular differentiation [32]. ERK1/2 phosphorylation can promote cell survival by inhibiting apoptosis in cancer cells [33].
Different phytosterols have been described for their antitumor actions by preventing NF-κB activation and decreasing inflammatory cytokines and chemokines focusing on NF-κB signaling [16]. NF-κB p65, a transcription factor, possesses signals for nuclear localization, regions for binding to DNA, and two activation domains known as TA1 and TA2. The TA1 region, containing a C-terminal of 30 amino acids, serves as a pivotal transactivation domain. NF-κB transactivation relies on multiple phosphorylation events within this domain. One such crucial phosphorylation site, Ser536, located within TA1, remains conserved across various species. Phosphorylation of p65 enhances its transcriptional activity. [34]. Beta-sitosterol was also shown to downregulate phospho-NF-kB p-65 levels, while having no influence on the total level of NF-kB p-65 in pancreatic cancer cells [35].
As discussed, an important mechanism for the anticancer effects of phytosterols include stimulation of ceramide formation and induction of apoptosis. TUNEL analysis as well as annexin V–FITC/PI- staining showed a significant increase of apoptosis in cancer cells incubated with 30 µM 7-KSS for 24 hours. Our data support pervious findings reporting that 7-KSS increased early apoptosis in human intestinal carcinoma cells [36], HepG2 cells [10] and human leukemic U937 cells [37].
In summary, 7-KSS application significantly reduced cell viability, suppressed proliferating cell nuclear antigen, S1P, p-ERK and p-NFκB p65 protein levels while increasing ceramide amounts and apoptotic cell numbers in cancer cells. Increased ceramide concentrations, reduced S1P, decreased phospho-44/42 ERK1/2, and lowered phospho-NF-κBp65 levels contribute to decreased proliferation in cancer cells treated with 7-KSS, potentially facilitating apoptosis.
Data availability:
Data obtained and analyzed in the work are available from the corresponding author on reasonable request.
Conflicts of Interest:
The authors declare no conflicts of interest.
Author Contributions
Z. B.; Conceptualization, supervision, project administration, funding acquisition, review & editing. M. A; Conceptualization, supervision, project administration, funding acquisition, writing – review & editing. B.Ç., T. Ç. and, Ç. Y.; Methodology, software, validation, formal analysis, and investigation.
Funding
This work was supported by grants from Akdeniz University Research Foundation BAPSIS (grant number: TSA-2023-6282).
Abbreviations
7-KSS, 7-ketositosterol; AP1, activated protein 1; CERs, ceramides; CTCF, validated total cell fluorescence; ERK, extracellular signal-regulated kinases; MAPK, mitogen-activated protein kinases; NF-κB, nuclear factor kappa B; PCNA, proliferating cell nuclear antigen; PI, propidium iodide; POPs, phytosterol oxidation products; S1P, sphingosine-1-phosphate; SMs, sphingomyelins; TLR4, toll-like receptor 4; UV, ultraviolet.
References
- Jefrei, E.; Xu, M.; Moore, J.B.; Thorne, J.L. Phytosterol and phytostanol-mediated epigenetic changes in cancer and other non-communicable diseases: a systematic review. Br. J. Nutr. 2024, 131, 1–9. [Google Scholar] [CrossRef]
- Ramprasath, V.R.; Awad, A.B. Role of Phytosterols in Cancer Prevention and Treatment. J. AOAC Int. 2015, 98, 735–738. [Google Scholar] [CrossRef]
- Plat, J.; Brzezinka, H.; Lütjohann, D.; Mensink, R.P.; von Bergmann, K. Oxidized plant sterols in human serum and lipid infusions as measured by combined gas-liquid chromatography-mass spectrometry. J. Lipid Res. 2001, 42, 2030–2038. [Google Scholar] [CrossRef]
- El Omari, N.; Bakrim, S.; Khalid, A.; Abdalla, A.N.; Iesa, M.A.M.; El Kadri, K.; Tang, S.Y.; Goh, B.H.; Bouyahya, A. Unveiling the molecular mechanisms: dietary phytosterols as guardians against cardiovascular diseases. Nat. Prod. Bioprospecting 2024, 14, 27. [Google Scholar] [CrossRef]
- Khan, Z.; Nath, N.; Rauf, A.; Bin Emran, T.; Mitra, S.; Islam, F.; Chandran, D.; Barua, J.; Khandaker, M.U.; Idris, A.M.; et al. Multifunctional roles and pharmacological potential of β-sitosterol: Emerging evidence toward clinical applications. Chem. Interactions 2022, 365, 110117. [Google Scholar] [CrossRef]
- Salehi, B.; Quispe, C.; Sharifi-Rad, J.; Cruz-Martins, N.; Nigam, M.; Mishra, A.P.; Konovalov, D.A.; Orobinskaya, V.; Abu-Reidah, I.M.; Zam, W.; et al. Phytosterols: From Preclinical Evidence to Potential Clinical Applications. Front. Pharmacol. 2021, 11, 599959. [Google Scholar] [CrossRef]
- Poli, A.; Marangoni, F.; Corsini, A.; Manzato, E.; Marrocco, W.; Martini, D.; Medea, G.; Visioli, F. Phytosterols, Cholesterol Control, and Cardiovascular Disease. Nutrients 2021, 13, 2810. [Google Scholar] [CrossRef]
- Woyengo, T.A.; Ramprasath, V.R.; Jones, P.J.H. Anticancer effects of phytosterols. Eur. J. Clin. Nutr. 2009, 63, 813–820. [Google Scholar] [CrossRef]
- García-Llatas, G.; Rodríguez-Estrada, M.T. Current and new insights on phytosterol oxides in plant sterol-enriched food. Chem. Phys. Lipids 2011, 164, 607–624. [Google Scholar] [CrossRef]
- Koschutnig, K.; Heikkinen, S.; Kemmo, S.; Lampi, A.-M.; Piironen, V.; Wagner, K.-H. Cytotoxic and apoptotic effects of single and mixed oxides of β-sitosterol on HepG2-cells. Toxicol. Vitr. 2009, 23, 755–762. [Google Scholar] [CrossRef]
- Kenny, O.; O’callaghan, Y.; O’connell, N.M.; McCarthy, F.O.; Maguire, A.R.; O’brien, N.M. Oxidized Derivatives of Dihydrobrassicasterol: Cytotoxic and Apoptotic Potential in U937 and HepG2 Cells. J. Agric. Food Chem. 2012, 60, 5952–5961. [Google Scholar] [CrossRef]
- Conchillo, A.; Cercaci, L.; Ansorena, D.; Rodriguez-Estrada, M.T.; Lercker, G.; Astiasarán, I. Levels of Phytosterol Oxides in Enriched and Nonenriched Spreads: Application of a Thin-Layer Chromatography−Gas Chromatography Methodology. J. Agric. Food Chem. 2005, 53, 7844–7850. [Google Scholar] [CrossRef]
- Bradford, P.G.; Awad, A.B. Modulation of signal transduction in cancer cells by phytosterols. BioFactors 2010, 36, 241–247. [Google Scholar] [CrossRef]
- Shi, M.; Tang, C.; Wu, J.-X.; Ji, B.-W.; Gong, B.-M.; Wu, X.-H.; Wang, X. Mass Spectrometry Detects Sphingolipid Metabolites for Discovery of New Strategy for Cancer Therapy from the Aspect of Programmed Cell Death. Metabolites 2023, 13, 867. [Google Scholar] [CrossRef]
- Guo, Y.J.; Pan, W.W.; Liu, S.B.; Shen, Z.F.; Xu, Y.; Hu, L.L. ERK/MAPK signalling pathway and tumorigenesis. Exp. Ther. Med. 2020, 19, 1997–2007. [Google Scholar] [CrossRef]
- Khan, A.U.; Khan, A.; Shal, B.; Khan, S.; Khan, M.; Ahmad, R.; Riaz, M. The critical role of the phytosterols in modulating tumor microenvironment via multiple signaling: A comprehensive molecular approach. Phytotherapy Res. 2023, 37, 1606–1623. [Google Scholar] [CrossRef]
- Jarvis, W.D.; Fornari, F.A.; Auer, K.L.; Freemerman, A.J.; Szabo, E.; Birrer, M.J.; Johnson, C.R.; Barbour, S.E.; Dent, P.; Grant, S. Coordinate Regulation of Stress- and Mitogen-Activated Protein Kinases in the Apoptotic Actions of Ceramide and Sphingosine. Mol. Pharmacol. 1997, 52, 935–947. [Google Scholar] [CrossRef]
- Roy, A.; Srivastava, M.; Saqib, U.; Liu, D.; Faisal, S.M.; Sugathan, S.; Bishnoi, S.; Baig, M.S. Potential therapeutic targets for inflammation in toll-like receptor 4 (TLR4)-mediated signaling pathways. Int. Immunopharmacol. 2016, 40, 79–89. [Google Scholar] [CrossRef]
- Aggarwal, B.B. Nuclear factor-κB. Cancer Cell 2004, 6, 203–208. [Google Scholar] [CrossRef]
- Eskiler, G.G.; Özkan, A.D.; Kaleli, S.; Bilir, C. Inhibition of TLR4/TRIF/IRF3 Signaling Pathway by Curcumin in Breast Cancer Cells. J. Pharm. Pharm. Sci. 2019, 22, 281–291. [Google Scholar] [CrossRef]
- Hsiao, C.-C.; Chen, P.-H.; Cheng, C.-I.; Tsai, M.-S.; Chang, C.-Y.; Lu, S.-C.; Hsieh, M.-C.; Lin, Y.-C.; Lee, P.-H.; Kao, Y.-H. Toll-like receptor-4 is a target for suppression of proliferation and chemoresistance in HepG2 hepatoblastoma cells. Cancer Lett. 2015, 368, 144–152. [Google Scholar] [CrossRef]
- Aslan, M.; Afşar, E.; Kırımlıoglu, E.; Çeker, T.; Yılmaz. Antiproliferative Effects of Thymoquinone in MCF-7 Breast and HepG2 Liver Cancer Cells: Possible Role of Ceramide and ER Stress. Nutr. Cancer 2021, 73, 460–472. [Google Scholar] [CrossRef]
- Aslan, M. Polyunsaturated Fatty Acid and Sphingolipid Measurements by Tandem Mass Spectrometry. Mini-Reviews Org. Chem. 2021, 18, 3–10. [Google Scholar] [CrossRef]
- Maguire, L.; Konoplyannikov, M.; Ford, A.; Maguire, A.R.; O'Brien, N.M. Comparison of the cytotoxic effects of β-sitosterol oxides and a cholesterol oxide, 7β-hydroxycholesterol, in cultured mammalian cells. Br. J. Nutr. 2003, 90, 767–775. [Google Scholar] [CrossRef]
- Awad, A.B.; Von Holtz, R.L.; Cone, J.P.; Fink, C.S.; Chen, Y.C. beta-Sitosterol inhibits growth of HT-29 human colon cancer cells by activating the sphingomyelin cycle. . 1998, 18, 471–3. [Google Scholar]
- von Holtz, R.L.; Fink, C.S.; Awad, A.B. β-sitosterol activates the sphingomyelin cycle and induces apoptosis in LNCaP human prostate cancer cells. Nutr. Cancer 1998, 32, 8–12. [Google Scholar] [CrossRef]
- Awad, A.B.; Barta, S.L.; Fink, C.S.; Bradford, P.G. β-Sitosterol enhances tamoxifen effectiveness on breast cancer cells by affecting ceramide metabolism. Mol. Nutr. Food Res. 2008, 52, 419–426. [Google Scholar] [CrossRef]
- Ogretmen, B. Sphingolipid metabolism in cancer signalling and therapy. Nat. Rev. Cancer 2018, 18, 33–50. [Google Scholar] [CrossRef]
- Tasyriq, M.; Najmuldeen, I.A.; In, L.L.A.; Mohamad, K.; Awang, K.; Hasima, N. 7α-Hydroxy-β-Sitosterol fromChisocheton tomentosusInduces Apoptosis via Dysregulation of Cellular Bax/Bcl-2 Ratio and Cell Cycle Arrest by Downregulating ERK1/2 Activation. Evidence-Based Complement. Altern. Med. 2012, 2012, 1–12. [Google Scholar] [CrossRef]
- Mao, Z.; Shen, X.; Dong, P.; Liu, G.; Pan, S.; Sun, X.; Hu, H.; Pan, L.; Huang, J. Fucosterol exerts antiproliferative effects on human lung cancer cells by inducing apoptosis, cell cycle arrest and targeting of Raf/MEK/ERK signalling pathway. Phytomedicine 2018, 61, 152809. [Google Scholar] [CrossRef]
- Tkach, M.; Rosemblit, C.; A Rivas, M.; Proietti, C.J.; Flaqué, M.C.D.; Mercogliano, M.F.; Beguelin, W.; Maronna, E.; Guzmán, P.; Gercovich, F.G.; et al. p42/p44 MAPK-mediated Stat3Ser727 phosphorylation is required for progestin-induced full activation of Stat3 and breast cancer growth. Endocrine-Related Cancer 2013, 20, 197–212. [Google Scholar] [CrossRef]
- Mebratu, Y.; Tesfaigzi, Y. How ERK1/2 activation controls cell proliferation and cell death: Is subcellular localization the answer? Cell Cycle 2009, 8, 1168–1175. [Google Scholar] [CrossRef]
- Balmanno, K.; Cook, S.J. Tumour cell survival signalling by the ERK1/2 pathway. Cell Death Differ. 2009, 16, 368–377. [Google Scholar] [CrossRef]
- Viatour, P.; Merville, M.-P.; Bours, V.; Chariot, A. Phosphorylation of NF-κB and IκB proteins: implications in cancer and inflammation. Trends Biochem. Sci. 2005, 30, 43–52. [Google Scholar] [CrossRef]
- Cao, Z.-Q.; Wang, X.-X.; Lu, L.; Xu, J.-W.; Li, X.-B.; Zhang, G.-R.; Ma, Z.-J.; Shi, A.-C.; Wang, Y.; Song, Y.-J. β-Sitosterol and Gemcitabine Exhibit Synergistic Anti-pancreatic Cancer Activity by Modulating Apoptosis and Inhibiting Epithelial–Mesenchymal Transition by Deactivating Akt/GSK-3β Signaling. Front. Pharmacol. 2019, 9, 1525. [Google Scholar] [CrossRef]
- Gao, J.; Chen, S.; Zhang, L.; Cheng, B.; Xu, A.; Wu, L.; Zhang, X. Evaluation of Cytotoxic and Apoptotic Effects of Individual and Mixed 7-Ketophytosterol Oxides on Human Intestinal Carcinoma Cells. J. Agric. Food Chem. 2015, 63, 1035–1041. [Google Scholar] [CrossRef]
- Ryan, E.; Chopra, J.; McCarthy, F.; Maguire, A.R.; O'Brien, N.M. Qualitative and quantitative comparison of the cytotoxic and apoptotic potential of phytosterol oxidation products with their corresponding cholesterol oxidation products. Br. J. Nutr. 2005, 94, 443–451. [Google Scholar] [CrossRef]
Figure 1.
Analysis of 7-ketositosterol (7-KSS) toxicity in cancer cells and BJ fibroblasts. A) 24-hour viability analysis of 7-KSS administration in MCF-7 cells. Values mean ± SD (n=8). One-way ANOVA or Kruskal-Wallis analysis was performed for statistical testing. The difference among the groups was analyzed by Tukey or Dunn’s test. *, p <0.05, vs. control, DMSO and 5 μM 7-KSS groups over the same time periods. #, p <0.05 compared to 12 hours and 18 hours in the same dose interval. B) 24-hour viability analysis of 7-KSS administration in HepG2 cells. Values mean ± SD (n=8). One-way ANOVA or Kruskal-Wallis analysis was performed for statistical testing. The difference among the groups was analyzed by Tukey or Dunn's test. *, p <0.05, vs. control, DMSO, 5 μM 7-KSS, and 10 μM 7-KSS over the same time periods. #, p <0.05 compared to 12 and 18 hours in the same dose range. C) 24-hour viability analysis of 7-KSS administration in BJ fibroblast cells. Values mean ± SD (n=7-8). One-way ANOVA or Kruskal-Wallis analysis was performed for statistical testing. The difference among the groups was analyzed by Tukey or Dunn's test. #, p <0.05 vs. 18 hours at the same dose.
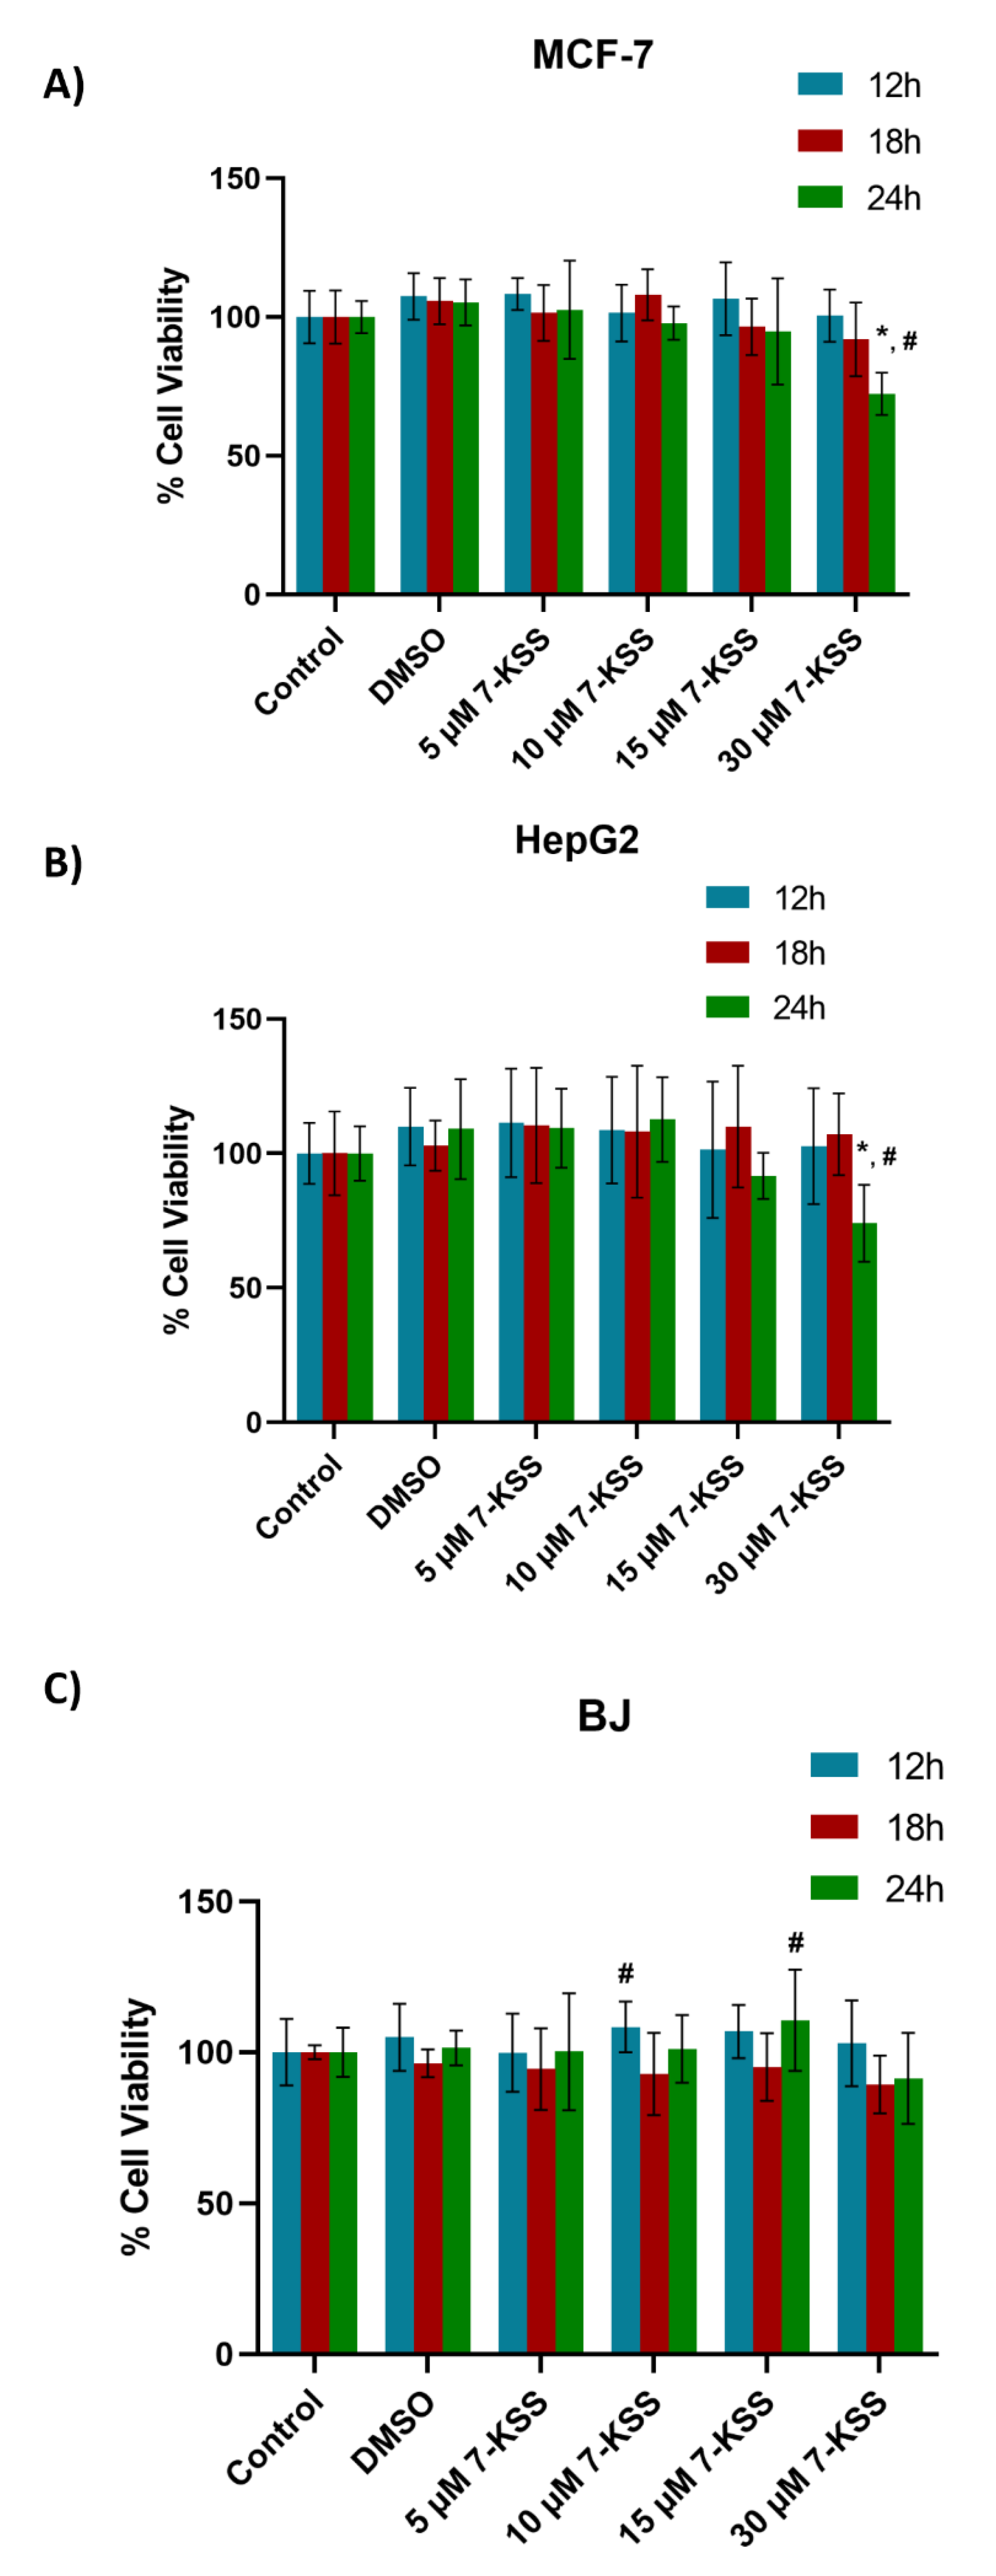
Figure 2.
A) Representative Immunofluorescent staining of p-ERK, p-NF-κB and PCNA in MCF-7 cells incubated with 30 µM 7-Ketositosterol (7-KSS) for 24h. B) Quantitation of p-ERK fluorescence staining by ImageJ software. Values mean ± SEM (n=10). Kruskal-Wallis test and Dunn’s multiple comparison analysis was performed to test statistical significance. *p < 0.05, vs. control and DMSO groups. C) Quantitation of p-NF-κB fluorescence staining. Values are given as mean ± SEM (n=10). One-way ANOVA test and Tukey’s multiple comparisons was used to determine statistical significance. *p < 0.05, compared to control and DMSO. D) PCNA staining quantitation. Values are given as mean ± SEM (n=10). One-way ANOVA test and Tukey’s multiple comparisons was used to determine statistical significance. *p < 0.05, compared to control and DMSO. E) PCNA levels in MCF-7 cells. Values mean ± SD (n=5). *, p<0.05, vs. control and DMSO groups.
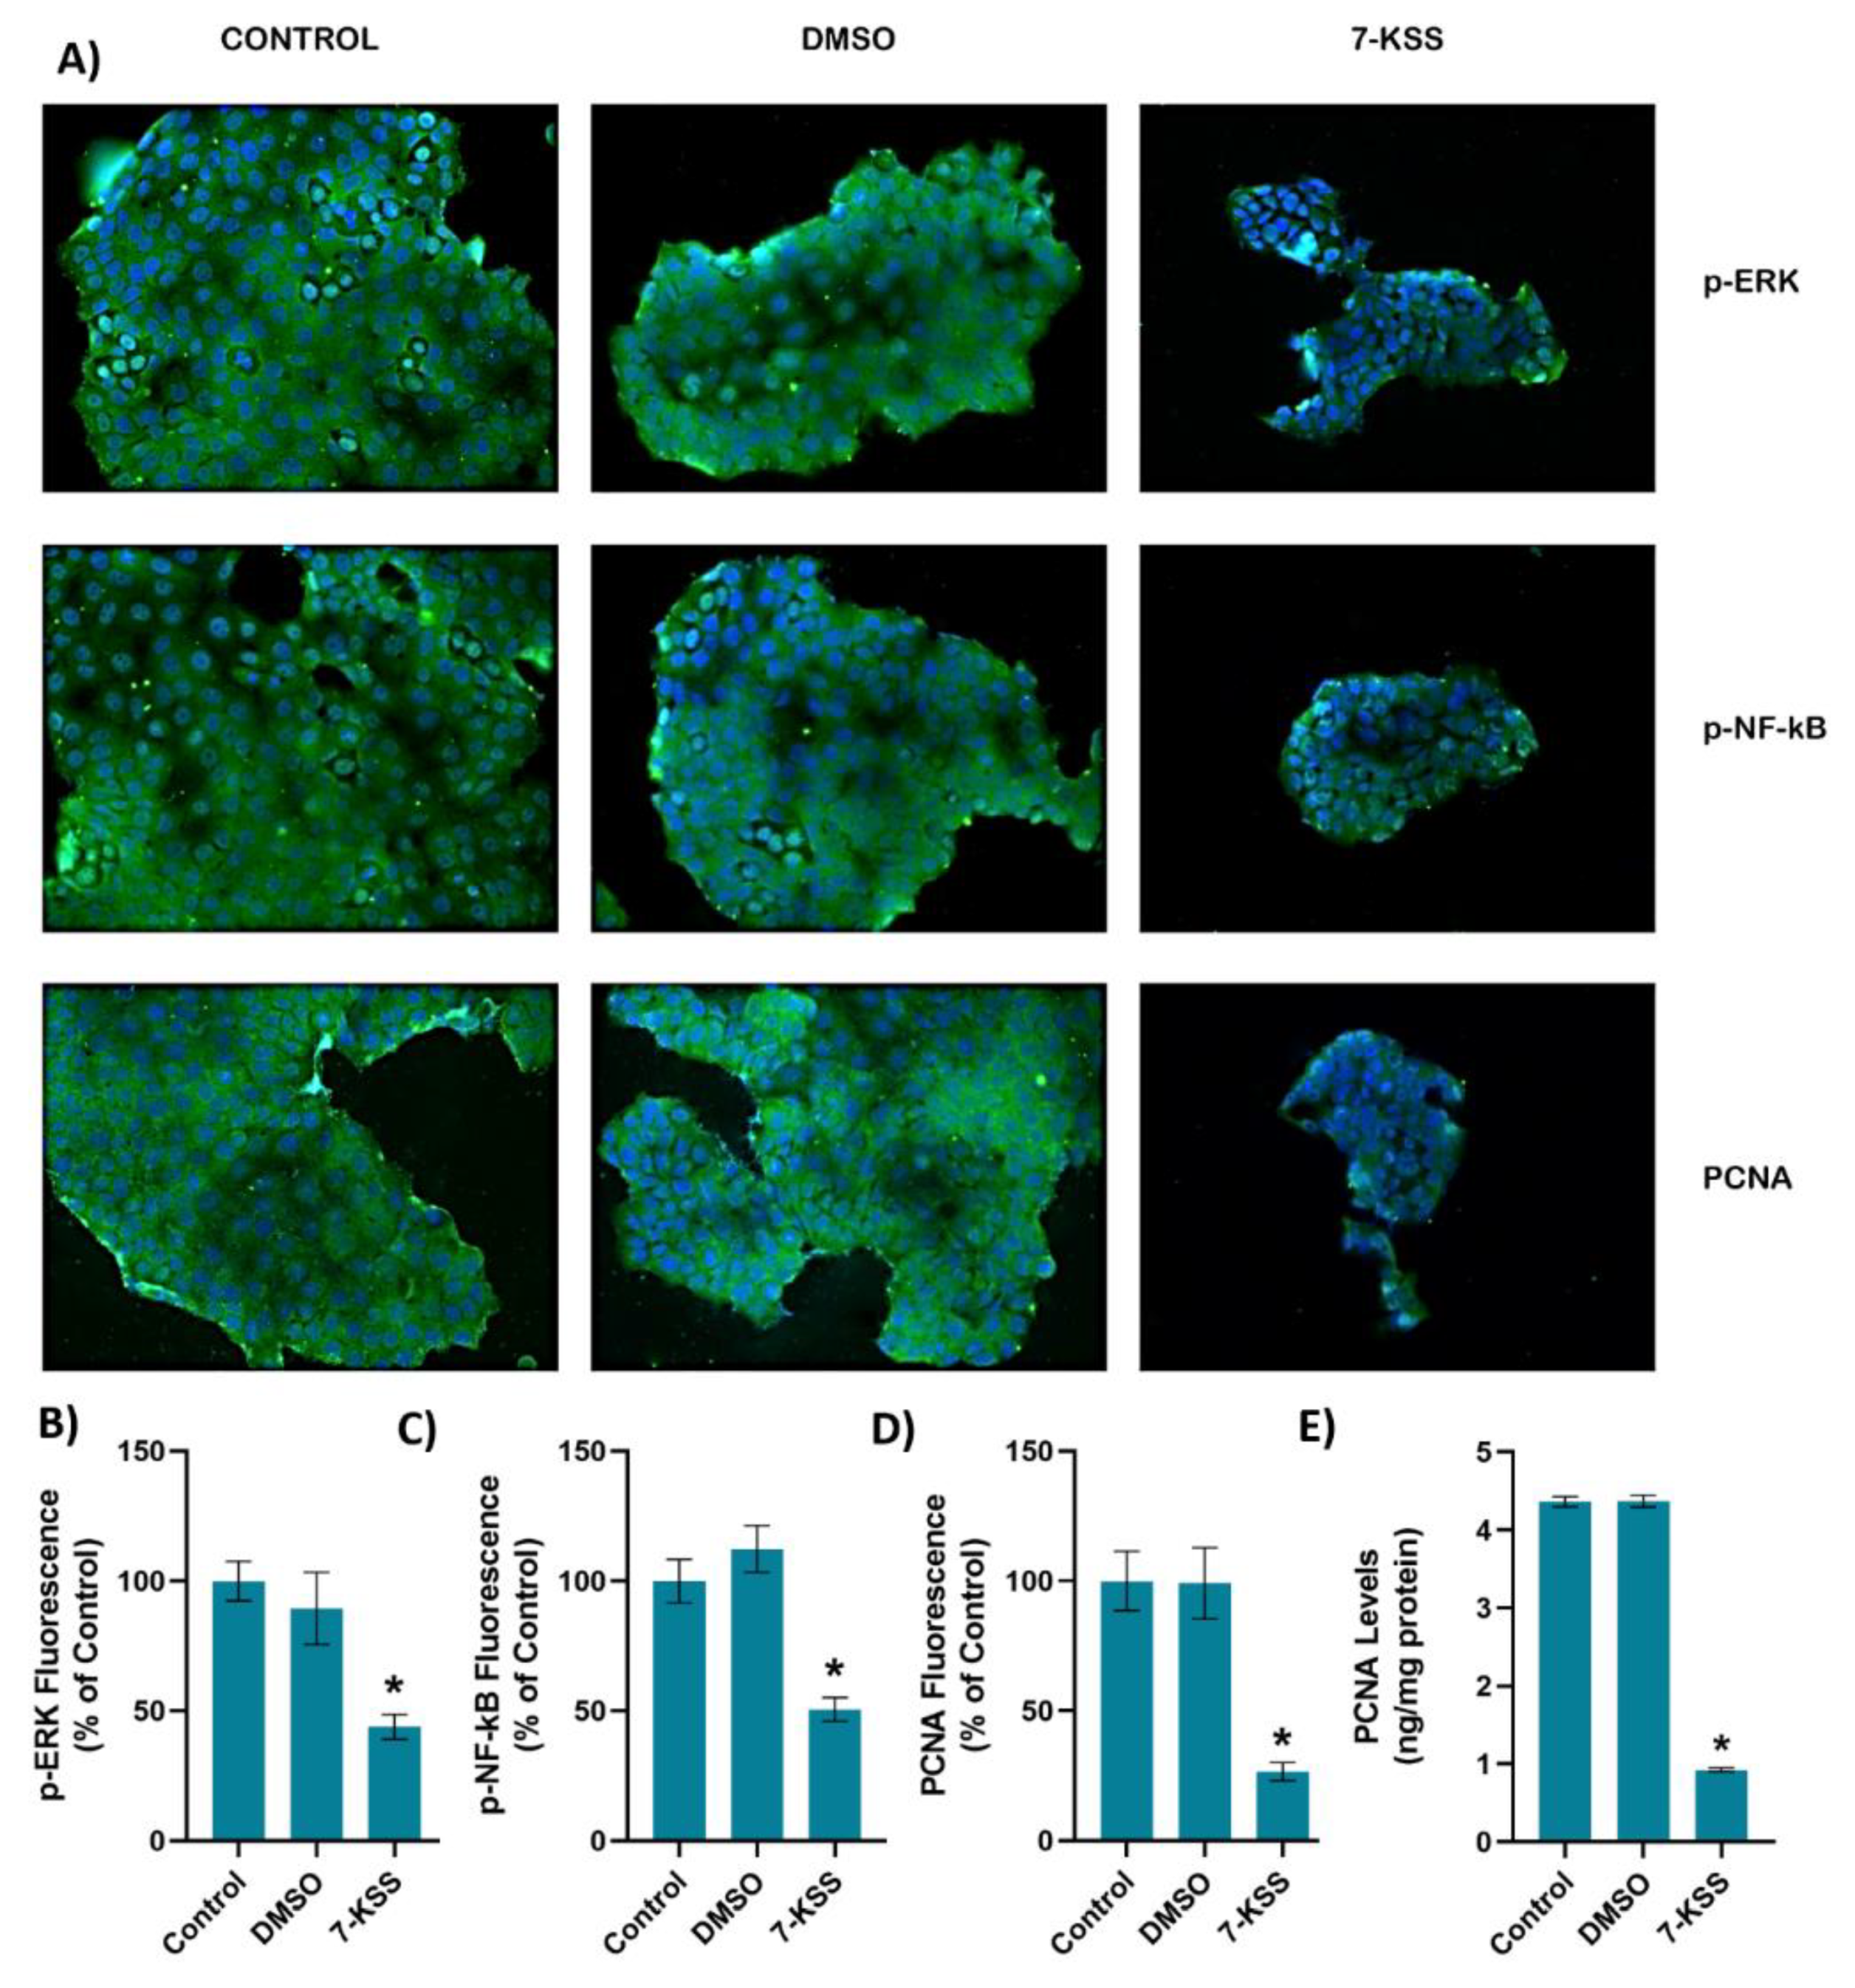
Figure 3.
A) Representative immunofluorescent staining of p-ERK, p-NF-κB and PCNA in HepG2 cells incubated with 30 µM 7-Ketositosterol (7-KSS) for 24h. B) Quantitation of p-ERK fluorescence staining by ImageJ software. Values mean ± SEM (n=10). Kruskal-Wallis test and Dunn’s multiple comparison analysis was performed to test statistical significance. *p < 0.05, vs. control group. C) Quantitation of p-NF-κB fluorescence staining. Values are given as mean ± SEM (n=10). One-way ANOVA test and Tukey’s multiple comparisons analysis was used for statistical analysis. *p < 0.05, compared to control and DMSO groups. D) Quantitation of PCNA fluorescence staining by ImageJ software. Values mean ± SEM (n=10). Kruskal-Wallis test and Dunn’s multiple comparison analysis was performed to test statistical significance. *p < 0.05, vs. control and DMSO groups. E) PCNA levels in HepG2 cell groups. Values mean ± SD (n=5). One-way ANOVA and Tukey multiple comparison test was performed for statistical analysis. *, p<0.05, vs. control and DMSO groups.
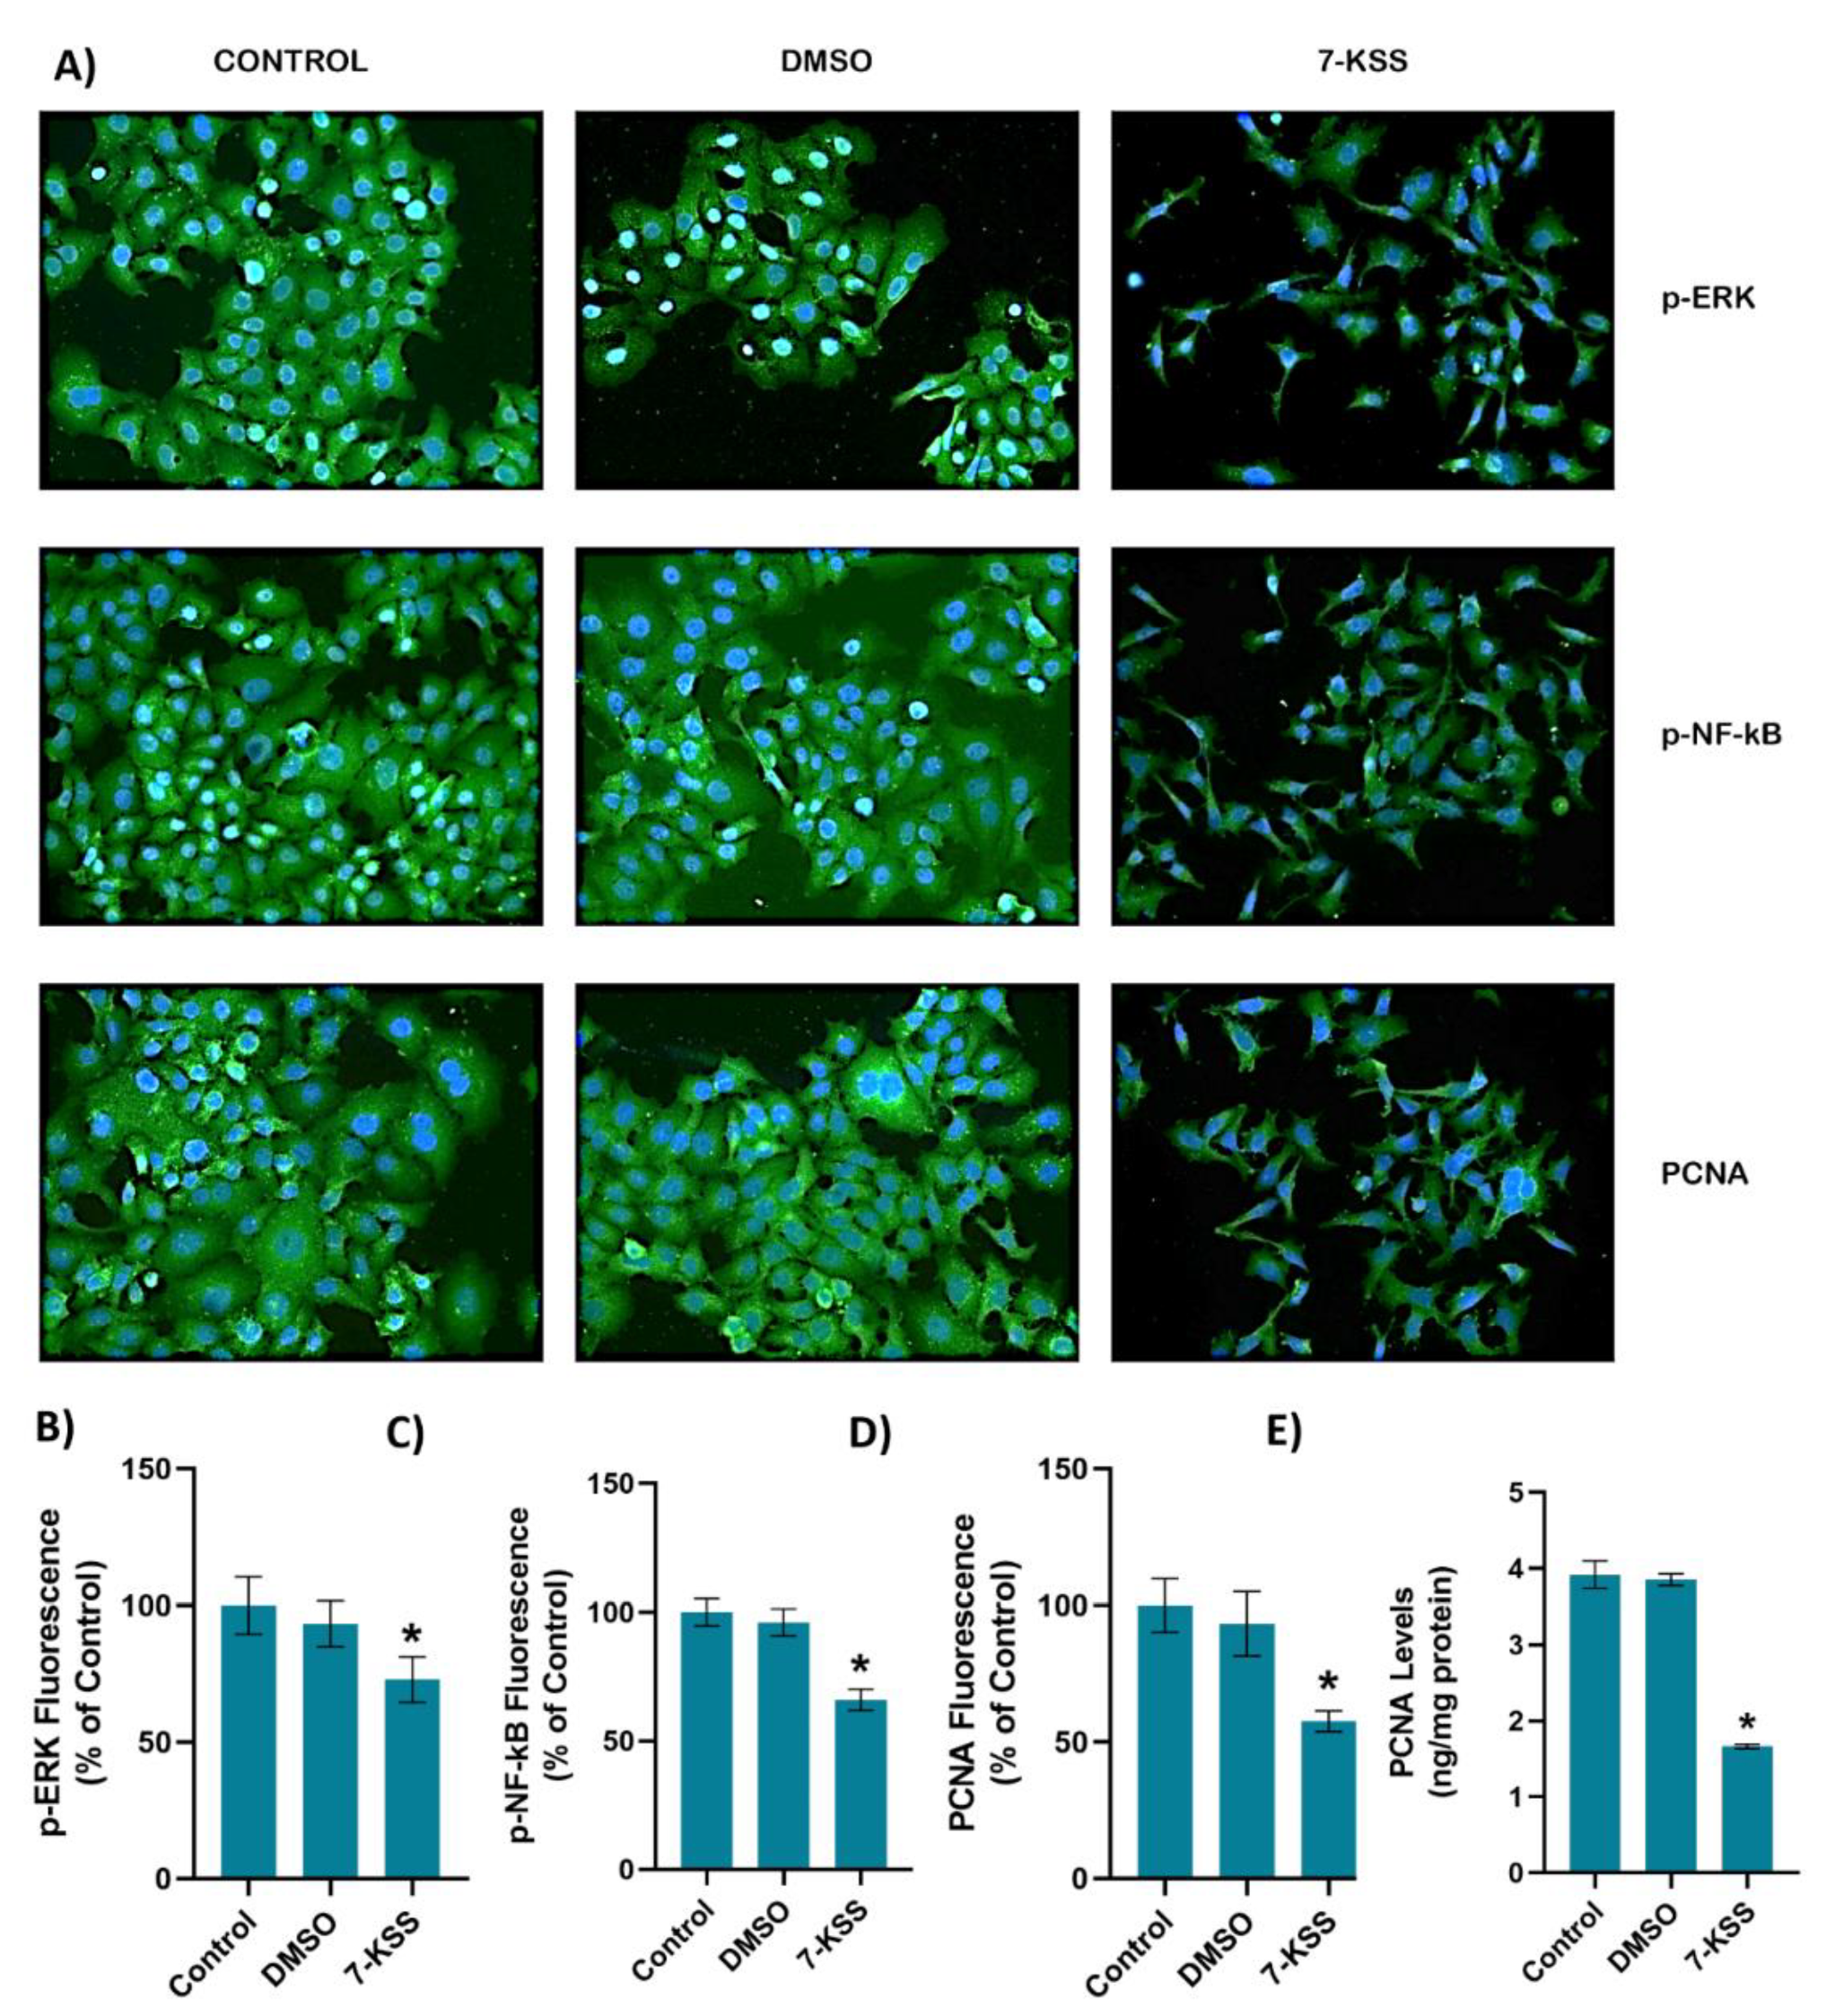
Figure 4.
A) Illustrative western immunoblots for phospho-44/42 ERK1/2 (T202/Y204), total ERK 1/2, phospho -NF-κB p65 (S536), total NF-κB p65 and β-Actin in MCF-7 and HepG2 cells. C, control; D, cells treated with 1 μl/ml dimethyl sulfoxide; 7-KSS, cell treated with 30 μM 7-KSS for 24 hours. B) The band quantitation ratio of phospho-ERK/Total ERK in MCF-7 and C) HepG2 cells. D) The band quantitation ratio of phospho-NFκBp65/Total NFκBp65 in MCF-7 and E) HepG2 cells. Blots were quantitated by ImageJ software. Data shown are representative of 3 separate experiments and values are given as mean ± SD. Statistical analysis was performed by one way ANOVA and all pairwise multiple comparison procedures done by Tukey test. *, p < 0.01 vs. control and DMSO groups. F) Phospho-ERK levels in MCF-7 cells. Values mean ± SD (n=5-8). One-way ANOVA and Tukey multiple comparisons were used to determine statistical significance. *, p<0.05, vs. control and DMSO groups. G) Phospho-ERK levels in HepG2 cells. Values mean ± SD (n=8). One-way ANOVA and Tukey multiple comparisons were performed for statistical analysis. *, p<0.05, when compared with the control and DMSO groups. H) Phospho-NFκBp65 levels in MCF-7 cells. Values mean ± SD (n=8). One-way ANOVA and Tukey multiple comparisons were performed to test statistical significance. *, p<0.05, when compared with the control and DMSO groups. I) Phospho-NFκBp65 levels in HepG2 cells. Values mean ± SD (n=8). One-way ANOVA and Tukey multiple comparisons were used to determine statistical significance. *, p<0.05, when compared with the control and DMSO groups.
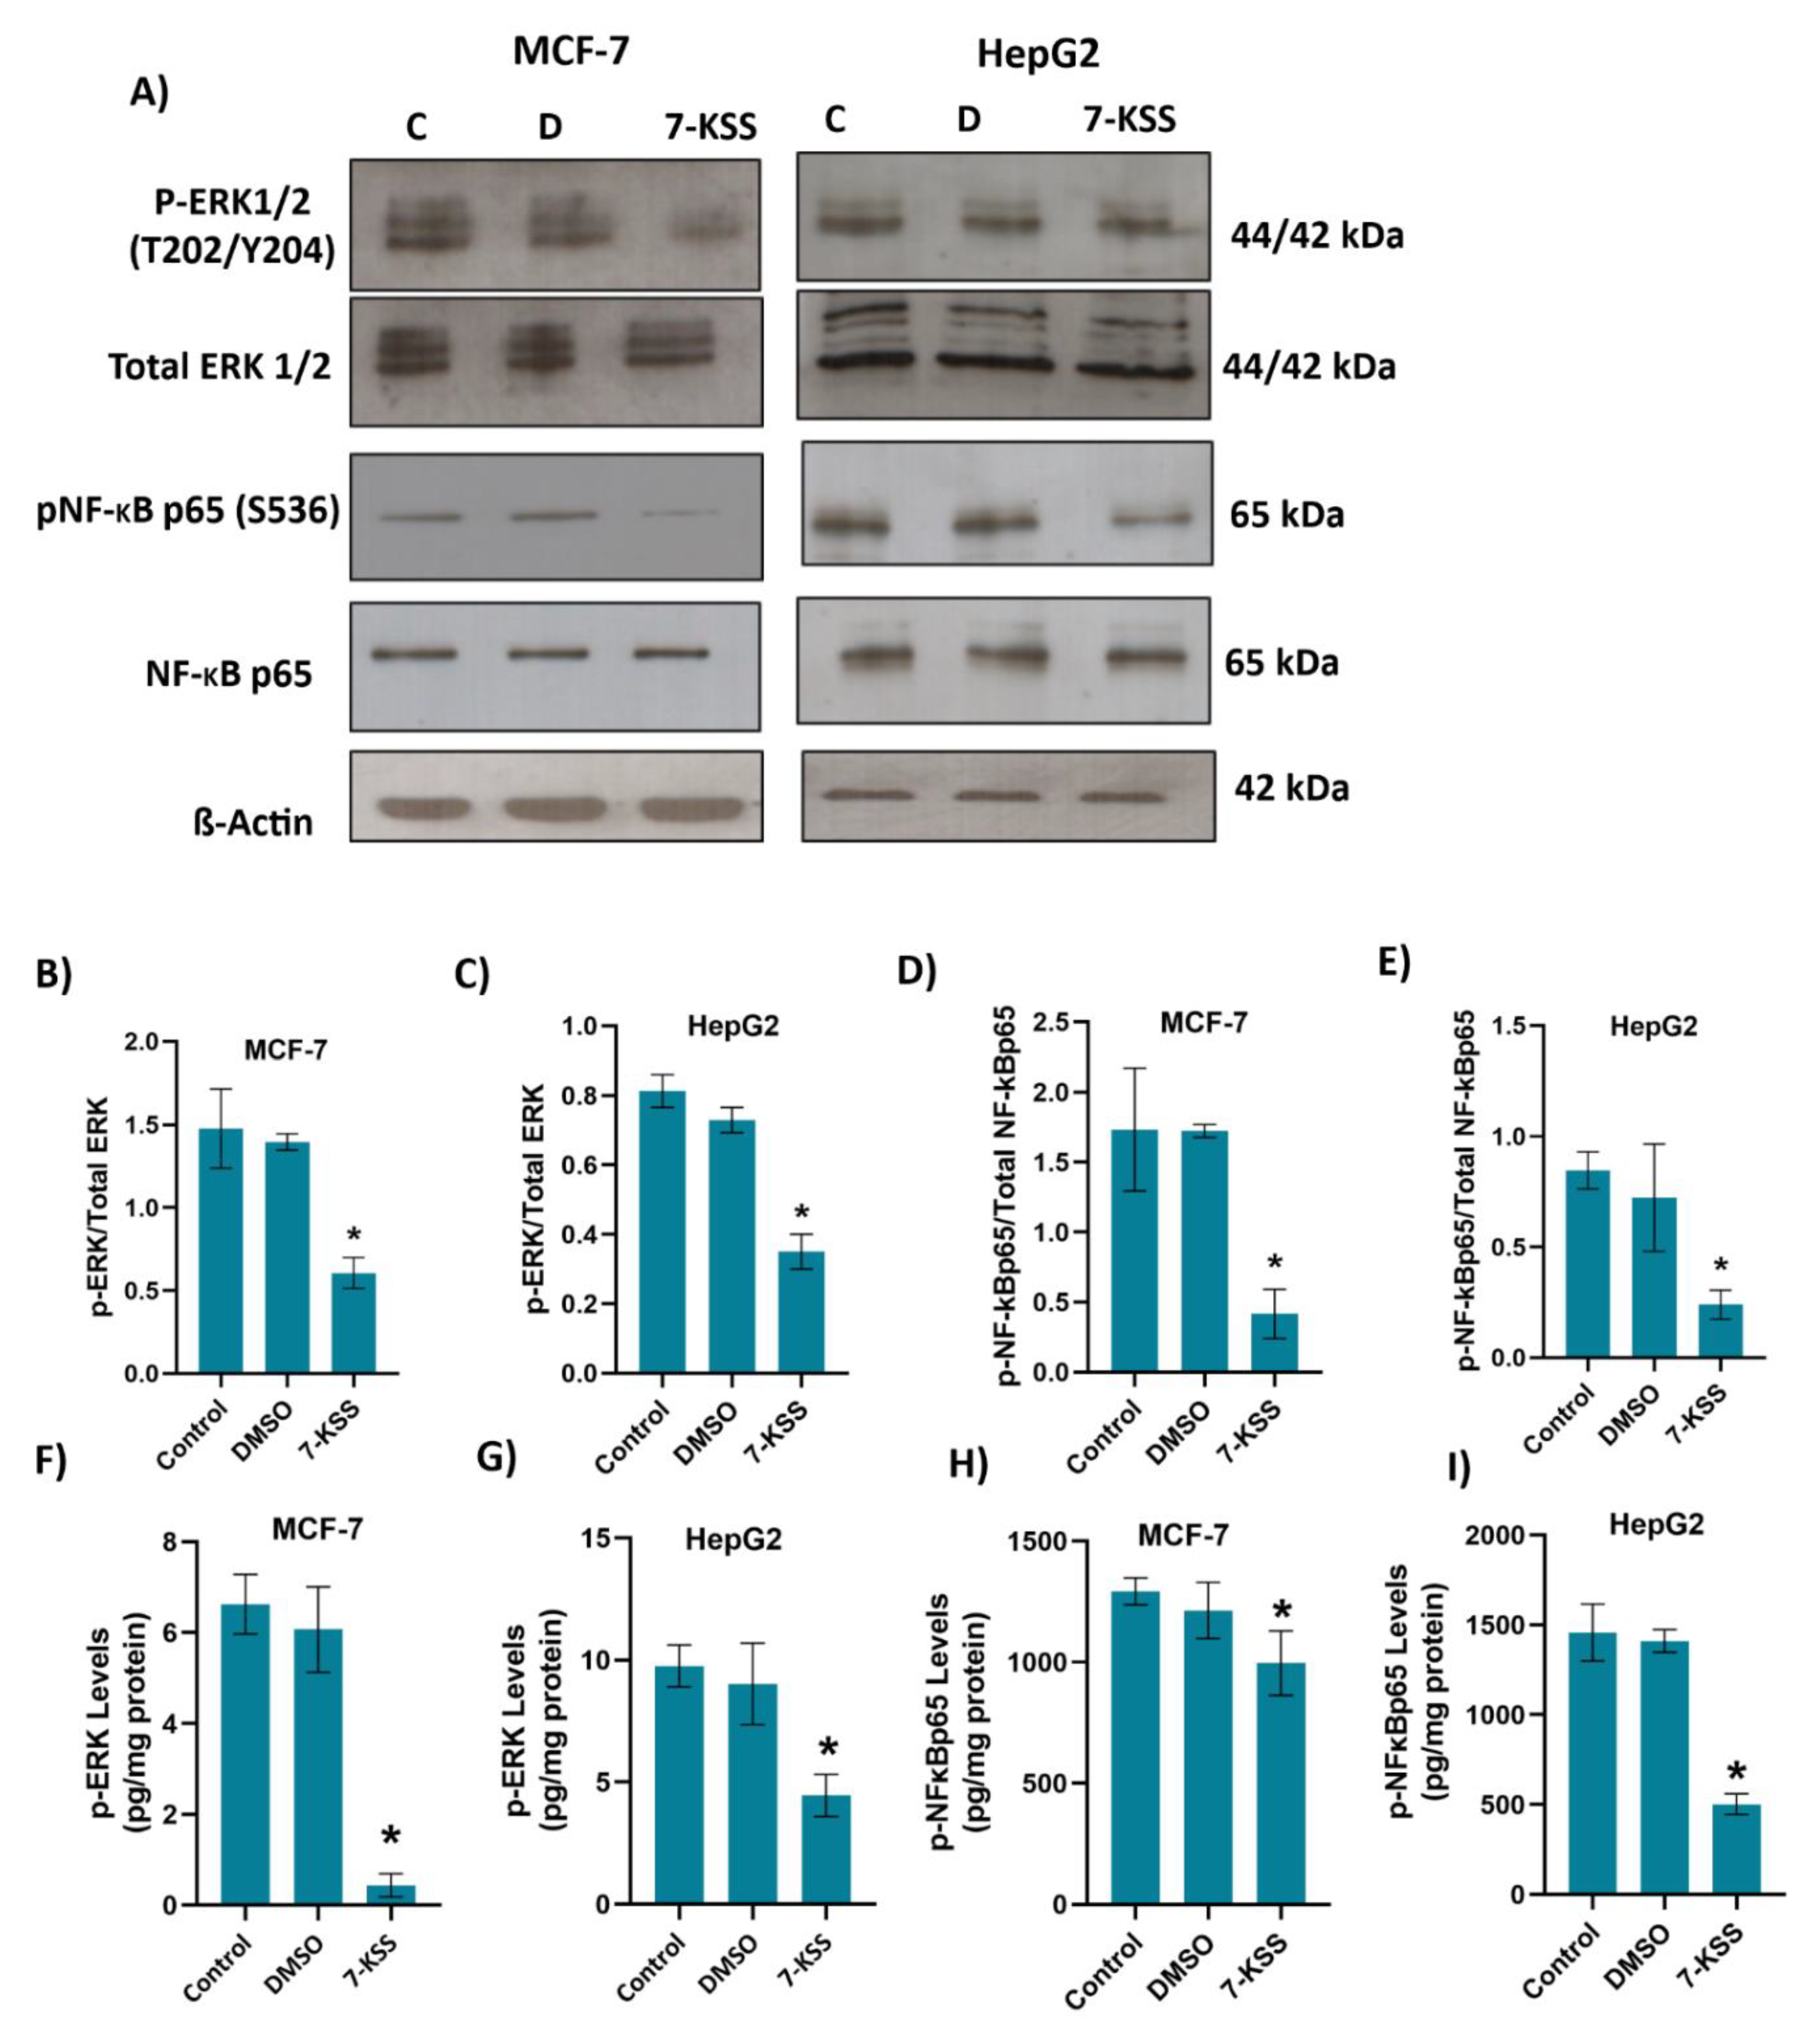
Figure 5.
TUNEL staining in cancer cells. A) Dimethyl sulfoxide (DMSO, 1 μL/mL) and 7-KSS (30 μM) were applied for 24 hours (200 X magnification). B) Quantitation of TUNEL staining in MCF-7 cells with the ImageJ program. Values mean ± SEM (n=7-8). Kruskal-Wallis test and Dunn's analysis were performed to test statistical significance. *, p<0.05, compared with the control and DMSO groups. C) Quantitation of TUNEL staining in HepG2 cells with ImageJ program. Values are mean ± SEM (n=8). One-way ANOVA and Tukey multiple comparisons were used to determine statistical significance. *, p<0.05, when compared with the control and DMSO groups. D) Annexin V–FITC and PI-labeled HepG2 and MCF-7 cells. 10,000 events were analyzed for each condition. E) Quantitative analysis of annexin-V and PI labeling in MCF-7 cells by flow cytometry. Values mean ± SD (n=3). One-way ANOVA analysis and Tukey test was used for statistical analysis. *, p<0.05, compared to control and DMSO groups. F) Quantitative analysis of annexin-V and PI labeling in HepG2 cells by flow cytometry. Values mean ± SD (n=3). One-way ANOVA analysis and Tukey test was used for statistical analysis. *, p<0.05, compared to control and DMSO groups.
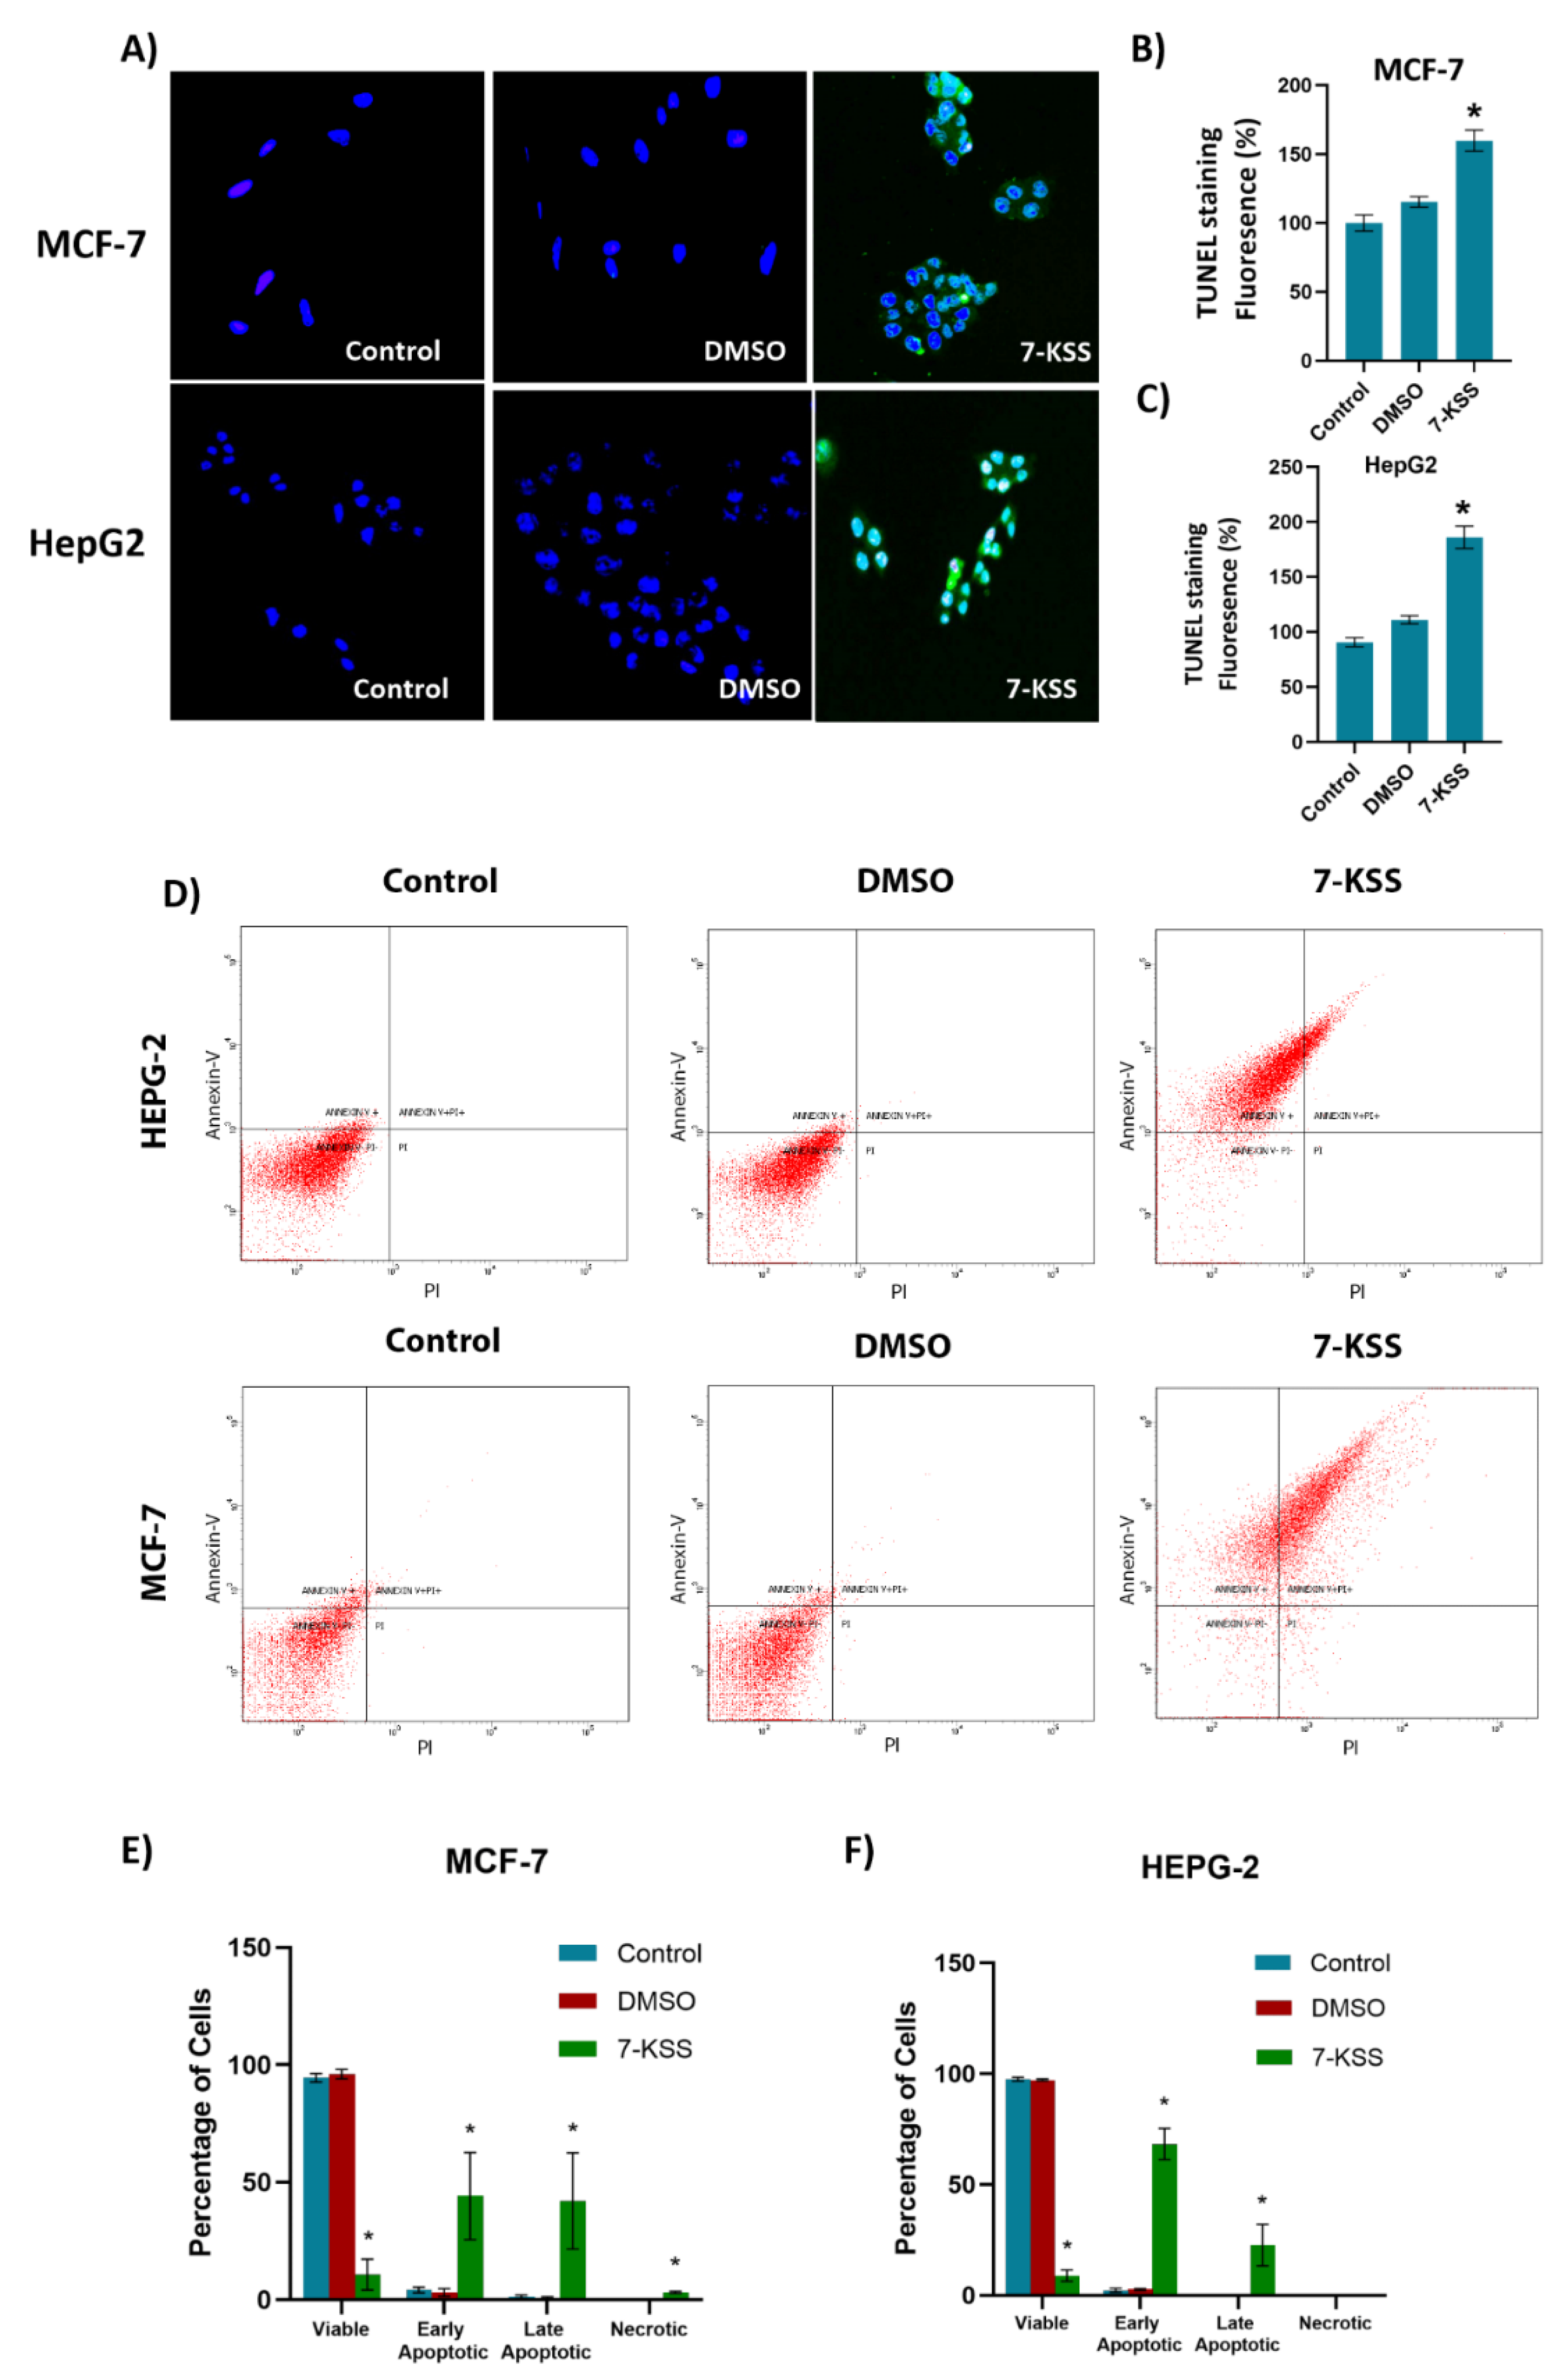

Table 1.
Sphingolipid levels in MCF-7 and HepG2 cells.
 |
Disclaimer/Publisher’s Note: The statements, opinions and data contained in all publications are solely those of the individual author(s) and contributor(s) and not of MDPI and/or the editor(s). MDPI and/or the editor(s) disclaim responsibility for any injury to people or property resulting from any ideas, methods, instructions or products referred to in the content. |
© 2024 by the authors. Licensee MDPI, Basel, Switzerland. This article is an open access article distributed under the terms and conditions of the Creative Commons Attribution (CC BY) license (http://creativecommons.org/licenses/by/4.0/).
Copyright: This open access article is published under a Creative Commons CC BY 4.0 license, which permit the free download, distribution, and reuse, provided that the author and preprint are cited in any reuse.


