

Submitted:
28 May 2024
Posted:
28 May 2024
You are already at the latest version
Abstract
Amazon tropical forest is actually subject to strong deforestation, generally originated from illegal logging, resulting in ecological, environmental and economic problems. Aiming stop deforestation and timber commercialization of illegal logging of tropical forest, new laws has been introduced in many countries. Here we investigated the utility of DNA fingerprinting of nuclear and cytoplasmatic SNPs to timber tracking the intensive logged and commercialized of the Amazonian Neotropical tree Jacaranda copaia. Samples of 832 individuals from 43 populations from Bolivia, Brazil, French Guiana, and Peru were used to investigate the power of 113 nuclear SNPs, 11 CpSNPs, and four MtSNP loci to determine the country and population origin. The genetic differentiation among all populations and contries was high (0.233–0.942), specialy for CpMtSNP (generally>0.6) loci, and there is a strong isolation by distance pathern among populations, favoring the group or individual samples tracking to correct site. For self-assignment tests, we were able to 100% correct determine country and population origin of all samples using all SNPs. Our results show that the use of 128 SNP markers is suitable to correct determination of country and population site of J. copaia timber origin and very useful tool for customs and local and international policies.
Keywords:
illegal logging
; forensics
; SNP markers
; timber tracking
; tropical trees
1. Introduction
Great part of trade timber harvest around the world from natural forest has illegal origin [1,2,3] and even the legal origin comes from unsustainable forest logging [4,5,6,7]. This is a fact, especially for tropical forests, as Amazon Forest, where greatest part world plant and animal biodiversity lives [8]. Both illegal and legal logging contributes to biodiversity loss, decreasing the human resources potential to find medicinal and future timber sources. The opening of roads and highways within the Amazon Forest is linked to the felling of trees and the export of illegally cut timber, as easy road access contributes to entering and leaving the forest, with about 95% of deforestation occurring up to 5,5 km of roads [9]. Illegal logging is also an economic problem for the legal market, as extremely low-priced wood competes with legal logging, where costs are higher [10,11].
Due to that, many international lows have been established in countries around de world to avoid illegal timber importations, as for example, the timber regulation of the US (Lacey Act), EU (No. 995/2010), and Australia (prohibition bill), which made it illegal to import timber and its derived products (furniture, musical instruments, etc) originated from illegal extraction [11]. These rules require that importing companies declare the country and specific place of origin, names of the species of all plants contained in their products and guarantee that these wood products have legal origin and have been extracted in a sustainable way and in accordance with the laws of the country of origin. In addition to legislation targeting illegal timber trade, the Convention on International Trade in Endangered Species- CITES [12,13] allows import only from natural sources and plantations of species listed in Appendix II. In Brazil, in 2022 the Normative Instruction (No. 8, of March 25, 2022) was implemented, which “Establishes the procedures for authorizing the export of wood products and by-products of native species of natural or planted forests, aiming to complement, relatively control the export of loads of native wood within the scope of the Brazilian Institute for the Environment and Renewable Natural Resources (IBAMA), Normative Instruction No. 21, of December 24, 2014, Normative Instruction No. 17, of December 1, 2021, and Ordinance No. 8, of January 3, 2022.” and an Ordinance (No. 8, of January 3, 2022, amended by Ordinance No. 46, of January 6, 2022), which “Establishes, within the scope of IBAMA, the Single Consent Platform of Brazil - Pau Brasil for use in foreign trade activities involving products and by-products of biodiversity”. Three lists are found in the country, according to Decree nº 3.607, of September 21, 2000, indicating the species that are already considered threatened with extinction, and those that appear in the second list, which includes species that are not currently threatened, but that are at serious risk unless trade traffic is strictly observed and laws and regulations are strictly followed. In the third annex are the species that the Brazilian agency itself has listed, so that there is greater care in the exploration, which is restricted or even blocked for better export control. For example, Jacaranda spp. are listed in the first annex [13], so its timber and derived products originated from legal and sustainable forest logging in natural forest can be exported.
The biggest problem about the illegality of the trade is in the documentation of the origin of the wood, having falsified certificates and documentation and with missing or false information [14]. According to the Brazilian Federal Police, in 2021, 90% of the wood extracted from the Amazon Forest had an illegal origin [15,16]. Such timber tracking methods are required, but methods based only on documentation are sensitive to manipulation and forgery. Therefore, exporting companies and institutions responsible for controlling the origin of imported timber, such as customs, federal police and Interpol need reliable tools to prove and confirm the declared origin of wood and its derivative products, traded internationally.
To timber tracking the species, country and specific site origin of imported timber, many methods have been tested, such as chemical analysis or mass spectrometry species timber differences [17,18,19,20], stable isotopes [21], near-infrared spectroscopy [22], wood anatomy [23,24], and DNA fingerprint [1,2,3,11,25,26,27,28,29,30,31,32,33]. Results of different methods have been shows strong potential for species determination, country and site origin, in special using DNA fingerprint [1,2,3,11,25,26,27,28,29,30,31,32,33]. Methods such as wood anatomical, isotopic, and spectrometric methods are limited to all species, country and site origin determination, due to variations in tissue type, individual sample age, individuals and population genetic differences or environmental influences on timber composition [31]. Thus, molecular methods that allow correct identification of tree species and tracking of timber origin are essential for controls on the legality of timber by public authorities, industry, and trading companies.
In the current work we investigated the use of the DNA fingerprint method to track the intensive and high value wood of the Neotropical pioneer tree Jacaranda copaia (Aubl.) D. Don. (Bignonaceae). The genus Jacaranda sp. present about 53 species, all Neotropicals, most of them are mainly found in the Cerrado around the Amazon Forest, where J. copaia is the only species of this genus widely distributed in the Amazon [34]. The species occurs from northern to western South America, from Belize to Bolivia, Brazil, French Guiana, and Peru [34]. In Brazil, the species is found in the states of Acre, Amapá, Amazonas, Maranhão, Mato Grosso, Pará, Rondônia, and Roraima, and populations usually have more than one tree per hectare [34]. This is a fast-growing species, with an average annual increase in diameter at breast height (DBH) of 2.05 cm and height of 1.98 m, and in adulthood, trees have a straight stem, reaching 106 cm in DBH and 45 m in height [34,35]. Its wood is light and used for furniture [35,36]. The species is hermaphroditic, self-incompatible and about 40 species of bees, butterflies and hummingbird wasps were detected as potential pollinators, although Euglossa spp. and Centris spp. bees was detected as the main pollinators in the Tapajós National Forest, Brazil [37]. Reproduction is primarily mediated by outcrossing, ranging from 0.942–0.993 [38,39]. The fruits can have up to 250 seeds and the winged seeds are dispersed by the wind [37]. Mating between related trees has been reported and attributed to the fact that populations have intrapopulational spatial genetic structure, ranging 50–500 m, due to the short-distance seed dispersal (up to 100 m), but also due short pollen dispersal distance, ranging from 34–90 m [39].
Here, samples from 43 populations of J. copaia collected in Bolivia, Brazil, French Guiana and Peru were used to quantify genetic diversity and population structure, and to test the ability of chloroplast, mitochondrial and nuclear single nucleotide polymorphism (SNPs) markers to determine the geographic location of origin of wood of the species harvested from the Amazon Forest.2. Materials and methods
2.1. Sampling
Were collected cambium or leave samples from 832 trees from 43 natural populations (2–31 individuals) in the Amazon rainforest of four countries (Bolivia, Brazil, French Guiana and Peru) and all trees sampled were georeferenced with GPS usage (Table 1, Figure 1). All samples were stored in a labelled plastic bag with silica gel. The samples were collected by the Institut National de la Recherche.Agronomique- INRA together with the forest authorities (Office National des Forêts, ONF) in seven populations in French Guiana (2–30 individuals per site); In Brazil, samples were collected in national forests, extractive reserves, ecological stations, and national parks with the support of Chico Mendes Institute of Biodiversity (Brazilian governmental institution), totaling 12 sites (4–31 individuals per site); In Peru, samples were collected in national forests, extractive reserves, ecological stations, national parks, farms, and forest concessions, totaling 19 sites (2–30 individuals per site); In Bolivia samples were collected in farms and forest concessions from five sites (5–29 individuals per site). However, due to the low sample size in five populations (2 trees), for genetic analysis, these individuals were grouped with the closest population (Table 1), as well as we also divided the Brazilian samples in West (six populations) and East (six populations) origin and Peru in North (nine populations) and South (eight populations) origin. The minimum distance among sampled trees within populations was 50 m and the distance among populations ranged from 23–2648 km. After sampling, all collected plant material was stored and dried in silica gel. All samples were registered in a database at the Thünen Institute (SampleDataBase, Grosshansdorf, Germany).
2.2. DNA Extraction and SNPs Analysis
Cambium and leaf samples collected in Brazil were sent the Laboratory of Population Genetics and Forestry of São Paulo State University in Ilha Solteira, Brazil (UNESP-FEIS) for DNA isolation. Samples collected in French Guyana, Peru and Bolivia were sent to Thünen Institute facilities in Großhansdorf, Germany, for DNA isolation. DNA isolation from leaf and cambium was carried out according to Dumolin et al. [40]. The samples were screened for 128 SNP and INDEL markers using the MassARRAY® iPLEXTM genotyping, where 113 were nuclear SNPs (nSNPs), 11 cloroplastidial SNPs (CpSNPs), and four mitochondrial SNPs (MtSNPs), all selected for genetic tracking analysis due to show a minimum amplification rate of 95% [41].
2.3. Genetic Diversity and Population Differentiation
The genetic diversity for nSNP was determined for each population and country by the total number of alleles (), percent of polymorphic loci (), observed (), and expected () heterozygosity. The mean fixation index () was estimated to quantify the inbreeding within each population or country and the statistical significance of the values was determined permuting alleles among individuals. For CpMtSNP, the genetic diversity was determined for each population by , percent of polymorphic loci (%), and . We also estimated the percent of polymorphic loci (), observed for all nCpMtSNP loci. The genetic differentiation () was estimated among all populations, populations within country, among countries, and pairwise populations for all nCpMtSNP markers. These analyses were carried out using the GDANT 1b software [42]. The pairwise and spatial distance among populations was used to investigate the isolation by distance (IBD) gene dispersal, using the Spearman correlation coefficient (ρ). We also assessed the IBD by the estimate the spatial genetic structure (SGS) based on calculation of the coancestry coefficient () described in Loiselle et al. [43], between mean pairs of individuals within 10 distance-classes (0–198, 199 –441, 442–655, 656–860, 861–1068, 1069–1409, 1410–1838, 1839–2770, 2771–2478, and 2479–2646 km) determined using the same number of pairs per classes, and using the SPAGEDI 1.5 software [44]. The statistical significance of the average of each distance class was derived by comparing the limits of the confidence interval at 95% probability for the average for each distance class, estimated permuting (1000 times) genotypes between distances classes, using the SPAGEDI software.
2.4. Bayesian Clustering Analysis
Bayesian clustering method [45] implemented in the software STRUCTURE v.2.3.4 [46] was used for the 128 SNPs makers to check for the number of genetic groups/populations. We set the length of burn-in and Markov chain Monte Carlo to 10.000 and tested K values from 2–10 for 30 times. We used the admixture model with correlated allele frequencies. The optimal number of genetic clusters was estimated with the ΔK method [46]. For each optimal K, data from the 30 STRUCTURE runs was permuted with CLUMPP v.1.1.2 [47] to obtain the final Q values for each individual. For determine the optimal number of genetic clusters was determined with the ΔK method described by Evanno et al. [46] using the software CLUMPAK [48].
2.5. Genetic Assignment
Bayesian method [49] implemented in GeneClass 2.0 [50] was used to assign group (population) and individuals to its population and country. Both group and individual assignment were caried out for all nCpMtSNP loci, and the most likely group determined by the highest score by the Bayesian criteria was used as an indicator of the power of the markers to compute the proportion of correctly assigned groups or individuals in self-assignments tests [51]. Here the individuals of the reference data were self-classified to the sampled groups (populations and countries) using the leave-one-out approach [52]. We also estimated the overall, ≥ 80% and ≥ 95% score rate of group and individuals assigned to correct origin population.
3. Results
3.1. Genetic Diversity
The total number of alleles () among populations for 113 nSNPs ranged from 122–226 alleles (mean of 183) and for 15 CpMtSNPs from 14–19 alleles, mean of 15.9 alleles (Table 2). Percent of polymorphic loci () for 113 nSNPs was higher (ranged among populations from 23–88.5%) than for 15 CpMtSNPs (0–26.7%) and 128 nCpMtSNPs (20.3–78.1%, mean of 55.9%). The observed heterozygosity () ranged from 0.023–0.343 (mean of 0.178), the expected heterozygosity () for nSNPs ranged among populations from 0.028–0.348 (mean of 0.204), where for CpMtSNPs ranged from 0–0.16 (mean of 0.024). The values of for nSNPs were high (≥ 50% of the maximum value for biallelic loci, 0.5) for 21 populations, where the highest values were observed for Brazil and Bolivia populations. The mean intrapopulation fixation index () ranged from -0.086–0.295 and was significantly (P< 0.05) higher than zero in six of the 38 populations, suggestion inbreeding. At countries level, for nSNPs, and were highest in Brazil for nSNPs (226, 100%, respectively) and CpMtSNPs (30, 100%, respectively), and lowest in French Guiana (nSNPs= 200, 76.1%, respectively; CpMtSNPs= 18; 20%, respectively). Bolivia presented the highest (0.319) and (0.359) values and lowest (0.113), where French Guiana presented the lowest (0.095) and (0.192) values and the highest (0.506). The for CpMtSNPs was also highest in Brazil (0.251) and lowest in French Guiana (0.013). Spearman correlation (ρ) for nSNPs was significantly higher than zero (ρ= 0.36, P= 0.026) between sample size () and total number of alleles per population (), between and observed heterozygosity (: ρ= 0.675, P= 0), and between and expected heterozygosity (: ρ= 0.691, P= 0), showing that high sample sizes increases allele diversity and populations with higher number of alleles presented higher heterozygosity’s (Supplementary Materials, Table S1).
3.2. Population Differentiation
To determine differences between nuclear SNPs, chloroplastidial and mitochondrial markers (CpMtSNPs) in estimating genetic differentiation () between samples, we compared the results between all 128 nCpMtSNPs, 113 nSNPs, and 15 CpMtSNPs (Table 3). The results showed that the among all populations and countries was higher for CpMtSNPs (0.942 and 0.695, respectively) than for all nCpMtSNPs (0.484 and 0.295, respectively) and nSNPs (0.415 and 0.233, respectively). Among populations within Brazil, Peru and Bolivia countries, the was also higher for CpMtSNPs (0.974, 0.741, and 0.735, respectively) than for all nCpMtSNPs (0.3, 0.466, and 0.142, respectively) and nSNPs (0.224, 0.456, and 0.107, respectively). In contrast, among populations within French Guiana, the was higher for nCpMtSNPs (0.12) and nSNPs (0.117) than CpMtSNPs (0.004). The results also showed that the estimates of for nCpMtSNPs, nSNPs, and CpMtSNPs was generally highest within Peru and Brazil, where the number of sampled populations was highest (Peru= 17, Brazil= 12), indicating that the number of sample populations is important to detect high population differentiation within countries. The highest for CpMtSNPs and nCpMtSNPs than for nSNPs indicated that the combination of 113 nuclear and 15 cytoplasmatic SNP markers increase the capacity of detect genetic differences among populations.
3.3. Isolation by Distance
The Spearman correlation coefficient () between pairwise and spatial distance between populations, based on 128 nCpMtSNP loci was significantly (P< 0.001) higher than zero (= 0.506), indicating an isolation by distance (IBD) genetic pattern (Figure 2). The estimate of pairwise coancestry for nSNP and nCpMtSNP loci between individuals within ten distance classes was significantly higher than zero up to the distance of 655 km, where for CpMtSNP loci was significant up to 1068 km, and non-significant or significantly lower than zero in the other distance classes (Figure 3).
3.4. Bayesian Cluster Analysis
The results of the STRUCTURE analysis showed that based on delta K, the best representation of the data is obtained with a K of 4 or 9 different genetic groups (Figure 3). With 5 groups, there is less mixture of gene pools within individuals. With K= 5, 85% of all individuals had a gene pool membership coefficient above 0.9, while for K= 4, only 76% of all individuals had gene pool membership coefficients above 0.9. The STRUCTURE analysis based on CpMtSNPs showed a clear distinction between French Guiana and North Brazil populations (red) from North Peru, South Brazil (6BW-An; 7B-Ja), East Bolivia (34Bo-Ri, 35Bo-De) (green and white), and from South Peru (29P-In; 30P-Md, 31P-Ca, 32P-Am, 33P-Ta), Southwest Brazil (9BW-Xa, 10B-Co) and Bolivia (36Bo-Vi, 37Bo-Ch; 38Bo-Ma) (blue) (Figure 3A). The STRUCTURE analysis based on nSSR, there are a few locations with mixtures of individuals from different groups (e.g. Flona do Jamari (7BW-Ja), Resex Tapajos-Arapins (14BE-Ar), and ESEC Maraca (5BW-Ma) in Figure 3B). The samples from French Guiana are very similar among them-selves, and created one genetic group (K2 in Figure 3B). We found one genetic group (K3) which we only found in two Brazilian populations (8BW-Jr. 11BE-Am) and another genetic group (K1) distributed more in the middle of the Amazon basin (Figure 3B).
3.5. Genetic Assignment
The grouped sample assignment test for all nCpMtSNPs was able to self-assignment of 100% of population (score of 100%) to the correct origin country and population (Table 4). The individual sample assignment test for all nCpMtSNPs was able to self-assignment of 30.5–100% (mean of 85.7%) of individuals to the correct origin population (score ranging from 59.3–100%). The rate of correct individual assignment for scores ≥ 80% and ≥ 95% were 71 and 62.3%, respectively. The assignment test for individuals for was able to self-assignment among 56.4–98.6% (mean rate of 98.7%) of country origin (mean score ranging from 74.9–99.2%). The rate of correct individual assignment to the correct country source with scores ≥ 80% and ≥ 95% ranged from 49.2–97.6% and 31.9–97.6%, respectively. In the cases of wrong self-assignments, the scores ranged from 45.5–100%, where the distance between the correct to assigned population ranged from of 29–591 km.
Spearman correlation (ρ) for all SNPs was significantly higher than zero (P≤ 0.015) between correct country assignment and and (ρ: ranging from 0.809–0.905), as well as between all SNPs and (ρ= 0.74, P= 0.04) (Supplementary material, Table S2). Spearman correlation for all SNPs and nSNPs was also significantly higher than zero (P≤ 0.026) between correct population assignment and , , and (ρ: ranging from 0.36–0.691) and significantly lower (P≤ 0.003) than zero between correct population assignment and for all SNPs (ρ= -0.473) and nSNPs (ρ= -0.504).
4. Discussion
4.1. Genetic Diversity
The ilegal timber trade, both species-specific and illegally sourced, has become a major problem for tropical forests. Control of the chain of custody for timber originating from the Amazonia Forest, as well as timber from other biomes and regions of the planet, is urgent to verify the species, countries, and place of origin declared in the transport and export documentation and restrict or even irradicate illegal logging. Our study shows the potential of DNA fingerprinting to track the country and population origing for timber, as well as to follow and verify the chain of custodia for J. copaia timber products.
Our study displayed only moderate levels of genetic diversity for the nSNP and low levels for CpMtSNP markers for J. copaia. However, the observed () and expected () heterozygosity were generally moderate and high, respectively, and are within the reported pattern identified for other Neotropical trees using nSNPs markers, where has been observed ranging from 0.017–0.39 and ranging from 0.02–0.371 (Table S4). The genetic diversity of J. copaia was especially low in some North Peru populations. The values were also higher for nSNPs than for CpMtSNPs due to the higher polymorphism of nSNP loci.
The estimate of intrapopulation fixation index () indicated inbreeding in some populations. Inbreeding has also been observed for other Neotropical trees using SNPs markers (Table S4). However, because J. copaia is self-incompatible [37], and our within population samples were taken from geographically distant trees, the observed inbreeding is very likely an artefact of the Wahlund effect [53] due to mixtures of samples from different subpopulations.
4.2. Population Genetic Differentiation
The presence of population genetic differentiation and intrapopulation spatial genetic structure (SGS), or the occurrence of isolation by distance patterns (IBD), is key to assigning timber to different origins [11,29,54,55,56], including country, population, and regions within countries. High genetic differentiation among the different genetic groups increases the success of genetic assignment [54]. Our results showed strong genetic differentiation among all populations and between countries, as well as SGS and a pattern of IBD. The for all SNPs, nSNPs, and CpMtSNps was generally high, especially for CpMtSNps, indicating that SNP markers have a strong capacity to determine the correct timber population of origin. The genetic differentiation was higher among all populations than among countries. Within countries for all SNPs markers, was highest among the Brazilian and Peru population. These results indicate strong potential for assigning timber origins between populations and countries.
4.3. Genetic Assignment and Practical Application
The results indicate a high power to correctly assign groups at both levels: between countries and populations (100%). Our results confirm that this approach offers the possibility of high levels of success in the grouping of timber samples based on their origin populations. This success can be attributed to the general wide genetic differentiation among countries and populations. Even when the differentiation was only moderate (< 0.2) (French Guiana, Bolivia), differences in allele frequencies between analyzed groups were enough to produce high scores for the correct origin. However, it is important to emphasize that this is true when the reference data set contains genetic data of the timber’s original population. Therefore, the success in determining the origin of J. copaia timber, as well as other species, greatly depends on the reference data set developed by the authorities involved in controlling the origin of timber (reference populations). This data set should have genetic data from the population where harvesting is legally practiced.
The results for individual assignment test for all SNPs and nSNPs were lower than group assignment, but also showed a high power of correct assignment among countries and populations. Peru and its regions (North and South) showed a low rate of assignment. According to the Spearman correlation (ρ) for countries and populations for assignment of all SNPs and nSNPs versus , , and for population level for assignment of nSNPs versus , the and , following by are the indices with the most influence on the success of individual assignment tests. The Peru North population generally showed the lowest and values as well as the highest levels of inbreeding, which can explain the low assignment scores. In general, the results for the individual assignment test for all SNPs and nSNPs indicate that this approach has the power to determine the specific site of timber origin. In using CpMtSNP loci markers, it is necessary to develop a large number of loci to improve both group and individual assignment tests. Similar results of better group that individual assignment tests were reported for Hymenaea sp. [1,2] and Handroanthus sp. [57]. For Swietenia macrophylla, based on nSSR loci, the assignment test was higher at the country (82%) than population (71%) level [11]. For the Malaysian Gonystylus bancanus tree, the self-assignment rate using a set of 16 nSSRs was lower (55%) than that observed here at the population level [58]. For SNP data of Entandrophragma cylindricum, the assignment at the country level ranged from 66–74%, depending on the assignment method [53]. Many other studies on tropical, African, and European tree species have been developed using microsatellite and SNPs markers to track timber and the main conclusion is that, due to the presence of SGS and genetic differentiation, DNA fingerprinting is the most effective tool to track the country and population of origin [54,55,56,57,58,59,60,61,62,63,64,65].
Finally, we recommend that the timber sector add such genetic controls as an independent audit beyond the paper-based proof of the chain of custody [11]. It is important to note that the power of the genetic reference data to detect false declarations reaches 100% if more than one sample with the same declaration is tested.
4.4. Conclusion
The genetic differentiation () among all populations, countries, and regions within countries was generally high, especially based on CpMtSNP loci. Furthermore, there is a strong isolation by distance pattern among populations, favoring the tracking of group or individual samples to the correct site. For self-assignment tests, we were able to obtain 100% accuracy to the country, population, and region origin for all samples using all SNPs and nSNPs. Our results show that the use of all SNP or nSNP markers are suitable to correctly determine the country and population of origin for J. copaia timber, thus offering a very useful tool for customs and local and international police. The J. copaia reference database of our study represents a robust assignment tool available to timber companies or government agencies to test and validate origin declarations. We recommend the use of the method described herein for other native tropical species, since it is highly effective in identifying the origin of wood, thus helping the police and other relevant agencies in the definition of illegally deforested areas, as well as unsustainable extraction.
Supplementary Materials
The following supporting information can be downloaded at the website of this paper posted on Preprints.org, Figure S1. Spatial genetic structure of Jacaranda copaia for all sample individuals in all populations for all 128 nCpMtSNP. 113nSNP. and 15 CpMtSNP markers. Unfilled circles indicated mean θ_ij values significant different than zero (P< 0.05) of the hypothesis of absence of SGS (H0: θ_ij= 0); vertical bars show the standard error at 95% of probability; Table S1. Spearman correlation coefficient (ρ) between spatial distance and population genetic differentiation (F_st) in each country all 128 nCpMtSNP, 113 nSNP, and 15 CpMtSNP loci; Table S2. Population genetic diversity and population structure (F_ST) for Neotropical tree species based on SNP markers.
Author Contributions
Conceptualization, Lorena F.M. Capo and Alexandre M. Sebbenn, Bernd Degen, Celine Blanc Jolivet, and Stephen Cavers; Methodology, Alexandre M. Sebbenn, Celine Blanc-Jolivet; Data validation, Malte Mader, Valerie Troispoux, and Celine Blanc-Jolivet; Formal Analysis, Alexandre M. Sebbenn and Celine Blanc-Jolivet; Investigation, Alexandre M. Sebbenn and Celine Blanc-Jolivet; Resources, Bernd Degen; Writing – Original Draft Preparation, Lorena F.M. Capo and Alexandre M. Sebbenn; Writing – Review & Editing, Lorena F.M. Capo and Alexandre M. Sebbenn; Supervision, Bernd Degen; Project Administration, Bernd Degen, Celine Blanc-Jolivet; Sampling, Kathelyn Paredes-Villanueva, Eurídice N. Honorio-Conorado, Carmen R. García-Dávila, and Niklas Tysklind.
Data Availability Statement
The data presented in this study are available on request from the corresponding author due to (specify the reason for the restriction).
Acknowledgments
This research was supported by the German Federal Ministry of Food and Agriculture in the frame of the “Large scale project on genetic timber verification”. Genotyping was performed at the Genomic and Sequencing Facility of Bordeaux (grants from the Conseil Regional d’Aquitaine n° 20030304002FA and 20040305003FA, the European Union, FEDER n° 2003227 and Investissements d'avenir, n° ANR-10-EQPX-16-01 and CEBA: ANR-10-LABX-25-01 to the UMR EcoFoG). Permits ICMBIO n° 47960, 49369, registration CGen n° A16E4DA (Brazil), MAYA/VMABCCGDF/DGBAP/MEG n° 0280/2016 (Bolivia), R.D. n° 001-2016-SERNANP-DGANP, R.D. n° 001A-2015-SERFOR-DGGSPFFS-DGSPF, and Contract n° 001-2016-SERFOR-DGGSPFFS-DGSPF (Peru) were granted for the collection, transport, and genetic analyses of samples. We are grateful to colleagues from IIAP, INRA French Guiana, CIRAD Paracou Station, Office National des Forêts, and Thünen Institute for their assistance during field work and laboratory work. In Bolivia, samples were identified by Museo de Historia Natural Noel Kempff Mercado.
Conflicts of Interest
The authors declare no conflict of interest.
References
- Chaves, C.L.; Degen, B.; Pakull, B.; Mader, M.; Honorio, E.; Ruas, P.; Tysklind, N.; Sebbenn, A.M. Assessing the ability of chloroplast and nuclear DNA gene markers to verify the geographic origin of Jatoba (Hymenaea courbaril L.) timber. J. Hered. 2018, 109, 543–552. [Google Scholar] [CrossRef]
- Chaves, C.L.; Blanc-Jolivet, C.; Sebbenn, A.M.; Mader, M.; Meyer-Sand, B.R.V.; Paredes-Villanueva, K.; Coronado, E.N.H.; Garcia-Davila, C.; Tysklind, N.; Troispoux, V.; et al. Nuclear and chloroplastic SNP markers for genetic studies of timber origin for Hymenaea trees. Conserv. Genet. Resour. 2019, 11, 329–331. [Google Scholar] [CrossRef]
- Coronado, E.N.H.; Blanc-Jolivet, C.; Mader, M.; García-Dávila, C.R.; Gomero, D.A.; del Castillo, D.T.; Llampazo, G.F.; Pizango, G.H.; Sebbenn, A.M.; Meyer-Sand, B.R.V.; et al. SNP markers as a successful molecular tool for assessing species identity and geographic origin of trees in the economically important South American legume Genus Dipteryx. J. Hered. 2020, 111, 346–356. [Google Scholar] [CrossRef] [PubMed]
- Sebbenn, A.M.; Degen, B.; Azevedo, V.C.R.; Silva, M.B.; Lacerda, A.E.B.; Ciampi, A.Y.; Kanashiro, M.; Carneiro, F.S.; Thompson, I.; Loveless, M.D. Modelling the long-term impacts for selective logging on genetic diversity and demographic structure of four tropical tree species in the Amazon Forest. For. Ecol. Manag. 2008, 254, 335–349. [Google Scholar] [CrossRef]
- Lacerda, A.E.B.; Nimmo, E.R.; Sebbenn, A.M. Modeling the long-term impacts of logging on genetic diversity and demography of Hymenaea courbaril. For. Sci. 2013, 59, 15–26. [Google Scholar] [CrossRef]
- Dal Bem, E.A.; Bittencourt, J.V.M.; Moraes, M.L.T.; Sebbenn, A.M. Cenários de corte seletivo de árvores na diversidade genética e área basal de populações de Araucaria angustifolia com base em modelagem Ecogene. Sci. For. 2015, 43, 453–466. [Google Scholar]
- Vinson, C.C.; Kanashiro, M.; Sebbenn, A.M.; Williams, T.C.R.; Harris, S.A.; Boshier, D.H. Long-term impacts of selective logging on two Amazonian tree species with contrasting ecological and reproductive characteristics: Inferences from Ecogene model simulations. Heredity 2015, 115, 130–139. [Google Scholar] [CrossRef] [PubMed]
- Gattia, TC et al. The number of tree species on Earth. Proc. Natl. Acad. Sci. USA 2022, 119(6), e2115329119. [CrossRef]
- Barber, C.P.; Cochrane, M.A.; Souza Jr, C.; Laurance, W.F. Roads, deforestation, and the mitigating effect of protected areas in the Amazon. Biol. Conserv. 2014, 177, 203–209. [Google Scholar] [CrossRef]
- Gray, J.A. Forest concession policies and revenue systems: Country experience and policy changes for sustainable tropical forestry, World Bank Publications. 2002.
- Degen, D.; Ward, S.E.; Lemes, M.R.; Navarro, C.; Cavers, S.; Sebbenn, A.M. Verifying the geographic origin of mahogany (Swietenia macrophylla King) with DNA-fingerprints. Forensic Sci. Int-Gen. 2013, 7, 55–62. [Google Scholar] [CrossRef]
- Lowe, A.J.; Dormontt, E.E.; Bowie, M.J.; Degen, B.; Gardner, S.; Thomas, D.; Clarke, C.; Rimbawanto, A.; Wiedenhoeft, A.; Yin, Y. Opportunities for improved transparency in the timber trade through scientific verification. BioScience 2016, 66, 990–998. [Google Scholar] [CrossRef]
- CITES, Comércio Internacional das Espécies da Flora e Fauna Selvagens em Perigo de Extinção, 2021. Disponível em. Available online: https://cites.org/esp/app/appendices.php (accessed on 1 June 2022).
- Lescuyer, G.; Ndotit, S.; Ndong, L.B.B.; Tsanga, R.; Cerutti, P.O. Policy options for improved integration of domestic timber markets under the voluntary partnership agreement (VPA) regime in Gabon. Center for International Forestry Research (CIFOR), 2014.
- Federal Police Brazil, GOV, 2022. Disponível em. Available online: https://www.gov.br/pf/pt-br/search?SearchableText=madeira%20ilegal%20extra%C3%ADda%20da%20Amaz%C3%B4nia (accessed on 17 May 2022).
- Farias, Elaíze. 2019. “Amazônia em Chamas: 90% da madeira exportada são ilegais, diz Polícia Federal.” Amazônia Real, September 13. Available online: https://amazoniareal.com.br/amazonia-em-chamas-90-da-madeira-exportada-sao-ilegais-diz-policia-federal/67 (accessed on 31 July 2023).
- Perez Coelho, M.; Sanz, J.; Cabezudo, M. Analysis of volatile components of oak wood by solvent extraction and direct thermal desorption-gas chromatography-mass spectrometry. J. Chromat. 1997, 778, 427–434. [Google Scholar] [CrossRef]
- Fidelis, C.H.V.; Augusto, F.; Sampaio, P.T.B.; Krainovic, P.M.; Barata, L.E.S. Chemical characterization of rosewood (Aniba rosaeodora Ducke) leaf essential oil by comprehensive two-dimensional gas chromatography coupled with quadrupole mass spectrometry. J. Essent. Oil Res. 2012, 24, 245–251. [Google Scholar] [CrossRef]
- Paredes-Villanueva, K.; Espinoza, E.; Ottenburghs, J.; Sterken, M.G.; Bongers, F.; Zuidema, P.A. Chemical differentiation of Bolivian Cedrela species as a tool to trace illegal timber trade. Forestry: An Internat. J. For. Resear. 2018, 91, 603–613. [Google Scholar] [CrossRef]
- Deklerck, V.; Finch, K.; Gasson, P.; Van den Bulcke, J.; Van Acker, J.; Beeckman, H.; Espinoza, E. Comparison of species classification models of mass spectrometry data: Kernel discriminant analysis vs random forest; A case study of Afrormosia (Pericopsis elata (Harms) Meeuwen). Rapid Commun. Mass Spectrom. 2017, 1582–1588. [Google Scholar] [CrossRef] [PubMed]
- Kagawa, A.; Leavitt, S.W. Stable carbon isotopes of tree rings as a tool to pinpoint the geographic origin of timber. J. Wood Sci. 2010, 56, 175–183. [Google Scholar] [CrossRef]
- Bergo, M.C.J.; Pastore, T.C.M.; Coradin, V.T.R.; Wiedenhoeft, A.C.; Braga, J.W.B. NIRS identification of Swietenia macrophylla is robust across specimens from 27 countries. IAWA J. 2016, 37, 420–430. [Google Scholar] [CrossRef]
- Gasson, P.; Baas, P.; Wheeler, E. Wood anatomy of Cites-listed tree species. IAWA J. 2011, 32, 155–198. [Google Scholar] [CrossRef]
- Moya, R.; Wiemann, M.C.; Olivares, C. Identification of endangered or threatened Costa Rican tree species by wood anatomy and fluorescence activity. Rev. Biol. Trop. 2013, 61, 1113–1156. [Google Scholar]
- Tnah, L.H.; Lee, S.L.; Ng, K.K.S.; Tani, N.; Bhassu, S.; Othman, R.Y. Geographical traceability of an important tropical timber (Neobalanocarpus heimii) inferred from chloroplast DNA. For. Ecol. Manage. 2009, 258, 1918–1923. [Google Scholar] [CrossRef]
- Lowe, A.J.; Wong, K.N.; Tiong, Y.S.; Iyerh, S.; Chew, F.T. A DNA method to verify the integrity of timber supply chains; confirming the legal sourcing of merbau timber from logging concession to sawmill. Silvae Genet. 2010, 59, 263–272. [Google Scholar] [CrossRef]
- Tnah, L.H.; Lee, S.L.; Ng, K.K.S.; Faridah, Q.Z.; Faridah-Hanum, I. Forensic DNA profiling of tropical timber species in Peninsular Malaysia. For. Ecol. Manage. 2010, 259, 1436–1446. [Google Scholar] [CrossRef]
- Jolivet, C.; Degen, D. Use of DNA fingerprints to control the origin of sapelli timber (Entandrophragma cylindricum) at the forest concession level in Cameroon. Forensic Sci. Int-Gen. 2012, 6, 487–493. [Google Scholar] [CrossRef] [PubMed]
- Dormontt, E.E.; Boner, M.; Braun, B.; Breulmann, B.; Degen, B.; Espinoza, E.; Gardner, S.; Guillery, P.; Hermanson, J.C.; Koch, G.; et al. Forensic timber identification: It's time to integrate disciplines to combat illegal logging. Biol. Conserv. 2015, 191, 790–798. [Google Scholar] [CrossRef]
- Blanc-Jolivet, C.; Yanbaev, Y.; Kersten, B.; Degen, B. A set of SNP markers for timber tracking of Larix spp. in Europe and Russia. Forestry: An. Int. J. For. Resear. 2018, 91, 614–628. [Google Scholar] [CrossRef]
- Vlam, M.; de Groot, G.A.; Boom, A.; Copini, P.; Laros, I.; Veldhuijzen, K.; Zakamdi, D.; Zuidema, P.A. Developing forensic tools for an African timber: Regional origin is revealed by genetic characteristics, but not by isotopic signature. Biol. Conserv. 2018, 220, 262–271. [Google Scholar] [CrossRef]
- Abeele, S.V.; Hardy, O.J.; Beeckman, H.; Ilondea, B.A.; Janssens, S.B. Genetic markers for species conservation and timber tracking: Development of microsatellite primers for the Tropical African tree species Prioria balsamifera and Prioria oxyphylla. Forests 2019, 10, 1037. [Google Scholar] [CrossRef]
- Paredes-Villanueva, K.; Blanc-Jolivet, C.; Mader, M.; Coronado, E.N.H.; Garcia-Davila, C.; Sebbenn, A.M.; Meyer-Sand, B.R.V.; Caron, H.; Tysklind, N.; Cavers, S.; et al. Nuclear and plastid SNP markers for tracing Cedrela timber in the tropics. Conserv. Genet. Resour. 2020, 12, 239–244. [Google Scholar] [CrossRef]
- Loureiro, A.A.; Silva, M.F.; Alencar, J.C. Essências madeireiras da Amazonia. INPA, 1979, v.1.
- Sampaio, P.T.B.; Barbosa, A.P.; Fernandes, N.P. Ensaio de espaçamento com caroba - Jacaranda copaia (AUBL.) D. DON. BIGNONTACEAE. Acta Amaz. 1989, 9, 383. [Google Scholar] [CrossRef]
- Gentry, A.H. Bignoniaceae – Part II (Tribe Tecomeae). Flora Neotropica 1992, 25, 1–370. Available online: https://www.jstor.org/stable/i400045.
- Maues, M.M.; Oliveira, P.E.A.M.; Kanashiro, M. Pollination biology in Jacaranda copaia (Aubl.) D. Don. (Bignoniaceae) at the “Floresta Nacional do Tapajós”, Central Amazon. Rev. Brasil. Bot. 2008, 31, 517–527. [Google Scholar] [CrossRef]
- James, T.; Veges, S.; Aldrich, P.; Hamrick, J.L. Mating systems of three tropical dry Forest tree species. Biotropica 1998, 30, 587–594. [Google Scholar] [CrossRef]
- Vinson, C.C.; Kanashiro, M.; Harris, S.A.; Boshier, D.H. Impacts of selective logging on inbreeding and gene flow in two Amazonian timber species with contrasting ecological and reproductive characteristics. Mol. Ecol. 2015, 24, 38–53. [Google Scholar] [CrossRef] [PubMed]
- Dumolin, S.; Demesure, B.; Petit, R.J. Inheritance of chloroplast and mitochondrial genomes in pediculate oak investigated with an efficient PCR method. Theor. Appl. Genet. 1995, 91, 1253–1256. [Google Scholar] [CrossRef] [PubMed]
- Sebbenn, A.M.; Blanc-Jolivet, C.; Mader, M. Meyer-Sand, B.R.V.; Paredes-Villanueva, K.; Coronado, E.N.H.; Garcia-Davila, C.; Tysklind, N.; Troispoux, V.; Delcamp, A.; Degen, D. Nuclear and plastidial SNP and INDEL markers for genetic tracking studies of Jacaranda copaia. Conserv. Genet. Resour. 2019, 11, 341–343. [CrossRef]
- Degen B, Blanc-Jolivet C, Stierand K, Gillet, E. 2017. A nearest neighbour approach by genetic distance to the assignment of individual trees to geographic origin. Forensic Sci. Int. Genet. 27:132–141.
- Loiselle, B.A.; Sork, V.L.; Nason, J.; Graham, C. Spatial genetic structure of a tropical understory shrub, Psychotria officinalis (Rubiaceae). Am. J. Bot. 1995, 82, 1420–1425. [Google Scholar] [CrossRef]
- Hardy, O.J.; Vekemans, X. SPAGeDI: A versatile computer program to analyses spatial genetic structure at the individual or population levels. Mol. Ecol. Notes 2002, 2, 618–620. [Google Scholar] [CrossRef]
- Pritchard, J.K.; Stephens, M.; Donnelly, P. Inference of population structure using multilocus genotype data. Genetics 2000, 155, 945–959. [Google Scholar] [CrossRef] [PubMed]
- Evanno, G.; Regnaut, S.; Goudet, J. Detecting the number of clusters of individuals using the software STRUCTURE: A simulation study. Mol. Ecol. 2005, 14, 2611–2620. [Google Scholar] [CrossRef] [PubMed]
- Jakobsson, M.; Rosenberg, N.A. CLUMPP: A cluster matching and permutation program for dealing with label switching and multimodality in analysis of population structure. Bioinformatics 2007, 23, 1801–1806. [Google Scholar] [CrossRef] [PubMed]
- Kopelman, N.M.; Mayzel, J.; Jakobsson, M.; Rosenberg, N.A.; Mayrose, I. Clumpak: A program for identifying clustering modes and packaging population structure inferences across K. Mol. Ecol. Resour. 2015, 15, 1179–1191. [Google Scholar] [CrossRef] [PubMed]
- Rannala, B.; Mountain, J.L. Detecting immigration by using multilocus genotypes. Proc. Natl. Acad. Sci. U.S.A. 1997, 94, 9197–9201. [Google Scholar] [CrossRef] [PubMed]
- Piry, S.; Alapetite, A.; Cornuet, J.M.; Paetkau, D.; Baudouin, L.; Estoup, A. GENECLASS2: A software for genetic assignment and first-generation migrant detection. J. Hered. 2004, 95, 536–539. [Google Scholar] [CrossRef] [PubMed]
- Efron, B. Estimating the error rate of a prediction rule – improvement on cross validation. J. Am. Stat. Assoc. 1983, 78, 316–331. [Google Scholar] [CrossRef]
- Cornuet, J.M.; Piry, S.; Luikart, G.; Estoup, A.; Solignac, M. New methods employing multilocus genotypes to select or exclude populations as origins of individuals. Genetics 1999, 153, 1989–2000. [Google Scholar] [CrossRef] [PubMed]
- Wahlund, S. Composition of populations and correlation appearances viewed in relation to the studies of inheritance. Hereditas 1928, 11, 65–106. [Google Scholar] [CrossRef]
- Ogden, R.; Linacre, A. Wildlife forensic science: A review of genetic geographic origin assignment. Forensic Sci. Int. Genet. 2015, 18, 152–159. [Google Scholar] [CrossRef] [PubMed]
- Scotti-Saintagne, C.; Dick, C.W.; Caron, H.; Vendramin, G.G.; Guichoux, E.; Buonamici, A.; Duret, C.; Sire, P.; Valencia, R.; Lemes, M.R.; et al. Phylogeography of a species complex of lowland Neotropical rain forest trees (Carapa, Meliaceae). J. Biogeogr. 2013, 40, 676–692. [Google Scholar] [CrossRef]
- Scotti-Saintagne, C.; Dick, C.W.; Caron, H.; Vendramin, G.G.; Troispoux, V.; Sire, P.; Casalis, M.; Buonamici, A.; Valencia, R.; Lemes, M.R.; et al. Amazon diversification and cross-Andean dispersal of the widespread Neotropical tree species Jacaranda copaia (Bignoniaceae). J. Biogeogr. 2013, 40, 707–719. [Google Scholar] [CrossRef]
- Meyer-Sand, B.R.V.; Blanc-Jolivet, C.; Mader, M.; Paredes-Villanueva, K.; Tysklind, N.; Sebbenn, A.M.; Guichoux, E.; Degen, D. Development of a set of SNP markers for population genetics studies of Ipe (Handroanthus sp.), a valuable tree genus from Latin America. Conserv. Genet. Resour. 2018, 10, 779–781. [Google Scholar] [CrossRef]
- Ng, K.K.; Lee, S.L.; Tnah, L.H.; Nurul-Farhanah, Z.; Ng, C.H.; Lee, C.T.; Tani, N.; Diway, B.; Lai, P.S.; Khoo, E. Forensic timber identification: A case study of a cites listed species, Gonystylus bancanus (thymelaeaceae). Forensic Sci. Int. Genet. 2016, 23, 197–209. [Google Scholar] [CrossRef]
- Degen, B.; Blanc-Jolivet, C.; Stierand, K.; Gillet, E. A nearest neighbour approach by genetic distance to the assignment of individual trees to geographic origin. Forensic Sci. Int. Genet. 2017, 27, 132–141. [Google Scholar] [CrossRef] [PubMed]
- Jardine, D.I.; Blanc-Jolivet, C.; Dixon, R.R.M.; Dormontt, E.E.; Dunker, B.; Gerlach, J.; Kersten, B.; Van Dijk, K.J.; Degen, B.; Lowe, A.J. Development of SNP markers for Ayous (Triplochiton scleroxylon K. Schum) an economically important tree species from tropical West and Central Africa. Conserv. Genet. Resour. 2016, 8, 129–139. [Google Scholar] [CrossRef]
- Pakull, B.; Mader, M.; Kersten, B.; Ekue, M.R.M.; Dipelet, U.G.B.; Paulini, M.; Bouda, Z.H.N.; Degen, B. Development of nuclear, chloroplast and mitochondrial SNP markers for Khaya sp. Conserv. Genet. Resour. 2016, 8, 283–297. [Google Scholar] [CrossRef]
- Schroeder, H.; Cronn, R.; Yanbaev, Y.; Jennings, T.; Mader, M.; Degen, B.; Kersten, B. Development of molecular markers for determining continental origin of wood from white oaks (Quercus L. sect. Quercus). PloS ONE 2016, 11, e0158221. [Google Scholar] [CrossRef]
- Paredes-Villanueva, K.; de Groot, G.A.; Laros, I.; Bovenschen, J.; Bongers, F.; Zuidema, P.A. Genetic differences among Cedrela odorata sites in Bolivia provide limited potential for fine-scale timber tracing. Tree Genet. Genome 2019, 15, 33. [Google Scholar] [CrossRef]
- Tysklind, N.; Blanc-Jolivet, C.; Mader, M.; Meyer-Sand, B.R.V.; Paredes-Villanueva, K.; Coronado, E.N.H.; Garcia-Davila, C.; Sebbenn, A.M.; Caron, K.; Troispoux, V.; et al. Development of nuclear and plastid SNP and INDEL markers for population genetic studies and timber traceability of Carapa species. Conserv. Genet. Resour. 2019, 11, 337–339. [Google Scholar] [CrossRef]
- Pakull, B.; Schindler, L.; Mader, M.; Kerten, B.; Blanc-Jolivet, C.; Paulini, M.; Lemes, M.R.; Ward, S.E.; Navarro, C.M.; Cavers, S.; et al. Development of nuclear SNP markers for Mahogany (Swietenia spp.). Conserv. Genet. Resour. 2020, 12, 585–587. [Google Scholar] [CrossRef]
Figure 1.
Spatial distribution of samples for Jacaranda copaia in South America.
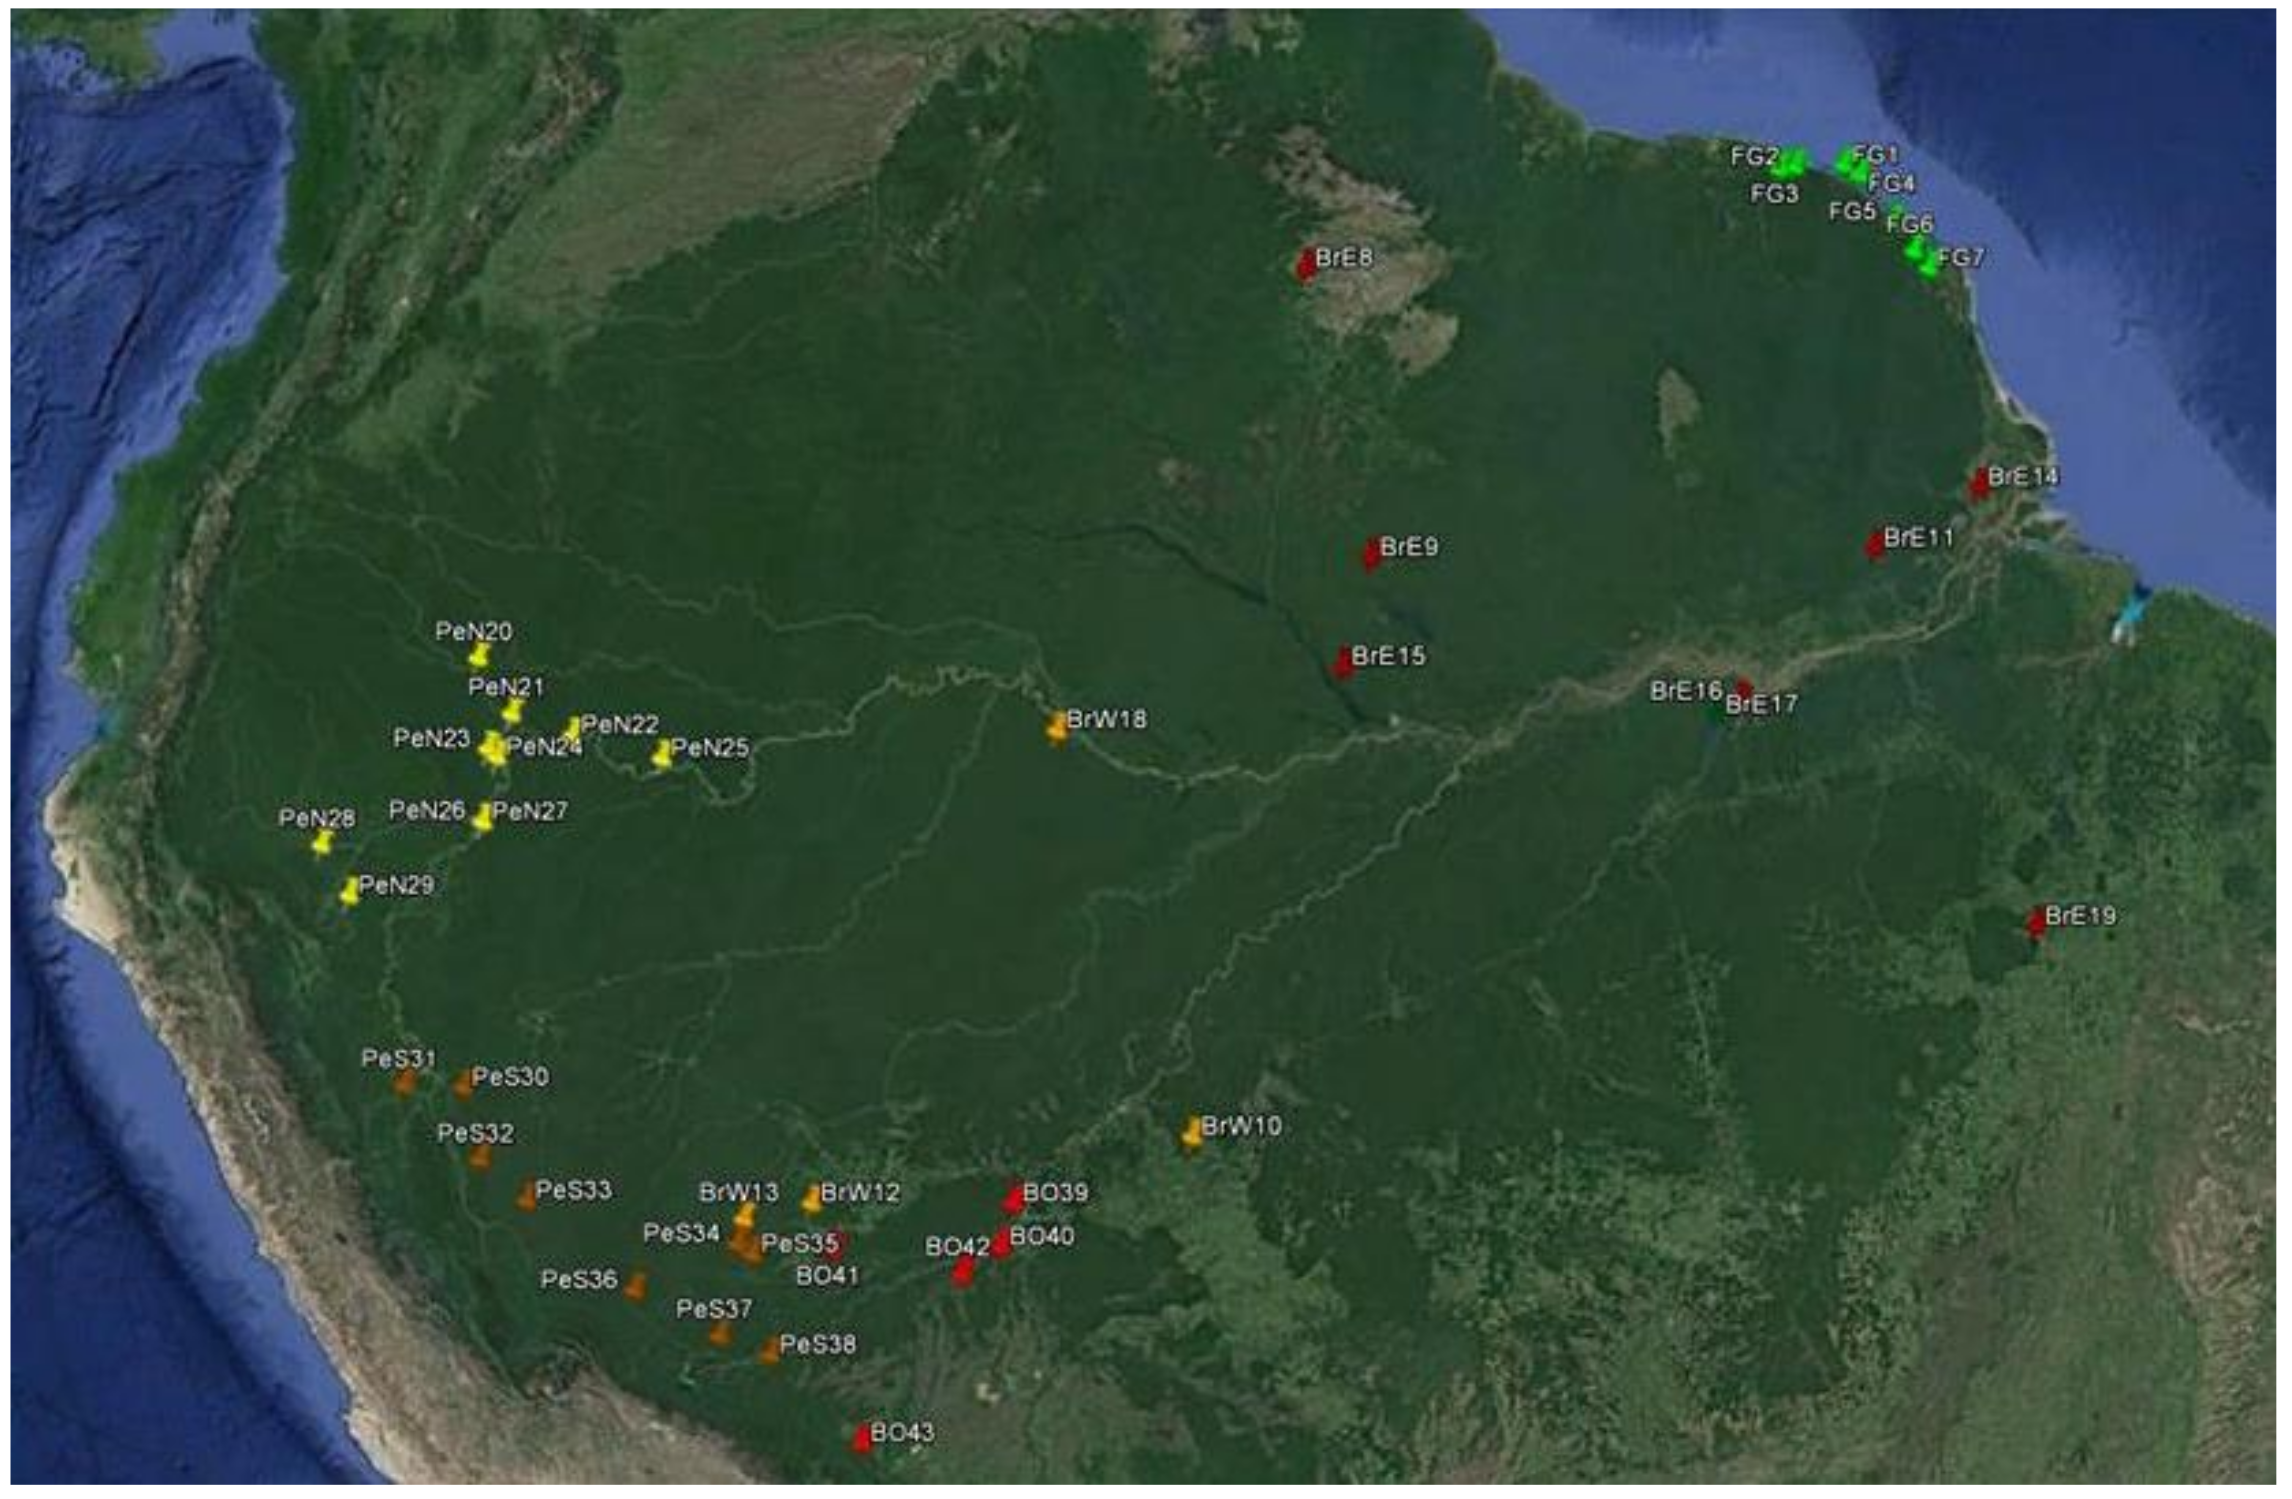
Figure 2.
Pattern of isolation by distance in Jacaranda copaia populations. is the pairwise genetic differentiation between populations for all 128 loci. The Spearman correlation coefficient () was significantly higher than zero (P< 0.01) for all loci (0.506); Coefficient of determination R2= 0.268.
Figure 2.
Pattern of isolation by distance in Jacaranda copaia populations. is the pairwise genetic differentiation between populations for all 128 loci. The Spearman correlation coefficient () was significantly higher than zero (P< 0.01) for all loci (0.506); Coefficient of determination R2= 0.268.
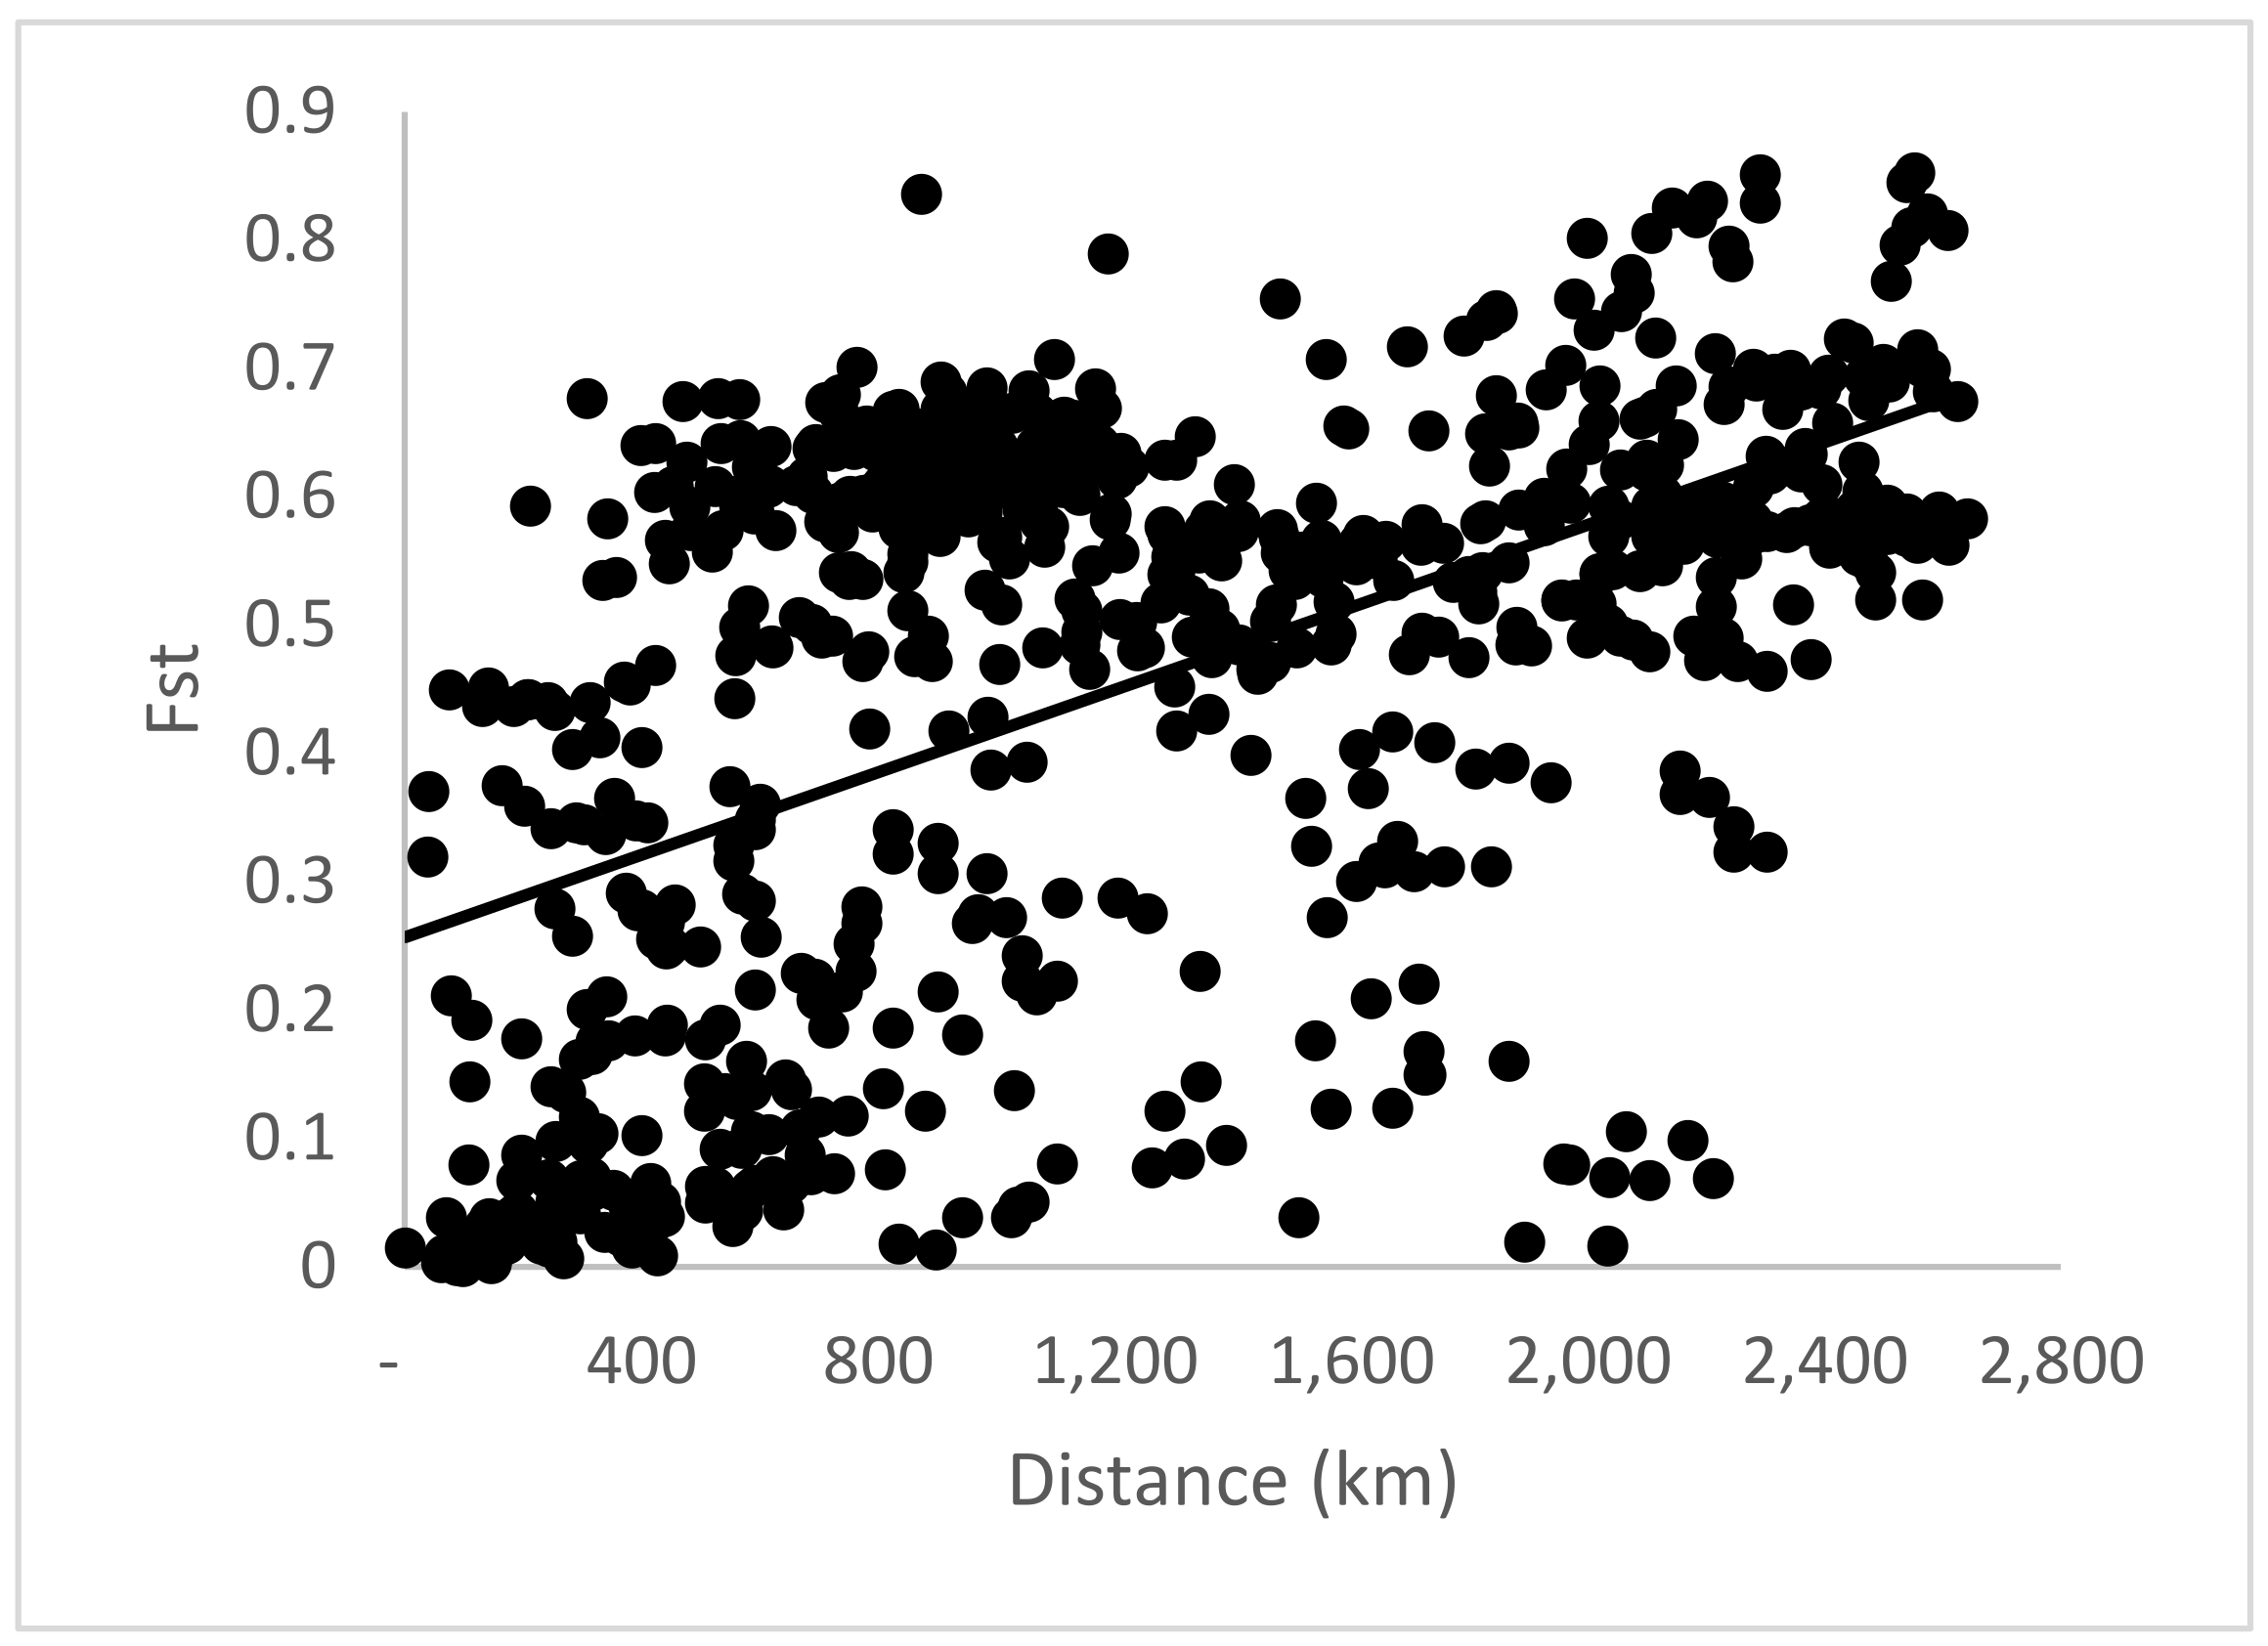
Figure 3.
Spatial distribution of CpMtSNPs (A, K=4), nSNPS (B; K=9) and nCpMtSNP (C; K=8) estimated by STRUCTURE (K = 4 to 9) for Jacaranda copaia in South America.
Figure 3.
Spatial distribution of CpMtSNPs (A, K=4), nSNPS (B; K=9) and nCpMtSNP (C; K=8) estimated by STRUCTURE (K = 4 to 9) for Jacaranda copaia in South America.
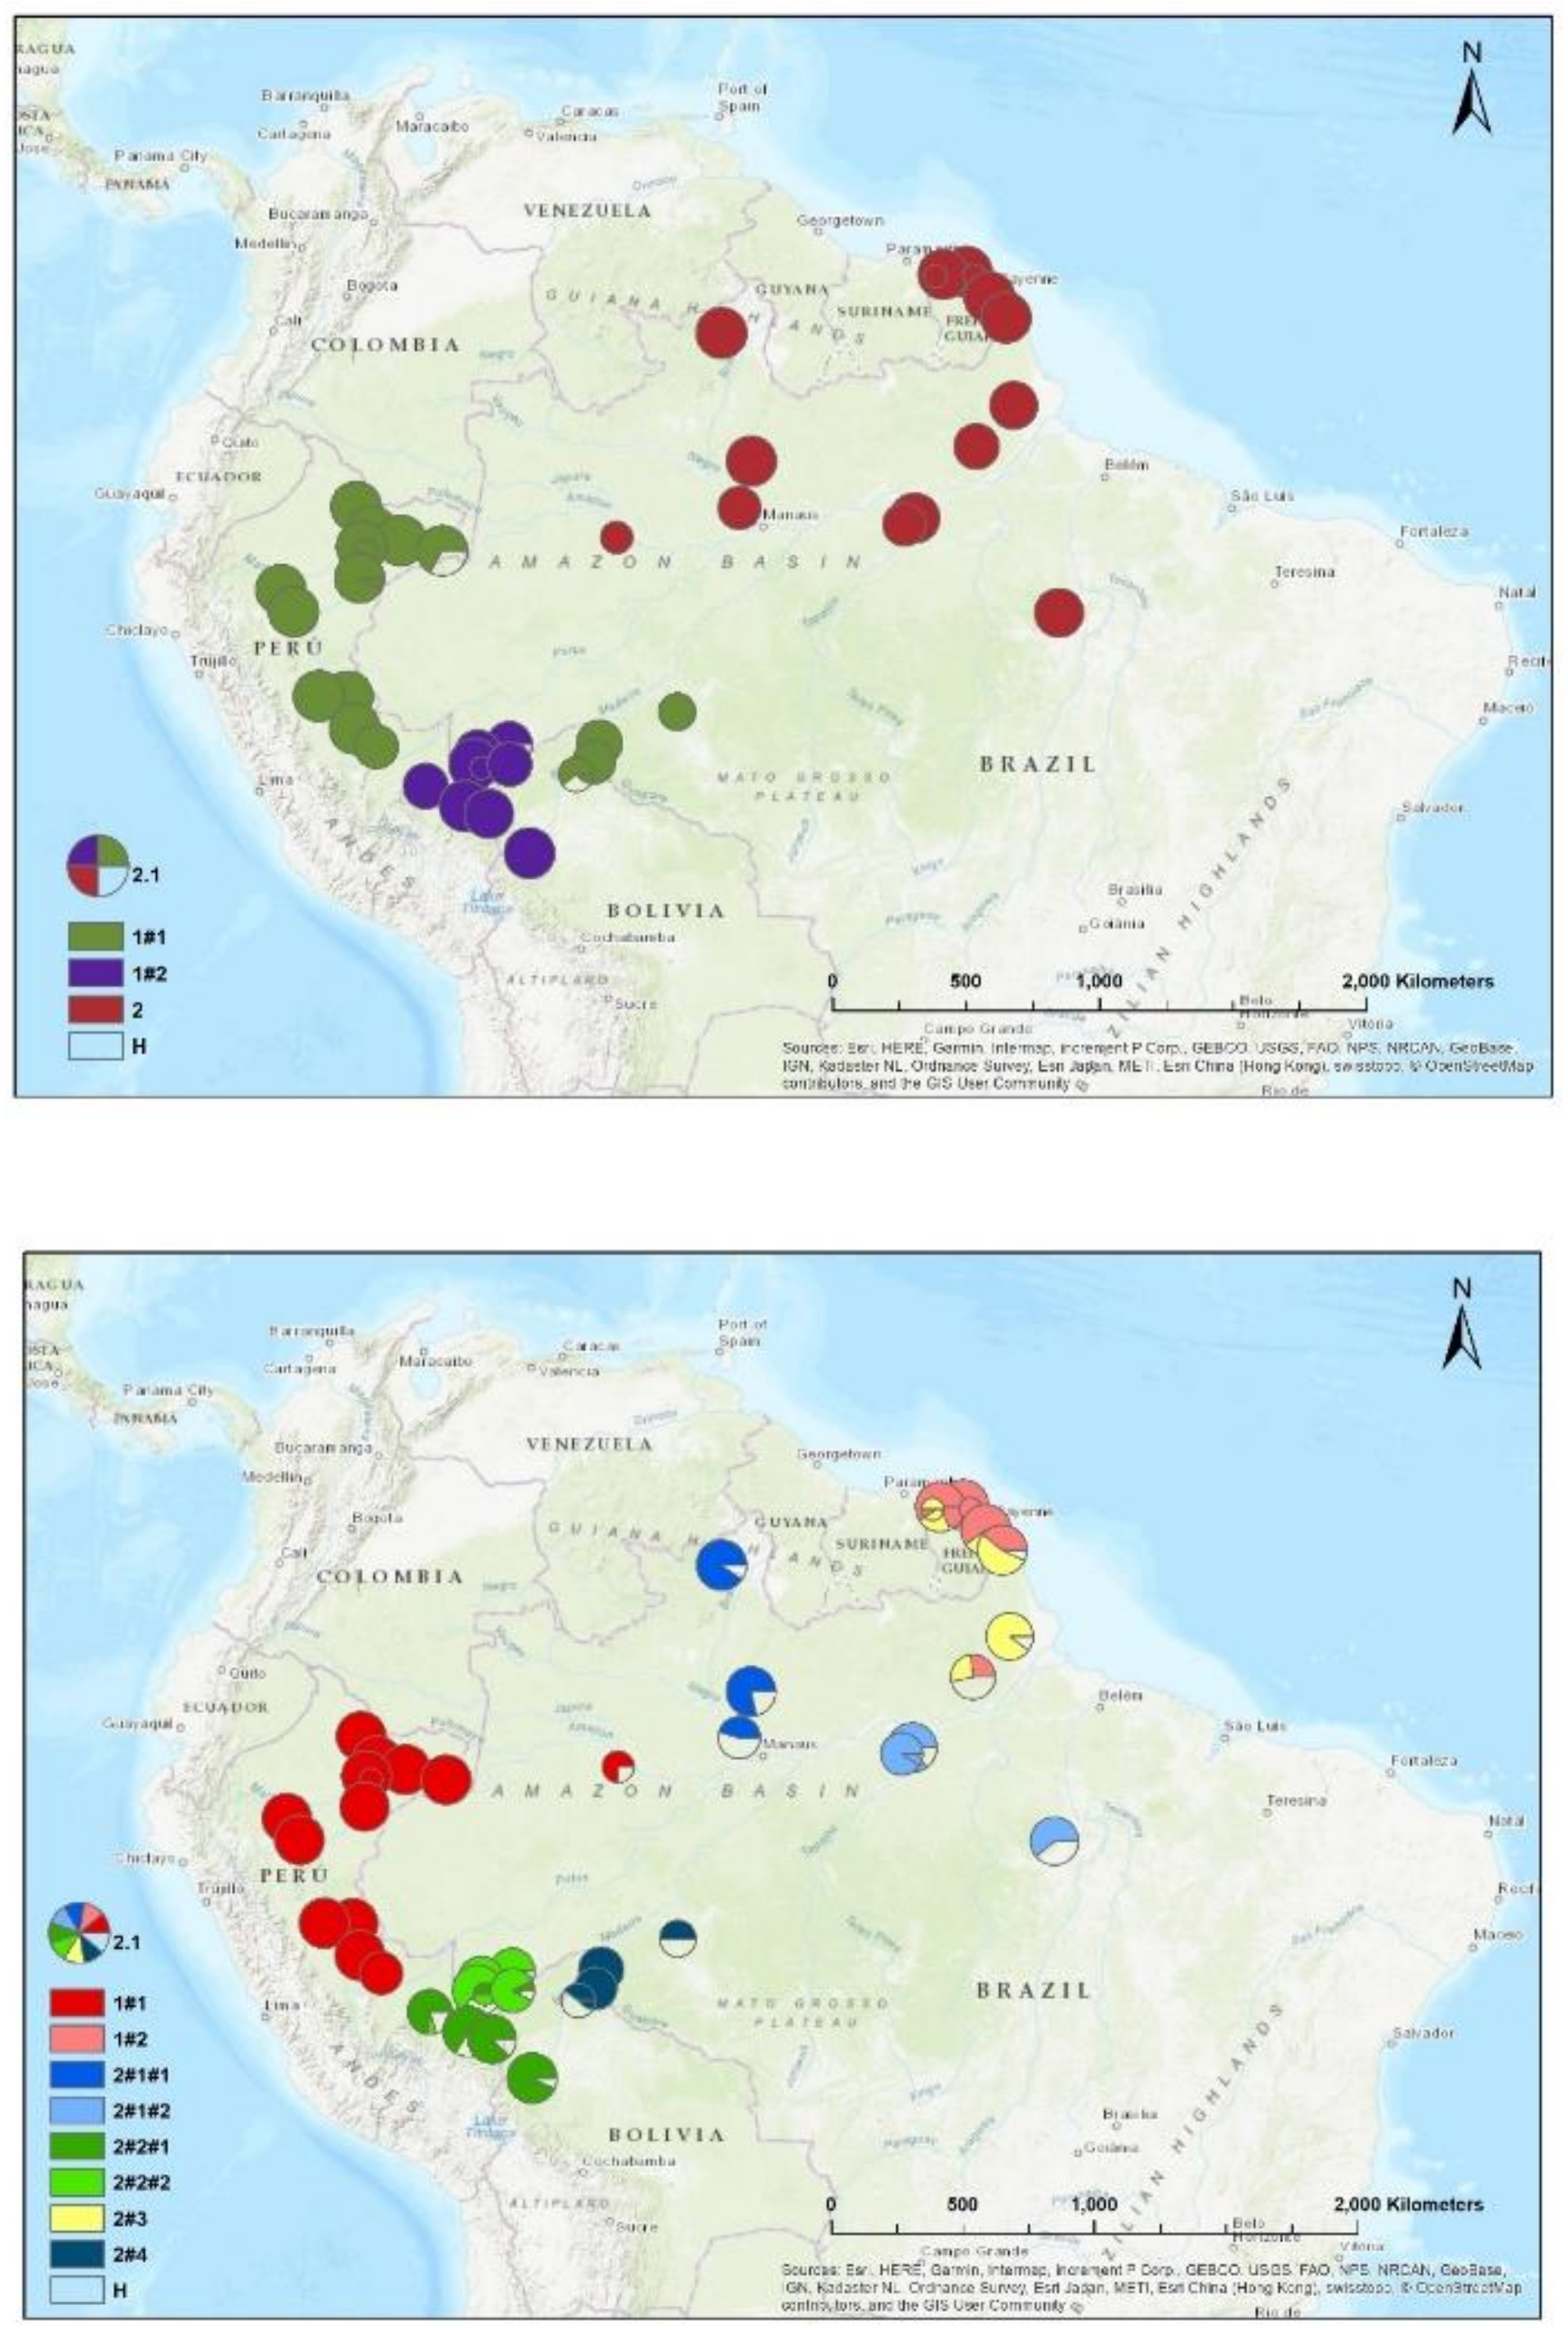
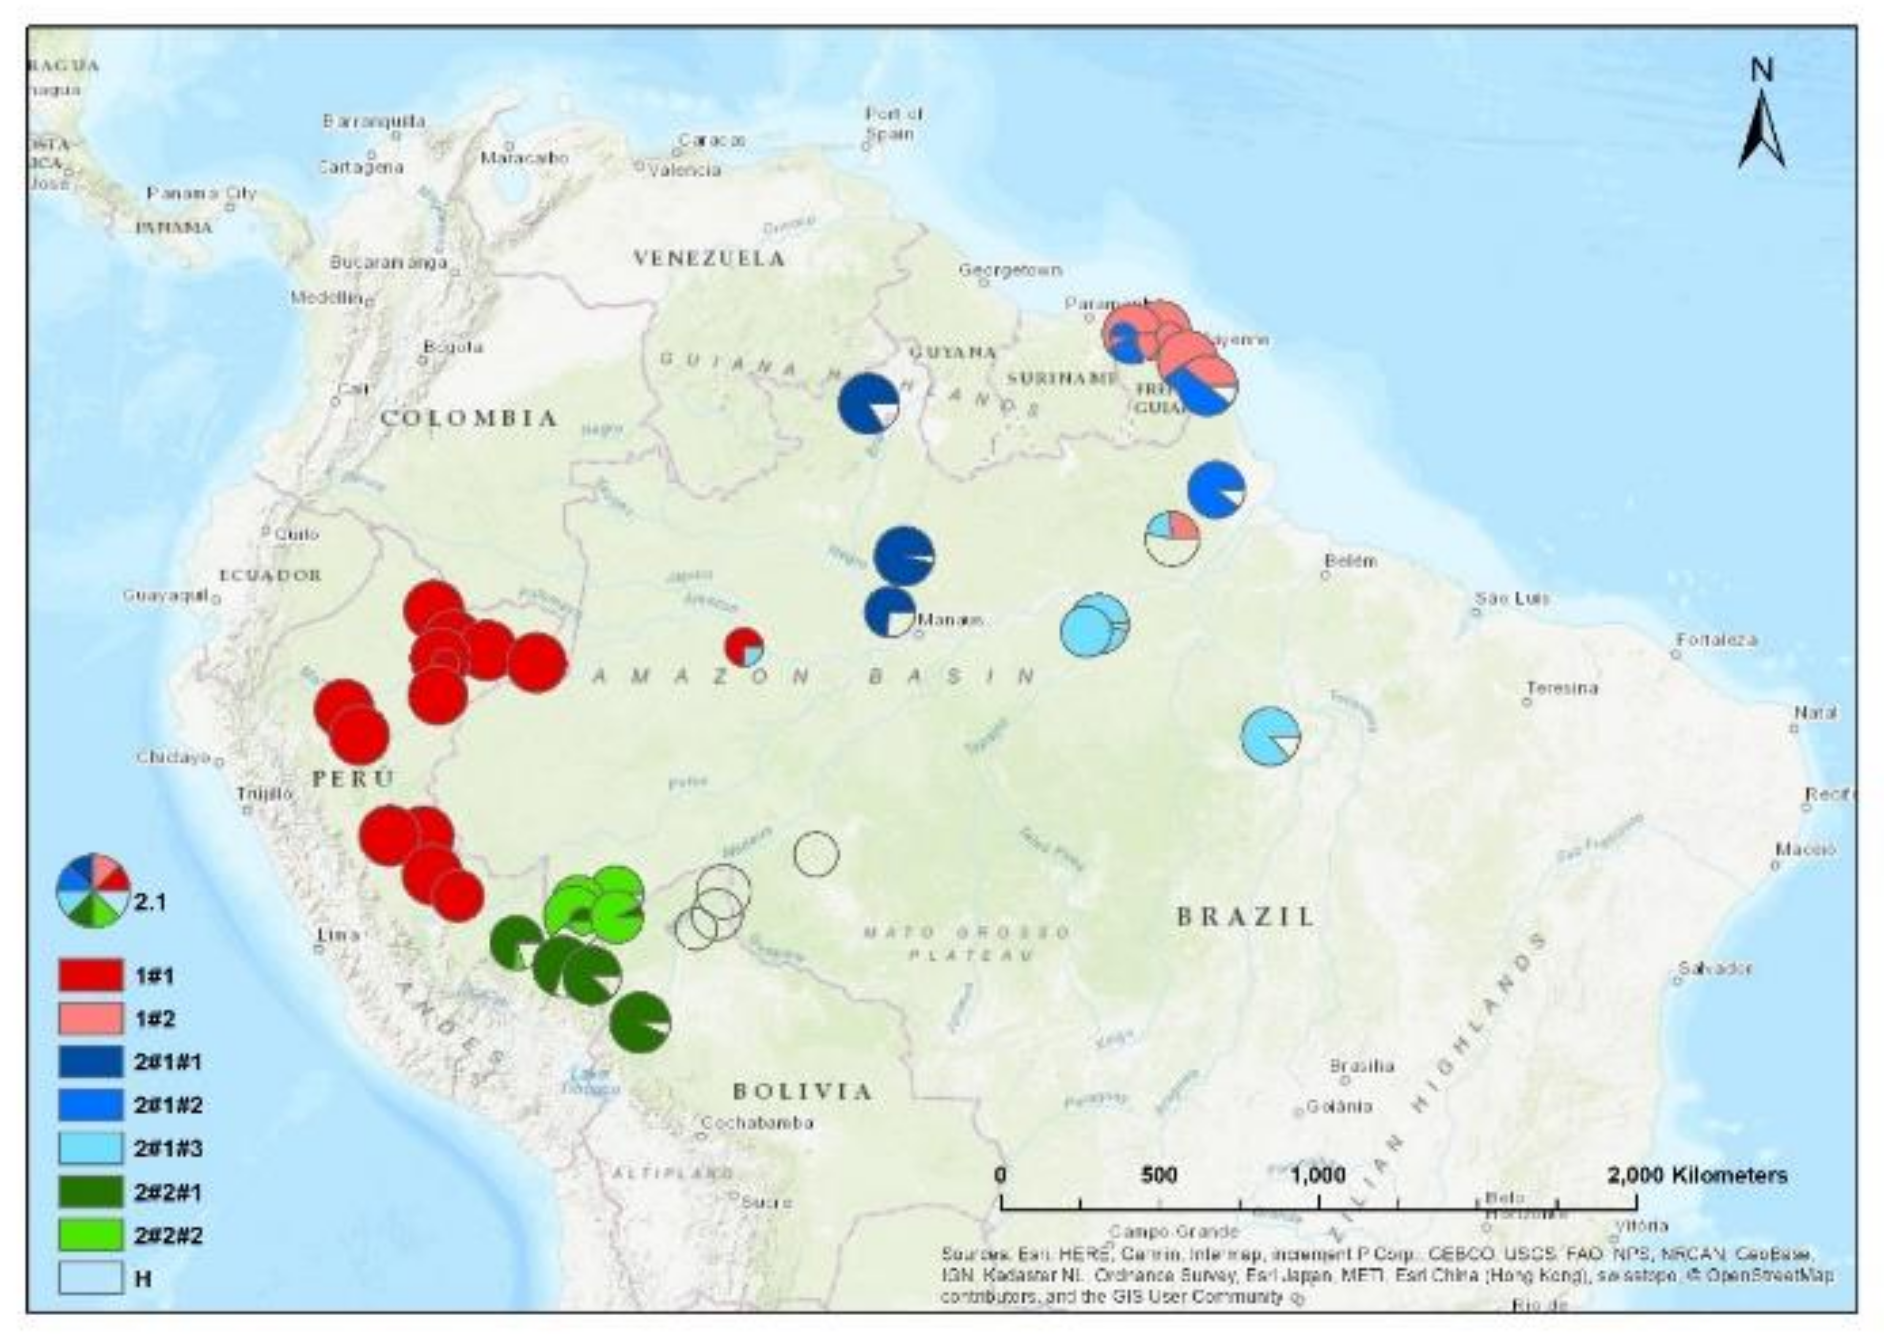

Table 1.
Information on the sampled size (), location and latitude (Lat) and longitude (Long), and group abbreviation (Abbrev).
Table 1.
Information on the sampled size (), location and latitude (Lat) and longitude (Long), and group abbreviation (Abbrev).
| Country | Population | Lat | Long | Abbrev | ||
| 1-F. Guiana | Counami | 30 | 5,41543 | -53,175 | 1FG-Co | 32 |
| 2-F. Guiana | Sinamary | 2 | 5,2884 | -52,916 | ||
| 3-F. Guiana | Piste de Paul Isnard | 27 | 5,33216 | -53,957 | 2FG-Is | 29 |
| 4-F. Guiana | Acapou | 2 | 5,27343 | -54,218 | ||
| 5-F. Guiana | Route de Cocoa | 30 | 4,56779 | -52,406 | 3FG-Ro | 32 |
| 6-F. Guiana | Regina | 2 | 4,13118 | -52,088 | ||
| 7-F. Guiana | Saut Maripa | 28 | 3,87833 | -51,857 | 4FG-Ma | 28 |
| 8-Brazil | ESEC de Maraca-RR | 31 | 3,37032 | -61,444 | 5BW-Ma | 31 |
| 9-Brazil | Flona de Anauá e arredores-Rorainópolis-RR | 28 | -0,9339 | -60,451 | 6BW-An | 28 |
| 10-Brazil | AMATA Flona do Jamari-RO | 8 | -9,4014 | -62,911 | 7BW-Ja | 8 |
| 11-Brazil | ESEC do Jarí | 15 | -0,4955 | -52,829 | 8BW-Jr | 15 |
| 12-Brazil | Resex Chico Mendes-Xapuri-AC (AMATA-Flona do Jamari) | 16 | -10,504 | -68,595 | 9BW-Xa | 16 |
| 13-Brazil | Resex Chico Mendes-Comunidade Cumaru-Assis-AC | 15 | -10,772 | -69,647 | 10BW-Co | 15 |
| 14-Brazil | FLONA Amapá-AP | 20 | 0,52785 | -51,128 | 11BE-Am | 20 |
| 15-Brazil | PARNA da Ana Avilhanas-AM | 11 | -2,5345 | -60,837 | 12BE-Av | 11 |
| 16-Brazil | Flona de Tapajós-PA | 27 | -2,8687 | -54,92 | 13BE-Ta | 27 |
| 17-Brazil | Resex Tapajós-Arapins-PA | 11 | -3,0792 | -55,278 | 14BE-Ar | 11 |
| 18-Brazil | FLONA Tefé-AM | 4 | -3,5248 | -64,972 | 15BE-Te | 4 |
| 19-Brazil | FLONA do Carajás | 23 | -6,0628 | -50,059 | 16BE-Ca | 23 |
| 20-Peru | Dpto Loreto, Maynas, El Napo, Huiririma Native Community | 26 | -2,4761 | -73,744 | 17PN-Hu | 26 |
| 21-Peru | Huaman Urco | 27 | -3,3128 | -73,198 | 18PN-Ur | 27 |
| 22-Peru | Dpto Loreto, Maynas, Las Amazonas, Est. Biológica Madreselva | 28 | -3,6312 | -72,233 | 19PN-Ma | 28 |
| 23-Peru | Dpto Loreto, Mayna, Iquitos, Comunidad Campesina Yarina | 28 | -3,827 | -73,567 | 20PN-Ya | 28 |
| 24-Peru | Allpahuayo | 2 | -3,9544 | -73,422 | ||
| 25-Peru | Dpto Loreto, Mar. Ramón Castilla, C. Poblado Unión Progresista | 27 | -3,9727 | -70,841 | 21PN-Pr | 29 |
| 26-Peru | Dpto Loreto, Requena, Jenaro Herrera Research Centre | 11 | -4,8966 | -73,646 | 22PN-Ce | 11 |
| 27-Peru | Jenaro Herrera | 25 | -4,9158 | -73,649 | 23PN-He | 25 |
| 28-Peru | Dpto Loreto, Alto Amazonas, Jeberos, Centro Poblado Jeberos | 26 | -5,2598 | -76,317 | 24PN-Je | 26 |
| 29-Peru | Shucushuyacu | 27 | -6,0199 | -75,854 | 25PN-Sh | 27 |
| 30-Peru | Dpto Ucayali, Cor. Portillo, Con. Forestal-Oxigeno para el Mundo | 29 | -8,8869 | -74,034 | 26PS-Po | 29 |
| 31-Peru | Dpto Ucayali, Padre Abad, Macuya Forestry Research Station | 30 | -8,8766 | -75,014 | 27PS-Pa | 30 |
| 32-Peru | Dpto Ucayali, Atalaya, Tahuania, Concesión Forestal-Javier Díaz | 29 | -9,9803 | -73,817 | 28PS-Di | 29 |
| 33-Peru | Dpto Ucayali, Atalaya, Raymondi, Comunidad San Juan de Inuya | 12 | -10,582 | -73,071 | 29PS-In | 12 |
| 34-Peru | Dpto Madre de Dios, Tahuamanu, Concesión Forestal Maderacre | 31 | -11,145 | -69,758 | 30PS-Md | 33 |
| 35-Peru | Ibéria | 2 | -11,299 | -69,524 | ||
| 36-Peru | Dpto Madre de Dios, P.N. Manu, Est. Biológica Cocha Cashu | 15 | -11,903 | -71,403 | 31PS-Ca | 15 |
| 37-Peru | Dpto Madre de Dios, Manu, Estación Biológica Los Amigos | 30 | -12,565 | -70,088 | 32PS-Am | 30 |
| 38-Peru | Dpto Madre de Dios, R. Nac. Tambopata, La Torre-Sandoval | 24 | -12,832 | -69,284 | 33PS-Ta | 24 |
| 39-Bolivia | Riberalta, MABET | 15 | -10,442 | -65,55 | 34Bo-Ri | 15 |
| 40-Bolivia | Riberalta, El Desvelo | 11 | -11,093 | -65,746 | 35Bo-De | 11 |
| 41-Bolivia | Cobija, Road - Bella Vista | 13 | -11,198 | -68,287 | 36Bo-Vi | 13 |
| 42-Bolivia | Riberalta, El Chorro | 5 | -11,514 | -66,327 | 37Bo-Ch | 5 |
| 43-Bolivia | Rurrenabaque, Área Protegida Madidi | 29 | -14,162 | -67,905 | 38Bo-Ma | 29 |
Table 2.
Genetic diversity for populations and countries for nSNPs (113) and CpMtSNPs (15) loci.
| nSNP | CpMtSNPs | |||||||||
| Sample | ||||||||||
| 1FG-Co | 32 | 122 | 50.4 | 0.023 | 0.028 | 0.005 | 16 | 6.7 | 0.012 | 45.3 |
| 2FG-Is | 29 | 190 | 69 | 0.109 | 0.197 | 0.25* | 17 | 13.3 | 0.017 | 62.5 |
| 3FG-Ro | 32 | 196 | 71.7 | 0.094 | 0.202 | 0.295* | 16 | 6.7 | 0.013 | 64.1 |
| 4FG-Ma | 28 | 195 | 72.6 | 0.148 | 0.254 | 0.286* | 16 | 13.3 | 0.009 | 65.7 |
| 5BW-Ma | 31 | 193 | 82.3 | 0.299 | 0.309 | 0.005 | 16 | 6.7 | 0.029 | 73.4 |
| 6BW-An | 28 | 195 | 70.8 | 0.291 | 0.292 | -0.022 | 15 | 0 | 0 | 72.7 |
| 7BW-Já | 8 | 207 | 80.5 | 0.194 | 0.298 | 0.198* | 17 | 13.3 | 0.036 | 72.6 |
| 8BW-Jr | 15 | 207 | 83.2 | 0.205 | 0.287 | 0.057 | 16 | 13.3 | 0.04 | 75 |
| 9BW-Xa | 16 | 204 | 72.6 | 0.278 | 0.29 | -0.021 | 16 | 6.7 | 0.016 | 75 |
| 10BW-Cu | 15 | 147 | 83.2 | 0.261 | 0.275 | 0.016 | 15 | 0 | 0 | 73.5 |
| 11BE-Am | 20 | 204 | 75.2 | 0.215 | 0.231 | 0.052 | 15 | 0 | 0 | 66.4 |
| 12BE-Av | 11 | 207 | 61.9 | 0.278 | 0.29 | -0.021 | 15 | 0 | 0 | 64.8 |
| 13BE-Ta | 27 | 197 | 83.2 | 0.261 | 0.275 | 0.016 | 15 | 0 | 0 | 74.2 |
| 14BE-Ar | 11 | 183 | 69 | 0.238 | 0.276 | 0.078 | 15 | 0 | 0 | 68 |
| 15BE-Te | 4 | 207 | 83.2 | 0.141 | 0.257 | 0.057 | 15 | 0 | 0 | 73.5 |
| 16BE-Ca | 23 | 190 | 81.4 | 0.275 | 0.282 | -0.019 | 15 | 0 | 0 | 75 |
| 17PN-Hu | 26 | 149 | 30.1 | 0.053 | 0.059 | 0.017 | 17 | 13.3 | 0.077 | 28.1 |
| 18PN-Ur | 27 | 147 | 31.9 | 0.06 | 0.066 | 0.018 | 17 | 13.3 | 0.098 | 29.7 |
| 19PN-Ma | 28 | 147 | 30.1 | 0.054 | 0.066 | 0.031 | 19 | 20 | 0.075 | 28.9 |
| 20PN-Ya | 28 | 147 | 30.1 | 0.059 | 0.064 | 0.024 | 16 | 6.7 | 0.034 | 27.4 |
| 21PN-Pr | 29 | 142 | 30.1 | 0.065 | 0.069 | 0.016 | 19 | 26.7 | 0.103 | 29.7 |
| 22PN-Ce | 11 | 146 | 25.7 | 0.043 | 0.065 | 0.072 | 15 | 0 | 0 | 22.7 |
| 23PN-He | 25 | 145 | 29.2 | 0.05 | 0.056 | 0.018 | 16 | 20 | 0.017 | 28.1 |
| 24PN-Je | 26 | 142 | 28.3 | 0.041 | 0.061 | 0.087* | 19 | 26.7 | 0.049 | 28.1 |
| 25PN-Sh | 27 | 147 | 26.5 | 0.047 | 0.053 | 0.028 | 14 | 0 | 0 | 23.4 |
| 26PS-Po | 29 | 146 | 30.1 | 0.046 | 0.075 | 0.087* | 16 | 6.7 | 0.009 | 27.4 |
| 27PS-Pa | 30 | 140 | 30.1 | 0.063 | 0.064 | 0.02 | 14 | 0 | 0 | 26.6 |
| 28PS-Di | 29 | 139 | 23.9 | 0.054 | 0.061 | 0.024 | 15 | 0 | 0 | 21.1 |
| 29PS-In | 12 | 213 | 23 | 0.056 | 0.061 | 0.017 | 15 | 0 | 0 | 20.3 |
| 30PS-Ma | 33 | 206 | 88.5 | 0.297 | 0.315 | 0.045 | 15 | 0 | 0 | 78.1 |
| 31PS-Ca | 15 | 213 | 82.3 | 0.271 | 0.31 | 0.073 | 15 | 0 | 0 | 72.7 |
| 32PS-Am | 30 | 209 | 88.5 | 0.312 | 0.317 | -0.01 | 15 | 0 | 0 | 78.1 |
| 33PS-Ta | 24 | 209 | 85 | 0.284 | 0.314 | 0.08 | 15 | 0 | 0 | 75 |
| 34Bo-Mb | 15 | 207 | 84.1 | 0.321 | 0.324 | -0.026 | 16 | 6.7 | 0.034 | 75 |
| 35Bo-De | 11 | 206 | 84.1 | 0.297 | 0.312 | -0.012 | 16 | 6.7 | 0.036 | 75 |
| 36Bo-Vi | 13 | 205 | 82.3 | 0.313 | 0.313 | -0.023 | 15 | 0 | 0 | 72.7 |
| 37Bo-Ch | 5 | 212 | 82.3 | 0.34 | 0.348 | -0.086 | 19 | 26.7 | 0.16 | 75.8 |
| 38Bo-Ma | 29 | 226 | 87.6 | 0.322 | 0.313 | -0.032 | 15 | 0 | 0 | 77.3 |
| Overall | 832 | 183 | 100 | 0.178 | 0.204 | 0.086* | 15.9 | 6.7 | 0.024 | 55.9 |
| F. Guiana | 121 | 200 | 76.1 | 0.095 | 0.192 | 0.506* | 18 | 20 | 0.013 | 69.5 |
| Brazil | 209 | 226 | 100 | 0.261 | 0.354 | 0.264* | 30 | 100 | 0.251 | 100 |
| Peru | 429 | 217 | 92.9 | 0.111 | 0.222 | 0.498* | 23 | 53.3 | 0.105 | 88.3 |
| Bolivia | 73 | 218 | 92.9 | 0.319 | 0.359 | 0.113* | 20 | 33.3 | 0.154 | 85.9 |
*P< 0.05; is the sample size; is the percent of polimorphic loci; is the percent of polimorphic loci for all 128 nCpMtSNPs; is the total number of alleles; and are the observed and expected heterozygosity; is the fixation index.
Table 3.
Genetic differentiation () among all populations, countries, populations within countries for all nCpMtSNPs (128), nSNPs (113), and CpMtSNPs (15).
Table 3.
Genetic differentiation () among all populations, countries, populations within countries for all nCpMtSNPs (128), nSNPs (113), and CpMtSNPs (15).
| Sample | nCpMtSNPs (128) | nSNPs (113) | CpMtSNPs (15) | |
| All populations | 38 | 0.484 ± 0.043* | 0.415 ± 0.032* | 0.942 ± 0.042* |
| Countries | 4 | 0.295 ± 0.036* | 0.233 ± 0.022* | 0.695 ± 0.144* |
| French Guiana | 4 | 0.12 ± 0.017* | 0.117 ± 0.017* | 0.011 ± 0.002 |
| Brazil | 12 | 0.299 ± 0.049* | 0.224 ± 0.03* | 0.925 ± 0.103* |
| Peru | 17 | 0.466 ± 0.056* | 0.456 ± 0.056* | 0.741 ± 0.267* |
| Bolivia | 5 | 0.142 ± 0.034* | 0.107 ± 0.024* | 0.735 ± 0.383* |
* P< 0.05; is number of populations; ± is the 95% standard error, 1.96SE.
Table 4.
Corrected group and individual self-assignment rate and scores for population and countries (mean scores) for all 128 nCpMtSNPs and mean score for wrong assignment and geographic distance (D, km) from correct population.
Table 4.
Corrected group and individual self-assignment rate and scores for population and countries (mean scores) for all 128 nCpMtSNPs and mean score for wrong assignment and geographic distance (D, km) from correct population.
| Group (%) | Correct individual rate (%) | Score (%) | ||||||
| Rate | Score | Rate total |
Score | Rate >80% |
Rate >95% |
Wrong | D (km) | |
| 1FG-Co | 100 | 100 | 100 | 100 | 100 | 100 | 0 | 0 |
| 2FG-Is | 100 | 100 | 34.5 | 94.1 | 27.6 | 27.6 | 92.8 | 87 |
| 3FG-Ro | 100 | 100 | 30.5 | 90.2 | 30.5 | 16.7 | 69.1 | 134 |
| 4FG-Ma | 100 | 100 | 60.7 | 98.8 | 57.1 | 57.1 | 100 | 29 |
| 5BW-Ma | 100 | 100 | 100 | 99.8 | 100 | 100 | 0 | 0 |
| 6BW-An | 100 | 100 | 100 | 100 | 100 | 100 | 0 | 0 |
| 7BW-Já | 100 | 100 | 73.3 | 95.6 | 73.3 | 66.7 | 88.8 | 203 |
| 8BW-Jr | 100 | 100 | 100 | 99.6 | 100 | 96.4 | 0 | 0 |
| 9BW-Xa | 100 | 100 | 100 | 99.8 | 100 | 100 | 0 | 0 |
| 10BW-Cu | 100 | 100 | 100 | 98.7 | 96.3 | 92.6 | 0 | 0 |
| 11BE-Am | 100 | 100 | 100 | 100 | 100 | 100 | 0 | 0 |
| 12BE-Av | 100 | 100 | 100 | 99.8 | 100 | 100 | 0 | 0 |
| 13BE-Ta | 100 | 100 | 95.7 | 98.7 | 95.7 | 95.7 | 70.5 | 591 |
| 14BE-Ar | 100 | 100 | 100 | 99.7 | 100 | 100 | 0 | 0 |
| 15BE-Te | 100 | 100 | 100 | 100 | 100 | 100 | 0 | 0 |
| 16BE-Ca | 100 | 100 | 100 | 99.8 | 100 | 100 | 0 | 0 |
| 17PN-Hu | 100 | 100 | 69.2 | 68 | 30.8 | 11.5 | 49.9 | 299 |
| 18PN-Ur | 100 | 100 | 70.4 | 63.0 | 25.9 | 11.1 | 47.6 | 211 |
| 19PN-Ma | 100 | 100 | 75 | 69.7 | 39.3 | 21.4 | 60 | 287 |
| 20PN-Ya | 100 | 100 | 89.3 | 64.6 | 35.7 | 14.3 | 45.7 | 174 |
| 21PN-Pr | 100 | 100 | 86.2 | 80.3 | 55.2 | 34.5 | 57.5 | 131 |
| 22PN-Ce | 100 | 100 | 81.8 | 59.3 | 18.2 | 18.2 | 50 | 155 |
| 23PN-He | 100 | 100 | 68 | 60.5 | 24 | 12 | 65.1 | 178 |
| 24PN-Je | 100 | 100 | 65.4 | 59.6 | 15.4 | 7.7 | 55 | 146 |
| 25PN-Sh | 100 | 100 | 88.9 | 66.4 | 29.6 | 7.4 | 47 | 237 |
| 26PS-Po | 100 | 100 | 72.4 | 79.8 | 41.4 | 13.8 | 49.7 | 236 |
| 27PS-Pa | 100 | 100 | 80 | 71.5 | 43.3 | 13.3 | 56.7 | 247 |
| 28PS-Di | 100 | 100 | 93.1 | 74.9 | 55.2 | 13.8 | 58.4 | 283 |
| 29PS-In | 100 | 100 | 45.5 | 70.8 | 36.4 | 18 | 53.5 | 208 |
| 30PS-Ma | 100 | 100 | 97 | 97.2 | 93.9 | 81.8 | 94.1 | 129 |
| 31PS-Ca | 100 | 100 | 93.3 | 97.1 | 93.3 | 80 | 76.7 | 147 |
| 32PS-Am | 100 | 100 | 96.7 | 97.7 | 93.3 | 93.3 | 45.5 | 270 |
| 33PS-Ta | 100 | 100 | 95.8 | 98.9 | 95.8 | 91.7 | 92.7 | 85 |
| 34Bo-Mb | 100 | 100 | 93.3 | 99.8 | 93.3 | 93.3 | 97.8 | 29 |
| 35Bo-De | 100 | 100 | 100 | 100 | 100 | 100 | 0 | 0 |
| 36Bo-Vi | 100 | 100 | 100 | 97.1 | 100 | 83.3 | 0 | 0 |
| 37Bo-Ch | 100 | 100 | 100 | 100 | 100 | 100 | 0 | 0 |
| 38Bo-Ma | 100 | 100 | 100 | 98.7 | 96.6 | 93.1 | 0 | 0 |
| Overall | 100 | 100 | 85.7 | 91.0 | 71.0 | 62.3 | 70.3 | 174 |
| F. Guiana | 100 | 100 | 48.8 | 98 | 46.3 | 46.3 | 96.9 | - |
| Brazil | 100 | 100 | 97.6 | 99.2 | 97.6 | 97.6 | 87.5 | - |
| Peru | 100 | 100 | 82.3 | 74.9 | 49.2 | 31.9 | 53.1 | - |
| Bolivia | 100 | 100 | 98.6 | 98 | 94.5 | 91.8 | 68.6 | - |
Disclaimer/Publisher’s Note: The statements, opinions and data contained in all publications are solely those of the individual author(s) and contributor(s) and not of MDPI and/or the editor(s). MDPI and/or the editor(s) disclaim responsibility for any injury to people or property resulting from any ideas, methods, instructions or products referred to in the content. |
© 2024 by the authors. Licensee MDPI, Basel, Switzerland. This article is an open access article distributed under the terms and conditions of the Creative Commons Attribution (CC BY) license (http://creativecommons.org/licenses/by/4.0/).
Copyright: This open access article is published under a Creative Commons CC BY 4.0 license, which permit the free download, distribution, and reuse, provided that the author and preprint are cited in any reuse.