Submitted:
24 May 2024
Posted:
28 May 2024
You are already at the latest version
Abstract
Human milk (HM) feedings are associated with reduced risks of neurodevelopmental and neurocognitive delays and systemic inflammatory diseases in infants born prematurely and/or at a low birth weight. Utilizing a neonatal piglet model, HM feedings were compared to bovine milk-derived infant formula (IF)-feedings with the aim of understanding the underlying mechanisms involved in reducing these risks. Six male piglets at postnatal-day (PD)2 were randomized into two feeding groups: HM-fed (n = 3) or IF-fed (n = 3) for 28 days. At 3- and 4-weeks-old, piglet memory and learning performance were assessed using novel object recognition (NOR). At PD30 piglets were euthanized, and whole brains were excised, weighed, and preserved for further analyses, and brain microglial morphology, and systemic inflammatory cytokines were quantified. During NOR, HM-fed piglets had significantly more non-novel revisits at both 3- and 4-weeks-old compared to IF-fed piglets. Microglia of HM-fed piglets had longer processes, more branch points, more endpoints, and a larger territorial volume compared to IF-fed piglets at PD30. In a neonatal piglet model, HM-feedings may improve cognition and reduce brain inflammatory response compared to IF-feedings.
Keywords:
human milk
; infant formula
; neurodevelopment
; cognition
; microglia
; inflammation
; neonatal piglet
1. Introduction
Infants born prematurely (< 37 weeks gestation) and/or at a lower birth weight are at an increased risk of morbidities, acute and chronic neurodevelopmental and motor delays, and mortality [1,2,3,4,5,6]. Neurodevelopmental deficits may occur in preterm infants because they are born during a period of rapid neuronal and glial cell migration, growth, and maturation with changes in overall brain organization [7,8,9,10,11,12,13]. Human milk (HM) consumption has been correlated with a reduced risk for these morbidities. Additionally, HM feedings in preterm and term infants are associated with increased feeding tolerance, greater cognitive development, and higher IQ scores up to seven years of age compared with infant formula (IF) feedings [14,15,16,17,18,19,20,21]. However, most of these studies are observational and include a number of confounding variables, such as caregiver education, maternal/paternal IQ and age, and socioeconomic status, that may impact the decision to, and duration of, feeding an infant HM [22,23,24]. Randomized controlled feeding trials and the acquisition of tissue samples in non-diseased infants have obvious ethical limitations making animal models necessary to understand neurodevelopmental mechanisms in relation to feeding. The neonatal piglet model is ideally suited for developmental studies due to gastrointestinal (GI) and neurological developmental similarities and high genetic homology with human infants [25,26].
The protective effects of HM on the developing GI system are most pronounced in preterm infants. These infants are at high risk for neonatal inflammatory diseases, including necrotizing enterocolitis (NEC), sepsis, and chronic lung disease [5,15,27,28,29]. These inflammatory disorders may lead to severe systemic inflammatory responses and blood-brain and blood-cerebrospinal fluid barrier disruptions, ultimately causing neuroinflammation and long-term cognitive impact [30,31,32]. Neuroinflammation may result in white matter injury due to apoptosis and subarachnoid hemorrhage-associated blood-brain barrier disruption that may be related to changes in microglial phenotypes [31,32,33]. This damage in early life may increase the risk of neurodevelopmental disorders, such as bipolar disorder, autism, cerebral palsy, and schizophrenia [34,35,36,37].
The primary neurodevelopmental processes in the early postnatal period of neurodevelopment are oligodendrocyte maturation and myelination of axons [38,39]. During development, microglia are closely associated with oligodendrocytes and phagocytose myelin sheaths [40,41]. However, microglia also eliminate cells and/or myelin in response to injury or disease [42,43]. These disease-related processes can be induced by inflammatory stimuli in the brain, which could disrupt normal developmental processes, including neurogenesis, oligodendrogenesis, neuronal migration, and myelination of axonal tracts due to aberrant pruning/phagocytosis [44].
To assess neurodevelopment in a neonatal piglet model, a commonly used test is novel object recognition (NOR; [45,46]). The purpose of NOR testing is to utilize the innate exploratory nature of animals to assess memory of an object they have been previously exposed to (a familiar object; [45]). If an animal can remember this familiar object, then introducing a novel object should result in the animal spending more time with the new object [45].
The question remains whether the improved cognitive outcomes associated with early HM feeding exposure, compared with IF feeding, involve reducing chronic low-grade systemic inflammation and subsequently minimizing neuroinflammation. In this pilot study, we hypothesized that HM feedings would lead to neurodevelopmental and neurocognitive improvements through decreasing systemic inflammation, thus reducing neuroinflammation compared to bovine milk-derived infant formula (IF) feedings in a neonatal piglet model.
2. Materials and Methods
2.1. Animals and Animal Care
Three Yorkshire-Duroc cross male neonatal piglet pairs (n=6) at postnatal day (PD)2 were obtained from a local swine producer (Colfax, WA). Due to significant differences in male and female development, baseline microglia morphology and inflammation during development, and potentially worse health prognosis/outcomes in males, we focused on male piglets in this study [47,48,49,50]. Male littermates were randomly assigned as pairs into the two feeding groups upon arrival and received 28 days of assigned feedings: unpasteurized HM (n = 3) or bovine milk-derived IF (n = 3). The HM feedings included donated HM from 14 different mothers. HM donations were kept at –80°C followed by being thawed at 4°C for 20 to 22 hours, homogenized to improve the generalizability of study results, and refrozen into individual three-liter volumes at –80°C to avoid excess freeze-thaw cycles during daily food preparation. Piglets were housed in clean individual rearing units (PD2 to PD15: L 30” x W 18.4” x H 20”; PD16 to PD30: L 30” x W 38.5” x H 20”) located at the University of Idaho Piglet Intervention Center (PInC™). Lights were turned on at 0800 hours and were turned off at 2100 hours each day. The PInCTM facility thermostat was set to maintain a temperature of 26.67°C (80°F) with each rearing unit containing a heat lamp set to maintain an enclosure temperature between 30°C - 34°C (86-93.2°F; optimal temperature for neonatal piglets) [51,52]. Piglets were assessed daily, including measurement of weight (kg), girth (cm), activity level, and waste outputs. Piglets were given a clean, small towel daily for enrichment.
Piglet daily morning weight was used to determine estimated nutritional needs and HM or IF feedings were isocaloric (kcal/kg) and isonitrogenous (g/kg; Table S1; [53,54,55,56,57,58]). Both HM and IF-feeding regimens included whey protein isolate (WPI; including lysine), vitamin and mineral supplements (VMS), and DI water to meet additional macro- and micronutrient requirements for piglets [53,54,55,56,57,58]. Once bulk HM (un-supplemented) for daily HM feeds was thawed, it was used within 48 hours or discarded. Daily prepared HM and IF feeds (with supplemental nutrients) were used or discarded within 24 hours. Piglets were fed three times per day. This study was approved under protocol number IACUC-2020-56 from the University of Idaho Institutional Animal Care and Use Committee.
2.2. Functional Neurocognitive Assessment: Novel Object Recognition (NOR)
At 3-weeks-old (PD18-22) and 4-weeks-old (PD25-29), piglets underwent NOR testing to assess functional learning and memory differences between the two feeding groups (HM vs. IF). Piglets underwent NOR testing in a separate room from piglet housing to minimize distractions. Testing occurred within a 6’ (w) x 6’(l) x 3’ (h) stainless-steel arena with Tenderfoot® (Tandem Products, Inc., Minneapolis, MN, USA) flooring during daylight hours after the first piglet feeding of the day. Testing was video recorded and analyzed using EthoVision XT version 17 (Noldus, Wageningen, Netherlands).
The NOR procedure was followed as outlined by Fleming & Dilger (2017) [46] and NOR testing was conducted through four phases: habituation, familiarization, novel testing, and control. Each piglet per week of testing underwent two habituation trials, one familiarization trial, three novel trials (randomized 5 min, 1 hr, and 24 hr delay following familiarization), and two control trials (Figure 1a). The habituation phase involved two 10 minute trials over two consecutive days (one trial per day) where the piglet was placed into the empty arena without any objects. The open arena habituation phase was conducted to familiarize the piglets with the arena prior to conducting any cognitive testing.
The day after the habituation phase, piglets were exposed to two identical objects for 5 minutes in the familiarization phase. Piglets were removed from the arena and then there was a randomized time delay (5 minutes, 1 hour, or 24 hours) before the novel testing phase began. The novel testing phase involved exposing piglets to one of the previously exposed objects from the familiarization phase (the familiar object) and a novel object of similar color and texture for 5 minutes (Figure 1b). Placement of the novel object (on the left or right side of the arena) was counterbalanced between trials to prevent an innate object location preference. The novel testing phase was repeated until each piglet had been tested at 5 minutes, 1 hour, and 24-hour delays in a random order. For example, for one week of testing for one piglet, they would have undergone one familiarization phase trial followed by three novel testing phase trials with the order of novel delay randomized (5 minutes, 1 hour, and 24 hours; 5 minutes, 24 hours, and 1 hour; 1 hour, 5 minutes, and 24 hours; 1 hour, 24 hours, and 5 minutes; 24 hours, 5 minutes, and 1 hour; 24 hours, 1 hour, and 5 minutes).
The day after the last novel testing phase delay, two control trials (both occurred in one day) were conducted for 5 minutes per trial. For each trial piglets were exposed to two object pairs of similar color, but different shape. These object pairs were the same objects used for the novel testing phase, but they occurred on opposing weeks of the novel testing phase (
Figure 1
b). Control phase trials were used to determine if any innate object preference (such as color, texture, shape, etc.) could influence the innate novelty preference in the novel testing phase.
Piglet exploration of objects (familiar and novel) included detection of the object itself as well as a 15 cm boundary around the object. Object pairs were green, red, yellow, and blue (
Figure 1
b). NOR object pairs 1-2 (green and red) were used in week 3 and object pairs 3-4 (yellow and blue) were used in week 4 of the novel testing phase. HM piglets were exposed to object pairs green and yellow and IF piglets were exposed to object pairs red and blue during the novel testing phase. Only the familiar objects were used during the familiarization phase. Object pairs 3-4 were used in week 3 of control phase testing and object pairs 1-2 were used in week 4 of novel phase testing.
2.3. Euthanization and Sample Collection
At the end of the 28-day feeding trial (PD30), piglets were anesthetized with telazol/xylazine (9.3 mg/kg) via intramuscular injection. Once anesthetized, piglets were weighed followed by cardiac puncture to obtain systemic blood samples and euthanized with pentobarbital sodium (1 mL/4.55 kg; Fatal Plus; Veterinary Laboratories, Inc, Lenexa, KS). Blood samples were collected in heparinized vacutainers followed by centrifugation at 3500 g for 15 minutes at 4°C. Plasma was transferred into 3 mL cryotubes and stored at -80°C until analysis. Following euthanasia, a craniotomy was performed and whole brain tissue including brain stem was removed, weighed, and fixed in 10% neutral buffered formalin (NBF) for 48 hours at 4°C. Gross brain weights were normalized based on PD30 piglet weight (g/kg body weight) and compared across feeding groups. Following initial fixation, brains were hemisected and brainstems were removed. Tissues were re-fixed in 10% NBF for 48 hours then washed with phosphate-buffered saline (PBS) and stored in PBS plus 0.01% sodium azide and transported to the University of Washington on ice (Department of Neurology, Seattle, WA). Tissue embedding, sectioning, immunofluorescence, and morphology was performed at the University of Washington. Microglial stereology and morphology was used to determine morphological differences that may be related to neuroinflammation in the feeding groups.
2.4. Quantification of Microglial Morphology
Brain sections were processed as outlined by Kajimoto et al. (2020; [59]). A one-centimeter cube section of the right prefrontal cortex was dissected out and cryo-protected in sequential 10%, 20%, and 30% sucrose prior to embedding in optimal cutting temperature (OCT) compound and flash-frozen. Tissue was sectioned at 20 µm on a cryostat and stored at -20°C until staining. Tissue was blocked with 10% donkey serum and 0.1% Triton-X for 30 minutes prior to immunostaining. Tissue was incubated overnight at 4°C with a pan-myeloid marker for microglia goat anti-Iba1 (1:500; Abcam, Waltham, MA), washed, and incubated for 2 hours at RT with donkey anti-goat conjugated to AF-488 (1:500; Abcam), and stained with DAPI (1:1000; Sigma, Burlington, MA; [60,61,62]). Sections with randomized gray matter sampling of 30-45 fields of view and 1 um z-stacks from each section were then imaged through fluorescence microscopy (Marianas imaging system, Intelligent Imaging Innovations, Inc. [3i], Denver, CO), using a Zeiss Axiovert 200 M microscope (Zeiss, Oberkochen, Germany) and Slidebook software (Slidebook, Denver, CO) and quantified within each region of interest using MATLAB software version 2021a (The MathWorks, Inc., Natick, MA) using standard stereological methods [63,64]. Analysis of microglial morphology was performed using the MATLAB script 3D-Morph [64] to measure average branch length (um), number of branch points, number of endpoints, cell complexity index, cell volume (um3), and territorial volume (um3).
2.5. Systemic Inflammatory/Anti-inflammatory Markers
Systemic inflammatory status was assessed by measuring concentrations of serum cytokines (TNF-α, IL-1β, IL-6, IL-8, and IL-10) using enzyme-linked immunosorbent assay following manufacturer recommendations (QuantikineⓇ ELISA; R&D Systems, Inc., Minneapolis, MN, USA). Samples for ELISAs were measured in duplicate with both positive and negative controls. Samples below the level of detection were inputted as the lowest level of detection divided by two.
2.6. Statistical Analysis
2.6.1. NOR Cognitive Testing
NOR data was obtained from EthoVision XTTM version 17 (Noldus), and NOR statistical analyses were conducted using R software version 4.3 [65]. Of 90 recorded trials collected for NOR, six were excluded (remaining n = 84 total trials). Exclusion criteria for NOR trials included any trials where piglets managed to remove objects from their bolted station and trials lost due to video media loss. Trials were stratified into the following categories after exclusion: 23 habituation trials, 12 familiarization sample object trials, 34 novel object trials, and 21 control trials. Missing observations accounted for 4.2% of the habituation phase, 5.6% of the novel testing phase, and 12.5% of the control phase.
A discrimination index variable (DI) was calculated as DI = (TN-TF)/(TN+TF), where TN = the time spent exploring the novel object(s) and TF = the time spent exploring the familiar sample object(s). Positive values of DI indicate more time spent exploring the novel object and negative values indicate more time spent exploring the familiar sample object as defined previously by Antunes and Biala (2012; [45]). Zero means null or no preference between the two objects.
The novel and control trial variables were analyzed using a general linear mixed model where feeding group (HM or IF) and age (3 weeks or 4 weeks) were fixed effects, and piglet subject, phase time delay, and toy color were random effects. All pairwise interactions and the three-way interaction were also included as fixed effects. Count variables (novel visits, fam visits, and novel revisits) were analyzed using the same independent variables as a generalized linear model with a Poisson distribution and a log link function. The habituation trial variables included group, age and group-by-age interaction as fixed effects and piglet subject as a random effect. Count variables (border and center visits) were also analyzed using a generalized linear model with a Poisson distribution and log link function. Linear modeling was conducted using the ‘Ime4’ package; ANOVA was conducted using ‘ImerTest’ and ‘car’ packages for general and generalized linear models, respectively [66,67]. Models were evaluated for assumptions of equal variance, normality and independence, and identical distribution of the error terms by inspecting plots of residuals.
2.6.2. Piglet Body Weights, Brain Morphology, and Systemic Cytokines
All piglet body weight measurements (PD2, PD30, and average daily percentage of weight gain), normalized brain weight, and systemic cytokine (IL-6, IL-8, IL-10, TNF-α, and IL-1β) data were analyzed using R software version 4.3 [65]. Variance between HM and IF groups were assessed through F tests. Normality of data distribution was assessed using Shapiro-Wilk’s normality test.68 If data was normally distributed, independent samples t-tests were run. If data was non-normally distributed, Mann-Whitney U tests were used. Microglial morphological statistics were performed using GraphPad Prism version 8 (GraphPad Software, La Jolla, CA, USA) utilizing t-tests for group comparisons.
For all statistical analyses, significance was set at p-values < 0.05 with a confidence level of 95%.
3. Results
3.1. Piglet Weights
Baseline (PD2) mean piglet weight was 1.517 ± 0.204 kg (n=6 males; HM=3 & IF=3) with no differences in PD2 weight between feeding groups (HM: 1.500 ± 0.100 kg; IF: 1.533 ± 0.306 kg, p = 0.866; Figure 2a). At PD30, piglets weighed 5.900 ± 2.252 kg with a pattern towards IF-fed piglets weighing more than HM-fed (IF: 7.467 ± 2.303 kg; HM: 4.367 ± 0.416 kg; p = 0.083; Figure 2b). Additionally, IF-fed piglets had a significantly higher daily percentage of weight gain compared to HM-fed (IF: 5.924 ± 0.563 %; HM: 3.984 ± 0.265 %; p = 0.006; Figure 2c).
3.2. Cognitive Function – NOR Testing
3.2.1. NOR Habituation Phase
When comparing piglets by age, piglets traveled more distance (p < 0.001) and spent more time moving (p =0.037) regardless of diet at 3-weeks-old compared to 4-weeks-old (Figure 3a-b; Table 1). Additionally, there were age and nutritional group-by-age interaction differences in total time spent in the center of the arena, at the borders of the arena, and the number of border visits (Figure 3c-e; Table 1). HM-fed piglets spent less time in the center of the arena at 3-weeks-old compared to 4-weeks-old whereas IF-fed piglets spent more time in the center at 3-weeks-old vs. 4-weeks-old (age: p =0.003; nutritional-group-by-age: p < 0.0001). As expected, when piglets spent more or less time in the center the opposite was true for time spent on the borders of the arena (age: p =0.002; nutritional-group-by-age: p < 0.0001). Lastly, HM-fed piglets had less border visits at 3-weeks-old compared to 4-weeks-old whereas IF-fed piglets had more border visits at 3-weeks-old compared to 4-weeks-old (age: p =0.015; nutritional-group-by-age: p < 0.0001).
3.2.2. NOR Novel & Control Testing Phases
When examining piglets by age (3-weeks-old or 4-weeks-old), HM-fed piglets and IF-fed piglets had more novel object visits at 4-weeks-old compared to 3-weeks-old during the novel testing phase (p = 0.001; Figure 4a; Table 1). However, for the control phase HM-fed piglets continued to have more novel object visits at 4-weeks old compared to 3-weeks-old, but IF-fed piglets had less novel object visits at 4-weeks-old compared to 3-weeks-old (nutritional-group-by-age interaction: p < 0.001; Figure 4h; Table 1). For familiar object visits, there was a significant interaction between nutritional group and age during the novel testing phase (p = 0.002; Figure 4b; Table 1). Both HM-fed and IF-fed piglets during the novel testing phase showed less familiar object visits at 4-weeks-old compared to 3-weeks-old (age: p < 0.0001; Figure 4b; Table 1). IF-fed piglets had significantly more familiar object visits compared to HM-fed piglets at 3-weeks-old during the novel testing phase (nutritional group: p = 0.036). There were no significant results for familiar object visits during the control testing phase (Figure 4i; Table 1) and there were no significant results for novel object revisits in both the novel and control testing phases (Figure 4c,j; Table 1).
For non-novel (center, border, and familiar object) revisits during the novel testing phase, HM-fed piglets had more non-novel revisits compared to IF-fed piglets at both 3-weeks-old and 4-weeks-old (nutritional group: p = 0.033; Figure 4d; Table 1). This was also true during the control testing phase (nutritional group: p = 0.001; Figure 4k; Table 1). Both HM-fed and IF-fed piglets had less non-novel revisits at 4-weeks-old compared to 3-weeks old during the novel testing phase (age: p = 0.023; Figure 4d; Table 1). However, during the control phase IF-fed piglets had more non-novel revisits at 4-weeks-old compared to 3-weeks-old whereas HM-fed piglets still had less non-novel revisits at 4-weeks-old compared to 3-weeks-old (age: p = 0.010; Figure 4k; Table 1).
There were no significant results for total time with the novel or familiar object during both novel and control testing phases (Figure 4e,l,f,m; Table 1). Lastly, there were no significant results for the discrimination index (DI; novel vs. familiar sample object ratio where a positive value indicates more time spent with the novel object) during both the novel and control testing phases (Figure 4g,n; Table 1). However, there was a pattern towards piglets at 4-weeks-old compared to 3-weeks-old moving towards null toy preference during the control phase (age: p = 0.072; Figure 4n; Table 1).
3.3. Piglet Brain Weights
At PD30, mean gross piglet brain weight was 52.500 ± 3.564 g and normalized brain weight was 9.714 ± 3.386 (g/kg of body weight). Normalized brain weight for HM-fed piglets was not statistically different from IF-fed piglets (HM: 11.835 ± 2.449; IF: 7.593 ± 3.029; p = 0.132; Figure S1).
3.4. Piglet Microglial Morphology
When comparing HM-fed and IF-fed piglets at PD30, HM-fed prefrontal cortex microglia had significantly longer processes (p < 0.0001), more branch points (p < 0.0001), and more endpoints (p < 0.0001; Figure 5a-c) compared with IF. Cell volume (p < 0.1001) and complexity index score (p < 0.1136) were non-significant between the groups (Figure 5d-e). However, the territorial volume of microglial in HM-fed brains was significantly larger than that patrolled by microglia in IF-fed brains (p < 0.0010; Figure 5f).
3.5. Systemic inflammatory/Anti-inflammatory Markers
When comparing HM-fed and IF-fed piglets at PD30, there were no significant differences in systemic cytokine levels (TNF-α, IL-1β, IL-6, IL-8, & IL-10 pg/mL; see Supplemental Information, Figure S2).
4. Discussion
This pilot study was conducted to assess the feasibility of using the neonatal piglet model to examine the effects of HM vs. IF on neurodevelopment. Due to the obvious ethical and tissue accessibility considerations involved in assigning specific feeding regimens in infant neurodevelopmental and neurocognitive studies, as well as potential neuroinflammation, a neonatal piglet model was used. This was the first study to compare HM vs. IF nutritional interventions utilizing different neurodevelopmental measures in term piglets from postnatal day (PD)2 to PD30.
For perspective, the serotonergic neurological system (an autonomic brainstem process that includes the regulation of cognition, mood, respiration, and the waking state) in a piglet at PD4 is approximately equivalent to about a one-month-old infant, PD12 to a four-month-old infant, and PD30 to a six-month-old infant [69]. Moreover, one week of piglet total brain volume growth is equivalent to about one month of infant total brain volume growth [70]. Utilization of a neonatal piglet model allows for shorter experimental feeding periods to examine the effect of early life feeding on brain development relevant to human infants.
At PD18 to PD22 (3-weeks-old) and PD25 to PD29 (4-weeks-old), the piglets in this study underwent NOR functional cognitive assessment. While the majority of significant results were not related to dietary exposure on its own, these results were useful to assess open field behavior in piglets. Previous studies in piglets have shown that when exhibiting anxiety, piglets move away from open spaces (center of an arena) and may seek the borders of the arena as a means of escape [46,71,72]. Moreover, piglet stress is reflected in open arena movements: low mobility (freezing behaviors) or high mobility (as a means of finding a way out of the area; [72,73]). Therefore, a piglet experiencing stress would spend more time on the borders of the arena as a means of trying to escape instead of staying in the center.
The results of this study may indicate less anxiety in both HM-fed and IF-fed piglets at 4-weeks-old compared to 3-weeks old as shown by significantly less total distance traveled and less total time moving (Figure 3a-b). This may be related to age (a more developed brain) and arena habituation over time. Furthermore, HM-fed piglets explored more at 4-weeks-old than 3-weeks-old as reflected by spending more time in the center of the area; whereas IF-fed piglets actually spent less time in the center of the arena at 4-weeks-old compared to 3-weeks-old (Figure 3c). Previous studies on male piglet brain development have shown that total brain volume, cortex, diencephalon, cerebellum, and brainstem reach their max growth rate at around 4 to 5 weeks of age.74 Our findings may reflect both increased brain maturation (4-weeks-old vs. 3-weeks-old) and/or impact of different feeding types, with HM-fed piglets at 4-weeks-old being less fearful of arena exploration than IF-fed piglets.
While we observed some interactions between dietary regimen and age, there were some dietary findings that may have clinical significance and contribute toward improving future studies. There was a significant dietary group difference between HM-fed piglets and IF-fed piglets during non-novel (center, border, and familiar object) revisits. During novel phase testing, both HM-fed and IF-fed piglets had fewer non-novel revisits at 4-weeks-old compared to 3-weeks-old, but HM-fed piglets had much higher revisits at both 3 and 4-weeks-old compared to IF-fed piglets (Figure 4d). This may indicate more exploratory behavior overall in HM-fed piglets compared to IF-fed piglets. Moreover, although not statistically significant, HM-fed piglets showed overall more novel object visits and more time with novel objects at 4-weeks compared to 3-weeks-old in the novel phase. In contrast, IF-fed piglets exhibited less novel object visits and less time with novel objects at 4 and 3-weeks-old in comparison to HM-fed piglets (Figure 4a,e). This may suggest a greater impact of a HM-fed diet on memory performance than age-related brain development alone. In a human observational study by Belfort et al., (2016), HM intake > 50% in the first 28 days of life in very preterm infants was associated with higher IQ, working memory, and motor function at 7 years of age and a larger volume of both deep nuclear gray matter and hippocampus at term equivalent age [75]. Due to the Belfort et al. (2016) study being observational in nature, it was not possible to fully control confounding variables such as caregiver age, IQ, education, and socioeconomic status. However, our study supports their findings without these confounding variables.
Although HM-fed vs. IF-fed piglets at PD30 were not statistically different in body weight, there was a pattern towards HM-fed piglets having smaller body weights compared with IF-fed counterparts that may be clinically significant (Figure 2b). Moreover, IF-fed piglets had a significantly higher daily percentage of weight gain throughout the study compared to the HM-fed piglets (Figure 2c). This finding also aligns with clinical observations that HM-fed infants weigh less than IF-fed infants from at least three to eight months of age [76,77]. Despite HM-fed piglets having smaller body weights, they had greater normalized brain weights (brain volume per kg of body weight) than IF-fed piglets, which may also have clinical significance (Figure S1). There is a similar pattern seen in infant MRI studies where HM-fed infants also have higher volumes of total white matter (including frontal and temporal regions), subcortical gray matter, and parietal lobe cortical thickness compared to formula-fed infants at two years old and even into adolescence [78,79,80].
Moreover, we saw significant differences in prefrontal cortex microglia between HM-fed and IF-fed piglets (Figure 5). HM-fed brains had microglia with characteristics indicative of a less activated phenotype - longer process lengths, more complex processes (more branch points and end points) - compared to microglia in IF-fed piglets (Figure 5). Other features, such as cell volume, were not significantly different between feeding groups. One possible explanation for these findings is that if low-grade inflammation is present, it may not be sufficient to dramatically drive profound morphological shifts observable given the limited sample number. Of further consideration is the role of microglia during neurodevelopment, including phagocytosis, thus microglia in the developing brain may have a more activated phenotype and transcriptome than microglia in healthy adult brains [81,82,83]. These subtle shifts in the piglets require a larger sample size to elucidate. Furthermore, while microglial morphology correlates well with activation state and function [64,84], there are other parameters that remain to be investigated such as transcriptomics that would provide more information on microglial responses in each feeding group. Future research is necessary to determine microglial proliferation and activation states as well as levels and types of inflammatory cytokines within the brain.
Although the systemic cytokines (IL-6, IL-8, IL-10, IL-1β, and TNF-α) from piglet blood plasma did not result in statistically significant results, this study showed patterns in HM-fed piglets having higher concentrations of IL-1β compared to IF-fed piglets (Figure S2). It is important to note that while IL-1β is typically released in response to infection and injury [85,86], it is also an immune cell mediator within the brain produced by glial cells and found in high abundance within the hippocampus [87,88,89]. IL-1β may be involved in synaptic plasticity with higher gene expression during long term potentiation processes involving learning and memory maintenance [90,91]. Long term potentiation is necessary for the strengthening of synaptic processes [92]. It is possible that HM-fed piglets had higher levels of IL-1β in this study due to more memory consolidation compared to IF-fed piglets.
There are also known sex differences in baseline inflammatory states. Males appear to have more activated microglia than females based on morphology [93]. While this is necessary for brain masculation during development, it may result in a higher baseline state of inflammation than females. Therefore, if feeding interventions, such as HM, decrease systemic inflammation, then this may impact males more greatly than females.
Due to the pilot nature of this study, study design and results were used to determine the feasibility of a larger study and to generate preliminary data to further future research efforts that are adequately powered. Many potentially significant clinical trends were seen, and a larger sample size will help to determine whether these differences will become statistically significant. We conducted a power analysis using the NOR data which indicated a sample size of n = 15 to 20 per feeding group would provide adequate statistical power to detect statistically significant and biologically meaningful differences between groups. Other limitations of this study involved uncontrollable variables related to the acquisition of piglets, NOR procedure, and microglial morphology. Piglets were obtained on PD2; however, it was difficult to quantify the actual volume of sow colostrum consumed and the exact postnatal age (in hours) of the piglet. Only date of birth, but not hour of birth, was listed at purchase. Both colostrum intake and postnatal age may have influenced overall piglet immune status. Furthermore, the NOR functional cognitive procedure may have been too strenuous for the piglet subjects. Piglets appeared less interested in both familiar and novel objects when randomization of trials results in more than two trials in one day (i.e. familiarization trial, 5 minute delay, and 1 hour delay). This may have impacted how much they visited the novel object leading to less accurate results. However, this pilot study provided data for NOR procedure improvements in future studies.
Future studies can improve these findings by increasing the sample size, simplifying NOR procedure (minimizing the number of novel object delay trials and the number of different colored objects) and having more precise PD age and colostrum consumption. Moreover, future studies will include microglial morphological comparisons between feeding groups with particular emphasis between Iba1 and CD68 to quantify the number of phagocytic microglia present and Iba1 and Tmem119 to differentiate between peripheral macrophages (Iba1+/Tmem119-) and resident microglia [94,95,96].
5. Conclusions
To our knowledge, this is the first study to utilize different feeding regimens (HM vs IF) to assess neurodevelopmental differences in term piglets from PD2 to PD30 (comparative roughly to a 6-month-old infant brain) alongside neuroinflammation. When examining cognition, both HM-fed and IF-fed piglets appeared to have less anxiety at an older age (4-weeks-old vs. 3-weeks-old) as observed through less distance traveled and less total time moving in an arena. HM-fed piglets exhibited more exploratory behavior than IF-fed piglets as observed through more time spent in the center vs border of the arena at 4-weeks-old compared to 3-weeks-old. Additionally, HM-fed piglets had more non-novel revisits at both 4-weeks-old and 3-weeks-old compared to IF-fed piglets.
When examining memory and learning, diet may have impacted memory performance in HM-fed vs. IF-fed piglets. Although not significant, HM-fed piglets had more novel object visits and spent more time with novel objects in an arena at both 3-weeks-old and 4-weeks-old compared to IF-fed piglets. This may indicate they recognized when a new object was presented to them over a familiar object.
Brain development may also be different between HM-fed and IF-fed piglets at 4-weeks-old (~PD30). HM-fed piglets had a pattern towards smaller body weights and greater normalized brain weight compared to IF-fed piglets at PD30. Moreover, HM-fed piglet prefrontal cortex microglia had statistically significant characteristics of a less activated phenotype (longer and more complex processes) compared to IF-fed piglets. We also saw a pattern of higher IL-1β plasma levels in HM-fed piglets compared to IF-fed piglets which may indicate more memory consolidation due to IL-1β naturally higher abundance within the hippocampus.
Supplementary Materials
The following supporting information can be downloaded at: www.mdpi.com/xxx/s1, Table S1: Comparisons of estimated piglet nutrition requirements with an unpasteurized human milk (HM) and bovine milk-based infant formula (IF) feeding regimen; Figure S1: Normalized piglet brain weight; Figure S2: Systemic cytokine levels in piglets at PD30.
Author Contributions
Conceptualization, Y.C.; methodology, L.A.N., Y.C., B.D.F., and A.M.; software, L.A.N., J.P., B.D.F, Y.C., and A.M.; validation, L.A.N., J.P., B.D.F, Y.C., and A.M.; formal analysis, J.P., L.A.N., B.D.F., and A.M.; investigation, L.A.N., Y.C., and B.D.F.; resources, Y.C.; data curation, J.P., L.A.N., B.D.F., and A.M.; writing—original draft preparation, L.A.N., J.P., and A.M.; writing—review and editing, , L.A.N., J.P., B.D.F, Y.C., and A.M.; visualization, L.A.N., B.D.F., and A.M.; supervision, Y.C., B.D.F., and A.M.; project administration, Y.C.; funding acquisition, Y.C. All authors have read and agreed to the published version of the manuscript.
Funding
This research was funded by was provided by internal funding from the University of Idaho College of Agriculture and Life Sciences as well as the ASPEN Rhoads Research Foundation.
Institutional Animal Care and Use Committee Statement
The animal study protocol was approved under protocol number IACUC-2020-56 from the University of Idaho Institutional Animal Care and Use Committee.
Informed Consent Statement
Not applicable.
Data Availability Statement
The data presented in this study are available upon request from the corresponding author.
Acknowledgments
The authors would like to thank all members of the Chen Lab team, with particular emphasis on Kendi Phelps, Alexis Bisotti, and Kyleigh Weinstein. Piglet care could not have been possible without their time and efforts.
Conflicts of Interest
The authors declare no conflicts of interest.
References
- Centers for Disease Control and Prevention. Preterm birth. https://www.cdc.gov/reproductivehealth/maternalinfanthealth/pretermbirth.html. (2020, October 30).
- Gill, S.V., May-Benson, T.A., Teasdale, A., & Munsell, E. G. Birth and developmental correlates of birth weight in a sample of children with potential sensory processing disorder. BMC Pediatr 13, 29 (2013). [CrossRef]
- Peterson, B. S. et al. Regional brain volume abnormalities and long-term cognitive outcome in preterm infants. JAMA. 2000 Oct 18;284(15):1939-47. [CrossRef]
- Romero, R., Dey, S. K., & Fisher, S. J. Preterm labor: one syndrome, many causes. Science 345(6198), 760-5 (2014). [CrossRef]
- Chen, Z. et al. Impact of early term and late preterm birth on infants’ neurodevelopment: evidence from a cohort study in Wuhan, China. BMC Pediatr 22, 251 (2022). [CrossRef]
- Sansavini, A. et al. The effect of gestational age on developmental outcomes: a longitudinal study in the first 2 years of life. Child: Care Health Dev. 37(1), 26-36 (2011). [CrossRef]
- Rakic, P. Mode of cell migration to the superficial layers of fetal monkey neocortex. J. Comp. Neurol. 145(1), 61-83 (1972). [CrossRef]
- Rakic, P. A. small step for the cell—a giant leap for mankind: a hypothesis of neocortical expansion during evolution. Trends Neurosci. 18(9), 383-388 (1995). [CrossRef]
- Sidman, R. L., & Rakic, P. "Development of the human central nervous system,” in Histology and Histopathology of the Nervous System. (W. Haymaker and R. D. Adams, Springfield, IL: C.C. Thomas, 3-145, 1982).
- Kostović, I., & Rakic, P. Development of prestriate visual projections in the monkey and human fetal cerebrum revealed by transient cholinesterase staining. J. Neurosci. 4(1), 25-42 (1984). [CrossRef]
- Kostović, I., & Rakic, P. Developmental history of the transient subplate zone in the visual and somatosensory cortex of the macaque monkey and human brain. J. Comp. Neurol. 297(3), 441-470 (1990). [CrossRef]
- Hüppi, P. S. et al. Quantitative magnetic resonance imaging of brain development in premature and mature newborns. An. Neurol.: Official J. Am. Neurol. Assoc. Child Neurol. Soc. 43(2), 224-235 (1998). [CrossRef]
- Kidokoro, H. et al. Brain injury and altered brain growth in preterm infants: predictors and prognosis. Pediatrics 134(2), e444-e453 (2014). [CrossRef]
- Fanaro, S. Feeding intolerance in the preterm infant. Early Hum. Dev. 89, S13-S20 (2013). [CrossRef]
- Gibertoni, D. et al. Positive effect of human milk feeding during NICU hospitalization on 24 month neurodevelopment of very low birth weight infants: an Italian cohort study. PLoS One 10(1), e0116552 (2015). [CrossRef]
- Belfort, M. B. et al. Breast milk feeding, brain development, and neurocognitive outcomes: a 7-year longitudinal study in infants born at less than 30 weeks' gestation. J. Pediatr. 177, 133-139 (2016). [CrossRef]
- Andres, A. et al. Developmental status of 1-year-old infants fed breast milk, cow’s milk formula, or soy formula. Pediatrics, 129(6), 1134-1140 (2012). [CrossRef]
- Oddy, W. H. et al. Breast feeding and cognitive development in childhood: a prospective birth cohort study. Pediatr. Perinat. Epidemiol. 17(1), 81-90 (2003). [CrossRef]
- Ou, X. et al. Voxel-based morphometry and fMRI revealed differences in brain gray matter in breastfed and milk formula–fed children. Am. J. Neuroradiol. 37(4), 713-719 (2016). [CrossRef]
- Luby, J. L., Belden, A. C., Whalen, D., Harms, M. P., & Barch, D. M. Breastfeeding and childhood IQ: The mediating role of gray matter volume. J. Am. Acad. Child Adolesc. Psychiatry 55(5), 367-375 (2016). [CrossRef]
- Straub, N., Grunert, P., Northstone, K., & Emmett, P. Economic impact of breast-feeding-associated improvements of childhood cognitive development, based on data from the ALSPAC. British J. Nutr. 122(s1), S16-S21 (2019). [CrossRef]
- Der, G., Batty, G. D., & Deary, I. J. Effect of breast feeding on intelligence in children: prospective study, sibling pairs analysis, and meta-analysis. BMJ 333(7575), 945 (2006). [CrossRef]
- Boutwell, B. B., Young, J. T., & Meldrum, R. C. On the positive relationship between breastfeeding & intelligence. Dev. Psychol. 54(8), 1426 (2018). [CrossRef]
- Kramer, M. S. et al. Breastfeeding and child cognitive development: New evidence from a large randomized trial. Arch. General Psychiatry 65, 578-584 (2008). [CrossRef]
- Lind, N. M. et al. The use of pigs in neuroscience: modeling brain disorders. Neurosci. Biobehav. Rev. 31(5), 728-751 (2007). [CrossRef]
- Gonzalez, L. M., Boeser, A. J., & Blikslager, A. T. Porcine models of digestive disease: the future of large animal translational research. Trans. Res. 166(1), 12-27 (2015). [CrossRef]
- Cohen-Wolkowiez, M. et al. Early and late onset sepsis in late preterm infants. Pediatr. Infect. Dis. J. 28(12), 1052 (2009). [CrossRef]
- Brunse, A., Abbaspour, A., & Sangild, P. T. Brain barrier disruption and region-specific neuronal degeneration during necrotizing enterocolitis in preterm pigs. Dev. Neurosci. 40(3), 198-208 (2018). [CrossRef]
- Shennan, A. T., Dunn, M. S., Ohlsson, A., Lennox, K., & Hoskins, E. M. Abnormal pulmonary outcomes in premature infants: prediction from oxygen requirement in the neonatal period. Pediatrics 82(4), 527-532 (1988). [CrossRef]
- Yang, C., Hawkins, K. E., Doré, S., & Candelario-Jalil, E. Neuroinflammatory mechanisms of blood-brain barrier damage in ischemic stroke. Am. J. Physiol-Cell Physiol. 316(2), C135-C153 (2019). [CrossRef]
- Wang, L. W., Tu, Y. F., Huang, C. C., & Ho, C. J. JNK signaling is the shared pathway linking neuroinflammation, blood–brain barrier disruption, and oligodendroglial apoptosis in the white matter injury of the immature brain. J. Neuroinflamm. 9(1), 1-17 (2012). [CrossRef]
- Dammann, O., Durum, S., & Leviton, A. Do white cells matter in white matter damage? Trends Neurosci. 24(6), 320-324 (2001). [CrossRef]
- Okazaki, K. et al. Elevation of cytokine concentrations in asphyxiated neonates. Neonatology 89(3), 183-189 (2006). [CrossRef]
- Vadodaria, K. C. et al. Altered neuronal support and inflammatory response in bipolar disorder patient-derived astrocytes. Stem Cell Rep. 16(4), 825-835 (2021). [CrossRef]
- Shi, L., Fatemi, S. H., Sidwell, R. W., & Patterson, P. H. Maternal influenza infection causes marked behavioral and pharmacological changes in the offspring. J. Neurosci. 23(1), 297-302 (2003). [CrossRef]
- Wang, L. Y., Tu, Y. F., Lin, Y. C., & Huang, C. C. CXCL5 signaling is a shared pathway of neuroinflammation and blood–brain barrier injury contributing to white matter injury in the immature brain. J. Neuroinflamm. 13(1), 1-15 (2016). [CrossRef]
- Kunugi, H., Urushibara, T., Murray, R. M., Nanko, S., & Hirose, T. Prenatal underdevelopment and schizophrenia: a case report of monozygotic twins. Psychiatry and Clin. Neurosci. 57(3), 271-274 (2003). [CrossRef]
- Miron, V. E. Microglia-driven regulation of oligodendrocyte lineage cells, myelination, and remyelination. J Leukoc Biol 101, 1103-1108 (2017). [CrossRef]
- Schafer, D. P. et al. Microglia sculpt postnatal neural circuits in an activity and complement-dependent manner. Neuron 74, 691-705 (2012). [CrossRef]
- Hughes, A. N. & Appel, B. Microglia phagocytose myelin sheaths to modify developmental myelination. Nat Neurosci 23, 1055-1066 (2020). [CrossRef]
- Li, Q. et al. Developmental Heterogeneity of Microglia and Brain Myeloid Cells Revealed by Deep Single-Cell RNA Sequencing. Neuron 101, 207-223 e210 (2019). [CrossRef]
- Church, J. S., Milich, L. M., Lerch, J. K., Popovich, P. G. & McTigue, D. M. E6020, a synthetic TLR4 agonist, accelerates myelin debris clearance, Schwann cell infiltration, and remyelination in the rat spinal cord. Glia 65, 883-899 (2017). [CrossRef]
- Xu, T. et al. The roles of microglia and astrocytes in myelin phagocytosis in the central nervous system. Journal of cerebral blood flow and metabolism : official journal of the International Society of Cerebral Blood Flow and Metabolism, 271678X221137762 (2022). [CrossRef]
- Bar, E. & Barak, B. Microglia roles in synaptic plasticity and myelination in homeostatic conditions and neurodevelopmental disorders. Glia 67, 2125-2141 (2019). [CrossRef]
- Antunes, M., & Biala, G. The novel object recognition memory: neurobiology, test procedure, and its modifications. Cog. Processing 12(2), 93-110 (2012). [CrossRef]
- Fleming, S. A., & Dilger, R. N. (2017). Young pigs exhibit differential exploratory behavior during novelty preference tasks in response to age, sex, and delay. Behav. Brain Res. 321(50-60). [CrossRef]
- Kent, A. L., Wright, I. M., Abdel-Latif, M. E., New South, W. & Australian Capital Territory Neonatal Intensive Care Units Audit, G. Mortality and adverse neurologic outcomes are greater in preterm male infants. Pediatrics 129, 124-131 (2012). [CrossRef]
- Peacock, J. L., Marston, L., Marlow, N., Calvert, S. A. & Greenough, A. Neonatal and infant outcome in boys and girls born very prematurely. Pediatr Res 71, 305-310 (2012). [CrossRef]
- VanRyzin, J. W., Marquardt, A. E., Pickett, L. A. & McCarthy, M. M. Microglia and sexual differentiation of the developing brain: A focus on extrinsic factors. Glia (2019). [CrossRef]
- VanRyzin, J. W., Pickett, L. A. & McCarthy, M. M. Microglia: Driving critical periods and sexual differentiation of the brain. Dev Neurobiol 78, 580-592 (2018). [CrossRef]
- Le Dividich, J., & Noblet, J. Colostrum intake and thermoregulation in the neonatal pig in relation to environmental temperature. Neonatology 40(3-4), 167-174 (1981). [CrossRef]
- Mount, L. E. Environmental temperature preferred by the young pig. Nature 199(4899), 1212-1213 (1963). [CrossRef]
- Brown, J. E. Nutrition during lactation: Infant nutrition. In Nutrition through the life cycle (7th edn), 157-158 (Cengage Learning, 2020).
- Urschel, K. L., Shoveller, A. K., Uwiera, R. R., Pencharz, P. B., & Ball, R. O. Citrulline is an effective arginine precursor in enterally fed neonatal piglets. J. Nutr. 136(7), 1806-1813 (2006). [CrossRef]
- Wykes, L. J., Ball, R. O., & Pencharz, P. B. Development and validation of a total parenteral nutrition model in the neonatal piglet. J. Nutr. 123(7), 1248- 1259 (1993). [CrossRef]
- Burrin, D. G. et al. Minimal enteral nutrient requirements for intestinal growth in neonatal piglets: how much is enough? Am. J. Clin. Nutr. 71(6), 1603-1610 (2000). [CrossRef]
- Bos, C. et al. Intestinal lysine metabolism is driven by the enteral availability of dietary lysine in piglets fed a bolus meal. Am. J. Physiol.-Endocrinol. Metabol. 285(6), E1246-E1257 (2003). [CrossRef]
- National Research Council. Nutrient requirements of swine (National Academies Press, 2012).
- Kajimoto, M. et al. Inhaled nitric oxide reduces injury and microglia activation in porcine hippocampus after deep hypothermic circulatory arrest. J. Thoracic Cardiovasc. Surg. 161(6), e485-e498 (2020). [CrossRef]
- Lim, R. R., Hainsworth, D. P., Mohan, R. R., & Chaurasia, S. S. Characterization of a functionally active primary microglial cell culture from the pig retina. Exp. Eye Res. 185, 107670 (2019). [CrossRef]
- Fumagalli, S., Perego, C., Ortolano, F., & De Simoni, M. G. CX3CR1 deficiency induces an early protective inflammatory environment in ischemic mice. Glia 61(6), 827-842 (2013). [CrossRef]
- Rice, R. A. et al. Microglial repopulation resolves inflammation and promotes brain recovery after injury. Glia 65(6), 931-944 (2017). [CrossRef]
- Howard, C. V., & Reed, M. G. Unbiased stereology: Three-dimensional measurement in microscopy (Advanced Methods) 2nd edn. (QTP Publications, 2010).
- York, E. M., LeDue, J. M., Bernier, L. P., & MacVicar, B. A. 3DMorph automatic analysis of microglial morphology in three dimensions from ex vivo and in vivo imaging. Eneuro, 5(6) (2018). [CrossRef]
- R Core Team. R: A language and environment for statistical computing. R Foundation for statistical computing, Vienna, Austria. https://www.R-project.org/ (2022).
- Bates, D., Maechler, M., Bolker, B., & Walker, S. Fitting Linear Mixed-Effects Models Using lme4. J. Stat Softw, 67(1), 1-48. (2015). [CrossRef]
- Kuznetsova, A., Brockhoff, P.B., Christensen, R.H.B. (2017). “lmerTest Package: Tests in Linear Mixed Effects Models.” J. Stat Softw, 82(13), 1-26. [CrossRef]
- Shapiro, S. S., & Wilk, M. B. An analysis of variance test for normality (complete samples). Biometrika 52(3-4), 591-611 (1965). [CrossRef]
- Niblock, M.M. et al. Comparative anatomical assessment of the piglet as a model for the developing human medullary serotonergic system. Brain Res Rev. 50(1), 169-183 (2005). [CrossRef]
- Knickmeyer R. C., Gouttard S. A structural MRI study of human brain development from birth to 2 years. J. Neurosci. 28(47),12176–12182 (2008). [CrossRef]
- Haigh, A., Chou, J. Y., & O'Driscoll, K. (2020). Variations in the behavior of Pigs during an open field and novel object test. Front. Vet. Sci. 607(7; 2020). [CrossRef]
- Brewer, J. S., Bellinger, S. A., Joshi, P., & Kleven, G. A. Enriched open field facilitates exercise and social interaction in 2 strains of guinea pigs (Cavia porcellus). J. Am. Assoc. Lab. Anim. Sci. 53(4), 344–355 (2014).
- Mormède, P., Dantzer, R., Bluthe, R. M., Caritez, J. C. Differences in adaptive abilities of three breeds of Chinese pigs. Behavioural and neuroendocrine studies. Genet Sel Evol 16(1), 85-102 (1984). [CrossRef]
- Conrad, M. S., Dilger, R. N., & Johnson, R. W. (2012). Brain growth of the domestic pig (Sus scrofa) from 2 to 24 weeks of age: a longitudinal MRI study. Dev. Neurosci. 34(4), 291–298 (2012). [CrossRef]
- Belfort, M. B. et al. Breast milk feeding, brain development, and neurocognitive outcomes: a 7-year longitudinal study in infants born at less than 30 weeks' gestation. J. Pediatr. 177, 133-139 (2016). [CrossRef]
- Huang, J. et al. Early feeding of larger volumes of formula milk is associated with greater body weight or overweight in later infancy. Nutr. J. 17(1), 1-9 (2018). [CrossRef]
- Hopkins, D., Steer, C. D., Northstone, K., & Emmett, P. M. Effects on childhood body habitus of feeding large volumes of cow or formula milk compared with breastfeeding in the latter part of infancy. Am. J. of Clin. Nutr. 102(5), 1096-1103 (2015). [CrossRef]
- Deoni, S. C. et al. Breastfeeding and early white matter development: A cross-sectional study. Neuroimage 82, 77-86 (2013). [CrossRef]
- Kafouri, S. et al. Breastfeeding and brain structure in adolescence. International journal of epidemiology, 42(1), 150-159 (2013. [CrossRef]
- Isaacs, E. B. et al. Impact of breast milk on intelligence quotient, brain size, and white matter development. Pediatr. Res. 67(4), 357-362 (2010). [CrossRef]
- Barger, N. et al. Microglia: An Intrinsic Component of the Proliferative Zones in the Fetal Rhesus Monkey (Macaca mulatta) Cerebral Cortex. Cereb Cortex 29, 2782-2796 (2019). [CrossRef]
- Cunningham, C. L., Martinez-Cerdeno, V. & Noctor, S. C. Microglia regulate the number of neural precursor cells in the developing cerebral cortex. J Neurosci 33, 4216-4233 (2013). [CrossRef]
- Kracht, L. et al. Human fetal microglia acquire homeostatic immune-sensing properties early in development. Science 369, 530-537 (2020). [CrossRef]
- Hanisch, U. K. & Kettenmann, H. Microglia: active sensor and versatile effector cells in the normal and pathologic brain. Nat Neurosci 10, 1387-1394 (2007). [CrossRef]
- Dinarello, C. A. Biologic basis for interleukin-1 in disease. Blood 87(6), 2095–2147 (1996).
- Besedovsky, H. O., & del Rey, A. Immune-neuro-endocrine interactions: facts and hypotheses. Endocr. Rev. 17(1), 64-102 (1996). [CrossRef]
- Haas, H. S., & Schauenstein, K. Neuroimmunomodulation via limbic structures—the neuroanatomy of psychoimmunology. Prog. Neurobio. 51(2), 195-222 (1997). [CrossRef]
- Rothwell, N. J., & Hopkins, S. J. Cytokines and the nervous system II: actions and mechanisms of action. Trends Neurosci. 18(3), 130-136 (1995). [CrossRef]
- Schneider, H. et al. A neuromodulatory role of interleukin-1β in the hippocampus. Proc. Natl. Acad. Sci. 95(13), 7778-7783 (1998). [CrossRef]
- Yirmiya, R., & Goshen, I. Immune modulation of learning, memory, neural plasticity and neurogenesis. Brain Behav. Immun. 25(2), 181-213 (2011). [CrossRef]
- Milner, B. Hemispheric specialization: Scope and limits. In The Neurosciences: the third study program (Schmitt, F. O., Worden, F. G.) 75-89 (MIT Press, Cambridge, MA, 1974).
- Purves, D. et al. (eds.). Long-Term Synaptic Potentiation. In Neuroscience (2nd edn), Chapter 35 (Sinauer Associates, Sunderland, MA, 2001).
- Lenz, K. M., Nugent, B. M., Haliyur, R., & McCarthy, M. M. Microglia are essential to masculinization of brain and behavior. J. Neurosci. 33(7), 2761-2772 (2013). [CrossRef]
- McDonough, A. et al. Ischemic preconditioning induces cortical microglial proliferation and a transcriptomic program of robust cell cycle activation. Glia 68(1), 76-94 (2020). [CrossRef]
- Satoh, J. I. et al. TMEM119 marks a subset of microglia in the human brain. Neuropathol. 36(1), 39-49 (2016). [CrossRef]
- Hamner, M. A. et al. Microglial depletion abolishes ischemic preconditioning in white matter. Glia 70(4), 661-674 (2022). [CrossRef]
Figure 1.
Novel object recognition (NOR) testing of human milk (HM)-fed and bovine milk-derived infant formula (IF)-fed piglets at 3-weeks-old and 4-weeks-old to assess learning and memory. NOR neurocognitive testing involved four phases conducted in the following order: habituation, familiarization, novel testing, and control. (a) Flowchart of each NOR phase. The habituation phase had 2 trials, the familiarization phase had 1 trial, the novel testing phase had 3 trials (with randomized novel toy delay of 5 minutes, 1 hour, and 24 hours after the familiarization trial), and the control phase had 2 trials. All phase trials had a duration of 5 minutes, except for the habituation phase trials which were 10 minutes; (b) Objects used during NOR testing. Object pairs 1-2 were examined at week 3 and object pairs 3-4 at week 4 of familiar and novel testing phases. Control phase testing involved the opposite object pairs where both feeding groups were exposed to all novel object pairs: 3-4 at week 3 and 1-2 at week 4.
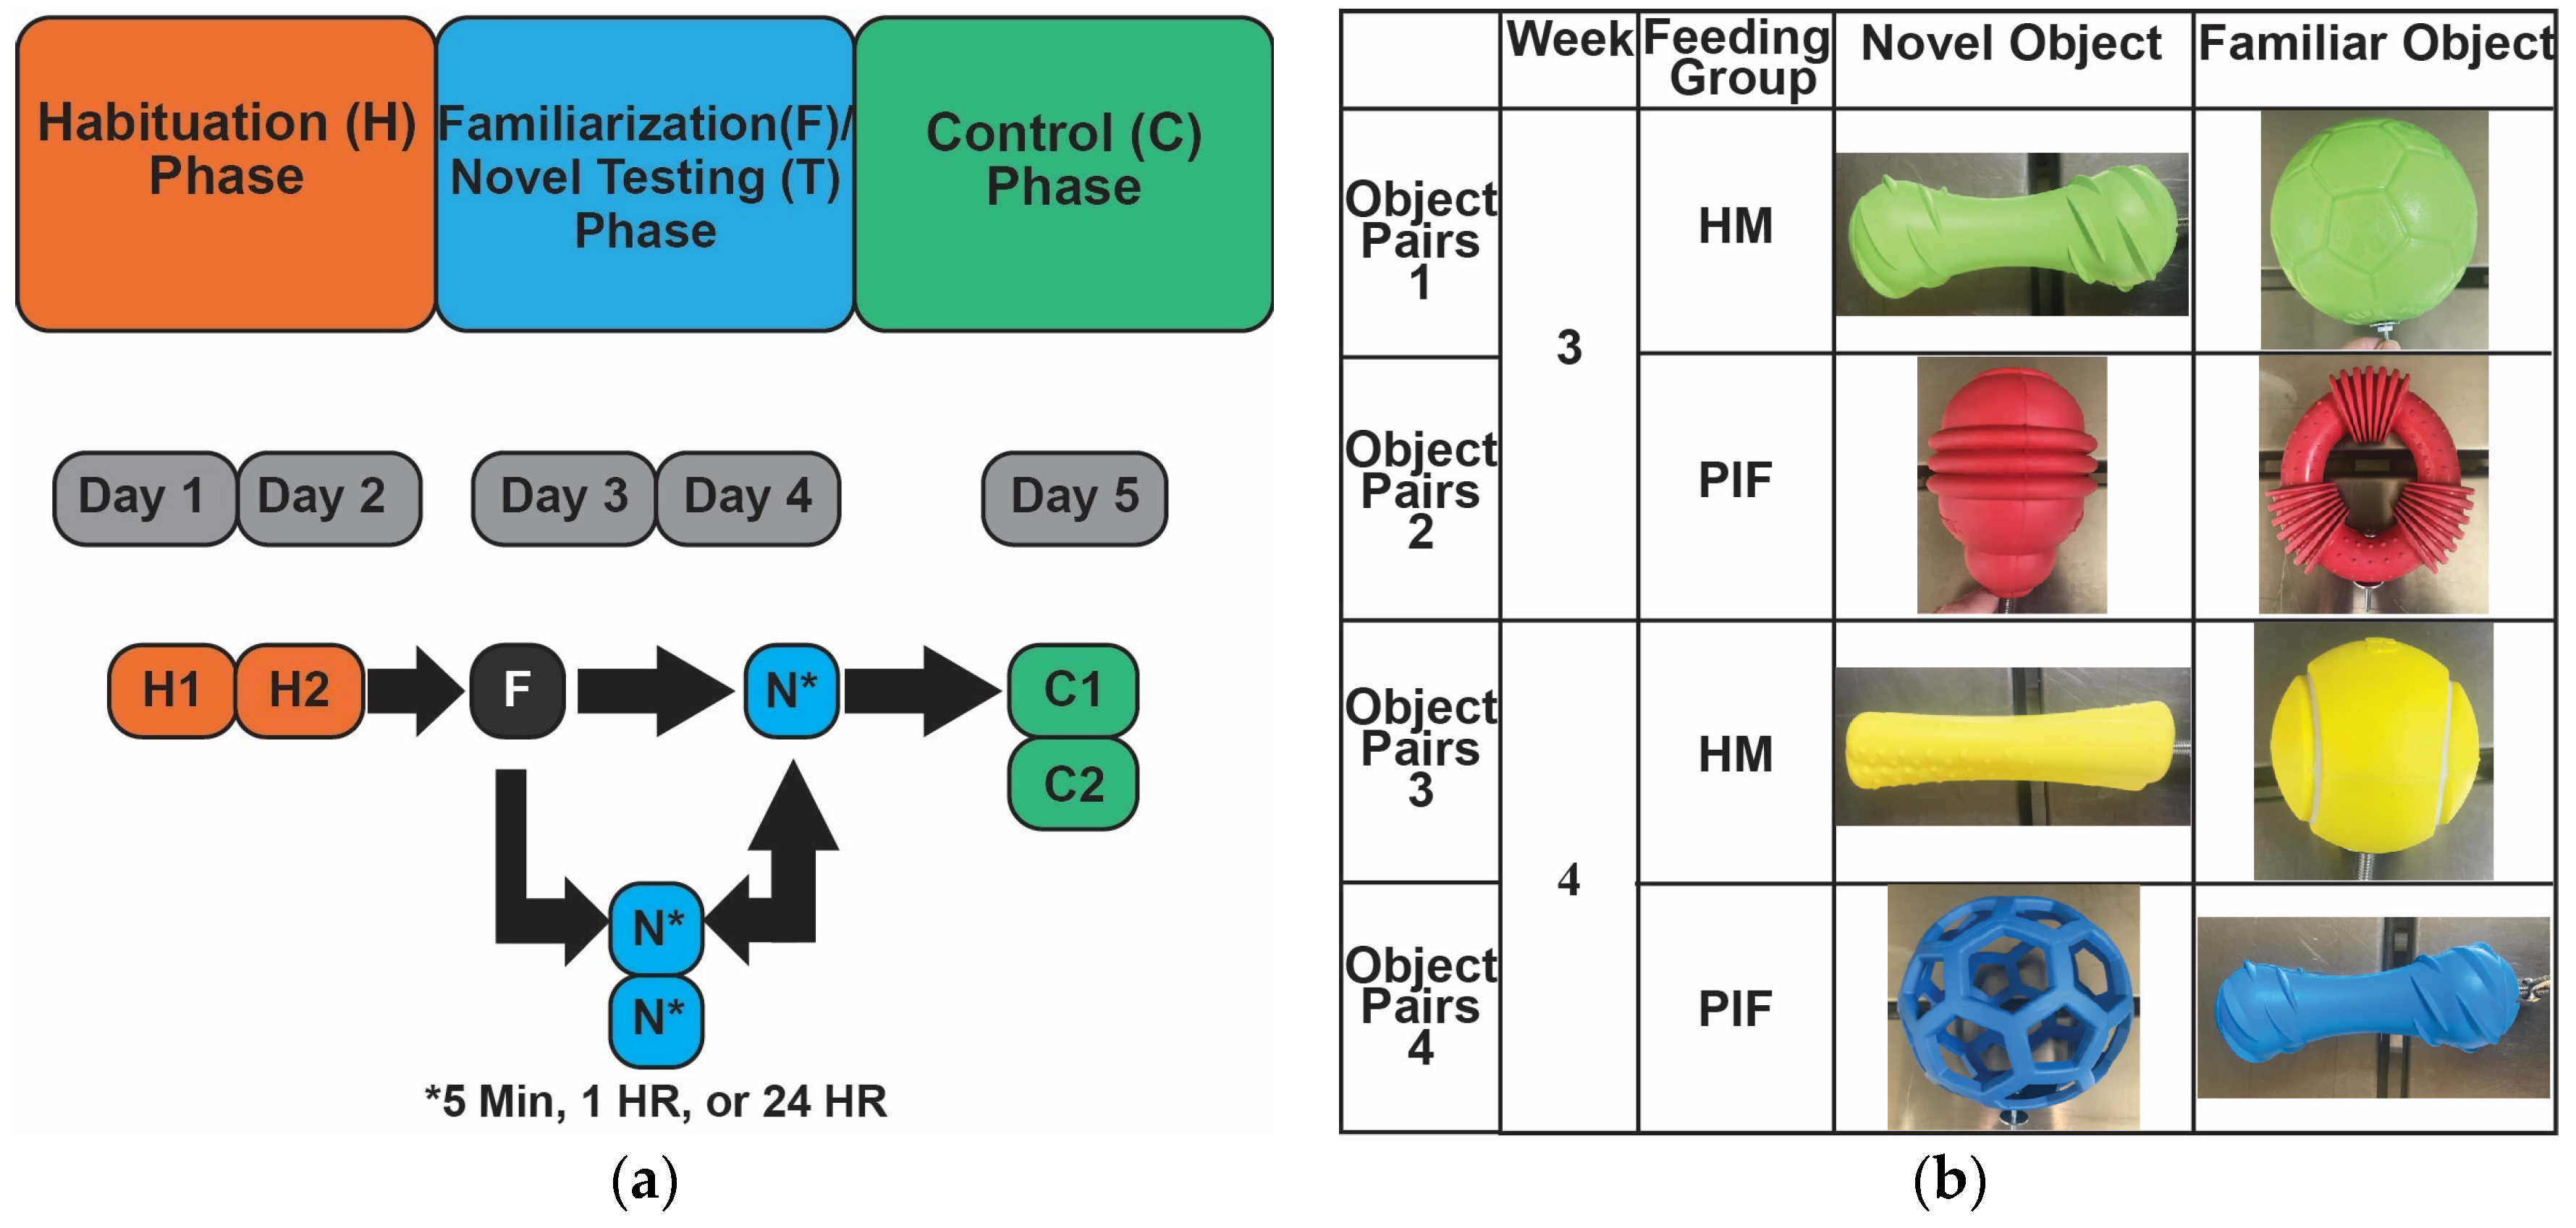
Figure 2.
Piglet weight examined by feeding group (HM-fed vs. IF-fed) throughout the 28-day feeding regimen: (a) piglet weight at the beginning of the study (PD2); (b) piglet weight at the end of the study (PD30); and (c) average daily percentage of piglet weight gain throughout the study. HM-fed (n = 3); IF-fed (n = 3). Significance was determined by independent samples t-tests and is indicated by †p < 0.10, **p < 0.01. HM = human milk; IF = bovine milk-derived infant formula; PD = postnatal day.
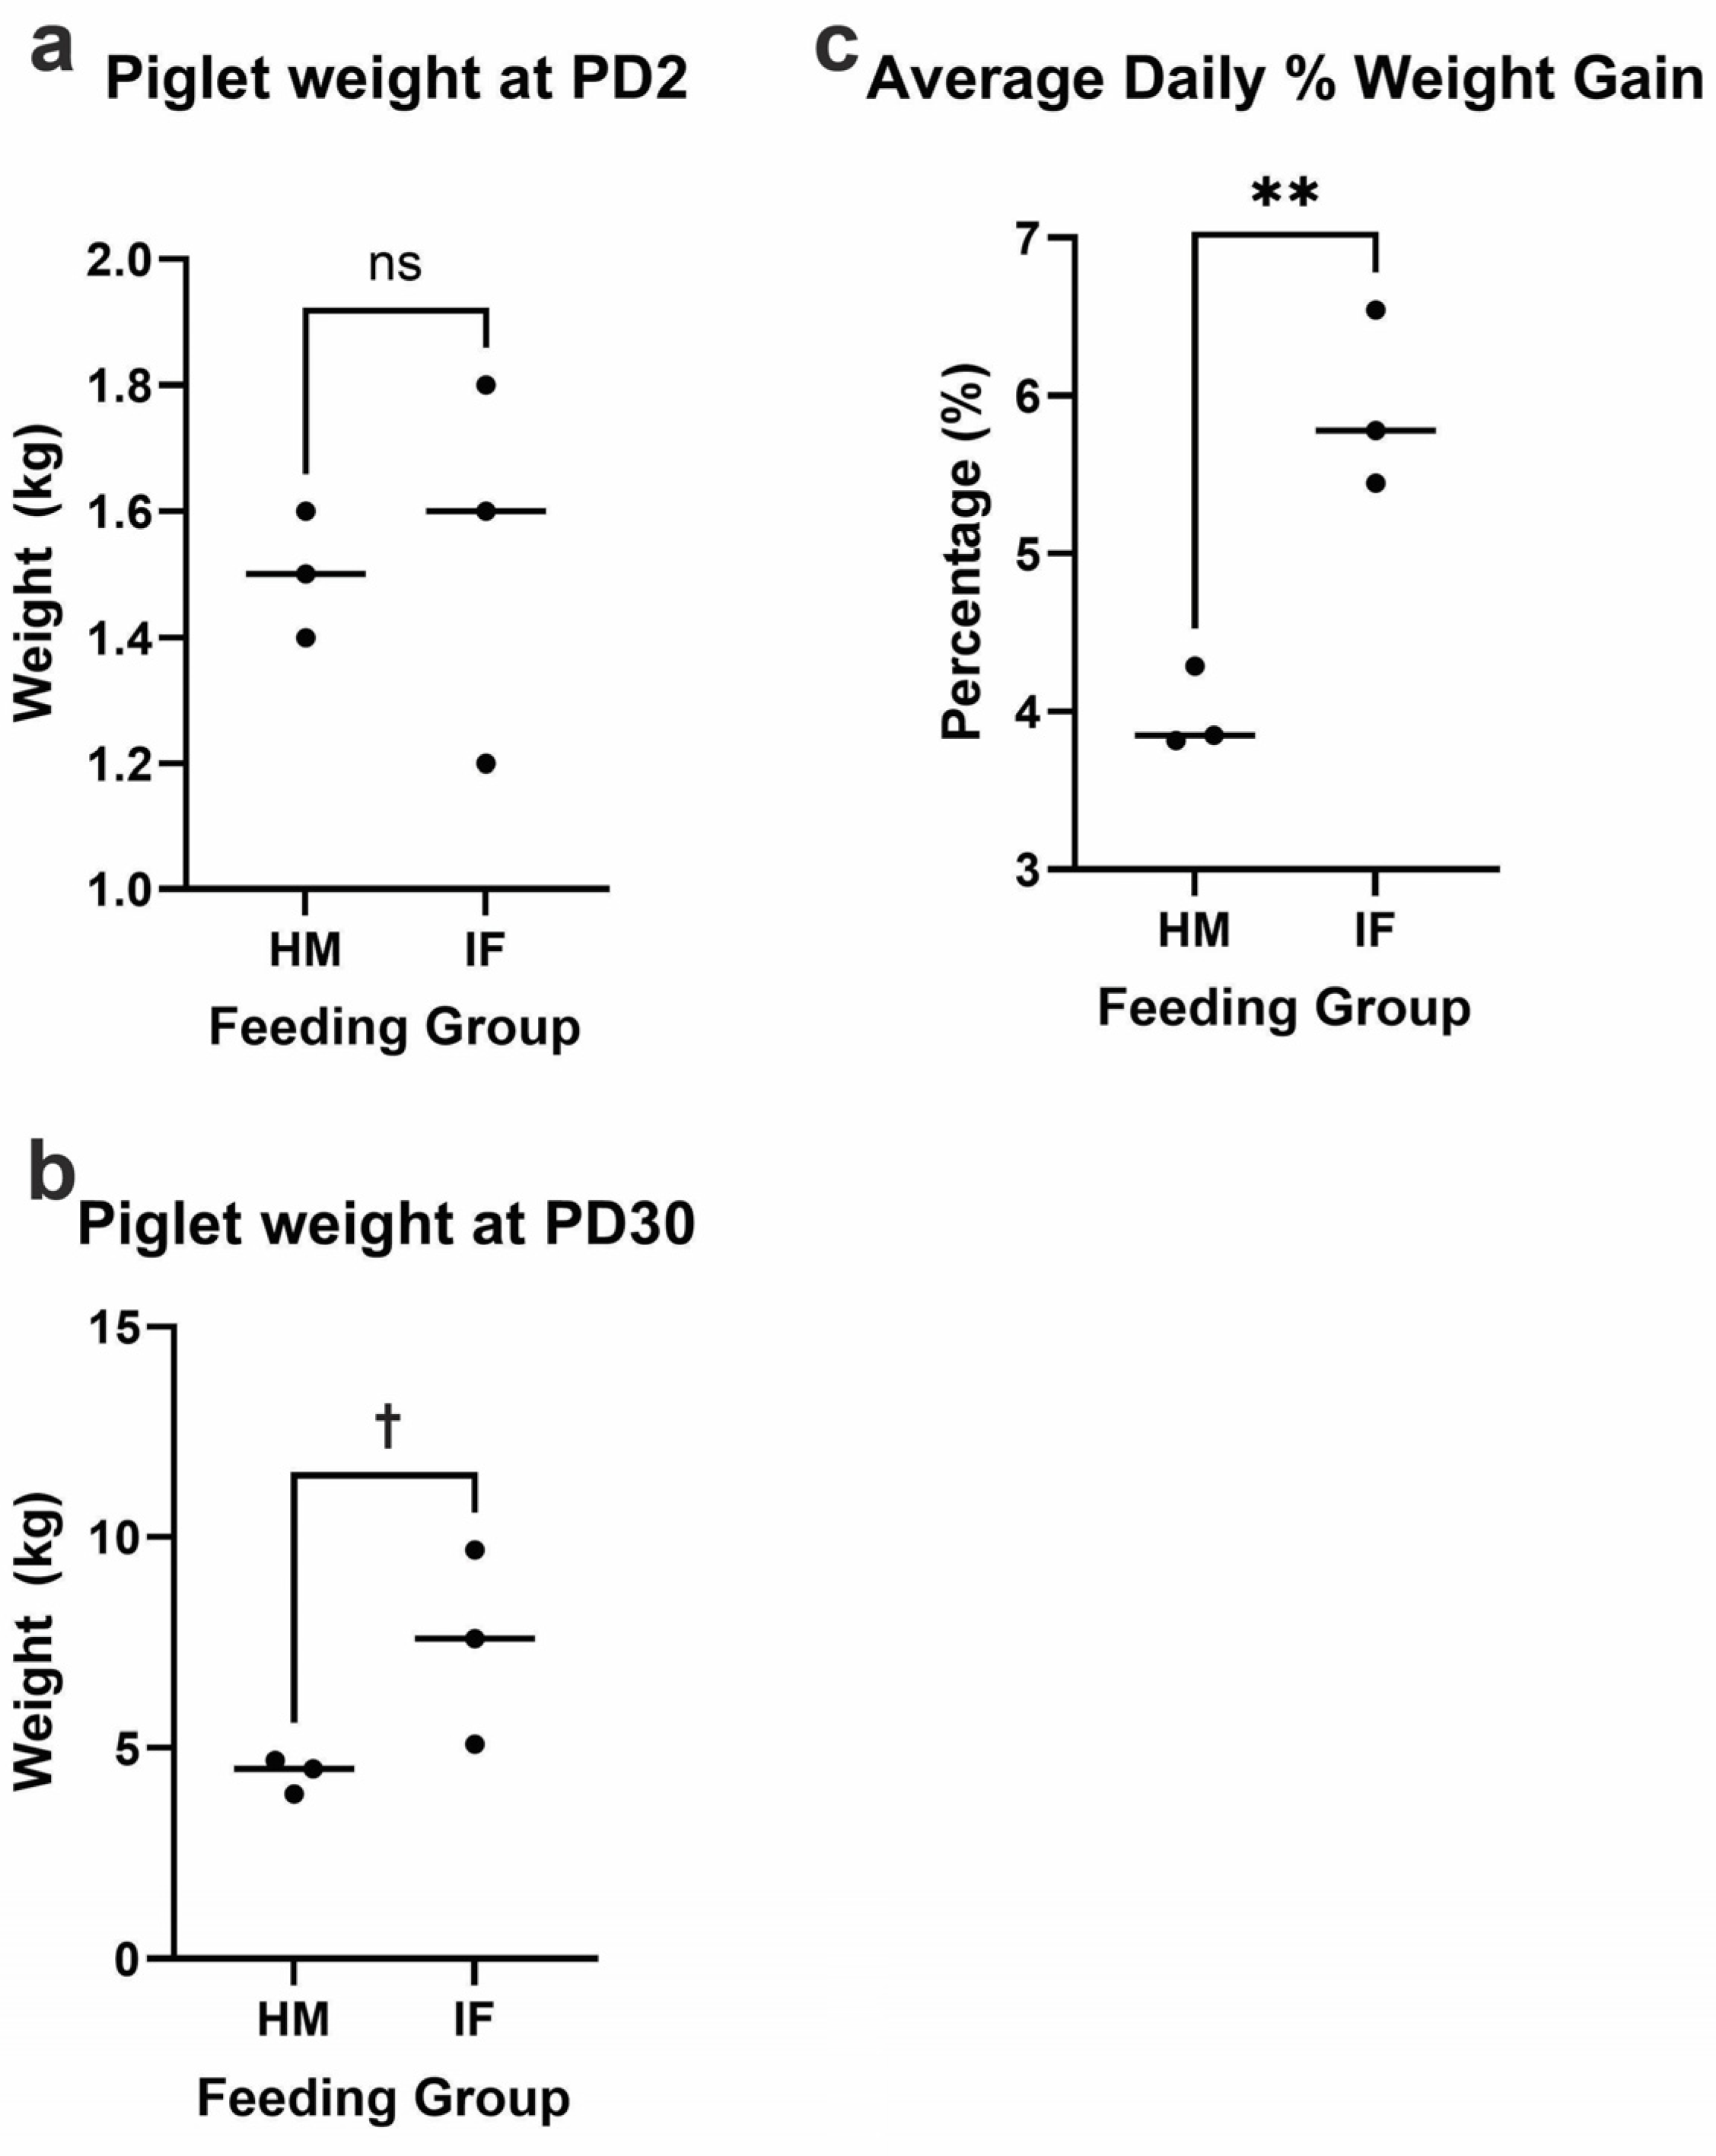
Figure 3.
Novel Object Recognition (NOR) habituation phase trials of piglet exploration examined by feeding group (human milk vs. infant formula) and age (3-weeks-old vs.4-weeks-old): (a) the total distance traveled (cm); (b) total time spent moving (s); (c) total time spent in the center of the arena (s); (d) Total time spent at the borders of the arena (s); and (e) the number of border visits (count). All values are expressed in means ± SE bars. Significance was determined by ANOVA and is indicated by †p < 0.10, *p < 0.05, **p < 0.01, ***p < 0.001, ****p < 0.0001. Uppercase letters indicate nutritional group-by-age interaction significance. HM-fed (n = 3); IF-fed (n = 3); HM = human milk; IF = bovine milk-derived infant formula; s = seconds; cm = centimeter. .
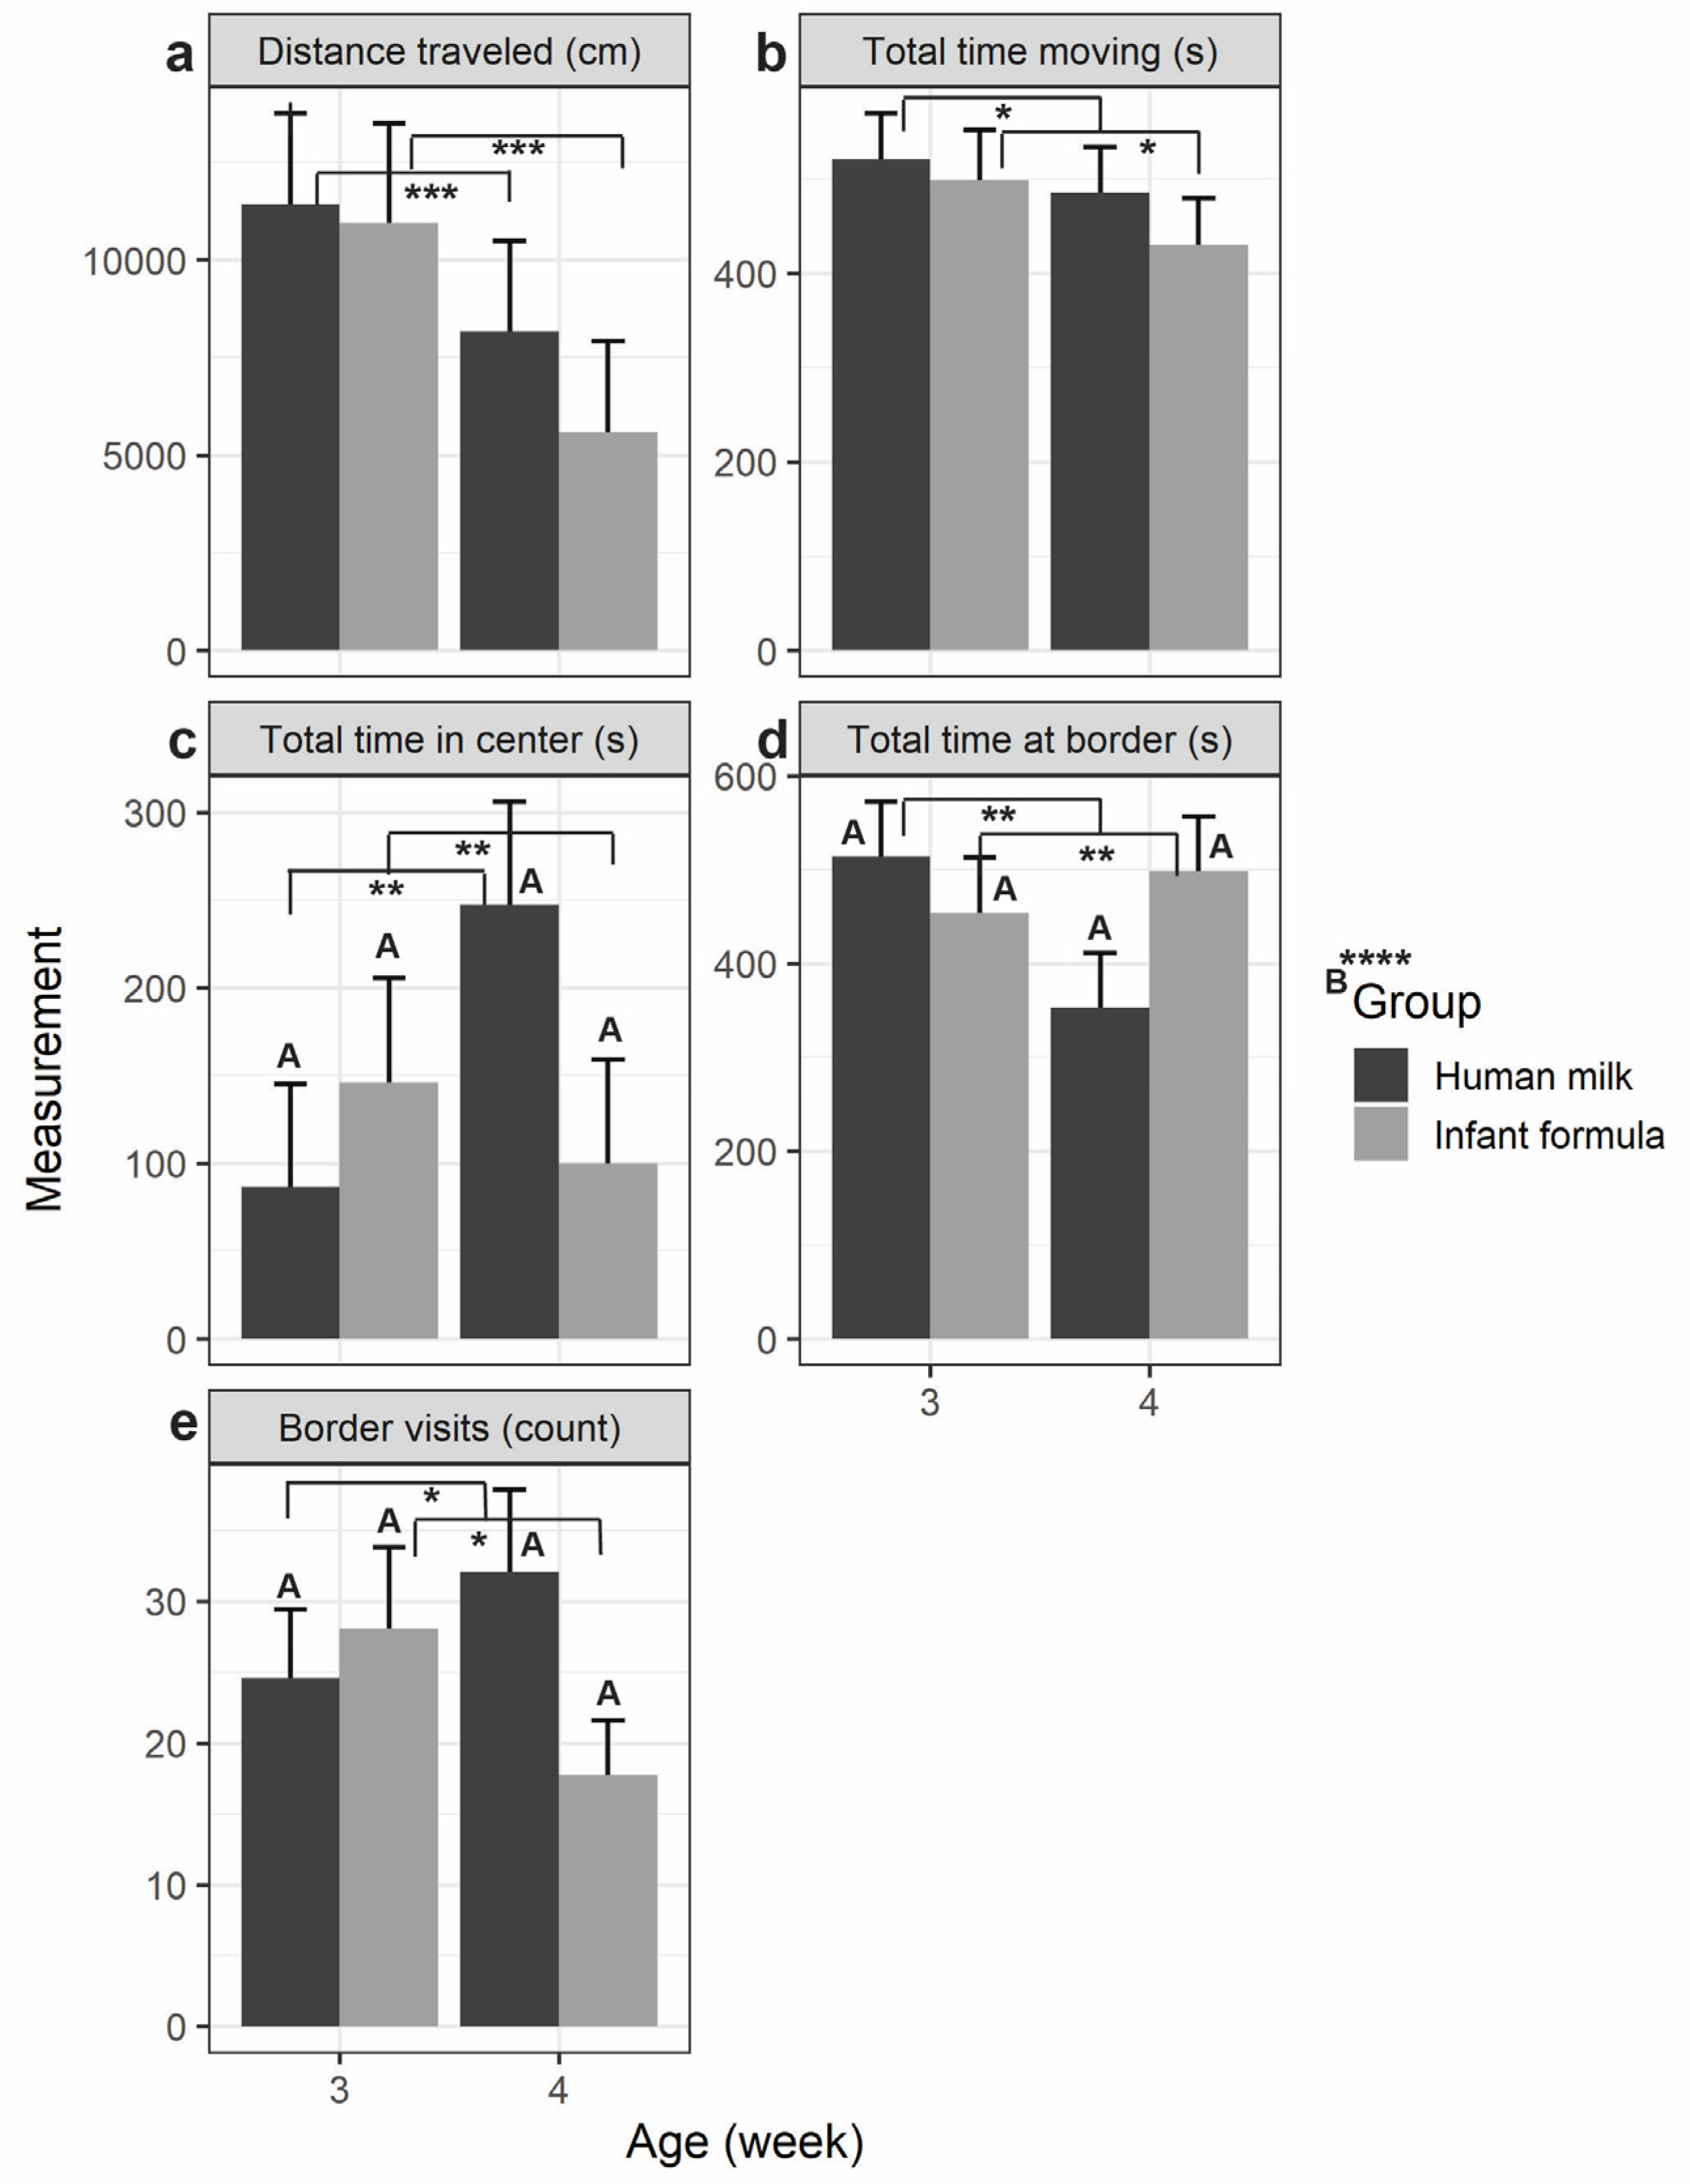
Figure 4.
Novel object recognition (NOR) novel (a-g) and control (h-n) testing phase trials of piglet object interaction examined by feeding group (human milk vs. infant formula) and age (3-weeks-old vs. 4-weeks-old): (a,h) the number of novel object visits (count); (b,i) the number of familiar object visits (count); (c,j) the number of novel object revisits (count); (d,k) the number of non-novel (center, border, and familiar sample object) visits; (e,l) total time spent with the novel object (s); (f,m) total time spent with the familiar sample object (s); and (g,n) the discrimination index (DI; positive values indicate more time with the novel object vs. negative values indicate more time with the familiar sample object). All values are Means ± SE. Significance was determined by ANOVA and is indicated by †p < 0.10, *p < 0.05, **p < 0.01, ***p < 0.001, ****p < 0.0001. Superscript letters indicate nutritional group-by-age interaction significance. HM-fed (n = 3); IF-fed (n = 3); HM = human milk; IF = bovine milk-derived infant formula; s = seconds; cm = centimeter. .
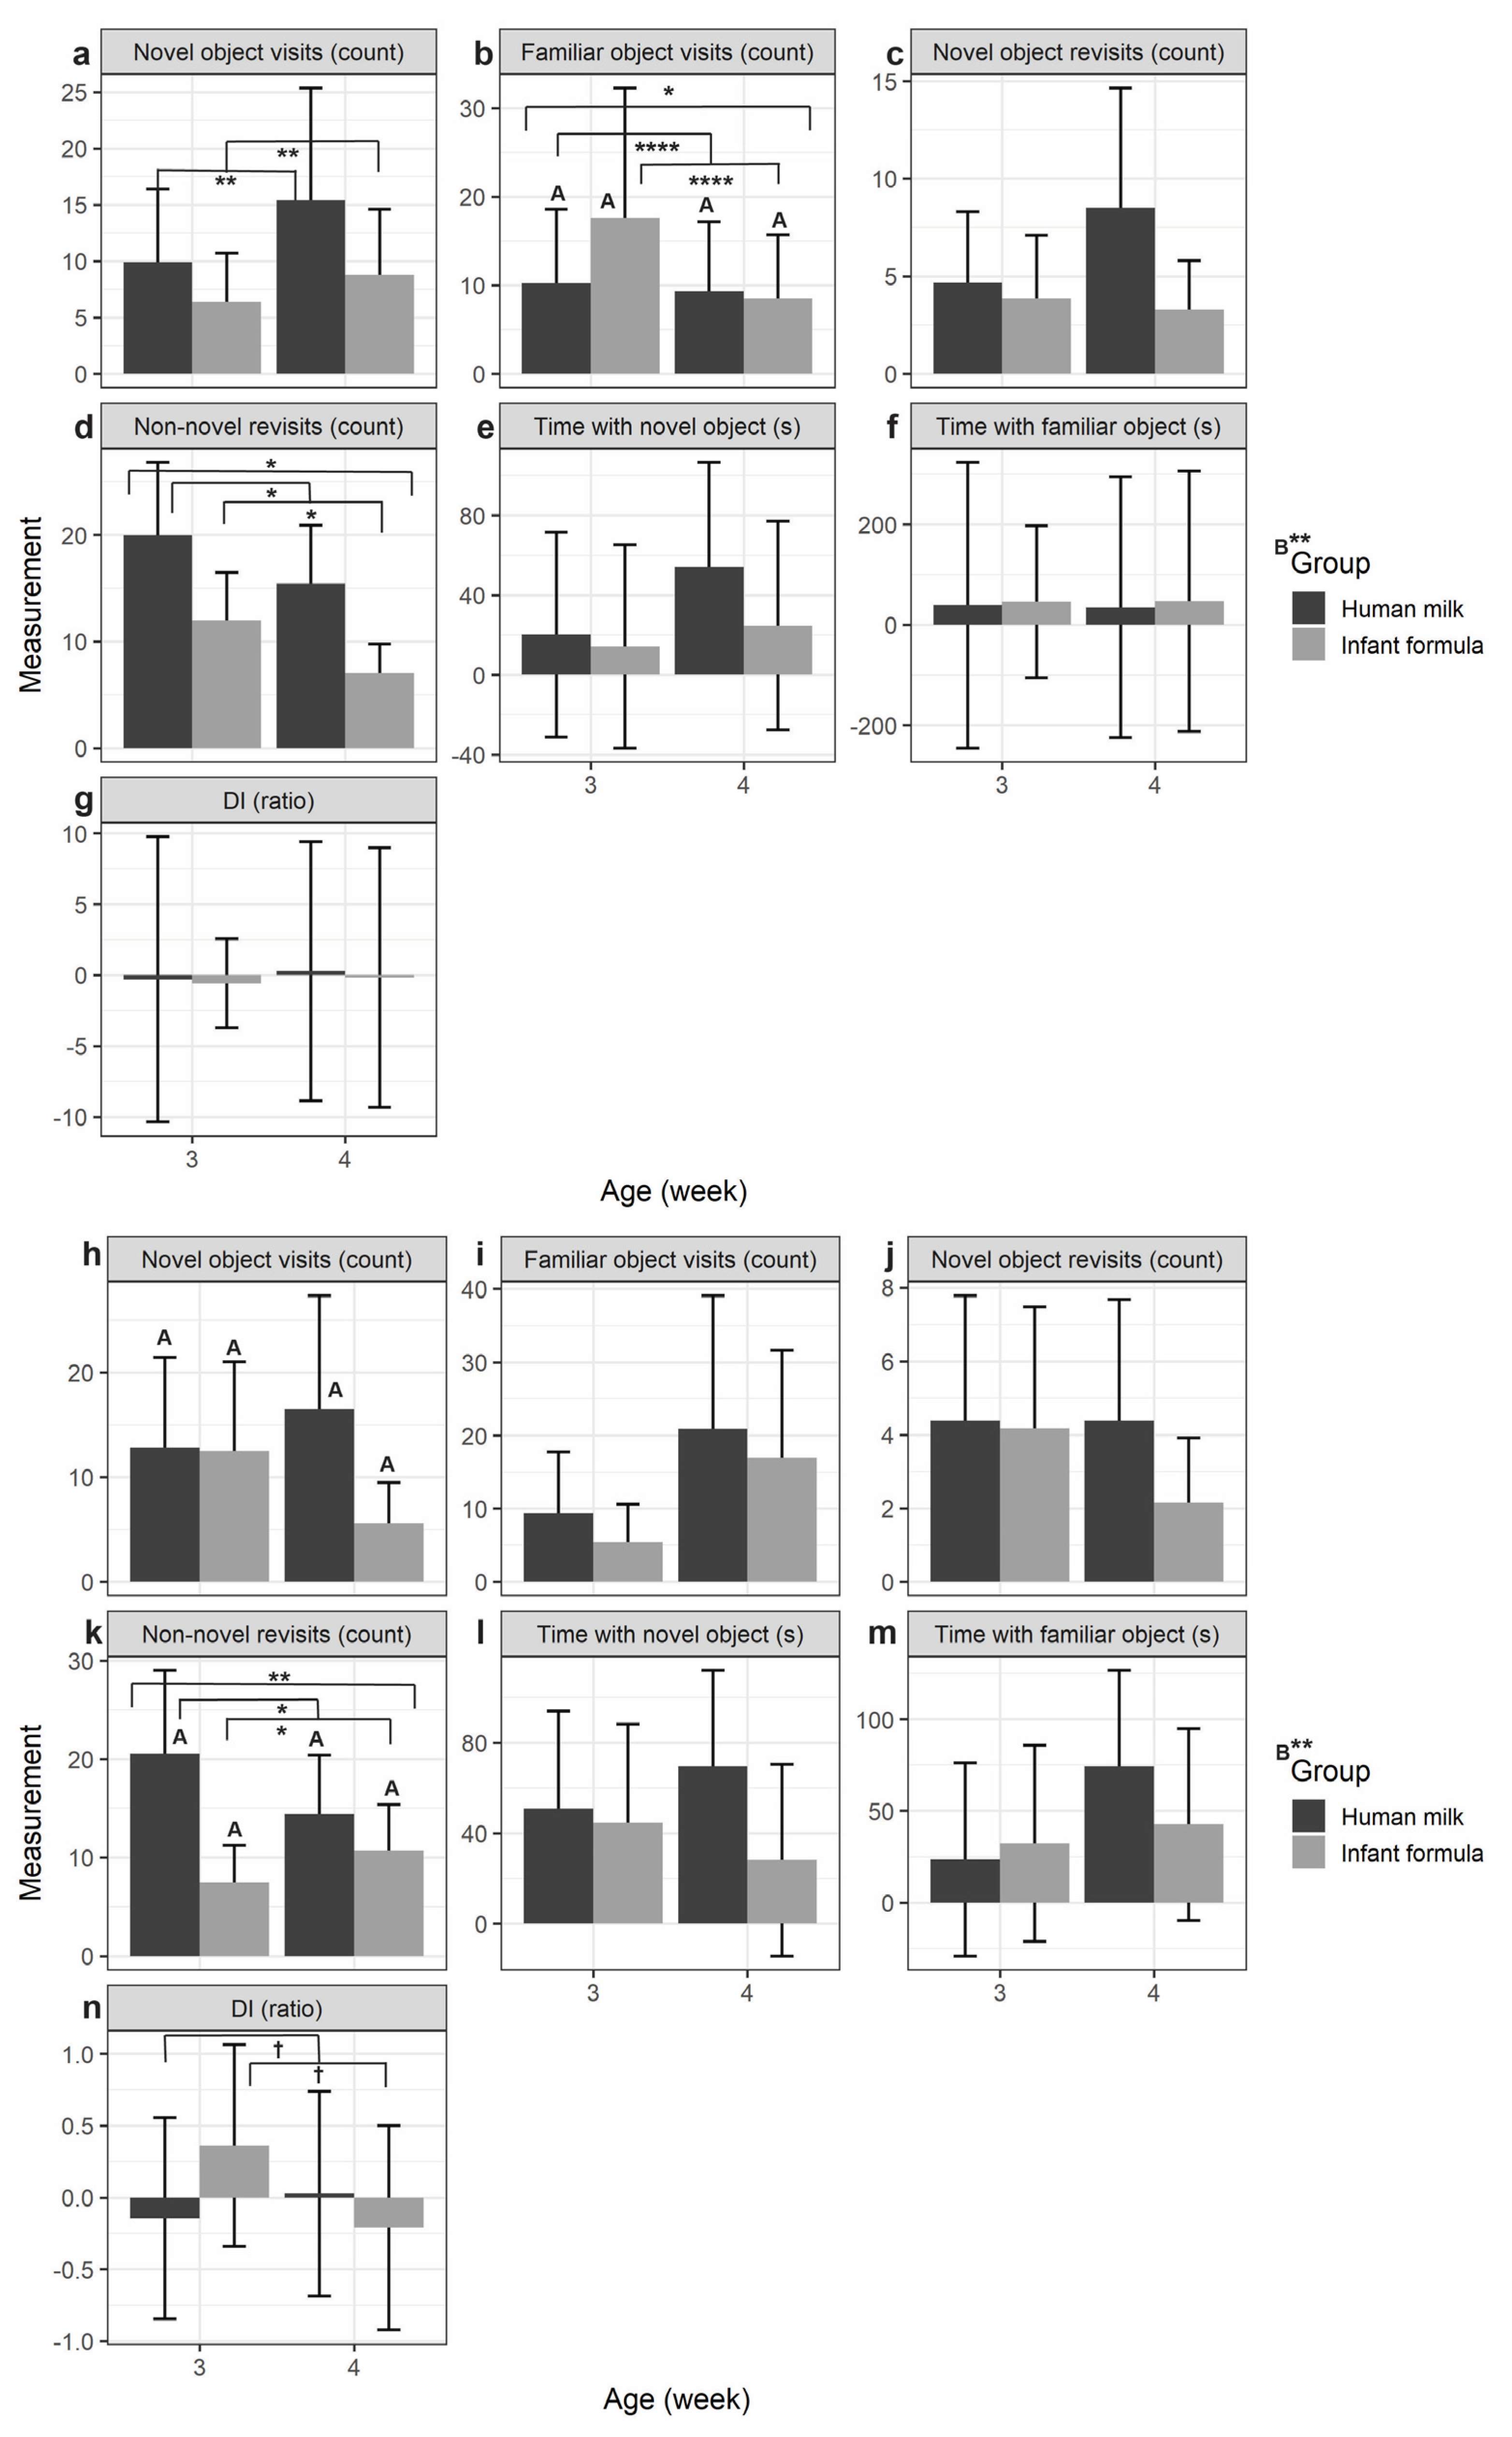
Figure 5.
Microglial morphology in the right prefrontal cortex of HM-fed (n = 3) vs. IF-fed piglets (n = 3) at PD30 as determined using immunofluorescence and quantified using 3DMorph: (a) average branch length (µm); (b) number of branch points (count); (c) number of end points (count); (d) cell complexity index (complexity score); (e) cell volume (µm3); (f) territorial volume (µm3); (g) representative images of HM-fed microglia and (h) IF-fed microglia; Iba1-green; DAPI-blue; scale bar = 50 um. **p < 0.01, ****p < 0.0001. µm =micrometer or micron; µm^3 = micrometer or micron cubed; HM = Human milk; IF = bovine milk-derived infant formula; PD = postnatal day.
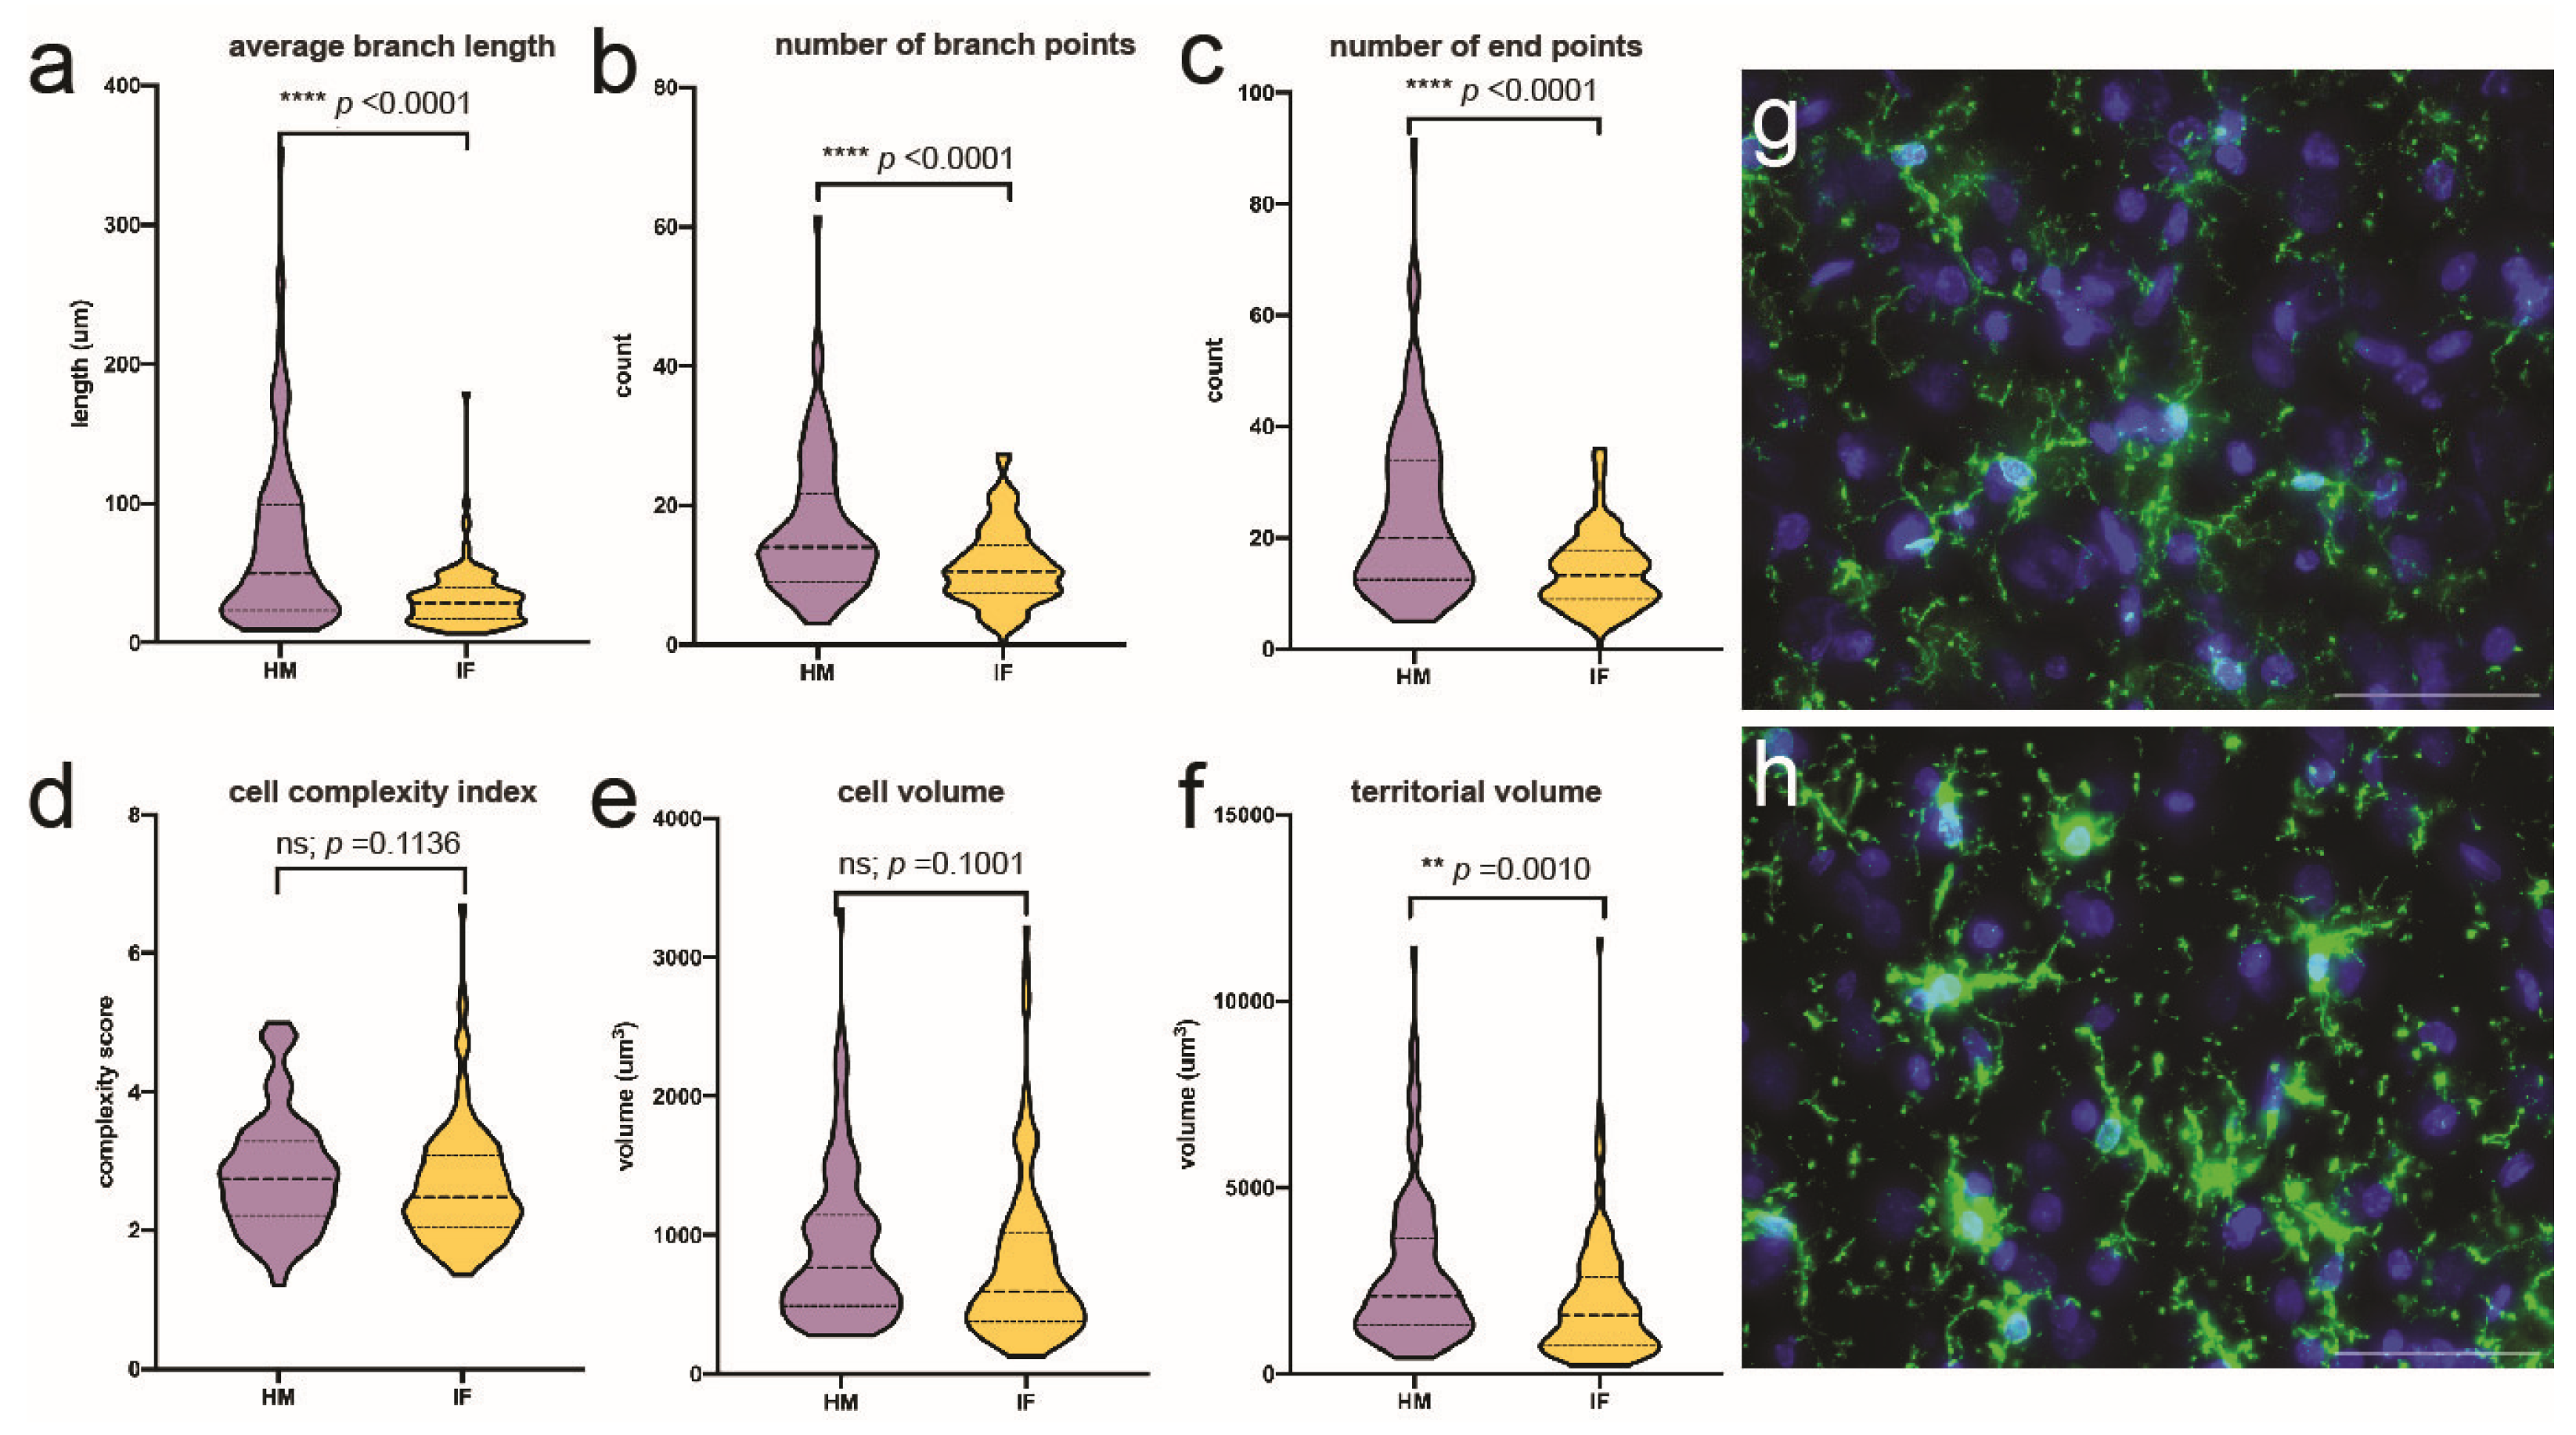

Table 1.
Novel object recognition (NOR) p-value results from ANOVA for all models and variables: Variables were divided based upon NOR phase (habituation, novel or control). Comparisons were by dietary nutrition group (HM-fed [n=3] vs. IF-fed [n=3]), piglet age (3-weeks-old vs. 4-weeks-old), and potential interactions (nutrition-by-age). .
| Variable | Nutritional Group | Age | Nutrition-by-age |
|---|---|---|---|
|
Habituation Variables Distance Traveled Total Time Moving Total Center Time Total Border Time Border Visits |
|||
| 0.176 | 8.77 x 10⁻⁴*** | 0.347 | |
| 0.169 | 0.037* | 0.485 | |
| 0.224 | 0.003** | 9.75 x 10⁻⁶**** | |
| 0.231 | 0.002** | 1.00 x 10⁻⁵**** | |
| 0.369 | 0.015* | 1.94 x 10⁻⁵**** | |
|
Novel Variables Novel Object Visits Familiar Object Visits Novel Object Revisits Non-novel Object Revisits Time with Novel Object Time with Familiar Object DI |
|||
| 0.356 | 0.001** | 0.603 | |
| 0.036* | 1.87 x 10⁻⁷**** | 0.002** | |
| 0.102 | 0.283 | 0.853 | |
| 0.033* | 0.023* | 0.123 | |
| 0.442 | 0.373 | 0.760 | |
| 0.582 | 0.918 | 0.893 | |
| 0.371 | 0.224 | 0.839 | |
|
Control Variables Novel Object Visits Familiar Object Visits Novel Object Revisits Non-novel Object Revisits Time with Novel Object Time with Familiar Object DI |
|||
| 0.847 | 0.321 | 1.28 x 10⁻⁴*** | |
| 0.649 | 0.107 | 0.579 | |
| 0.847 | 0.919 | 0.121 | |
| 0.001** | 0.010* | 0.005** | |
| 0.428 | 0.935 | 0.312 | |
| 0.599 | 0.424 | 0.169 | |
| 0.666 | 0.072† | 0.193 |
†p<0.10, *p < 0.05, **p < 0.01, ***p < 0.001, ****p < 0.0001. HM = human milk; IF = bovine milk-derived infant formula; Visits = count; Distance = centimeters; Time = seconds .
Disclaimer/Publisher’s Note: The statements, opinions and data contained in all publications are solely those of the individual author(s) and contributor(s) and not of MDPI and/or the editor(s). MDPI and/or the editor(s) disclaim responsibility for any injury to people or property resulting from any ideas, methods, instructions or products referred to in the content. |
© 2024 by the authors. Licensee MDPI, Basel, Switzerland. This article is an open access article distributed under the terms and conditions of the Creative Commons Attribution (CC BY) license (http://creativecommons.org/licenses/by/4.0/).
Copyright: This open access article is published under a Creative Commons CC BY 4.0 license, which permit the free download, distribution, and reuse, provided that the author and preprint are cited in any reuse.


