Submitted:
24 May 2024
Posted:
27 May 2024
You are already at the latest version
Abstract
In view of the fact that the field monitoring information can more intuitively and accurately reflect the stability state of slopes, this paper takes the warning threshold of slope deformation rate monitoring as the slope stability evaluation standard, and puts forward a method for solving the safety coefficient of rocky slopes. The discrete element method 3DEC, which is suitable for rocky slopes, is selected as the numerical calculation tool, and the convergence criterion of its strength reduction method is modified to the slope deformation rate threshold, and the method is realized by the bifurcation method through its built-in FISH programming language. The results of the classical case show that, by selecting the slope deformation rate threshold in the appropriate interval, the results of this paper's method are very close to those of the finite unit stress method and the limit equilibrium method, which verifies the reliability of this paper's method. Further, the method of this paper is applied to an open-pit mine slope project, based on the slope deformation on-site monitoring data, through the time series prediction method to determine the slope deformation rate warning threshold, using the threshold as an evaluation criterion to solve the slope's coefficient of safety, the calculation results show that: the slope's coefficient of safety in natural working conditions is 1.086, basically stable, suffered from continuous rainfall, the slope body is gradually saturated, the slope's coefficient of safety is reduced to 0.987, the slope's safety is reduced to 0.987. After continuous rainfall and gradual saturation of the slope, the coefficient of safety decreased to 0.987, destabilizing and destroying, which is consistent with the site conditions.
Keywords:
rocky slopes
; safety factor
; strength reduction method
; monitoring and warning
; deformation rate
1. Introduction
In the field of geotechnical engineering and geohazard prevention, it is crucial to accurately assess the stability of slopes and calculate their factor of safety. Among the many methods for solving the factor of safety of slopes, the limit equilibrium method and the strength reduction method are the most widely used. The limit equilibrium method assumes that the slope is in equilibrium in the limit state, and based on the equilibrium relationship between external and internal forces/moments, the stability equation is established to obtain the slope safety factor. Although this method is simple and intuitive, its applicability is limited when dealing with complex slopes because it does not take into account the deformation and internal structural characteristics of the geotechnical body. In contrast, the strength reduction method is usually combined with numerical calculation methods such as finite element and finite difference, which can consider more complex geological structures and analyze the force and deformation of geotechnical bodies, so that the calculation results are more in line with the engineering reality and have wider applicability.
The core problem in slope stability analysis using the strength reduction method is to identify whether the slope has reached a state of ultimate equilibrium. Currently, the following three evaluation criteria are commonly used in numerical calculation methods: convergence of unbalanced force [1], sudden change of displacement in characteristic parts [2,3] and plastic zone penetration. [4] The following three criteria are currently used in numerical calculation methods: convergence of unbalanced forces, sudden change in displacement at a feature and penetration of the plastic zone. Although reasonable results can be obtained in most cases, they may show limitations under specific conditions, e.g., the unbalanced force convergence criterion may lead to misjudgment when only local damage or small-scale large deformation occurs while the overall slope is still stable, and the latter two criteria depend on the selection of the feature site or the applicability of the plastic damage criterion. For this reason, some scholars have attempted to establish new judging indexes in order to more accurately and comprehensively identify the critical instability state of slopes. Li Changming et al. [5] constructed a fuzzy comprehensive evaluation model for slope stability analysis and a boundary value matrix of associated factors to comprehensively evaluate the stability of slopes. Yang Tianhong et al. [6] Revealed the dynamic connection between microseismic activity, strength weakening and slope stability in the internal “space” damage deterioration of the slope rock mass, and realized the dynamic evaluation of slope stability by using the microseismic precursor information and strength reserve coefficient of the slope rock mass as the indexes. Salmi and Hosseinzadeh [7] judged the slope damage based on the overall displacement vector of the slope. These research results promote the development of the strength discount method, but its feasibility and applicability on complex engineering slopes still need to be further studied.
In recent years, with the rapid development of monitoring and early warning technology, deformation monitoring and early warning systems have been arranged on most of the important slopes in China, which provides a more direct means of judging the critical state of slopes. Qu et al. [8] Based on the on-site deformation monitoring data, the improved genetic algorithm was used to predict the destabilization critical slip of slopes in open pit quarries. Dong Jie et al. [9] A joint multivariate prediction model of landslide displacement based on CEEMDAN-LSTM is established for slope displacement evolution and instability prediction. Shen Jinglin et al. [10] revealed the correlation between slope stability and internal angle, and proposed to use angle change as a monitoring indicator to predict slope instability. Some scholars also combine monitoring and warning with numerical calculation to analyze the stability of slopes, such as Cheng Yongchun et al. [11] Based on the monitoring information of slope displacement, the neural network algorithm uses the finite element simulation data as the training samples, and establishes the functional relationship between the slope safety coefficient and its displacement, according to which the slope safety coefficient can be obtained directly from the displacement monitoring data, which provides a new way of thinking for the evaluation of the stability of slopes.
In this paper, the deformation rate easily and accurately obtained by the slope monitoring and early warning system is used as the evaluation index, and the threshold value of slope deformation rate is obtained through the time series prediction method, which is used as the criterion of slope destabilization in the numerical calculation method, so as to put forward a method of solving the coefficient of safety of the rocky slopes. The 3DEC (3 Dimensional Distinct Element Code), which is applicable to rocky slopes, is used as a numerical calculation tool, and the convergence criterion of the strength reduction method is modified to the slope deformation rate threshold, and the method is realized by the built-in FISH programming language, and the feasibility and accuracy of the method are verified by classical cases, and then applied to the slope stability of an open-pit mine. The method is realized by its built-in FISH programming language, and the feasibility and accuracy of the method is verified by classical cases and applied in the slope stability evaluation of an open pit mine.
2. Deformation Rate Threshold Based Solution for Slope Safety Factor
2.1. Fundamentals of the Discrete Element-Intensity Discounting Method
Methods such as finite element and finite difference are based on the assumption of continuous medium, which can only deal with a small number of discontinuous surfaces, while the engineering rock mass is rich in discontinuous surfaces such as joints and fissures, and its deformation and damage are subject to these discontinuous surfaces, which have significant discontinuity characteristics, and its mechanical behavior is more suitable for simulation by discontinuous medium methods, such as discrete element and DDA. Therefore, this paper investigates the solution method for the safety factor of rocky slopes based on the three-dimensional discrete element method 3DEC.
Discrete unit method [12] is a numerical calculation method proposed by Cundall in 1971, which is a powerful tool for analyzing the deformation and motion problems of discrete media, and is also widely used in the field of geotechnical engineering. The method regards the jointed rock body as a discrete medium system composed of rock blocks and jointed surfaces, which allows the rock blocks to translate, rotate and deform, while the jointed surfaces can slip, separate or flip, so that the discontinuous large deformation and damage behavior of the jointed rock body can be simulated.
In the discrete cell method, the motion of a single block follows Newton’s second law of motion, and the equations of motion of the block can be obtained based on the combined force transmitted to the block by neighboring blocks through the nodal plane, combined with its deformation intrinsic relationship:
Within this formula: m is the mass of the block, u is the displacement, t is the time, c is the viscous damping, k is the stiffness coefficient, and f is the external force applied to the block.
The interaction between blocks is described by the force-displacement relationship, which is usually assumed to be proportional to each other, i.e:
Fn =Kn *Un
Fs =Ks *Us
Within this formula: Fn and Fs are the normal and tangential components of the contact force, Kn and Ks are the normal and tangential stiffnesses, and Un and Us are the normal and tangential components of the contact displacement, respectively.
For engineered rock masses, the force-displacement relationship between blocks is characterized by nonlinearity, which is usually described by the Coulomb slip model, i.e., the normal direction is not subject to tension and the tangential direction can generate slip:
Within this formula: c is the cohesive force on the contact surface, φ is the friction angle, and A is the contact area.
The discrete elements are calculated using the strength discount method to obtain the factor of safety of the slope. The basic principle of the strength discount method is to divide the strength parameters of the slope geotechnical body (rock mass and joint surface) by a discount factor at the same time to obtain a new set of strength parameters, which are then input as the new material parameters and then calculated, and when the slope is in a critical state, the corresponding discount factor is defined as the slope’s safety factor.
The discount factor K is defined as follows:
K=c/c′
K=tanφ/tanφ′
K=tanφ/tanφ′
Within this formula: c and φ are the cohesion and internal friction angle of the geotechnical body, and c′ and φ′ are the cohesion and internal friction angle after discounting, respectively.
2.2. Slope Destabilization Criteria
The judgment of the critical state of the slope is a key problem of the strength discount method, and different discrimination methods will produce large differences. At present, there are mainly three kinds of slope instability judgments adopted by numerical calculation methods: calculation convergence, displacement mutation, and plastic zone penetration. These criteria have their own characteristics and applicability, and in many cases, they may not be suitable for judging the destabilization of rocky slopes, for example, the deformation and stability of rocky slopes are controlled by the structural surface, and the rock itself will not undergo a large deformation and enter into the plastic state, so the plastic zone penetration criterion is not applicable.
Slope destabilization damage has a more complex internal mechanism, is a combination of various factors, the external visualization of the slope body produced accelerated movement, the emergence of large deformation can not be restored or stabilized, macro-expression of cracks through, the whole sliding and other damages. Many scholars have carried out a lot of on-site monitoring of slopes, and concluded that the evolution of slope deformation and instability has the following characteristics: when the deformation rate of the slope body is kept at a low level of fluctuation, the slope is basically stable; when the slope is subjected to external disturbances, the stability of the slope is reduced, the deformation rate begins to grow, and when it reaches a certain threshold, the slope will not be able to maintain the stability, and enters into the state of instability. This law has been successfully applied to the landslide near-slip prediction. [13,14] It can also be applied to the numerical analysis of slope stability as a criterion of slope destabilization.
This paper introduces the deformation rate index in the landslide near-slip prediction, determines the warning threshold of slope instability deformation rate by analyzing the deformation monitoring data and trend prediction of the key points, and replaces it with the convergence criterion of the calculation that comes with the 3DEC software to solve the safety coefficient of rocky slopes.
2.3. Program Realization Process
The FISH language of 3DEC software is used to write the program to implement the method of this paper. In order to reach the critical state of the slope as soon as possible and reduce the number of calculations, the bifurcation strategy is used for iterative calculations, and the specific implementation process is as follows (Figure 1):
- 1)
- First, set the parameters, including: the deformation rate threshold vth, the lower limit K1, the upper limit K2 and the tolerance δ of the folding coefficient K, and the maximum number of iterative steps n;
- 2)
- Then, make K=K1, get the new strength parameters: c/K, tanφ/K, using this parameter for calculation, if the deformation rate of the key point v>vth, the slope is unstable, its safety factor is less than K1, exit the calculation; if v≤vth, the slope is stable, the third step of calculation;
- 3)
- Then make K=K2, get the new strength parameters, calculate again, if the key point deformation rate v ≤ vth, then the slope safety factor is greater than K, exit the calculation; if v>vth, then the slope is unstable, the fourth step calculation;
- 4)
- Make K = (K1 +K2)/2, calculate again, if the slope is stable, then take K1 =K, if the slope is unstable, then take K2 =K, so that the range of K is reduced by half; iterative, until the slope critical instability, when K1 and K2 are very close to, less than the tolerance δ, take the average of its as the result of the calculation of the safety factor.
3. Classic Case Validation
The classic case model used in this study is Dawson et al. [15] described as an example of stability analysis. A schematic of this analytical model is shown in Figure 2, and the physico-mechanical indices of the geotechnical body used for the calculations are listed in Table 1. Since the Dawson et al. example is a two-dimensional model, in the 3DEC analysis of this example, only one cell width is used in the y-direction (which is taken to be 0.5 m), and y-direction velocities are constrained at all nodes of the model to allow for an equivalent plane strain analysis.

Table 2.
Physical and Mechanical Marameter Indicators.
| ρ/kg-m-3 | K/MPa | G/MPa | c/kPa | φ/(°) | σt /MPa |
| 2000 | 100 | 30 | 12.38 | 20 | 1000 |
The coefficient of safety of this slope under different deformation rate thresholds was calculated through the simulation analysis of 3DEC discrete element software. The relationship curve between the deformation rate threshold and the safety factor is shown in Figure 3.
From Figure 3, it is known that different settings of the deformation rate threshold can obtain different safety coefficients when solving for the safety coefficient. When the deformation rate threshold is set between 2.00×10⁻⁵ m/s and 3.00×10⁻⁴ m/s, the obtained safety coefficients are unchanged and are all 1.086, and the safety coefficients obtained in this range are considered to be reliable. When the threshold value is further increased, the result of the safety coefficient changes and increases with the increase of the threshold value, and the safety coefficient increases from 1.102 to 1.117 as the deformation rate threshold range increases from 2.00×10⁻³ m/s to 2.00×10⁻² m/s, and the safety coefficients obtained in this range are unstable, and therefore the results of the safety coefficients obtained here are considered to be unreliable. Using the finite element method, the safety factor of the same calculation model is 1.049, with an error of 3.4%, and using the limit equilibrium method, the safety factor is 0.957, with an error of 11.9%. Therefore, it was determined that the factor of safety was 1.086. It was also determined that the deformation monitoring threshold was 3.00×10⁻⁴ m/s for this working condition with physico-mechanical parameters.
3. Engineering Applications
3.1. Geological and Engineering Background
A slope project is located in Taihe Town, Xichang City, Sichuan Province (Figure 4). The geographic coordinates of the foot of the slope are east longitude: 102º07′ 35.44”, north latitude: 27º54′ 26.27”. The slope of the quarry is surrounded by high mountains in the west, south and north, and open in the east. Under the action of artificial mining, the quarry has formed a number of steps, with the slope angle of the mining steps ranging from 45 to 54°, and the angle of the overall slope ranging from 29 to 44°. At present, the elevation of the bottom of the pit is 1530 m. The maximum difference in elevation of the slope is 618 m, which is a super-high slope. The slope stratum of the quarry is composed of powdery clay, moraine soil, gabbro and gabbro from top to bottom.
The study area of this paper contains a wedge (Figure 5 and Figure 6), which is developed in the middle of the slope on the west side of the north gang of the open-pit quarry, and is in the deformation zone of the wedge. The slope surface of the wedge is modified by mining stripping micro-geomorphic type in the form of steps, involving 11 steps, elevation from 1660m to 1758m, step height of about 12m, platform width ranging from 2m to 39m (the lower part of the not yet mined), the measured slope gradient of the upper part of the steps is about 40 °, the lower part of the 50-65 °, and the overall slope gradient of the upper part of the slow and the lower part of the steep. The plane of the wedge is approximately rectangular, with a maximum longitudinal length of about 280m and a transverse width of about 62m, and the maximum deformation depth of about 50m obtained from the deep displacement monitoring, with a square volume of about 50×104m3, a slip direction of about 175°, and an average height difference of 98m along the slip direction.
The quarry will need to continue to be mined 100 meters down from its current base, a process that will be carried out in two layers, each at a depth of 50 meters. The rocky slope is unstable and could collapse or landslide in the event of heavy rainfall, which would reduce the mechanical strength of the soil as it is soaked by rain.
3.2. Modeling and Boundary Conditions
The most important step in analyzing the movement and damage of jointed rock mass using 3DEC discrete element modeling software is to establish a simplified yet practical computational model. Based on the geological investigation of the slope, the actual geological conditions were reasonably simplified. In order to ensure that the computational boundaries do not affect the wedge area of interest, its width was extended to three times the width of the wedge during the modeling process. Based on the results of the geologic survey, a complex 3D geologic model containing the major fissures was created using Rhino software and exported as a 3DEC block file. By importing this file into 3DEC software, the required computational model was finally obtained. Finally, the model created was 660m×525m×530m at the maximum side length, respectively, as shown in Figure 7.
Numerical simulations were performed using the Mohr-Coulomb principal model. All faces except the top face (slope face) are set as fixed faces. In the DEM modeling of the slope, all blocks of the computational model are considered to be deformable and are modeled using the Mohr-Coulomb damage criterion. Based on the detailed site investigation and indoor straight shear test, the mechanical parameters of the rock and soil bodies were determined, as listed in Table 3. Since structural surfaces exist on the left and right sides of the wedge, the parameters of the structural surfaces were used to characterize this part. The parameters of the weak interlayer were used at the bottom of the wedge and at the interface between the rock and soil bodies.
3.3. Determination of Deformation Monitoring Thresholds
According to the conclusions obtained from the “Research Report on Surface Deformation Threshold of Open Pit Mining Slope of Heavy Steel Xichang Mining Co., Ltd.”, the monitoring system has not yet considered the indicators of deformation rate continuity, improvement of tangent angle, and the amount of single change. In order to adapt to the existing monitoring system, this study establishes a comprehensive early warning method through multiple indicators and determines the deformation rate as the threshold indicator.
The displacement rate unit of the existing system is mm/h, while the threshold unit in Table 4 is mm/d, which needs to be adjusted. According to the report, using the threshold method proposed in this project can better reflect the slope deformation and give a reasonable warning level, especially when the daily deformation rate is used, the daily deformation rate can effectively reduce the monitoring error, reduce false alarms and improve the warning accuracy. Therefore, this project adopts the deformation rate threshold of 10 mm/d, i.e., 1.158×10⁻⁸ m/s.
3.3. Analysis of Calculation Results
In the computational simulation software 3DEC, the convergence criterion for determining whether a simulation has reached equilibrium is whether the deformation rate converges within the detection threshold.
3.3.1. Solving for Factor of Safety in Natural Operating Conditions
In the numerical simulation under natural conditions, the boundary conditions used are the side boundaries are fixed in the corresponding directions and the bottom is fixed in the x, y and z directions. The damage criterion of the slope is the Mohr-Coulomb criterion, and its mechanical properties are listed in Table 3.In the computational simulation software 3DEC, the convergence criterion to determine whether the simulation has reached equilibrium is whether the deformation rate converges within the detection threshold. The value of the deformation rate in the calculation refers to Figure 4, for adopting a deformation rate threshold of 10 mm/d, i.e., 1.158 × 10⁻⁸ m/s.
From Figure 8 and Figure 9, it can be seen that under the natural working condition, the range of the discount factor is between 1.065 and 1.750, and the range of the deformation rate is between 7.857×10⁻⁸ m/s and 2.766×10⁻² m/s. The more the discount factor is, the more the safety factor is calculated. And the larger the discount factor, the larger the calculated safety factor. When the discount factor is 1.750, the maximum value of the deformation rate is 2.766×10⁻² m/s; when the safety factor is between 1.090 and 1.750, the results of the deformation rate calculation do not converge, and when it is between 1.063 and 1.086, the results of the calculation of the discount factor converge, and it is less than the threshold value. The rate of deformation changes abruptly at the discount factor of 1.086, so the safety factor of 1.086 is obtained.The stability analysis of rocky slope is carried out, and it is found that the slope remains basically stable under natural working conditions, which is consistent with the results of the on-site monitoring.
3.3.2. Factor of Safety Solution for Storm Conditions
In the numerical simulation under heavy rainfall conditions, the boundary conditions used are the side boundaries fixed in the corresponding directions and the bottom fixed in the x, y and z directions. The damage criterion of the slope is the Mohr-Coulomb criterion, and its mechanical properties are listed in Table 4.The values of deformation rate for the calculation refer to Table 4, for the adoption of a deformation rate threshold of 10 mm/d, i.e., 1.158 × 10⁻⁸ m/s.
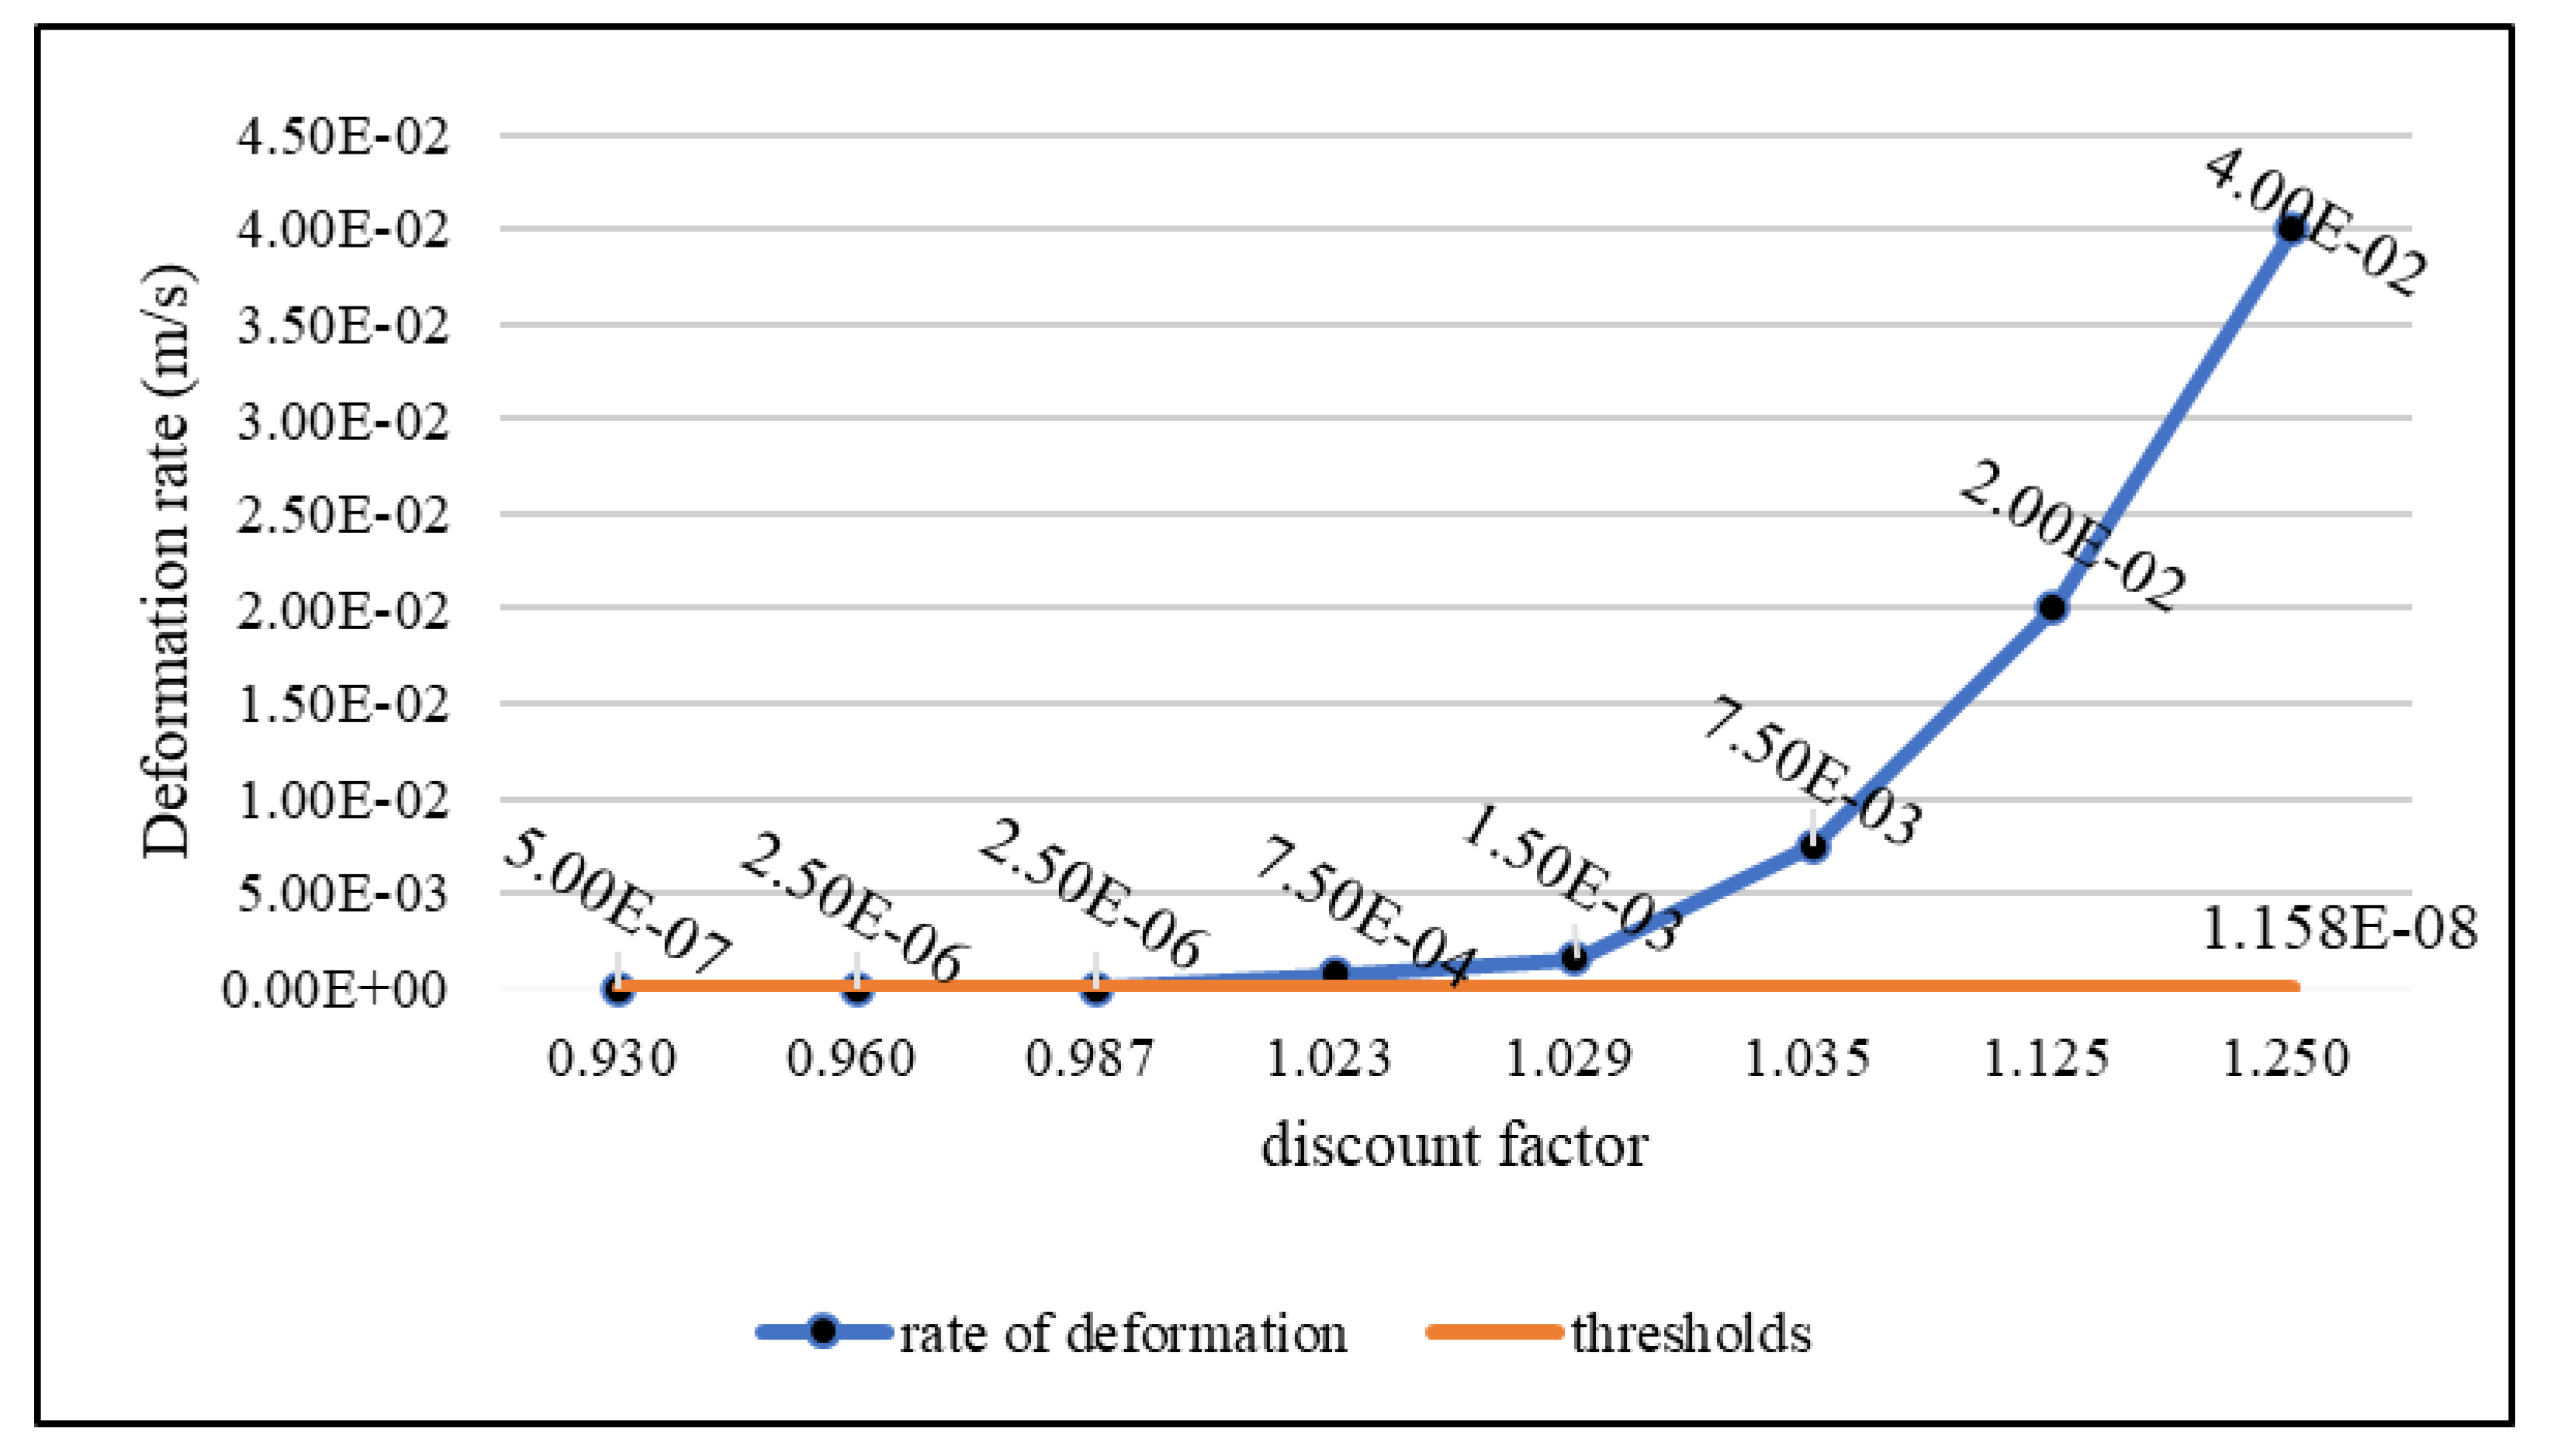
From Figure 6.4-3 and Table 6.4-4, it can be seen that under heavy rainfall conditions, the range of the discount factor solution is between 0.930 and 1.250, and the range of the deformation rate is between 7.500×10⁻⁸ m/s and 2.050×10⁻² m/s. The more the discount factor is, the more the safety factor is calculated. And the larger the discount factor, the larger the calculated safety factor. When the discount factor is 1.250, the maximum value of deformation rate is 2.050×10⁻² m/s; when the safety factor is between 1.023 and 1.250, the results of the deformation rate calculation do not converge, while between 0.930 and 0.987, the results of the calculation of the discount factor converge and are less than the threshold value. The rate of deformation changes abruptly at the discount factor of 0.987, so the safety factor is obtained as 0.987. The stability analysis of the rocky slope using the safety factor obtained by the method of this study shows that the slope is unstable under the heavy rainfall condition, and there is a slippage phenomenon, which is consistent with the results of the on-site monitoring.
Figure 11.
Deformation rate versus discount factor for storm conditions.
4. Conclusion
This paper explores the use of slope deformation monitoring warning threshold as a slope instability criterion in numerical computation, and proposes a rocky slope safety coefficient solution method; based on the three-dimensional discrete element program 3DEC, the convergence criterion is modified to the deformation rate criterion through the secondary development of its embedded FISH language to realize the solution of slope safety coefficient based on the deformation monitoring warning threshold. The following conclusions are drawn:
- (1)
- With the help of Rhino 7.4 modeling software to establish a high-precision numerical model, which can more clearly reflect the whole process of slope damage, 3DEC numerical simulation calculates that the slope is in a stable state under natural working conditions, and its stability is mainly controlled by rainfall, and local or large-scale deformation and damage may occur under the triggering of heavy rainfall.
- (2)
- The conclusions obtained from numerical simulation are in line with the actual monitoring situation, the slope stability analysis results of the safety coefficient of nodular rocky slopes corresponding to the deformation rate threshold are reliable, and the research method of numerical simulation combined with the monitoring means to comprehensively analyze the stability of slopes is closer to the actual situation of the slope project.
- (3)
- The proposed method for solving the coefficient of safety based on the deformation rate threshold is applied to the stability analysis of actual down-gradient high steep rocky slopes. Specifically, the factor of safety calculated by the method in this study is 1.086, which is basically consistent with the field observation results.
References
- Shangyi Zhao, Yingren Cheng, Yufang Zhangn. Lecture on limit analysis finite element method - II Discussion on the criterion of slope instability in finite element strength discount method. Geotechnics, 2005, (02): 332-6.
- ZIENKIEWICZ O C, HUMPHESON C, LEWIS R W. ASSOCIATED AND NON-ASSOCIATED VISCO-PLASTICITY AND PLASTICITY IN SOIL MECHANICS. Geotechnique, 1975, 25(4): 671-89.
- Song Erxiang. Finite element calculation of safety factor of geotechnical structures. Journal of Geotechnical Engineering, 1997, (02): 4-10.
- Maotian Luan, Yajun Wu, Tingkai Nian. Plastic zone criterion for slope instability and its application in strength discounted finite element method. Journal of Disaster Prevention and Mitigation Engineering, 2003, (03): 1-8.
- Changming, Li. Application of fuzzy analysis in slope stability evaluation. Journal of Rock Mechanics and Engineering, 1997, (05): 92-7.
- Tianhong Yang, Fengchun Zhang, Qinglei Yu, et al. Current status and development trend of research on the stability of high and steep slopes in open pit mines. Geotechnics, 2011, 32(05): 1437-51+72.
- SALMI E F, HOSSEINZADEH S. Slope stability assessment using both empirical and numerical methods: a case study. Bulletin of Engineering Geology and the Environment, 2015, 74: 13-25.
- Qu. Early warning method of unstable slope near slip in open pit quarry based on improved genetic algorithm. China Coal Geology, 2023, 35(03): 55-9.
- Jie Dong. Slope Displacement Prediction and Instability Characterization Based on CEEMDAN-LSTM. South Central University, 2024.
- Jinglin Shen. Research on highway slope deformation law and engineering application based on real-time angle monitoring, Shandong Institute of Transportation, 2022.
- Yongchun Cheng, Ping Jiang, Guojin Tan, et al. Real-time judgment of soil slope stability based on displacement monitoring information. Journal of Jilin University (Engineering Edition), 2012, 42(06): 1487-90.
- CUNDALL P, A. A computer model for simulating progressive large-scale movements in blocky rock systems. Procintsympon Rock Fracture, 1971, 1(ii-b): 11-8.
- J. Song, L. Li, L. Ji. Slope stability analysis and dramatic slip prediction based on monitoring data. Survey Science and Technology, 2017, (06): 6-10+26.
- Cuisong, Bu. Research on the stability analysis and monitoring and forecasting technology of landslide body at the mouth of Qinglong Tunnel. South Central University, 2007.
- DAWSON E M, ROTH W H, DRESCHER A. Slope stability analysis by strength reduction. Géotechnique, 1999, 49(6): 835-40.
Figure 1.
FISH calculation flow.
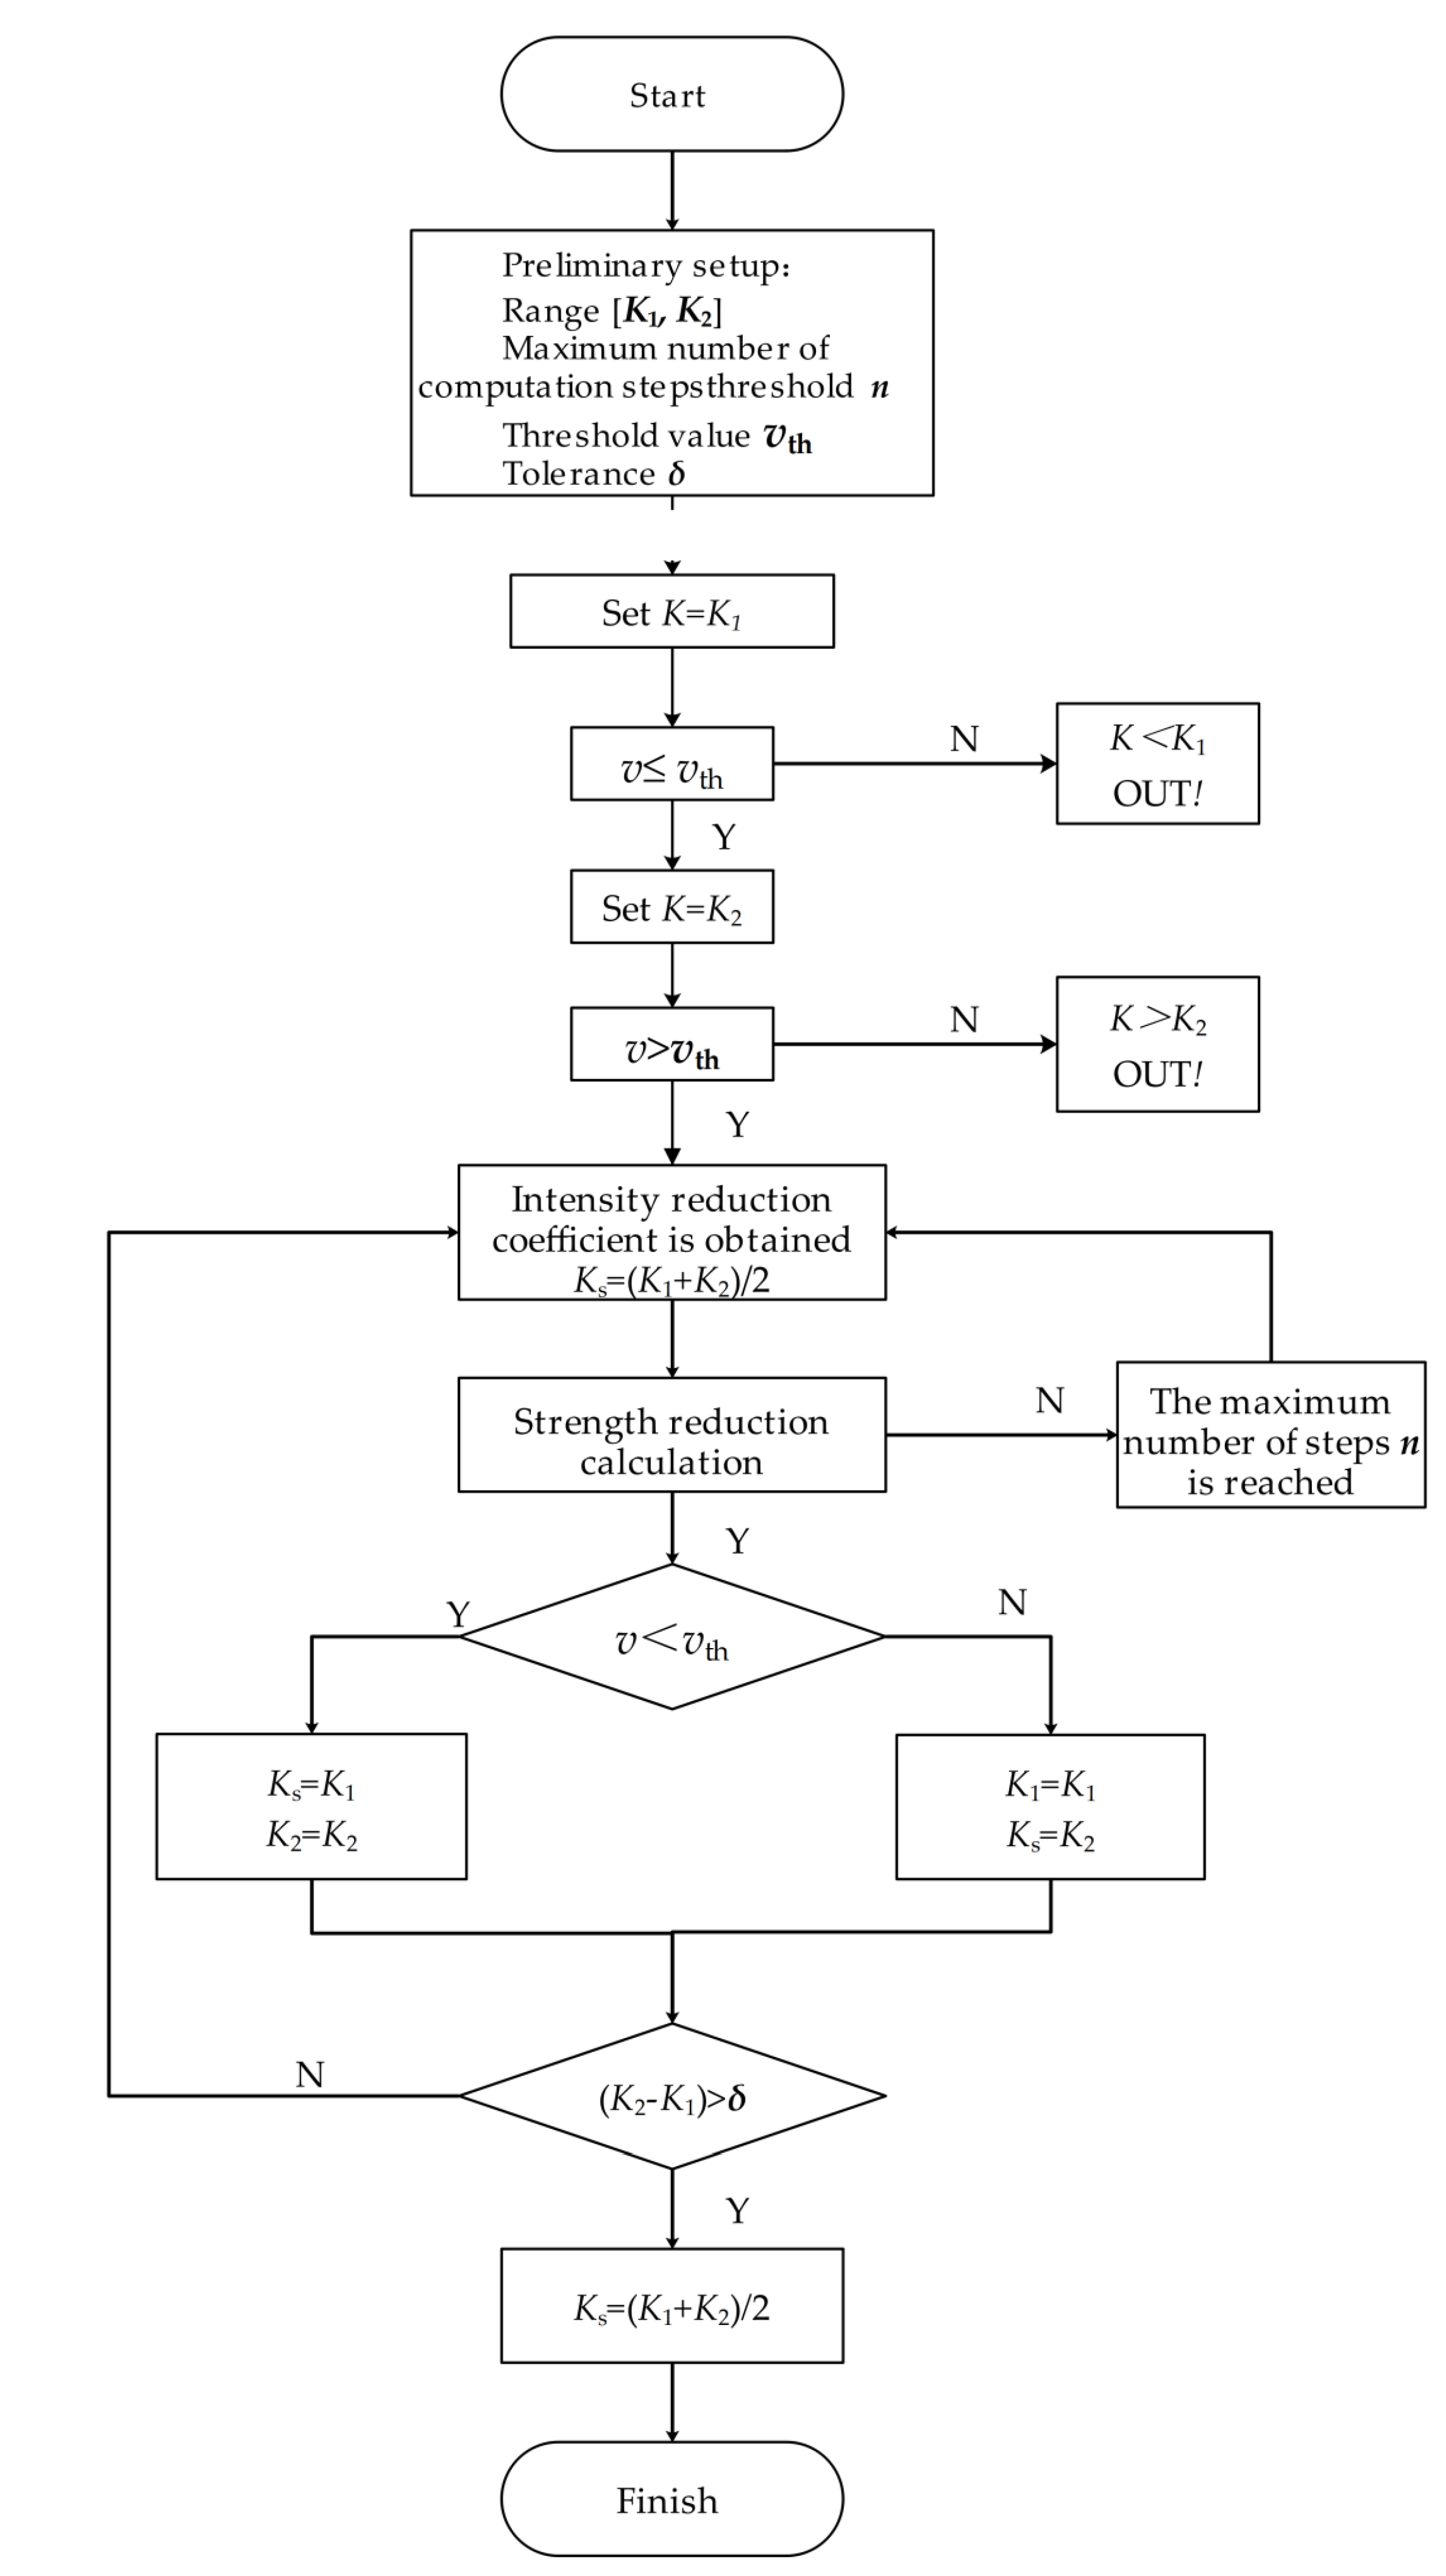
Figure 2.
Schematic diagram of the analytical model.
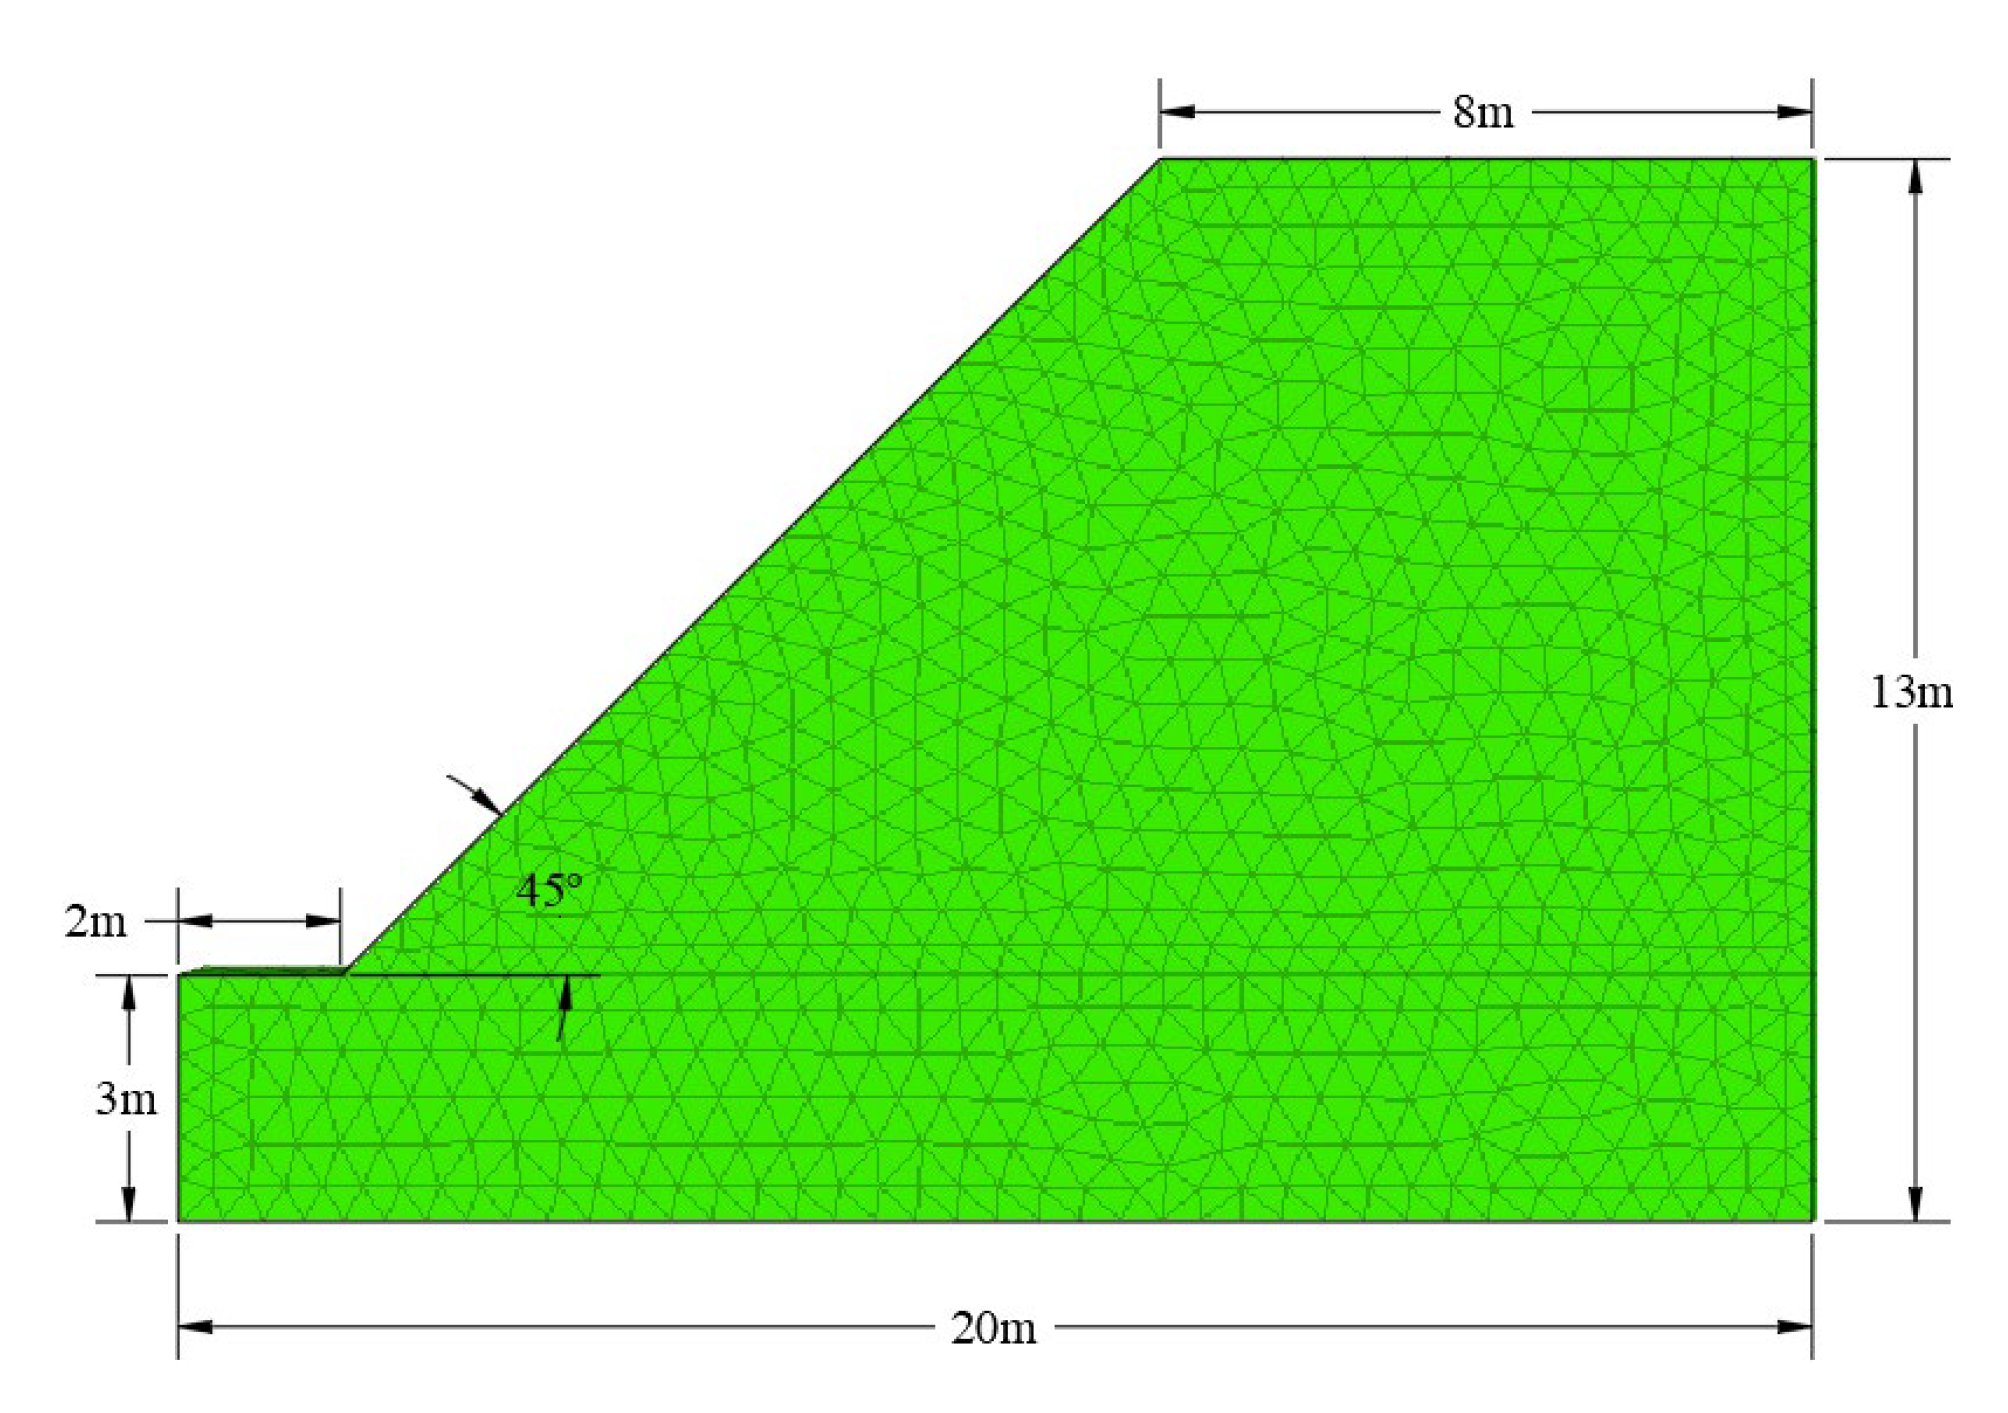
Figure 3.
Curve of deformation rate threshold versus safety factor.
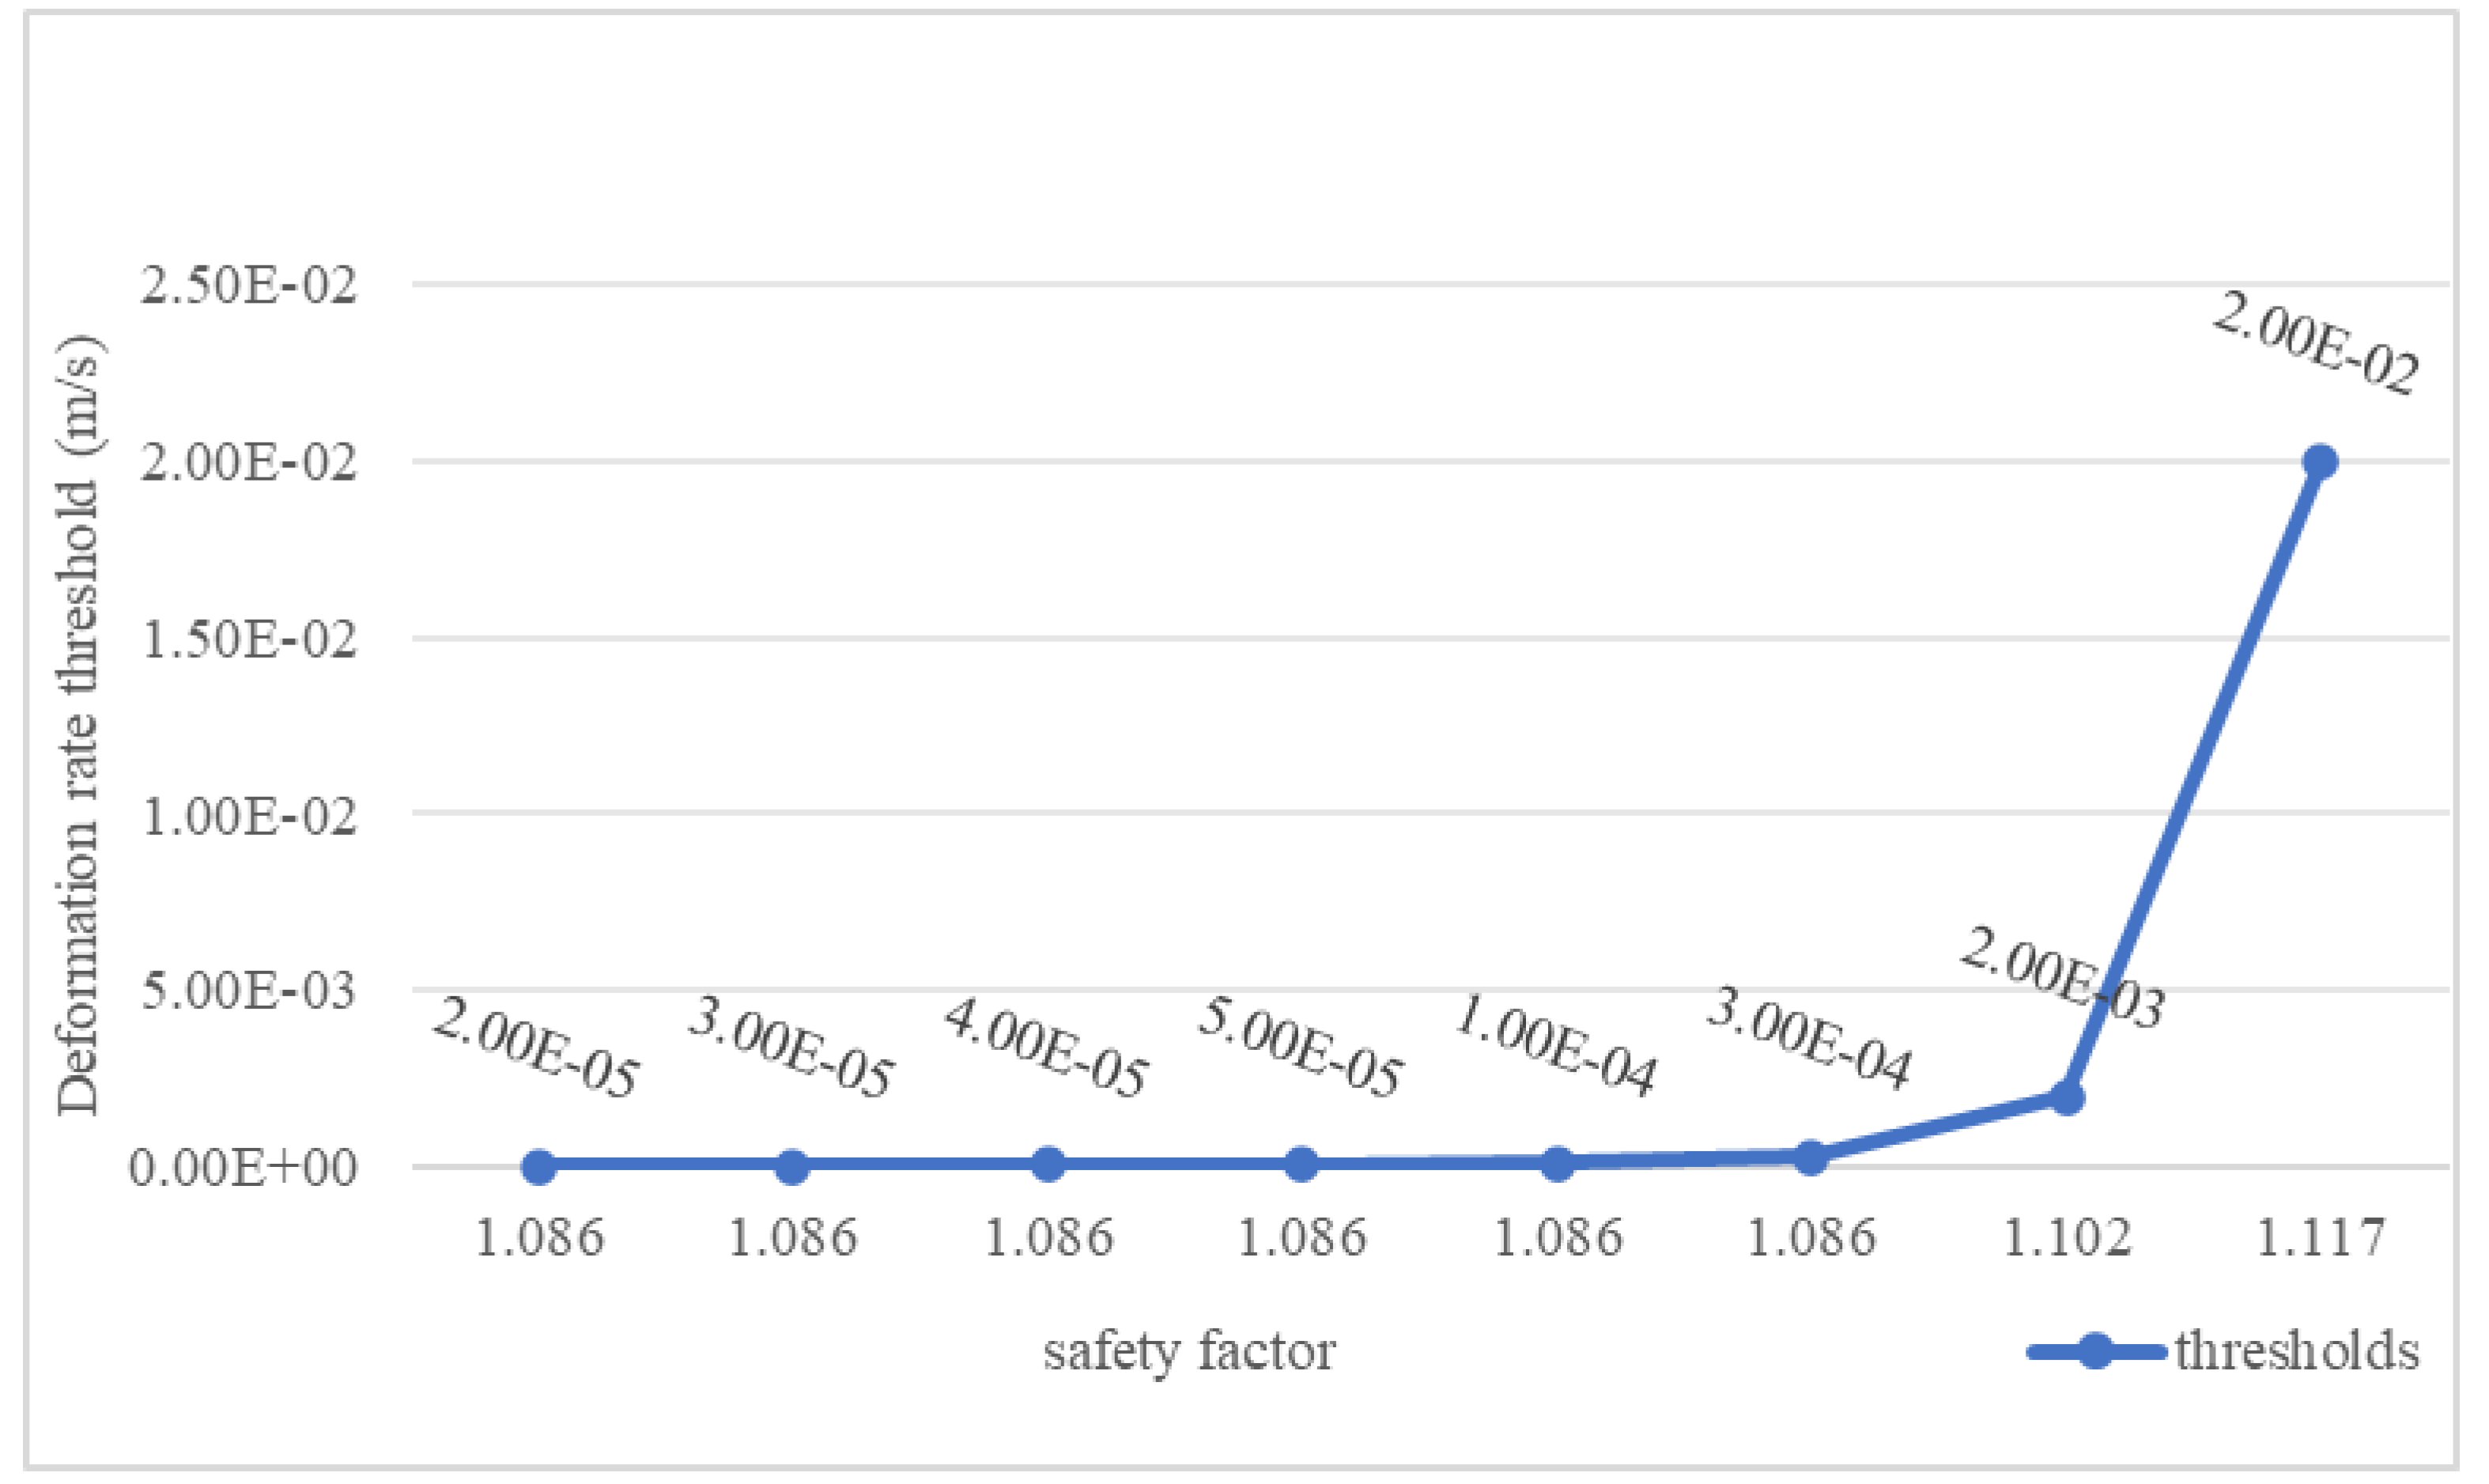
Figure 4.
Slope of the north gang of the mine.
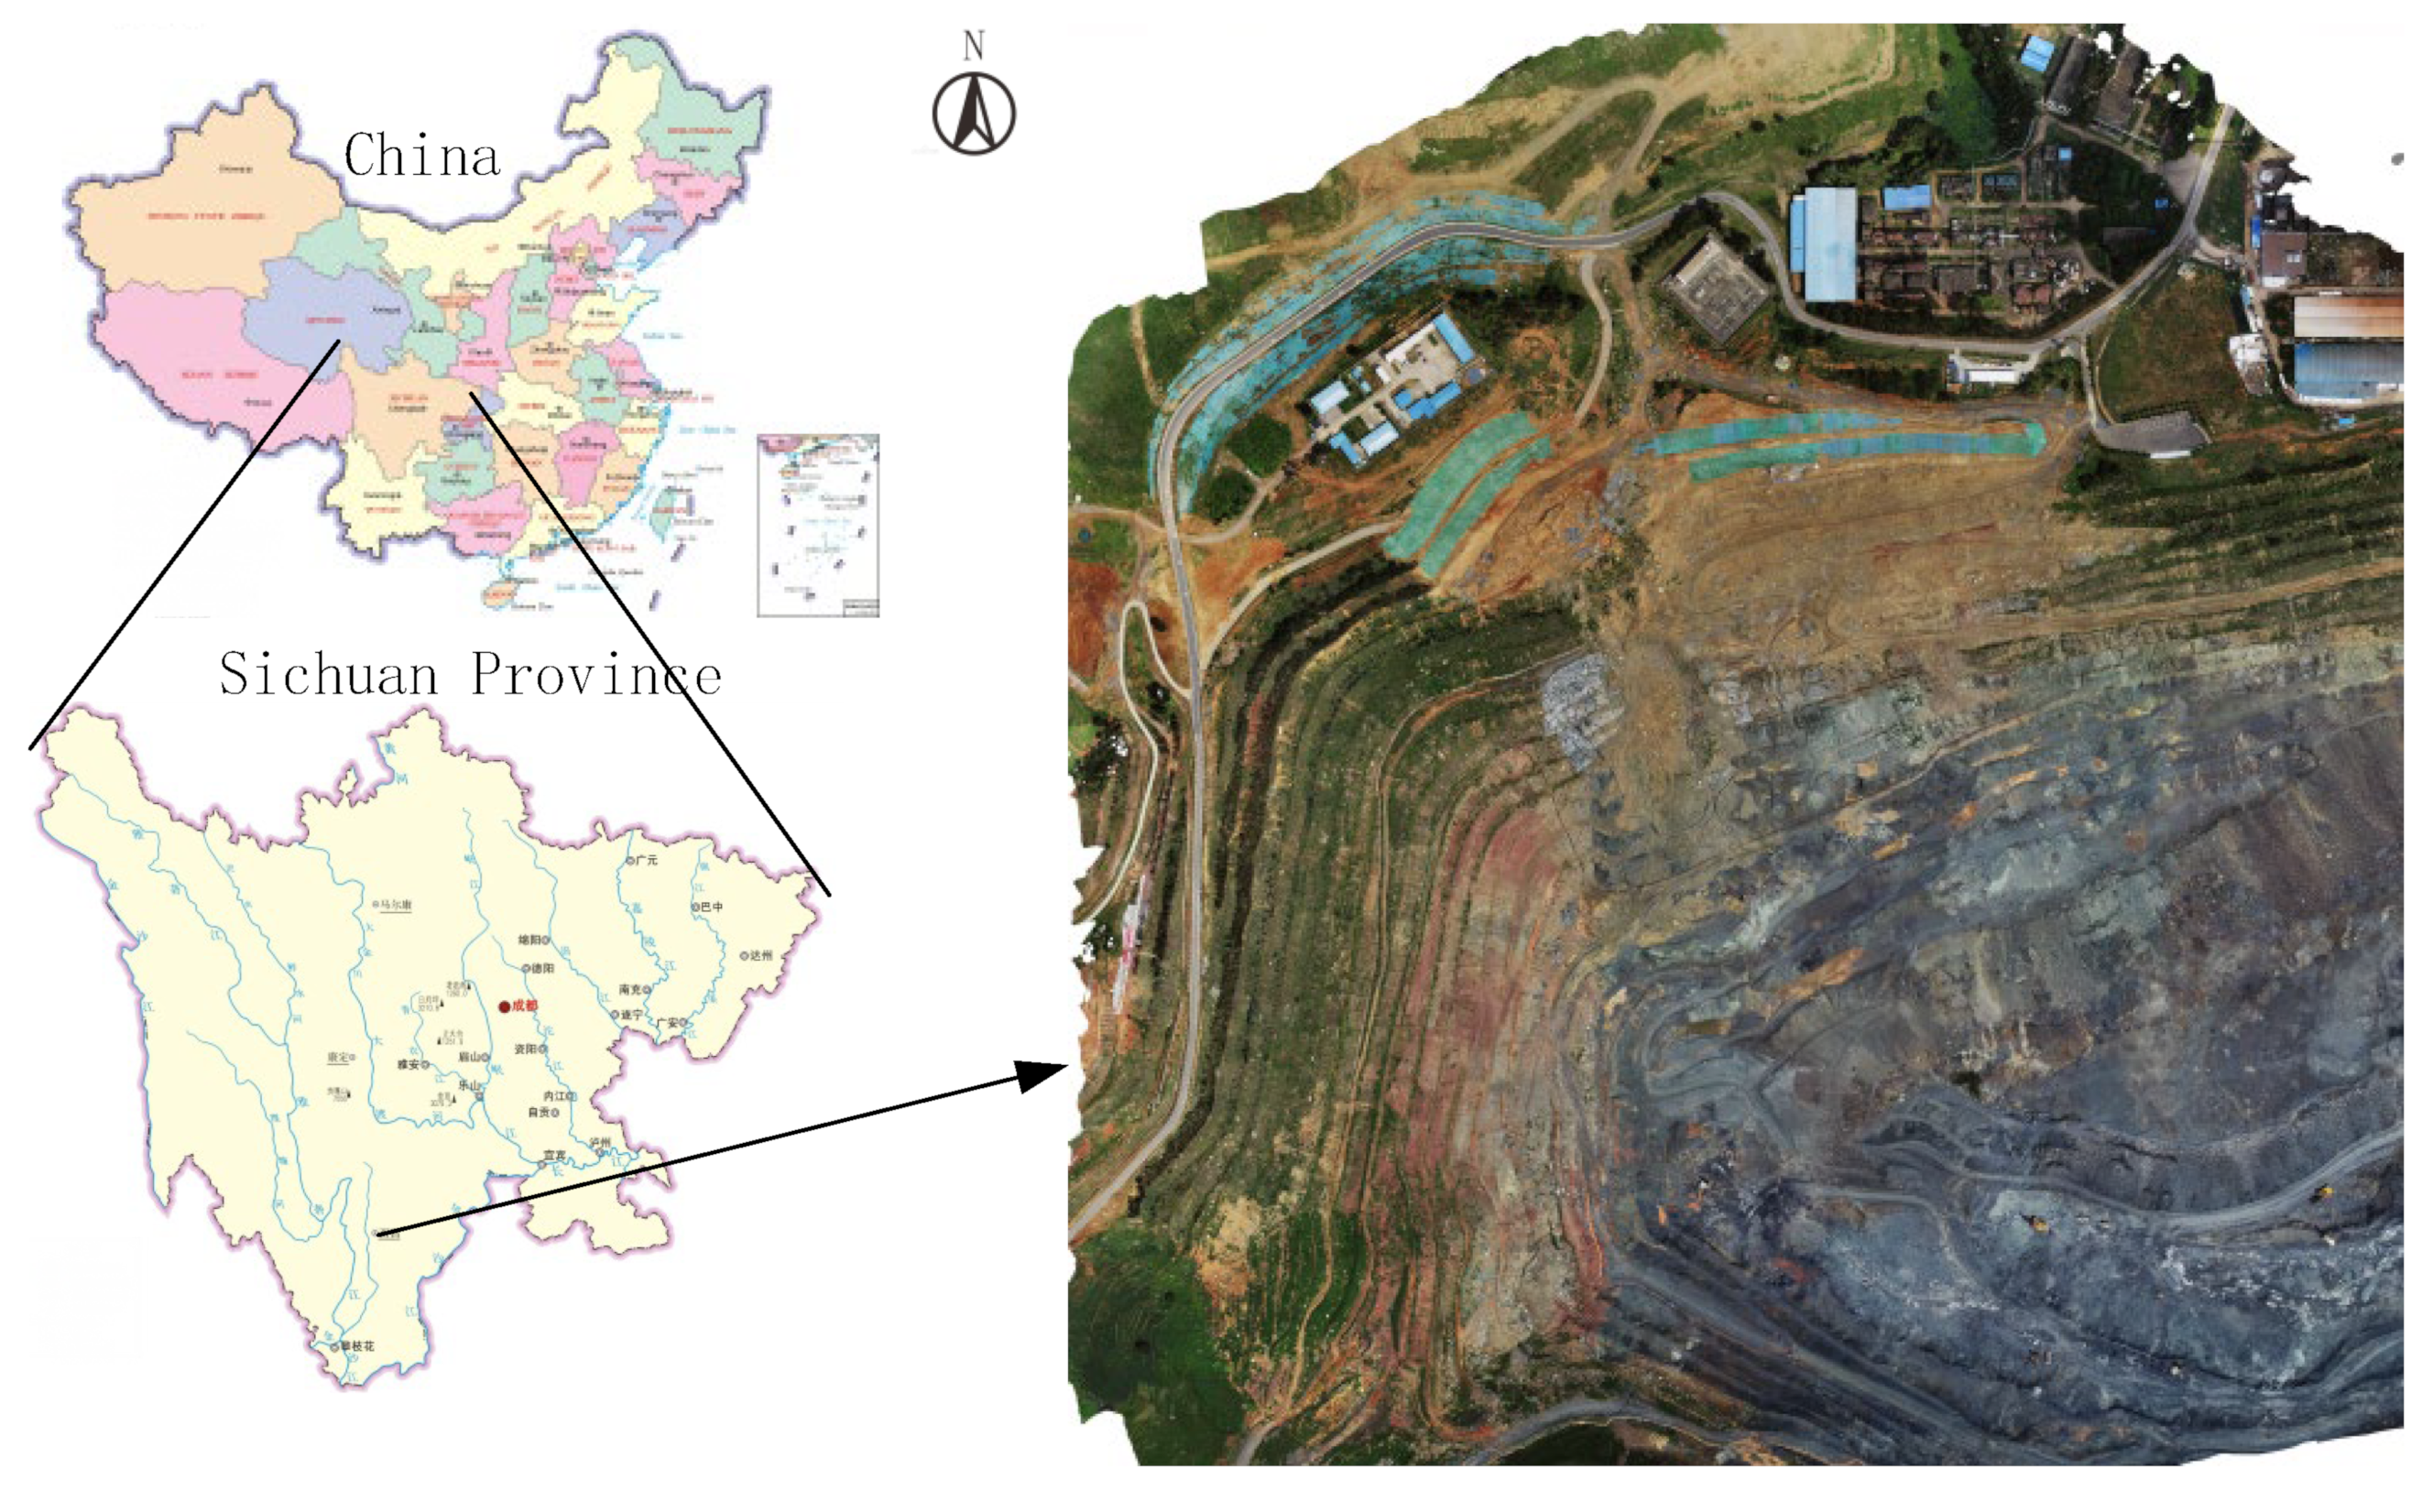
Figure 5.
Full view of the wedge.
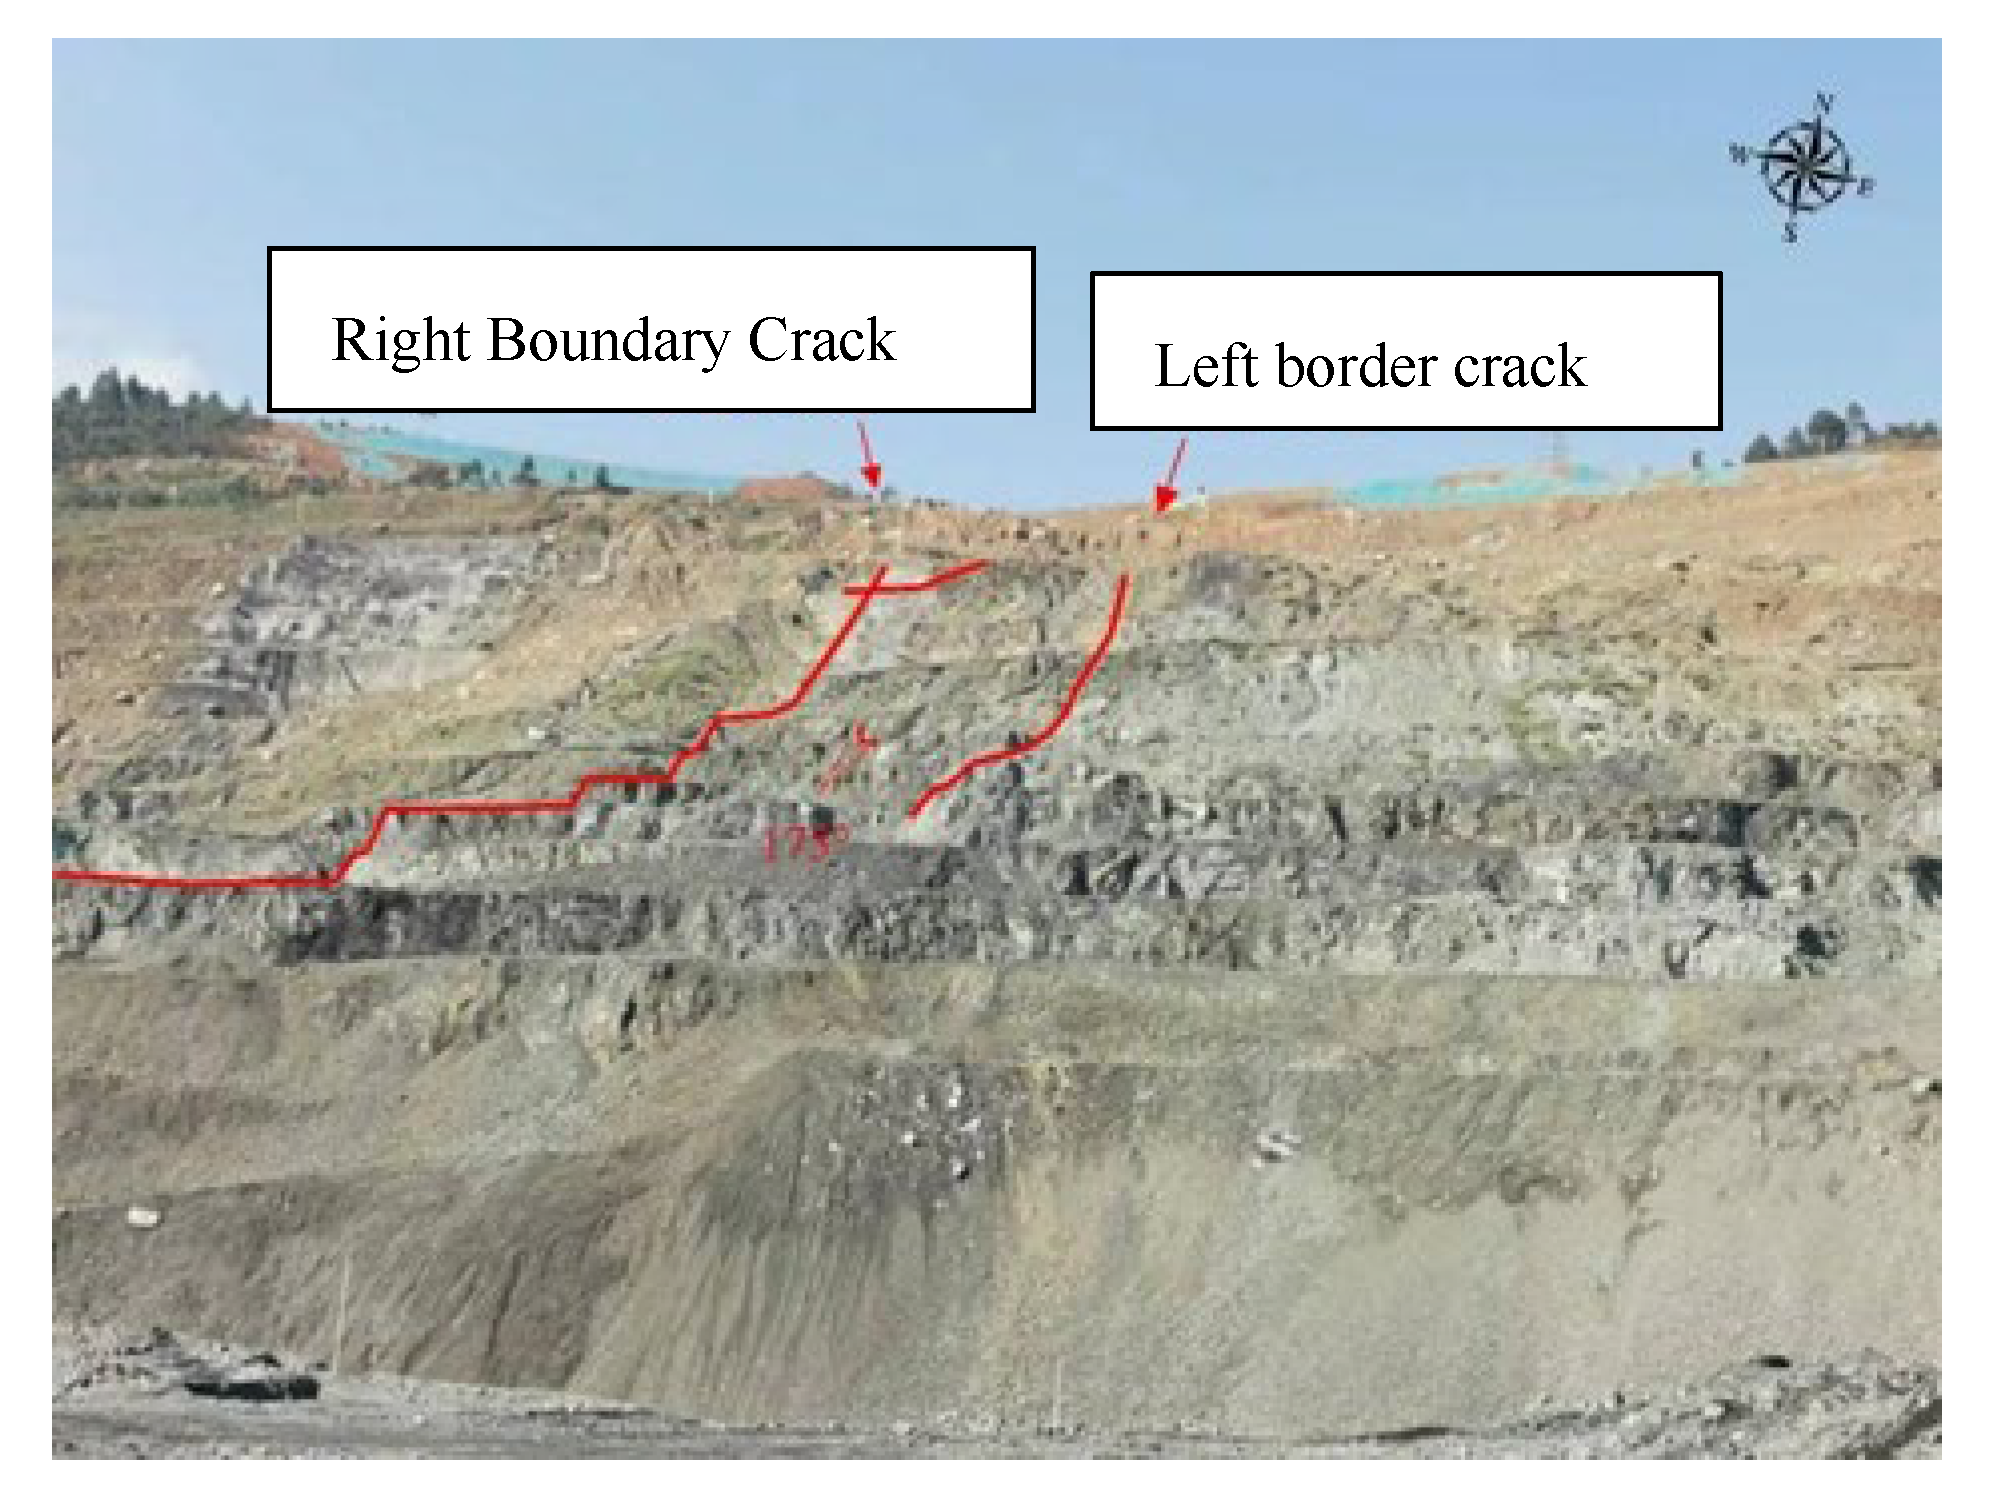
Figure 6.
Schematic diagram of the wedge plane.
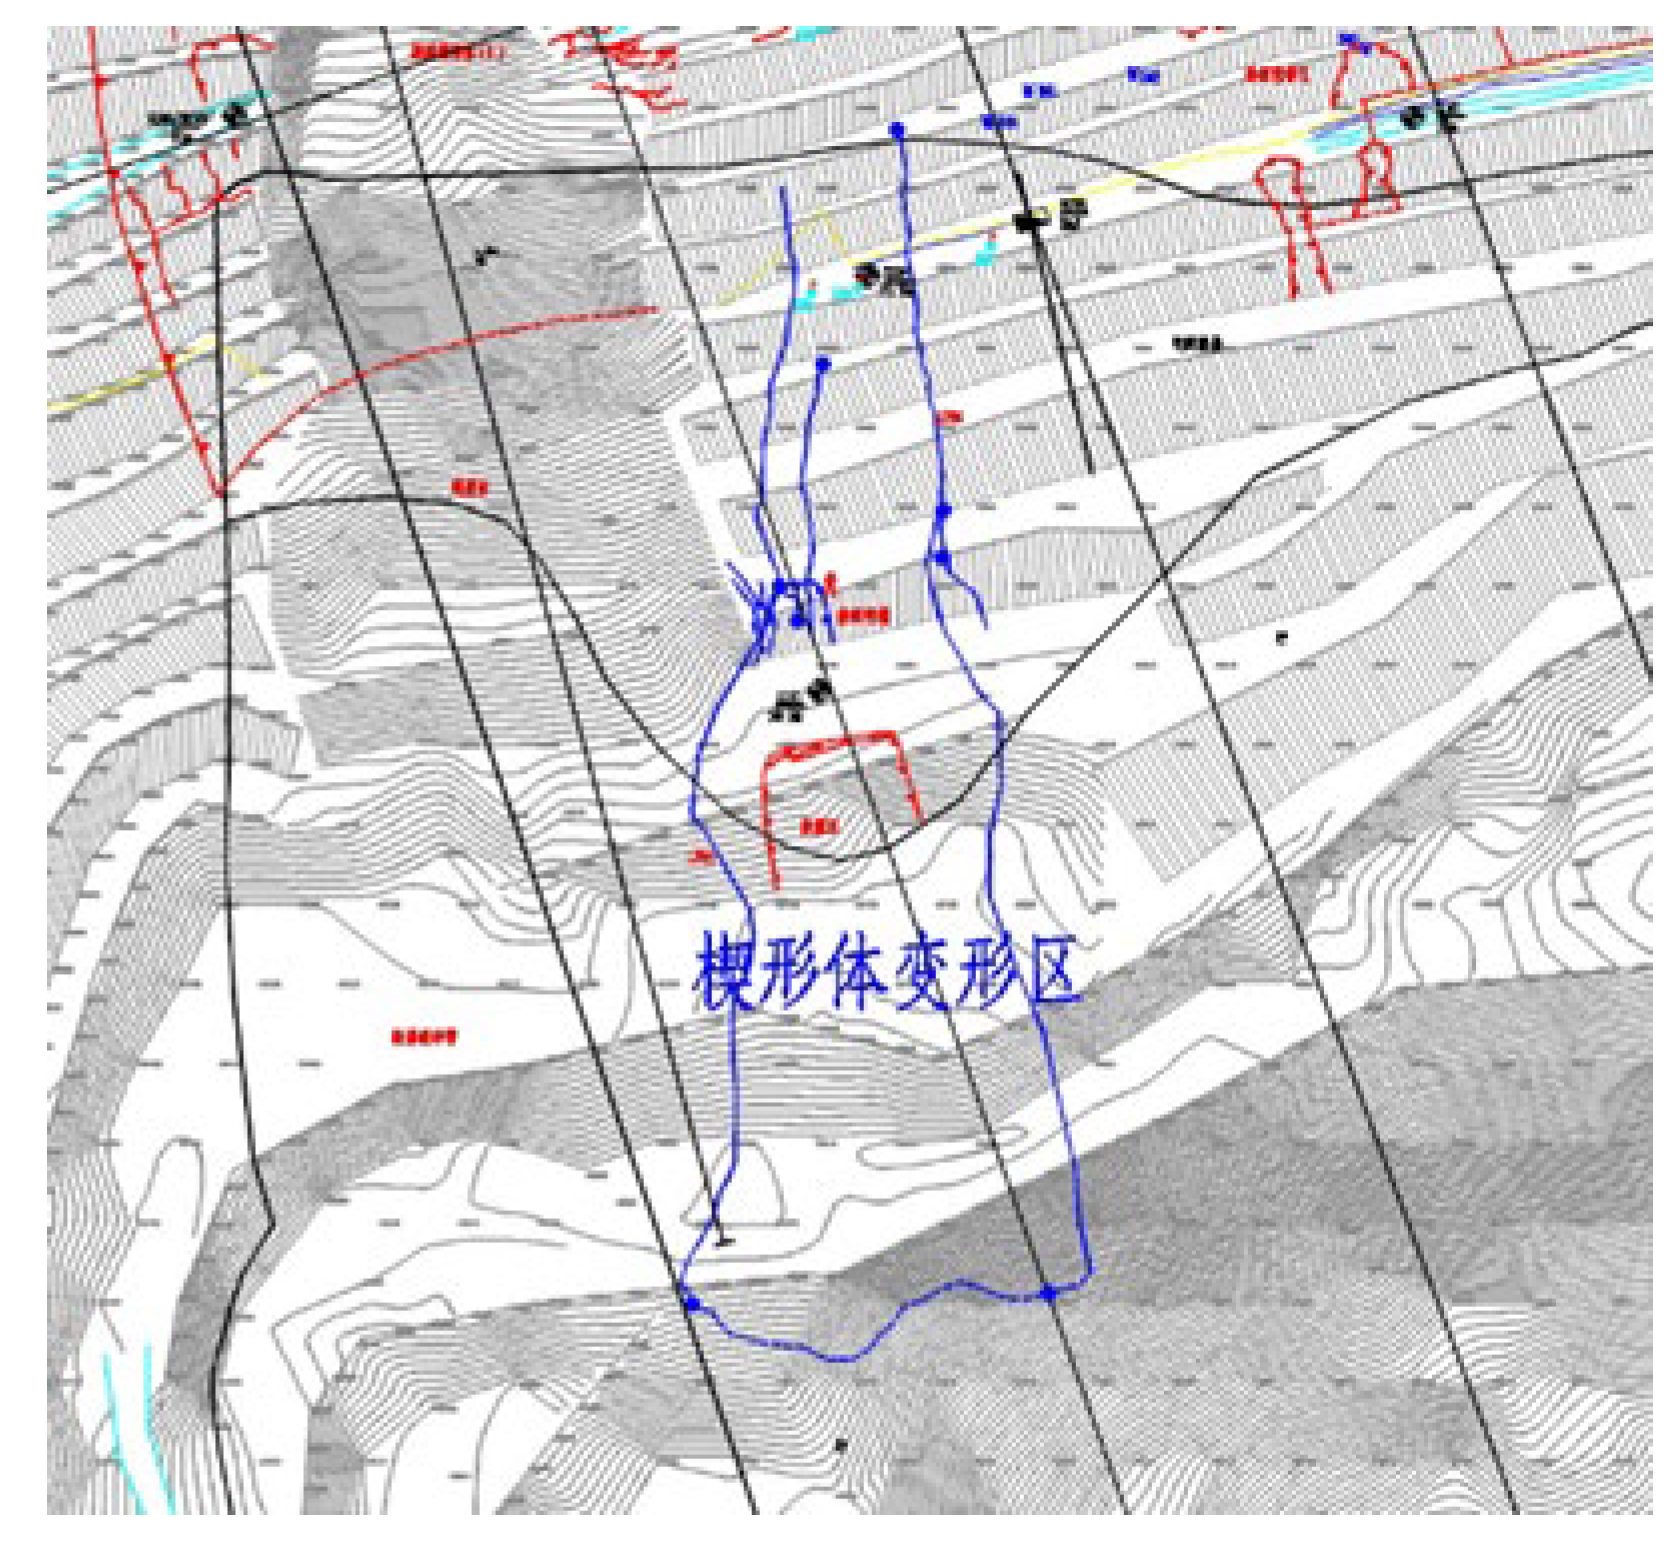
Figure 7.
General slope discrete element calculation model (unit: m).
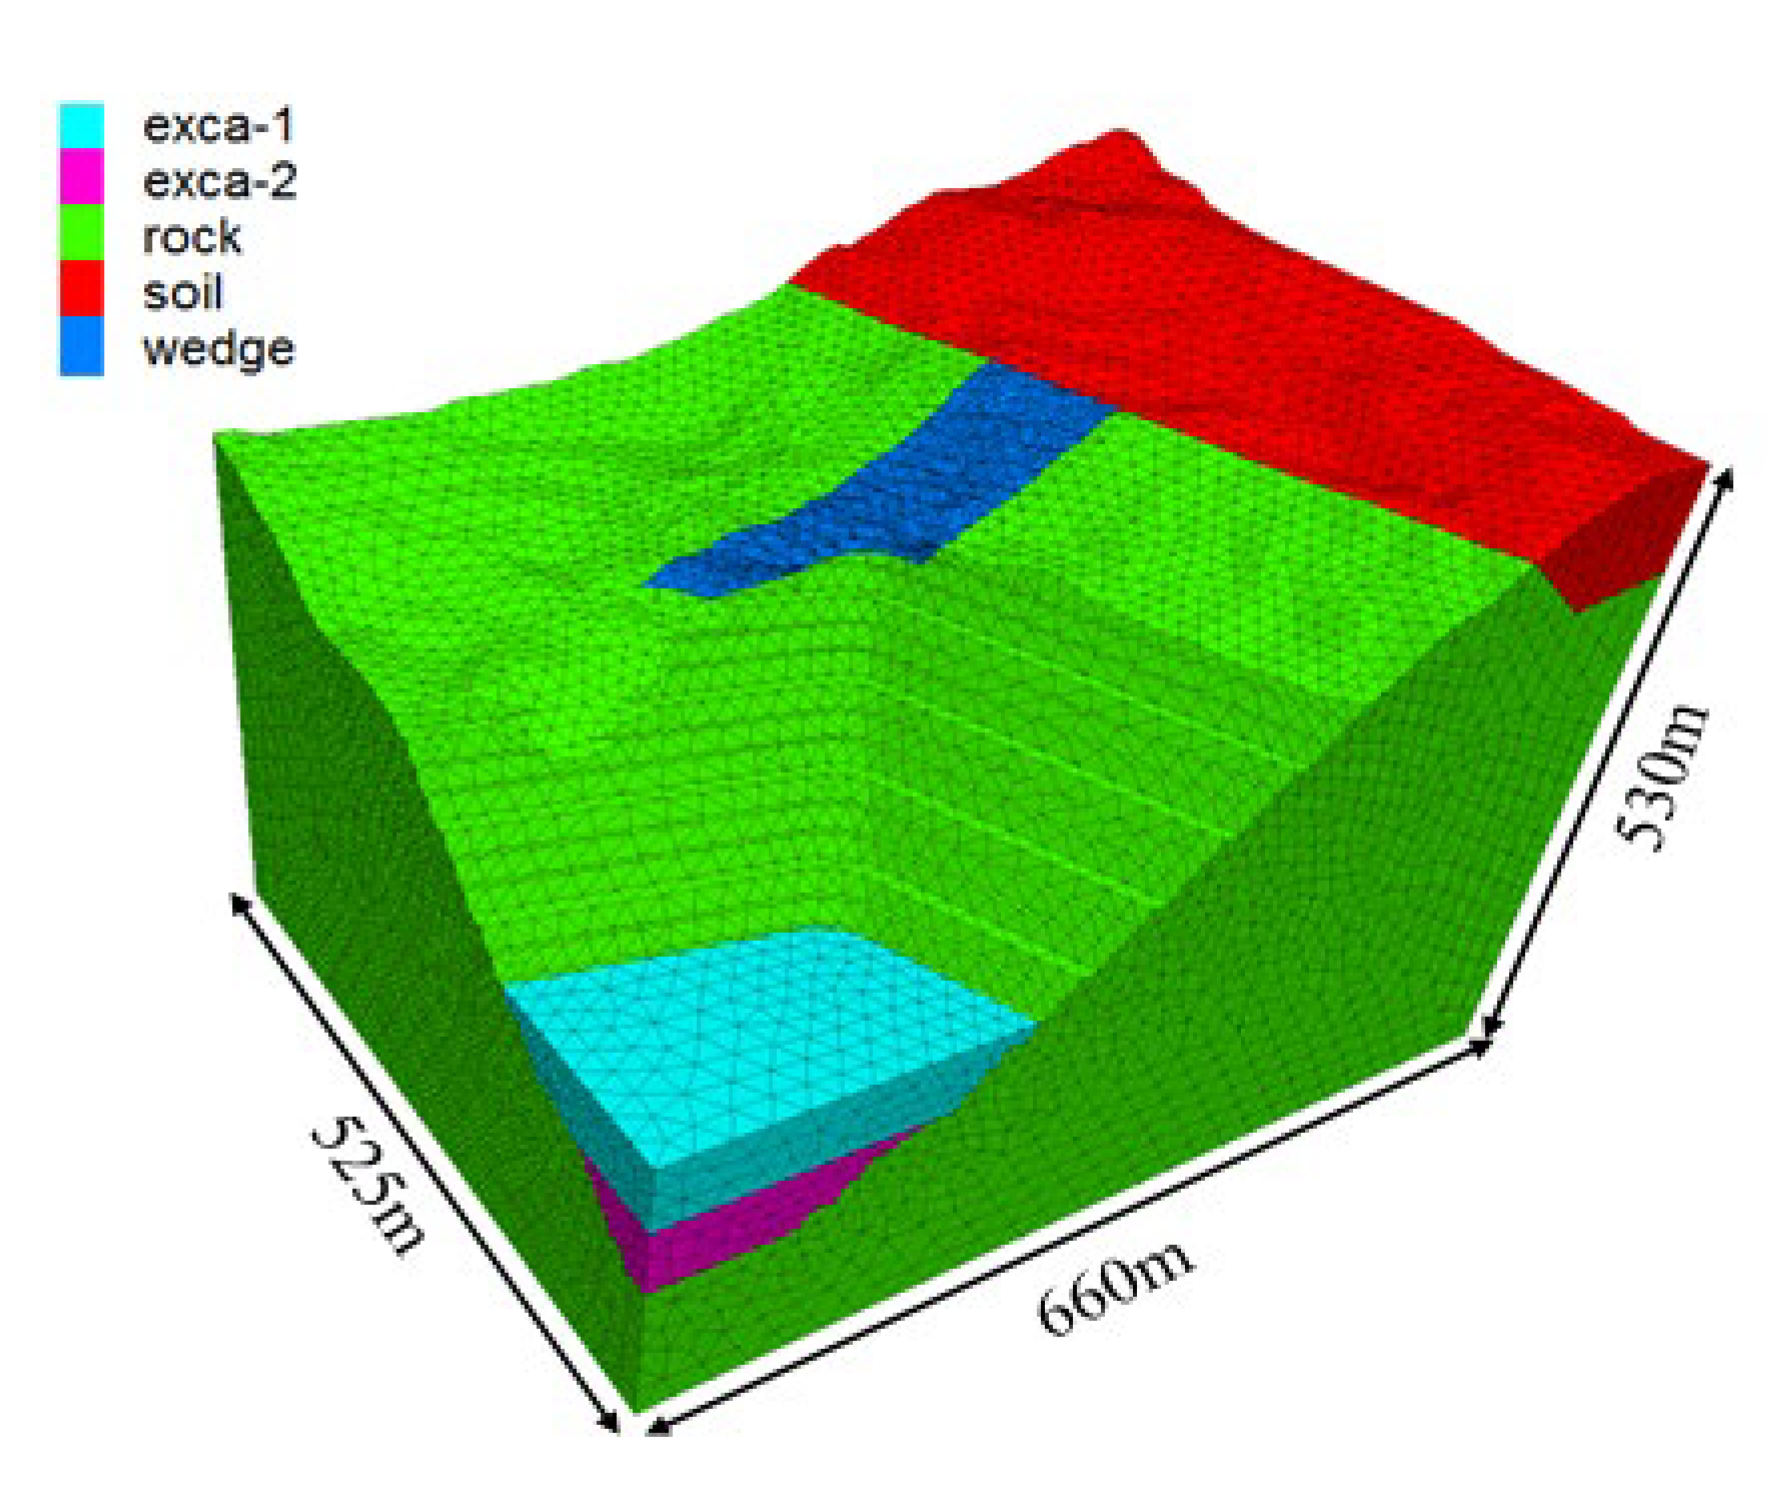
Figure 8.
Deformation rates corresponding to different discount factors under natural working conditions.
Figure 8.
Deformation rates corresponding to different discount factors under natural working conditions.

Figure 9.
Deformation rate versus discount factor under natural working conditions.
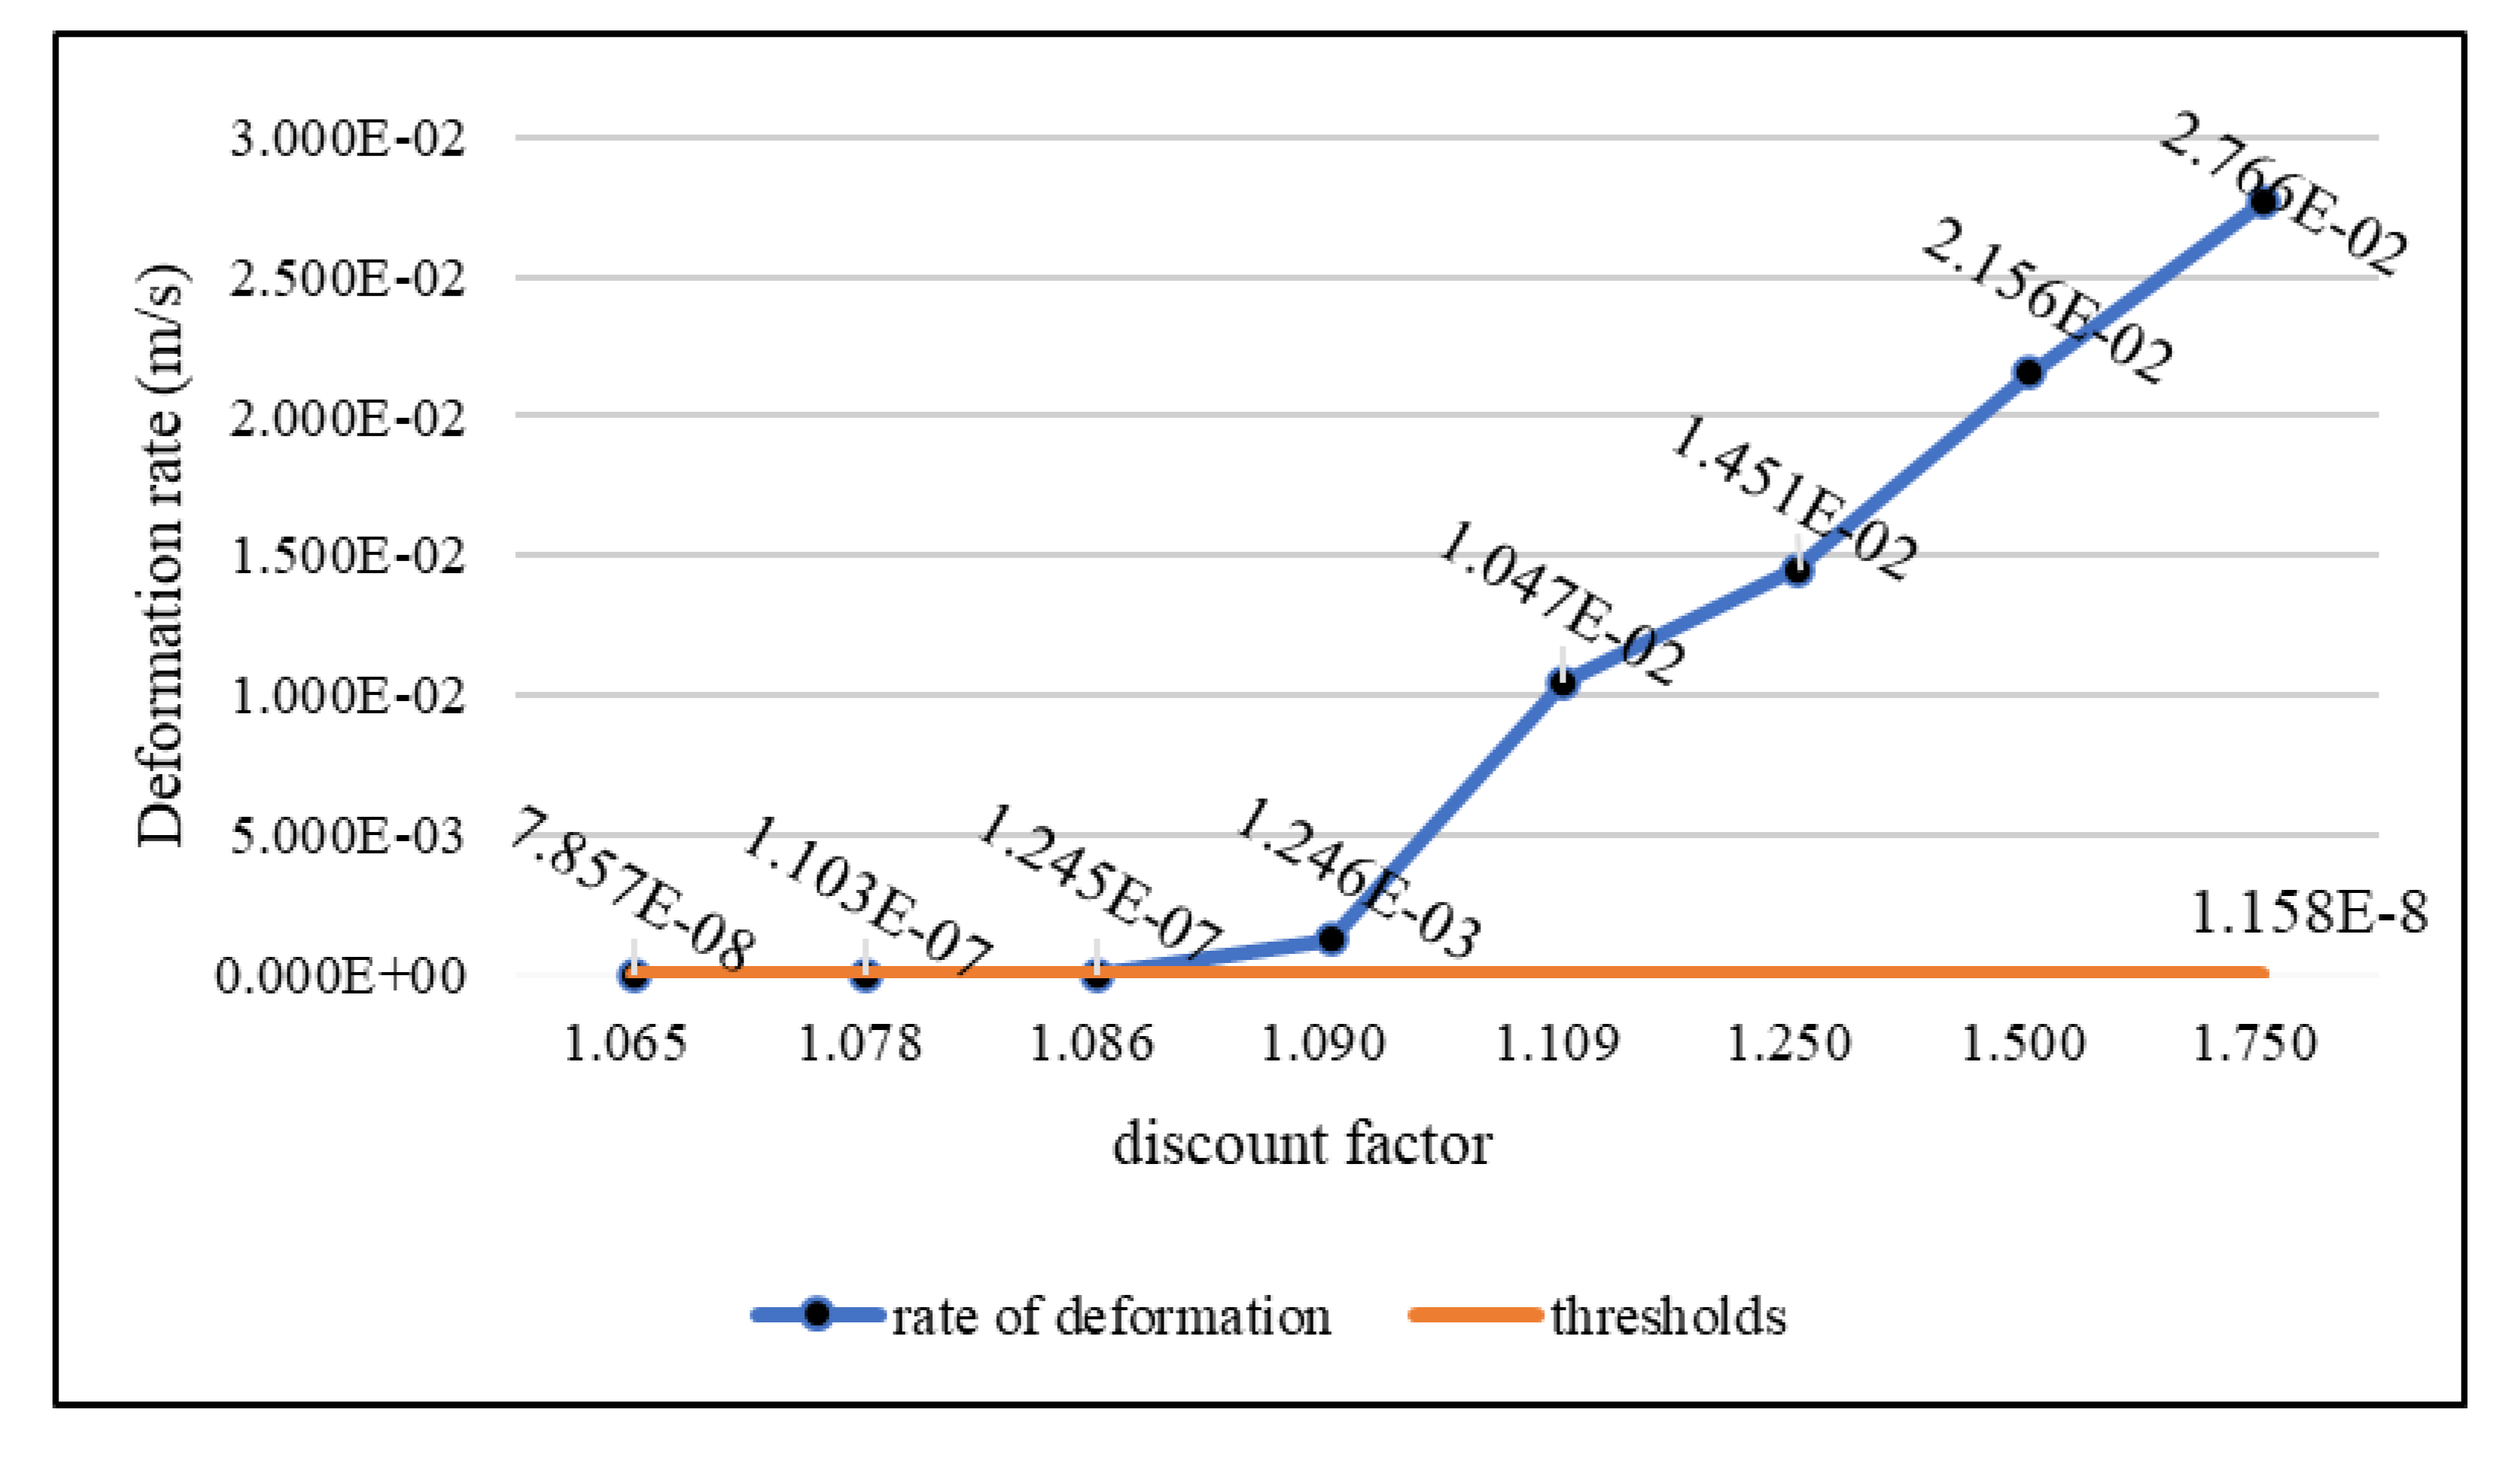
Figure 10.
Deformation rates corresponding to different discount factors under heavy rainfall conditions.
Figure 10.
Deformation rates corresponding to different discount factors under heavy rainfall conditions.
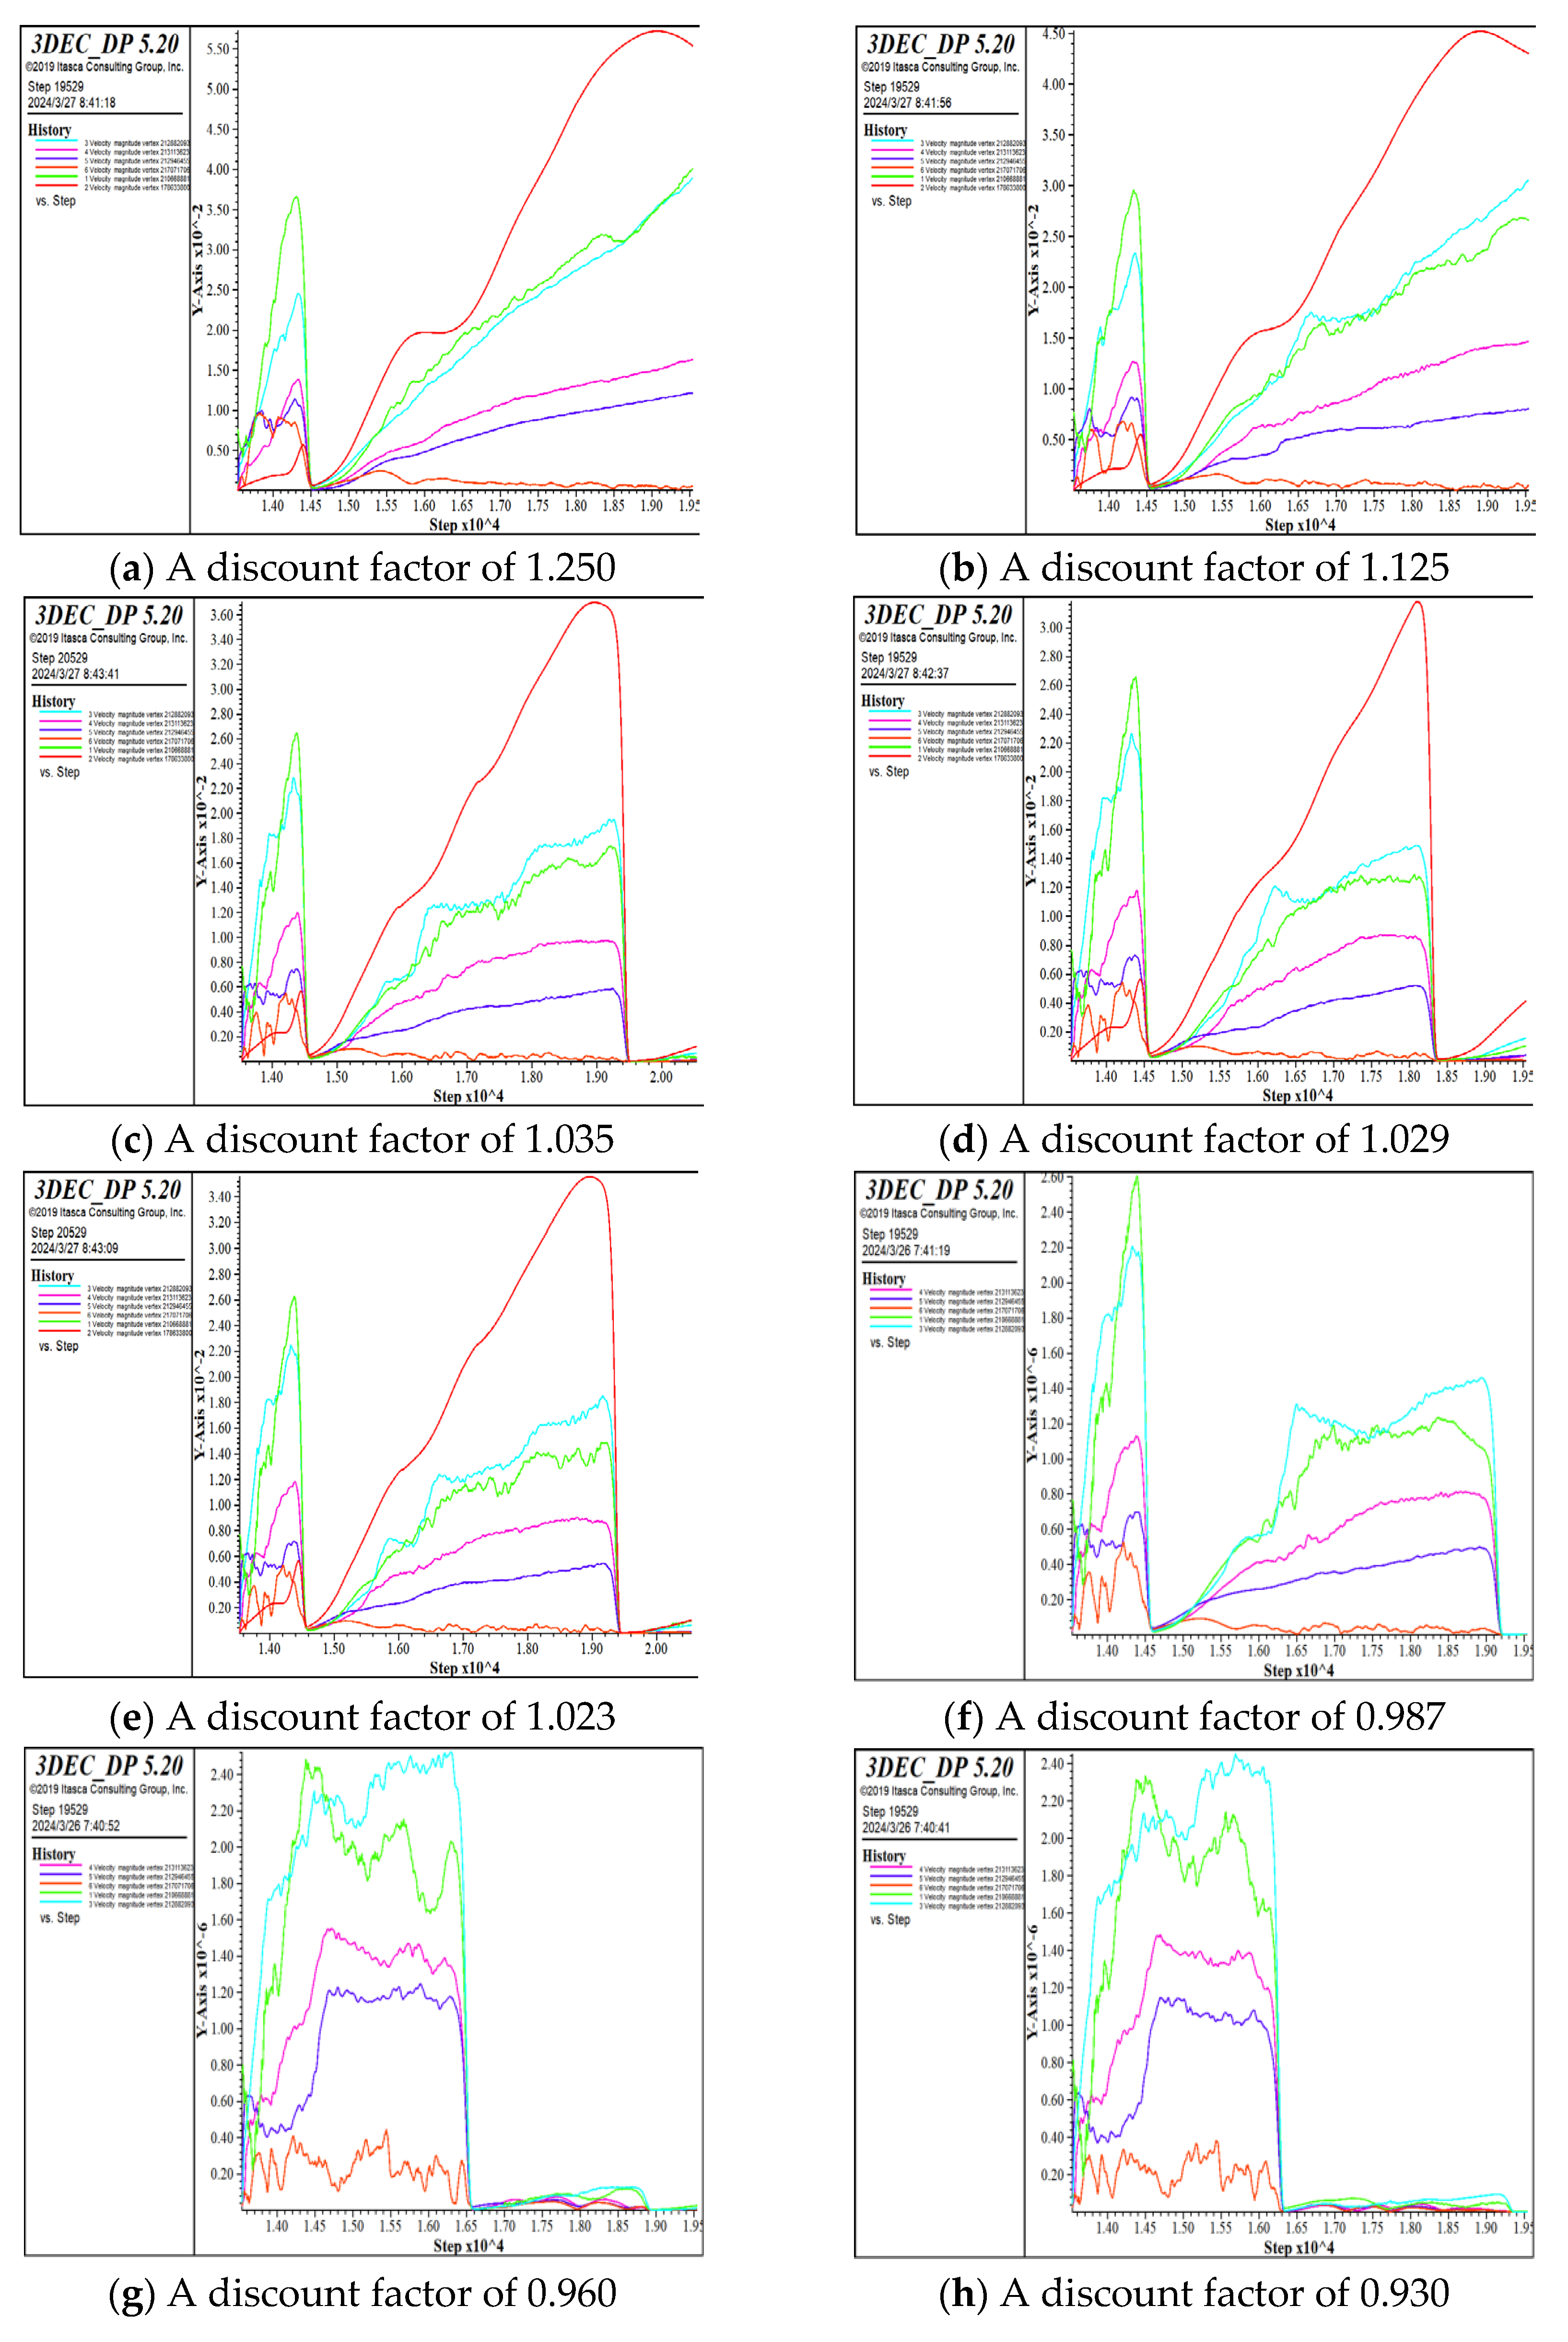
Table 3.
Calculation parameters.
| Geotechnical name | ρ/kg-m-3 | Em/MPa | Poisson’s ratio | Natural shear strength | saturated shear strength | ||
|---|---|---|---|---|---|---|---|
| c/kPa | φ/(°) | c/kPa | φ/(°) | ||||
| silty clay | 1910 | 9 | 0.43 | 24.97 | 18.06 | 21.47 | 16.25 |
| clasticastic soil | 2200 | 22 | 0.4 | 44.73 | 44.26 | 26.8 | 32.61 |
| dolerite | 2360 | 300 | 0.3 | 13.5 | 33.4 | 11.7 | 29.8 |
| gabbro (geology) | 3130 | 5000 | 0.2 | 3.66 x 10³ | 45.36 | 2.42 x 10³ | 40.99 |
| structural plane | - | - | - | 1.13 | 28.81 | 2.11 | 27.52 |
| weak sandwich | 92.2 | 10.65 | 72.5 | 4.11 | |||
Table 4.
Daily Deformation Threshold of Slopes.
| warning level | blue warning | yellow alert | orange alert | red alert |
| risk status | take note of | cautionary | be on the alert | distress |
| Deformation rate (mm/d) | 20~40 | 40~60 | 60~100 | >100 |
| Improvement of tangent angle (°) | 55~60 | 60~80 | 80~85 | >85 |
| Deformation rate continuity requirements | / | Continuous 48h deformation speed>10mm/d | ||
Disclaimer/Publisher’s Note: The statements, opinions and data contained in all publications are solely those of the individual author(s) and contributor(s) and not of MDPI and/or the editor(s). MDPI and/or the editor(s) disclaim responsibility for any injury to people or property resulting from any ideas, methods, instructions or products referred to in the content. |
© 2024 by the authors. Licensee MDPI, Basel, Switzerland. This article is an open access article distributed under the terms and conditions of the Creative Commons Attribution (CC BY) license (http://creativecommons.org/licenses/by/4.0/).
Copyright: This open access article is published under a Creative Commons CC BY 4.0 license, which permit the free download, distribution, and reuse, provided that the author and preprint are cited in any reuse.


