Submitted:
27 May 2024
Posted:
27 May 2024
You are already at the latest version
Abstract
Droughts have a substantial effect on water resources, agriculture, and ecosystems on a worldwide scale. In the Mekong Delta of Vietnam, droughts exacerbated by climate change are significantly endangering the region's agricultural sustainability and output. Conventional forecasting techniques frequently do not capture the intricate dynamics of meteorological phenomena associated to drought effectively, prompting the exploration of more advanced methodologies. This work utilises artificial intelligence, par-ticularly machine learning methods like Gradient Boosting and Extreme Gradient Boosting (XGBoost), to enhance drought pre-diction in the Mekong Delta. The study utilises data from 11 meteorological stations spanning from 1990 to 2022 to create and evaluate Machine Learning models based on several climatic factors. We utilise Gradient Boosting and XGBoost algorithms to estimate the Standardised Precipitation-Evapotranspiration Index (SPEI) and evaluate their effectiveness in comparison to con-ventional forecasting techniques. The results show that Machine Learning, particularly XGBoost, surpasses traditional approaches in predicting SPEI accuracy at various time scales. XGBoost demonstrates skill in understanding the complex relationships between climatic factors, with R² values falling between 0.90 and 0.94 for 1-month forecasts. The progress highlights the potential of Machine Learning in improving drought management and adaptation tactics, proposing the incorporation of Machine Learning forecasting models into decision-making processes to enhance drought resistance in susceptible areas.
Keywords:
Drought Forecasting
; Machine Learning Algorithms
; Mekong Delta
; Water Resource Management
; Vietnam
1. Introduction
Droughts are natural hazards that can occur in all climatic zones and have long-term economic and environmental impacts [1]. They can be defined in different ways, such as meteorological, hydrological, and agricultural droughts, depending on the time horizon and variables used [2]. Climate change has made drought one of the greatest natural hazards in Europe, affecting large areas and populations [3]. In the conterminous United States, precipitation deficits have been the primary drivers of past major drought events, with temperature as a secondary driver [4]. Droughts in South Africa have led to employment losses in the agricultural sector, affecting income generation [5]. Droughts adversely affect various environmental components including soil processes, vegetation growth, wildlife, water quality, and aquatic ecosystems. They also limit access to water resources and can have international impact.
Drought forecasting is important for several reasons, as follows. First, it allows early action to be taken to mitigate the impacts of drought events. This can include measures, such as early livestock destocking and water management strategies [6]. Second, accurate drought prediction can help in the management of groundwater sources, agriculture, and ecosystems, thereby reducing the social and economic harm caused by drought [7]. Additionally, forecasting future drought conditions is crucial for preventing agricultural and hydrological resource damage in models that can be used to predict drought severity classes [8]. Furthermore, impact-based drought forecasting can provide critical information for disaster preparedness and adaptation, and increase community resilience [9]. Lastly, forecasting droughts on a seasonal timescale can provide useful insights into the increase in the frequency and intensity of extreme events and their location [10].
Accurate prediction of drought is essential for reducing the negative effects of drought in the Mekong Delta, Vietnam, impacting agriculture, water management, and community resilience. It facilitates strategic agricultural planning, optimises water resource allocation, and improves early warning systems to prepare for difficulties associated to drought. Accurate predictions are essential for adjusting to climate change through guiding sustainable practices and policy development. This holistic method for predicting drought enhances agricultural output in the area, guarantees sustainable water resources, and strengthens resistance to climate-related challenges. Thus, accurate drought forecasting is the cornerstone of proactive and effective risk management. It empowers stakeholders to make informed decisions, implement timely interventions, and build resilience in the face of a changing climate, ultimately contributing to the sustainable development of regions vulnerable to drought in the Mekong Delta.
This study focuses on applying artificial intelligence (AI) to forecast the drought index in the Mekong Delta, aiming to address and achieve key objectives. Primarily, it seeks to surpass the constraints of conventional drought forecasting techniques, which frequently fail to accurately represent the intricate and changing climatic conditions unique to the Mekong Delta. Through the utilization of AI, the study aims to significantly improve the precision and dependability of drought forecasts. Furthermore, the enhanced forecasting capability provided by AI is intended to facilitate the issuance of timely warnings and the initiation of preemptive actions. This proactive approach empowers communities, governmental bodies, and other pertinent stakeholders to adequately prepare for and mitigate the repercussions of imminent water scarcities and related challenges.
Current methods for forecasting drought involve a combination of statistical, probabilistic, and data-driven approaches. The historical perspective of drought in the Mekong Delta reveals a complex interplay of climatic, hydrological, and anthropogenic factors that have shaped the region's vulnerability to water scarcity. Understanding the historical context provides insights into the recurring challenges faced by the Mekong Delta and sets the stage for innovative approaches, such as the application of artificial intelligence, to address contemporary drought issues. A study by [11] analyzed the spatiotemporal variability of meteorological droughts in the Mekong Delta area of Vietnam using the standardized precipitation index (SPI) and found that the frequency of drought scales decreased while their spatial distribution tended to increase, with the main scales including moderate and severe droughts. The most extreme drought during the study period occurred in 1990-1992, with 11 out of 13 provinces experiencing extreme drought with a peak SPI value of -2.63 and a duration of 29 months. The study concluded that climate change was the major factor affecting drought in the study area, rather than the El Niño phenomenon. The Mekong Delta has a long history of drought, with the 2015-2016 event being particularly severe, and The Mekong Delta suffered the worst historic drought and salinity intrusion occurrence on record [12]. This region has also experienced a shift in the spatial distribution of meteorological droughts, with a decrease in frequency and an increase in severity [13]. The impact of these droughts on agriculture, particularly on rice production, is significant [14]. The construction of mega-dams in the Mekong River has further exacerbated this situation, leading to reduced water levels and increased dry season droughts [15]. Nguyen Thi Ngoc et al. evaluated meteorological droughts using the standardized precipitation index (SPI) based on data from the Tropical Rainfall Measuring Mission (TRMM) [16]. Tran et al. used the Normalized Difference Water Index (NDWI) derived from Landsat satellite images to analyze drought severity and spatiotemporal dynamics. Tran et al. (EDSI) by integrating remote sensing data and spatiotemporal regression methods to assess the severity of agricultural drought severity [17]. Pal and Juddoo conducted a comprehensive drought risk assessment that considered climate change impacts in the coastal provinces of the Mekong Delta [18]. Nguyen and Li analyzed the correlation between sea surface temperature anomalies (SSTA) and meteorological droughts in the Vietnam Mekong Delta [19]. These studies demonstrate the use of various methods and data sources for drought forecasting in the Mekong Delta. Quang et al. investigated the spatiotemporal trends, intensity, duration, and frequency of meteorological droughts in the Vietnamese Mekong Delta (VMD) using the Standardized Precipitation Evaporation Index (SPEI) at multiple timescales (3, 6, and 12 months). The findings suggest that the intensity, duration, and frequency of drought events increased from 1985 to 2018, with extreme drought events from October 2013 to September 2016 being the most severe and prolonged during the study period. El Niño was found to strongly influence extreme drought events in VMD, and adaptation measures are crucial for coping with drought disasters, particularly in the agricultural and aquaculture sectors [20].
Current approaches to drought forecasting in the Mekong Delta have limitations. The lack of observation stations reduces the reliability of the monitoring results, making it difficult to accurately identify droughts [16]. Additionally, current weather and climate conditions have negatively affected the accuracy and reliability of traditional prediction indicators used by small-scale farmers in the region [21]. These indicators, which are based on traditional environmental cues, may not be as effective in predicting drought events under the current conditions of climate uncertainty and variability [22]. Furthermore, the reduced number of elderly people in the community has led to a decline in the diversity and complexity of the interpretation of these indicators [23]. These limitations highlight the need to enhance traditional prediction methods and develop new approaches that can better account for the changing environmental and climatic conditions in the Mekong Delta [24].
Artificial Intelligence (AI) techniques, particularly Machine Learning (ML), have been increasingly used for drought forecasting. These models have been applied to improve current weather forecasts and as alternatives to conventional predictions of extreme events [25]. In the Mekong Delta of Vietnam, where drought has become more severe owing to climate change, ML-based models have been used to assess future drought hazards [17]. Additionally, spatiotemporal regression methods and time-series biophysical data derived from remote sensing were integrated to develop a new drought index called the enhanced drought severity index (EDSI). These approaches have demonstrated the potential of AI and ML in drought forecasting and risk assessment in the Mekong Delta region.
Artificial intelligence, particularly in the form of artificial neural networks, has shown promise for drought forecasting. Luong Bang Nguyen and J. Lee demonstrated the effectiveness of this technology for predicting drought indices and rainfall, respectively [26,27]. The use of climate indices as input variables in these models further enhances their accuracy. A. Jalalkamali et al. compared the performance of various artificial intelligence models in drought forecasting, and the ARIMAX model showed the highest precision [28]. A. Kikon and P. C. Deka provided a comprehensive review of the role of artificial intelligence in drought assessment, monitoring, and forecasting, highlighting its significance in these areas [29]. These studies collectively underscore the potential of artificial intelligence in improving drought forecasting in the Mekong Delta.
The Standardized Precipitation Evapotranspiration Index (SPEI) is a popular index for evaluating drought conditions. It has been used in various studies to analyze drought patterns and severity [30,31]. The SPEI combines meteorological and hydrological variables, such as precipitation, evapotranspiration, and groundwater levels, to provide a comprehensive assessment of drought [32]. It has been found to accurately characterize severe drought events in different climatic regions. Additionally, the SPEI has been used to monitor drought conditions during critical phenological phases of crops, such as maize cultivation, and to assess the temporal and spatial variability of droughts. The SPEI is a drought index used to assess water balance and drought conditions. It calculates a standardized value based on a continuous probability distribution fitted to a water balance time series. Different probability distributions, such as generalized logistic (GLO), generalized extreme value (GEV), Pearson Type III (PE3), and normal (NOR) distributions, have been considered for SPEI analysis in various regions. Studies have recommended using PE3 or GEV distributions for SPEI analysis in Canada [33], whereas a new multiscale SPEI dataset has been provided for reference and future time horizons in Italy [34]. Regional drought analysis using SPEI has been performed in the Gediz Basin, Turkey, with different distributions found to be the best fit for different reference periods [35]. In China, the SPEI has been used to accurately monitor drought events, with spatiotemporal distribution and trends analyzed in various climatic sub-regions [36]. In Malaysia, the SPEI has been used to determine drought indices for the Pahang River Basin, with the aim of mitigating the impact on water supply and economic development [37].
The Standardized Precipitation Evapotranspiration Index (SPEI) has several advantages. It is useful for assessing both drought and wetter-than-normal conditions, and provides a comprehensive understanding of moisture variability [34]. SPEI is a reliable tool for drought prediction because it is simpler, faster, and requires fewer data points than dynamic models [38]. It can accurately determine the spatial and temporal dimensions of drought events, making it valuable for drought monitoring and risk assessments. The SPEI is particularly effective in predicting droughts, with higher overall accuracy and fewer mistakes compared to other indices, such as the Standardized Precipitation Index (SPI) [39]. Additionally, the SPEI can be used to estimate the impact of drought events on water availability, agriculture, and ecosystems, aiding in the mitigation of economic losses and damage to the quality of life [40]. The versatility of the SPEI allows for the development of ensemble PDFs, making it suitable for assessing drought projections throughout the 21st century. The Standardized Precipitation Evapotranspiration Index (SPEI) is a reliable drought index that can be used for accurate drought assessment and forecasting.
The role of artificial intelligence in drought forecasting is transformative and offers innovative solutions to overcome the limitations of traditional approaches. By harnessing the power of AI, drought forecasting becomes more accurate, adaptive, and responsive, ultimately supporting effective water resource management and enhancing resilience in drought-vulnerable regions.
2. Materials and Methods
2.1. Study Area
The Mekong Delta is a region in southwestern Vietnam where the Mekong River approaches and empties into the sea. It covers over 40,500 km2 and is an important source of agriculture and aquaculture in the region. The Mekong Delta is known for its cultural diversity, with various ethnic groups and religions coexisting in the region. The area is also vulnerable to adverse impacts of climate change, including saltwater intrusion, coastal erosion, flooding, and drought, and efforts are being made to ensure greater productivity and climate resilience (Figure 1).
The main seasons in the Mekong Delta are dry and rainy. The dry season typically occurs from December to May, whereas the rainy season occurs from June to November [41]. The dry season is critical for rice production, as more than 80% of rice is planted during this time when water flow is at its lowest [42]. However, the wet season supplies the majority of the water needed for rice production and other agricultural activities in the delta [43]. The seasons in the Mekong Delta are affected by climate change, which leads to alterations in rainfall patterns and water availability [44]. These changes in weather patterns have implications for the crop yield and water quality in the region.
Drought is a prevalent concern in the Mekong Delta because of climate change impacts [18]. The intensity, duration, and frequency of meteorological droughts in the delta have been studied using various indices[45]. The Vietnamese Mekong Delta (VMD) has experienced droughts that affect agriculture and aquaculture [46]. The Standardized Precipitation Index (SPI) has been used to identify drought events and their impact on rice yields in the VMD [47]. VMD, particularly Ca Mau Province, experiences both dry and wet conditions, with prolonged drought events extending into the wet season [48]. These findings contribute to a better understanding of drought patterns and their impact on agricultural output in the Mekong Delta, providing valuable insights for policymakers and practitioners in water resource management.
2.2. Data Sources
Drought forecasting relies on various data sources to accurately monitor and predict drought conditions. These data sources provide information on the meteorological, hydrological, and environmental variables that are critical for understanding and forecasting drought events.
For this study, we analyzed data from 11 meteorological stations (1990 – 2022): Chau Doc, Moc Hoa, Cao Lanh, Can Tho, My Tho, Ba Tri, Cang Long, Soc Trang, Bac Lieu, Ca Mau, and Rach Gia (Figure 1 and Table 1). Rainfall and temperature datasets from these meteorological stations were collected from the Southern Regional Hydrometeorological Center (Vietnam Meteorological and Hydrological Administration). Long-term rainfall records help identify trends and anomalies in precipitation patterns. Temperature data are essential for calculating potential evapotranspiration, which is a crucial component of drought assessment.
The yearly precipitation in the Mekong Delta typically exceeds 1,350 - 2,366 mm. The Ca Mau - Rach Gia region experiences the highest levels of rainfall, with measurements ranging from to 2000-2,366 mm or more. Approximately 30% of the weather stations record a rainfall of 1,300 mm or more. In contrast, areas such as My Tho receive a lower amount of precipitation, with levels ranging from approximately 1,300 mm. The rainfall distribution exhibits temporal and spatial irregularities. This matter is intricately connected to the equilibrium and utilization of water resources to support the objective of sustainable development of water resources in the Mekong Delta. Figure 2 clearly illustrates that the rainfall was predominantly concentrated between June and October.
In addition to monthly rainfall and temperature information, we incorporated four climatic variables, including soil moisture, humidity, Southern Oscillation Index (SOI), and Equatorial Pacific Sea Surface Temperatures (SST), to develop machine learning models. Soil moisture and humidity data were acquired via The Enhanced POWER Data Access Viewer (NASA's Prediction of Worldwide Energy Resources (POWER)) website at https://power.larc.nasa.gov/data-access-viewer/. SOI and SST data were obtained from the National Oceanic and Atmospheric Administration (NOAA) website at https://www.ncei.noaa.gov/access/monitoring/enso. The data sources were constantly maintained, and no post-processing was performed.
2.3. Methodology
2.3.1. Data Pre-Processing
Data pre-processing is an essential step to guarantee the integrity and dependability of the data utilised in modelling [49]. This entails:
-
Data cleaning:
- Handling missing values: Methods include replacing missing values with the mean, using regression to estimate missing values, or removing incomplete cases.
- Correcting Inconsistencies and Outliers: This involves identifying and resolving errors or outliers using data profiling, statistical methods, or domain-specific knowledge.
- Normalize data:
Ensures all variables are on the same scale, typically between 0 and 1, to improve algorithm accuracy. The formula used is:
where X norm is the normalized value, and X0, Xmin, and Xmax are the real value, minimum value, and maximum value of the same variable, respectively.
- 3.
- Split data:
The data will be partitioned into training and testing sets, with 80% of the data used for training and 20% used for evaluating the model.
2.3.2. Method for Calculating Drought Index
In this study, the Hargreaves-Samani (HS) method was used to estimate reference evapotranspiration (ETo) because this method has been used to estimate reference evapotranspiration (ETo) in various regions. Studies have shown that the HS equation can accurately estimate ETo values when compared with the FAO Penman-Monteith (PM) method, which is considered the most accurate method for ETo estimation [50,51]. The HS equation performs well under different climatic conditions and environments, including regions with high altitudes [52]. In some cases, the HS equation outperforms the FAO56-PM method, particularly when meteorological data are limited or unavailable [53]. In general, the HS method has been demonstrated to be a viable option for calculating ETo, especially in areas where the availability of data is limited, such as the Mekong Delta.
The Hargreaves-Samani (HS) approach calculates the reference evapotranspiration (ETo) based solely on the highest and minimum temperatures [54], as shown in the following equation:
Where:
- extraterrestrial solar radiation, in mm day-1
- conversion parameter (=0.0023)
- Tmax, Tmin and T: the maximum, minimum and average temperature (°C),
Water balance, which refers to the excess or shortage of water, was computed accordingly.
Di values were then aggregated at different time scales. The log-logistic distribution, F(x), was applied to transform the original D series into standardized units at different time scales. Finally, the F(x) distribution was used to calculate the SPEI [55].
The SPEI package for R [56], was used to compute the SPEI drought index. This tool serves as a valuable resource for the in-depth examination of drought conditions, both for research purposes and practical applications. Drought levels were classified according to the SPEI values, as indicated in Table 2.
2.3.3. Bayes Method (BMA)
The Bayes technique, also known as Bayesian Model Averaging (BMA), employs Bayesian statistics to address the tasks of model selection and averaging. The incorporation of the Bayes factor (BF) and the Bayesian Information Criterion (BIC) in this approach allows for the consideration of the trade-off between model complexity and predictive performance. These components aid in the assessment and choice of models that strike a balance between simplicity and complexity, hence enhancing the ability to generalise to new data [57],[58].
Bayesian Model Averaging (BMA) effectively addresses the problem of duplication in multivariable linear regression by objectively identifying the variables that make a meaningful contribution to the model. By excluding factors that do not have a significant effect, the model's accuracy and interpretability are enhanced. The methodology utilises probabilistic frameworks to calculate the average of many models, taking into account the uncertainty related to the parameters of each model [49].
If we have two models M1 and M2 and assume that one of them is true, the posterior probability of M1 is:
In fact, we can also compare the two models M1 and M2 through real evidence:
This ratio is called the Bayes factor (BF). In the above interpretation, BF gives us information that the data are toward M1 or M2. With the BMA method, each study does not have only one model, but there can be many models that can also explain γ.
Various elements, such as climate and meteorology, influence the outcomes of calculating the drought index, known as the standardized precipitation–evapotranspiration index (SPEI). The study employed the Bayesian method to discover influential elements that significantly impact the Standardized Precipitation Evapotranspiration Index (SPEI) in the Mekong Delta, in order to establish the typical parameters for machine learning models. The application of the Bayesian method (BMA) in statistical analysis enables the identification of influential elements that significantly impact the SPEI value. Consequently, these factors may be determined as the primary parameters affecting the SPEI and can then be utilized as input parameters for the SPEI.
2.3.4. Artificial Intelligence Model Selection
The accuracy of the models utilized is crucial for forecasting the SPEI. Scientists have investigated many artificial intelligence (AI) methods, such as machine learning models, to make precise predictions of the SPEI index. According to the results of the literature review, the machine learning methods widely employed for SPEI prediction include Gradient Boosting, Extreme Gradient Boosting (XGBoost).
Gradient boosting algorithms such as XGBoost and Gradient Boosting can be effectively used to predict the Standardized Precipitation Evapotranspiration Index. These algorithms are powerful machine-learning methods that can handle complex relationships between input variables and the SPEI index [59]. By utilizing the principles of gradient boosting, these algorithms can iteratively refine the predictions and incorporate the strengths of multiple weak models into a strong predictive model. Moreover, research studies have shown that the XGBoost and LightGBM outperform traditional machine learning algorithms, such as decision trees, neural networks, and random forests, in terms of prediction accuracy for the SPEI index [60]. Additionally, the incorporation of specific characteristics of each variable through weighting distance based on sensitivity coefficients was found to further improve the performance of these algorithms in predicting the SPEI index. Furthermore, these gradient boosting algorithms have shown promising results in forecasting different seasons and multimonth-ahead reference evapotranspiration. In summary, gradient boosting algorithms, specifically XGBoost and Gradient Boosting, were highly effective in predicting the SPEI index.
- Gradient Boosting algorithms
Gradient boosting algorithms are a collection of strategies that improve the performance of weaker models (learners) by progressively combining them to decrease bias and variation in supervised learning situations [61]. Gradient boosting leverages the advantages of several models to construct a resilient predictive model that outperforms any individual poor learner [49].
Given a training dataset D = {xi, yi}N1, the goal of gradient boosting is to find an approximation, , of the function F∗(x), which maps instances x to their output values y by minimizing the expected value of a given loss function, L(y, F(x)). Gradient boosting builds an additive approximation of F∗(x) as a weighted sum of functions (6):
where is the weight of the mth function, hm(x). These functions are the models of the ensemble (e.g., decision trees). The approximation is constructed iteratively.
Below is a thorough analysis of the functioning of gradient boosting:
- Model Initialization: The procedure commences by constructing an initial model utilising the training data. The model generates predictions based on the training data, and subsequently calculates the residual errors, which represent the discrepancies between the actual values and the anticipated values.
- Sequential Model Addition: A novel model is trained to forecast the discrepancies between the preceding model's predictions and the actual values. The newly introduced model is incorporated into the ensemble, and the collective predictions of all existing models are utilised to revise the residuals.
- Weight Adjustment and Reweighting: The data points' weights are modified to prioritise the previously misclassified or poorly forecasted points. This procedure is iterated, wherein each subsequent model rectifies the inaccuracies of the collective ensemble of preceding models.
- Iterative process: Models are incrementally included until the training data is accurately predicted or a predetermined maximum number of models is attained. Every iteration has the objective of minimising the total prediction error by dealing with the leftover residuals.
- 2.
- Extreme Gradient Boosting (XGBoost):
XGBoost is a machine learning technique that use a gradient boosting framework to improve the accuracy of predictions. The algorithm lends greater importance to incorrectly classified data pieces, prioritising their accurate prediction in subsequent iterations [62]. XGBoost enhances existing gradient boosting algorithms by integrating regularisation approaches to reduce overfitting and employing advanced optimisation techniques to improve computational performance [49].
The purpose of the model is simplification through optimizations of the training loss (l) and regulations (Ω). fk is the function of the K–tree. The objective function (J) in round t is given by Equation (7).
Here is a concise summary of its functionality:
- Model Generation: An initial decision tree is constructed using the initial data. The calculation involves determining the discrepancy between the projected values and the actual observations, which is referred to as residuals.
- Subsequent Models: Additional trees are constructed to forecast the discrepancies from the preceding model. These algorithms prioritise the analysis of data points that were previously misclassified or inaccurately anticipated.
- Optimisation involves the ongoing addition of new trees, where each tree aims to rectify the mistakes made by the preceding trees. The designated loss function, such as mean squared error, is optimised by utilising the residuals obtained from each stage.
- Iteration and Combination: This iterative process is done several times. The ultimate model is an amalgamation of all the separate trees, with each tree making a contribution to the overall prediction.
2.3.5. Model Evaluation Method
The evaluation of the accuracy of models forecasting the Standardised Precipitation Evapotranspiration Index (SPEI) in the Mekong Delta is based on the following indicators: Mean absolute error (MAE); The mean square error (MSE); The root mean square errors (RMSE); and The coefficient of determination (R2) [49]. The criteria for evaluating (calibrating) the models are presented in Equations (8)–(11):
3. Results
3.1. SPEI Calculation
Figure 3 shows the SPEI calculation results for 11 meteorological stations in the Mekong Delta region during various time periods (1, 3, 6, and 12 months). The Mekong Delta region has experienced droughts from 1985 to 1990 and from 2010 to 2016.
- Stations with an SPEI < -2 (extremely dry) include Can Tho. These stations received less rainfall than the other stations; hence, the SPEI index was low.
- Stations with an SPEI ≥ 2 (extremely wet) included Ba Tri, Bac Lieu, Ca Mau, My Tho, and Soc Trang (1989). These coastal stations receive more rainfall than the other stations; hence, the SPEI index is high.
3.2. Feature Selection Results by BMA
Feature selection is a technique that involves minimizing the number of input variables in a model by retaining only the pertinent data and eliminating irrelevant or noisy information. Based on the findings of the correlation study, it is evident that the correlation coefficients between the SPEI1, SPEI3, SPEI6, SPEI9, and SPEI12 indices were quite high, ranging from 0.57 0.96. The correlation coefficient values for the pairs of variables were as follows: 0.79 for SPEI1 and SPEI3, 0.88 for SPEI3 and SPEI6, 0.93 for SPEI6 and SPEI9, and 0.96 for SPEI9 and SPEI12. Thus, this study exclusively chose the indicators SPEI1, SPEI3, SPEI6, and SPEI12 to construct the models. The correlation coefficient between the SPEI and meteorological parameters exhibited a relatively low range, varying from 0.09 0.48. Hence, the task of selecting ideal parameters for calculating the SPEI using machine learning models is a challenge, necessitating the use of a method for identifying crucial factors (Figure 4).
The nonlinear association between SPEI and climatic parameters is evident. This study utilized the Bayesian Model Averaging method (BMA) to choose the most suitable parameters. The statistical analysis results obtained using the BMA are presented in Figure 5. The BMA technique identified the five best models by selecting the essential parameters:
- The model for SPEI-1: Seven parameters were selected as Rainfall, Avg_Tmax, Avg_Tmin, Avg_Hum, PET, SOI_Anomaly, and SST_NINO4 (posterior probability was 100%).
- The model for SPEI-3: four parameters were selected: Rainfall, Avg_Tmin, Avg_Hum, and SST_NINO4 (posterior probability was 92.5%).
- The model for SPEI-6: Four parameters were selected: Rainfall, Avg_Tmin, Avg_Hum, and SST_NINO4 (posterior probability was 100%).
- The model for SPEI-12:5 parameters were selected as Rainfall, Avg_Tmin, Avg_Hum, SOI_Anomaly, SST_NINO4 (posterior probability was 88.4%).
3.3. Results of Evaluating Machine Learning Models
This study established four models for the SPEI-1, SPEI-3, SPEI-6, and SPEI-12 indices using the BMA method to predict only the SPEI. The models were developed based on various time periods and included Gradient Boosting (GB) and Extreme Gradient Boosting (XGBoost). Table 3 displays the outcomes of the hyperparameter-tweaking process.
The SPEI is calculated at different timescales (1, 3, 6, and 12 months) to capture short-term and long-term drought conditions. The forecast results for SPEI-1, SPEI-3, SPEI-6, and SPEI-12 are presented in Figure 6, Figure 7, Figure 8 and Figure 9 along with a comparison chart illustrating the discrepancy between the predicted and computed SPEI values for the test data.
The performance of each model was assessed using four evaluation metrics: the Mean Absolute Error (MAE), Mean Squared Error (MSE), Root Mean Squared Error (RMSE), and coefficient of determination (R2). These metrics are commonly used in regression analysis to quantify the accuracy, precision, and goodness-of-fit of the predictive models. Table 4 shows the results of the evaluation of the machine learning models (based on the four criteria) to predict the SPEI in the study area.
This table outlines the performance of the Gradient Boosting and XGBoost models trained to predict the Standardized Precipitation-Evapotranspiration Index (SPEI) over different time scales: 1, 3, 6, and 12 months. The input parameters for each model vary slightly, but generally include measures of rainfall, temperature (maximum and minimum averages), humidity, Potential Evapotranspiration (PET), Southern Oscillation Index (SOI) Anomaly, and Sea Surface Temperature in the NINO4 region (SST_NINO4).
The SPEI-1 model utilizes a comprehensive range of inputs to forecast SPEI on a monthly scale. The model's performance metrics included an MAE ranging from 0.28 to 0.34, MSE from 0.16 to 0.19, RMSE from 0.37 to 0.44, and an R² from 0.90 0.94. These values demonstrate high accuracy and indicate that XGBoost captures the intricate dynamics that influence monthly drought conditions.
The SPEI-3 model streamlined its inputs for the 3-month prediction by omitting the Avg_Tmax, PET, and SOI anomalies. The model demonstrates MAE ranging from 0.33 to 0.38, MSE from 0.21 to 0.26, RMSE from 0.45 to 0.51, and R² value between 0.83 and 0.89. It provides robust predictive capabilities, albeit significantly less precise than those of the 1-month model.
The SPEI-6 model, using identical inputs as the SPEI-3 model, produced a 6-month forecast with an MAE ranging from 0.32 to 0.36, MSE from 0.19 to 0.23, RMSE from 0.41 to 0.49, and an R² between 0.87 and 0.90. This suggests that the model is highly efficient in predicting mid-term droughts.
The SPEI-12 model incorporates the SOI Anomaly, in addition to the variables utilized in the SPEI-3 and SPEI-6 models for the 12-month forecast. The model achieves MAE ranging from 0.30 to 0.36, MSE ranging from 0.17 to 0.23, RMSE ranging from 0.41 to 0.48, and R² values ranging from 0.87 to 0.92. This indicates that including the SOI Anomaly leads to a substantial enhancement in the precision of the model for long-term drought forecasts.
4. Discussion
Artificial intelligence (AI) techniques, particularly machine learning models such as Gradient Boosting and Extreme Gradient Boosting (XGBoost), have demonstrated considerable promise in improving the accuracy of drought prediction in the Mekong Delta. These models overcome the constraints of conventional forecasting approaches by accurately reflecting the intricate dynamics of meteorological variables that impact drought conditions. The study demonstrates that the XGBoost model outperforms other models in predicting droughts at different time intervals. It emphasises the model's capability to handle complex interactions between input variables, which is crucial for accurately predicting the diverse character of droughts.
AI-based methods provide in-depth analysis of drought vulnerability and advancement, assisting in the management of water resources, planning for agriculture, and conservation of ecosystems. Precise and timely predictions allow stakeholders to proactively take actions to reduce the negative effects of drought on vulnerable populations and their means of living. Nevertheless, there are still obstacles to overcome, including as dealing with imbalanced datasets, integrating various data sources, and improving the process of selecting models and modifying hyperparameters. Furthermore, the fluctuation in space and time of droughts requires ongoing enhancement and verification of models.
In order to tackle these difficulties, it is essential to improve the methods of gathering and exchanging data, encourage collaboration between different fields of study, and make use of the progress made in processing power and algorithms. Future study should investigate the integration of AI models with satellite and remote sensing technologies to enhance the comprehension of drought indicators and advance real-time monitoring capabilities. Creating hybrid models that combine machine learning with conventional forecasting methods or other artificial intelligence approaches could provide a strong and flexible framework for predicting droughts that is customised to the specific requirements of the Mekong Delta and other places susceptible to drought.
The utilisation of AI for drought prediction is a crucial measure in comprehending and alleviating the consequences of this devastating natural calamity. Despite ongoing obstacles, the capacity of AI to fundamentally transform drought management tactics is unquestionable. As these models are improved and extended, the goal of obtaining better resistance to drought in the Mekong Delta and other areas becomes more and more achievable.
5. Conclusions
The amalgamation of artificial intelligence (AI) and machine learning (ML) has brought about a significant transformation in drought prediction, especially in susceptible areas such as the Mekong Delta. This study demonstrates the effectiveness of Gradient Boosting and Extreme Gradient Boosting (XGBoost) models in predicting the Standardised Precipitation-Evapotranspiration Index (SPEI) with R² values ranging from 0.83 to 0.94. These models surpass traditional techniques by precisely reflecting the intricate interconnections of climate elements.
AI models utilise comprehensive climate data and advanced analytical tools to improve the precision, dependability, and effectiveness of drought predictions. The XGBoost model excels in its ability to effectively handle the complex interconnections among meteorological variables. This progress establishes a strong basis for making well-informed decisions in the fields of water resource management, agriculture, and ecosystem conservation. Artificial intelligence-powered drought forecasts enable preventive and adaptable measures to reduce the negative effects on societies, economies, and ecosystems worldwide.
The study emphasises the necessity for ongoing investment in AI research and the creation of integrated models that merge satellite and remote sensing data. Future endeavours should prioritise improving the comprehensibility of AI models to ensure that their findings are easily understood by a wide range of individuals involved. Collaboration among scientists, policymakers, and practitioners is essential for ensuring that research goals are in line with practical uses and for implementing AI solutions on a large scale.
Ultimately, the integration of AI in drought prediction represents a notable advancement in promoting environmental resilience and sustainability. As these technologies advance, it becomes more possible to tackle the issues caused by drought. This helps to safeguard our world and its residents from the escalating dangers of climate change.
Author Contributions
All authors contributed to the writing and editing of the manuscript. Duong Hai Ha led the investigation, conceptualization, methodology, statistics, visualization, and writing of the original and final drafts. Phong Nguyen Duc, Thuan Ha Luong, Thang Tang Duc, Thang Trinh Ngoc, Tien Nguyen Minh, and Tu Nguyen Minh helped with conceptualization, writing, reviewing, visualization, and editing.
Funding
This research received no external funding.
Data Availability Statement
Data collected for the study can be made available upon request from the corresponding author.
Acknowledgments
The author would like to thank the steering committee of the Project "Research and develop criteria and solutions to implement on-the-spot guidelines to ensure water source security for socio-economic development in the Mekong Delta" (ĐTĐL.CN-45/23) of Assoc. Dr. Ha Luong Thuan provided data on water resources, hydrometeorology in Mekong Delta for this study.
Conflicts of Interest
The authors declare no conflicts of interest.
References
- Merlo, M.; Giuliani, M.; Du, Y.; Pechlivanidis, I.; Castelletti, A. 2023.
- McCabe, G.J.; Wolock, D.M.; Lombard, M.; Dudley, R.W.; Hammond, J.C.; Hecht, J.S.; Hodgkins, G.A.; Olson, C.; Sando, R.; Simeone, C.; et al. A hydrologic perspective of major U.S. droughts. Int. J. Climatol. 2023, 43, 1234–1250. [Google Scholar] [CrossRef]
- Orimoloye, I.R.; Belle, J.A.; Orimoloye, Y.M.; Olusola, A.O.; Ololade, O.O. Drought: A Common Environmental Disaster. Atmosphere 2022, 13, 111. [Google Scholar] [CrossRef]
- Eyvaz, M.; Albahnasawi, A.; Tekbaş, M.; Gürbulak, E.; Eyvaz, M.; Albahnasawi, A.; Tekbaş, M.; Gürbulak, E. Drought - Impacts and Management; 2022; ISBN 978-1-80355-544-7.
- P, A.; a; Sahoo, N. ; Panigrahi, B.; Das, D.M. Drought Assessment using Standardized Precipitation Index and Normalized Difference Vegetation Index. Int. J. Curr. Microbiol. Appl. Sci. 2020, 9, 1125–1136. [Google Scholar] [CrossRef]
- Busker, T.S.; de Moel, H.; van den Hurk, B.; Aerts, J.C.J.H. Impact-Based Seasonal Rainfall Forecasting to Trigger Early Action for Droughts 2022. [CrossRef]
- Yaseen, Z.M.; Shahid, S. Drought Index Prediction Using Data Intelligent Analytic Models: A Review. In Intelligent Data Analytics for Decision-Support Systems in Hazard Mitigation: Theory and Practice of Hazard Mitigation; Deo, R.C., Samui, P., Kisi, O., Yaseen, Z.M., Eds.; Springer Transactions in Civil and Environmental Engineering; Springer: Singapore, 2021; pp. 1–27. ISBN 9789811557729. [Google Scholar]
- Son, B.; Lee, J.; Im, J.; Park, S. Future drought prediction using time-series of drought factors and the US drought monitor data based on deep learning over CONUS. Copernicus Meetings; 2023. [Google Scholar]
- Rasheed, N.K.A.; Otieno, V.; Misiani, H.; Ouma, J.; Otenyo, E.; Kinuya, J.; Amdihun, A. Automatic generation of impact-based drought forecast, implications for early warning and action in East Africa; Copernicus Meetings. 2023. [Google Scholar]
- Monte, T.D.; Cherchi, A.; Alessandri, A.; Gaetani, M. Assessing the predictability of droughts through seasonal forecasts; Copernicus Meetings. 2023. [Google Scholar]
- Seung Kyu, L.; Truong An, D. Evaluating drought events under influence of El-Nino phenomenon: A case study of Mekong delta area, Vietnam. J. Agrometeorol. 2018, 20, 275–279. [Google Scholar] [CrossRef]
- Nguyen, N.A. Historic drought and salinity intrusion in the Mekong Delta in 2016: Lessons learned and response solutions. Vietnam J. Sci. Technol. Eng. 2017, 59, 93–96. [Google Scholar] [CrossRef] [PubMed]
- Lee, S.K.; Dang, T.A. Spatio-temporal variations in meteorology drought over the Mekong River Delta of Vietnam in the recent decades. Paddy Water Environ. 2019, 17, 35–44. [Google Scholar] [CrossRef]
- Adamson, P.; Bird, J. The Mekong: A Drought-prone Tropical Environment? Int. J. Water Resour. Dev. 2010, 26, 579–594. [Google Scholar] [CrossRef]
- Lu, X.; Chua, S. River Discharge and Water Level Changes in the Mekong River: Droughts in an Era of Mega-Dams; Preprints, 2021. [Google Scholar]
- Ngoc, N.T.; Duong, B.D.; Chien, N.Q.; Darby, S.; Nga, P.T.T.; Thao, B.T.P.; Tai, N.V. Meteorological drought assessment using satellite-based TRMM product in Vietnamese Mekong Delta.; Publishing House for Science and Technology: Hanoi, Vietnam, 2019. [Google Scholar]
- Tran, T.V.; Tran, D.X.; Myint, S.W.; Latorre-Carmona, P.; Ho, D.D.; Tran, P.H.; Dao, H.N. Assessing Spatiotemporal Drought Dynamics and Its Related Environmental Issues in the Mekong River Delta. Remote Sens. 2019, 11, 2742. [Google Scholar] [CrossRef]
- Bui, N.; Pal, I.; Chollacoop, N. Drought risk assessment under climate change impacts utilizing CMIP6 climate models in the coastal zone of the Mekong Delta; Copernicus Meetings. 2023. [Google Scholar]
- Nguyen, L.; Li, Q. Relationship between Pacific and Indian Oceans SST and Drought Trends in Vietnam Mekong Delta.; ACTA Press, 2014.
- Quang, C.N.X.; Hoa, H.V.; Giang, N.N.H.; Hoa, N.T. Assessment of meteorological drought in the Vietnamese Mekong delta in period 1985-2018. IOP Conf. Ser. Earth Environ. Sci. 2021, 652, 012020. [Google Scholar] [CrossRef]
- Orn-uma Polpanich; Dhyey Bhatpuria; Tania Fernanda Santos Santos; Chayanis Krittasudthacheewa Leveraging Multi-Source Data and Digital Technology to Support the Monitoring of Localized Water Changes in the Mekong Region. Available online: https://www.mdpi.com/2071-1050/14/3/1739 (accessed on Jan 27, 2024).
- Zhang, X.; Qu, Y.; Ma, M.; Liu, H.; Su, Z.; Lv, J.; Peng, J.; Leng, G.; He, X.; Di, C. Satellite-Based Operational Real-Time Drought Monitoring in the Transboundary Lancang–Mekong River Basin. Remote Sens. 2020, 12, 376. [Google Scholar] [CrossRef]
- Shabri, A. A hybrid wavelet analysis and adaptive neuro-fuzzy inference system for drought forecasting. Appl. Math. Sci. 2014, 8, 6909–6918. [Google Scholar] [CrossRef]
- Salite, D. Traditional prediction of drought under weather and climate uncertainty: analyzing the challenges and opportunities for small-scale farmers in Gaza province, southern region of Mozambique. Nat. Hazards 2019, 96, 1289–1309. [Google Scholar] [CrossRef]
- Bertini, C.; Andel, S.J. van; Perez, G.C.; Werner, M. AI-enhanced drought forecasting: a case study in the Netherlands; Copernicus Meetings. a: drought forecasting, 2022. [Google Scholar]
- Luong Bang Nguyen; Manh Hung Le Application of Artificial Neural Network and Climate Indices to Drought Forecasting in South-Central Vietnam Available online: http://www.pjoes.com/Application-of-Artificial-Neural-nNetwork-and-Climate-Indices-to-Drought-nForecasting,105972,0,2.html (accessed on Jan 27, 2024).
- Lee, J.; Kim, C.-G.; Lee, J.E.; Kim, N.W.; Kim, H. Application of Artificial Neural Networks to Rainfall Forecasting in the Geum River Basin, Korea. Water 2018, 10, 1448. [Google Scholar] [CrossRef]
- Jalalkamali, A.; Moradi, M.; Moradi, N. Application of several artificial intelligence models and ARIMAX model for forecasting drought using the Standardized Precipitation Index. Int. J. Environ. Sci. Technol. 2015, 12, 1201–1210. [Google Scholar] [CrossRef]
- Kikon, A.; Deka, P.C. Artificial intelligence application in drought assessment, monitoring and forecasting: a review. Stoch. Environ. Res. Risk Assess. 2022, 36, 1197–1214. [Google Scholar] [CrossRef]
- Qaisrani, Z.N.; Nuthammachot, N.; Techato, K.; Asadullah; Jatoi, G. H.; Mahmood, B.; Ahmed, R. Drought variability assessment using standardized precipitation index, reconnaissance drought index and precipitation deciles across Balochistan, Pakistan. Braz. J. Biol. 2022, 84, e261001. [Google Scholar] [CrossRef] [PubMed]
- F. D. Kartika and P. Wijayanti, “Drought disaster modeling using drought index: a systematic literature review,” IOP Conf. Ser.: Earth Environ. Sci., vol. 1190, no. 1, p. 012026, Jun. 2023. [CrossRef]
- M. Öney and A. Anli, “Regional Drought Analysis with Standardized Precipitation Evapotranspiration Index (SPEI): Gediz Basin, Turkey,” J Agr Sci-Tarim Bili, vol. 29, no. 4, Art. no. 4, Nov. 2023. [CrossRef]
- P. Kumari, S. P. Kumari, S. Rehana, S. K. Singh, and M. Inayathulla, “Development of a new agro-meteorological drought index (SPAEI-Agro) in a data-scarce region,” Hydrological Sciences Journal, vol. 68, no. 9, pp. 1301–1322, Jul. 2023. [CrossRef]
- Kobulniczky, B.; Holobâcă, I.-H.; Črepinšek, Z.; Pogačar, T.; Jiman, A.-M.; Žnidaršič, Z. Comparison of Standardized Precipitation Index (SPI) and Standardized Potential Evapotranspiration Index (SPEI) applicability for drought assessment during the maize growing period between Bărăgan (Romania) and Prekmurje (Slovenia) regions (1991; Copernicus Meetings. 1991. [Google Scholar]
- Tam, B.Y.; Cannon, A.J.; Bonsal, B.R. Standardized precipitation evapotranspiration index (SPEI) for Canada: assessment of probability distributions. Can. Water Resour. J. Rev. Can. Ressour. Hydr. 2023, 48, 283–299. [Google Scholar] [CrossRef]
- Santini, M.; Noce, S.; Mancini, M.; Caporaso, L. A Global Multiscale SPEI Dataset under an Ensemble Approach. Data 2023, 8, 36. [Google Scholar] [CrossRef]
- Shi, X.; Yang, Y.; Ding, H.; Chen, F.; Shi, M. Analysis of the Variability Characteristics and Applicability of SPEI in Mainland China from 1985 to 2018. Atmosphere 2023, 14, 790. [Google Scholar] [CrossRef]
- Azman, R.M.N.R.; Noor, N. a. M.; Abdullah, S.; Ideris, M.M. Analysis of Drought Index in Sub-Urban Area Using Standard Precipitation Evapotranspiration Index (SPEI). Int. J. Integr. Eng. 2022, 14, 157–163. [Google Scholar] [CrossRef]
- Sandhya Krishna, P.; Yamini Krishna, B. ; Nafisa, Shaik. ; Ratna Sravani, T.; Ragha Madhuri, J.; Vanditha, Ch. Prediction of Droughts using SPEI. In Proceedings of the 2023 IEEE 12th International Conference on Communication Systems and Network Technologies (CSNT); 2023; pp. 839–845. [Google Scholar]
- Azman, R.M.N.R.; Noor, N. a. M.; Abdullah, S.; Ideris, M.M. Analysis of Drought Index in Sub-Urban Area Using Standard Precipitation Evapotranspiration Index (SPEI). Int. J. Integr. Eng. 2022, 14, 157–163. [Google Scholar] [CrossRef]
- Careto, J.A.M.; Soares, P.M.M.; Cardoso, R.M.; Russo, A.; Lima, D.C.A. A new ensemble-based SPI and SPEI index to depict droughts projections for the Iberia Peninsula with the EURO-CORDEX; Copernicus Meetings. 2022. [Google Scholar]
- Nguyen, V.H.; Yen, H.P.H. Seasonal variation and its impacts in rice-growing regions of the Mekong Delta. Int. J. Clim. Change Strateg. Manag. 2021, 13, 483–491. [Google Scholar] [CrossRef]
- Thanh Nguyen Giao; Thi Hong Huynh Nhien Evaluating Water Quality Variation in the Vietnamese Mekong Delta Area Using Cluster and Discriminant Analysis | Applied Environmental Research. Available online: https://ph01.tci-thaijo.org/index.php/aer/article/view/240912 (accessed on Jan 30, 2024).
- Dinh, T.K.H.; Dang, T.A. Potential risks of climate variability on rice cultivation regions in the Mekong Delta, Vietnam. Rev. Bras. Eng. Agríc. E Ambient. 2022, 26, 348–355. [Google Scholar] [CrossRef]
- Cosslett, T.L.; Cosslett, P.D. The Mekong Delta Provinces. In Water Resources and Food Security in the Vietnam Mekong Delta; Cosslett, T.L., Cosslett, P.D., Eds.; Natural Resource Management and Policy; Springer International Publishing: Cham, 2014; ISBN 978-3-319-02198-0. [Google Scholar]
- Minh Huynh,; Pankaj Kumar; Nguyen Van Toan Deciphering the relationship between meteorological and hydrological drought in Ben Tre province, Vietnam. Available online: https://www.researchsquare.com (accessed on Jan 26, 2024).
- Zhou, K.; Shi, X.; Renaud, F. Understanding precipitation moisture sources of the Vietnamese Mekong Delta and their dominant factors during recent drought events; Copernicus Meetings. 2023. [Google Scholar]
- Lavane, K.; Kumar, P.; Meraj, G.; Han, T.G.; Ngan, L.H.B.; Lien, B.T.B.; Van Ty, T.; Thanh, N.T.; Downes, N.K.; Nam, N.D.G.; et al. Assessing the Effects of Drought on Rice Yields in the Mekong Delta. Climate 2023, 11, 13. [Google Scholar] [CrossRef]
- Minh, H.V.T.; Kumar, P.; Van Ty, T.; Duy, D.V.; Han, T.G.; Lavane, K.; Avtar, R. Understanding Dry and Wet Conditions in the Vietnamese Mekong Delta Using Multiple Drought Indices: A Case Study in Ca Mau Province. Hydrology 2022, 9, 213. [Google Scholar] [CrossRef]
- Nguyen, D.P.; Ha, H.D.; Trinh, N.T.; Nguyen, M.T. Application of artificial intelligence for forecasting surface quality index of irrigation systems in the Red River Delta, Vietnam. Environ. Syst. Res. 2023, 12, 24. [Google Scholar] [CrossRef]
- Rattayová, V.; Garaj, M.; Kandera, M.; Hlavčová, K. Evaluation of Hargreaves method for calculation of reference evapotranspiration in selected stations of Slovakia; Copernicus Meetings. 2023. [Google Scholar]
- Al-Asadi, K.; Abbas, A.A.; Dawood, A.S.; Duan, J.G. Calibration and Modification of the Hargreaves–Samani Equation for Estimating Daily Reference Evapotranspiration in Iraq. J. Hydrol. Eng. 2023, 28, 05023005. [Google Scholar] [CrossRef]
- Koç, D.L.; Can, M.E. Reference evapotranspiration estimate with missing climatic data and multiple linear regression models. PeerJ 2023, 11, e15252. [Google Scholar] [CrossRef]
- Elagib, N.A.; Musa, A.A. Correcting Hargreaves-Samani formula using geographical coordinates and rainfall over different timescales. Hydrol. Process. 2023, 37, e14790. [Google Scholar] [CrossRef]
- Hargreaves, G.; Samani, Z. Reference Crop Evapotranspiration From Temperature. Appl. Eng. Agric. 1985, 1. [Google Scholar] [CrossRef]
- Mulualem, G.M.; Liou, Y.-A. Application of Artificial Neural Networks in Forecasting a Standardized Precipitation Evapotranspiration Index for the Upper Blue Nile Basin. Water 2020, 12, 643. [Google Scholar] [CrossRef]
- Vicente-Serrano, S.M.; Beguería, S.; López-Moreno, J.I. A Multiscalar Drought Index Sensitive to Global Warming: The Standardized Precipitation Evapotranspiration Index. J. Clim. 2010, 23, 1696–1718. [Google Scholar] [CrossRef]
- Max Hinne; Quentin F. Gronau; Eric-Jan Wagenmakers A Conceptual Introduction to Bayesian Model Averaging Available online:. Available online: https://journals.sagepub.com/doi/full/10.1177/2515245919898657 (accessed on Feb 2, 2024).
- Tuan, N.V. Regression Models and Scientific Discovery Available online:. Available online: https://www.sachkhaiminh.com/mo-hinh-hoi-quy-va-kham-pha-khoa-hoc-gs-nguyen-van-tuan (accessed on Feb 2, 2024).
- Fan, J.; Ma, X.; Wu, L.; Zhang, F.; Yu, X.; Zeng, W. Light Gradient Boosting Machine: An efficient soft computing model for estimating daily reference evapotranspiration with local and external meteorological data. Agric. Water Manag. 2019, 225, 105758. [Google Scholar] [CrossRef]
- Fan, J.; Wang, X.; Wu, L.; Zhou, H.; Zhang, F.; Yu, X.; Lu, X.; Xiang, Y. Comparison of Support Vector Machine and Extreme Gradient Boosting for predicting daily global solar radiation using temperature and precipitation in humid subtropical climates: A case study in China. Energy Convers. Manag. 2018, 164, 102–111. [Google Scholar] [CrossRef]
- Schapire, R.E. The Boosting Approach to Machine Learning: An Overview. In Nonlinear Estimation and Classification; Denison, D.D., Hansen, M.H., Holmes, C.C., Mallick, B., Yu, B., Eds.; Lecture Notes in Statistics; Springer: New York, NY, 2003; ISBN 978-0-387-21579-2. [Google Scholar]
- Ali, Z.; Abduljabbar, Z.; Tahir, H.; Sallow, A.; Almufti, S. Exploring the Power of eXtreme Gradient Boosting Algorithm in Machine Learning: a Review. 2023, 12, 320–334. [CrossRef]
Figure 1.
The geographical location and metrological stations in the Mekong Delta.
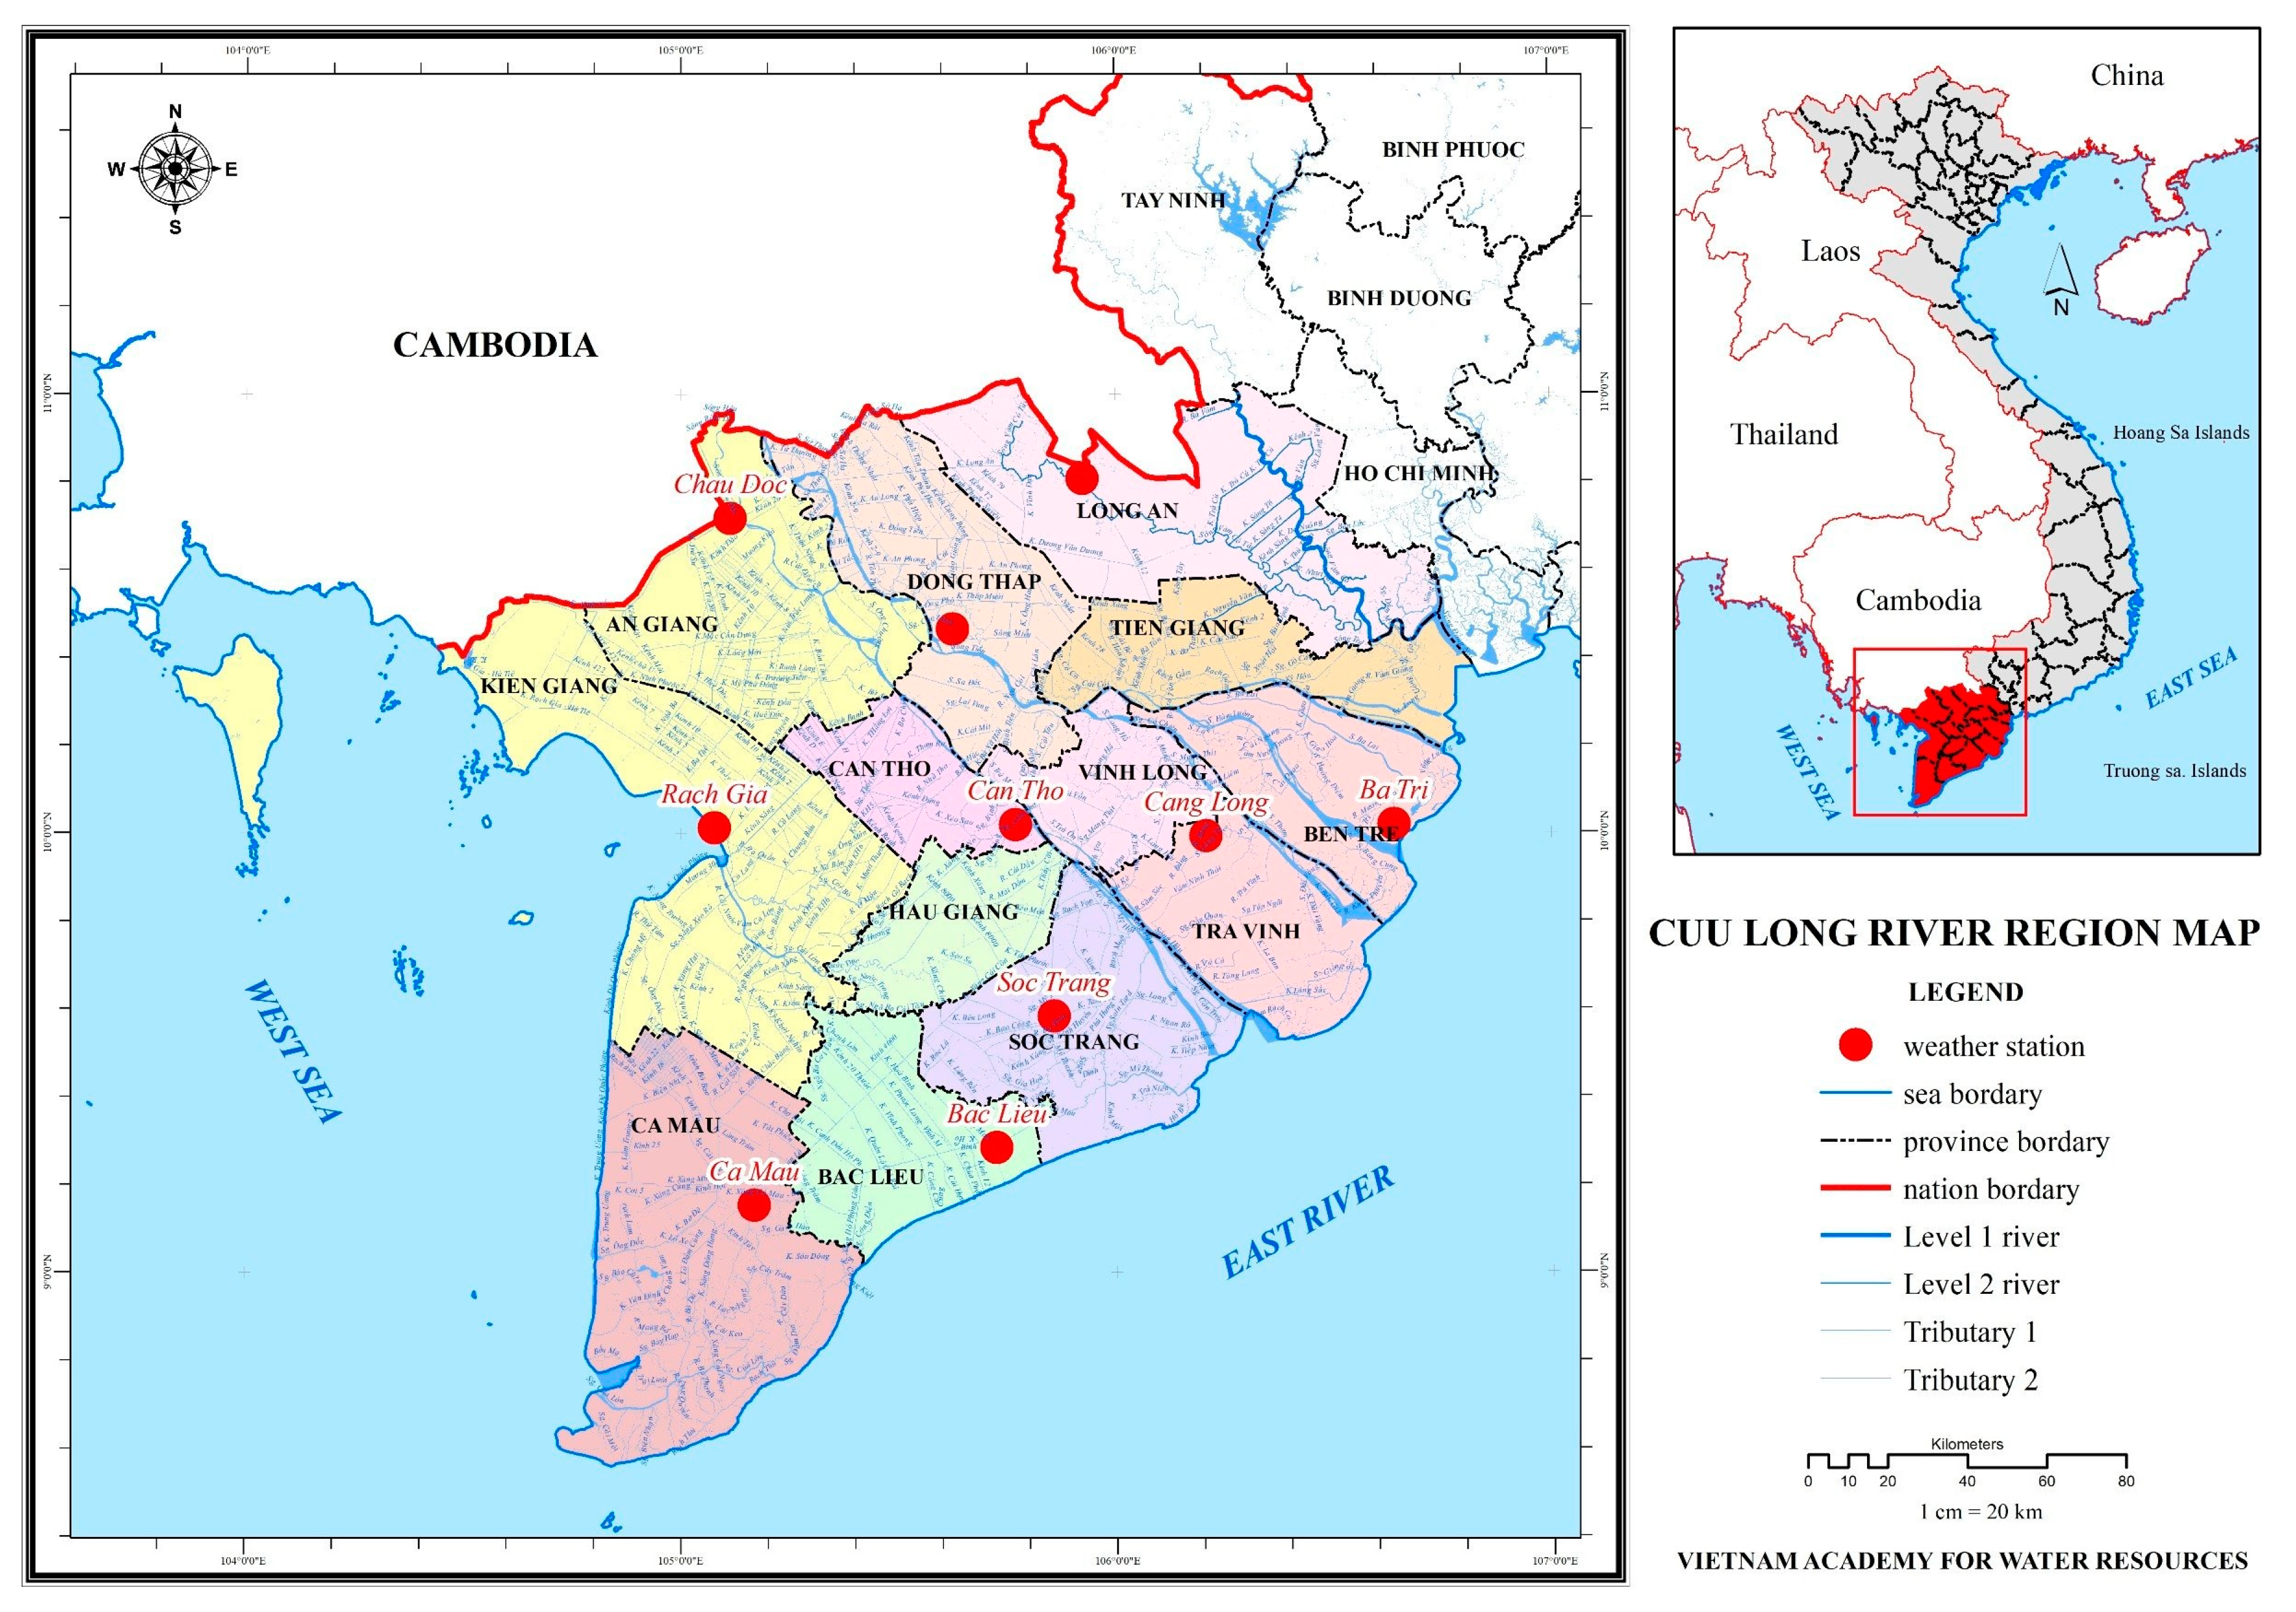
Figure 2.
The average monthly precipitation and CWBL for eleven meteorological stations in the Mekong Delta from 1985 to 2022.
Figure 2.
The average monthly precipitation and CWBL for eleven meteorological stations in the Mekong Delta from 1985 to 2022.
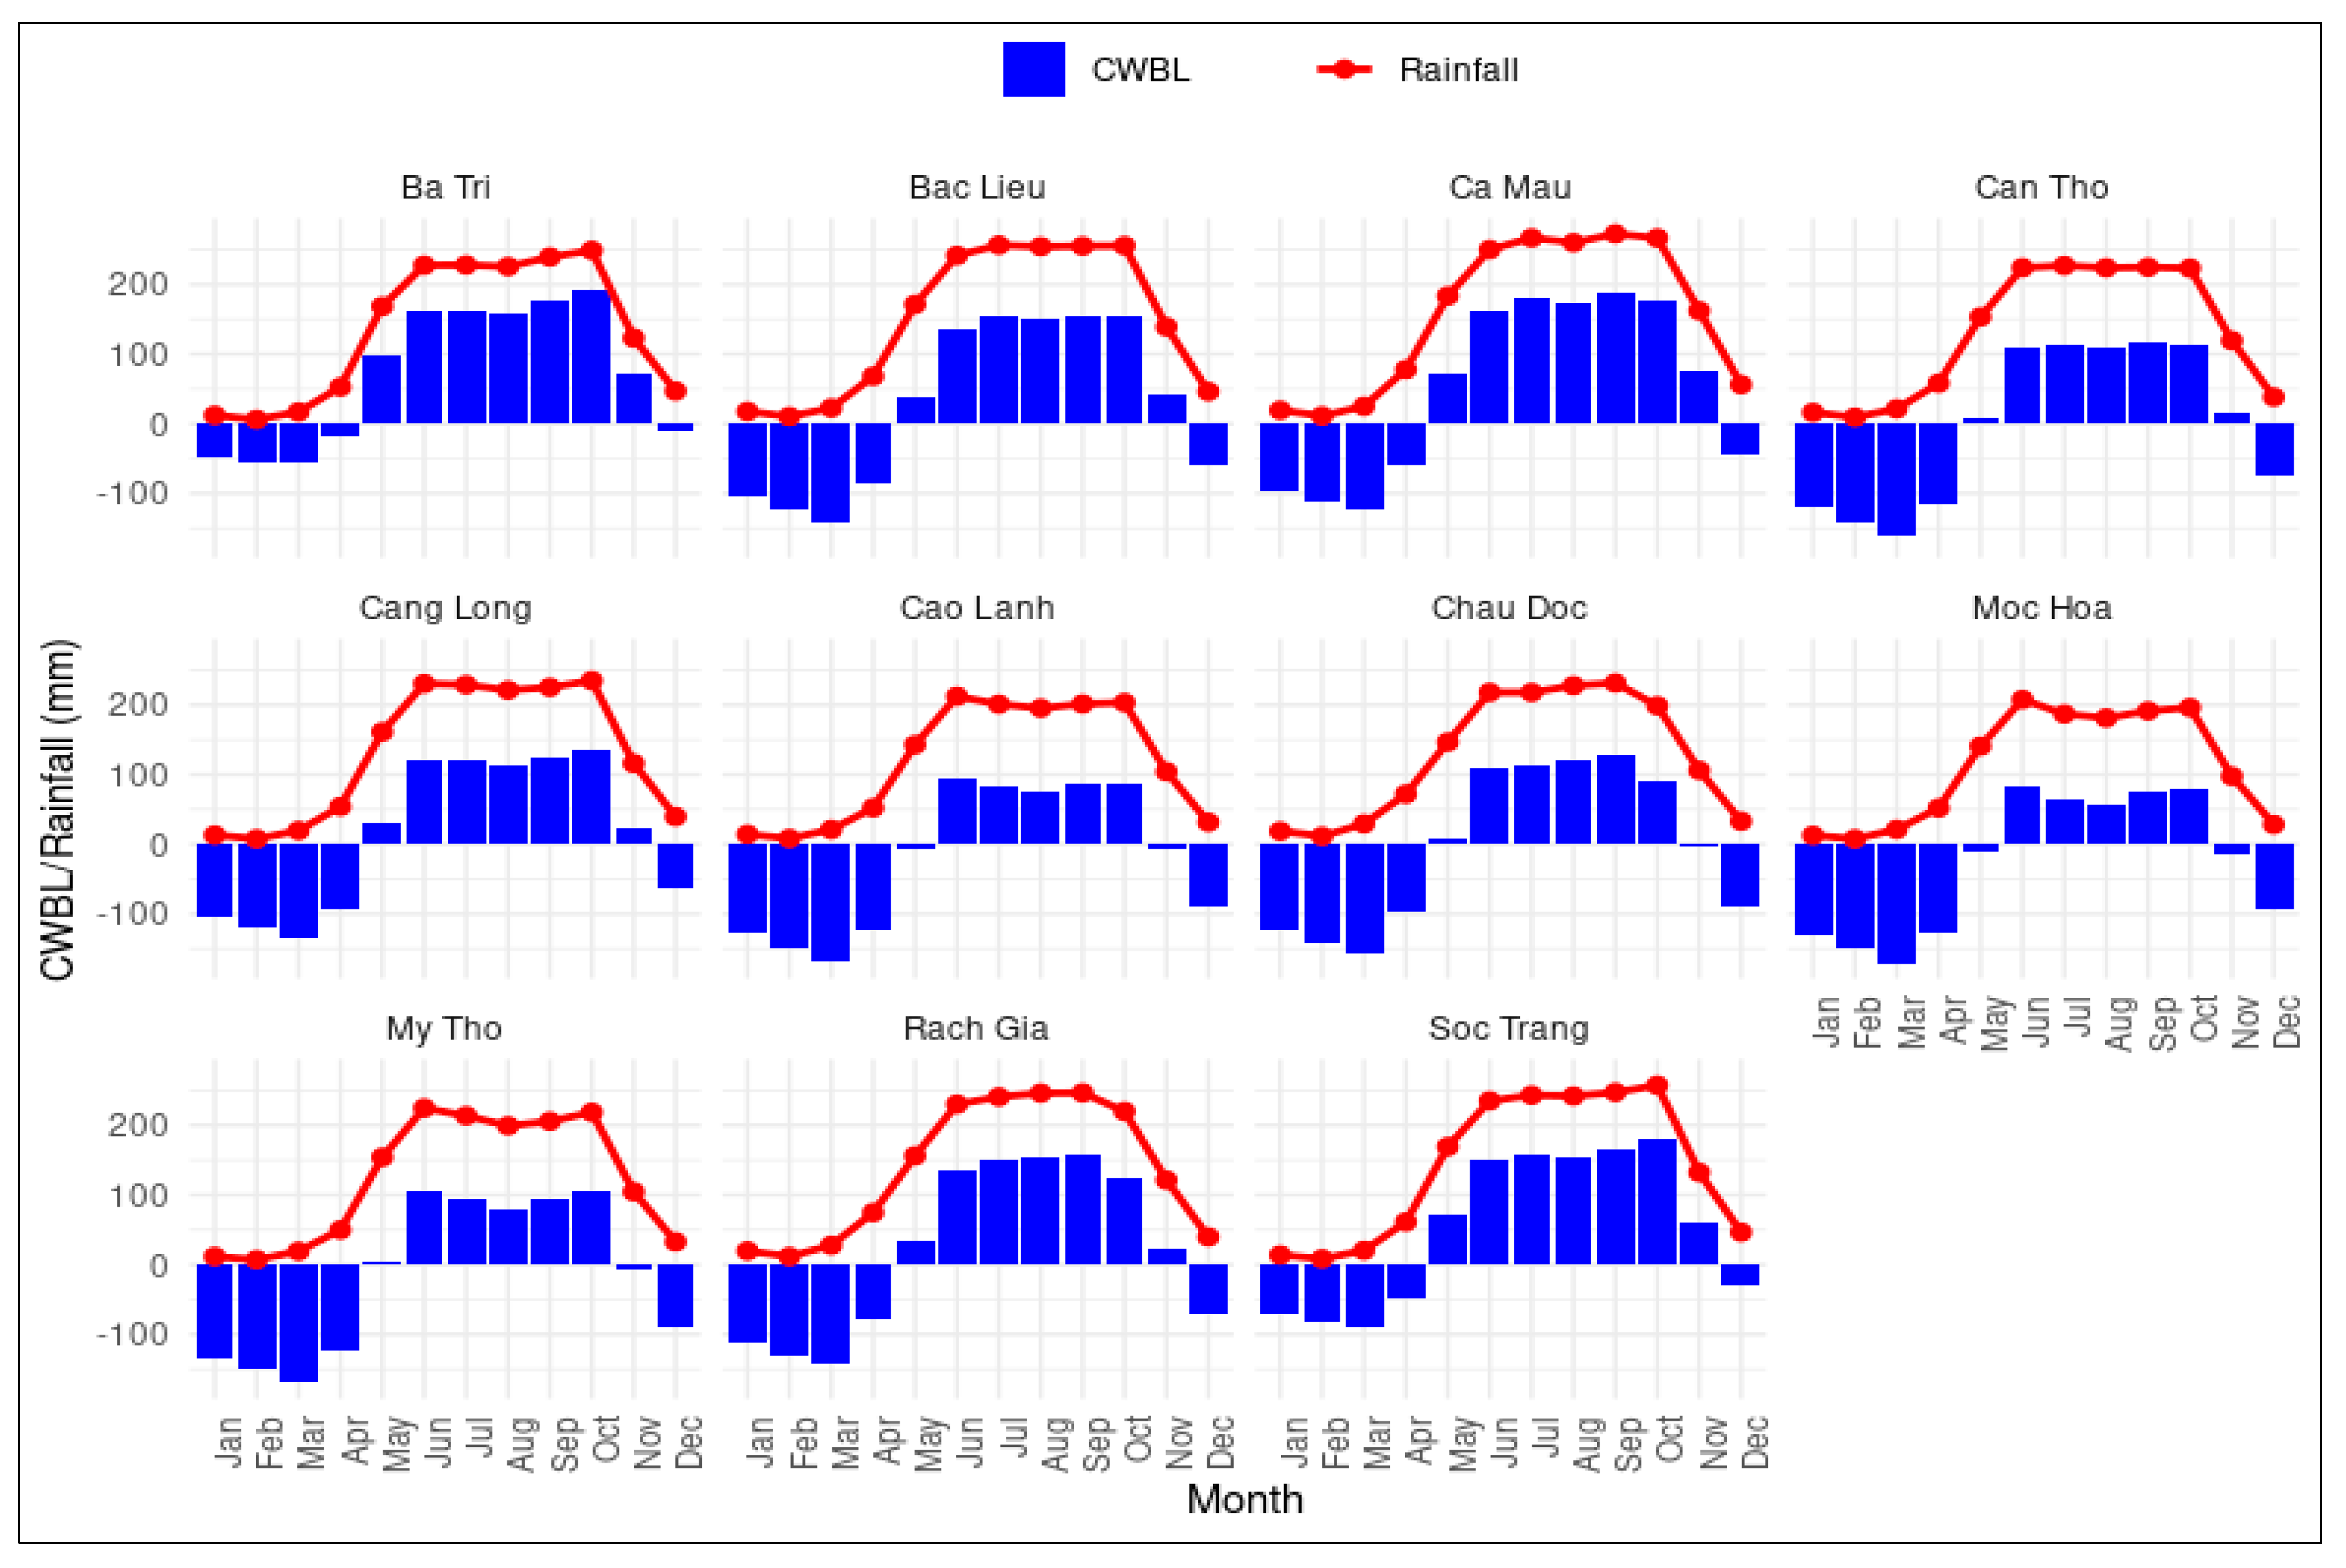
Figure 3.
Chart of SPEI of 11 meteorological stations in the Mekong Delta (1990 - 2022).
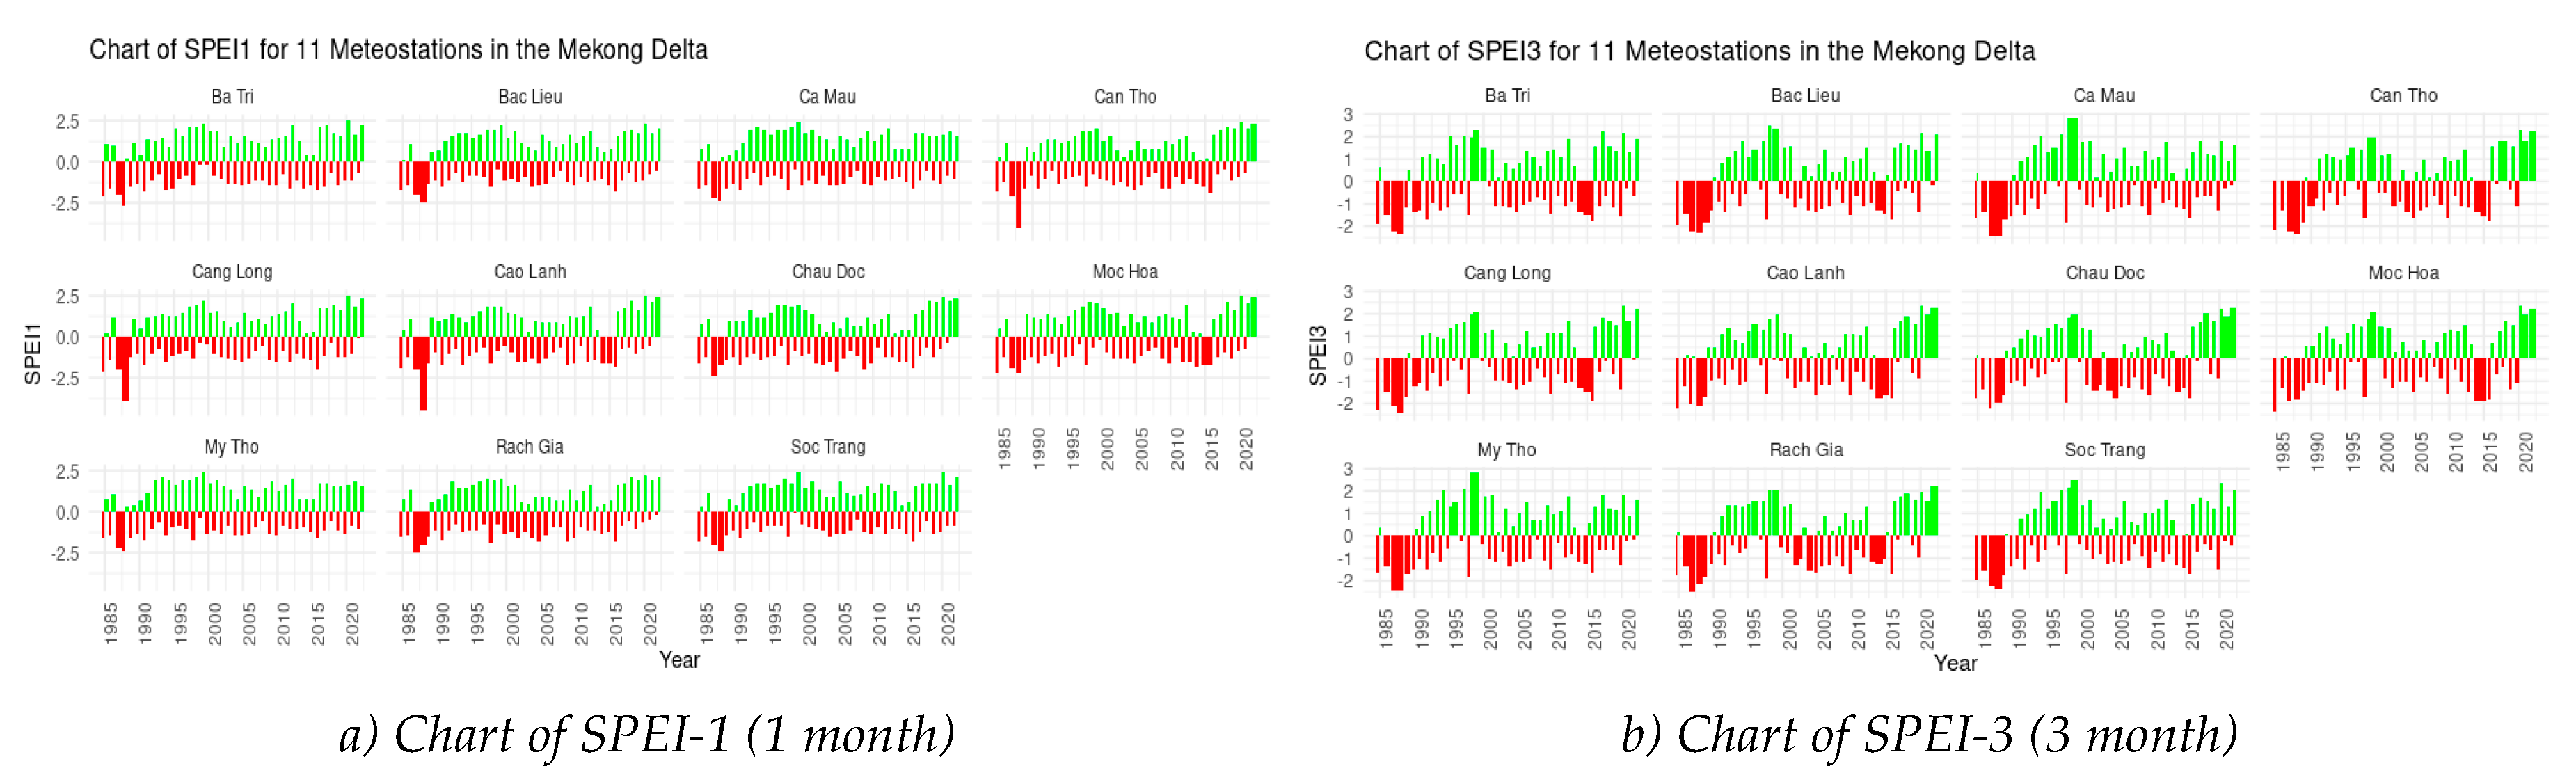
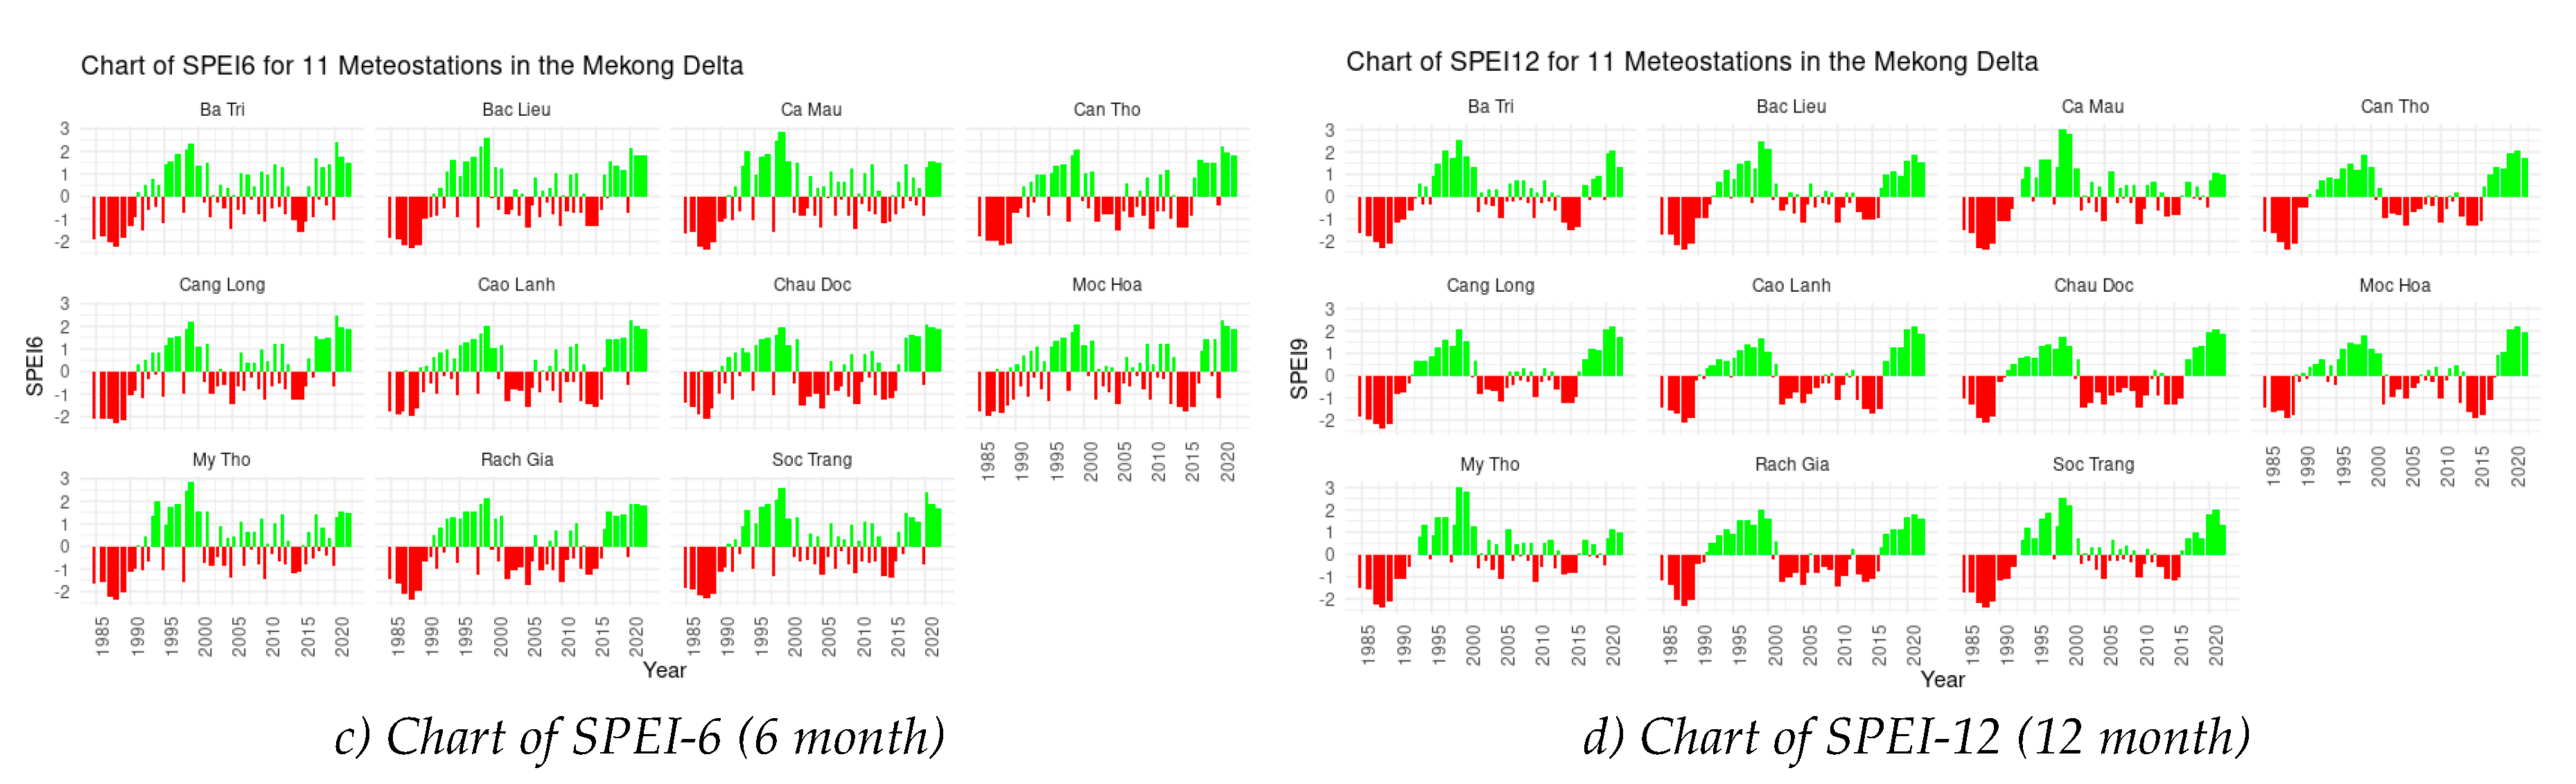
Figure 4.
Correlation chart of drought index and meteorological parameters.
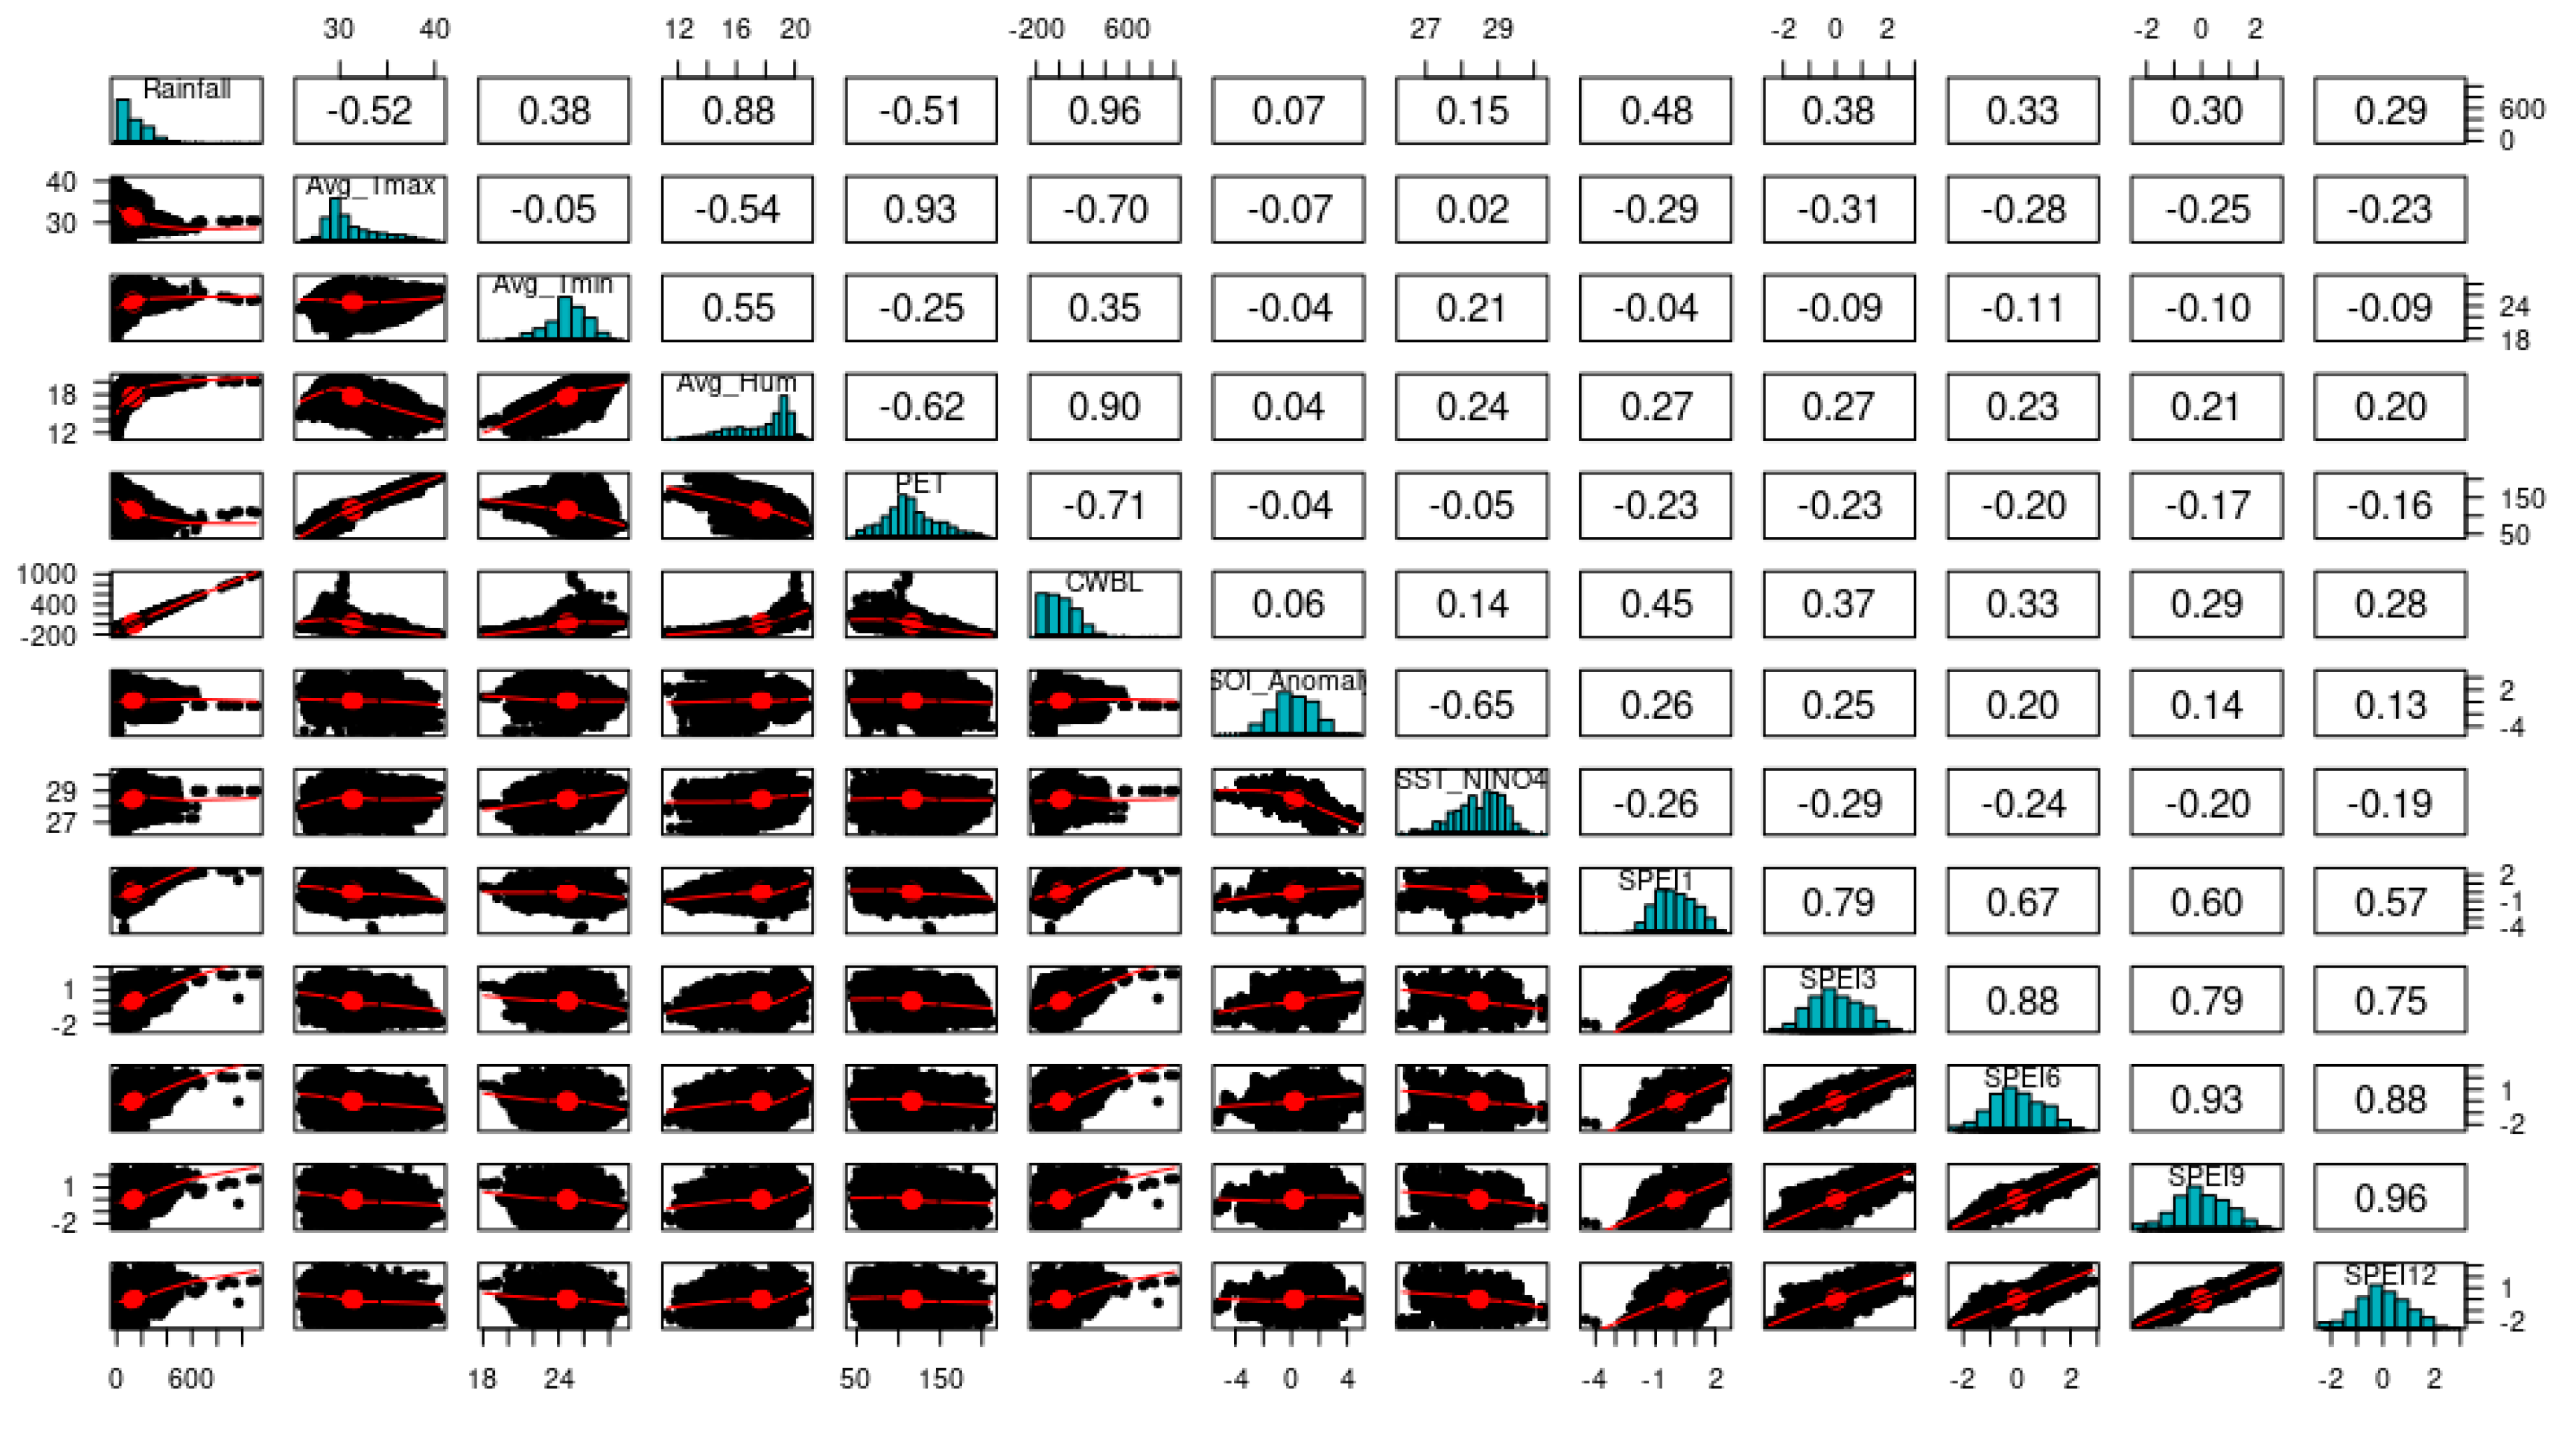
Figure 5.
Graph of the selection of important parameters by BMA.
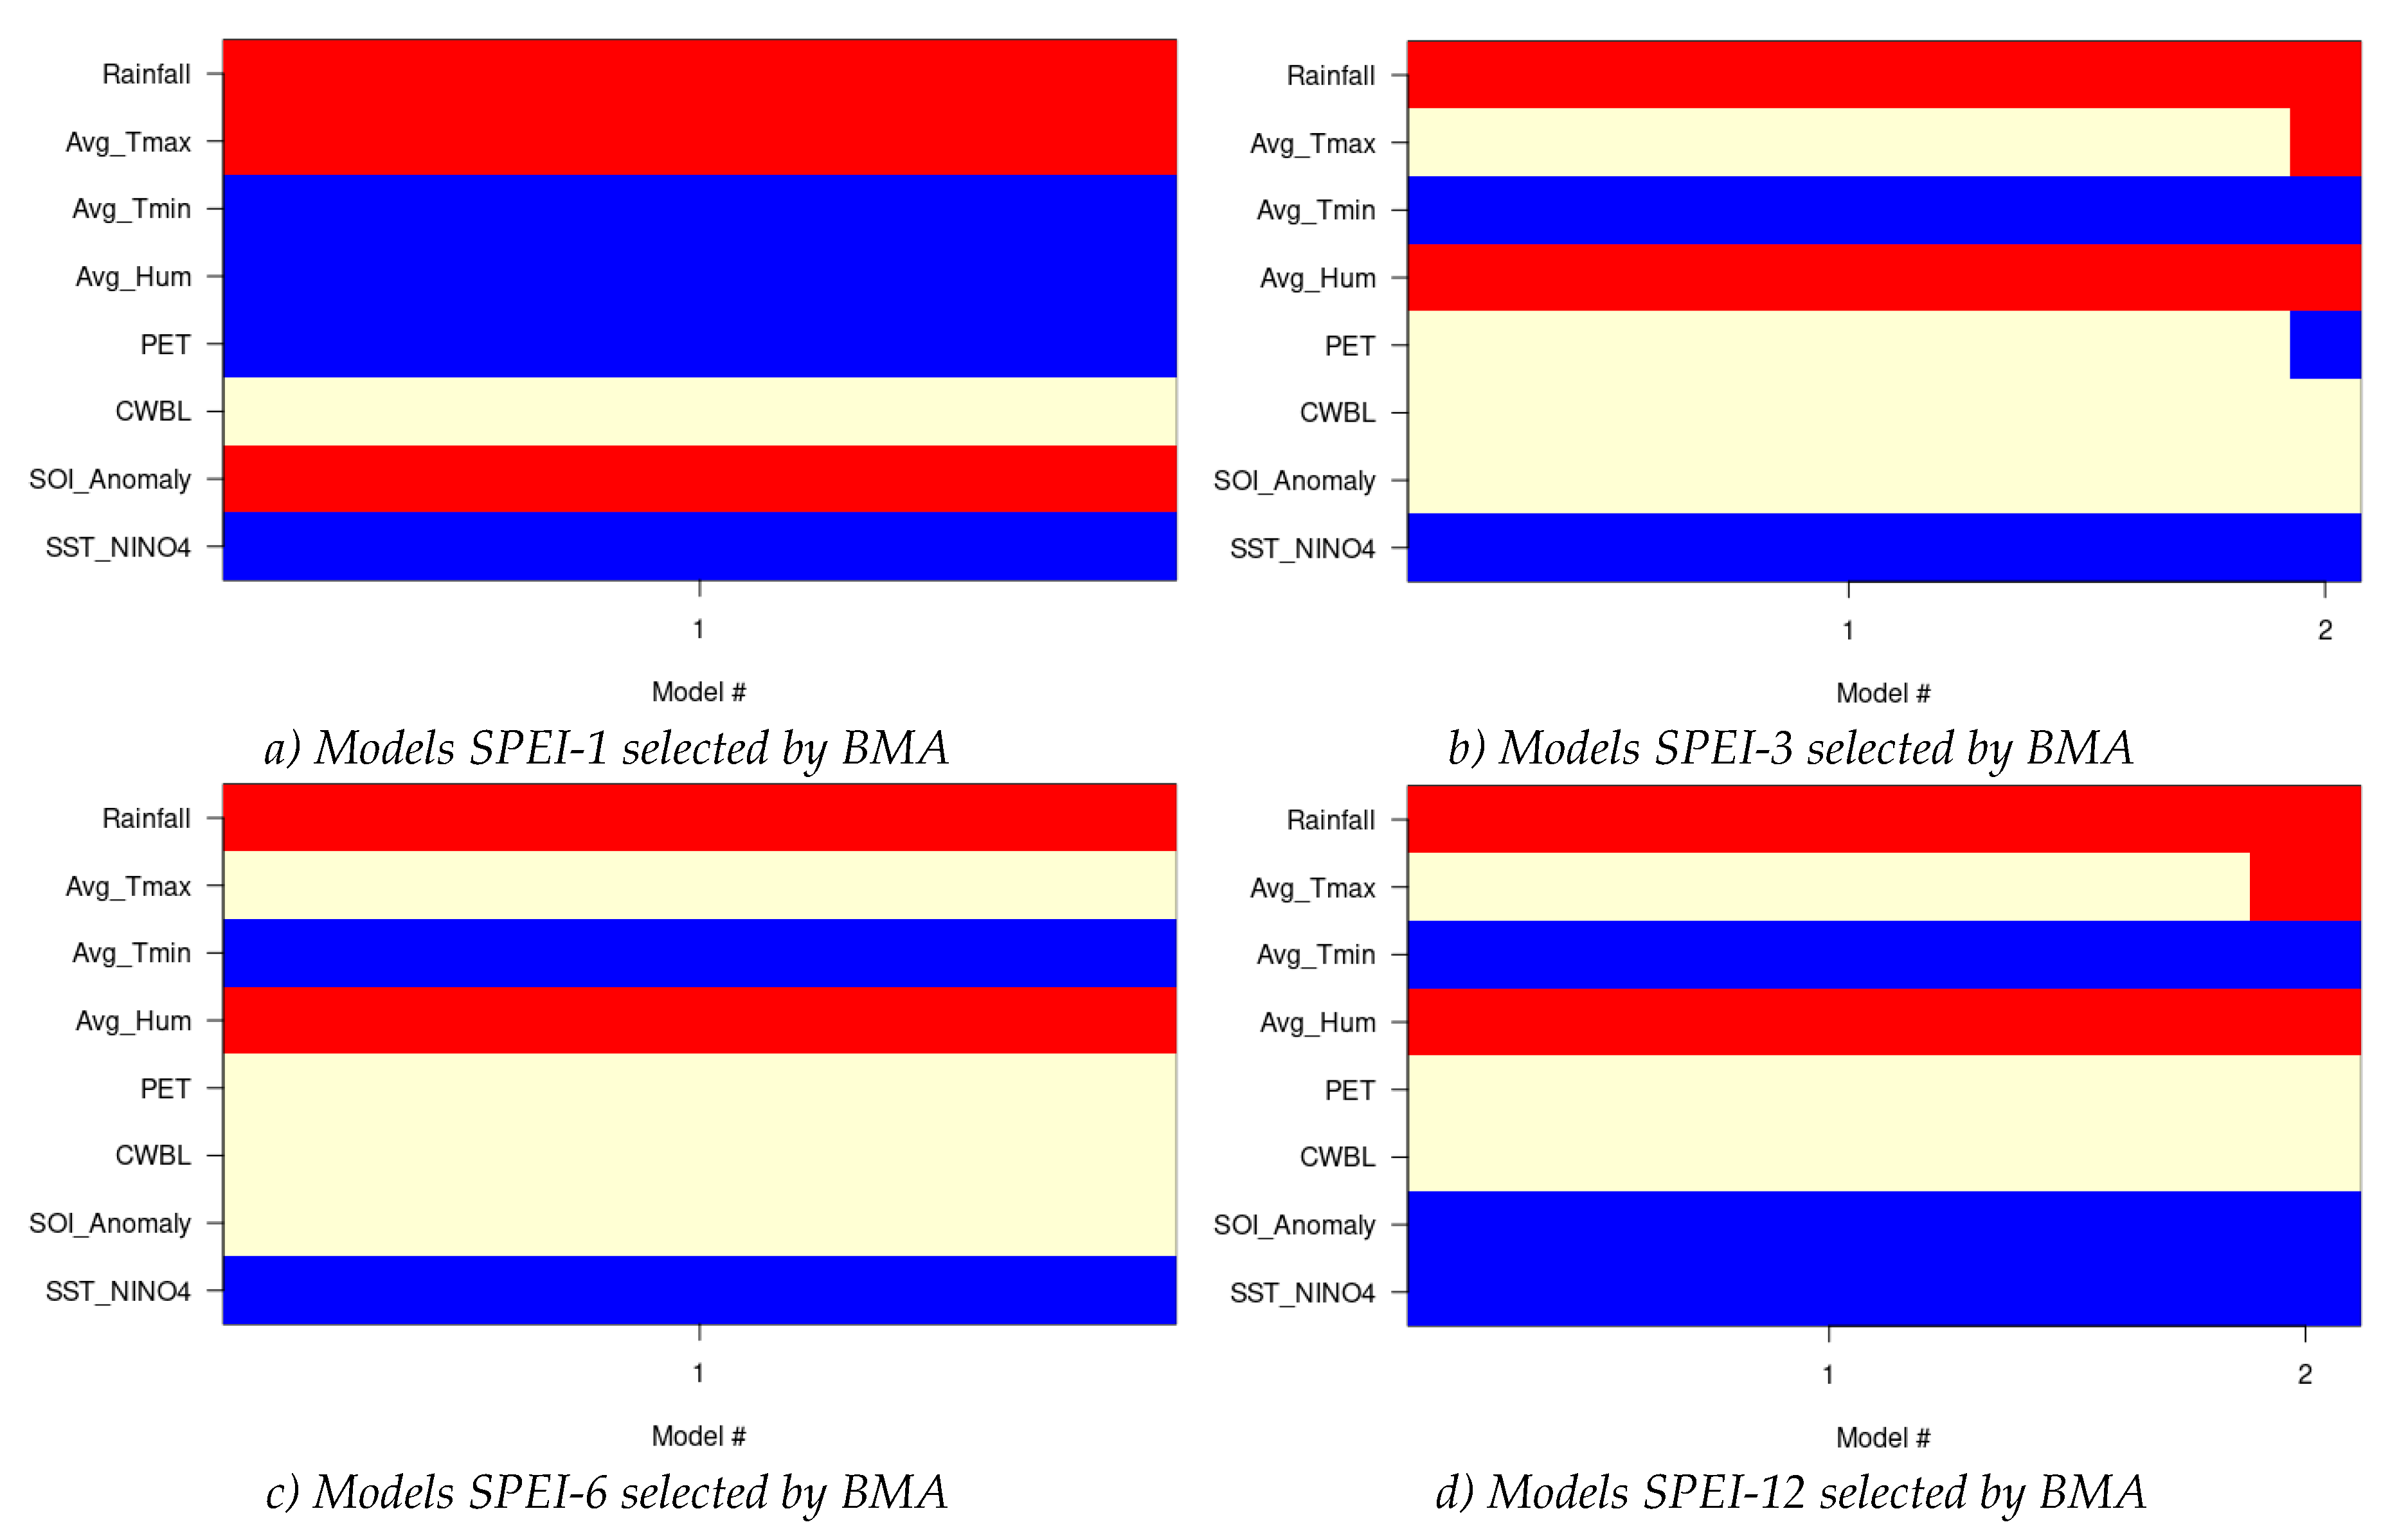
Figure 6.
Comparison chart between forecast and actual SPEI-1 for the test data.
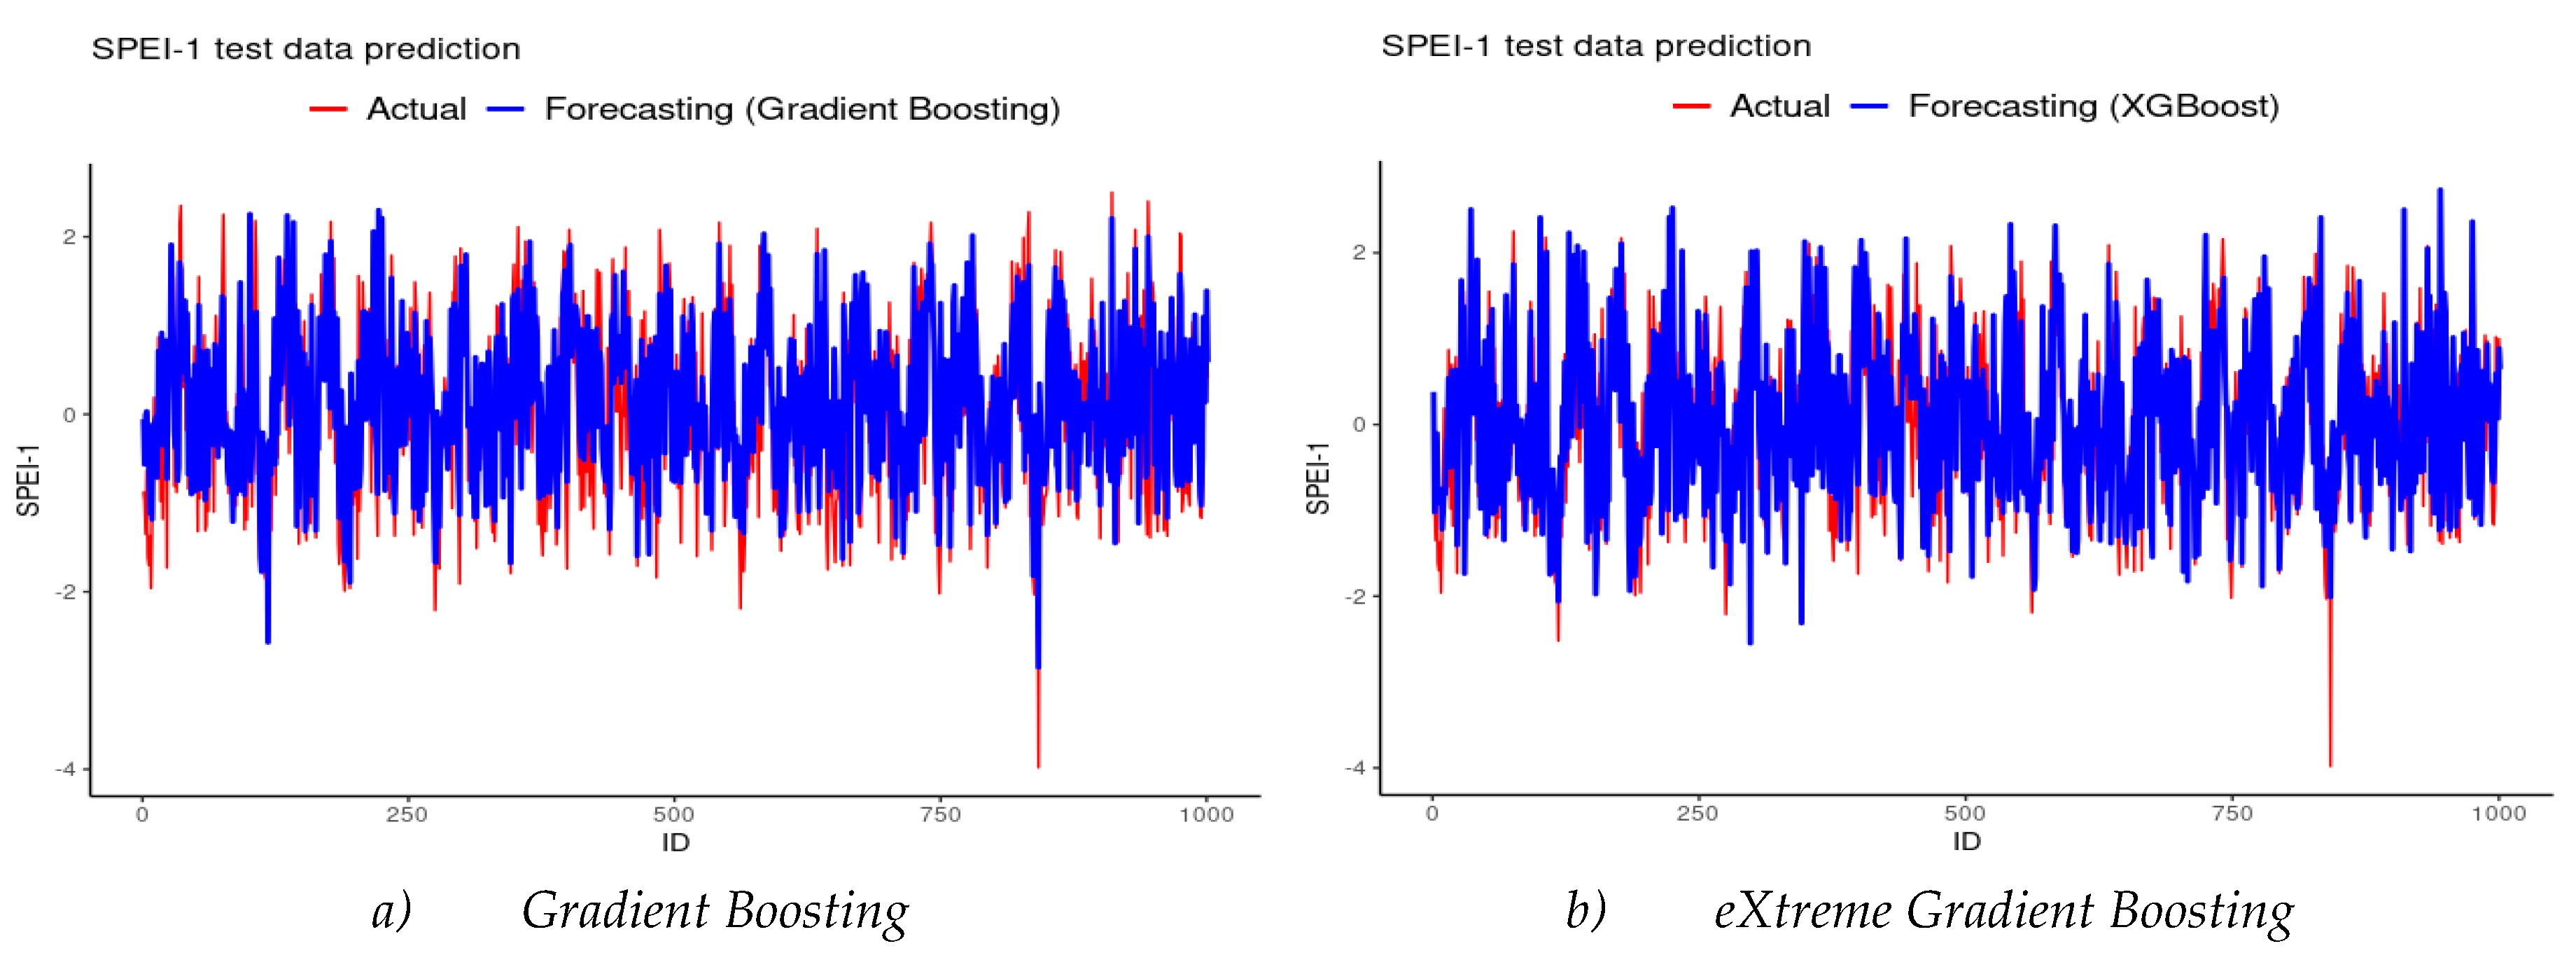
Figure 7.
Comparison chart between forecast and actual SPEI-3 for the test data.
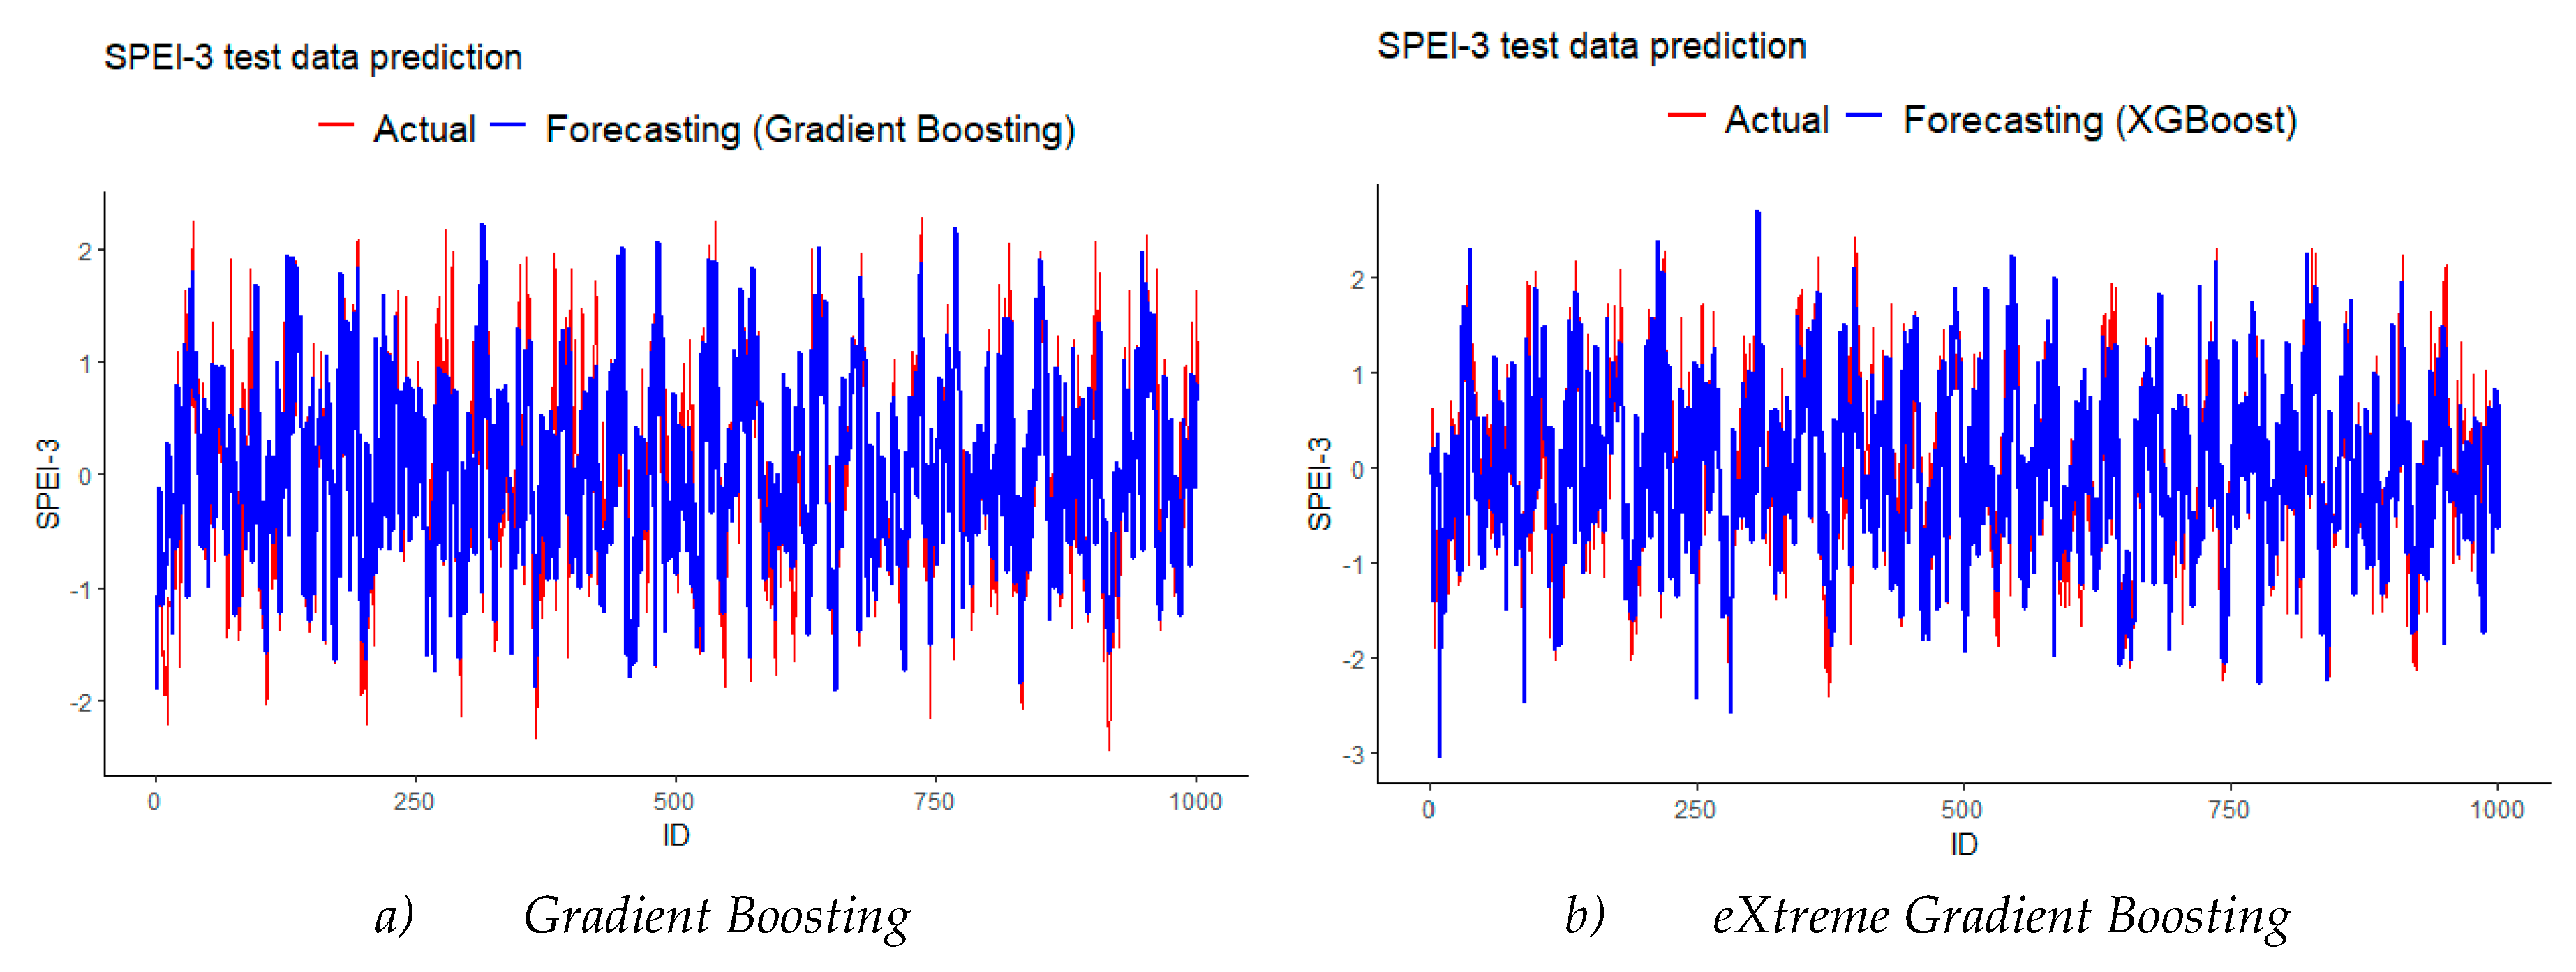
Figure 8.
Comparison chart between forecast and actual SPEI-6 for the test data.
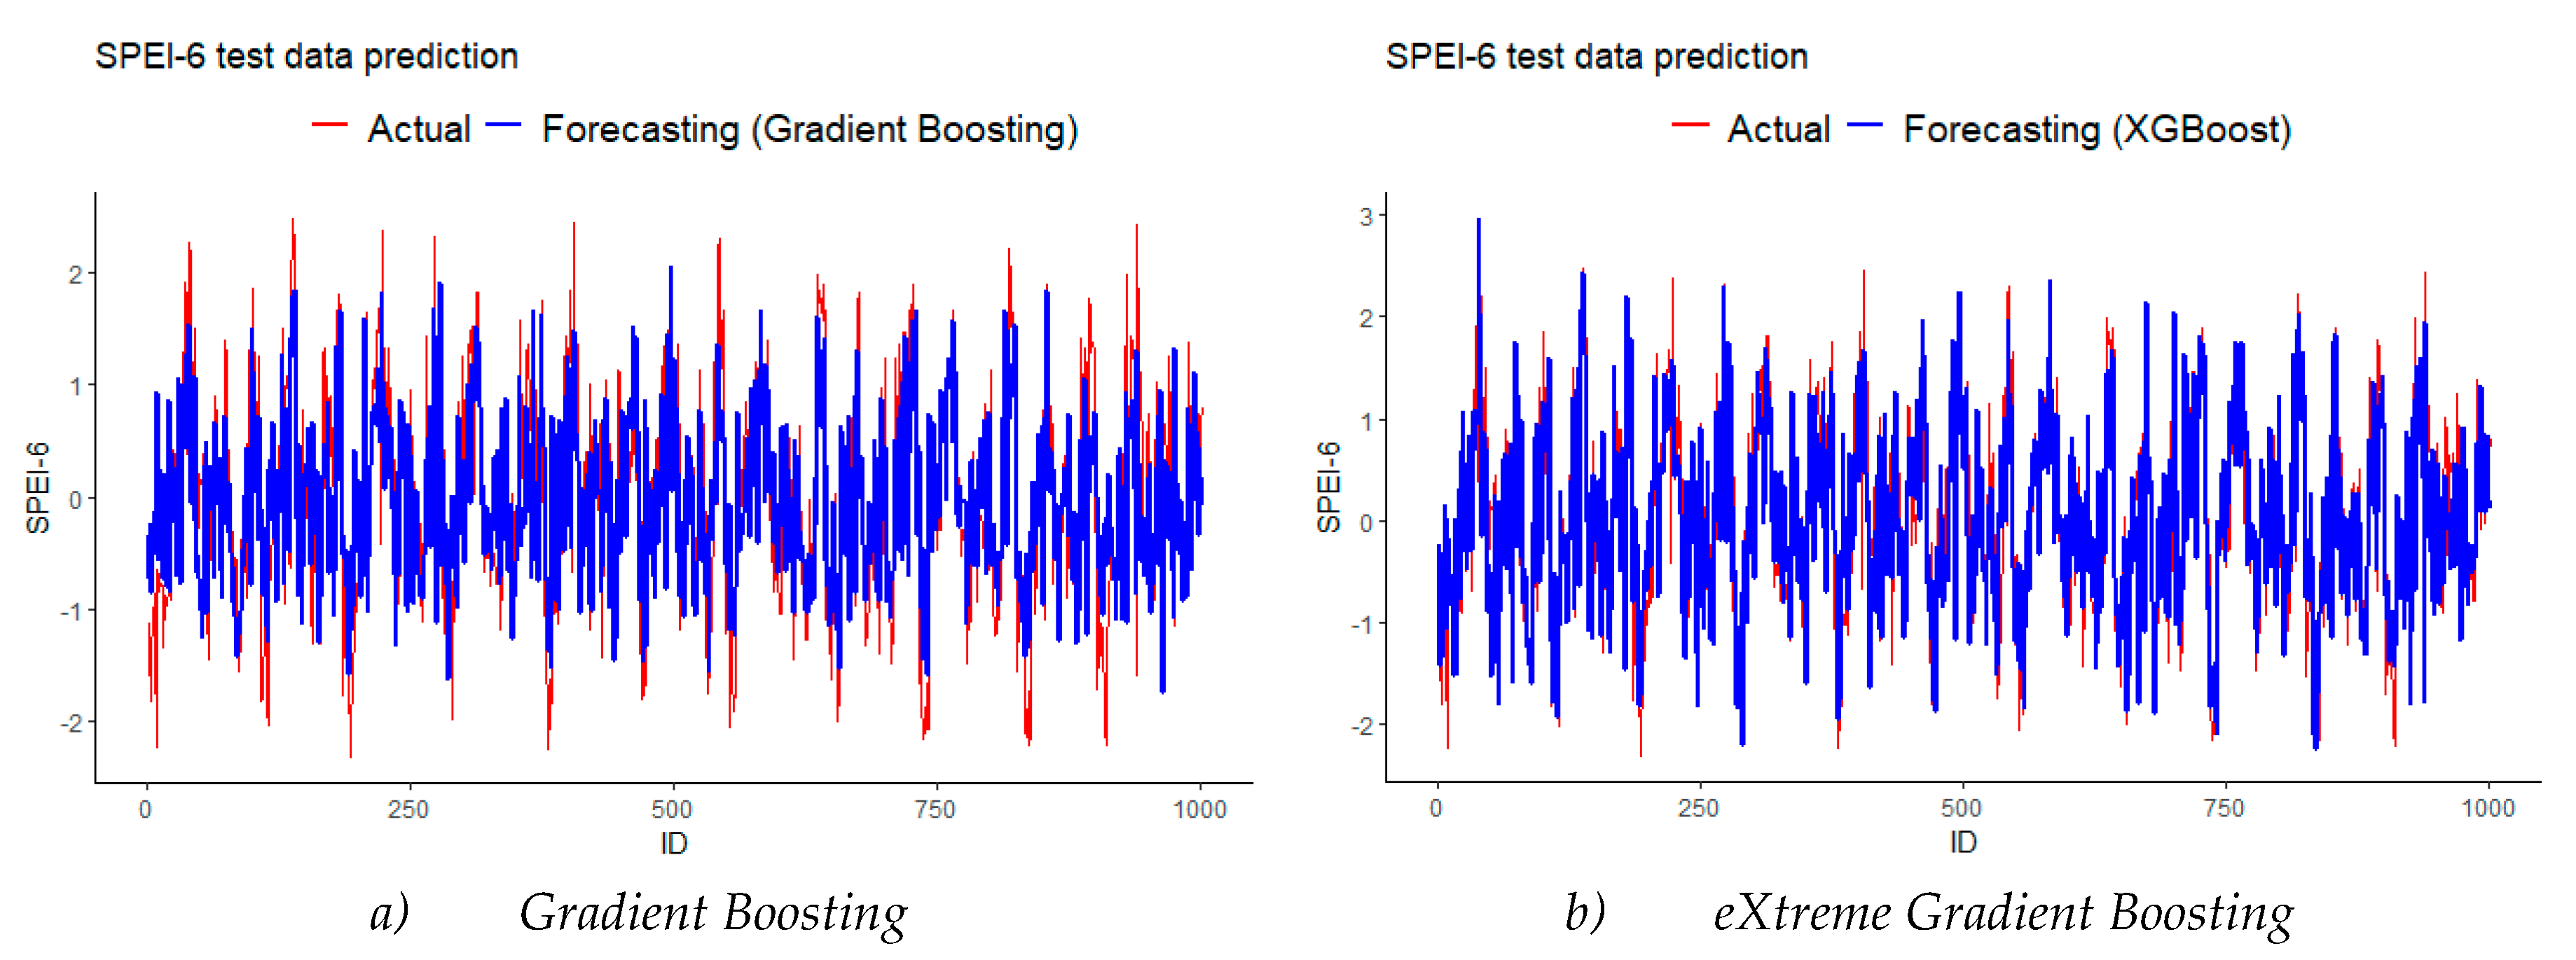
Figure 9.
Comparison chart between forecast and actual SPEI-12 for the test data.
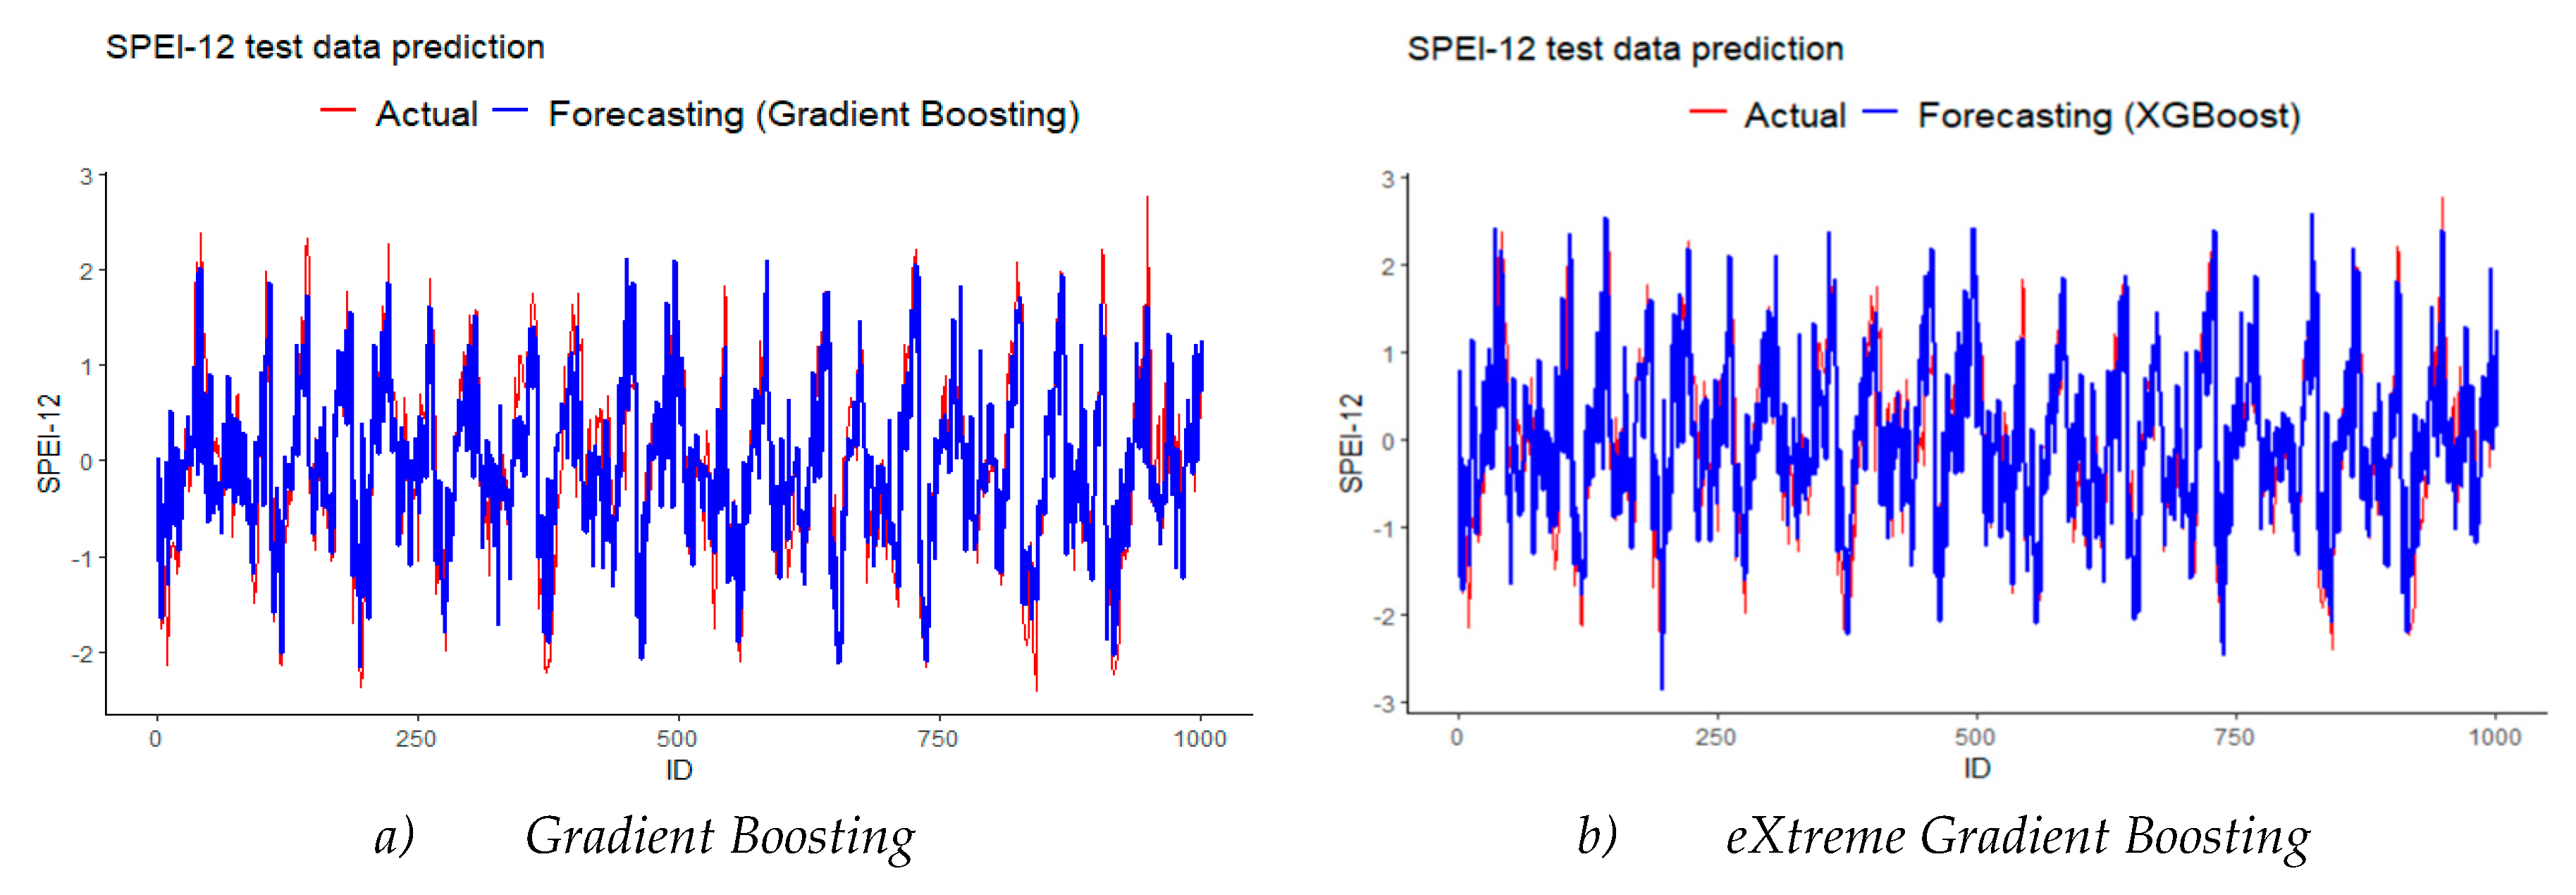

Table 1.
Descriptive statistics of meteorological stations in the Mekong Delta.
| Station Name | Geographical Locations | Annual Mean Rainfall (mm) | Annual Mean Temperature (0C) | |
|---|---|---|---|---|
| Latitude | Longitude | |||
| Chau Doc | 10°42'12.7"N | 105°07'58.7"E | 1360 | 27.0 |
| Cao Lanh | 10°28'16.6"N | 105°38'42.1"E | 1356 | 27.0 |
| Moc Hoa | 10°45'12.6"N | 105°56'00.5"E | 1564 | 27.3 |
| Can Tho | 10°01'33.9"N | 105°46'07.8"E | 1544 | 26.6 |
| My Tho | 10°21'03.3"N | 106°23'53.9"E | 1349 | 26.7 |
| Cang Long | 9°59'33.7"N | 106°12'11.3"E | 1672 | 26.8 |
| Ba Tri | 10°02'30.6"N | 106°35'37.3"E | 1473 | 26.8 |
| Soc Trang | 9°36'05.2"N | 105°58'24.9"E | 1859 | 26.8 |
| Bac Lieu | 9°17'43.5"N | 105°42'50.1"E | 1712 | 26.8 |
| Ca Mau | 9°10'28.5"N | 105°10'41.5"E | 2366 | 26.7 |
| Rach Gia | 10°00'44.5"N | 105°04'37.7"E | 2057 | 27.6 |
Table 2.
Characterization of drought using values of the standardised precipitation evapotransporation index (SPEI).
Table 2.
Characterization of drought using values of the standardised precipitation evapotransporation index (SPEI).
| SPEI | Drought Category |
|---|---|
| SPEI ≥ 2 | Extremely wet |
| 1.5 ≤ SPEI < 1 | Severely wet |
| 1 ≤ SPEI < 1.5 | Moderately wet |
| -1 ≤ SPEI < 1 | Near normal |
| -1.5 ≤ SPEI < -1 | Moderately dry |
| -2 ≤ SPEI < -1.5 | Severely dry |
| SPEI < -2 | Extremely dry |
Table 3.
Table of results of hyperparameter tuning.
| No. | Model name | Hyperparameter tuning |
|---|---|---|
| 1 | Gradient Boosting (GB) |
|
| 2 | eXtreme Gradient Boosting (XGBoost) |
|
Table 4.
Statistical table of evaluation results of models to predict the SPEI.
| Models | Input parameters | Output | Evaluation criteria | |||
|---|---|---|---|---|---|---|
| MAE | MSE | RMSE | R2 | |||
| Gradient Boosting | Rainfall, Avg_Tmax, Avg_Tmin, Avg_Hum, PET, SOI_Anomaly, SST_NINO4 | SPEI-1 | 0.34 | 0.19 | 0.44 | 0.90 |
| Rainfall, Avg_Tmin, Avg_Hum, SST_NINO4 | SPEI-3 | 0.38 | 0.26 | 0.51 | 0.83 | |
| Rainfall, Avg_Tmin, Avg_Hum, SST_NINO4 | SPEI-6 | 0.36 | 0.24 | 0.49 | 0.86 | |
| Rainfall, Avg_Tmin, Avg_Hum, SOI_Anomaly, SST_NINO4 | SPEI-12 | 0.36 | 0.23 | 0.48 | 0.87 | |
| XGBoost | Rainfall, Avg_Tmax, Avg_Tmin, Avg_Hum, PET, SOI_Anomaly, SST_NINO4 | SPEI-1 | 0.28 | 0.16 | 0.37 | 0.94 |
| Rainfall, Avg_Tmin, Avg_Hum, SST_NINO4 | SPEI-3 | 0.33 | 0.21 | 0.45 | 0.89 | |
| Rainfall, Avg_Tmin, Avg_Hum, SST_NINO4 | SPEI-6 | 0.32 | 0.19 | 0.41 | 0.90 | |
| Rainfall, Avg_Tmin, Avg_Hum, SOI_Anomaly, SST_NINO4 | SPEI-12 | 0.30 | 0.17 | 0.41 | 0.92 | |
Disclaimer/Publisher’s Note: The statements, opinions and data contained in all publications are solely those of the individual author(s) and contributor(s) and not of MDPI and/or the editor(s). MDPI and/or the editor(s) disclaim responsibility for any injury to people or property resulting from any ideas, methods, instructions or products referred to in the content. |
© 2024 by the authors. Licensee MDPI, Basel, Switzerland. This article is an open access article distributed under the terms and conditions of the Creative Commons Attribution (CC BY) license (http://creativecommons.org/licenses/by/4.0/).
Copyright: This open access article is published under a Creative Commons CC BY 4.0 license, which permit the free download, distribution, and reuse, provided that the author and preprint are cited in any reuse.


