Submitted:
21 May 2024
Posted:
23 May 2024
You are already at the latest version
Abstract
This study investigates the correlation between the California Bearing Ratio (CBR) and the Dynamic Cone Penetrometer (DCP) for subgrade soil analysis. The paper aims to provide practical equations for predicting CBR values from DCP test results, enhancing the efficiency of soil assessments in engineering practice. By analyzing test data and proposing correlations for different soil groups, the study introduces recalibrated correlations that demonstrate high accuracy in predicting CBR values. The newly proposed equations offer reliable predictions with R2 values of 0.89, 0.92, and 0.94 for clean sand, silty sand or sandy silt, and cohesive soil, respectively. These correlations serve as valuable tools for engineers, enabling rapid and accurate CBR estimations for improved decision-making in various engineering projects.
Keywords:
California Bearing Ratio
; CBR
; Dynamic Cone Penetrometer
; DCP
; Sand
; Subgrade
; Prediction
; Estimation
; Highway
; correlation
; construction
values of 0.89, 0.92, and 0.94 for clean sand, silty sand or sandy silt, and cohesive soil, respectively. These correlations serve as valuable tools for engineers, enabling rapid and accurate CBR estimations for improved decision-making in various engineering projects.
1. Introduction
The California Bearing Ratio (CBR) is one of the most important characteristics representing the undrained shear strength of subgrade material in pavement structure. To conduct the CBR test, samples must be transported from borrow pit, prepared, compacted and soaked in the laboratory, and then penetrated with CBR equipment. Consequently, the realistic CBR is difficult to obtain because it takes a long time and is not readily determined in the field. In addition, civil engineers often faced with the urgent need of the CBR of soil in a short amount of time, a survey of large amount of material resources for road construction is a good example. Therefore, in the literature, a number of correlations between CBR and other strength properties of soil such as density, unconfined compressive strength and DCP were established [1,2,3,4,5,6,7,8,9,10,11,12,13,14,15,16,17,18,19,20,21,22,23,24,25,26,27,28,29,30,31]. Among these techniques, one of the tests that can provide a highly reliable correlation with the CBR is the Dynamic Cone Penetration (DCP) test [3,4,13,14,17,18,19,20,21,22,23,24,25,32]. In addition, DCP equipment is considered compact and lightweight. Therefore, an efficient correlation between CBR and DCP is required.
The correlations between CBR and DCP for local materials proposed by many researchers are usually in the form of logarithmic equation as summarized in Table 1, and the trends of all graphs are depicted in Figure 1. According to equations in Table 1, a typical form of the DCP-CBR equation can be expressed as shown in Equation1, where α and β are the fitting parameters. Using the same form of equation, all graphs have the same tendency. It should be noted that when DCP reaches approximately 30 mm/blow, the CBR varies in a narrow range around approximately 6%. Furthermore, a wide possible range of CBR was found when DCP less than 30 mm/blow. For instance, when DCP is 10 mm/blow, the possible value of CBR can be approximately 13-32%. With this situation, it is very difficult for engineers to make decisions in selecting the proper CBR. In addition, inconsistency was found in the literature. Wilcesh et al. (2018) [19] reported a single equation that predicted well for various groups of soil i.e., SC, ML, MH, CL and CH for DCP ranging in 20-120 mm/blow. On the other hand, it was revealed from the test data (for soil type SM, SP, SP-SM, ML and CL) of Al-Refeai and Al-Suhaibani (1996) [17] that the correlations could predict well for some groups of soil but the data points for all groups of soil were scattered. However, the consistency was found from the test results of Feleke and Araya (2016) [18] and soil type CL from Al-Refeai and Al-Suhaibani (1996) [17]. It was evident that what was available was not enough. This had more to do with the existing test data to obtain reliable correlations for CBR predictions in general purposes.
In this paper, the existing test data for various soil types were investigated and the correlations were recalibrated. Four distinct sets of test results (three existing test results from [17,18,19] and one additional set from this study) were used in the analyses. The coefficient of determination () is used to evaluate the proposed correlations. Useful recommendations were also provided for the practical application with no additional testing.
2. Materials and Methods
To recalibrate the existing correlations between CBR and DCP, test results of soils from many regions and soil groups are required. As mentioned earlier, three existing test results from [17,18,19] were included in the analyses with one extra test results from five provinces of Northeast Thailand. Figure 2 shows the location map for material resources. The soil testing data from [17,18,19] is not repeated here. On the other hand, soil data which testing conducted in Thailand were shown in Table 2.
According to Table 2, most soil are classified as clayey sand (SC) and some of samples are silty-clayey sand (SC-SM) in the USCS system, while soils are classified as A-2 group in the AASHTO system for all samples.
The CBR and DCP testing are two significant tests in addition to the testing of basic properties. The standard for conducting the CBR and DCP were ASTM D1883-21 and ASTM D6951/D6951M-18, respectively. To conduct the CBR test, a standard area plunger is used to measure the pressure needed to pierce a sample of soil. The pressure needed to obtain an equal penetration on a typical crushed rock material is then divided by the observed pressure. The Dynamic Cone Penetrometer is made of 16mm steel rod attached with the 60-point angle cone at the end. With a 57.5cm drop height, an 8 kg hammer drives the DCP into the ground. The DCP's dimensions are shown in Figure 3. The penetration depth (D) in millimeters per single drop of the hammer is the definition of the DCP value.
3. Results and Discussions
In this section, the results of both DCP and CBR testing from 21 soil samples in Northeast Thailand were firstly presented, and the analyses for the correlation are secondly described.
3.1. Test results for strength parameters of subgrade soils
Prior to the test of CBR, the compaction test had to be performed to obtain the optimum moisture content (OMC) and the maximum dry density (MDD) which required in the CBR testing procedure. Therefore, not only the results of DCP and CBR, but also the MDD are presented in this section. It is worth noting that the MDD is one of the most effective factors that can provide a reliable correlation to the CBR. However, the process of MDD testing has a drawback in that it is time-consuming when compared to the test of DCP.
Table 3 summarizes the test results of the twenty-one soil samples in Northeast Thailand. The relationship between the DCP and CBR was demonstrated in Figure 4. It is indicated from Table 3 that the DCP values range from 7-40 mm/blow, and it is observed that the tendency of the DCP-CBR is similar to those of DCP-CBR presented in Figue1. Using Equation1, the best fit parameters α and β for soil in Northeast Thailand were evaluated as shown in Equation2 with of 0.94. Notably, although Equation2 can predict well in Northeast Thailand, there is nothing guarantee that the equation for local material is applicable for materials in other regions. Therefore, the recalibration process is required and is described in the next section.
3.2. Recalibration of the correlations
The recalibration process starts by investigating all test results of DCP-CBR from all types of soil. The data points extracted from [17,18,19] including from this study are depicted in Figure 5 with the upper bound and lower bound lines. It is evident that data points can be divided into two ranges of DCP value: 1) DCP less than 30 mm/blow, and 2) DCP greater than 30 mm/blow. For DCP less than 30 mm/blow, CBR was decreased with DCP and the data points were scattered in a wide range. Within this range, it is impossible to determine a unique correlation. This confirmed that test results from local material could not be used in the CBR prediction without any special conditions. For DCP greater than 30 mm/blow, the CBR varied in a narrow range for all types of soil. Therefore, a unique correlation can be established. This agreed with the finding of Wilcesh et al. [19] who suggested a single equation for describing the DCP-CBR relationship in this range of DCP. In addition, despite having equation of Wilcesh et al. [19], a constant value of CBR of 6% is enough for the estimation for DCP greater than 30 mm/blow. Moreover, when trying to evaluate the existing correlations presented in Table 1 by four sets of test data, the finding showed that equation proposed by Wilcesh et al. [19
] provided highest in three cases (i.e., Feleke & Araya (2016), Wilches et al. (2018) and soil test in this paper), but gave low for data from Al-Refeai & Al-Suhaibani (1996). Table 4 summarizes the described above. The number in rectangular represented the considered low value of .
The special conditions are addressed here for the recalibration. It should be kept in mind that no extra testing should be required, and the identifying procedure of soil sample during DCP testing by visual inspection should be enough in case of soil type involved. The special conditions added in the analyses are as follow:
The proposed correlations should be in the form of Equation1 and provide less changes or a constant value of CBR when DCP is greater than 30 mm/blow.
The correlation should be separated for the cohesionless and cohesive soil.
For cohesionless soil which the data points were much scattered, the subgroup such as clean sand or sand mixed with non-plastic silt (both silty sand and sandy silt) could be an important condition.
With these conditions, the proposed correlations can be derived in three subgroups as shown in Equations 3-5 and Figure 6.
Log(CBR) = 3.47-1.68log(DCP) (for soil SP, SP-SM)
Log(CBR) = 2.53-1.13log(DCP) (for soil SM, ML, MH)
Log(CBR) = 2.32-1.03log(DCP) (for soil SC, SC-SM)
In Figure 6, data points representing soil groups SP, SP-SM, SM, ML, MH, SC, and SC-SM were plotted against the proposed correlations. These correlations were established based on the conditions mentioned earlier, yielding values of 0.89, 0.92, and 0.94 for clean sand, silty sand or sandy silt, and cohesive soil, respectively. With an of approximately 0.9, these correlations provided sufficient accuracy for rapid prediction. It was emphasized that visually inspecting the soil before applying the correlations was crucial. Engineers could distinguish between clean sand and sand mixed with silt by observing the particle sizes. If the soil appeared predominantly sandy with visible particles, it was likely clean sand. However, if there were clearly visible portions of finer soil mixed in, it indicated a mixture of sand and silt. Additionally, if the soil exhibited cohesive properties or could be molded into threads when mixed with water, akin to the plastic limit test ;(PL), it was classified as cohesive soil. Hence, visual inspection could be effectively combined with the new correlation method.
4. Conclusions
The study presented in the paper focuses on predicting the CBR from the DCP for subgrade soil. By analyzing test data and proposing correlations between CBR and DCP for different soil groups, the researchers aimed to provide simple and practical equations for accurately predicting CBR values in general engineering practice. The findings of the study highlight the importance of recalibrating existing correlations to ensure applicability across different regions and emphasize the significance of visually inspecting soil characteristics before applying the proposed correlations. The newly proposed correlations demonstrated high accuracy with values of 0.89, 0.92, and 0.94 for clean sand, silty sand or sandy silt, and cohesive soil, respectively. These correlations offer a valuable tool for engineers to rapidly predict CBR values, ultimately enhancing the efficiency and reliability of subgrade soil assessments in various engineering projects.
Funding
Please add: This research was funded by Mahasarakham University, grant number 6717022/2567.
Data Availability Statement
The data presented in this study are available on request.
Acknowledgments
This research was supported by Mahasarakham University. The support is gratefully acknowledged.
Conflicts of Interest
The authors confirm that there are no conflict of interest with respect to the publication of this paper.
References
- Lines, S.; Williams, D.J.; Galindo-Torres, S.A.; Danyaya, H.A. Determination of Thermal Conductivity of Soil Using Standard Cone Penetration Test. 2nd International Conference on Advances on Clean Energy Research., Berlin, Germany,7-9 April 2017. [CrossRef]
- Mukesh, A.P.; Patel, H.S.; Gautam Dadhich, E.F. Prediction of Subgrade Strength Parameters from Dynamic Cone Penetrometer Index, Modified Liquid Limit and Moisture Content. 2nd Conference of Transportation Research Group of India, Agra, India,12-15 December 2013.
- Mukesh, A.P.; Patel, H.S. Experimental Study to Correlate the Test Results of PBT, UCS, and CBR with DCP on Various soils in soaked condition .IJE 2012, 6, 244-261.
- Mukesh, A.P.; Patel, H.S. Laboratory Assessment to Correlate Strength Parameter from Physical properties of Subgrade. Non-Circuit Branches of the 3rd Nirma University International Conference on Engineering, Ahmedabad, India, 6-8 December 2012.
- Bayamack, J.F.N.; Onana, V.L.; Ndzié Mvindi, A.T.; Ze, A.N.; Ohandja, H.N.; Eko, R.M. Assessment of the determination of Californian Bearing Ratio of laterites with contrasted geotechnical properties from simple physical parameters. Transportation Geotechnics 2012, 19, 84-95. [CrossRef]
- Kumar, S.; Singh, D. Prediction of UCS and CBR behavior of fiber-reinforced municipal solid waste incinerator bottom ash composites using experimental and machine learning methods. Construction and Building Materials 2023, 367,. [CrossRef]
- Othman, K.; Abdelwahab, H. The application of deep neural networks for the prediction of California Bearing Ratio of road subgrade soil. Ain Shams Engineering Journal 2023, 14,. [CrossRef]
- Othman, K.; Abdelwahab, H. Influence of clay mineralogy on the relationship of CBR of fine-grained soils with their index and engineering properties. Transportation Geotechnics 2018, 15, 29-38.
- Rehman, Z.U.; Khalid, U.; Farooq, K.; Mujtaba, H. Prediction of CBR Value from Index Properties of different Soils. UET 2017, 22, 17-26.
- Yildirim, B.; Gunaydin, O. Estimation of California bearing ratio by using soft computing systems. Expert Systems with Applications 2011, 30, 6381–6391. [CrossRef]
- Shirur, N. B.; Hiremath, S. G. Establishing Relationship between CBR Value and Physical Properties of Soil. IOSR-JMCE 2014, 11, 26-30. [CrossRef]
- Priya, G.; Arya, K.S.; Manjummekudiyil, E.M.; Unni, A.; Menon, V.S. Prediction of CBR Value from Index Properties of Soil. IRJET 2019, 6, 4029-4033.
- Perić, D.; Goh, G.; Saeidaskari, J.; Rashk Olia, A.S.; Ayar, P. Development of Prediction Models for Performance of Flexible Pavements in Kansas with Emphasis on the Effects of Subgrade and Unbound Layers. Sustainability 2022, 14, 9020. [CrossRef]
- Baghbani, A.; Nguyen, M.D.; Alnedawi, A.; Milne, N.; Baumgartl, T.; Abuel-Naga, H. Improving Soil Stability with Alum Sludge: An AI-Enabled Approach for Accurate Prediction of California Bearing Ratio. Appl. Sci 2023, 13, 4934. [CrossRef]
- Bandara, N.; Hettiarachchi, H.; Jensen, E.; Binoy, T.H.; Perera, R. Using Kiln Dust to Improve Weak Subgrades for Pavement Construction: A Field Verification in Michigan, USA. Geotechnics 2023, 3, 179-192. [CrossRef]
- Dafalla, M.; Shaker, A.; Al-Shamrani, M. Use of the Dynamic Cone Penetrometer in Compacted Clay–Sand Layers. Appl. Sci. 2022, 12, 11547. [CrossRef]
- AI-Refeai, T.; Al-Suhaibani, A. Prediction of CBR Using Dynamic Cone Penetrometer.Journal of King Saud University - Engineering Sciences, 1997, 9(2), 191-203.
- Feleke, G.G.; Araya, A.A. Prediction of CBR using DCP for Local Subgrade Materials. The 1st International Conference on Transportation and Road Research, Mombasa, Kenya,15-17 March 2016.
- Wilches, F. J.; Feria-Díaz, J. J.; Hernandez Ávila, J.R. Correlation between California Bearing Ratio (CBR) and Dynamic Cone Penetrometer (DCP) for soil from Sincelejo city in Colombia. International Journal of Applied Engineering Research ISSN 0973-4562.2018, 13, 2068-2071.
- Harison, J.A. Correlation Between California Bearing Ratio and Dynamic Cone Penetrometer Strength Measurement of Soils. Proc. Institution of Civil Engineering 1987, 83, 833-844. [CrossRef]
- Livneh, M. Validation of Correlations Between a Number of Penetration Test and in Situ California Bearing Ratio Tests. Transportation Research Record 1989, 1219, 56-67.
- Lee, J.S.; Kim, S.Y.; Hong, W.T.; Byun, Y.H. Assessing Subgrade Strength Using an Instrumented Dynamic Cone Penetrometer. Soils and Foundations 2019, 59, 930–941. [CrossRef]
- Amadi, A.A.; Sadiku, S.; Abdullahi, M.; Danyaya, H.A. Case study of construction quality control monitoring and strength evaluation of a lateritic pavement using the dynamic cone penetrometer. International Journal of Pavement Research and Technology 2018, 11, 530–539. [CrossRef]
- Salgado, R.; Yoon, S.; Hernandez Ávila, J.R. Dynamic Cone Penetration Test (DCPT) for Subgrade Assessment .INDOT Research 2003.
- Kaewhanam, N.; Juntasan, P.; Narong, S. Evaluation of Highway Subgrade Compaction by Dynamic Cone Penetrometer. The Fifth International Conference on Science, Technology and Innovation for Sustainable Well-Being, Luang Prabang, Lao PDR, 4-6 September 2013.
- Lakshmi, S.M.; Gani, M.A.; Kamalesh, V.; Mahalakshmi, V.; Padmesh, P.M. Correlating unsoaked CBR with UCC strength for SC and SP soil. Materials Today: Proceedings 2021, 43, 1293-1303. [CrossRef]
- Nagaraj, H.B.; Suresh, M.R. Influence of clay mineralogy on the relationship of CBR of fine-grained soils with their index and engineering properties. Transportation Geotechnics 2018, 15, 29-38. [CrossRef]
- Livneh, M. In-situ CBR testing by indirect methods. 12th International Conference on Soil Mechanics and Foundation Engineering, Rio De Janeiro, Brazil, 13-18 August 1989.
- Livneh, M.; Ishai, I. Prediction of CBR Values Under Covered Areas. 2nd Australia - New Zealand Conference on Geomechanics, Brisbane, Australia, 21-25 July 1975.
- Marawan, M.; Shahien.; Farouk, A. Estimation of deformation modulus of gravelly soils using dynamic cone penetration tests. Ain Shams Engineering Journal 2013, 4, 633-640.
- Benz-Navarrete, M.A.; Breul, P.; Gourvès, R. Application of wave equation theory to improve dynamic cone penetration test for shallow soil characterisation. Journal of Rock Mechanics and Geotechnical Engineering 2022, 14, 289-302. [CrossRef]
- George, V.; S. Sadiku, C.D.; Rao, N.C.; Shivashankar, R. PFWD, DCP and CBR correlations for evaluation of lateritic subgrades. International Journal of Pavement Engineering 2009, 10, 189-199.
Figure 1.
Graphs of the existing correlation between CBR) and DCP.
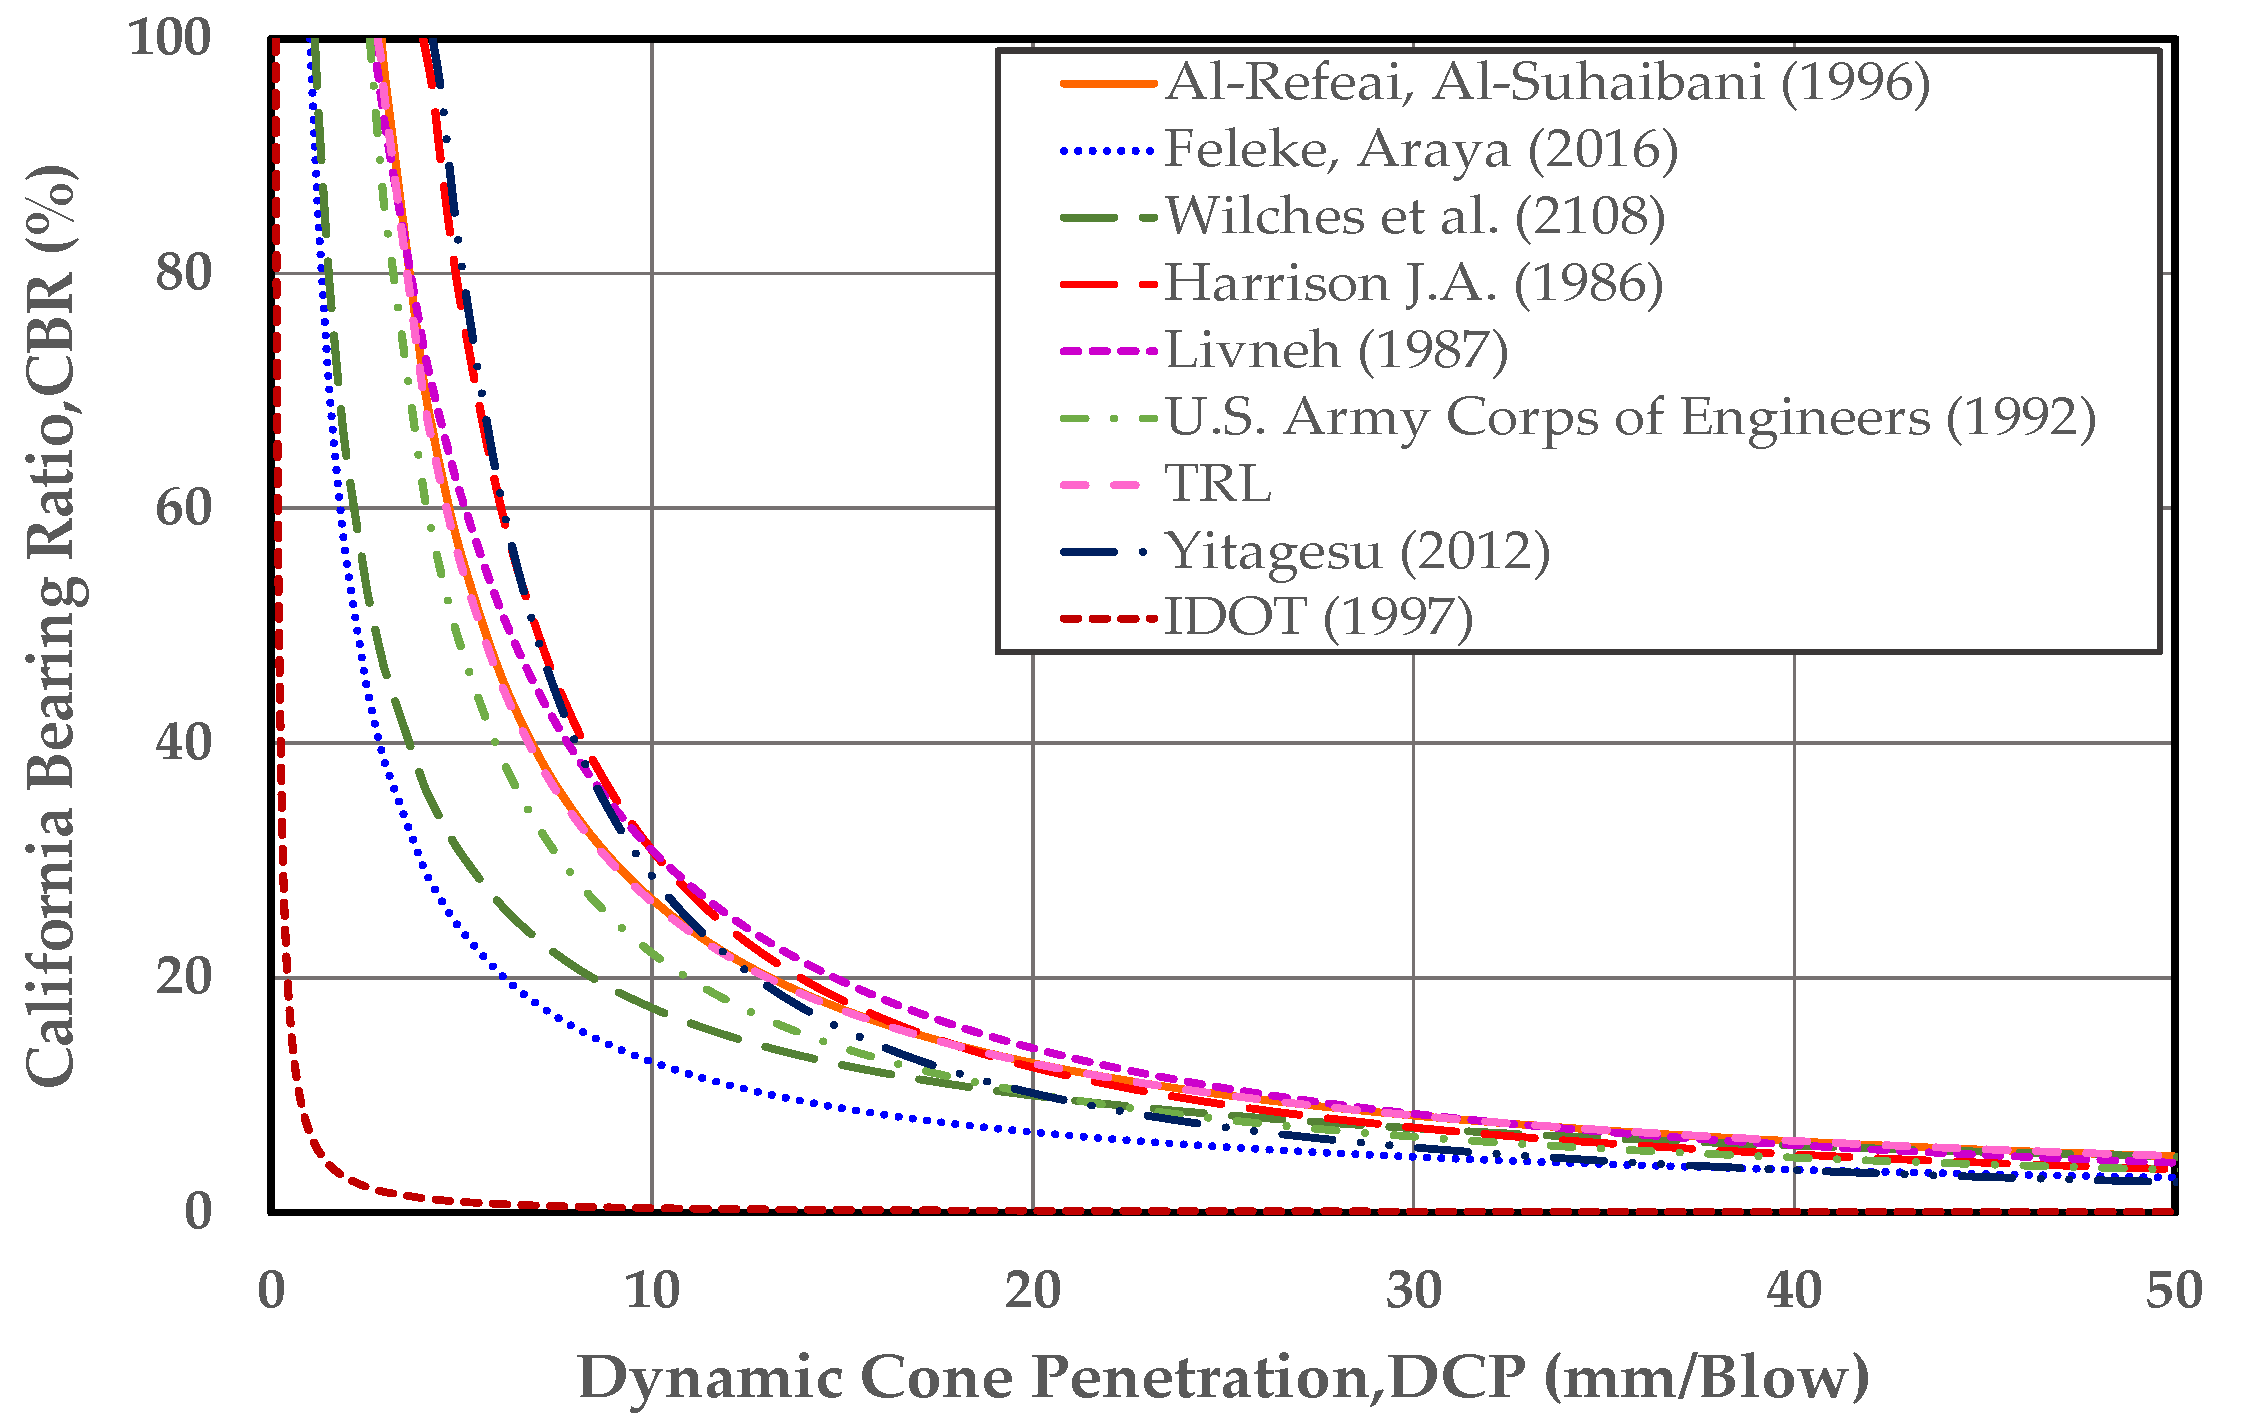
Figure 2.
Location map for local material from five provinces of Northeast Thailand (Chaiyaphom, Khon Kaen, Maha Sarakham, Kalasin and Roi Et).
Figure 2.
Location map for local material from five provinces of Northeast Thailand (Chaiyaphom, Khon Kaen, Maha Sarakham, Kalasin and Roi Et).
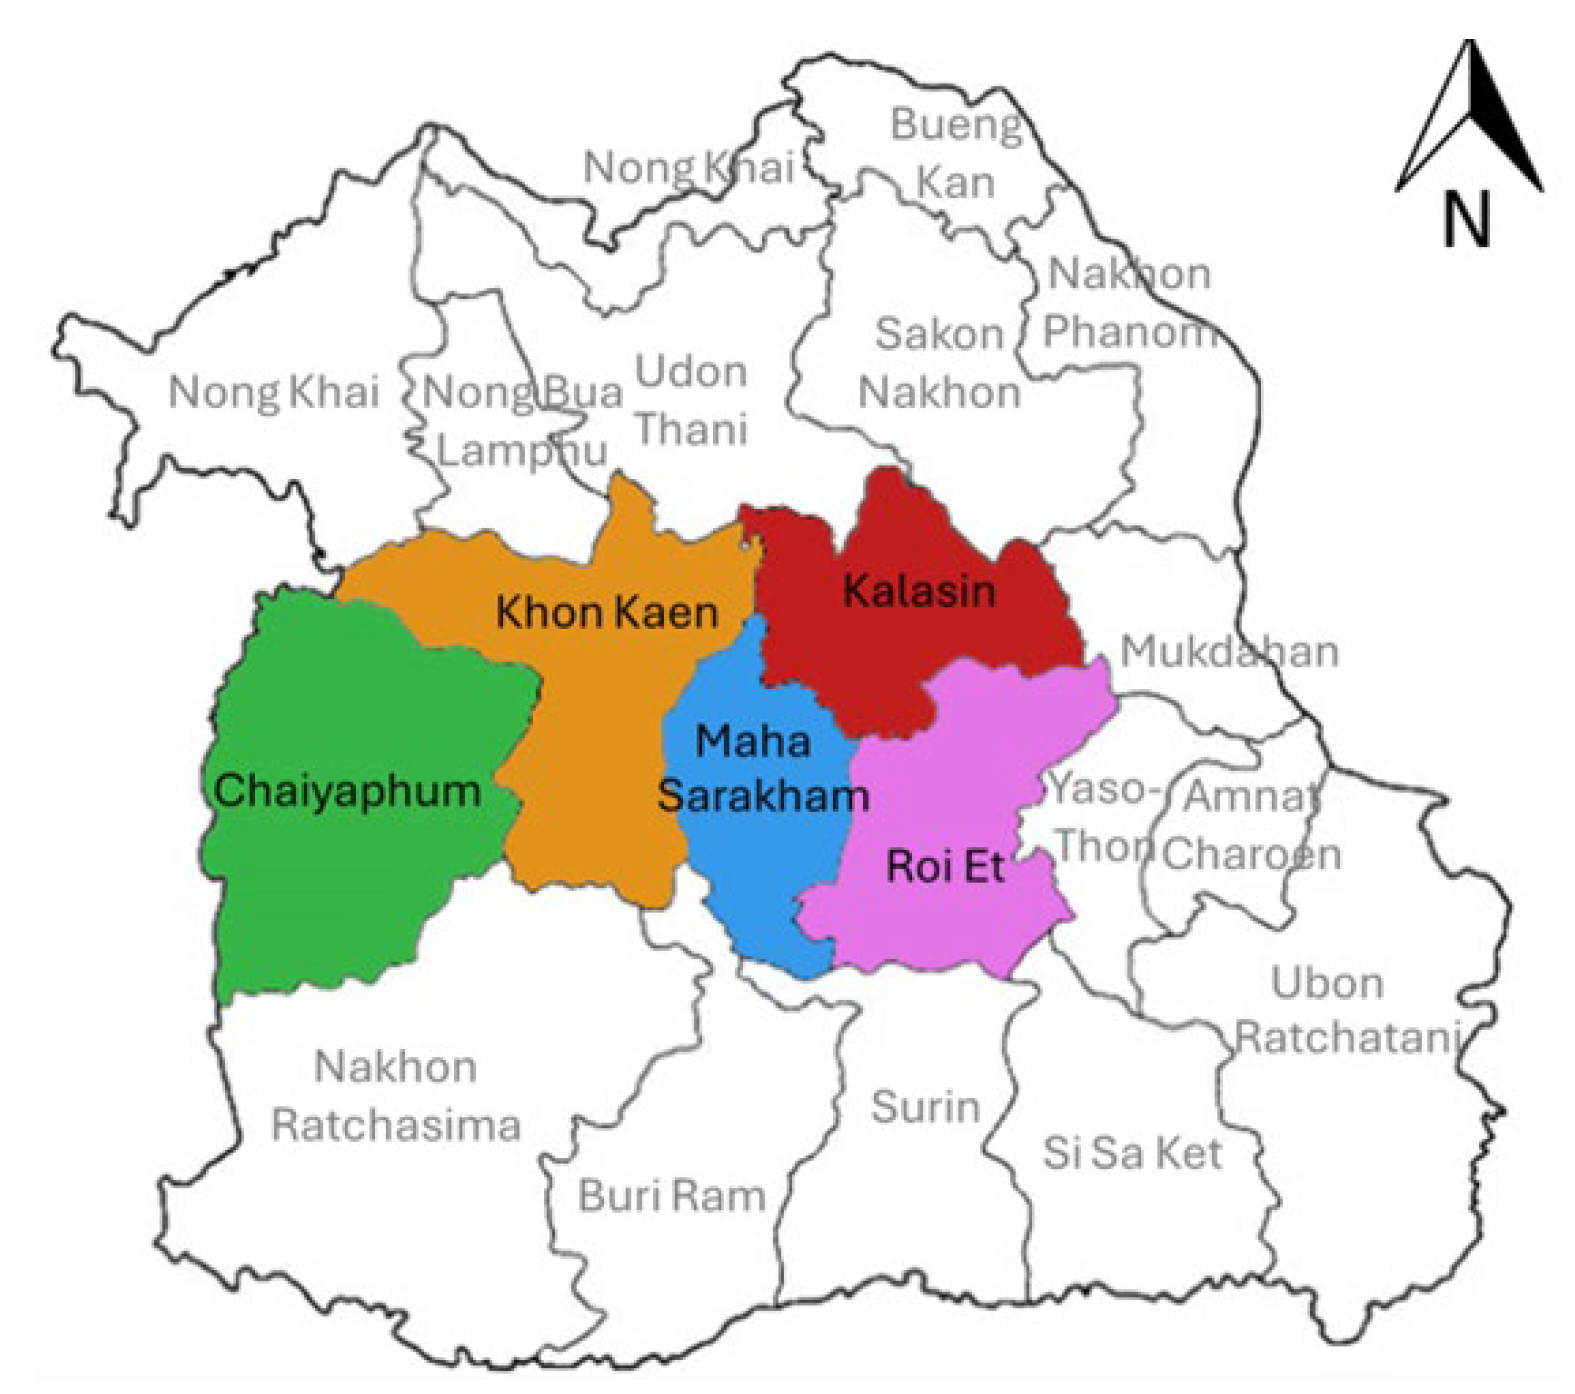
Figure 3.
The Dynamic Cone Penetrometer (DCP).
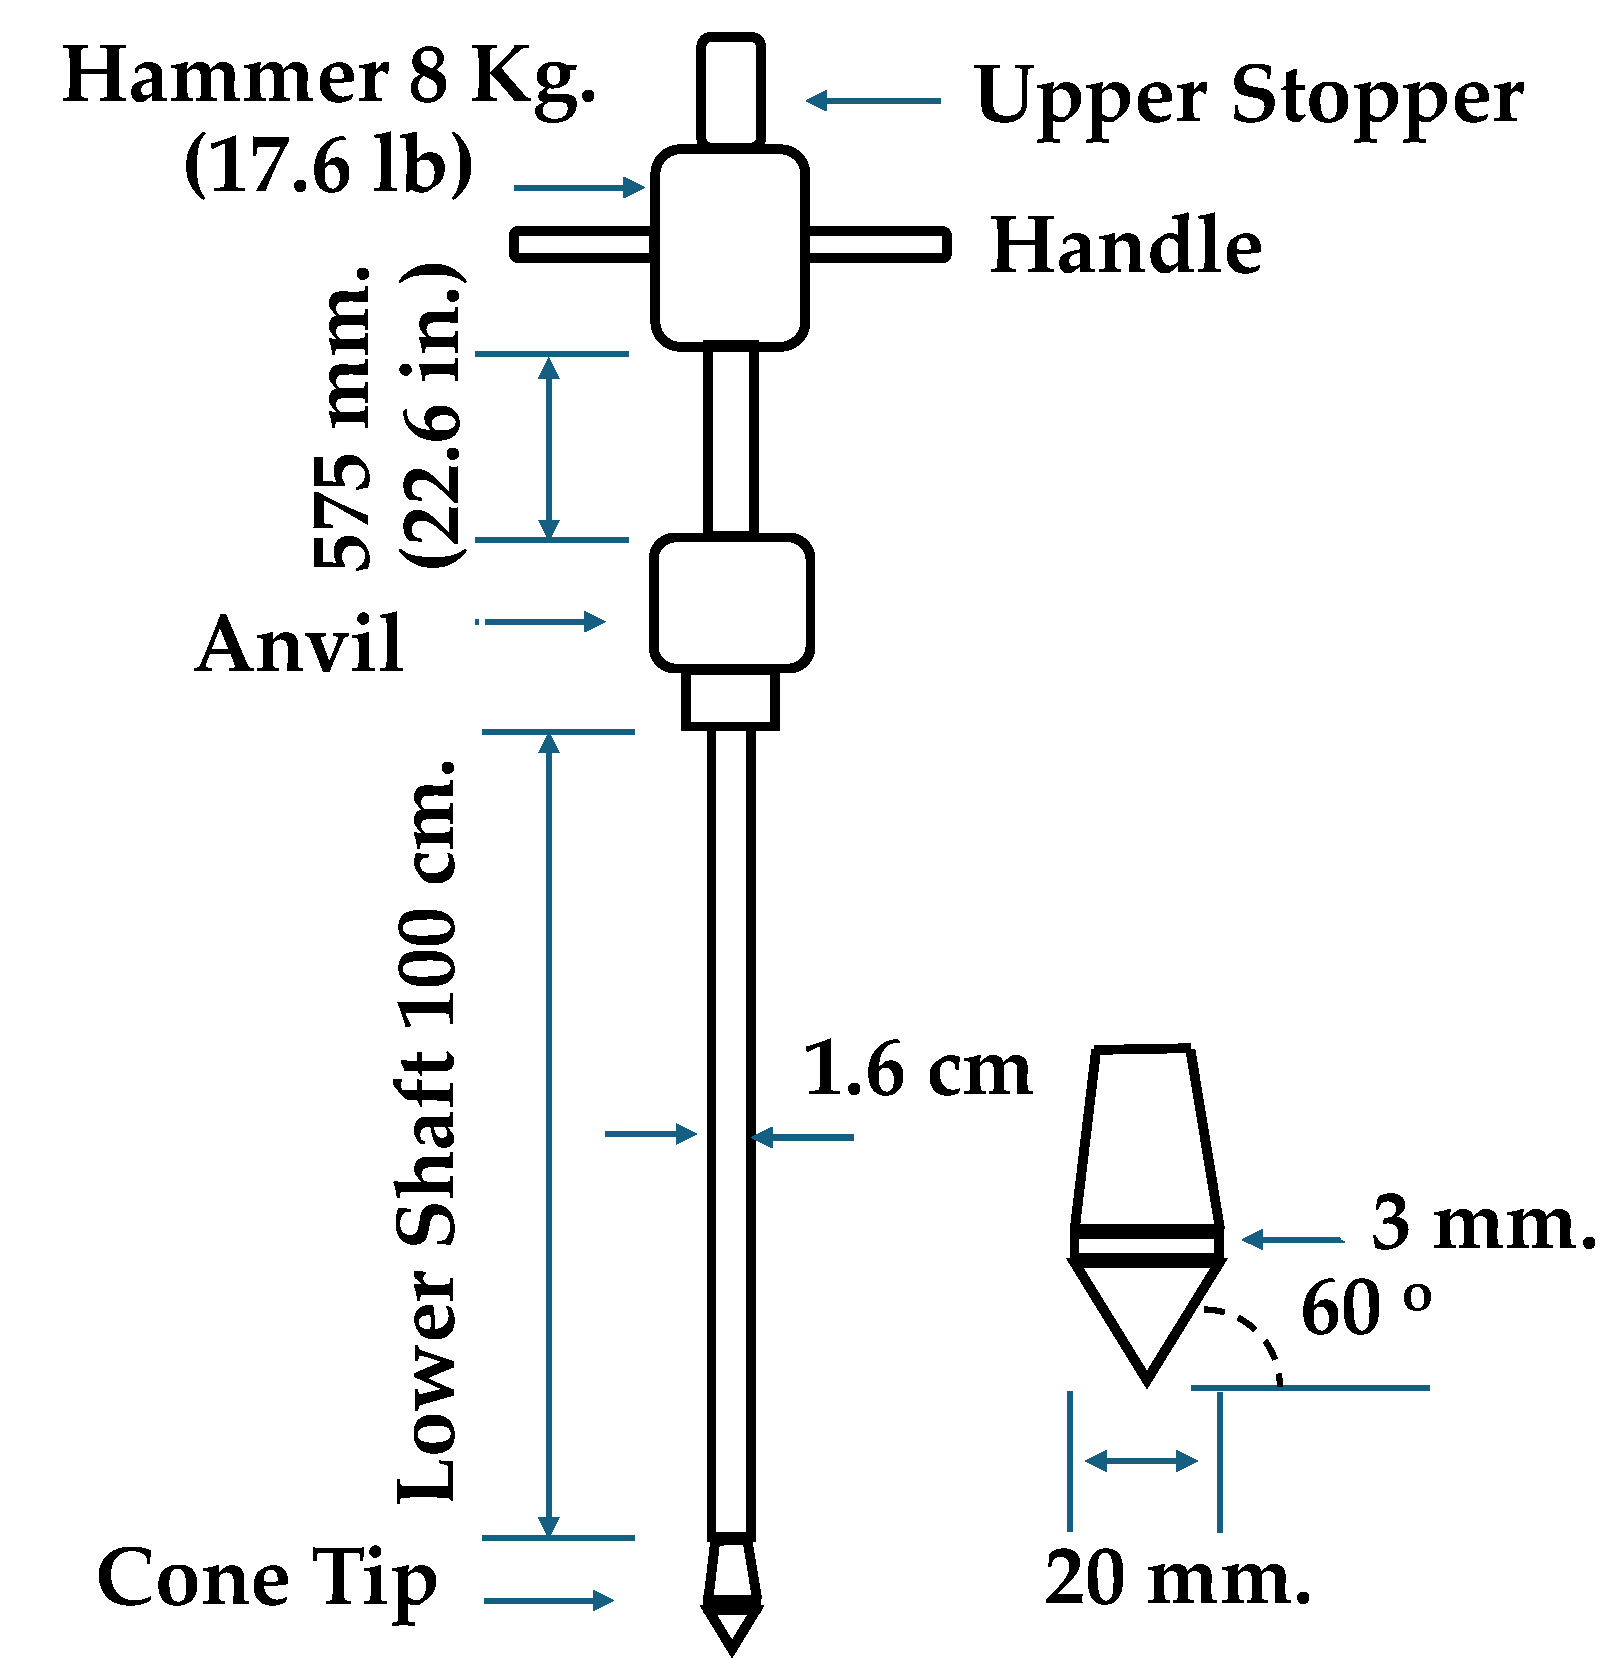
Figure 4.
Relationship between the DCP and CBR of soil samples in Northeast Thailand.
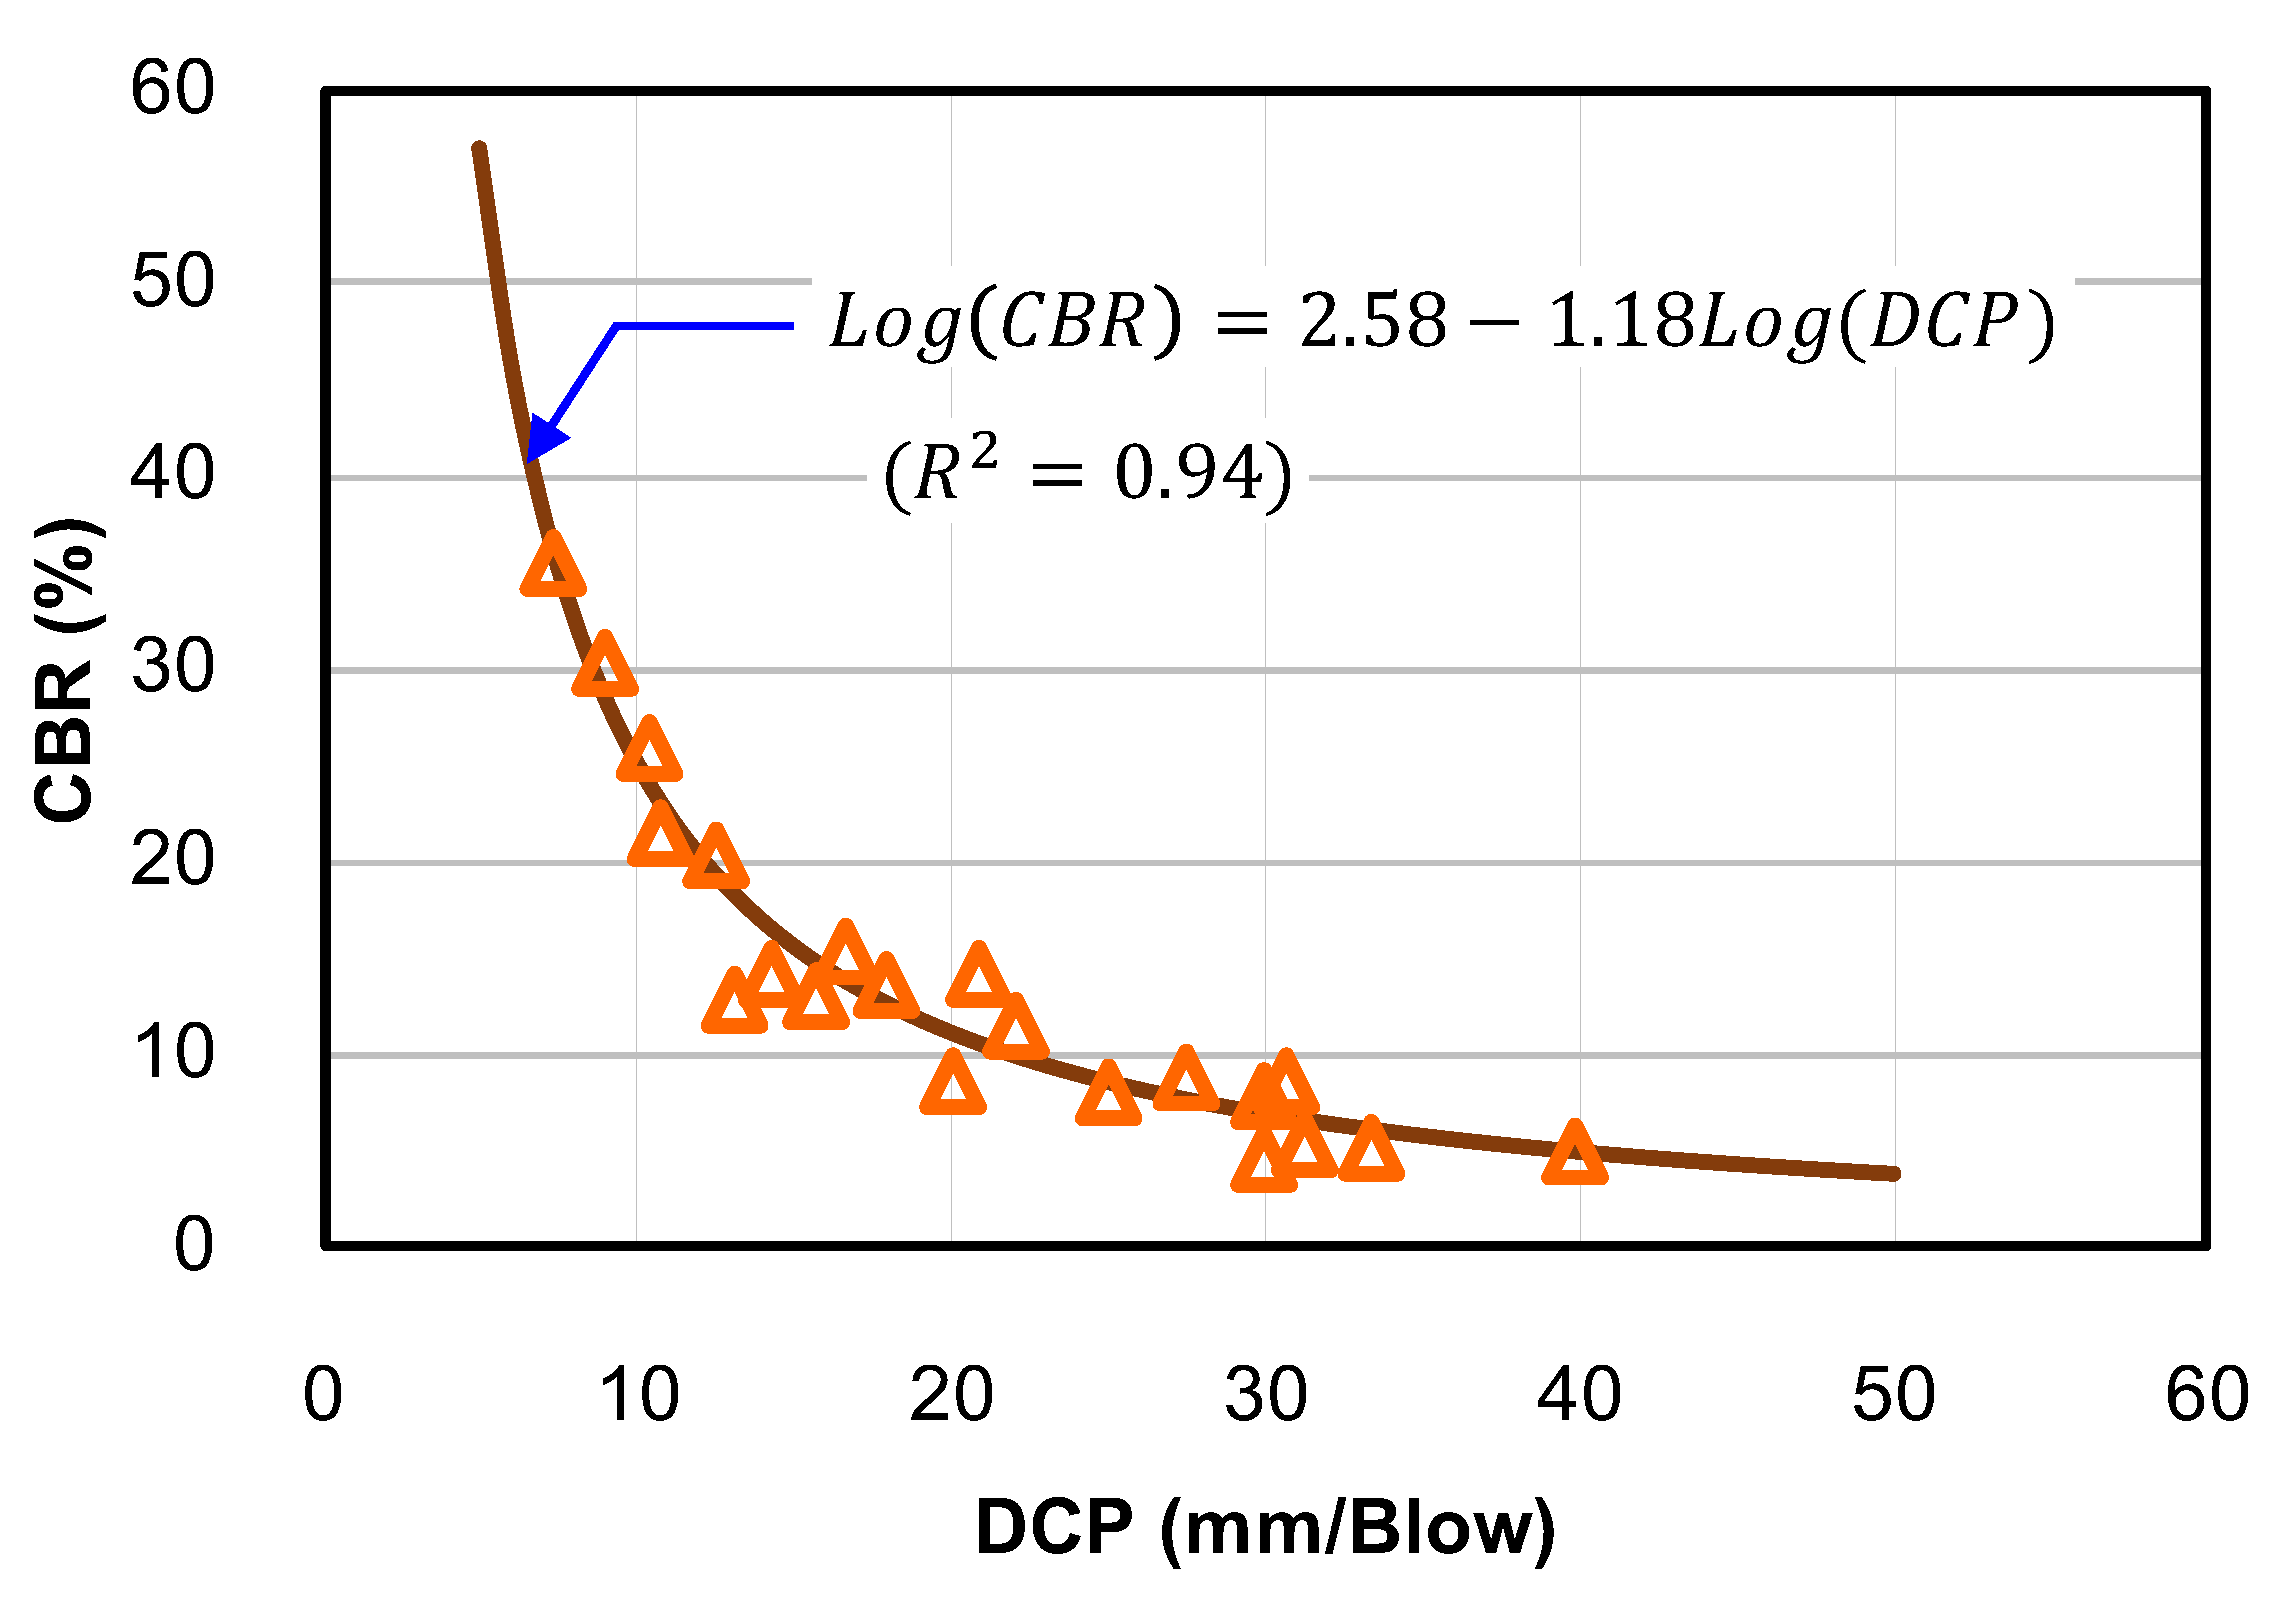
Figure 5.
Relationship between the DCP and CBR of soil samples in Northeast Thailand.
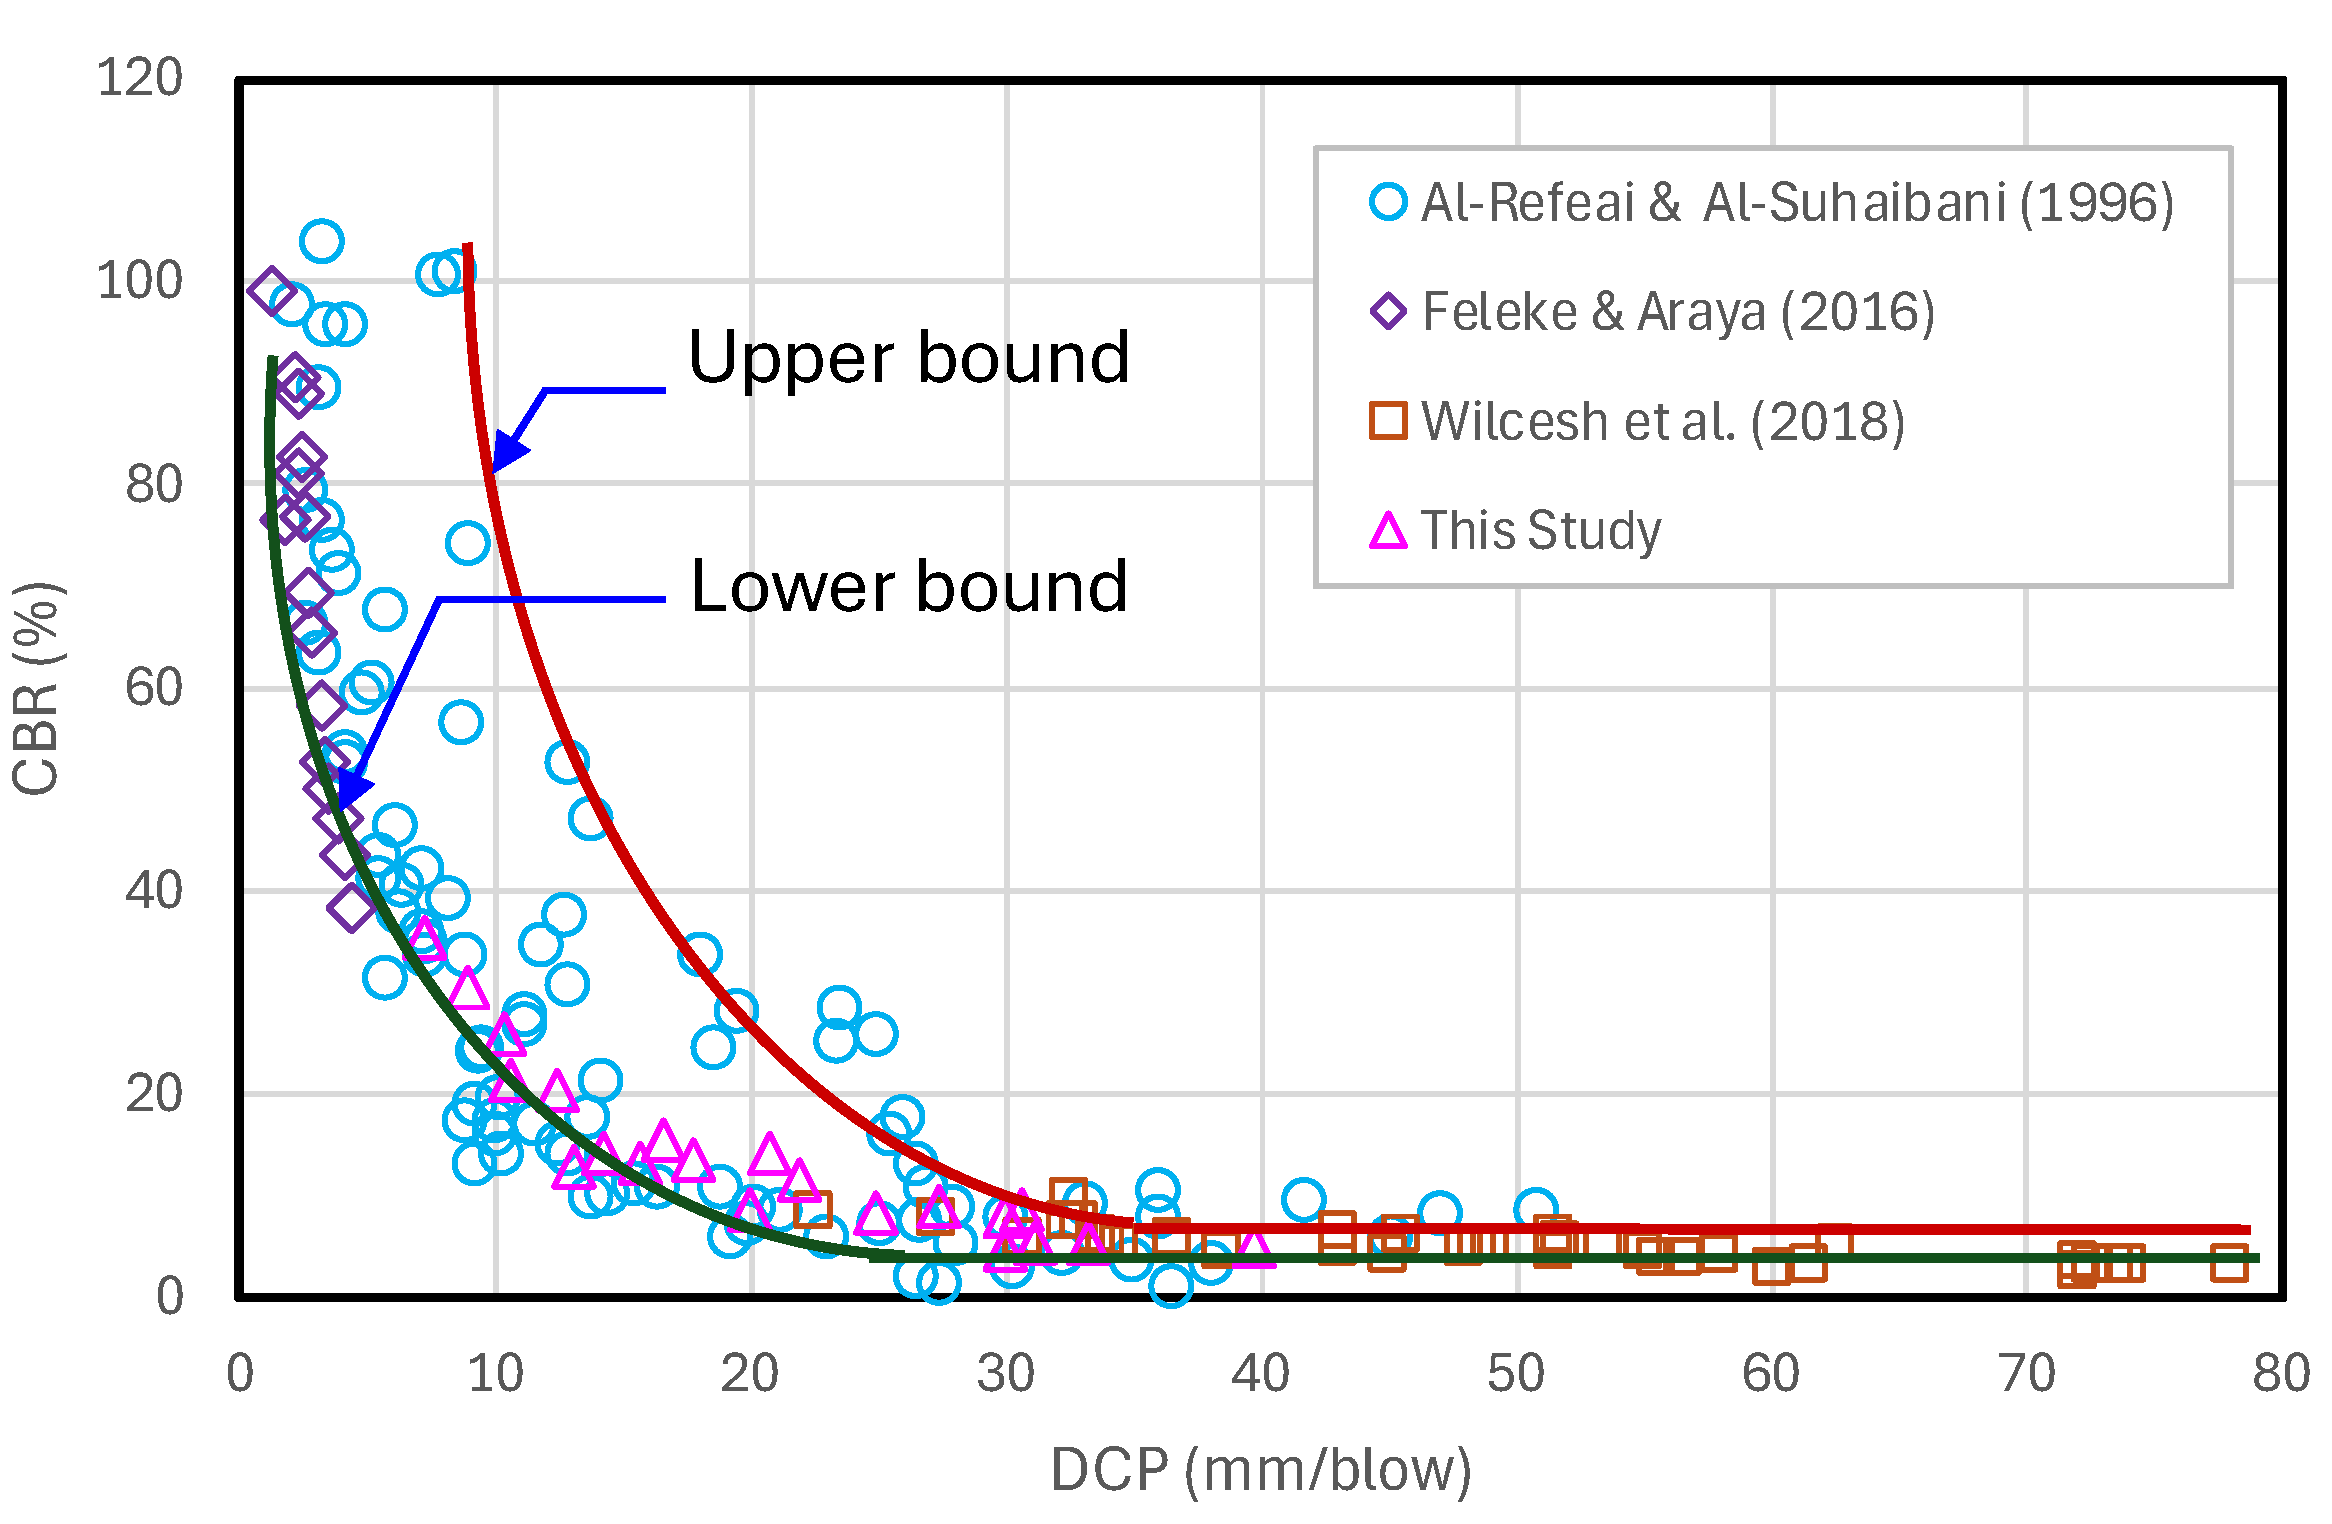
Figure 6.
Graphs of new correlations proposed in this paper.
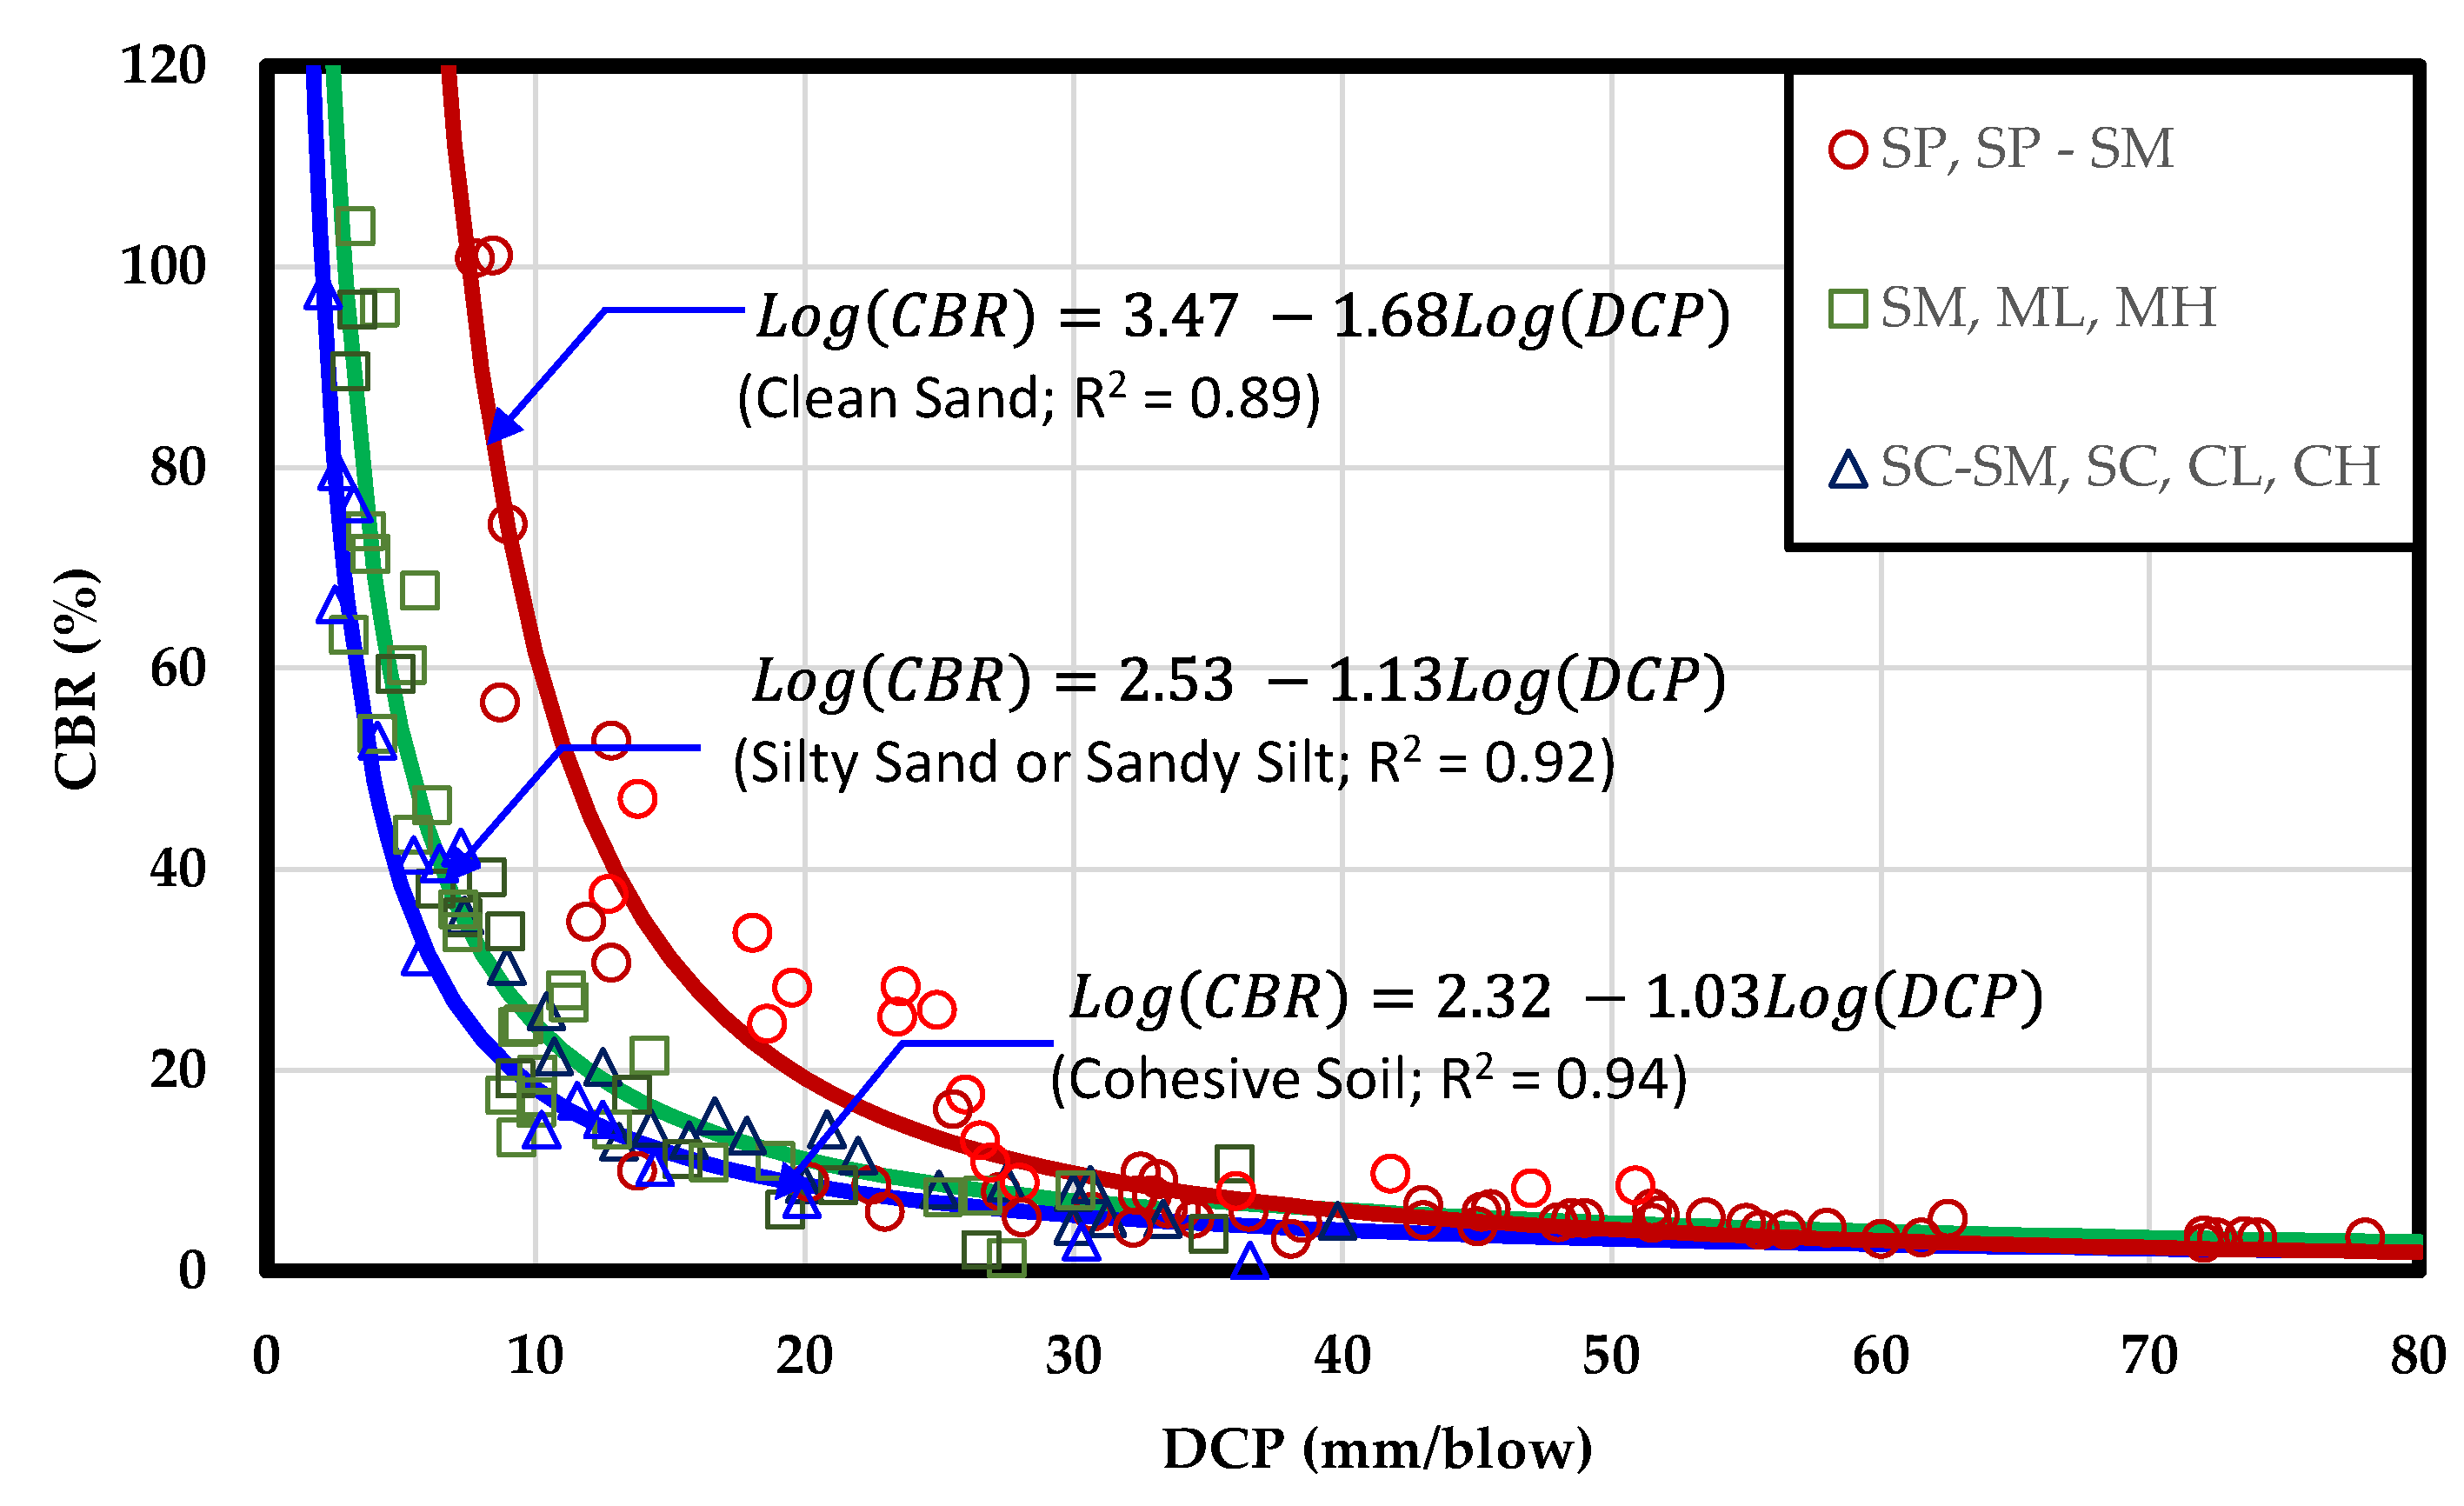

Table 1.
Existing correlation between CBR and DCP.
|
Equation No. |
Correlation CBR (%), DCP (mm/blow) |
Researchers | |
| 1 | Al-Refeai, Al-Suhaibani (1996) | ||
| 2 | Feleke & Araya (2016) | ||
| 3 | Wilcesh et al. (2018) | ||
| 4 | Harrison (1986) | ||
| 5 | Livneh (1987) | ||
| 6 | U.S. Army Corps of Engineers (1992) | ||
| 7 | TRL | ||
| 8 | Yitagesu (2012) | ||
| 9 | IDOT (1997) |
1 TRL denotes Transport Research Laboratory, Huntingdon, UK. 2 IDOT denotes Illinois Department of Transportation, US.
Table 2.
Basic soil test properties of soil in Northeast Thailand.
| Sample No. |
LL(%) | PI(%) | Gs | Soil Classification AASTHO USCS |
|
|---|---|---|---|---|---|
| 1 2 3 4 5 6 7 8 9 10 11 12 13 14 15 16 17 18 19 20 21 |
18.27 24.50 15.99 17.43 19.27 20.12 19.50 18.02 21.89 15.78 20.56 27.56 19.95 23.21 18.27 20.32 19.81 17.23 16.72 17.25 18.33 |
5.54 13.21 4.51 9.04 9.75 11.15 15.48 9.57 16.44 10.84 8.86 20.04 8.22 14.61 6.08 14.69 14.92 10.98 5.56 6.12 11.23 |
2.69 2.67 2.65 2.65 2.67 2.65 2.66 2.68 2.63 2.67 2.67 2.66 2.64 2.63 2.62 2.65 2.66 2.68 2.63 2.62 2.64 |
A-2-4 A-2-6 A-2-4 A-2-4 A-2-4 A-2-6 A-2-6 A-2-4 A-2-6 A-2-6 A-2-4 A-2-6 A-2-4 A-2-6 A-2-4 A-2-4 A-2-4 A-2-6 A-2-4 A-2-4 A-2-4 |
SC-SM SC SC-SM SC SC SC SC SC SC SC SC SC SC SC SC-SM SC SC SC SC-SM SC-SM SC |
Table 3.
Test results of 21 soil samples in Northeast Thailand.
| Sample No. |
Soil Classification | MDD (g/cm3) |
DCP (mm/Blow) |
CBR (%) |
|---|---|---|---|---|
| 1 2 3 4 5 6 7 8 9 10 11 12 13 14 15 16 17 18 19 20 21 |
SC-SM SC SC-SM SC SC SC SC SC SC SC SC SC SC SC SC-SM SC SC SCSC-SM SC-SM SC |
1.84 1.79 1.71 1.75 1.74 1.79 1,89 1.64 1.76 1.73 1.78 1.86 1.94 1.86 1.85 1.76 1.93 1.70 1.95 1.94 1.69 |
20.83 13.10 31.25 20.00 25.00 30.00 16.67 30.00 10.70 27.50 22.00 15.71 12.50 17.86 11.09 30.64 10.42 33.33 8.93 7.35 39.82 |
14.18 12.92 5.32 8.66 8.13 7.88 15.44 4.54 21.42 8.82 11.50 13.02 20.37 13.55 14.28 8.65 25.87 5.25 30.36 35.46 5.04 |
Table 4.
Coefficient of determination () of the Equations in Table 1 for various soil data set.
Table 4.
Coefficient of determination () of the Equations in Table 1 for various soil data set.
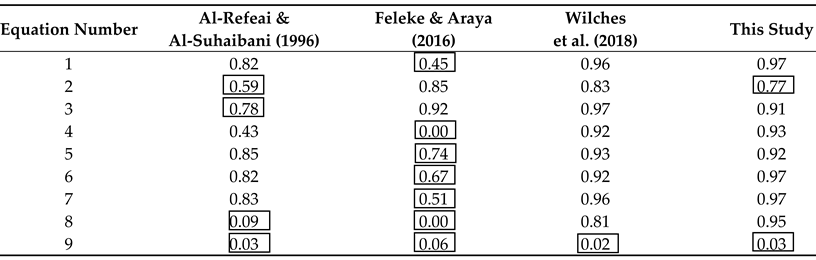 |
1 TRL denotes Transport Research Laboratory, Huntingdon, UK. 2 IDOT denotes Illinois Department of Transportation, US.
Disclaimer/Publisher’s Note: The statements, opinions and data contained in all publications are solely those of the individual author(s) and contributor(s) and not of MDPI and/or the editor(s). MDPI and/or the editor(s) disclaim responsibility for any injury to people or property resulting from any ideas, methods, instructions or products referred to in the content. |
© 2024 by the authors. Licensee MDPI, Basel, Switzerland. This article is an open access article distributed under the terms and conditions of the Creative Commons Attribution (CC BY) license (http://creativecommons.org/licenses/by/4.0/).
Copyright: This open access article is published under a Creative Commons CC BY 4.0 license, which permit the free download, distribution, and reuse, provided that the author and preprint are cited in any reuse.


