
Submitted:
22 May 2024
Posted:
23 May 2024
You are already at the latest version
Abstract
This study aims to provide empirical evidence on whether using renewable and non-renewable energy, CO₂ emissions and the resulting changes in temperature and precipitation can alter cereal yields in European Union countries. To this end, a panel data set covering 1992-2021 has been used to analyse the impact of climate change and economic factors on cereal production in European Union countries. The study employed various analytical techniques to understand better the relationship between climate change, energy consumption, and economic growth. These included using annual average temperature and rainfall to measure climate change and energy consumption and economic growth to analyse the economic aspects. To achieve the objective, feasible generalised least squares (FGLS) models with robust standard errors and bootstrap and a quantile regression (QR) model with marginal analysis were employed. The Westerlund cointegration test confirmed the presence of cointegration between cereal production and climate variables, economic growth, and energy consumption. The results indicate that increases in temperature and precipitation may contribute to increased cereal production in European Union countries. In contrast, energy consumption, including renewable energy and CO₂ emissions, may have a nonlinear effect on cereal production. Quantile regression analysis suggests climate change may impact crop yields most in countries with low and moderate cereal production per hectare. Increased CO₂ emissions may increase yields in the initial period, but excessive CO₂ may negatively impact cereal production in the long term. It would be advisable for countries with low and moderate crop productivity to consider implementing technological advances and combating global warming by modernising cultivation methods and making greater use of renewable energy sources.
Keywords:
cereal production
; climate change
; European Union
; FGLS
; CO2
; energy
; food security
; panel data
1. Introduction
In the third decade of the 21st century, the problem of global food security remains unresolved (it is estimated that 828 million people worldwide will suffer from hunger and malnutrition in 2021). Recently, the COVID-19 pandemic, the war in Ukraine, other armed conflicts, and the consequences of global warming have made it even more critical to address this issue. As the State of Food Security and Nutrition in the World 2023 report indicates, there has been an increase in the number of people experiencing hunger since 2019 [1].
Suppose this trend continues in the coming years. In that case, it will be impossible to achieve sustainable development by 2030, including eradicating hunger (SDG2 target) and poverty (SDG1 target) and ensuring good health and quality of life (SDG3 target), targets adopted by the UN in the 2030 Agenda for Sustainable Development resolution [2]. For several years now, FAO experts in successive reports of this kind (published even before the health crisis caused by the coronavirus pandemic) have stressed that increasing armed conflicts, economic downturns and downturns, the rise of extreme climatic events, with high prices for nutritious food and growing income inequality, are moving humanity further away from achieving the SDG2 goal of Zero Hunger by 2030.
It is becoming increasingly clear that food insecurity is one of the most pressing global challenges, affecting developing and highly developed countries such as the European Union. This problem became apparent during the global pandemic, which caused difficulties in food flows in global agri-food chains and led to higher food prices [2]. Furthermore, in mid-2021, because of soaring fuel and energy prices even before Russia invaded Ukraine, inflationary pressures emerged in several countries due to rising demand and weaker harvests, which in turn led to an increase in food prices [3]. Rising energy costs have also increased prices and reduced the availability of essential feed, fertilisers, and pesticides for European farmers. It is worth noting that the start of the war in Ukraine has led to an increase in the price of fertiliser, which is produced using natural gas [4]. From 2022/2023 onwards, global cereal supply began to increase, allowing cereal markets to stabilise and favour a fall in cereal prices.
At the same time, it is becoming increasingly clear that the consequences of climate change in the form of extreme weather events are having a significant impact worldwide and in Europe, with the potential to alter the natural conditions for growing crops [6,7,8,9,10,11]. It has recently contributed to a reduction in food security in European Union countries. However, it is essential to note that its member states are among the largest cereal producers in the world. They currently supply 20% of total world cereal production and export 15% of this production [11]. As Obiedzińska [12] points out, the grouping, simultaneously the largest importer and exporter of food, faces challenges that will define the possibilities of ensuring food security for every EU citizen.
As in the rest of the world, changing climatic conditions in Europe impact the development of agriculture and its production capacity. It is also essential to consider that although fossil fuel combustion has the most immense impact on greenhouse gas (GHG) emissions, agriculture significantly contributes to climate change, accounting for about 24% of global GHG emissions [13]. These include carbon dioxide (CO₂), nitrous oxide (N2O) and methane (CH4). In Europe, the contribution of agriculture to the total emissions of these gases is lower, at 10%. As indicated by Prandecki et al. [14], it is assumed that the volume of its emissions corresponds to the absorption capacity of this gas by plants. Therefore, global warming is more influenced by the other two greenhouse gases, namely nitrous oxide (N2O) and methane (CH4). N2O is emitted mainly from mineral and organic fertilisers and animal faeces, while CH4 results from the intestinal fermentation of cattle [15]. In Europe, CH4 emissions from enteric fermentation and N2O from soils are responsible for 48% and 31% of total agricultural GHG emissions, respectively. CH4 from manure management is the third most important source of emissions, accounting for about 17%. The remaining sources make relatively small contributions, accounting for less than 5% of agricultural GHG emissions in total [16].
Between 2005 and 2021, the volume of GHG emissions from EU agriculture revealed a slight downward trend of 3%, and in 2022, a 2% reduction in emissions was observed. However, this varied between member states. In 13 EU countries, there was an increase in emissions, while in 14 countries, there was a decrease. There were reductions in GHG emissions of more than 10% in Croatia, Greece, and Slovakia. In contrast, in countries such as Bulgaria, Estonia, Hungary, Ireland, Latvia and Luxembourg, there was an increase in emissions of more than 10%. It seems that to achieve the European Green Deal climate neutrality targets in individual member states, it may be necessary to consider significant reductions in emissions in sectors apart from agriculture. This could result from the energy transition and decarbonisation caused by fossil fuel combustion.
Kowalska [17] highlights that researchers often arrive at different conclusions regarding the impact of agriculture on the environment and climate change, as well as the impact of global warming on agriculture, global food production and prices, and food security. Zhang et al. [18] have suggested that a 2 °C increase in the Earth’s temperature could potentially lead to increased wheat yields in wheat-exporting countries at high latitudes (e.g. China, India, the United States, Canada, Russia). This could be attributed to the CO₂ fertilisation effect, whereby ecosystems absorb nearly 25% of the carbon dioxide emitted worldwide. It allows for some reduction in the negative consequences of rising temperatures for cereal crops and increases wheat production. Cereal crops are recognised as a cornerstone of global food security [19]. They occupy 30.6% of the total cereal area, followed by maize (26.7% of the sown area) and rice (22.6% of the crop). In low-latitude countries that import wheat, its yields may decrease significantly (e.g. Africa and South Asia). It could potentially lead to changes in grain prices and economic inequalities between wheat-importing and wheat-exporting countries and may even threaten food security [17]. However, it is difficult to say whether the research team’s forecast will be confirmed.
One of the critical considerations in environmental economics is the impact of climate change on cereal production in Europe and its food security. It is a significant research problem that has not yet been sufficiently analysed. This research aims to provide empirical evidence on whether using renewable and non-renewable energy, CO₂ emissions and the resulting changes in temperature and precipitation can affect crop yields in European Union countries and, thus, food security. In undertaking this research, the authors draw upon the insights of W.D. Nordhaus’ concept of the Climate Casino [20] and the potential impact of unpredictable climate change caused by greenhouse gas emissions on economic development and changes in agricultural productivity. The research objective required the realisation of several specific objectives, including the determination of the long-term relationships between:
- Economic growth and the volume of cereal production per hectare.
- The size of the area under cereal crops and the size of their yields.
- Temperature and rainfall and cereal production per hectare.
- CO₂ emissions and cereal yields.
- Energy and renewable energy consumption and cereal production per hectare.
To achieve the research objectives, the authors proposed the following hypotheses:
H1: Economic growth rate modifies crop yields and national food security.
H2: Long-term changes in climatic conditions are the most determinant of food security for countries with low crop productivity.
H3: CO₂ emissions impact cereal yields nonlinearly, causing them to fall over the long term.
H4: The consumption of energy, including using renewable energy in agriculture, contributes to the long-term productivity of cereal crops.
The hypothesis was validated using an FGLS model robust to heteroscedasticity and cross-sectional dependence and a quantile regression model. The second model was employed to test the robustness of the tested model, along with the inclusion of additional variables and their joint interaction. The countries of the European Union were studied using data on economic growth, climate change (described by annual average temperatures and precipitation), CO₂ emissions, non-renewable and renewable energy consumption, and cereal crop yields over a long period (1992-2021).
The paper is structured as follows. Section one introduces the problem, and section two is devoted to a review of the relevant literature. Section three discusses the methods used to analyse the research concern and the data sources. Section four presents the study’s results, while section five discusses the results. Finally, section six includes a summary and recommendations for policymakers.
2. Literature Review
2.1. Food Security and Cereal Production in Europe
Food security can be defined as a situation in which all people have physical, social and economic access to sufficient, safe and nutritious food that meets their dietary needs and food preferences for an active and healthy life. To ensure food security, four conditions must be met simultaneously [21]:
- (1)
- physical availability of food,
- (2)
- economic availability of food,
- (3)
- adequate diet quality and food safety,
- (4)
- stabilisation.
In 2016, the Council of the European Union expressed concern that hunger remains one of the most pressing development challenges [22]. The pandemic, ongoing warfare on various fronts, and climate change have highlighted weaknesses in agri-food systems and regional inequalities. It has resulted in a further increase in global hunger and a severe threat to food security. Ensuring physical and economic access to sufficient, safe and nutritionally adequate food for all people has thus become one of the most critical global challenges of the 21st century. Considering the considerable number of people in the world who are hungry and those who live below the subsistence level, every effort should be made to increase food security [23].
The concept of food security can be considered in both international and national contexts. At the international level, addressing global inequalities in satisfying hunger is vital to ensuring food security. Both emergency and long-term food aid play a significant role in reducing the food gap in countries experiencing persistent food deficits. The long-term determinants of national food security are the continuity of the food supply stream, the rational management of natural resources, environmental and climatic factors, and the administrative and socio-political environment [24]. It is evident that ensuring national food security and reducing regional inequalities is pivotal in addressing global food problems.
The ongoing conflict between Russia and Ukraine has heightened concerns about global food security, as both countries are significant producers and exporters of cereals. The discourse on the world’s threatened access to sufficient, safe and nutritious food has gained prominence. Furthermore, the trade restrictions imposed due to the war and the ongoing climate change are increasing the issue of food insecurity. Considering these circumstances, it is paramount to examine the factors influencing the production and yield of cereals, including wheat, which form the basis of human nutrition [25].
According to European Commission experts, despite this strong growth, animal protein is expected to remain the dominant source of protein consumed in the EU in the future (around 60%) [26]. More than 50% of cereal crops in the European Union are wheat. The remaining 50% comprises maize and barley, each taking up 30% of this share of cereals grown. The remaining 30% are cereals grown in smaller quantities, such as rye, oats and spelt [27]. A study by Aljohani and Chidmi [11] indicates a variation in technical efficiency scores across crops and countries. This diversity in performance reflects the inherent complexities within each crop and emphasises the crucial role of macroeconomic variables and agricultural policies in shaping efficiency outcomes on a countrywide scale. Furthermore, cereals in the EU are utilised in feed production, representing approximately two-thirds of the crop. Consequently, they exert an indirect influence on livestock production. One-third of the cereals grown are utilised for human consumption, while approximately 3% are employed in the production of biofuels.
Cereal productivity represents a crucial factor influencing food security. This impact is evident in several key areas, including:
- -
- Food supply: Cereals represent a significant proportion of the diet for many Europeans. The high cereals yield means more food can be produced, which can help ensure food security in Europe and globally.
- -
- Food prices: High cereal yields can lower food prices, improve food availability for low-income people, and encourage livestock production development.
- -
- Food instability: High cereal yields can help to reduce food security instability, which is caused by a few factors, including droughts, floods and military conflict, as well as health risks associated with a pandemic that has disrupted supply chains.
Cereal productivity is widely acknowledged as a critical indicator of the global food economy. Cereal yields (kg per hectare) represent a primary metric for assessing the productivity of cereal production. Figure 1 provides a comprehensive illustration of cereal productivity in EU countries. Detailed characteristics are presented in Table A1.
The yield of cereal crops is influenced by numerous factors, including the specific cereal variety, the quality of the soil, the cultivated area, the prevailing climatic conditions, and the use of appropriate agronomic techniques [28]. Verma et al. [29] found that the Cobb-Douglas production function used in wheat resulted in seed, fertilizer, and irrigation variables being positively significant, while the plant protection measures significantly negatively affected wheat production.
The recent intensification of the global warming problem has led to an increase in the unpredictability of climatic conditions for cereal production. This is particularly evident in the case of the average annual temperature and the average annual precipitation, which indicate a tendency towards deregulation of agricultural ecosystem conditions. As illustrated in Figure 1 and Figure 2, over the past three decades, there has been a rise in the average annual temperature across Europe, accompanied by a decline in precipitation. Additionally, the amplitude of temperature and precipitation fluctuations has increased, creating unstable conditions for cereal production and posing a long-term threat to food security [30]. However, this phenomenon allows northern European countries to enhance crop conditions [6,31]. A study by Carozzi et al. [32] predicts a significant reduction in cereal productivity between 2050 and 2099 due to a reduction in the length of the crop-growing cycle associated with rising temperatures. This effect was more pronounced for the more pessimistic climate scenario (-13% for croplands and -7.7% for grasslands) and Mediterranean regions, confirming a regionally distributed impact of climate change.
The interconnections between environmental deterioration caused by CO₂ emissions and economic factors represent a significant area of research within the broader field of environmental Kuznets curve (EKC) studies. The EKC hypothesis posits the existence of nonlinear relationships between socio-economic development and environmental CO₂ pollution [32,33,34]. In most studies, it has been observed that CO₂ emissions initially increase with economic growth but eventually decrease with increasing income levels of society. However, these relationships sometimes take on an N-shaped pattern [36].
The existing research indicates that the direct cause of climate change is the excessive emission of CO₂, which is primarily the result of human activity [39,40,41]. In the case of agriculture, a two-way causality between CO₂ emissions and crop production is noticeable. On the one hand, the excessive amount of carbon dioxide in the atmosphere worsens climate stability. On the other hand, economic activities, including agriculture, are responsible for CO₂ emissions. Concurrently, in the short term, elevated atmospheric CO₂ concentrations may enhance the productivity of cereal crops. However, in the long term, due to the impact on climate stability, augmenting the quantity of this gas in the atmosphere may result in adverse effects on cereal yields [40].
Furthermore, increasing crop yields necessitates the utilisation of contemporary technologies and agro-technical treatments that consume more energy. Concurrently, climate change necessitates an increase in energy consumption in agriculture, whether through supplementary irrigation of crops or the utilisation of more sophisticated agricultural technologies [41]. Considering the European Green Deal’s objective of reducing CO₂ emissions in European Union countries, it is imperative to identify alternative energy sources for agricultural activities and crop cultivation. Climate change will inevitably lead to increased energy requirements in agriculture, necessitating the development of new, sustainable energy sources [19].
2.2. Using Econometric Methods to Explore the Relationship between Climate Change Impacts and Global Cereal Production
A bibliographic analysis indicates a relatively limited body of empirical research on the impact of climate change on agricultural production, particularly in European Union countries [40]. In contrast, the issue of food security is addressed more concerning developing countries, with South Africa and West Asia identified as having the highest number of hungry people, estimated at 691 to 783 million [1]. The consequences of global warming and climate effects on agricultural production have led to this problem becoming even more relevant in these countries [42]. Furthermore, the negative impact of the COVID-19 pandemic and the war in Ukraine has been significant. A review of the studies presented so far for countries in Asia and Africa indicates that climate change affects agricultural sector production. Concurrently, the studies demonstrate that the impact of climatic factors is contingent upon the geographical location and the level of socio-economic development of the country in question. Table 1 presents an overview of recent studies (over the last five years) utilising advanced econometric models to assess the impact of environmental-economic factors on agricultural production.
A review of past research indicates that the analysis of the relationship between environmental and economic factors and food production has been conducted mainly for low- and middle-income countries. In the literature, there is a paucity of research results dedicated to the issue of energy consumption by the crop production sector, which will become increasingly crucial under technological progress and climate change conditions. It indicates a research gap in establishing the relationship between the effects of climate change (CO₂), energy consumption from various sources and the volume of crop production, which determines a country’s level of food security. This is a particularly critical issue for the Member States of the European Union. At present, they are confronted with the challenges of an energy transition while simultaneously experiencing the consequences of global warming. These include an increase in the average annual temperature, a reduction in precipitation, and violent climatic events, such as droughts, floods, extreme heat, hurricanes, etc.
3. Materials and Methods
3.1. Date
The study considered the countries of the European Union, except for Belgium, Cyprus, Luxembourg, Malta and Slovenia, as it was impossible to obtain a complete time series for these countries. Due to the extensive range of data required for the study, the authors employed the resources of the World Development Indicators (WDI), European Environment Agency (EEA) and United Nations Framework Convention on Climate Change (UNFCCC) databases. The selection of variables was guided by the study’s objectives and a comprehensive literature review. The data set encompasses a time series for all countries over the 30 years from 1992 to 2021 due to complete data availability. All variables are described in detail in Table 2, while Table 3 presents descriptive statistics for the initial and concluding periods of the study.
3.2. Econometric Framework
Following the stated objectives of the study, including the first three specific objectives and the literature review, the baseline model was expressed as a linear function of cereal production volume per hectare, where the control variables are GDP per capita, crop area, average annual rainfall and temperature:
To ascertain whether there is a nonlinear relationship between cereal production and CO₂ emissions, both the level and the square of CO₂ emissions were included in equation (1):
To ascertain whether there is a nonlinear relationship between cereal production and energy production and renewable energy consumption, both the level and the square of the emissions of the indicated variables were included in equation (1):
where are the parameters that were estimated by the model, and are the error terms. The subscripts i and t parameters denote the country and period for the variability analysis. To detect non-linearity in the assumed relationships, turning points were estimated for the variables CO2, EC and REW, the value of which allows the monotonicity to be tested.
Based on Wooldridge [57], to determine an appropriate estimation technique in the first stage of the study, the data were examined for cross-sectional dependence (CSD). For this purpose, the authors used two commonly used Pesaran CD cross-sectional dependence tests [58] and one based on the Lagrange Multiplier Breusch-Pagan [59,60]. In the next step, it was necessary to perform stationarity tests on the data. For this purpose, the authors used a second-generation panel data test based on averaged augmented Dickey-Fuller (ADF) regression and the CSD-resistant Im, Pesaran, and Shin - CIPS [58,61].
The data analysed were also tested for heteroscedasticity using the Breusch-Pagan/Cook-Weisberg test [59] and Cameron & Trivedi’s decomposition of IM-test [62]. A recent preliminary study analysed the incidence of cointegration. For this purpose, the second-generation Westerlund test was conducted [63], which is robust to cross-sectional dependence.
Two estimation techniques based on pre-testing were employed in the study. The first, the FGLS method, was designed to allow for the examination of overall relationships for the variables under study. This regression model is suitable for small panels with a more significant number of observations over time relative to the number of cross-sections. The model is robust to cross-sectional dependencies and heteroscedasticity [64,65]. The general form of the FGLS model is shown below [64]:
To reinforce the effects of the analysis, the standard errors and confidence intervals for the models tested were estimated by the bootstrap method with 800 replicate samples. To confirm the robustness of the results and gain information on the internal distributions of the dependent variable, quantile regression (QR) was performed [66]. Data analysis at the quantile level permitted the examination of relationships between regressors in disparate regions of the distribution of the dependent variable [67].
4. Results
4.1. Pre-Estimations Data Tests
In the initial phase of the study, the data were assessed to ascertain whether they aligned with the underlying assumptions of the methodology employed and the outcomes would be deemed reliable. The data presented in Table 4 indicate no pronounced correlation within the set of variables tested, which could signify a collinearity issue and thus contravene the tenets of conventional estimation methodologies. Concurrently, the correlation matrix suggests a few moderately robust correlations between the variables that can be tested. The Variance Inflation Factor (VIF) test results, presented in Table 5, indicate that the study variables do not exhibit multicollinearity problems. A summary of the results of both tests indicates that the variables studied correctly match the model analysed.
To test for cross-sectional dependence, the authors employed two tests, the results of which are presented in Table 6. The first is a test based on the Lagrange multiplier, while the second is the Peseran CD test, a second-generation test. Both tests demonstrated the presence of a robust cross-sectional dependence, rendering the use of ordinary least squares regression methods in the dataset under study untenable. The CIPS unit root tests demonstrated that all variables were stationary in the first difference I(1).
Table 7 presents the results of the Generation II cointegration test for panel data exhibiting cross-sectional dependence (CSD). Based on the Breusch-Pagan/Cook-Weisberg and White’s tests, it can be concluded that heteroscedasticity exists. Furthermore, based on the results of the Wooldridge test, it can be inferred that there is no first-order autocorrelation in the panel data set. It suggests that the residuals are independent of each other. The results of the Westerlund test indicated the presence of strong cointegration between the series under study, thereby enabling the inference of long-run causal relationships.
The results indicate that methods based on GLS models and quantile regression, which are robust to cross-sectional dependence and heteroscedasticity, should be employed in model estimation. Furthermore, a bootstrap should be utilised to estimate standard errors to guarantee more robust results.
4.2. Estimations results
The results of the estimation of the FGLS model are presented in Table 8, while Figs. 4-6 present the predicted changes in the dependent variable, considering the impact of the independent variables studied. The following significant relationships emerge from the study:
- -
- economic growth translates into higher yields - an increase in GDP per capita of around 1% results in a 0.3% increase in cereal yields per hectare;
- -
- the increase in the area under cereal crops determines the increase in cereal yields to a small extent; a more significant influence is the quality of the crop;
- -
- temperature and the amount of precipitation induce a positive effect on yields, but with the proviso that the increases in yields are not too significant.
The research findings indicate that an initial increase in energy consumption in agriculture is associated with a reduction in cereal yields per hectare (Figure 4). It is attributed to the fact that the energy consumed in agriculture is often directed towards producing inputs, such as fertilisers, pesticides and machinery, rather than the direct production of cereals. Furthermore, a period of adjustment is required during which the implementation of new agricultural technology occurs initially, with the subsequent effects manifesting as increased crop productivity [28]. The extensive utilisation of machinery and equipment, in turn, results in an increasing energy demand [68]. The model’s estimates indicate that once agricultural use reaches 2256.53 thousand tonnes of oil equivalent, crop yields in the European Union countries studied gradually increase. The projected course of the dependent variable suggests that an increase in crop yields requires greater energy consumption in the long term.
A U-shaped relationship is also observable for CO₂ emission (Figure 5). Initially, an increase in CO₂ leads to an increase in cereal yields due to the increased availability of carbon dioxide for plants. This gas is the main component of photosynthesis, a process in which plants use solar energy to produce carbohydrates from water and carbon dioxide. Increasing atmospheric carbon dioxide concentrations allows plants to produce more carbohydrates, increasing agricultural yields. Nevertheless, in the long term, an increase in CO₂ can result in a decline in cereal productivity. This is because the climate changes caused by the increase in CO₂ can harm cereal-growing conditions. These changes include:
- -
- an increase in air temperature can result in heat stress for plants, which may subsequently lead to a reduction in yield,
- -
- alterations in the distribution of precipitation, which can result in drought or flooding and which can also have a detrimental impact on crop yields,
- -
- a notable increase in the frequency and intensity of extreme weather events, including storms, hurricanes, tornadoes, droughts, floods and mudslides, has been observed, with a concomitant rise in the extent of crop damage.
The results indicate that the point at which the negative impact of CO₂ on cereal production in the EU countries studied will be when the average CO₂ emission level of 914.15 kg per capita is exceeded.
Figure 6 illustrates the impact of renewable energy use on cereal production in the EU countries surveyed. The research indicates that an increase in renewable energy consumption positively affects crop productivity. Nevertheless, an increase in renewable energy consumption initially results in a decline in cereal productivity, which can lead to increased agricultural production costs. This is because renewable energy is often pricier than energy derived from fossil sources, such as oil or natural gas. Increased energy costs can result in increased agricultural production costs, including those associated with fertilisers, crop protection products and transport. Increased operational expenses in agriculture can diminish the profitability of agricultural production, which may ultimately result in a decline in agricultural production, including cereals.
Nevertheless, in the long term, an increase in the use of renewable energy can enhance the efficiency of cereal production. This is because renewable energy is more environmentally friendly than conventional energy. Reducing greenhouse gas emissions due to reduced non-renewable energy consumption can improve growing conditions for cereals and consequently lead to increased yields. Furthermore, an increase in renewable energy consumption can contribute to developing new agricultural technologies that are more efficient and less costly. Furthermore, these new technologies may increase cereal productivity. According to the estimated model, an overall increase of 3.39% in renewable energy consumption in the countries studied positively impacts cereal yields.
Table 8 and Table 9 present the quantile regression (QR) results across the three quantiles. The results were estimated for CO₂, REW, EC, and the combined model, including all variables. When analysing the relationship between energy consumption and cereal yields per hectare, it can be observed that there is a U-shaped pattern. An initial increase in energy consumption results in a decrease in cereal yields per hectare, while agricultural productivity increases after the turning point. The most significant impact of an increase in energy consumption is observed in the first quantile (Q=0.25), indicating that countries with the lowest productivity in cereal production are most affected by rising energy consumption. Notably, beyond a certain threshold of energy consumption, the negative impact of increased energy consumption begins to diminish, and production efficiency improves for countries in the first and second quantiles (Q=0.25 and Q=0.50). For Q=0.75, the energy consumption coefficients are not significant. It indicates that an increase in energy consumption in high-productivity countries does not harm grain yields in the initial period. Furthermore, these countries no longer have a significant need for additional energy in agriculture.
The results of quantile regression analysis indicate that an increase in CO₂ in all quantiles examined significantly impacts agricultural productivity. This impact is most evident in the first quantile (Q=0.25), which includes countries with low agricultural productivity. Furthermore, exceeding the turning point in CO₂ harms cereal productivity, a concern for all countries studied. The earliest negative impact of CO₂ is anticipated to occur in countries within the middle quantile (Q=0.50).
The final relationship investigated was the impact of increased renewable energy use in agriculture on cereal production per hectare. In line with previous observations, renewable energy alone does not directly impact cereal productivity. However, the associated sustainable practices and technologies can contribute to improved productivity and sustainability of cereal production.
According to the results obtained, in countries in the first quantile (Q=25), renewable energy has the most significant impact on the decline in productivity in cereal production. It can be observed that a gradual increase in agricultural productivity occurs only after the turning point when the share of renewable energy increases by 3.24%. This is similar to the situation in the group of countries in the middle quintile, where the change in trend occurs after an increase in the share of renewable energy in agriculture of 2.95%. Renewable energy has no significant impact on cereal yields in countries with high iron productivity.
To validate the robustness of the findings, all the variables under investigation were subjected to cumulative analysis (Table 11). Incorporating all variables into the model did not significantly alter the parameter values and probabilities, thereby attesting to the robustness of the models employed and the outcomes attained.
5. Discussion
The research findings demonstrate that climatic variables, such as precipitation and temperature, exert a considerable influence on cereal yields within the EU. The study results in quantiles indicate that temperature exerts the most pronounced impact on crops in countries with high crop yields while exerting the most negligible impact in countries with low yields. The outcomes thus align with the conclusions of Attiaoui and Boufateh [47] and Nasrullah et al. [46], who also indicated a positive effect of temperature on cereal crop production in Tunisia and South Korea. However, studies by some authors have demonstrated that temperature is a factor negatively affecting cereal yields [51,54,55,56].
The research has demonstrated that precipitation considerably influences cereal production per hectare, with the most pronounced impact observed in countries with low and moderate cereal productivity. Conversely, these factors are less significant in high-productivity countries, where more advanced irrigation systems and crop technology are in place. These findings align with the ARDL model estimates of Chandio et al. [45], which indicate that rainfall enhances cereal productivity in both the short and long term.
The findings of Attiaoui and Boufateh [47] also corroborate the notion that rainfall exerts a considerable and constructive influence on agricultural output, albeit over an extended period. Conversely, the outcomes of this study diverge from those of the Alehile et al. [51] investigation in Nigeria, which indicated that a reduction in annual rainfall yields a positive and statistically significant impact on crop production in the short term.
In this context, Polish researchers have obtained interesting results from assessing the impact of weather factors on the yield of selected cereals in Poland under conditions of progressive climate change. The study used variables such as temperature precipitation, the proportion of medium and heavy soils and mineral fertiliser use. The study observed a significant effect of the number of days with precipitation on the yields obtained. While regularly occurring, moderate rainfall was undoubtedly favourable, large amounts of rainfall adversely affected yields. Another crucial factor was temperature during the spring and summer months. Moderate temperatures were found to be the most favourable for yields. Temperature changes influenced the yield changes of individual cereals to varying degrees, with the most substantial effect observed in wheat. The study concluded that Polish agriculture would have to adapt to the new climatic conditions by implementing many measures, including modifying the structure of crops, ensuring the irrigation of plants against potential droughts with efficient, modern irrigation systems, increasing the genetic diversity of plants, and utilising modern agro techniques.
The research findings also indicate a significant, albeit small, effect of cultivated area on cereal productivity. Increasing cultivated areas is most important in countries with low cereal production per hectare; it does not play a role in countries with high yields. These results are consistent with those of Chandio et al. [45], who confirmed that increasing cropped area positively and significantly increased wheat yields in the long and short term. The findings of Nasrullah et al. [46] suggest a long-run relationship between cropped area and rice productivity in South Korea.
However, it is critical to exercise caution when comparing previous studies on the influence of climatic factors on cereal yields with the results obtained in this study. This is because similar studies have not been carried out for European countries, and the studies have primarily concerned economically underdeveloped countries in different climate zones. Furthermore, the authors’ study also confirmed the positive effect of increased CO₂ on cereal yields in the European Union countries studied. Conversely, the relationship between CO₂ emissions and cereal yields is nonlinear, initially exhibiting a positive correlation but subsequently exhibiting a negative effect once the estimated level of emissions is exceeded. Furthermore, the negative effect of CO₂ emissions on cereal production is most pronounced in countries with moderate crop yields.
The results obtained can be considered to some extent similar to those of Chandio et al. [50], who conclude that CO₂ significantly impacts agricultural production in both the long and short term. Similar observations are also confirmed by Kumar et al. [53]. In contrast, Onour [55] estimates that a change in CO₂ has a positive and significant effect on cereal yields in the long and short term. Specifically, a 1% increase in CO₂ leads to a 3% increase in cereal yields in the short term and a 0.7% increase in the long term. Nevertheless, it is essential to note that previous studies have considered CO₂ emissions to be a linear variable without considering the U-shaped effect of CO₂ on cereal production.
The final area investigated was the impact of increased energy consumption and renewable energy in agriculture on cereal production per hectare. The results confirm that energy consumption significantly and nonlinearly impacts crop productivity. At the same time, countries with low and moderate crop yields face higher costs for implementing agrotechnology. However, crop productivity increases once the energy consumption level estimated in the study is exceeded. The authors’ findings also indicate that the increase in energy consumption should be realised by using renewable sources. However, their use in the initial period may have a negative impact due to increasing costs. Nevertheless, as the share of renewable sources in agricultural energy consumption increases, crop productivity will increase in the long term. Regarding the findings, it is essential to acknowledge that this topic has not been investigated more comprehensively.
Robertson et al. [69] proposed high energy consumption in areas with high soil mechanisation and agricultural productivity, indirectly contributing to increased CO₂. Chandio et al. [70] investigated the dynamic interaction between energy consumption and economic progress in Pakistani agriculture from 1984 to 2016. The results, which used the ARDL method, demonstrated a positive relationship between gas and electricity consumption and agricultural production growth. A study by Ghosh [71] revealed that short-term Granger causality results indicate a bidirectional relationship between value added from agriculture in India and energy consumption. It confirms the need to use energy-efficient technologies in agriculture to prevent environmental destruction. Aydoğan and Vardar [72] demonstrated the potential for renewable energy to contribute to economic growth in the agricultural sector, thereby reducing fossil fuel consumption and improving the environment. Their analysis employed Granger causality as a case study of G7 countries.
6. Conclusions
The research findings supported the hypotheses, which were subsequently verified. Panel studies were conducted using advanced econometric models to determine the relationships between the use of renewable and non-renewable energy in agriculture, CO₂ and climate change and the volume of cereal production (which determines the food security of these countries). The research team sought to identify short- and long-term relationships for most European Union countries. The results obtained permit the following conclusions to be drawn:
- -
- The influence of economic growth on cereal production is more pronounced in low-yielding countries. In contrast, developing economies facilitate the production of higher yields in agriculture.
- -
- The expansion of cultivated area exerts the most pronounced influence in countries with low crop yields, whereas, in countries with high yields, it has no discernible impact on the volume of cereal production per hectare.
- -
- It has been confirmed that precipitation significantly influences crop yields in countries with low and moderate cereal production per hectare. Conversely, precipitation has relatively few consequences in countries with high cereal yields. It is attributed to the presence of more advanced irrigation systems and crop technology, which serve to mitigate the impact of precipitation on yields.
- -
- In high-yielding countries, temperature has the most significant impact on crops, whereas in low-yielding countries, the most negligible impact is observed regarding cereal production.
- -
- Expanding energy consumption and integrating renewable energy sources into agricultural practices present a more formidable challenge for countries with low and moderate crop yields.
- -
- The increase in CO₂ will have the most rapid effect on cereal production in countries with moderate crop yields.
The study’s findings and the resulting conclusions indicate the following implications of the impact of climate change on the food security of EU countries in the following years. From the perspective of European food security, it is imperative to reduce CO₂ emissions to enhance the stability of climatic conditions. In certain EU countries, agro-technical treatments are imperative to augment cereal production. However, renewable energy should be employed for this purpose. Countries with low and moderate crop yields should prioritize the implementation of technological advances and combating global warming. It is therefore necessary to implement shielding programmes for cereal producers financed from the state budget as part of agricultural support and financial transfers from EU agricultural aid programmes. Furthermore, activities should be carried out to educate the public about the effects of excessive CO₂ and the adverse effects of climate change on agriculture. It is of particular importance to educate rural residents and farmers about the effects of excessive CO₂ and the adverse effects of climate change on agriculture. Furthermore, it is recommended that programmes be implemented to increase the efficiency of cereal production and use more renewable energy resources (undertaking research and development work financed, among other things, from EU aid funds and introducing new solutions in this area in the Member States).
As with any study, this one is subject to certain limitations. In this study, the authors assumed that exogenous factors such as temperature and precipitation have a linear effect on the dependent variable, although weather conditions frequently demonstrate nonlinear effects. Cereal yields tend to be highest in specific temperature and precipitation ranges [73]. Therefore, excessive temperature, precipitation, or both increases can negatively affect crop production. However, subsequent research may consider temperature and precipitation as nonlinear variables. Future research on these issues may seek to assess the impact of precipitation and temperature variability on individual EU countries’ production volumes, considering factors such as soil quality. Further research can also consider the short-term impact of the factors analysed on cereal production volumes and EU countries’ food security through ARDL Cross-sectional models.
Author Contributions
conceptualization, B.S., I.Ł. and I.S.; methodology, B.S.; software, B.S.; validation, B.S. and I.Ł.; formal analysis, B.S, I.Ł. and I.S.; investigation, B.S. and I.Ł.; resources, B.S.; data curation, B.S.; writing-original draft preparation, B.S, I.Ł. and I.S.; writing-review and editing, B.S, I.Ł. and I.S.; supervision, B.S. and I.Ł.; project administration, B.S.; funding acquisition, B.S, I.Ł. and I.S. All authors have read and agreed to the published version of the manuscript.
Funding
This research was funded by the Institute of Agricultural and Food Economics-National Research Institute, Warsaw, Poland and by the project within the framework of the Faculty of Economics of West Pomeranian University of Technology in Szczecin, Poland, under the name CARE.
Data Availability Statement
The data upon which this article is based is supported by different data portals such as national government pages, repositories, and other data sources.
Acknowledgements
The study is the result of the authors’ collaborative research internship under the direction of Prof. Iwona Szczepaniak at the Institute of Agricultural and Food Economics-National Research Institute, Warsaw.
Conflicts of Interest
The authors declare no conflicts of interest.
Appendix A

Table A1.
Division of the surveyed countries according to the volume of cereal production.
| Group | Countries |
|---|---|
| High-yielding countries (average yield over 6000 kg/ha) | Netherlands; Ireland; France; Germany; Denmark; Austria |
| Medium-yielding countries (average yield between 4000 and 6000 kg/ha) | Croatia; Italy; Czech Republic; Sweden; Hungary; Slovakia |
| Low-yielding countries (average yield less than 4000 kg/ha) | Greece; Portugal; Finland; Romania; Poland; Spain; Lithuania; Latvia; Estonia |
References
- Fao, I. The State of Food Security and Nutrition in the World 2023; FAO ; IFAD ; UNICEF ; WFP ; WHO , 2023;
- Figiel, S.; Floriańczyk, Z.; Wigier, M. Impact of the COVID-19 Pandemic on the World Energy and Food Commodity Prices: Implications for Global Economic Growth. Energies 2023, 16, 3152. [Google Scholar] [CrossRef]
- Jagtap, S.; Trollman, H.; Trollman, F.; Garcia-Garcia, G.; Parra-López, C.; Duong, L.; Martindale, W.; Munekata, P.E.S.; Lorenzo, J.M.; Hdaifeh, A.; et al. The Russia-Ukraine Conflict: Its Implications for the Global Food Supply Chains. Foods 2022, 11, 2098. [Google Scholar] [CrossRef] [PubMed]
- Rabbi, M.F.; Ben Hassen, T.; El Bilali, H.; Raheem, D.; Raposo, A. Food Security Challenges in Europe in the Context of the Prolonged Russian–Ukrainian Conflict. Sustainability 2023, 15, 4745. [Google Scholar] [CrossRef]
- Beillouin, D.; Schauberger, B.; Bastos, A.; Ciais, P.; Makowski, D. Impact of Extreme Weather Conditions on European Crop Production in 2018. Philos. Trans. R. Soc. B Biol. Sci. 2020, 375, 20190510. [Google Scholar] [CrossRef] [PubMed]
- Hristov, J.; Domínguez, I.P.; Fellmann, T.; Elleby, C. Economic Impacts of Climate Change on EU Agriculture: Will the Farmers Benefit from Global Climate Change? Environ. Res. Lett. 2023, 19, 014027. [Google Scholar] [CrossRef]
- Habib-ur-Rahman, M.; Ahmad, A.; Raza, A.; Hasnain, M.U.; Alharby, H.F.; Alzahrani, Y.M.; Bamagoos, A.A.; Hakeem, K.R.; Ahmad, S.; Nasim, W.; et al. Impact of Climate Change on Agricultural Production; Issues, Challenges, and Opportunities in Asia. Front. Plant Sci. 2022, 13. [Google Scholar] [CrossRef]
- Mohammadi, S.; Rydgren, K.; Bakkestuen, V.; Gillespie, M.A.K. Impacts of Recent Climate Change on Crop Yield Can Depend on Local Conditions in Climatically Diverse Regions of Norway. Sci. Rep. 2023, 13, 3633. [Google Scholar] [CrossRef] [PubMed]
- Rezaei, E.E.; Webber, H.; Asseng, S.; Boote, K.; Durand, J.L.; Ewert, F.; Martre, P.; MacCarthy, D.S. Climate Change Impacts on Crop Yields. Nat. Rev. Earth Environ. 2023, 4, 831–846. [Google Scholar] [CrossRef]
- Nepal, M.; Ashfaq, M.; Sharma, B.R.; Shrestha, M.S.; Khadgi, V.R.; Bruno Soares, M. Impact of Weather and Climate Advisories on Agricultural Outcomes in Pakistan. Sci. Rep. 2024, 14, 1036. [Google Scholar] [CrossRef]
- Aljohani, E.S.; Chidmi, B. Analyzing Technical Efficiency in Cereal Production across Selected European Union Countries. Sustainability 2024, 16, 546. [Google Scholar] [CrossRef]
- Obiedzińska, A. Wybrane aspekty zapewnienia bezpieczeństwa żywnościowego w Unii Europejskiej. Stud. BAS 2016, 123–161. [Google Scholar]
- Climate Change 2014: Synthesis Report; Pachauri, R. K., Mayer, L., Intergovernmental Panel on Climate Change, Eds.; Intergovernmental Panel on Climate Change: Geneva, Switzerland, 2015; ISBN 978-92-9169-143-2. [Google Scholar]
- Prandecki, K.; Wrzaszcz, W.; Zieliński, M. Rolnictwo a Klimat. Zmiana Klimatu - Skutki Dla Pol. Społeczeństwa Gospod. 2020. [Google Scholar]
- Michalak, D.; Rydz-Żbikowska, A. Jakie działania są niezbędne dla sprostania wyzwaniom zielonego ładu i uczynienia go szansą dla polskiego rolnictwa? In; Wydawnictwo Uniwersytetu Łódzkiego, 2022 ISBN 978-83-8220-870-2.
- Greenhouse Gas Emissions from Agriculture in Europe. Available online: https://www.eea.europa.eu/en/analysis/indicators/greenhouse-gas-emissions-from-agriculture (accessed on 28 April 2024).
- Wyzwania związane z bezpieczeństwem żywnościowym - komentarz ekspercki dr hab. Aleksandry Kowalskiej, prof. UMCS. Available online: https://www.umcs.pl/pl/aktualnosci,54,wyzwania-zwiazane-z-bezpieczenstwem-zywnosciowym-komentarz-ekspercki-dr-hab-aleksandry-kowalskiej-prof-umcs,120561.chtm (accessed on 28 April 2024).
- Zhang, T.; Wiel, K. van der; Wei, T.; Screen, J.; Yue, X.; Zheng, B.; Selten, F.; Bintanja, R.; Anderson, W.; Blackport, R.; et al. Increased Wheat Price Spikes and Larger Economic Inequality with 2°C Global Warming. One Earth 2022, 5, 907–916. [Google Scholar] [CrossRef]
- Economic and Food Security Impacts of Agricultural Input Reduction Under the European Union Green Deal’s Farm to Fork and Biodiversity Strategies; Beckman, J., Ivanic, M., Jelliffe, J.L., Baquedano, F.G., Scott, S.G., Eds.; 30; 2020;
- Nordhaus, W. The Climate Casino: Risk, Uncertainty, and Economics for a Warming World; Yale University Press, 2013; ISBN 978-0-300-18977-3.
- The State of Food Security and Nutrition in the World 2022. Available online: https://openknowledge.fao.org/items/c0239a36-7f34-4170-87f7-2fcc179ef064 (accessed on 17 May 2024).
- Borch, A.; Kjærnes, U. Food Security and Food Insecurity in Europe: An Analysis of the Academic Discourse (1975–2013). Appetite 2016, 103, 137–147. [Google Scholar] [CrossRef] [PubMed]
- Food Losses and Waste in the Context of Sustainable Food Systems. A Report by the High Level Panel of Experts on Food Security and Nutrition. HLPE Report 8 |Policy Support and Governance| Food and Agriculture Organization of the United Nations. Available online: https://www.fao.org/policy-support/tools-and-publications/resources-details/en/c/854257/ (accessed on 17 May 2024).
- Szczepaniak, I. Ocena bezpieczeństwa żywnościowego i samowystarczalności żywnościowej Polski na tle państw Unii Europejskiej. Int. Bus. Glob. Econ. 2018, 37, 168–182. [Google Scholar] [CrossRef]
- Neupane, D.; Adhikari, P.; Bhattarai, D.; Rana, B.; Ahmed, Z.; Sharma, U.; Adhikari, D. Does Climate Change Affect the Yield of the Top Three Cereals and Food Security in the World? Earth 2022, 3, 45–71. [Google Scholar] [CrossRef]
- European Commission. Directorate General for Agriculture and Rural Development. EU Agricultural Outlook 2023-2035.; Publications Office: LU, 2023. [Google Scholar]
- Wang, J.; Vanga, S.K.; Saxena, R.; Orsat, V.; Raghavan, V. Effect of Climate Change on the Yield of Cereal Crops: A Review. Climate 2018, 6, 41. [Google Scholar] [CrossRef]
- Matyjaszczyk, E. Comparison between Seed and Foliar Treatment as a Tool in Integrated Pest Management. J. Agric. Food Chem. 2017, 65, 6081–6086. [Google Scholar] [CrossRef] [PubMed]
- Verma, D.; Singh, H.; Meena, G. Factors Affecting Production of Cereal Crops in Rajasthan: The Cobb-Douglas Analysis. Econ. Aff. 2021, 66, 195–200. [Google Scholar] [CrossRef]
- Simionescu, M.; Bilan, Y.; Gędek, S.; Streimikiene, D. The Effects of Greenhouse Gas Emissions on Cereal Production in the European Union. Sustainability 2019, 11, 3433. [Google Scholar] [CrossRef]
- Peltonen-Sainio, P.; Palosuo, T.; Ruosteenoja, K.; Jauhiainen, L.; Ojanen, H. Warming Autumns at High Latitudes of Europe: An Opportunity to Lose or Gain in Cereal Production? Reg. Environ. Change 2018, 18, 1453–1465. [Google Scholar] [CrossRef]
- Carozzi, M.; Martin, R.; Klumpp, K.; Massad, R.S. Effects of Climate Change in European Croplands and Grasslands: Productivity, Greenhouse Gas Balance and Soil Carbon Storage. Biogeosciences 2022, 19, 3021–3050. [Google Scholar] [CrossRef]
- Selden, T.M.; Song, D. Environmental Quality and Development: Is There a Kuznets Curve for Air Pollution Emissions? J. Environ. Econ. Manag. 1994, 27, 147–162. [Google Scholar] [CrossRef]
- Allard, A.; Takman, J.; Uddin, G.S.; Ahmed, A. The N-Shaped Environmental Kuznets Curve: An Empirical Evaluation Using a Panel Quantile Regression Approach. Environ. Sci. Pollut. Res. 2018, 25, 5848–5861. [Google Scholar] [CrossRef] [PubMed]
- Awaworyi Churchill, S.; Inekwe, J.; Ivanovski, K.; Smyth, R. The Environmental Kuznets Curve in the OECD: 1870–2014. Energy Econ. 2018, 75, 389–399. [Google Scholar] [CrossRef]
- Shahbaz, M.; Sinha, A. Environmental Kuznets Curve for CO2 Emissions: A Literature Survey. J. Econ. Stud. 2019, 46, 106–168. [Google Scholar] [CrossRef]
- Abbasi, K.R.; Shahbaz, M.; Jiao, Z.; Tufail, M. How Energy Consumption, Industrial Growth, Urbanization, and CO2 Emissions Affect Economic Growth in Pakistan? A Novel Dynamic ARDL Simulations Approach. Energy 2021, 221, 119793. [Google Scholar] [CrossRef]
- Adedoyin, F.F.; Bein, M.A.; Gyamfi, B.A.; Bekun, F.V. Does Agricultural Development Induce Environmental Pollution in E7? A Myth or Reality. Environ. Sci. Pollut. Res. 2021, 28, 41869–41880. [Google Scholar] [CrossRef] [PubMed]
- Agovino, M.; Casaccia, M.; Ciommi, M.; Ferrara, M.; Marchesano, K. Agriculture, Climate Change and Sustainability: The Case of EU-28. Ecol. Indic. 2019, 105, 525–543. [Google Scholar] [CrossRef]
- Praveen, B.; Sharma, P. A Review of Literature on Climate Change and Its Impacts on Agriculture Productivity. J. Public Aff. 2019, 19, e1960. [Google Scholar] [CrossRef]
- Blake, R. Will the European Green Deal Make Agriculture More Sustainable? Outlooks Pest Manag. 2020, 31, 198–200. [Google Scholar] [CrossRef]
- Kulawik, J. The Common Agricultural Policy of the European Union in a Global Perspective. Gospod. Nar. Pol. J. Econ. 2015, 279, 119–143. [Google Scholar] [CrossRef]
- Warsame, A.A.; Sheik-Ali, I.A.; Ali, A.O.; Sarkodie, S.A. Climate Change and Crop Production Nexus in Somalia: An Empirical Evidence from ARDL Technique. Environ. Sci. Pollut. Res. 2021, 28, 19838–19850. [Google Scholar] [CrossRef] [PubMed]
- Ahsan, F.; Chandio, A.A.; Fang, W. Climate Change Impacts on Cereal Crops Production in Pakistan: Evidence from Cointegration Analysis. Int. J. Clim. Change Strateg. Manag. 2020, 12, 257–269. [Google Scholar] [CrossRef]
- Chandio, A.A.; Jiang, Y.; Fatima, T.; Ahmad, F.; Ahmad, M.; Li, J. Assessing the Impacts of Climate Change on Cereal Production in Bangladesh: Evidence from ARDL Modeling Approach. Int. J. Clim. Change Strateg. Manag. 2022, 14, 125–147. [Google Scholar] [CrossRef]
- Nasrullah, M.; Rizwanullah, M.; Yu, X.; Jo, H.; Sohail, M.T.; Liang, L. Autoregressive Distributed Lag (ARDL) Approach to Study the Impact of Climate Change and Other Factors on Rice Production in South Korea. J. Water Clim. Change 2021, 12, 2256–2270. [Google Scholar] [CrossRef]
- Attiaoui, I.; Boufateh, T. Impacts of Climate Change on Cereal Farming in Tunisia: A Panel ARDL–PMG Approach. Environ. Sci. Pollut. Res. 2019, 26, 13334–13345. [Google Scholar] [CrossRef] [PubMed]
- Chandio, A.A.; Gokmenoglu, K.K.; Ahmad, F. Addressing the Long- and Short-Run Effects of Climate Change on Major Food Crops Production in Turkey. Environ. Sci. Pollut. Res. 2021, 28, 51657–51673. [Google Scholar] [CrossRef] [PubMed]
- Ahmed, M.; Shuai, J.; Ali, H. The Effects of Climate Change on Food Production in India: Evidence from the ARDL Model. Environ. Dev. Sustain. 2023. [Google Scholar] [CrossRef]
- Chandio, A.A.; Jiang, Y.; Rehman, A.; Rauf, A. Short and Long-Run Impacts of Climate Change on Agriculture: An Empirical Evidence from China. Int. J. Clim. Change Strateg. Manag. 2020, 12, 201–221. [Google Scholar] [CrossRef]
- Alehile, K.S.; Njiforti, P.P.; Duru, M.C.; Jibril, M.S. IMPACT OF CLIMATE CHANGE ON NIGERIAN AGRICULTURAL SECTOR CROP PRODUCTION. J. Econ. ALLIED Res. 2022, 7, 105–115. [Google Scholar]
- Xiang, X.; Solaymani, S. Change in Cereal Production Caused by Climate Change in Malaysia. Ecol. Inform. 2022, 70, 101741. [Google Scholar] [CrossRef]
- Kumar, P.; Sahu, N.C.; Kumar, S.; Ansari, M.A. Impact of Climate Change on Cereal Production: Evidence from Lower-Middle-Income Countries. Environ. Sci. Pollut. Res. 2021, 28, 51597–51611. [Google Scholar] [CrossRef] [PubMed]
- Ogundari, K.; Onyeaghala, R. The Effects of Climate Change on African Agricultural Productivity Growth Revisited. Environ. Sci. Pollut. Res. 2021, 28, 30035–30045. [Google Scholar] [CrossRef] [PubMed]
- Onour, I. Effect of Carbon Dioxide Concentration on Cereal Yield in Sudan 2019.
- Abbasi, K. Green Growth of Cereal Food Production under the Constraints of Agricultural Carbon Emissions: A New Insights from ARDL and VECM Models. Sustain. Energy Technol. Assess. 2021, 47, 101452. [Google Scholar] [CrossRef]
- Wooldridge, J.M. Econometric Analysis of Cross Section and Panel Data; The MIT Press, 2010; ISBN 978-0-262-23258-6.
- Pesaran, M.H. A Simple Panel Unit Root Test in the Presence of Cross-Section Dependence. J. Appl. Econom. 2007, 22, 265–312. [Google Scholar] [CrossRef]
- Breusch, T.S.; Pagan, A.R. A Simple Test for Heteroscedasticity and Random Coefficient Variation. Econometrica 1979, 47, 1287–1294. [Google Scholar] [CrossRef]
- Baltagi, B.H.; Feng, Q.; Kao, C. A Lagrange Multiplier Test for Cross-Sectional Dependence in a Fixed Effects Panel Data Model. J. Econom. 2012, 170, 164–177. [Google Scholar] [CrossRef]
- Im, K.S.; Pesaran, M.H.; Shin, Y. Testing for Unit Roots in Heterogeneous Panels. J. Econom. 2003, 115, 53–74. [Google Scholar] [CrossRef]
- White, H. A Heteroskedasticity-Consistent Covariance Matrix Estimator and a Direct Test for Heteroskedasticity. Econometrica 1980, 48, 817–838. [Google Scholar] [CrossRef]
- Westerlund, J. Testing for Error Correction in Panel Data*. Oxf. Bull. Econ. Stat. 2007, 69, 709–748. [Google Scholar] [CrossRef]
- Fomby, T.B.; Johnson, S.R.; Hill, R.C. Feasible Generalized Least Squares Estimation. In Advanced Econometric Methods; Fomby, T.B., Johnson, S.R., Hill, R.C., Eds.; Springer: New York, NY, 1984; pp. 147–169. ISBN 978-1-4419-8746-4. [Google Scholar]
- Bai, J.; Choi, S.H.; Liao, Y. Feasible Generalized Least Squares for Panel Data with Cross-Sectional and Serial Correlations. Empir. Econ. 2021, 60, 309–326. [Google Scholar] [CrossRef]
- Koenker, R.; Bassett, G. Regression Quantiles. Econometrica 1978, 46, 33–50. [Google Scholar] [CrossRef]
- Koenker, R.; Hallock, K.F. Quantile Regression. J. Econ. Perspect. 2001, 15, 143–156. [Google Scholar] [CrossRef]
- Banerjee, A.; Jhariya, M.K.; Raj, A.; Yadav, D.K.; Khan, N.; Meena, R.S. Energy and Climate Footprint Towards the Environmental Sustainability. In Agroecological Footprints Management for Sustainable Food System; Banerjee, A., Meena, R.S., Jhariya, M.K., Yadav, D.K., Eds.; Springer: Singapore, 2021; pp. 415–443. ISBN 9789811594960. [Google Scholar]
- Robertson, G.P.; Paul, E.A.; Harwood, R.R. Greenhouse Gases in Intensive Agriculture: Contributions of Individual Gases to the Radiative Forcing of the Atmosphere. Science 2000, 289, 1922–1925. [Google Scholar] [CrossRef]
- Chandio, A.A.; Jiang, Y.; Rehman, A. Energy Consumption and Agricultural Economic Growth in Pakistan: Is There a Nexus? Int. J. Energy Sect. Manag. 2018, 13, 597–609. [Google Scholar] [CrossRef]
- Ghosh, S. Carbon Dioxide Emissions, Energy Consumption in Agriculture: A Causality Analysis for India. Arthaniti J. Econ. Theory Pract. 2018, 17, 183–207. [Google Scholar] [CrossRef]
- Aydoğan, B.; Vardar, G. Evaluating the Role of Renewable Energy, Economic Growth and Agriculture on CO2 Emission in E7 Countries. Int. J. Sustain. Energy 2020, 39, 335–348. [Google Scholar] [CrossRef]
- Semenov, M.A.; Porter, J.R. The Implications and Importance of Nonlinear Responses in Modelling the Growth and Development of Wheat. In Predictability and Nonlinear Modelling in Natural Sciences and Economics; Grasman, J., van Straten, G., Eds.; Springer Netherlands: Dordrecht, 1994; pp. 157–171. ISBN 978-94-011-0962-8. [Google Scholar]
Figure 1.
Cereal crop yields in European Union countries surveyed in 1992 (left) and 2021 (right). Source: FAO Stat.
Figure 1.
Cereal crop yields in European Union countries surveyed in 1992 (left) and 2021 (right). Source: FAO Stat.
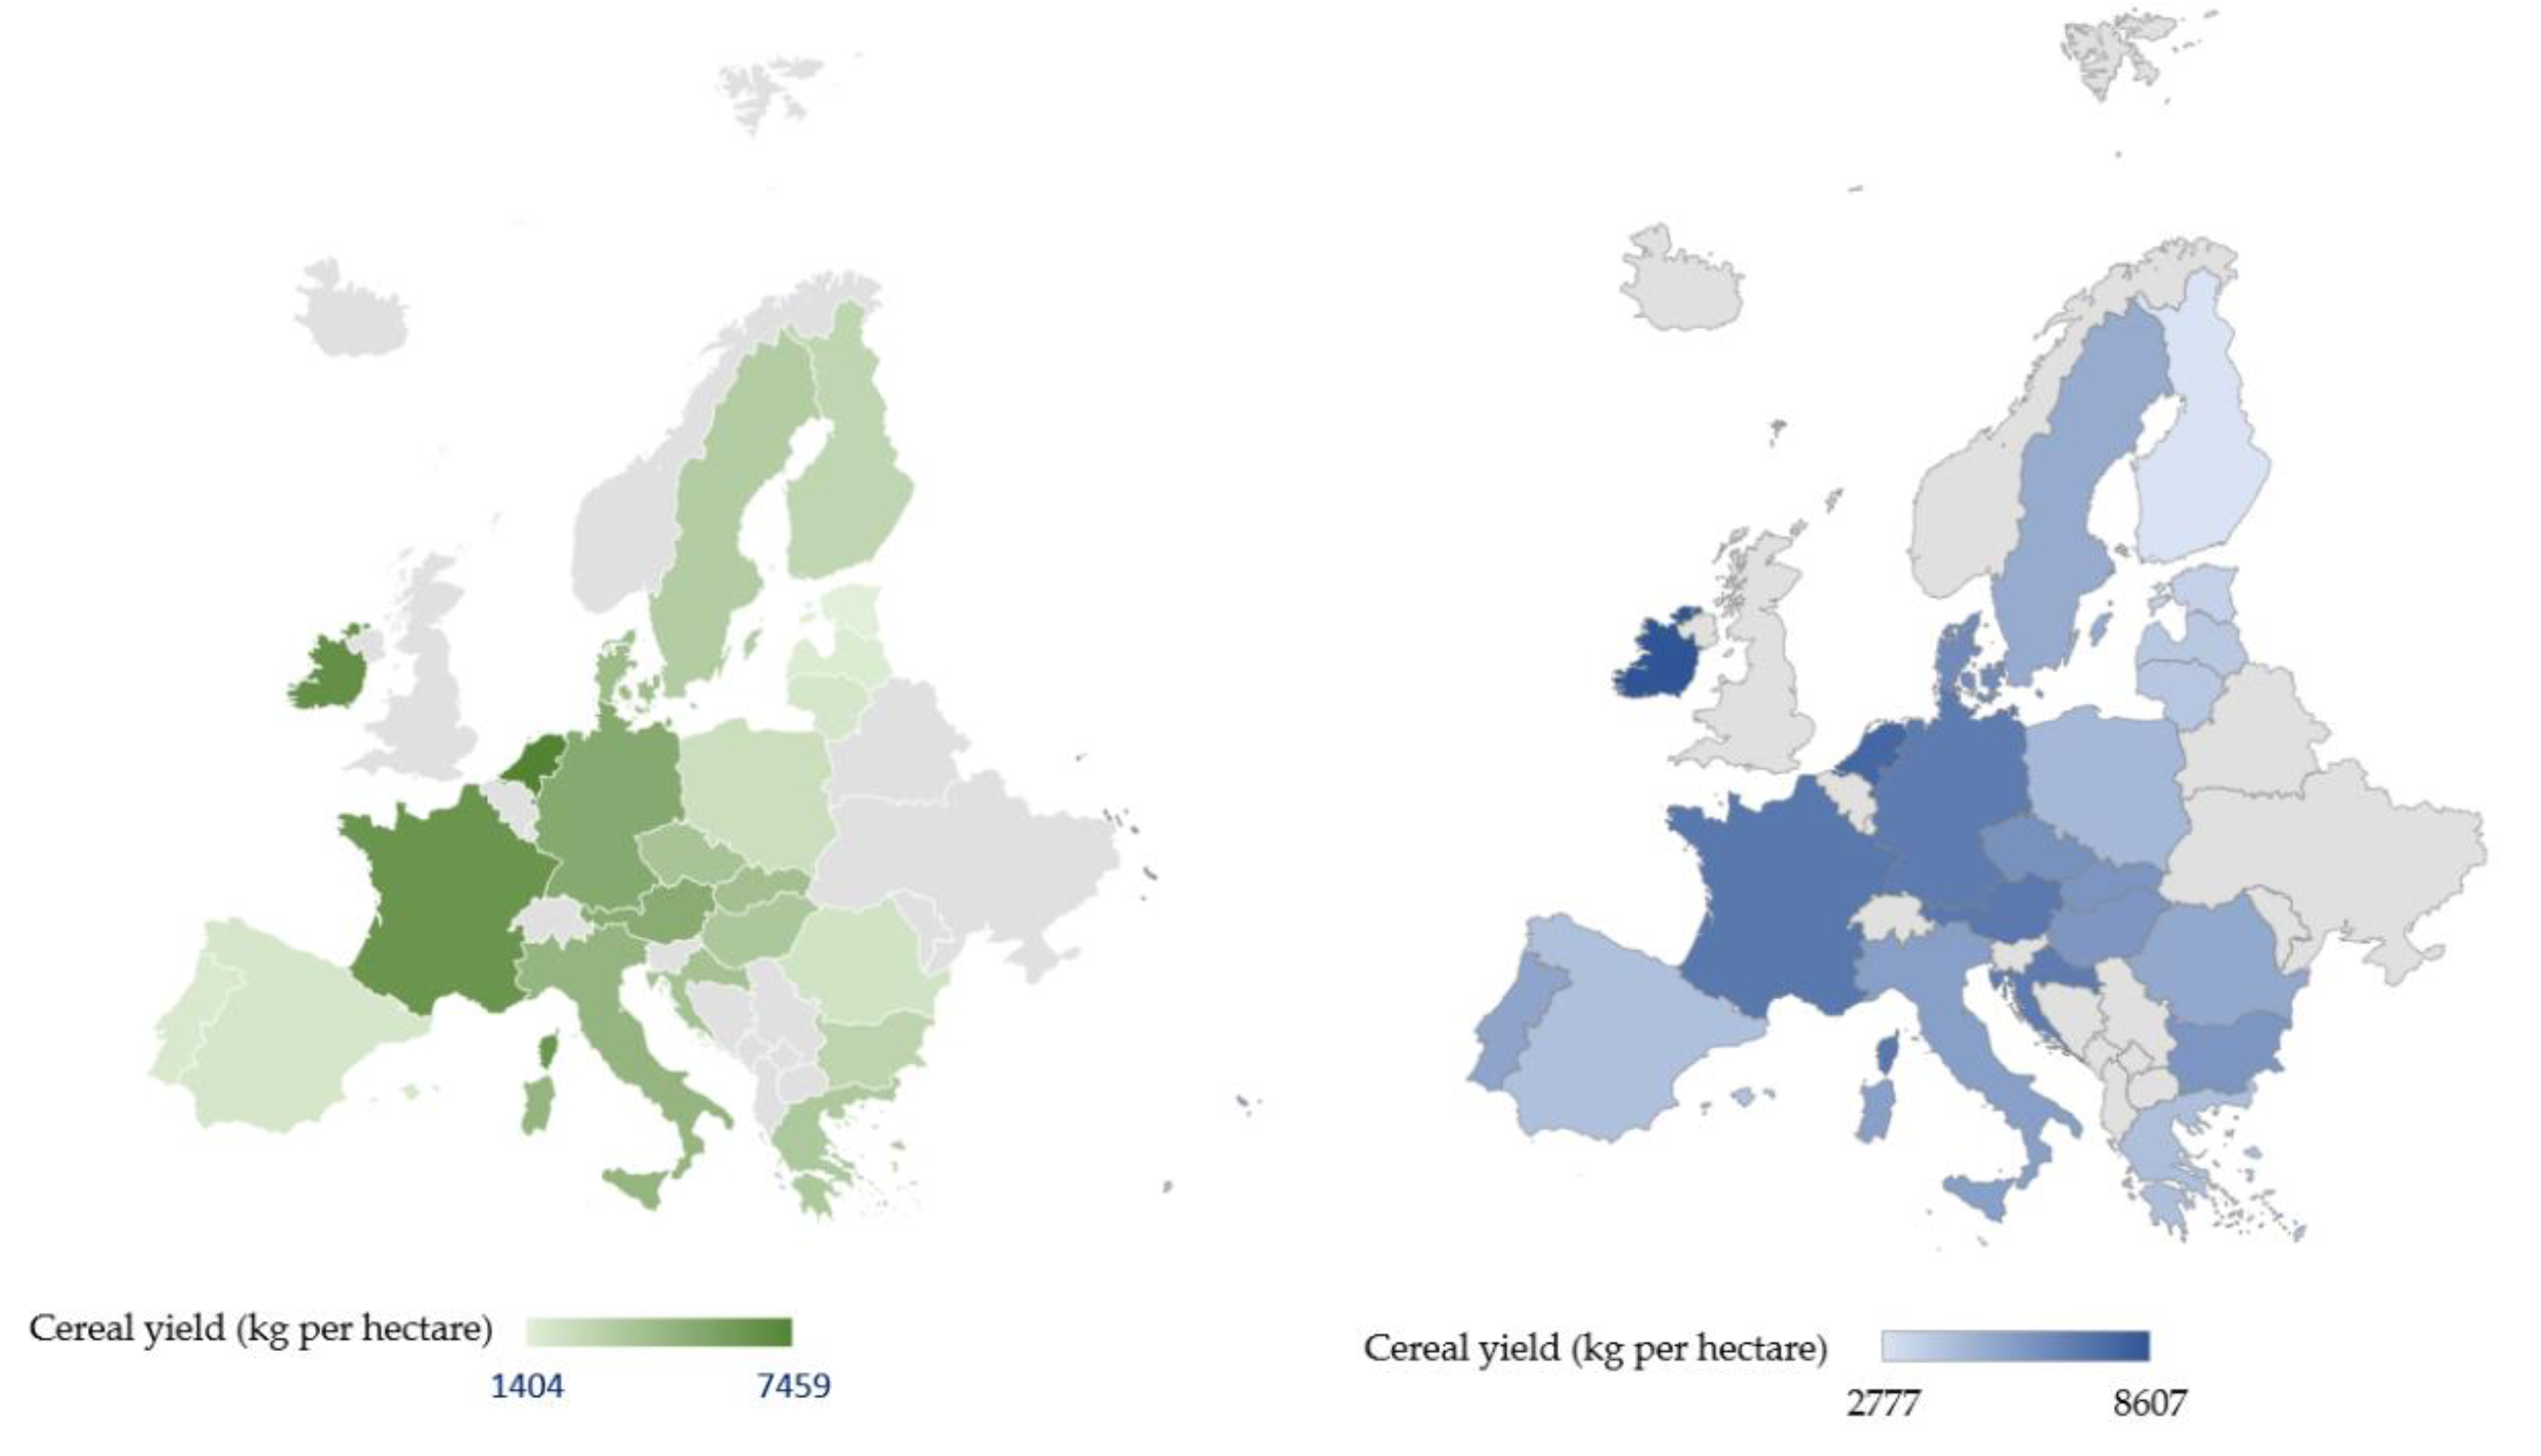
Figure 2.
The relationship between the countries’ cereal yields and the average annual rainfall. Source: FAO Stat.
Figure 2.
The relationship between the countries’ cereal yields and the average annual rainfall. Source: FAO Stat.
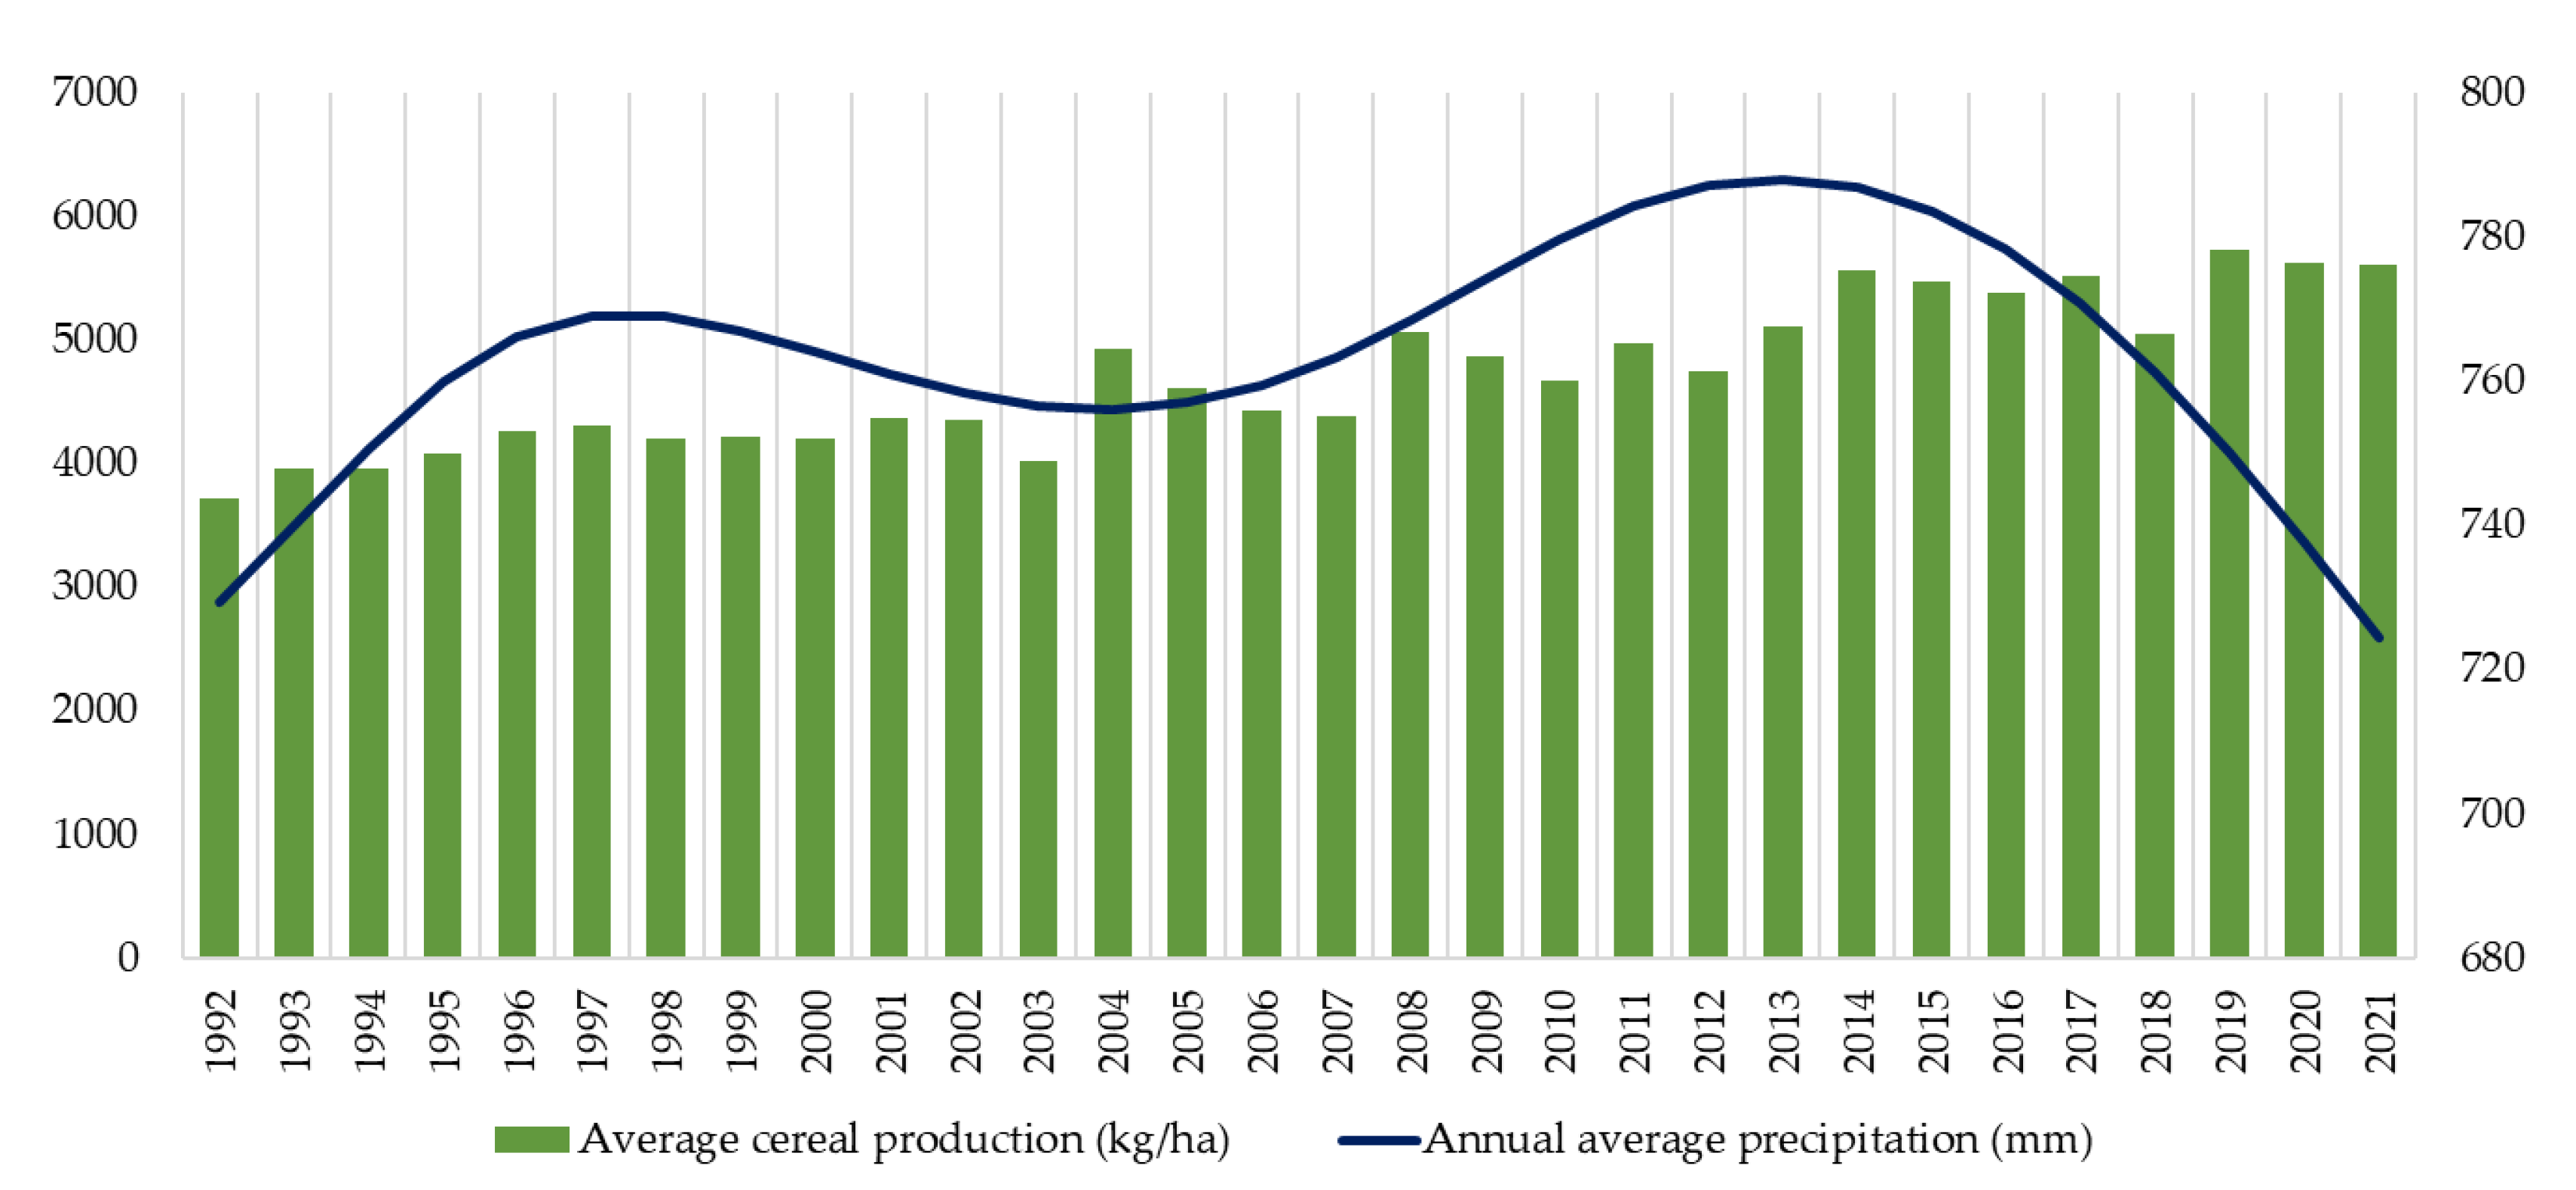
Figure 3.
The relationship between the countries’ cereal yields and the average annual temperature. Source: FAO Stat.
Figure 3.
The relationship between the countries’ cereal yields and the average annual temperature. Source: FAO Stat.
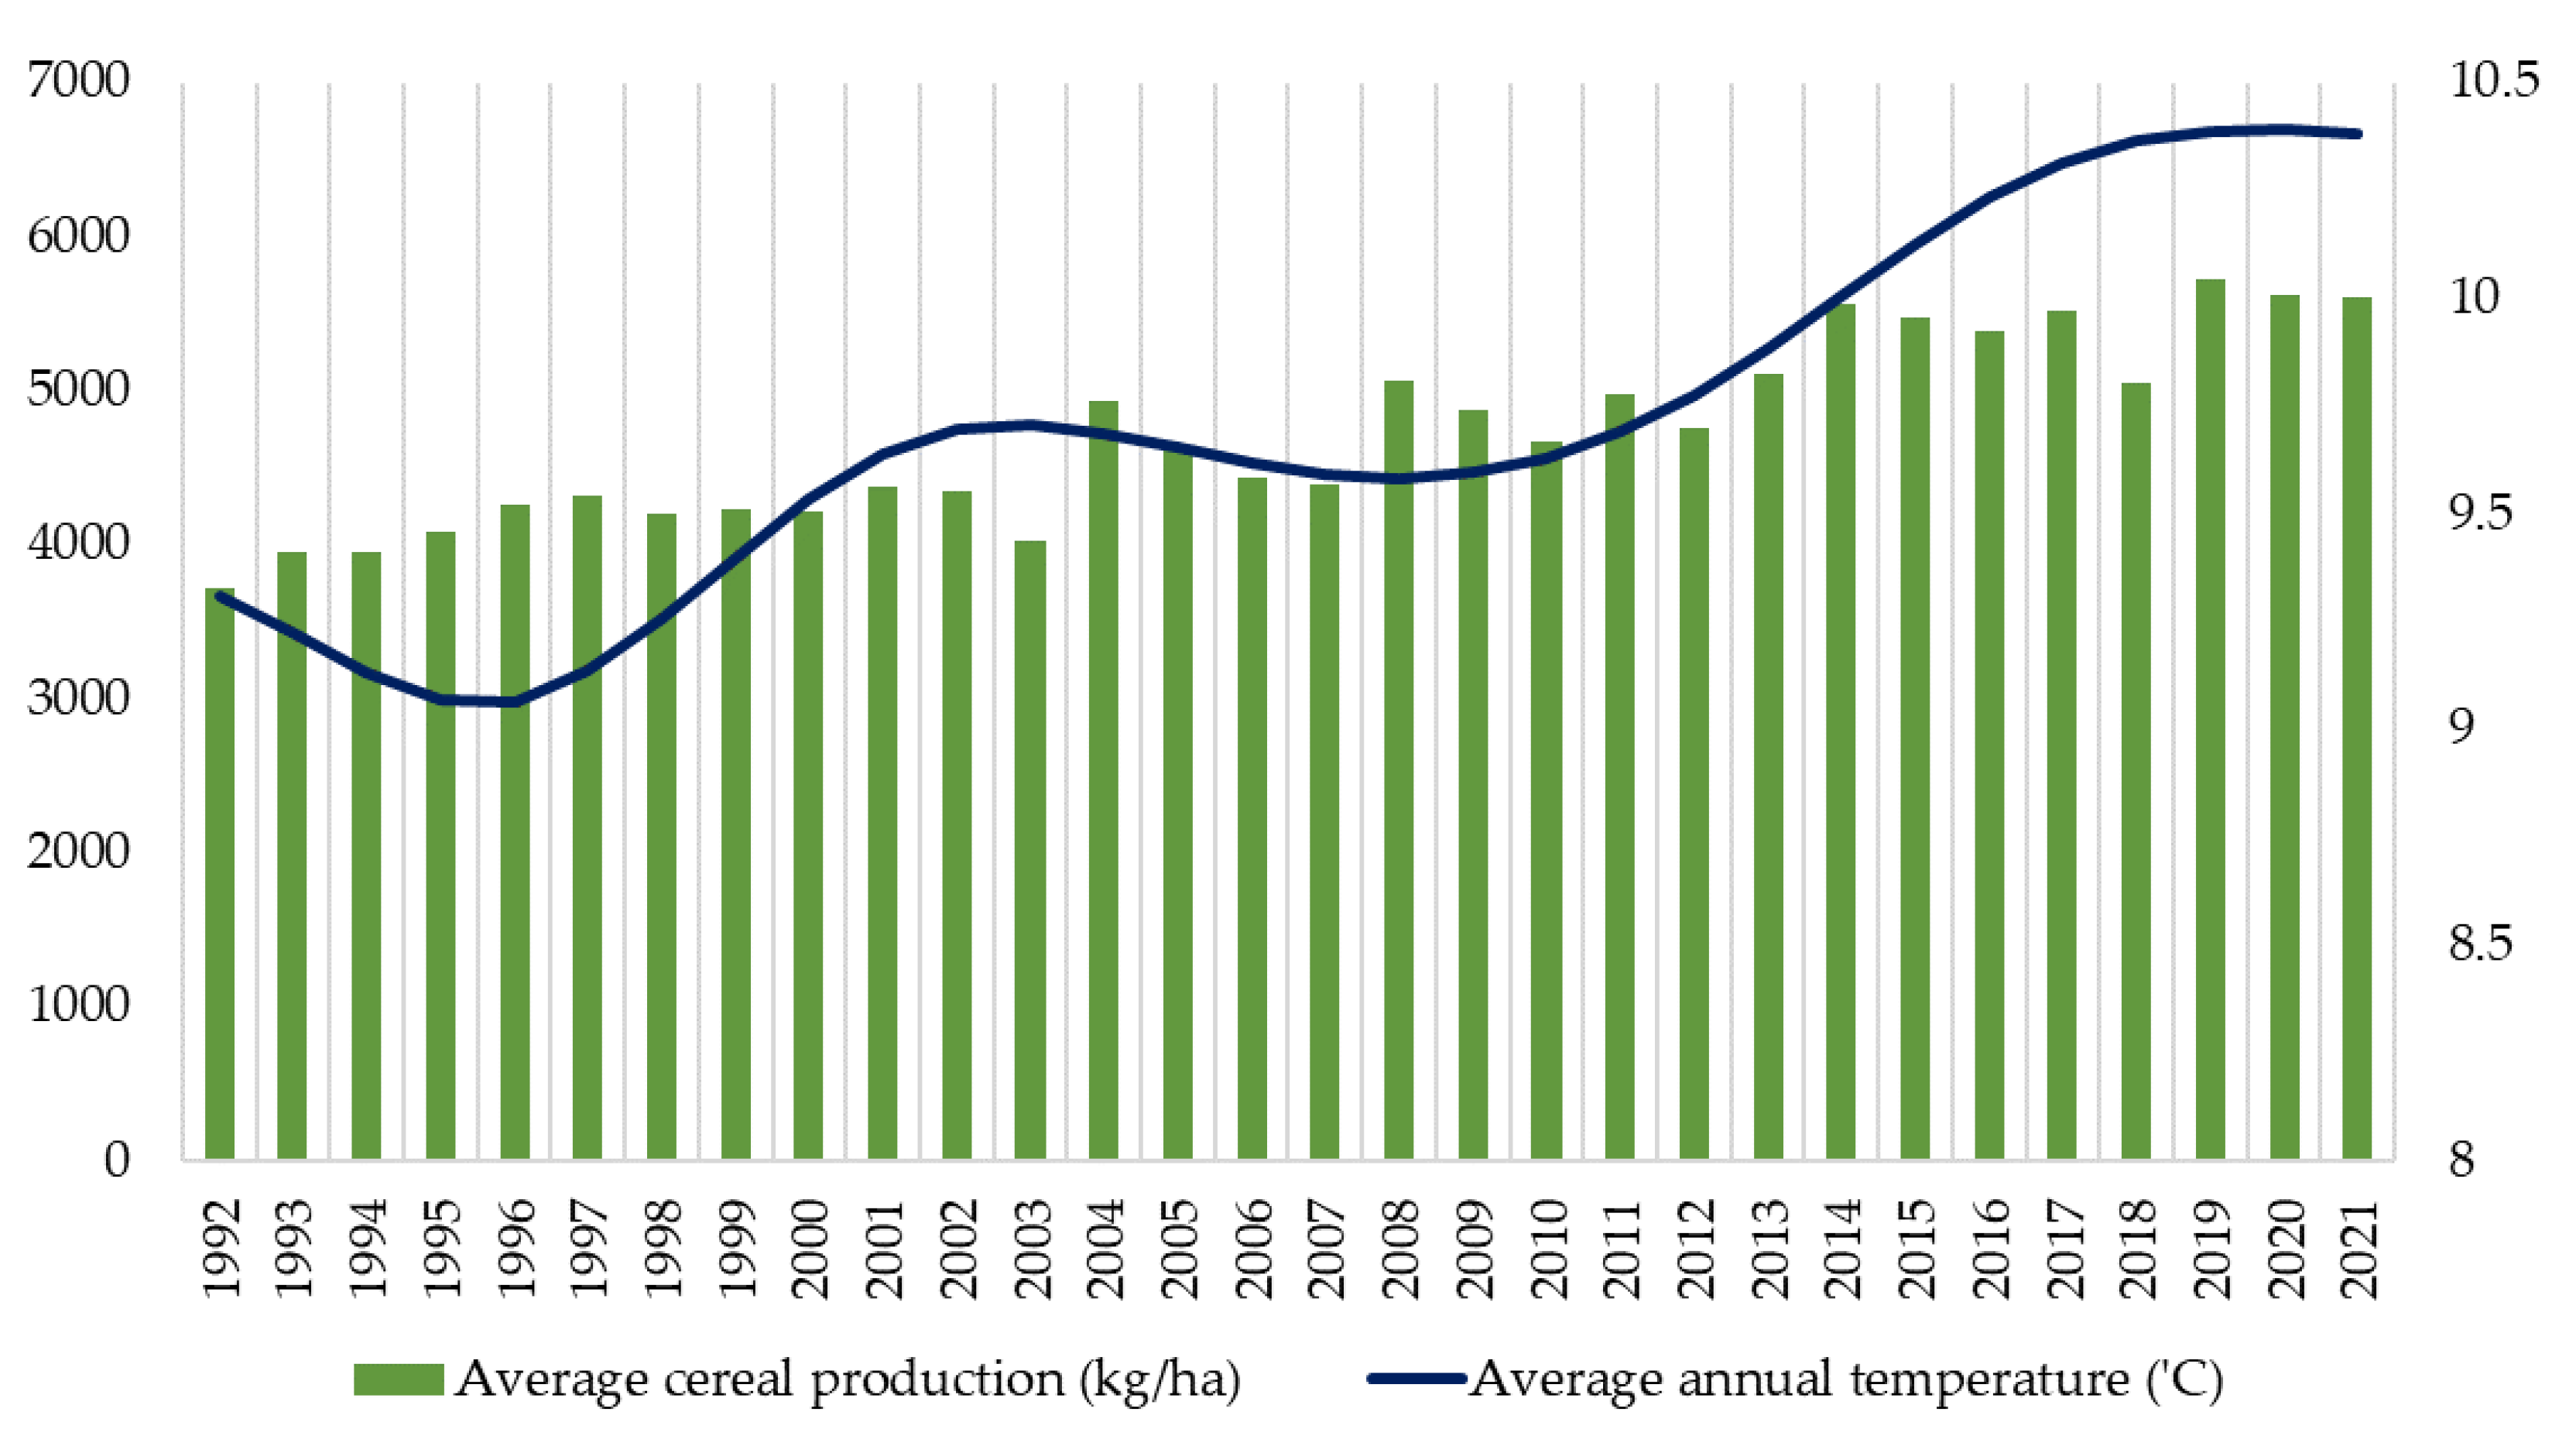
Figure 4.
Projected change in cereal production due to an increase in agricultural energy consumption in the surveyed EU countries.
Figure 4.
Projected change in cereal production due to an increase in agricultural energy consumption in the surveyed EU countries.
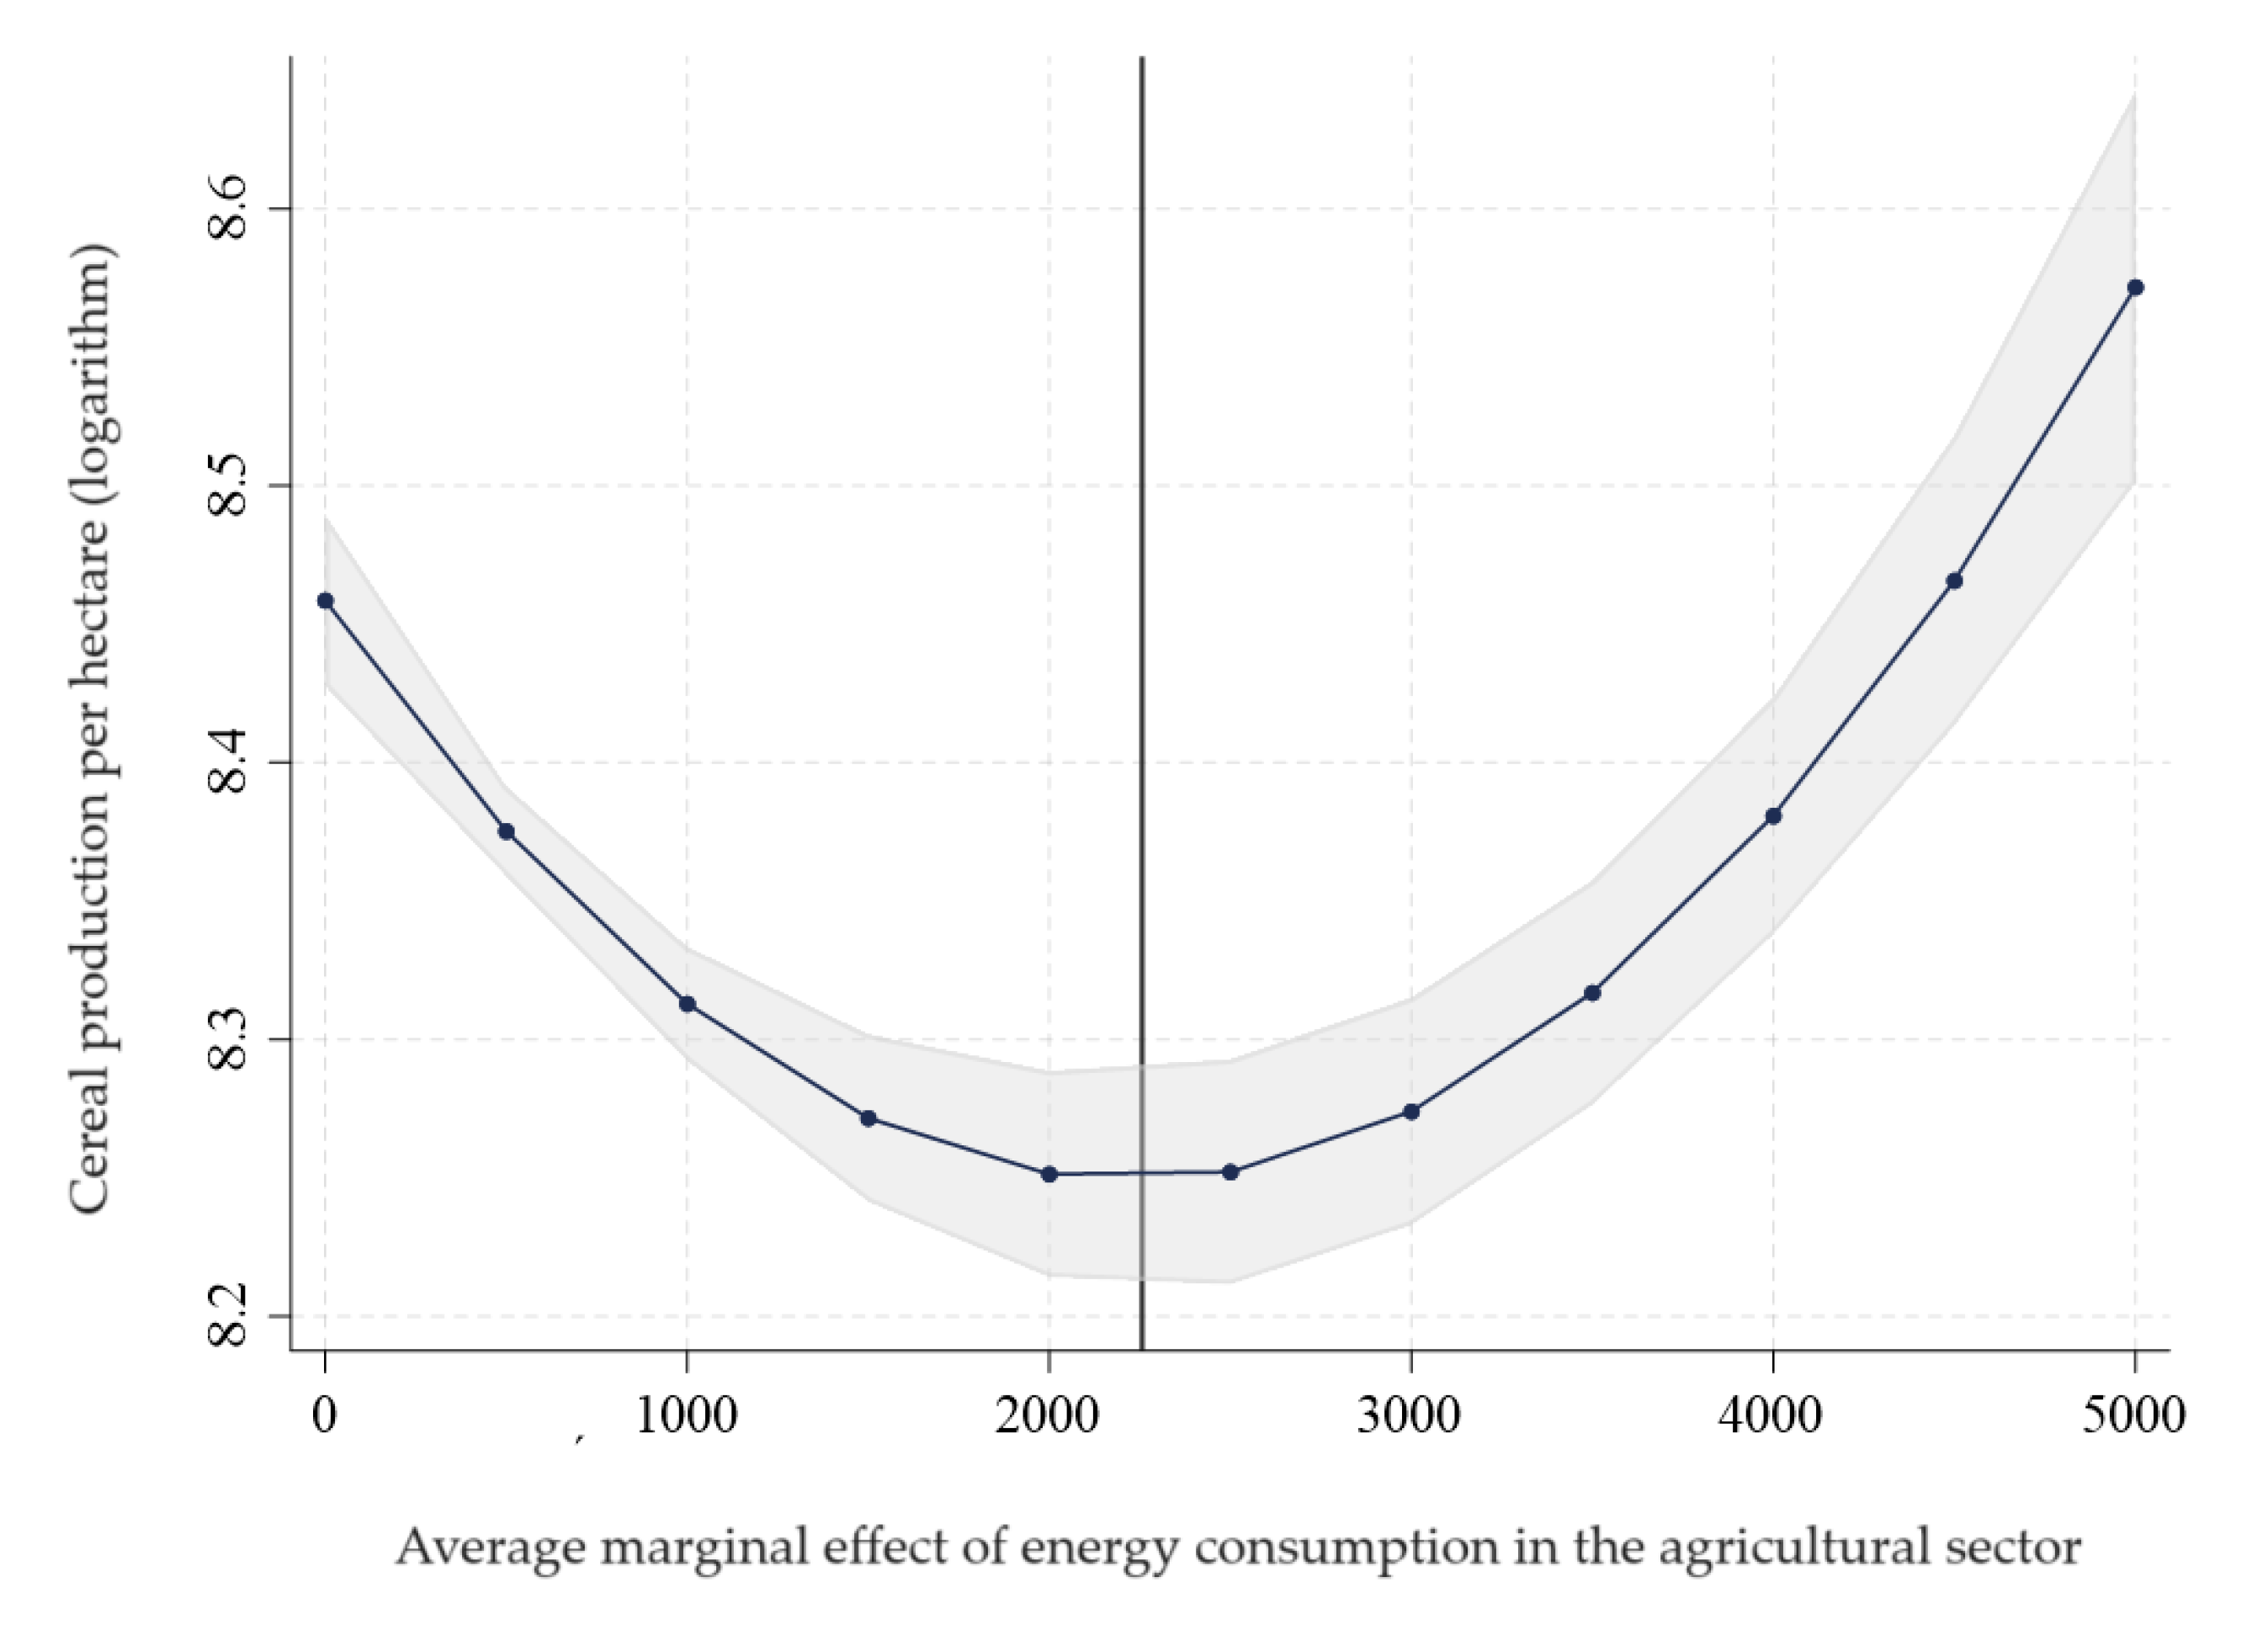
Figure 5.
Projected change in cereal production in the surveyed EU countries due to increased CO₂ emissions.
Figure 5.
Projected change in cereal production in the surveyed EU countries due to increased CO₂ emissions.
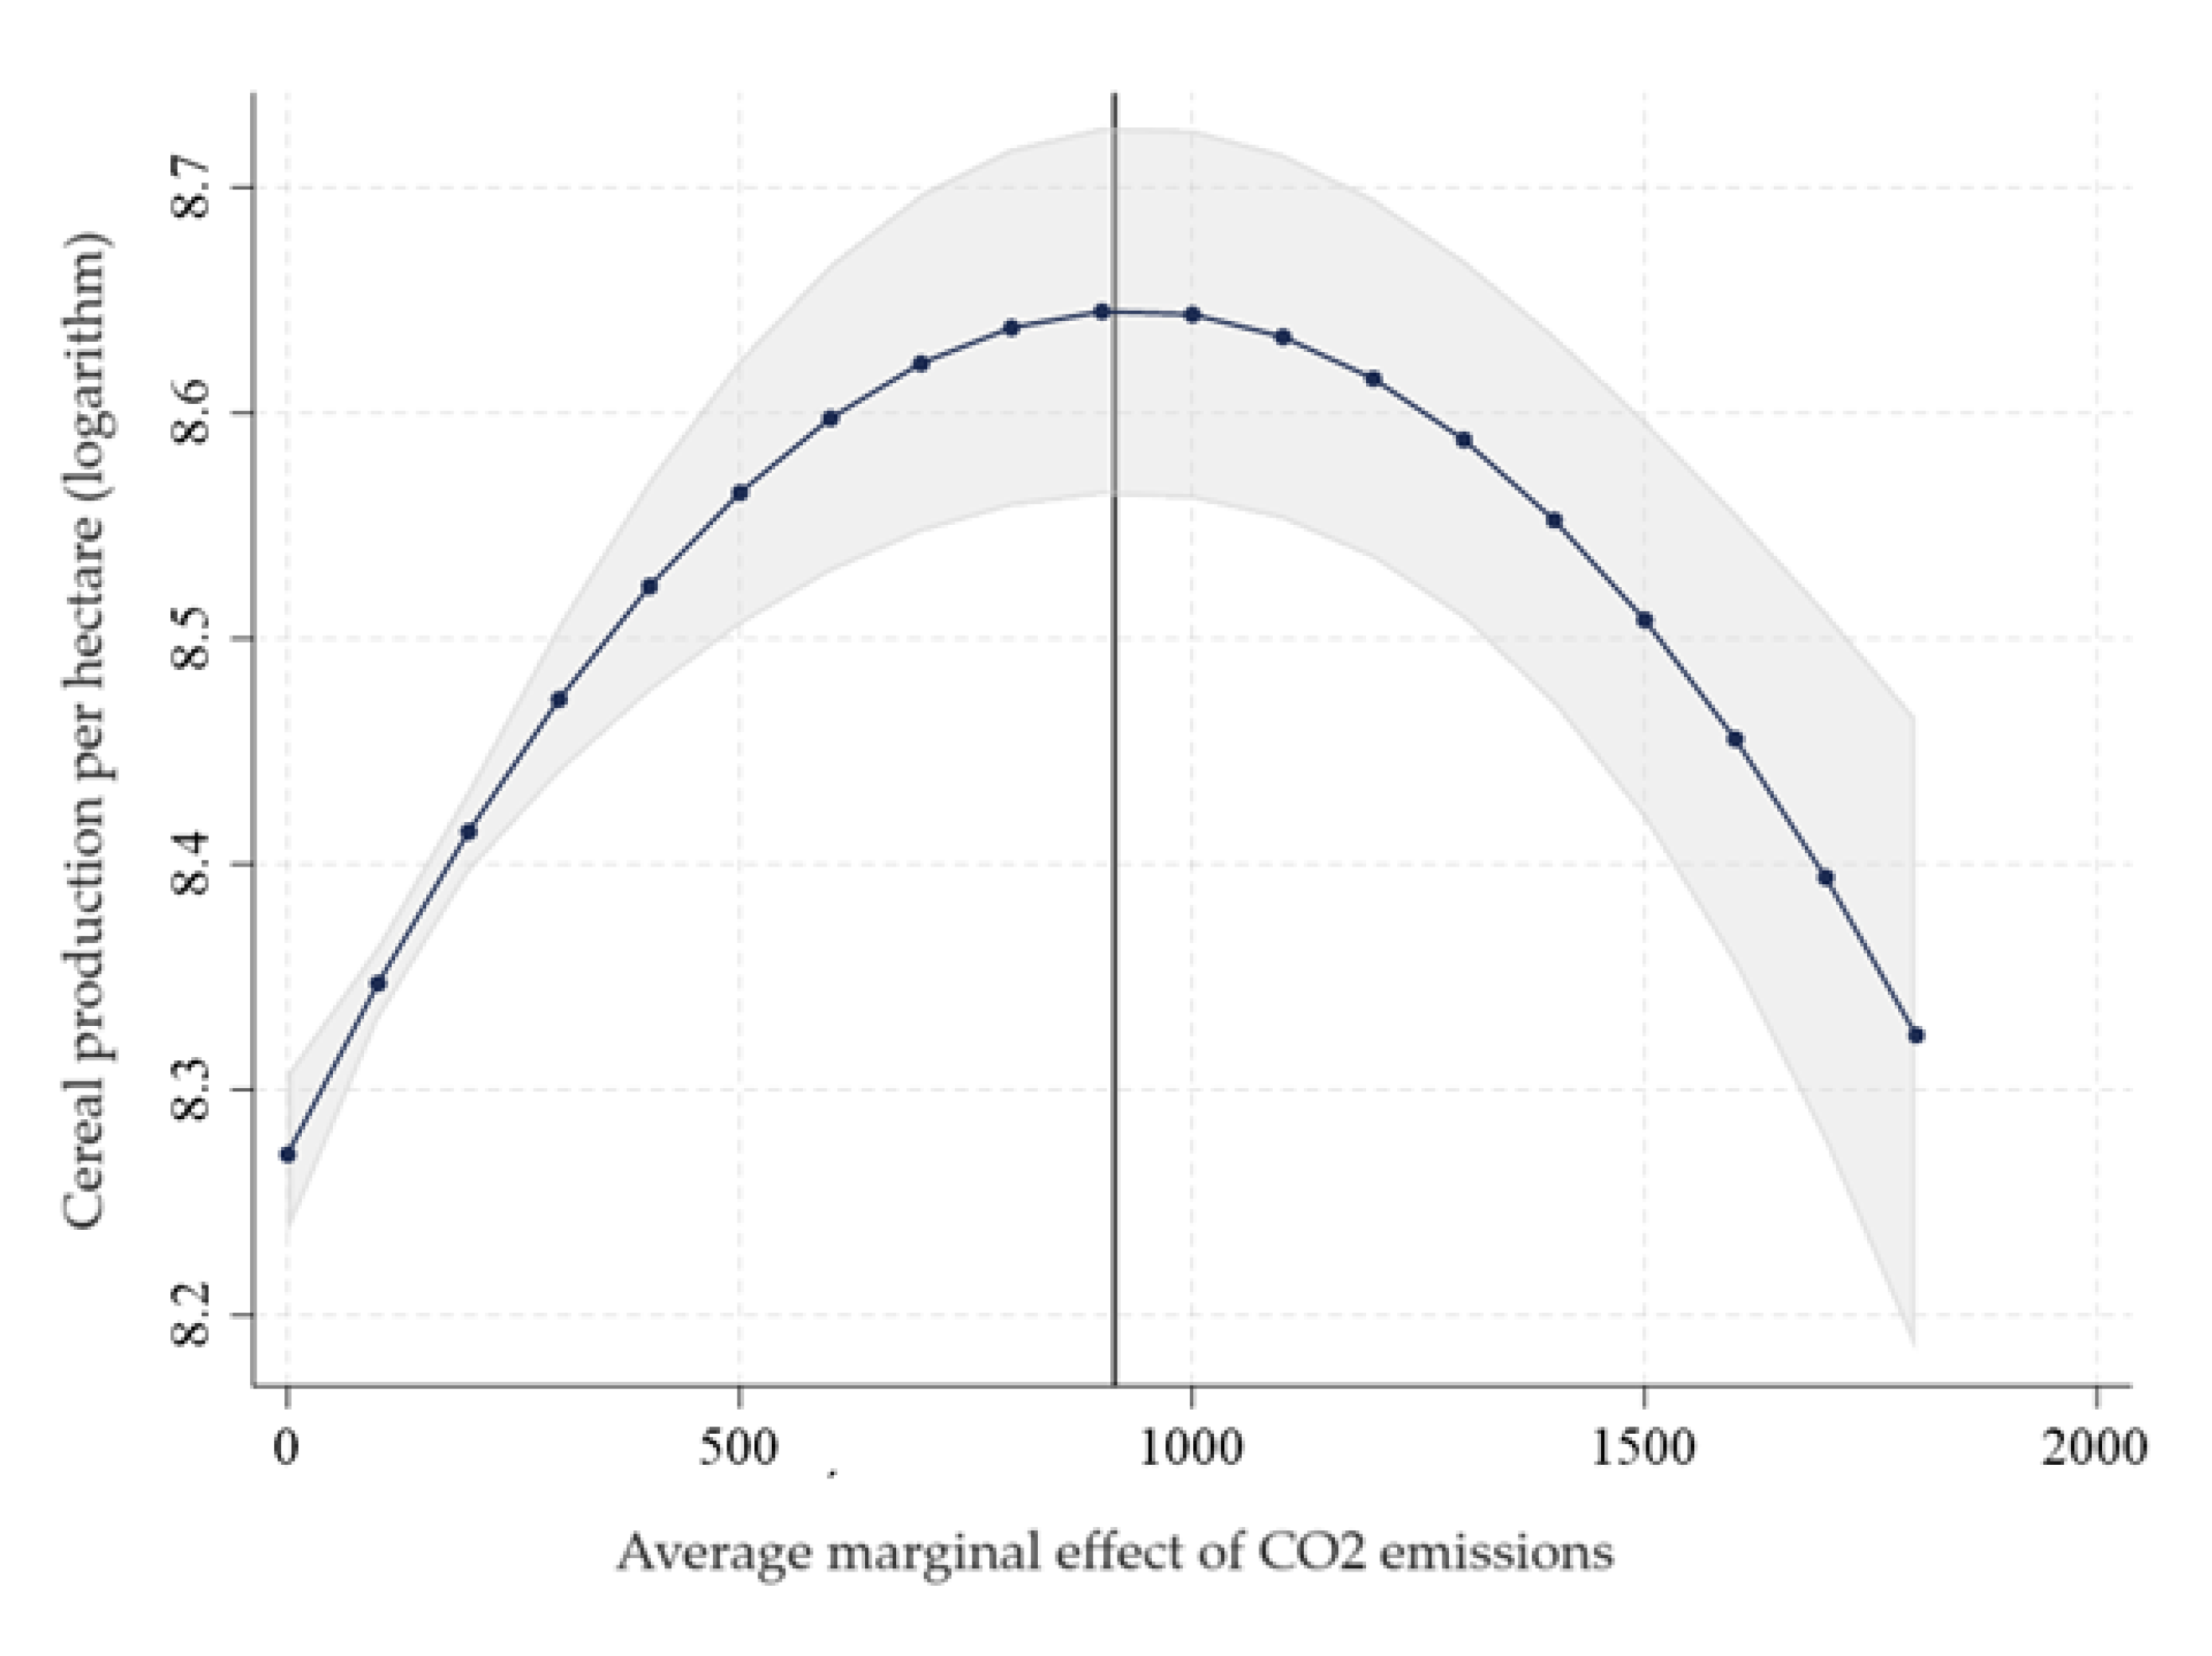
Figure 6.
Projected change in cereal production in the surveyed EU countries due to the increase in the share of renewable energy.
Figure 6.
Projected change in cereal production in the surveyed EU countries due to the increase in the share of renewable energy.
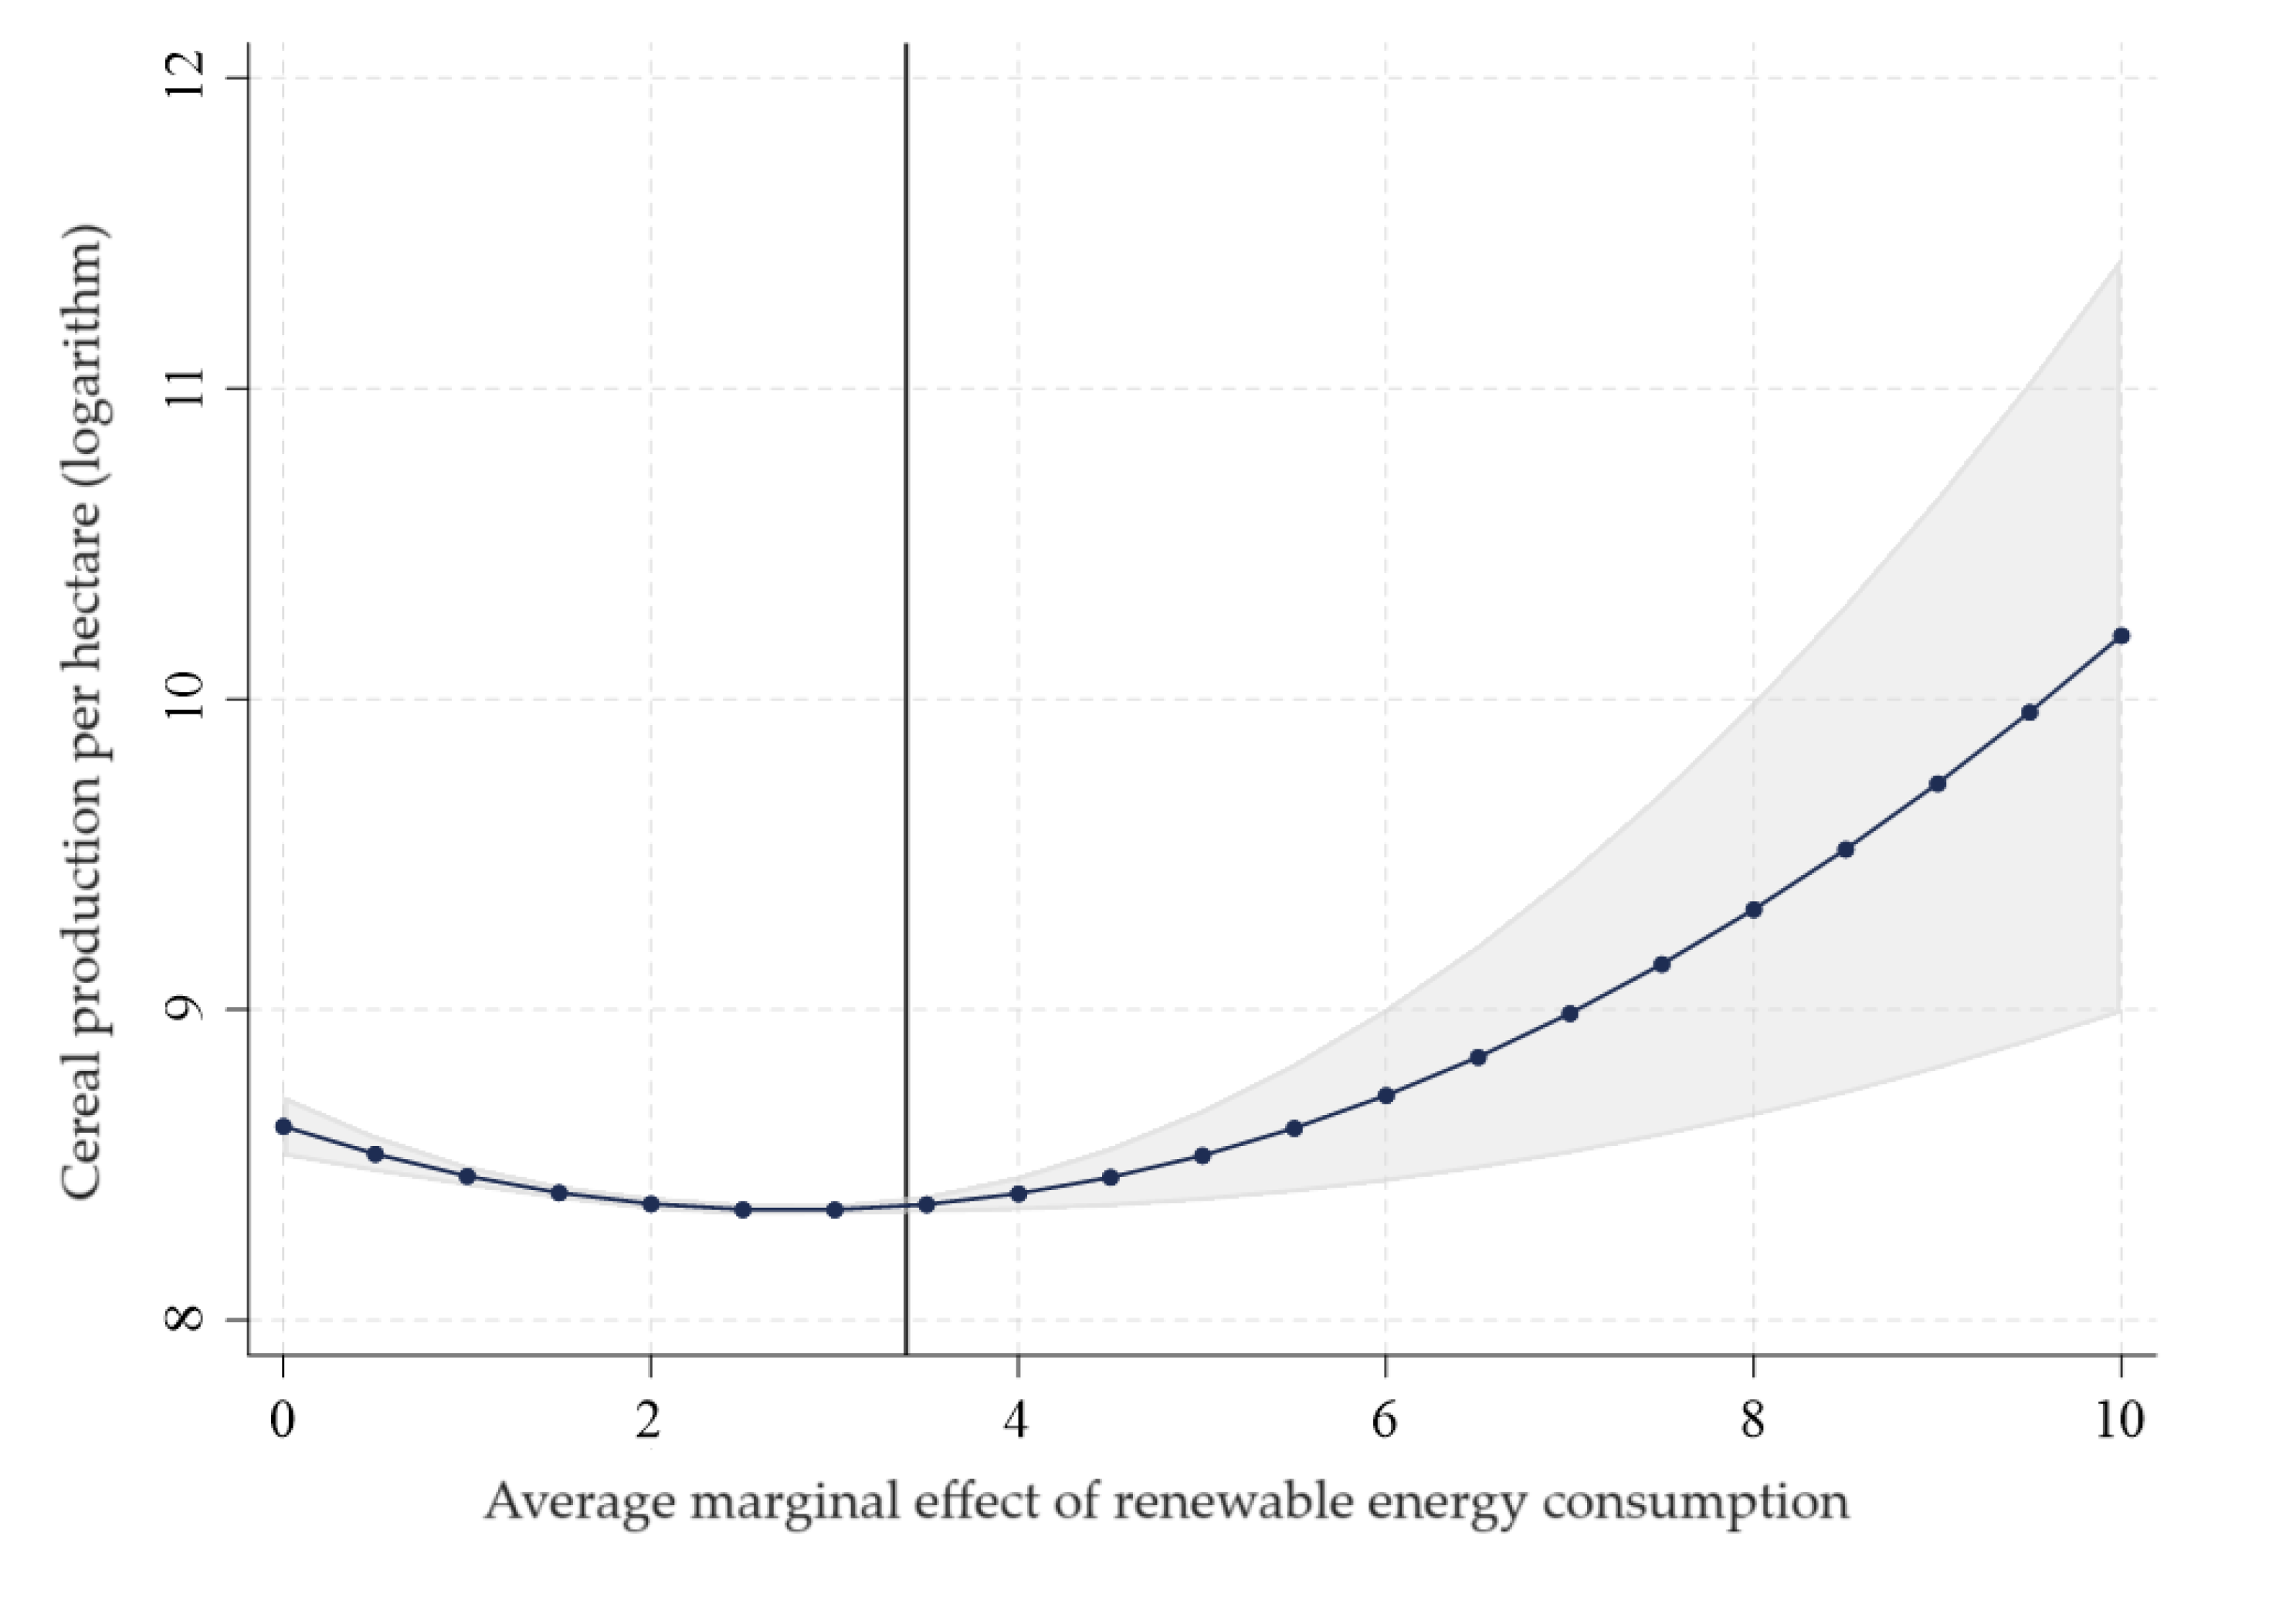
Table 1.
A synthetic review of recent research findings regarding the relationship between cereal production and climatic and economic factors.
Table 1.
A synthetic review of recent research findings regarding the relationship between cereal production and climatic and economic factors.
| Source / Study | Period | Country | Results | Methodology |
|---|---|---|---|---|
| Warsame et al., 2021 [43] | 1985-2016 | Somalia | P(+)→ CP(+) T(+)→ CP(-)razmakCO₂(+)→ CP(+)razmakLCU(+)→ CP(+) | ARDL |
| Chandio et al., 2020 [44] | 1983-2016 | Pakistan | CO₂(+)→ CP(+)razmakEC (+)→ CP (+) | ARDL |
| Chandio et al., 2022 [45] | 1988-2014 | Bangladesh | T(+)→ CP (-)razmakCO₂(+)→ CP(-)razmakLCU→ CP(+)razmakEC→ CP(+)razmakP (+)→ CP(+) | ARDL |
| Nasrullah et al., 2021 [46] | 1973-2018 | South Korea | T(+)→ CP(+)razmakCO₂ (+)→ CP(+)razmakLCU (+)→ CP (+) | ARDL |
| Attiaoui and Boufateh, 2019 [47] | 1975-2014 | Tunisia | P(-)→ CP(-) T(+)→ CP(+) | ARDL |
| Chandio et al., 2021 [48] | 1980-2016 | Turkey | T (+)→ CP(-)razmakCO₂ (+)→ CP(-)razmakLCU (+)→ CP(-) | ARDL |
| Ahsan et al., 2020 [44] | 1971-2014 | Pakistan | CO₂(+)→ CP(+)razmakLCU (+)→ CP(+)razmakEC (+)→ CP(+) | ARDL |
| Ahmed et al., 2023 [49] | 1990-2019 | India | CO₂ (+)→ FP(-)razmakT (+)→ FP(-) | ARDL |
| Chandio et al., 2020 [50] | 1982-2014 | China | CO₂ (+)→ CP(+)razmakT(+)→ CP(-)razmakP(+)→ CP(-)razmakLCU (+)→ CP(-) | ARDL |
| Alehile et al., 2022 [51] | 1990-2020 | Nigeria | T(+)→ CP(-)razmakP(+)→ CP(-) | NARDL |
| Xiang and Solaymani, 2022 [52] | 1969-2018 | Malaysia | T(+)→ CP(-)razmakP(+)→ CP(-)razmakCO₂→ CP(-) | ARDL |
| Kumar et al., 2021 [53] | 1971-2016 | Lower middle-income countries | T(+)→ CP(-)razmakP(+)→ CP(-)razmakCO₂(+)→ CP(+)razmak | FGLS/FMOLS |
| Ogundari and Onyeaghala, 2021 [54] | 1981 - 2010 | African countries | P(+)→ CP (+)razmakT (+)≠ CP(+) | FGLS |
| Onour, 2019 [55] | 1961-2016 | Sudan | CO₂(+)→ CP(+)razmak | ARDL |
| Abbasi, 2021 [56] | 1985-2018 | China | CO₂(+)→ CP(+) | ARDL/VECM |
Note: T - Temperature, P - Precipitation, CO₂ - Carbon dioxide emissions, LCU - Crop area, EC - Energy consumption, CP - Cereal production volume; ARDL - autoregressive distributed lag, NARDL - nonlinear autoregressive distributed lag, VECM - vector error correction model, FMOLS - Fully modified ordinary least squares, (+) - indicates a positive impact, (-) - indicates a negative impact.
Table 2.
Description of the data and variables used in the study.
| Variable | Symbol | Units | Source |
|---|---|---|---|
| Yield (cereal production per hectare) | CP | kg/ha | WDI |
| Area under cereals | LCU | ha | WDI |
| GDP per capita | GDP | Constant USD 2015 | WDI |
| Average annual precipitation | P | mm | EEA |
| Average annual temperature | T | °C | EEA |
| Energy consumption in the agricultural sector | EC | thousand tonnes eq of crude oil | UNFCCC |
| CO₂ emissions | CO₂ | kg per capita | WDI/ UNFCCC |
| Consumption of renewable energy | REW | % of total final energy consumption | WDI |
Source: own study.
Table 3.
Basic descriptive statistics of the variables studied.
| Period | Variable | Mean | Min | Max | SD |
|---|---|---|---|---|---|
| 1992 | CP | 3717.97 | 1403.75 | 7459.17 | 1723.88 |
| 2021 | 5611.95 | 2777.20 | 8606.73 | 1501.72 | |
| 1992 | GDP | 17575.14 | 2857.78 | 40384.45 | 12398.58 |
| 2021 | 31185.66 | 8638.64 | 90590.08 | 20052.35 | |
| 1992 | LCU | 2684077.00 | 180936.30 | 9324911.00 | 2867495.00 |
| 2021 | 2364339.00 | 169719.10 | 9326776.00 | 2669707.00 | |
| 1992 | EC | 1341.81 | 266.51 | 4155.55 | 1253.48 |
| 2021 | 1244.37 | 88.11 | 4270.55 | 1470.98 | |
| 1992 | P | 729.48 | 559.02 | 1165.96 | 172.30 |
| 2021 | 724.52 | 557.29 | 1206.40 | 165.84 | |
| 1992 | T | 9.31 | 2.20 | 15.65 | 3.26 |
| 2021 | 10.38 | 3.04 | 16.46 | 3.39 | |
| 1992 | CO₂ | 223.44 | 39.85 | 1700.19 | 351.13 |
| 2021 | 213.35 | 98.08 | 1637.13 | 320.29 | |
| 1992 | REW | 10.49 | 1.15 | 32.87 | 10.62 |
| 2021 | 26.77 | 10.78 | 58.39 | 12.81 |
Source: own study.
Table 4.
Correlation matrix for the studied variables.
| Variable | CP | GDP | LCU | EC | P | T | CO2 | REW |
|---|---|---|---|---|---|---|---|---|
| CP | 1.000 | 0.653 | -0.038 | 0.257 | 0.504 | 0.182 | 0.424 | -0.192 |
| GDP | 0.653 | 1.000 | -0.116 | 0.245 | 0.330 | -0.180 | 0.354 | 0.073 |
| LCU | -0.038 | -0.116 | 1.000 | 0.450 | -0.401 | 0.186 | -0.318 | -0.110 |
| EC | 0.257 | 0.245 | 0.450 | 1.000 | -0.102 | 0.227 | 0.011 | -0.387 |
| P | 0.504 | 0.330 | -0.401 | -0.102 | 1.000 | 0.275 | 0.581 | -0.048 |
| T | 0.182 | -0.180 | 0.186 | 0.227 | 0.275 | 1.000 | 0.115 | -0.361 |
| CO₂ | 0.424 | 0.354 | -0.318 | 0.011 | 0.581 | 0.115 | 1.000 | -0.388 |
| REW | -0.192 | 0.073 | -0.110 | -0.387 | -0.048 | -0.361 | -0.388 | 1.000 |
Source: own study.
Table 5.
Results of the VIF test to investigate multicollinearity.
| Variable | VIF | 1/VIF |
|---|---|---|
| CO₂ | 2.23 | 0,449 |
| P | 2.19 | 0,457 |
| REW | 1.85 | 0,541 |
| EC | 1.81 | 0,552 |
| GDP | 1.64 | 0,609 |
| LCU | 1.64 | 0,61 |
| T | 1.58 | 0,633 |
| Mean VIF | 1.85 | |
Source: own study.
Table 6.
Cross-section and unit root dependence tests.
| Variable | Pesaran CD | Breusch-Pagan LM | CIPS I(0) | CIPS I(1) |
|---|---|---|---|---|
| CP | 25.91*** | 1162.24*** | -4.980*** | -6.190*** |
| GDP | 32.30*** | 2039.75*** | -1.960 | -3.699*** |
| LCU | 18.32*** | 1396.63*** | 2.360*** | -5.538*** |
| T | 32.23 | 1968.11*** | -2.998*** | -2.232*** |
| P | 53.75*** | 3350.06*** | -1.241 | -4.565*** |
| EC | 42.24*** | 3471.88*** | -2.499*** | -5.133*** |
| CO₂ | 37.03*** | 2056.33*** | -1.789 | -5.797*** |
| REW | 58,31*** | 3749.04*** | -2.645*** | -4.977*** |
Note: *** 1% significance level, ** 5% significance level, * 10% significance level. Source: own study.
Table 7.
Westerlund cointegration and heteroscedasticity tests.
| Test | Statistic |
|---|---|
| Westerlund variance ratio | -2.1617** |
| Breusch-Pagan/Cook-Weisberg test for heteroscedasticity (Chi2) | 11.76*** |
| Cameron & Trivedi’s decomposition of IM-test (Chi2) | 250.14*** |
Note: *** 1% significance level, ** 5% significance level, * 10% significance level. Source: own elaboration.
Table 8.
The results of the FGSL model estimation.
| Variable | Model 1 | Model 2 | Model 3 | Model 4 | Model 5 |
|---|---|---|---|---|---|
| GDP | 0.318*** | 0.3619*** | 0.224*** | 0.314*** | 0.364*** |
| T | 0.163*** | 0.1842*** | 0.085*** | 0.133** | 0.193*** |
| P | 0.585*** | 0.5216*** | 0.446*** | 0.586*** | 0.432*** |
| LCU | 0.041*** | 0.0691*** | 0.040*** | 0.048*** | 0.095*** |
| EC | -0.00019*** | -0.00023*** | |||
| SQEC | 4.21e-08*** | 4.66E-08*** | |||
| CO₂ | 0.587*** | 0.00065*** | |||
| SQCO₂ | -0.041** | -3.85E-07* | |||
| REW | -0.217*** | -0.221*** | |||
| SQREW | 0.032*** | 0.041*** | |||
| Constant | 0.436 | 0.0575 | 0.597 | 0.768 | 0.461 |
| Inflection point | 2256.53 | 914.15 | 3.39 | ||
| R2 | 0.573 | 0.592 | 0.609 | 0.605 | 0.630 |
| Chi2 | 1448.17 | 1013.94 | 1029.86 | 657.91 | 482.92 |
Note: *** 1% significance level, ** 5% significance level, * 10% significance level. Source: own elaboration.
Table 9.
Results of quantile estimation for energy consumption (EC) in the surveyed EU countries.
| Variable | Quantile | ||
|---|---|---|---|
| Q = 0.25 | Q = 0.50 | Q = 0.75 | |
| GDP | 0.411*** | 0.356*** | 0.326*** |
| LCU | 0.110*** | 0.059** | -0.008 |
| P | 0.598*** | 0.512*** | 0.194*** |
| T | 0.192*** | 0.198*** | 0.316*** |
| ECP | -0.00028*** | -0.00022*** | -0.00007 |
| SQECP | 6.01E-08*** | 4.95E-08*** | 1.84E-08 |
| Const | -1.600*** | 0.329 | 3.518*** |
| Turning point | 2329.45 | 2222.22 | |
| Quantile Slope Equality Test | 131.69*** | ||
| Symmetric Quantiles Test | 10.78 | ||
Note: *** 1% significance level, ** 5% significance level, * 10% significance level. Source: own study.
Table 10.
Results of quantile estimation for CO₂ emissions in the surveyed EU countries.
| Variable | Quantile | Variable | Quantile |
|---|---|---|---|
| Q = 0.25 | Q = 0.50 | Q = 0.75 | |
| GDP | 0.267*** | 0.306*** | 0.308*** |
| LCU | 0.088*** | 0.048*** | 0.002 |
| P | 0.668*** | 0.472*** | 0.161*** |
| T | 0.075** | 0.159*** | 0.311*** |
| CO₂ | 0.00095*** | 0.00093*** | 0.00058*** |
| SQCO₂ | -5.32E-07*** | -5.46E-07*** | -3.30E-07*** |
| Const | -0.351 | 1.114** | 3.677*** |
| Turning point | 892.86 | 866.66 | 878.78 |
| Quantile Slope Equality Test | 83.025*** | ||
| Symmetric Quantiles Test | 12.06* |
Note: *** 1% significance level, ** 5% significance level. Source: own elaboration. Source: own study.
Table 11.
Quantile estimation results for the share of renewable energy in agriculture of the surveyed EU countries.
Table 11.
Quantile estimation results for the share of renewable energy in agriculture of the surveyed EU countries.
| Variable | Quantile | ||
|---|---|---|---|
| Q = 0.25 | Q= 0.50 | Q = 0.75 | |
| GDP | 0.317*** | 0.340*** | 0.337*** |
| LCU | 0.080*** | 0.056*** | -0.003 |
| P | 0.710*** | 0.529*** | 0.214*** |
| T | 0.107*** | 0.183*** | 0.324*** |
| REW | -0.220** | -0.272*** | -0.051 |
| SQREW | 0.034*** | 0.046*** | 0.005 |
| Const | -0.630 | 0.722 | 0.856*** |
| Turning point | 3.24 | 2.95 | |
| Quantile Slope Equality Test | 72.83*** | ||
| Symmetric Quantiles Test | 20.07*** | ||
Note: *** 1% significance level, ** 5% significance level, * 10% significance level. Source: own elaboration.
Table 12.
Estimation results for the pooled model (robust testing).
| Variable | Quantile | ||
|---|---|---|---|
| Q = 0.25 | Q= 0.50 | Q = 0.75 | |
| GDP | 0.386*** | 0.354*** | 0.327*** |
| LCU | 0.107*** | 0.086*** | 0.011 |
| P | 0.530*** | 0.489*** | 0.214*** |
| T | 0.167*** | 0.180*** | 0.283* |
| ECP | -0.00030*** | -0.00022*** | -0.00012* |
| SQECP | 6.05E-08*** | 4.57E-08*** | 2.52E-08 |
| CO₂ | 0.000636** | 0.000640** | 0.000416** |
| SQCO₂ | -4.16E-07** | -4.37E-07** | -2.80E-07** |
| REW | -0.2691** | -0.2658*** | -0.0557 |
| SQREW | 0.0473** | 0.0465*** | 0.0036 |
| Const | -0.5128 | 0.4353 | 3.2629*** |
| Quantile Slope Equality Test | 73.22* | ||
| Symmetric Quantiles Test | 16.72 | ||
Note: *** 1% significance level, ** 5% significance level, * 10% significance level. Source: own study.
Disclaimer/Publisher’s Note: The statements, opinions and data contained in all publications are solely those of the individual author(s) and contributor(s) and not of MDPI and/or the editor(s). MDPI and/or the editor(s) disclaim responsibility for any injury to people or property resulting from any ideas, methods, instructions or products referred to in the content. |
© 2024 by the authors. Licensee MDPI, Basel, Switzerland. This article is an open access article distributed under the terms and conditions of the Creative Commons Attribution (CC BY) license (http://creativecommons.org/licenses/by/4.0/).
Copyright: This open access article is published under a Creative Commons CC BY 4.0 license, which permit the free download, distribution, and reuse, provided that the author and preprint are cited in any reuse.


