Submitted:
15 May 2024
Posted:
16 May 2024
You are already at the latest version
Abstract
Constructing an innovation system centered on new-quality productivity is key to achieving China's technological independence and high-quality development, especially against the backdrop of rapid advancements in artificial intelligence. This article utilizes provincial panel data from China spanning 2010 to 2022 and applies kernel density estimation and the Moran's I index to study the spatiotemporal evolution of artificial intelligence and new-quality productivity. The findings indicate a clustering trend in the development of both factors across regions. Causal empirical analysis using a two-way fixed-effects model reveals that artificial intelligence positively influences new-quality productivity, with conclusions validated by robustness and endogeneity tests.
Keywords:
Artificial Intelligence
; New-Quality Productivity
; Kernel Density Estimation
; Moran's I Index
; Two-Way Fixed Effects Model
; Mediation Effect Model
; Spatial Durbin Model
1. Introduction
In September 2023, Xi Jinping first introduced the concept of “new-quality productivity” and emphasized at the Central Economic Work Conference the use of disruptive and frontier technologies to drive industrial innovation, guiding the construction of China’s new economic engine and competitive advantages. New-quality productivity, through technological progress and innovation-driven production process optimization and resource efficiency enhancement, is regarded as a new driver of economic growth and aligns with the new development concept. Against the backdrop of rapid information development, artificial intelligence technology has become key to global economic and technological progress [1,2]. China is also promoting the integration of AI with various industries and strengthening the foundations of scientific and technological innovation, aiming to enhance the capability of “Intelligent+” development.
Since the introduction of the new-quality productivity concept, the volume of research literature has significantly increased. However, due to the novelty of the concept, related academic research is still in its early stages, mainly discussing its definition and impact, with less empirical research and analysis of driving factors. Regarding the connotation of new-quality productivity, Huang Qunhui et al. define it from a systems theory perspective as an “element-structure-function” system, while Zhai Qing and others view it as a multi-dimensional breakthrough in material and spiritual productivity [3,4]. Zhang Lin’s research suggests that new-quality productivity promotes Chinese-style modernization through modern science and technology, economic development, and service to a better life [5]. Hou Guanyu and others believe it is key to promoting high-quality economic development and the equitable distribution of social wealth [6]. Sun Liwei and Wang Ke’s research has preliminarily constructed an evaluation index system and analyzed its spatiotemporal characteristics [7,8]. While these studies provide a foundation, the driving factors and evolutionary trends of new-quality productivity require further exploration.
The rapid development of Artificial Intelligence (AI) is transforming the global economic landscape, particularly demonstrating great potential in promoting new productivity and supporting Sustainable Development Goals (SDGs) [9,10,11,12,13]. AI technology, by optimizing resource allocation, enhancing energy efficiency, and strengthening the intelligence of decision-support systems, effectively supports sustainable urban development. For example, Goralski and Tan [11,14] explored AI’s applications in business and policymaking, emphasizing the importance of management education in cultivating business leaders capable of effectively utilizing AI technology. Meanwhile, Sanchez et al. [15] analyzed AI’s application in urban management, showing how resource allocation optimization and big data analysis enhance urban resilience and sustainability. Additionally, strategically implementing and managing AI technology is key to realizing its potential. Through policy-driven and innovation-driven resource allocation, AI capabilities can be effectively enhanced, thereby supporting economic and social welfare development [16,17]. In addressing complex issues such as environmental protection and social inclusivity, AI’s application transcends technical improvements, focusing on strategic and implementation-level innovations [18,19,20]. Through intelligent data analysis and learning algorithms, AI not only improves production efficiency but also promotes the sustainable use of resources, which is crucial for achieving global Sustainable Development Goals.
Therefore, this study focuses on the relationship between artificial intelligence and the development of new-quality productivity. It first establishes a relevant indicator system to measure new-quality productivity and the development level of artificial intelligence and analyzes their respective spatiotemporal evolution trends. Next, it studies the mechanism through which artificial intelligence empowers the development of new-quality productivity and establishes related models for causal empirical analysis. It also constructs a Spatial Durbin Model to study its spatial spillover effects. Finally, based on the above research, it formulates differentiated new-quality productivity development policies aligned with the development of artificial intelligence.
2. Theoretical Analysis and Research Hypotheses
2.1. Artificial Intelligence and New Quality Productivity
Artificial Intelligence (AI), as the frontier of technological innovation, is gradually reshaping the global productivity structure and significantly promoting the development of new-quality productivity. Through advanced data analysis and learning algorithms, AI not only optimizes production processes and reduces resource wastage but also accelerates market demand forecasting and supply chain adjustments, significantly improving production efficiency [21,22,23]. Moreover, the application of AI promotes product and service innovation, shortens R&D cycles, reduces costs, and facilitates the implementation of personalized market strategies [24]. In terms of environmental protection and resource management, AI helps businesses transition to a low-carbon economy [25]. These comprehensive effects not only drive industrial upgrading and technological integration but also provide new momentum for the sustainable development of the global economy, reflecting AI’s key role in promoting the development of new-quality productivity .Based on the aforementioned theoretical analysis, the following hypotheses are proposed:
H1: The development of artificial intelligence has a significant positive empowering effect on the development of new-quality productivity.
2.2. Mechanisms of Artificial Intelligence on the Development of New Quality Productivity
The rapid development of artificial intelligence significantly enhances the level of research and development innovation and promotes the upgrading of industrial structures. The interaction of these two factors provides a strong impetus for the development of new-quality productivity. In R&D, artificial intelligence, through machine learning and big data analysis, enables enterprises to discern complex patterns, predict future trends, and optimize the innovation process, thereby shortening the development cycle of new products and improving the success rate of R&D [26]. Additionally, the application of AI promotes the automation and intelligence of production processes [27], enhancing the technological level of industries, transforming the original industrial structure, and promoting the development of high-value-added industries. The dual drive of R&D innovation and structural upgrading powered by artificial intelligence constructs a more efficient and sustainable productivity system, fundamentally promoting the development of new-quality productivity. Based on the above theoretical analysis, the following hypothesis is proposed:
H2: The development of artificial intelligence can significantly improve the level of R&D innovation and promote industrial structure upgrading, thereby empowering the development of new-quality productivity.
2.3. Spatial Spillover Effects of Artificial Intelligence Development on Adjacent Regions’ New Quality Productivity
When the level of artificial intelligence in a certain region is high, its innovative achievements and advanced technologies will spread to neighboring areas through various channels such as cooperative projects, academic conferences, and industry exhibitions, thereby enhancing the technological capabilities and innovation activities of enterprises in the surrounding areas [28], and promoting the development of their new-quality productivity. Additionally, the development of AI in that region will also promote talent cultivation and mobility [29], drive capital flow between regions, provide financial support and expansion opportunities for industries in neighboring areas, strengthen regional economic connections, and offer possibilities for industrial upgrading in less technologically advanced areas. Based on the above theoretical analysis, the following hypothesis is proposed:
H3: The development of artificial intelligence has a significant spatial spillover effect on the new-quality productivity of neighboring regions.
3. Model Design and Variable Description
3.1. Model Specification
3.1.1. Kernel Density Estimation
To visually depict the absolute differences in the levels of artificial intelligence development and new quality productivity development among regions over the sample period, this study employs kernel density estimation to describe the absolute difference variations and their dynamic evolutionary trends. The specific expression is as follows:
Where K(⋅) represents the kernel density function, describing the weight of all sample points within the y neighborhood, and h represents the bandwidth of kernel density estimation. This study employs the optimal bandwidth selection method to confirm h and utilizes a Gaussian kernel function to estimate the difference between regional levels of artificial intelligence development and new quality productivity development. The specific expression is as follows:
3.1.2. Moran’s Index
To more accurately reflect the homogeneity and heterogeneity of the development levels of artificial intelligence and new-quality productivity across Chinese provinces, this article uses the Moran’s I index as a measurement tool. The Moran’s I index includes two forms: the global spatial autocorrelation Moran’s I index and the local spatial autocorrelation Moran’s I index. The global spatial autocorrelation Moran’s I index shows the similarity in development levels among neighboring provinces, and its expression is as follows:
Where is the observed value of province i, is the average value of all provinces in the country, n is the number of provinces, is the spatial weight matrix, and is the aggregation of all spatial weights, denoted as:
The value of the spatial weight matrix is determined by the following equation:
When the global Moran’s Index is 0 or not significant, the local Moran’s Index can reflect whether the indicator exhibits spatial clustering or dispersion effects locally. The local Moran’s Index is represented by the following formula:
When exhibits aggregation effects in space, indicates discrete effects in space.
3.1.3. Benchmark Regression Model
To examine the impact of artificial intelligence on new quality productivity, we first construct the following benchmark regression model:
Where i is the city and t is the year; is the coefficient of focus, i.e., the regression coefficient of the independent variable; is the set of control variables; is the constant term of the equation; is the province fixed effect, is the time fixed effect, and denotes the random error term.
3.1.4. Mediation Effect Model
To investigate how the development level of artificial intelligence influences new-quality productivity, this paper constructs the following mediation effect model equations:
Where M represents the mediating variable, specifically including research and development innovation level (RDi) and industrial structure upgrading (Inds).
3.1.5. Spatial Durbin Model
To investigate the spatial spillover effects of artificial intelligence on new quality productivity further, a spatial econometric model is constructed. Traditional models include the Spatial Durbin Model (SDM), Spatial Autoregressive Model (SAR), and Spatial Error Model (SEM), with formulas as follows:
Among them, W is an n×n dimensional spatial weight matrix, while K, ρ, and φ represent spatial autoregressive coefficients.
3.2. Variable Description and Measurement
3.2.1. Dependent Variable
In sharp contrast to traditional productivity, new quality productivity takes innovation as the leading role, breaking away from the conventional economic growth mode and the development path of productivity. It represents an advanced productivity characterized by high technology, high efficiency, and high quality. Therefore, this study constructs an evaluation indicator system for new quality productivity based on its three features. The specific indicator evaluation system is detailed in Table 1.
3.2.2. Core Explanatory Variables
This study considers the level of development of artificial intelligence as the core explanatory variable. Currently, there is relatively little research on the measurement of artificial intelligence both internationally and domestically, and a unified measurement standard has not yet been established. In academia, measurement methods include the use of the number of artificial intelligence patents, the quantity of industrial robots, the scale of artificial intelligence applications, and multidimensional artificial intelligence evaluation indicator systems. The number of artificial intelligence patents also involves issues related to the conversion of patent achievements. Therefore, this study aims to analyze the characteristics of artificial intelligence development and employ a multidimensional evaluation indicator system for measurement. The specific evaluation indicator system is detailed in Table 2.
The new quality productivity, driven by innovation, emphasizes the promotion of quality with novelty and the pursuit of novelty with quality. Artificial intelligence, as an innovative mode of production, transforms and upgrades various links of production, exchange, distribution, and consumption, thereby meeting people’s pursuit of a high-quality life from the supply side. Therefore, this study integrates the characteristics of new quality productivity and the development of artificial intelligence, drawing on the research of Lu Jiang et al. [30], and employs the entropy-weighted TOPSIS method based on AHP improvement to measure the development level of new quality productivity and artificial intelligence.
3.2.3. Control Variables
To minimize the bias caused by omitted variables, this paper further controls for a series of variables that influence new-quality productivity. Based on the environmental STIRPAT model and the Kaya formula, the following control variables are selected:
- Labor Level: Represented by the natural logarithm of the number of employed persons.
- Degree of Openness: Calculated as (calculated by multiplying the total amount of import and export of goods by the exchange rate of the U.S. dollar to the Chinese yuan” divided by “calculated by the gross regional product”.
- Level of Government Intervention: Represented by the proportion of general budgetary expenditure in the regional GDP.
- Urbanization Level: Measured by the proportion of urban population in the total population.
- Technology Market Development Level: Indicated by the proportion of technology market turnover in the regional GDP.
3.2.4. Mediating Variables
To explore the internal impact mechanism of artificial intelligence on new-quality productivity, this paper selects R&D technology innovation and industrial structure upgrading as mediating variables. Firstly, R&D technology innovation is measured by the Regional Innovation Capacity Index of China, compiled jointly by the China Science and Technology Development Strategy Research Group, the University of the Chinese Academy of Sciences, and the China Innovation and Entrepreneurship Management Research Center. This index in the regional development evaluation report establishes a four-level indicator system with 5 primary indicators, 20 secondary indicators, and 138 basic indicators, fully reflecting the performance of various regions in enterprise innovation, basic research and original innovation, innovation systems, etc. Secondly, for industrial structure upgrading, following the approach of Wang Guohua et al. [31], the ratio of the added value of the tertiary industry to the added value of the secondary industry is used as a measure.
3.3. Sample Selection and Data Sources
Due to the difficulty of data acquisition and the issue of sample comparability, this paper excludes Tibet Autonomous Region, Hong Kong Special Administrative Region, Macao Special Administrative Region, and Taiwan Province from China. The difficulty in obtaining data or severe data gaps in these regions could lead to significant biases in the analysis results. Therefore, the research sample includes the other 30 provinces and cities in China, covering the period from 2010 to 2022. The sample data primarily come from the “China Statistical Yearbook,” “China City Statistical Yearbook,” “China Environmental Statistical Yearbook,” “China Industrial Statistical Yearbook,” “China Science and Technology Statistical Yearbook,” and “China Energy Statistical Yearbook,” as well as various provincial (regional, municipal) statistical yearbooks and the national (local) bureaus of statistics and intellectual property.
For missing data in certain years for some provinces and cities, interpolation methods are used to supplement the data. The study conducted a descriptive statistical analysis of the main variables (see Table 3). The results show that the maximum value of artificial intelligence development level is 0.8981, indicating significant room for improvement. Meanwhile, the highest level of new-quality productivity development reaches 0.9515, which may be attributed to technological innovation, policy support, a vibrant innovation ecosystem, and ample talent resources.
4. Spatial Evolution Analysis Based on Kernel Density and Moran’s Index
4.1. Kernel Density Estimation Analysis
This paper utilizes the Kernel density estimation method to explore the spatial dynamic evolution trends of artificial intelligence development levels and new-quality productivity across China’s 30 provinces (regions, cities). The analysis is conducted by observing the peak, skewness, and symmetry of the density distribution diagrams.
The development levels of artificial intelligence in Figure 1(a) and new-quality productivity in Figure 1(b) exhibit similar trends on the kernel density function. From 2010 to 2022, the kernel density curves of both show the main peak moving to the right, indicating an overall improvement in their core levels. Particularly in 2022, the kernel density function images of the two are very similar, suggesting that there is likely some correlation between the development of the two.
From Figure 2, it can be observed that the development levels of artificial intelligence and new-quality productivity exhibit similar trends. In 2022, the kernel density curves for the development of national artificial intelligence and new-quality productivity initially rise and then fall, indicating that the development levels of artificial intelligence and new-quality productivity in most regions are increasing, with a favorable development waveform. Regarding the distribution shape of the main peak, the height of the peak within the sample period fluctuates, initially rising and then falling. Overall, the main peak decreases and widens, and the kernel density curve flattens, implying that the dispersion of the development levels of artificial intelligence and new-quality productivity across Chinese regions is in a fluctuating state and tends to be more dispersed. The symmetrical extension and long tail phenomenon indicate that in some regions, such as Beijing and Shanghai, which are rich in research resources, abundant, and talent-intensive, the development levels of artificial intelligence and new-quality productivity far exceed those in other regions.
4.2. Moran’s Index Analysis
4.2.1. Global Moran’s Index
To reflect the changes in the global Moran’s I index for the development levels of artificial intelligence and new-quality productivity in China from 2010 to 2022, the article has drawn the annual Moran’s index table (Table 4) and a line chart (Figure 3).
According to Table 4, the global Moran’s I index values for the development levels of artificial intelligence and new-quality productivity are both significantly positive after 2015 and have passed the 5% significance level test. This indicates that there is a certain degree of spatial clustering for artificial intelligence and new-quality productivity levels. In other words, regions with higher levels of artificial intelligence and new-quality productivity tend to have neighboring regions with similarly high levels of artificial intelligence and new-quality productivity.
According to Figure 3, in the early stages, the development of artificial intelligence did not show significant spatial clustering effects. This could be due to the fact that the application of artificial intelligence spans multiple industries and fields, leading to its diverse nature and resulting in a random spatial distribution rather than concentration in specific regions. In recent years, with the government actively promoting the development strategies of high-tech industries and innovation-driven growth, China’s artificial intelligence and new-quality productivity have begun to show more pronounced clustering effects. This change is due to policy support, capital investment, and the focused development of the next-generation information technology industry, especially artificial intelligence, which has led to the concentration of resources and talent in specific regions like Beijing, Shanghai, and Shenzhen.
Simultaneously, the clustering degree of new-quality productivity has evolved from slow growth in the initial stages to steady rise, reflecting the shift in China’s economy from reliance on manufacturing and exports to greater dependence on domestic demand, the service sector, and high-tech industries. The continuous optimization of China’s economic structure, the upgrading of industries, and the rapid development of high-end manufacturing and the service sector have all created favorable conditions for the clustered development of new-quality productivity. Moreover, as China’s position in the global value chain has risen, changes in the external environment have also promoted the clustering of domestic industries, accelerating the process of new-quality productivity aggregation.
4.2.2. Local Moran’s Index
Figure 4 and Figure 5 display the Moran index scatter plot and the geographical clustering trend map for the development level of artificial intelligence, revealing significant trends. In 2010, geographical clustering mainly exhibited “insignificant” and “Low-Low (L-L)” patterns, with “L-L” clusters primarily distributed in central provinces and some eastern and western regions, indicating a generally low level of artificial intelligence development in these areas, characterized by inefficient clustering patterns. By 2022, the clustering pattern had significantly shifted to “High-High (H-H)” and “Low-Low (L-L),” with a marked improvement in the level of artificial intelligence development in regional interiors and their neighboring areas, reflecting higher spatial correlations. Particularly, the “H-H” clustering areas in the first quadrant, which entirely include the eastern provinces, demonstrate higher levels of artificial intelligence development in these regions and their neighboring areas. This reflects the robust industrial base and advanced technological development in artificial intelligence in the eastern regions, fostering the spatial clustering characteristics of artificial intelligence development.
Figure 6 and Figure 7 present the Moran index scatter plot and the geographical clustering trend map for the development of China’s new-quality productivity, revealing the changing trends over thirteen years. In 2010, the clustering phenomenon of new-quality productivity primarily manifested in the “Low-Low (L-L)” and “High-High (H-H)” patterns, with the western regions, along with some eastern and central areas, generally exhibiting lower development, forming less efficient clusters and increased spatial dispersion. By 2022, it was observed that the number of provinces within the “Low-High “ and “High-Low “ clustering areas had decreased, with the overall development level of new-quality productivity tending towards the “L-L” pattern. This change reflects the impact of the national coordinated development strategy, which has reduced inter-provincial disparities and facilitated collective progress. Particularly, in the “H-H” clustering areas formed in the eastern provinces, these regions and their neighboring areas have higher levels of new-quality productivity development, demonstrating the robust industrial base of the eastern region and fostering the spatial clustering characteristics of new-quality productivity. These changes indicate that over time, the development of China’s new-quality productivity has shown more pronounced geographical distribution features and clustering effects.
5. Empirical Analysis
5.1. Benchmark Regression
Before conducting regression analysis, the appropriate regression model is selected through F-test, LM test, and robust Hausman test. The results show that both the F-test and LM test significantly reject the null hypothesis of using a pooled regression model at the 1% level. Therefore, this study chooses a two-way fixed effects model for regression analysis and explores the impact of artificial intelligence on new-quality productivity by progressively adding control variables. The fixed effects model regression results are shown in Table 5.
From Table 5, it can be seen that after gradually introducing control variables, the regression coefficients of the development level of artificial intelligence are all positive and highly significant at the 1% level. This indicates that the development level of artificial intelligence has a significant positive empowering effect on new-quality productivity, preliminarily validating Hypothesis H1. The reason may be that artificial intelligence, relying on the empowering and configuration advantages of big data technology and machine intelligence algorithms, can drive the improvement of factor combination efficacy through quality transformation and technological progress, thereby enhancing factor production efficiency and boosting the development of new-quality productivity.
5.2. Robustness Checks
To ensure the reliability of the impact of artificial intelligence on new-quality productivity, this study conducts robustness tests. First, the explanatory variable is changed. The industrial robot density is introduced into the model, replacing the artificial intelligence development indicator. The original data for industrial robot density comes from the International Federation of Robotics (IFR), and, following the research method of Yan Xueling et al. [32], the related data are summarized and calculated using the following formula.
Where is the employment in industry j in province i in year t, is the employment in province i in year t, is the stock of industrial robots in industry j, and is the national employment in industry j. Summing up all the industries, we can get the density of robots installed in province i. The results, presented in column (1) of Table 6, demonstrate that after substituting the variables, the development of AI continues to significantly enhance new quality productivity at the 1% level, indicating a positive empowering effect, which corroborates the aforementioned conclusion.
Second, switching to the random effects model for regression, as shown in column (2), the sign and significance of the regression coefficient of the level of artificial intelligence development on provincial new-quality productivity remain unchanged. Third, the sample is winsorized. To eliminate the impact of outliers on the basic conclusions of the study, a 1% winsorization is applied to all variable data, and regression is performed again based on this. The results, as shown in column (3) of Table 6, indicate that the coefficient of artificial intelligence development level is 0.937, and it is significant at the 1% level, confirming that the conclusions remain robust after eliminating the outlier issues.
5.3. Endogeneity Tests
Considering the potential bidirectional causality between the development of artificial intelligence and new-quality productivity, as well as the presence of other important omitted variables leading to endogeneity issues and potential bias in regression conclusions, this study constructs instrumental variables from the following two dimensions for testing. First, the lagged levels of artificial intelligence development from the 2nd to the 4th period are used as instrumental variables for estimation, with results shown in columns (1)-(3) of Table 7. Secondly, following the research of Deng Rongrong et al. [33], the frequency of terms related to artificial intelligence in government work reports is used as an instrumental variable. These reports effectively reflect the local government’s focus on the development of artificial intelligence for the year. Using AI technology, specifically Python web scraping, this study downloaded the provincial government work reports from 2010 to 2022 from local government official websites and extracted keywords such as “artificial intelligence,” “intelligence,” “intelligent,” “robot,” “cloud computing,” “wisdom,” “5G,” “big data,” “digitalization,” “informatization,” “Internet of Things,” etc., for frequency analysis. The 2SLS estimation method was employed to ensure the robustness of the regression, with results shown in column (4) of Table 7.
From Table 7, it is evident that the Kleibergen-Paap Wald rk LM is significant at the 1% level, rejecting the null hypothesis that the instrumental variable is unidentifiable. The values of the Cragg-Donald Wald F and Kleibergen-Paap Wald rk F statistics are both higher than the critical values at the 10% level of the Stock Yogo weak identification test, indicating that the choice of instrumental variables is reasonable. The test results demonstrate that after considering reverse causality, the regression results remain robust, validating Hypothesis H1.
6. Heterogeneity Analysis
6.1. Regional Heterogeneity
Given the heterogeneity in geographical locations and factor endowment structures of provincial administrative regions, this study divides the research sample into three groups for regional heterogeneity analysis: Eastern and Central-Western regions, coastal and non-coastal areas, and technology-intensive and non-technology-intensive zones. The classification of technology-intensive regions and the specific calculation formula are as follows:
In this paper, denotes the proportion of the output value of the i-th industry to the total output value, and H represents the level of industrial structure upgrading used to determine whether an area is a technology-intensive zone. A province is defined as a technology-intensive zone if its average H value during the sample period exceeds the average H value of all provinces during the same period. According to the calculation results, Beijing, Tianjin, Shanxi, Liaoning, Shanghai, Jiangsu, Zhejiang, Shandong, Guangdong, and Chongqing are classified as technology-intensive zones, while other regions are categorized as non-technology-intensive zones.
The regional heterogeneity regression results, as shown in Table 8, indicate that the heterogeneity coefficients for the six regions formed by the three classification methods are significantly positive at the 1% level. This further validates Hypothesis H1, which posits that artificial intelligence has a positive empowering effect on new quality productivity. Specifically, the empowering effect of artificial intelligence is more pronounced in the Midwest, non-coastal, and non-technology-intensive areas. Based on the spatial-temporal evolution and geographic clustering analysis of artificial intelligence and new quality productivity using the Moran’s I index, it is evident that the eastern regions have a higher level of development and possess a large number of AI innovative talents and funds, enabling them to fully leverage their empowering capabilities. In contrast, in regions like the Midwest and non-coastal areas, although some provinces have relatively slower development, the national government has highly prioritized the development of these regions in recent years and has issued numerous policies to promote the development of the Midwest. These policies have had a certain positive impact on the development of new quality productivity in the Midwest. Therefore, in these rapidly developing regions, the role of artificial intelligence in promoting new quality productivity is more evident. As these areas are currently in a developmental phase, the impact of artificial intelligence on local new quality productivity is even more pronounced.
6.2. Heterogeneity in Empowerment Effects
This article establishes an evaluation index system for new-quality productivity based on its three main characteristics: high technology, high efficiency, and high quality. To examine the heterogeneous impact of artificial intelligence on the constitutive factors of new-quality productivity, the explanatory variables are replaced with high technology, high efficiency, and high quality to explore the different empowering effects of artificial intelligence. The results, as shown in Table 9, indicate that artificial intelligence has a significant empowering effect on all three aspects at the 1% level. Among them, the empowering effect on high technology is the most significant, while the effect on high quality is relatively smaller. This reflects that in recent years, China has placed more emphasis on the technological empowerment role of artificial intelligence in the development of new-quality productivity. Therefore, future efforts should focus on leveraging big data technology and machine intelligence algorithms to optimize resource allocation, reduce production costs, and thus enhance the empowering effect of artificial intelligence on the high-quality aspect of new-quality productivity.
6.3. Quantile Regression
Considering that the panel fixed effects model can only depict the average impact of artificial intelligence on the development of new-quality productivity and fails to fully reflect this influence and its development trajectory, this study employs the panel quantile regression method to delve deeper into the process and changing patterns of how artificial intelligence empowers new-quality productivity. From Figure 8 and Table 10, it is evident that the regression coefficients of artificial intelligence development levels at various quantiles are all positive and have passed the 1% significance test, which once again confirms that the development of artificial intelligence can effectively promote the development of new-quality productivity. The results show that as new-quality productivity rises from lower to higher quantiles, the empowering effect of artificial intelligence on new-quality productivity exhibits an upward trend, with the rate of increase gradually accelerating.
7. Impact Mechanisms and Spatial Spillovers
7.1. Impact Mechanisms
To further explore the internal mechanism by which artificial intelligence empowers the development of new-quality productivity, after considering three mainstream methods for testing mediation effects—causal stepwise regression, the Sobel test, and the Bootstrap sampling method—the most effective Bootstrap sampling method was chosen to identify the mediation mechanism by which artificial intelligence empowers the development of new-quality productivity.
Through 2000 simulations of the Bootstrap test, the mediation effect model was analyzed, with the schematic diagram and results shown in Table 11. It is found that the 95% confidence interval for the mediation mechanism of R&D innovation level is [0.031, 0.092], excluding 0, with a p-value less than 0.01. This indicates that the development of artificial intelligence can enhance R&D and technological innovation, thereby promoting the development of new-quality productivity, with the mediation effect proportion being 46.496%. Similarly, the development of artificial intelligence can promote the upgrading of industrial structures, thereby empowering the development of new-quality productivity, with a mediation effect of 51.279%, confirming Hypothesis H2. By comparing the mediation effect values, it is evident that the effect of artificial intelligence on the upgrading of industrial structures has a more significant impact on the development of new-quality productivity.
7.2. Spatial Spillover Effects
7.2.1. Selection of Spatial Econometric Models
Before estimating spatial effects, it is essential to conduct a spatial autocorrelation test on the development level of artificial intelligence and the level of new-quality productivity. The results of the global Moran’s I index in Table 4 are predominantly significantly positive, indicating a notable positive spatial autocorrelation. This suggests that the levels of artificial intelligence and new-quality productivity exhibit distinct spatial clustering, thereby necessitating the use of spatial econometric models to further investigate spatial spillover effects.
To ensure the reliability of the spatial econometric model selection, this paper employs the Elhorst model for correlation testing, with results shown in Table 12. First, the LM test confirms the presence of spatial effects in the model. Both the Robust LM and LM test results are significantly positive, indicating that the empirical model has spatial effects. Second, the LR test results determine whether the Spatial Durbin Model should be converted to a spatial lag model or spatial error model. According to Table 12, neither condition holds, indicating that the model has not degenerated and the Spatial Durbin Model can be used. Third, the Hausman test determines whether to use a random effects or fixed effects model. The Hausman test result is significantly positive, indicating that a fixed effects model should be chosen. Additionally, to further clarify the type of fixed effects model, an LR test is used. The results indicate that a Spatial Durbin Model with time and individual double fixed effects should be selected.
7.2.2. Regression Results Analysis
The regression results of the Spatial Durbin Model, as shown in Table 13, indicate that the coefficient of determination (R²) suggests that the overall fit of the related models is good. The spatial autoregressive coefficient ρ=0.181 is significantly positive, indicating that the homogeneity spillover effect of artificial intelligence is quite significant. That is, the higher the level of artificial intelligence development in a local area, the higher the level of artificial intelligence development will be in neighboring areas. Both the direct impact coefficient of artificial intelligence and the spatial lag coefficient are positive, and they pass the significance test at the 1% level. This suggests that the development level of new-quality productivity in a local area is influenced to some extent by the development level of artificial intelligence in surrounding areas, confirming Hypothesis H3.
The decomposition of spatial effects, as shown in Table 14, indicates that the regression coefficients for the direct and indirect effects of the development level of artificial intelligence are significant at the 1% level. This demonstrates that the development of artificial intelligence can not only promote the development of new-quality productivity in the local area but also enhance the new-quality productivity of neighboring regions. This means that the development of artificial intelligence has a significant spatial spillover effect on the new-quality productivity of adjacent areas, further validating Hypothesis H3.
8. Conclusion and Recommendations
8.1. Research Conclusions
First, this paper conducts an empirical analysis on an extensive dataset from 30 provinces and cities in China, confirming a significant positive relationship between the development of artificial intelligence and new-quality productivity. This relationship is consistently validated across different statistical models, indicating that the development of artificial intelligence can directly promote the development of new-quality productivity.
Second, through kernel density estimation and spatial analysis using the Moran’s I index, this paper reveals the synchronous growth and significant spatial clustering of artificial intelligence development and new-quality productivity across regions. This spatial clustering suggests that technologically advanced regions can have a positive impact on surrounding areas through mechanisms such as knowledge spillover and talent mobility, thereby promoting productivity enhancement throughout the entire region. This finding emphasizes that when formulating economic growth and regional development strategies, the interactions and potential for coordinated growth between regions should be considered.
Third, the study further explores the mediating effects and spatial spillover effects of artificial intelligence in promoting new-quality productivity. It is found that artificial intelligence significantly improves the level of R&D innovation and promotes the upgrading of industrial structures, thereby indirectly driving the development of new-quality productivity. This conclusion highlights the complex impacts of technological development on various levels of the economy and suggests that these aspects should be comprehensively considered when formulating relevant policies and strategies.
8.2. Relevant Suggestion
Based on the above research conclusions, the following recommendations are proposed:
Regional Coordinated Development: Research indicates a significant positive relationship between the development of artificial intelligence technology and new-quality productivity, with synchronous growth and significant spatial clustering among regions. It is recommended that the country prioritize the establishment of AI innovation centers in the technologically mature eastern coastal regions and promote coordinated development between these centers and the central and western regions through policy guidance and financial support. By establishing cross-regional collaboration networks, sharing R&D resources and technological achievements, a new national pattern of AI development can be formed.
Cultivating Intermediary Roles: According to empirical analysis, the role of AI in promoting new-quality productivity is partially realized through its impact on R&D innovation and industrial upgrading. The government should implement specific measures to support AI-related R&D activities and industrial applications, such as setting up special funds to support research on core AI technologies and providing tax incentives and financial subsidies to encourage enterprises to use AI technology for industrial upgrading. Additionally, cooperation between the education sector and enterprises should be promoted to strengthen talent cultivation and technical training in the field of AI, ensuring that technology development aligns with industrial needs.
Utilizing Spatial Spillover Effects: Spatial analysis in the study reveals the inter-regional spillover effect of AI development, indicating that the development of technologically advanced regions can drive the economic improvement of surrounding areas. Policymakers should design a framework at the national level to promote the spatially balanced distribution of AI technology and industries. Specific measures include establishing regional linkage development strategies, setting up regional technology exchange and cooperation platforms, optimizing regional resource allocation and infrastructure construction, promoting the flow of technology and capital, and thus stimulating the development potential of new-quality productivity in the entire region.
Author Contributions
Conceptualization, X.G.; methodology, X.L.; software, X.G.; validation, X.G. and X.L.; formal analysis, X.G.; data curation, X.G. and X.L.; writing—original draft preparation, X.G. and X.L.; writing—review and editing, X.G.; visualization, X.G.; supervision, X.L.; project administration, X.G.; funding acquisition, X.G. All authors have read and agreed to the published version of the manuscript.
Funding
This research received no external funding.
Institutional Review Board Statement
Not applicable
Data Availability Statement
The original contributions presented in the study are included in the
article; further inquiries can be directed to the corresponding author.
Conflicts of Interest
The authors declare that there are no competing interests.
References
- Gupta, S.; Modgil, S.; Choi, T.-M.; Kumar, A.; Antony, J. Influences of artificial intelligence and blockchain technology on financial resilience of supply chains. Int. J. Prod. Econ. 2023, 261, 108868. [Google Scholar] [CrossRef]
- Xu, H.; Liu, J.; Xu, X.; Chen, J.; Yue, X. The impact of AI technology adoption on operational decision-making in competitive heterogeneous ports☆. Transp. Res. Part E: Logist. Transp. Rev. 2024, 183, 103428. [Google Scholar] [CrossRef]
- Huang, Q. H. , & Sheng, F. F. (2024). New quality productive system: Element characteristics, structural support, and functional orientation. Reform, (02), 15-24.
- Zhai, Q. , & Cao, S. X. (2024). The political economy interpretation of new quality productivity. Journal of Xi’an University of Finance and Economics, (02), 15-23. [CrossRef]
- Zhang, L. (2024). New quality productivity and the dynamics of Chinese-style modernization. The Economist, (03), 15-24. [CrossRef]
- Hou, G. Y. , & Zhang, Z. Y. (n.d.). The theoretical logic, key issues, and practical pathways of new quality productivity empowering common prosperity. Journal of Yunnan Minzu University (Philosophy and Social Sciences Edition), 1-8. [CrossRef]
- Sun, L. W. , & Guo, J. H. (n.d.). Construction and empirical measurement of the evaluation index system for new quality productivity. Statistics and Decision, 1-7.
- Wang, K. , & Guo, X. X. (n.d.). Levels, regional differences, and spatiotemporal evolution characteristics of China’s new quality productivity. Statistics and Decision, 1-7.
- Miailhe, N.; Hodes, C.; Jain, A.; Iliadis, N.; Alanoca, S.; Png, J. AI for Sustainable Development Goals. Delphi - Interdiscip. Rev. Emerg. Technol. 2019, 2, 207–216. [Google Scholar] [CrossRef]
- Susar, D. , & Aquaro, V. (2019, April). Artificial intelligence: Opportunities and challenges for the public sector. In Proceedings of the 12th international conference on theory and practice of electronic governance (pp. 418-426).
- Goralski, M.A.; Tan, T.K. Artificial intelligence and sustainable development. Int. J. Manag. Educ. 2020, 18, 100330. [Google Scholar] [CrossRef]
- Pedro, F. , Subosa, M., Rivas, A., & Valverde, P. (2019). Artificial intelligence in education: Challenges and opportunities for sustainable development.
- Di Vaio, A.; Palladino, R.; Hassan, R.; Escobar, O. Artificial intelligence and business models in the sustainable development goals perspective: A systematic literature review. J. Bus. Res. 2020, 121, 283–314. [Google Scholar] [CrossRef]
- Zhang, D.; Pee, L.; Pan, S.L.; Liu, W. Orchestrating artificial intelligence for urban sustainability. Gov. Inf. Q. 2022, 39, 101720. [Google Scholar] [CrossRef]
- Sanchez, T.W.; Shumway, H.; Gordner, T.; Lim, T. The prospects of artificial intelligence in urban planning. Int. J. Urban Sci. 2023, 27, 179–194. [Google Scholar] [CrossRef]
- Zhang, D.; Pee, L.; Pan, S.L.; Liu, W. Orchestrating artificial intelligence for urban sustainability. Gov. Inf. Q. 2022, 39, 101720. [Google Scholar] [CrossRef]
- Liengpunsakul, S. Artificial Intelligence and Sustainable Development in China. Chin. Econ. 2021, 54, 235–248. [Google Scholar] [CrossRef]
- Nishant, R.; Kennedy, M.; Corbett, J. Artificial intelligence for sustainability: Challenges, opportunities, and a research agenda. Int. J. Inf. Manag. 2020, 53, 102104. [Google Scholar] [CrossRef]
- Mhlanga, D. Artificial Intelligence in the Industry 4.0, and Its Impact on Poverty, Innovation, Infrastructure Development, and the Sustainable Development Goals: Lessons from Emerging Economies? Sustainability 2021, 13, 5788. [Google Scholar] [CrossRef]
- Rojas, C.N.; Peñafiel, G.A.A.; Buitrago, D.F.L.; Romero, C.A.T. Society 5.0: A Japanese Concept for a Superintelligent Society. Sustainability 2021, 13, 6567. [Google Scholar] [CrossRef]
- Javaid, M.; Haleem, A.; Singh, R.P.; Suman, R. Artificial Intelligence Applications for Industry 4.0: A Literature-Based Study. J. Ind. Integr. Manag. 2022, 07, 83–111. [Google Scholar] [CrossRef]
- Helo, P.; Hao, Y. Artificial intelligence in operations management and supply chain management: an exploratory case study. Prod. Plan. Control. 2022, 33, 1573–1590. [Google Scholar] [CrossRef]
- Awan, U. , Kanwal, N., Alawi, S., Huiskonen, J., & Dahanayake, A. (2021). Artificial intelligence for supply chain success in the era of data analytics. The fourth industrial revolution: Implementation of artificial intelligence for growing business success, 3-21.
- Li, Y.; Liu, C.; Zhang, J.; Ren, Y. Application Prospect Analysis and Key Issues Research of AI Technology in Service-oriented Manufacturing. Trans. Econ. Bus. Manag. Res. 2024, 4, 80–110. [Google Scholar] [CrossRef]
- Liu, J.; Liu, L.; Qian, Y.; Song, S. The effect of artificial intelligence on carbon intensity: Evidence from China's industrial sector. Socio-Economic Plan. Sci. 2022, 83, 101002. [Google Scholar] [CrossRef]
- Babina, T. , Fedyk, A., He, A., & Hodson, J. (2024). Artificial intelligence, firm growth, and product innovation. Journal of Financial Economics, 151, 103745.
- Li, B.-H.; Hou, B.-C.; Yu, W.-T.; Lu, X.-B.; Yang, C.-W. Applications of artificial intelligence in intelligent manufacturing: a review. Front. Inf. Technol. Electron. Eng. 2017, 18, 86–96. [Google Scholar] [CrossRef]
- Wang, Q.; Sun, T.; Li, R. Does artificial intelligence promote green innovation? An assessment based on direct, indirect, spillover, and heterogeneity effects. Energy Environ. 2023, 0958305X231220520. [Google Scholar] [CrossRef]
- Terrés Molina, P. (2023). The impact of artificial intelligence on human talent management: attraction, retention and motivation.
- Lu, J. , Guo, Z. A., & Wang, Y. P. (n.d.). Levels, regional differences, and enhancement pathways of new quality productivity development. Journal of Chongqing University (Social Science Edition), 1-16.
- Yu, G. H. , Wang, D. X., Deng, X., & Ren, Y. M. (2024). Transportation infrastructure, regional trade flow, and economic growth efficiency. Economic Perspectives, (02), 107-127.
- Yan, X. L. , Zhu, B. K., & Ma, C. (2020). Industrial Robot Use and Manufacturing Employment: Evidence from China. Statistical Research, 1, 74-87.
- Deng Rongrong, & Xiao Xiangtao. The impact of industrial intelligence on urban green ecological efficiency—an empirical study based on industrial robot data. Contemporary Economic Research, 338 (10), 98-113.
Figure 1.
Comparison Chart of Kernel Density Function Distributions for the Development of Artificial Intelligence and New Quality Productivity Levels.
Figure 1.
Comparison Chart of Kernel Density Function Distributions for the Development of Artificial Intelligence and New Quality Productivity Levels.
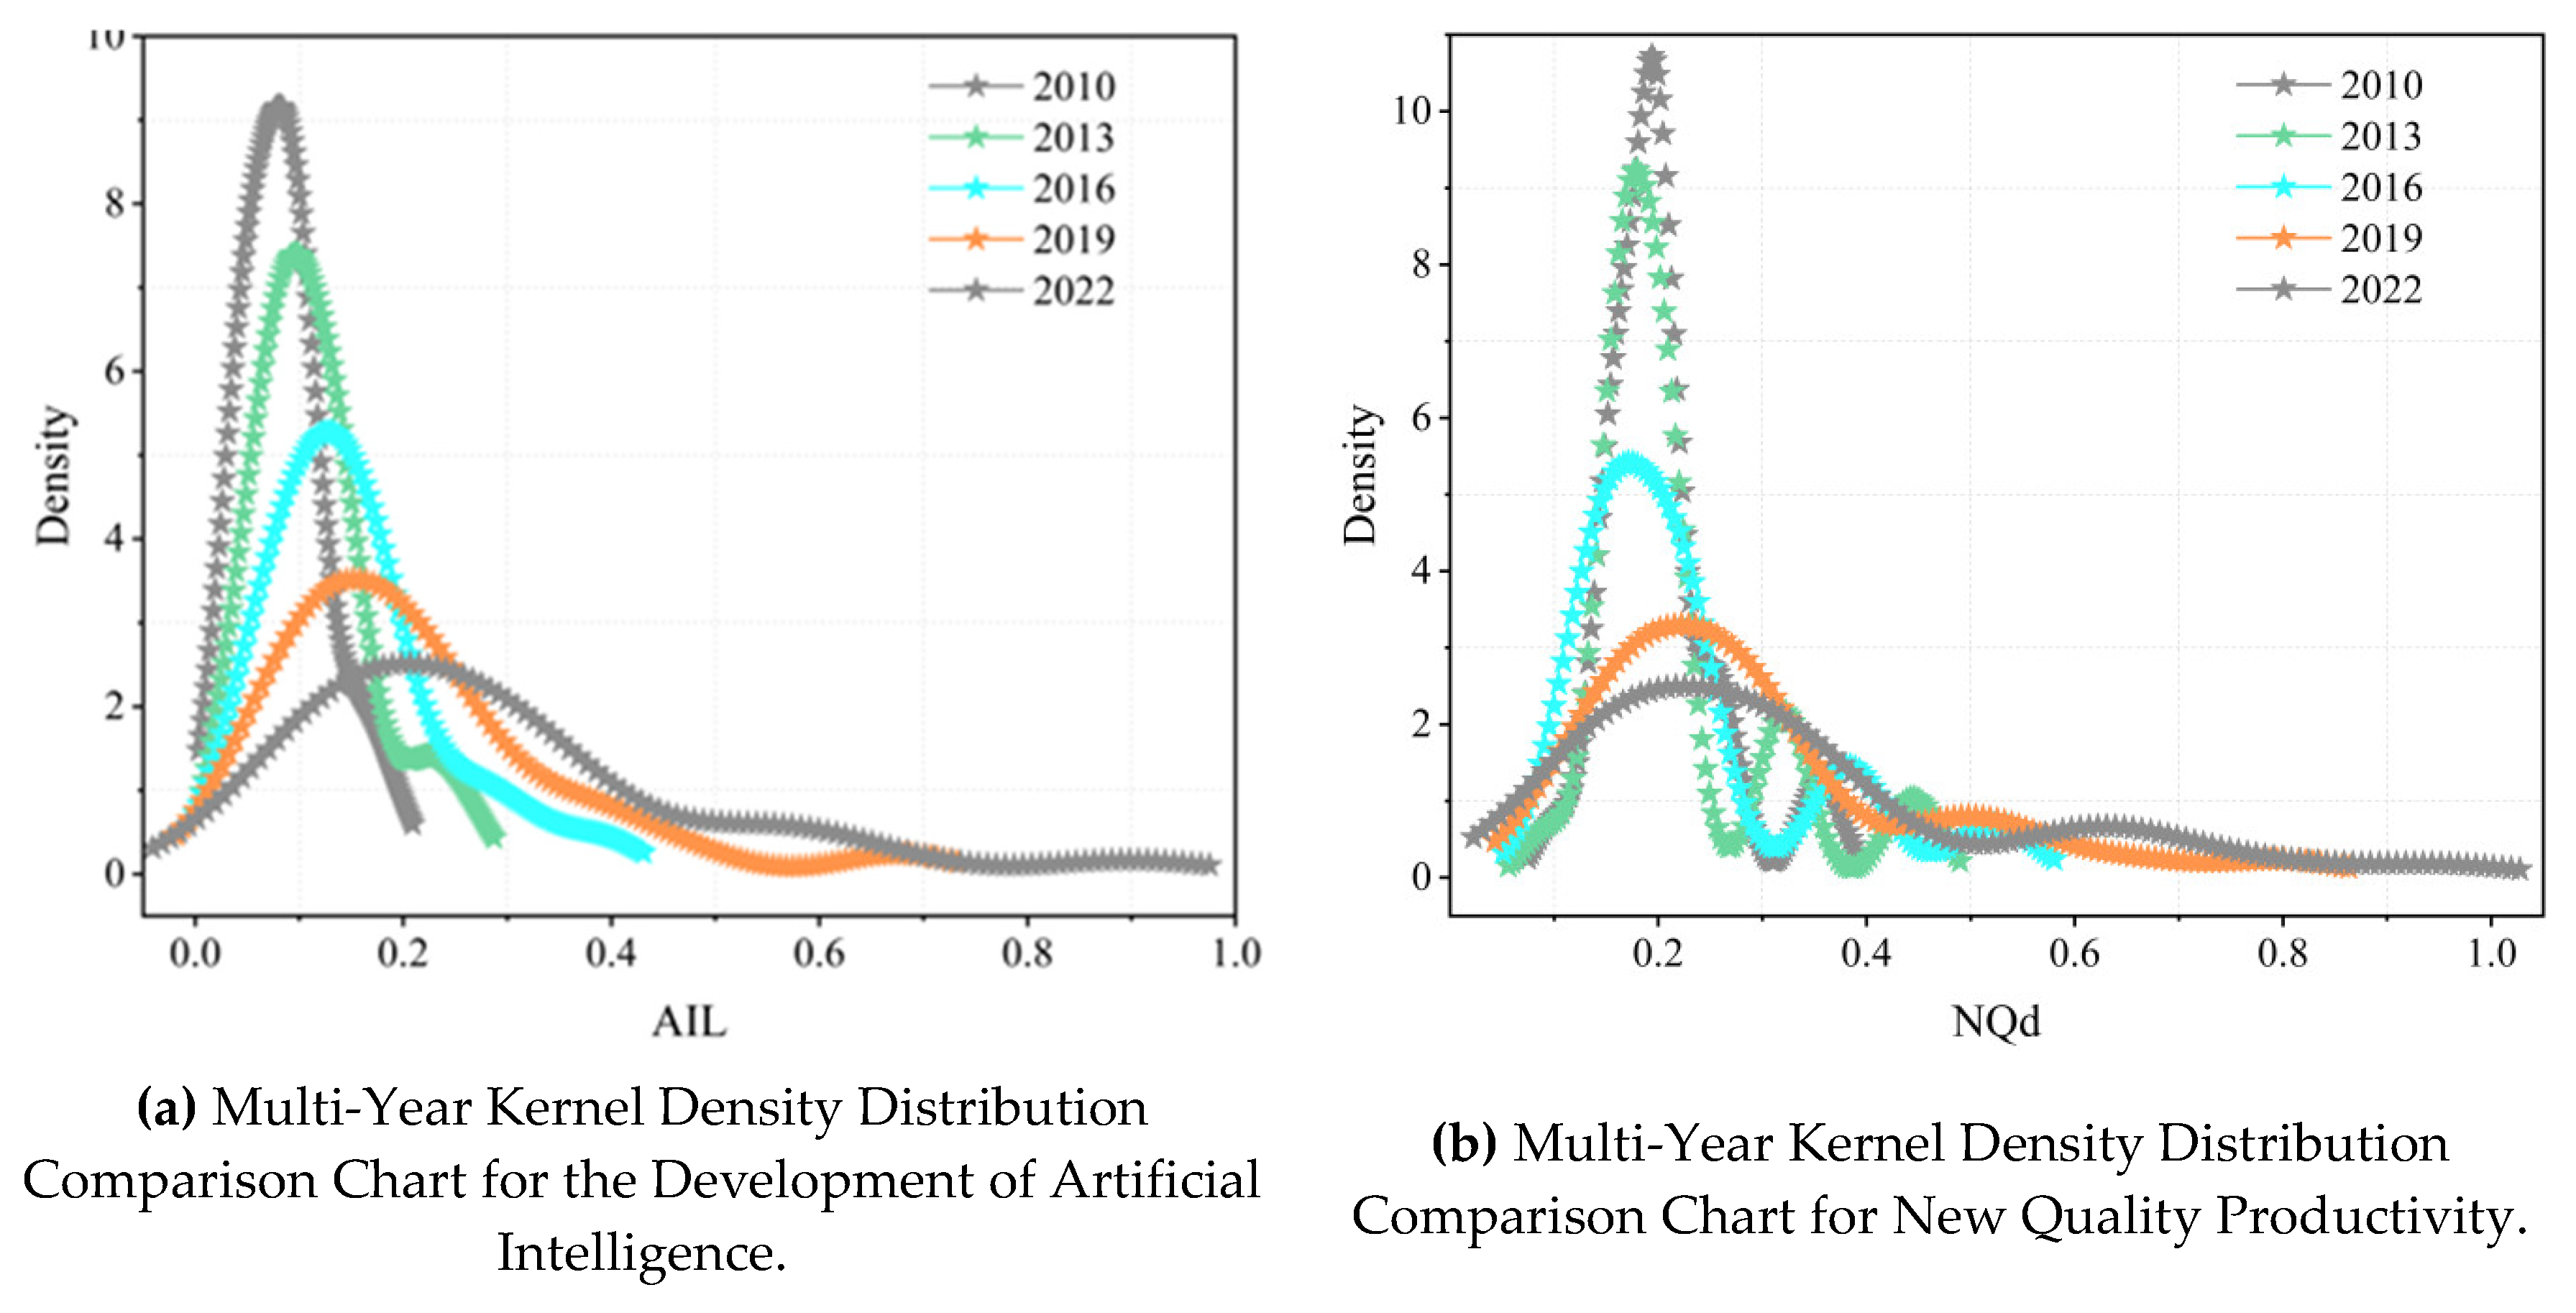
Figure 2.
Kernel Density Function Trend Chart for the Development Levels of Artificial Intelligence and New Quality Productivity.
Figure 2.
Kernel Density Function Trend Chart for the Development Levels of Artificial Intelligence and New Quality Productivity.
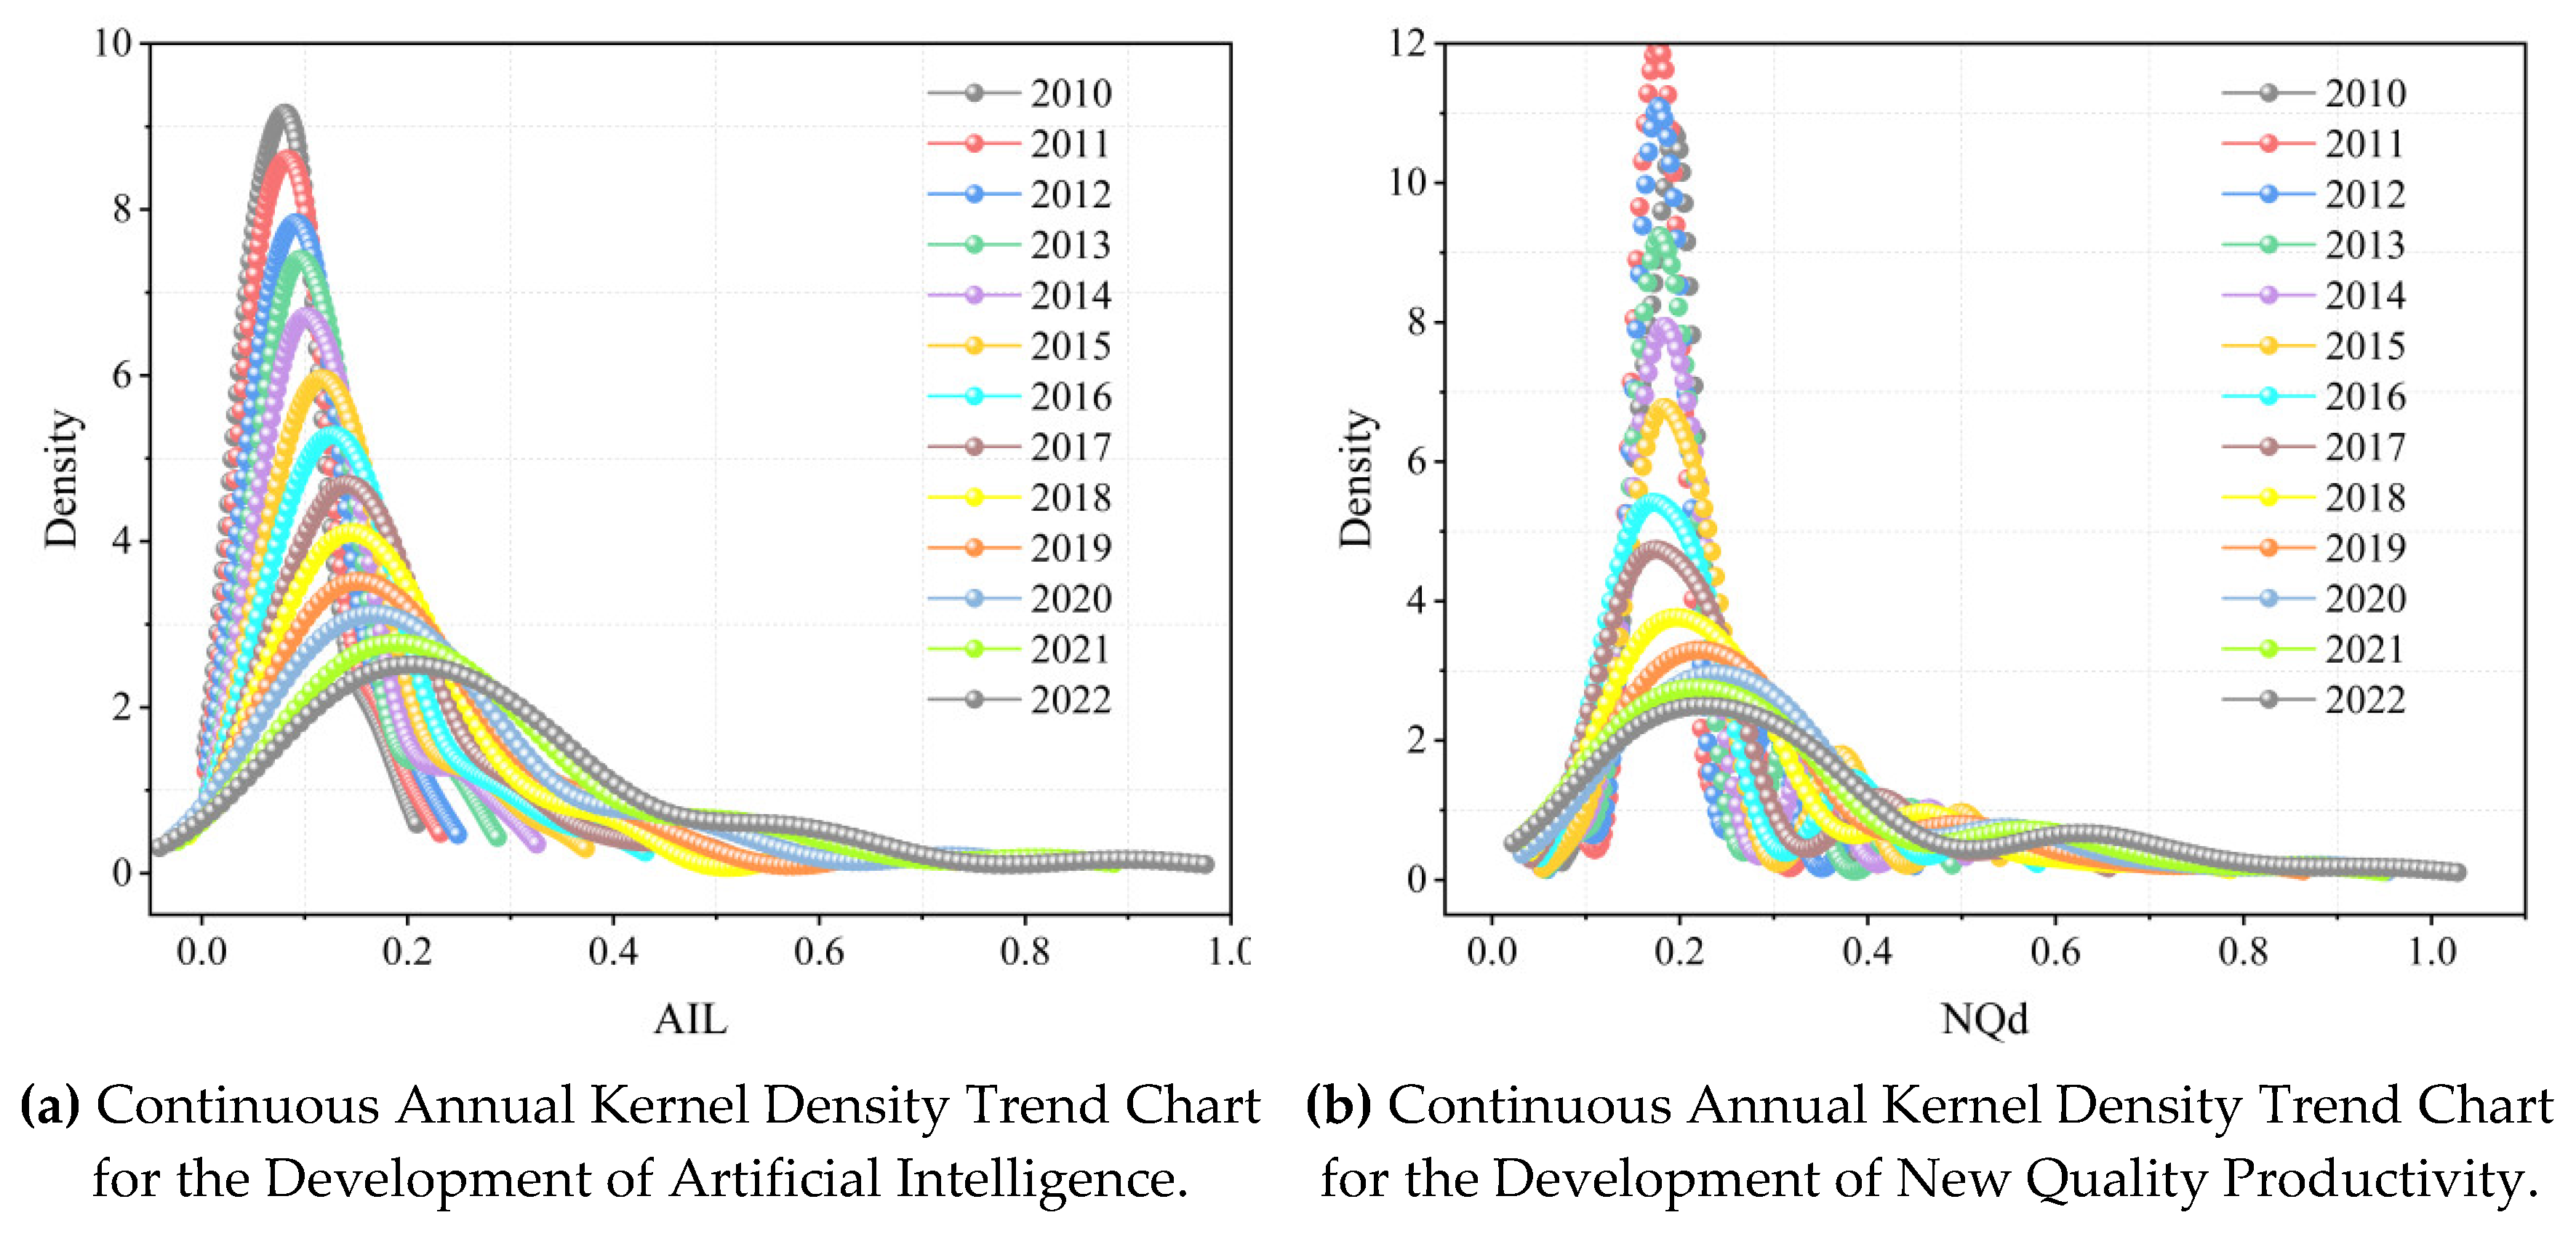
Figure 3.
Annual Moran’s Index Line Chart for the Development Levels of Artificial Intelligence and New Quality Productivity.
Figure 3.
Annual Moran’s Index Line Chart for the Development Levels of Artificial Intelligence and New Quality Productivity.
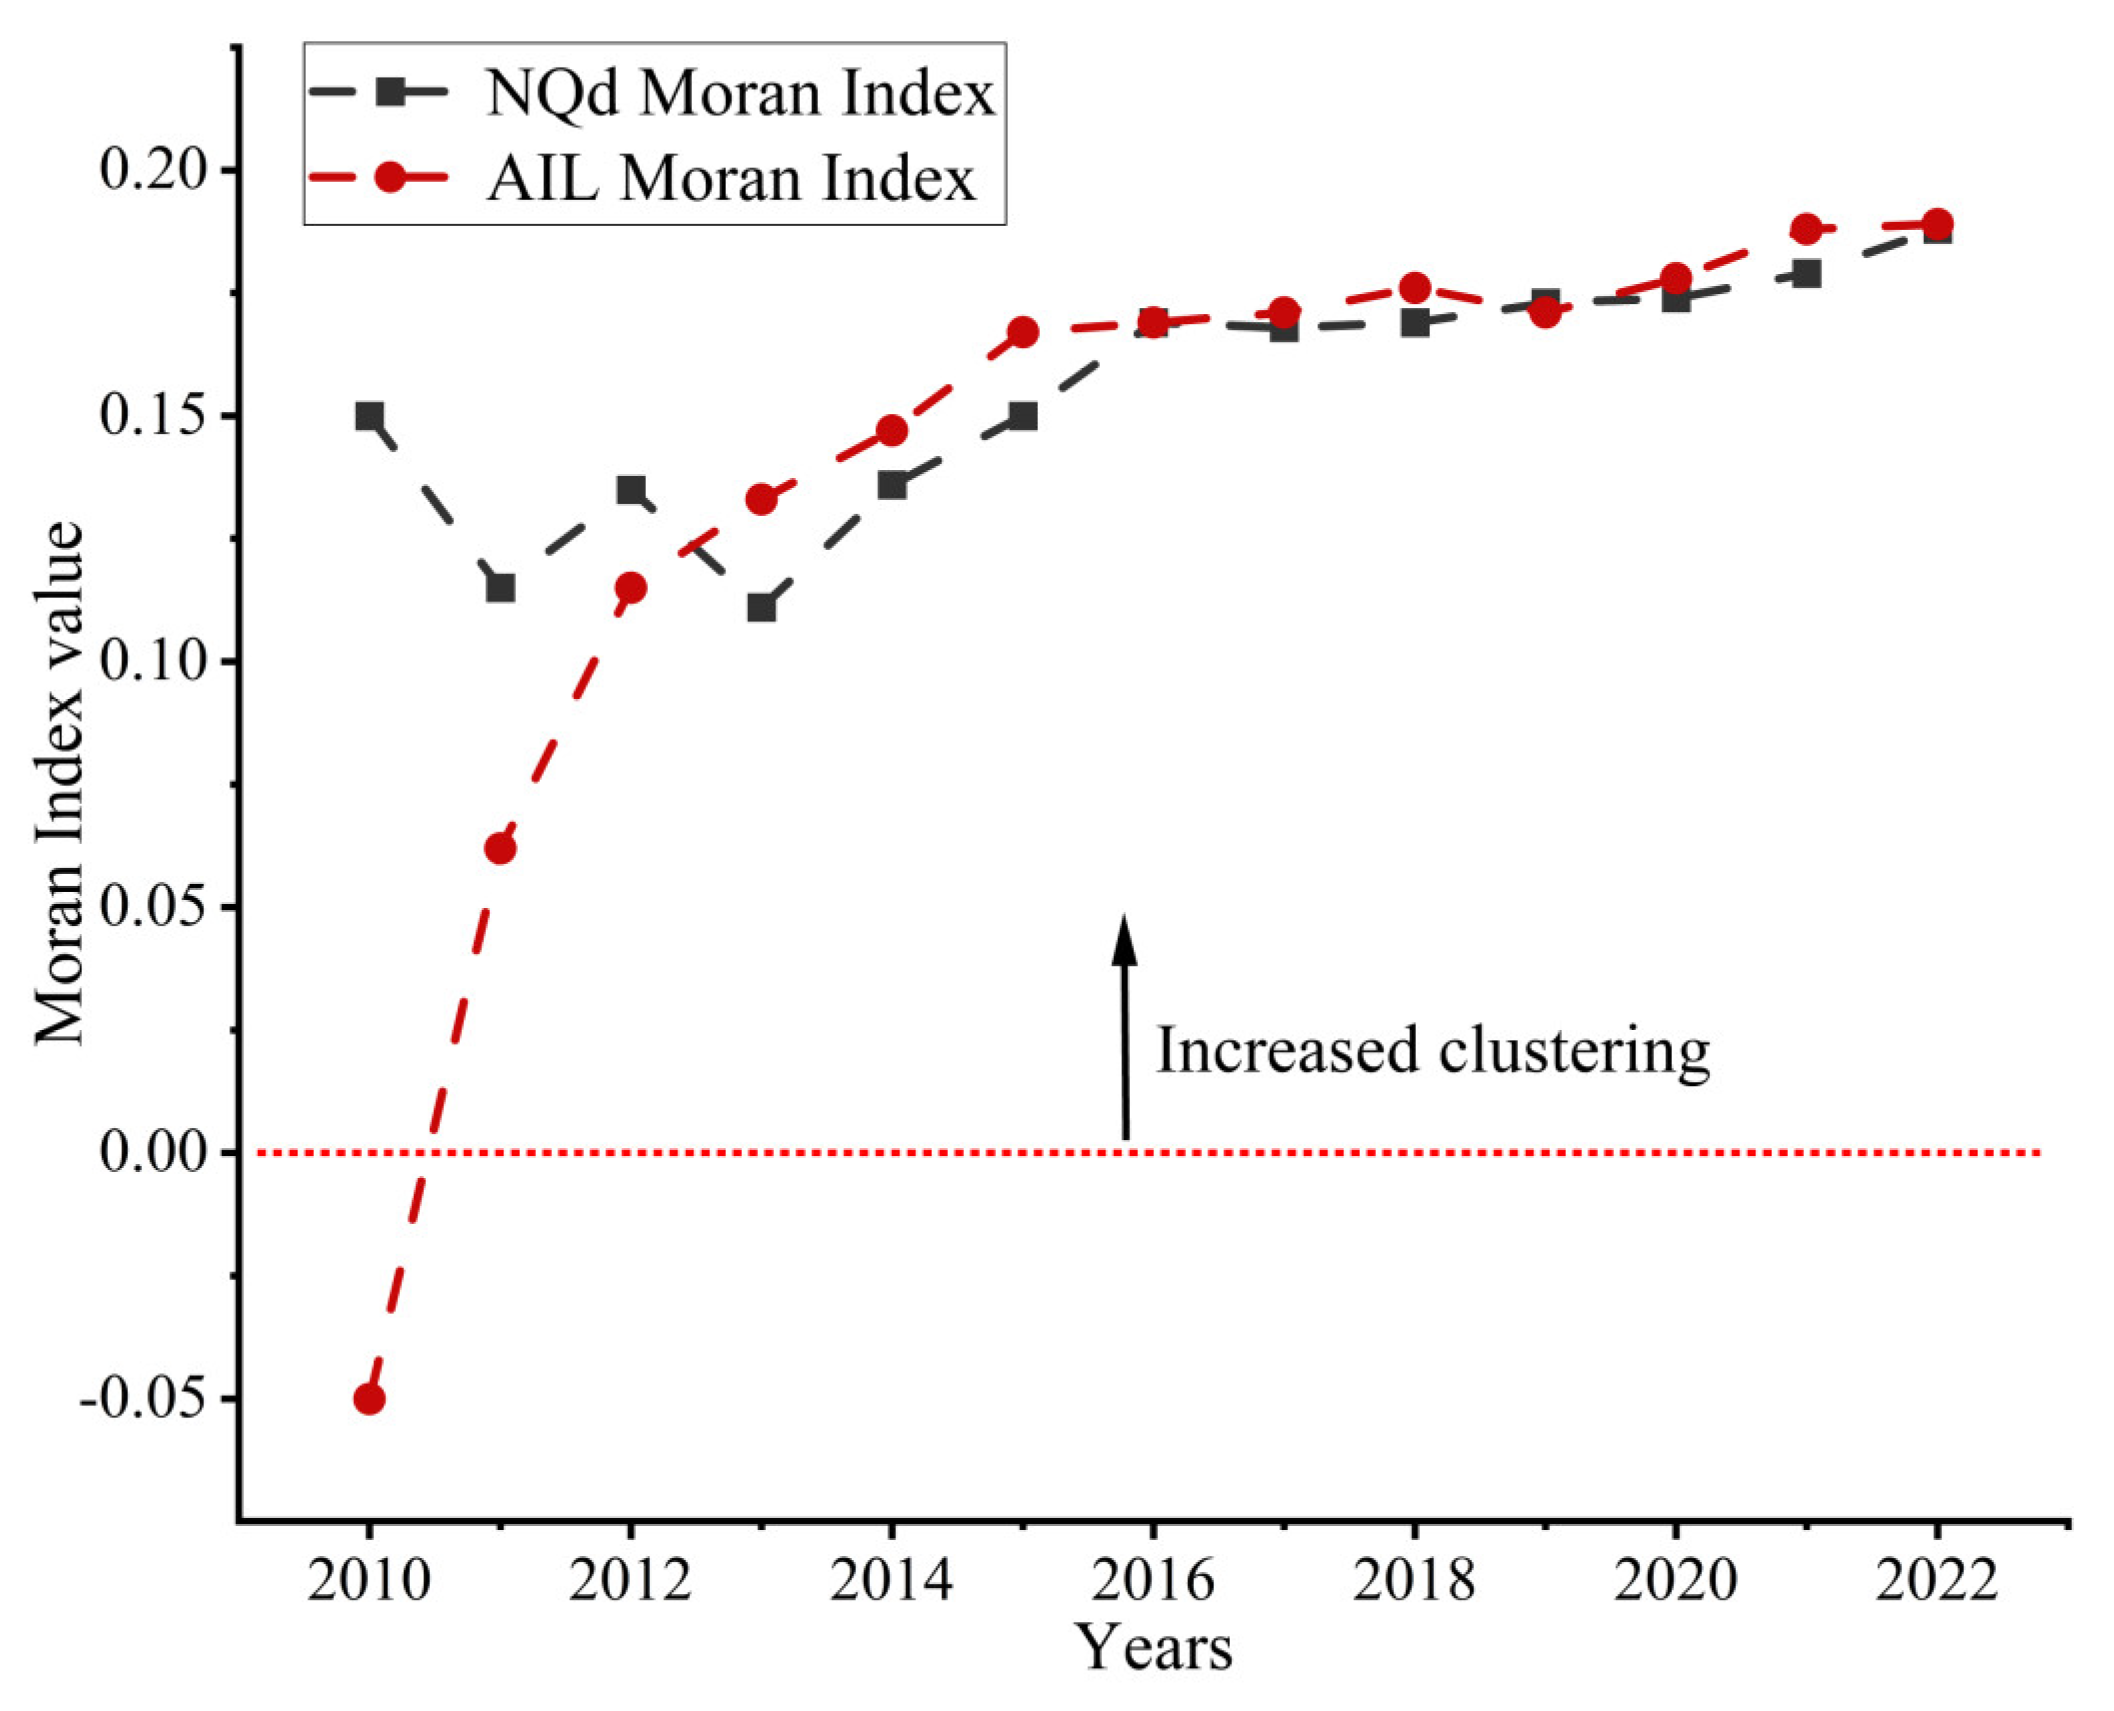
Figure 4.
Scatter Plot of Moran’s Index for the Development Level of Artificial Intelligence: 2010 (Left) vs. 2022 (Right).
Figure 4.
Scatter Plot of Moran’s Index for the Development Level of Artificial Intelligence: 2010 (Left) vs. 2022 (Right).
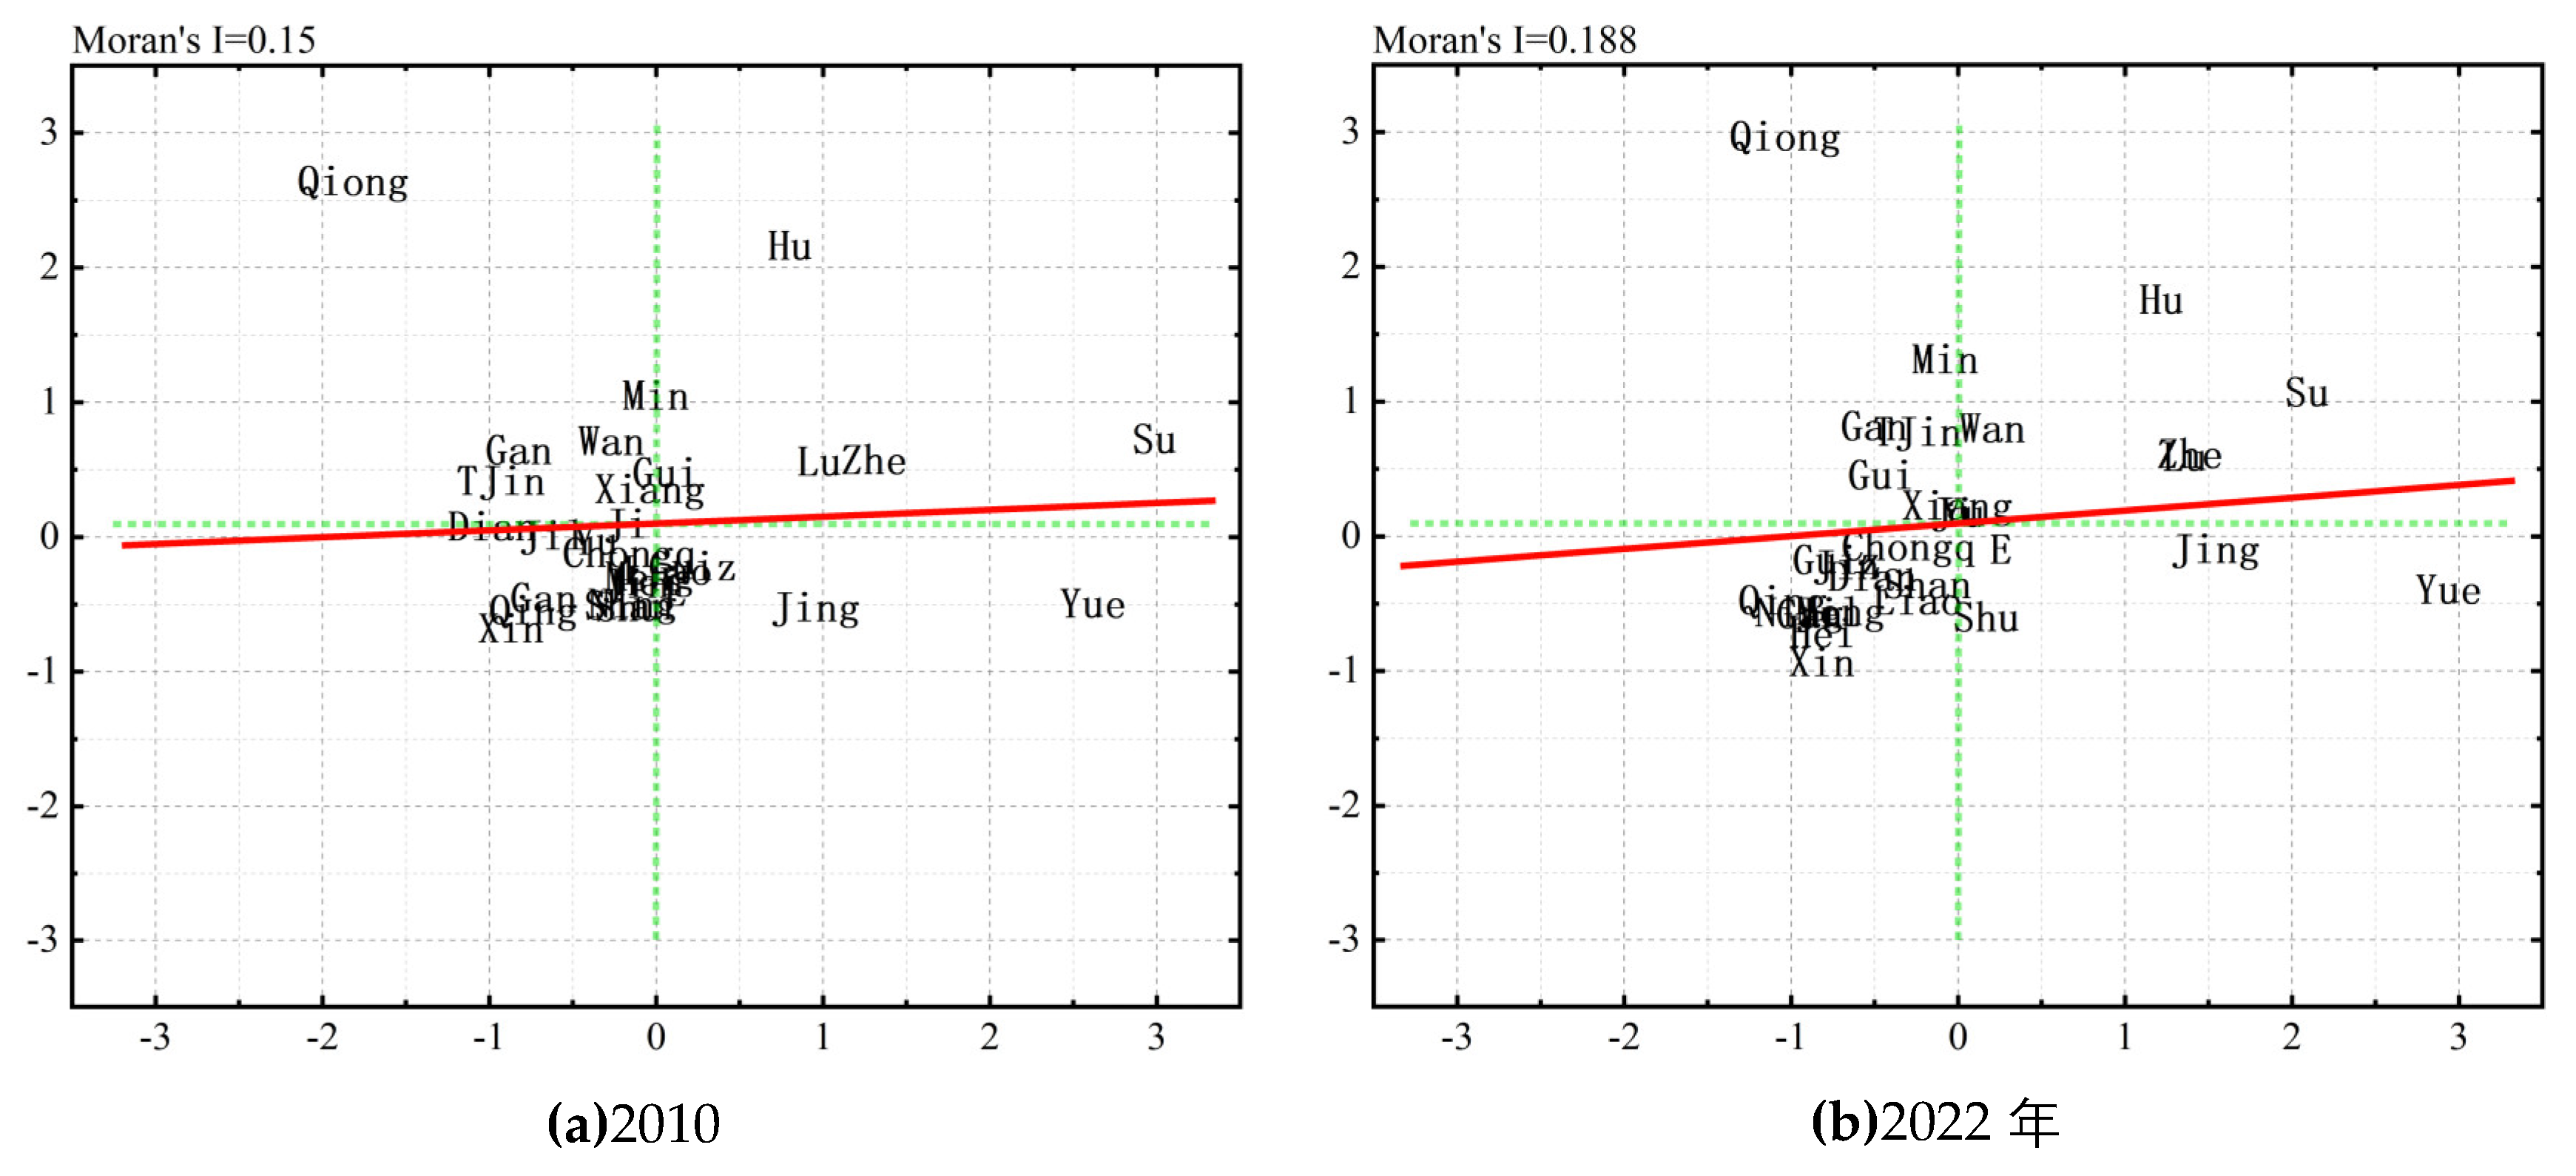
Figure 5.
Geographical Agglomeration Trend Map for the Development of Artificial Intelligence: 2010 (Left) vs. 2022 (Right).
Figure 5.
Geographical Agglomeration Trend Map for the Development of Artificial Intelligence: 2010 (Left) vs. 2022 (Right).
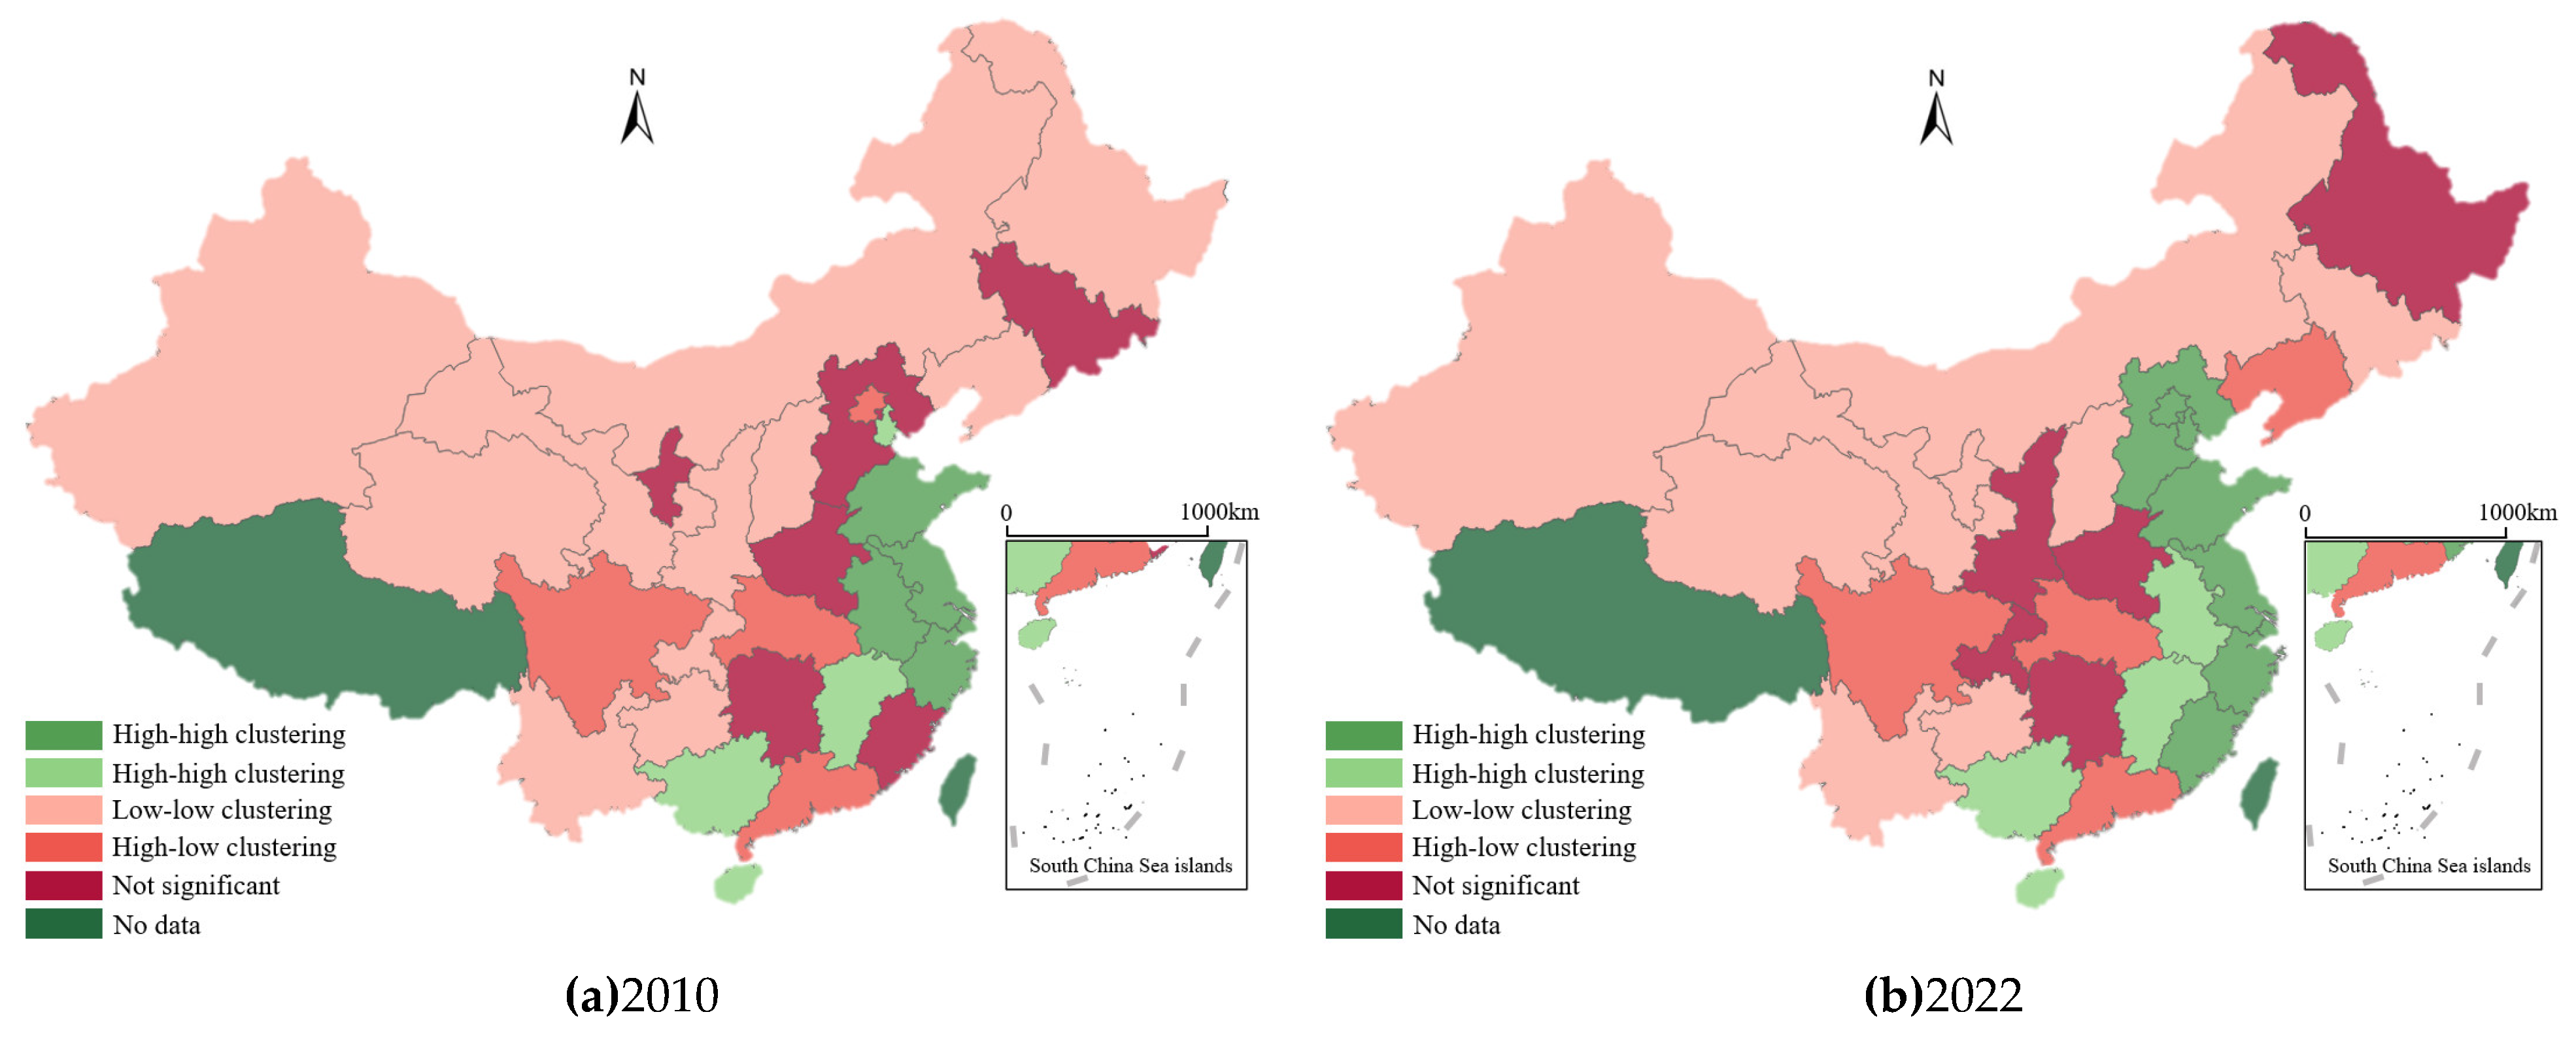
Figure 6.
Scatter Plot of Moran’s Index for the Development Level of New Quality Productivity: 2010 (Left) vs. 2022 (Right).
Figure 6.
Scatter Plot of Moran’s Index for the Development Level of New Quality Productivity: 2010 (Left) vs. 2022 (Right).
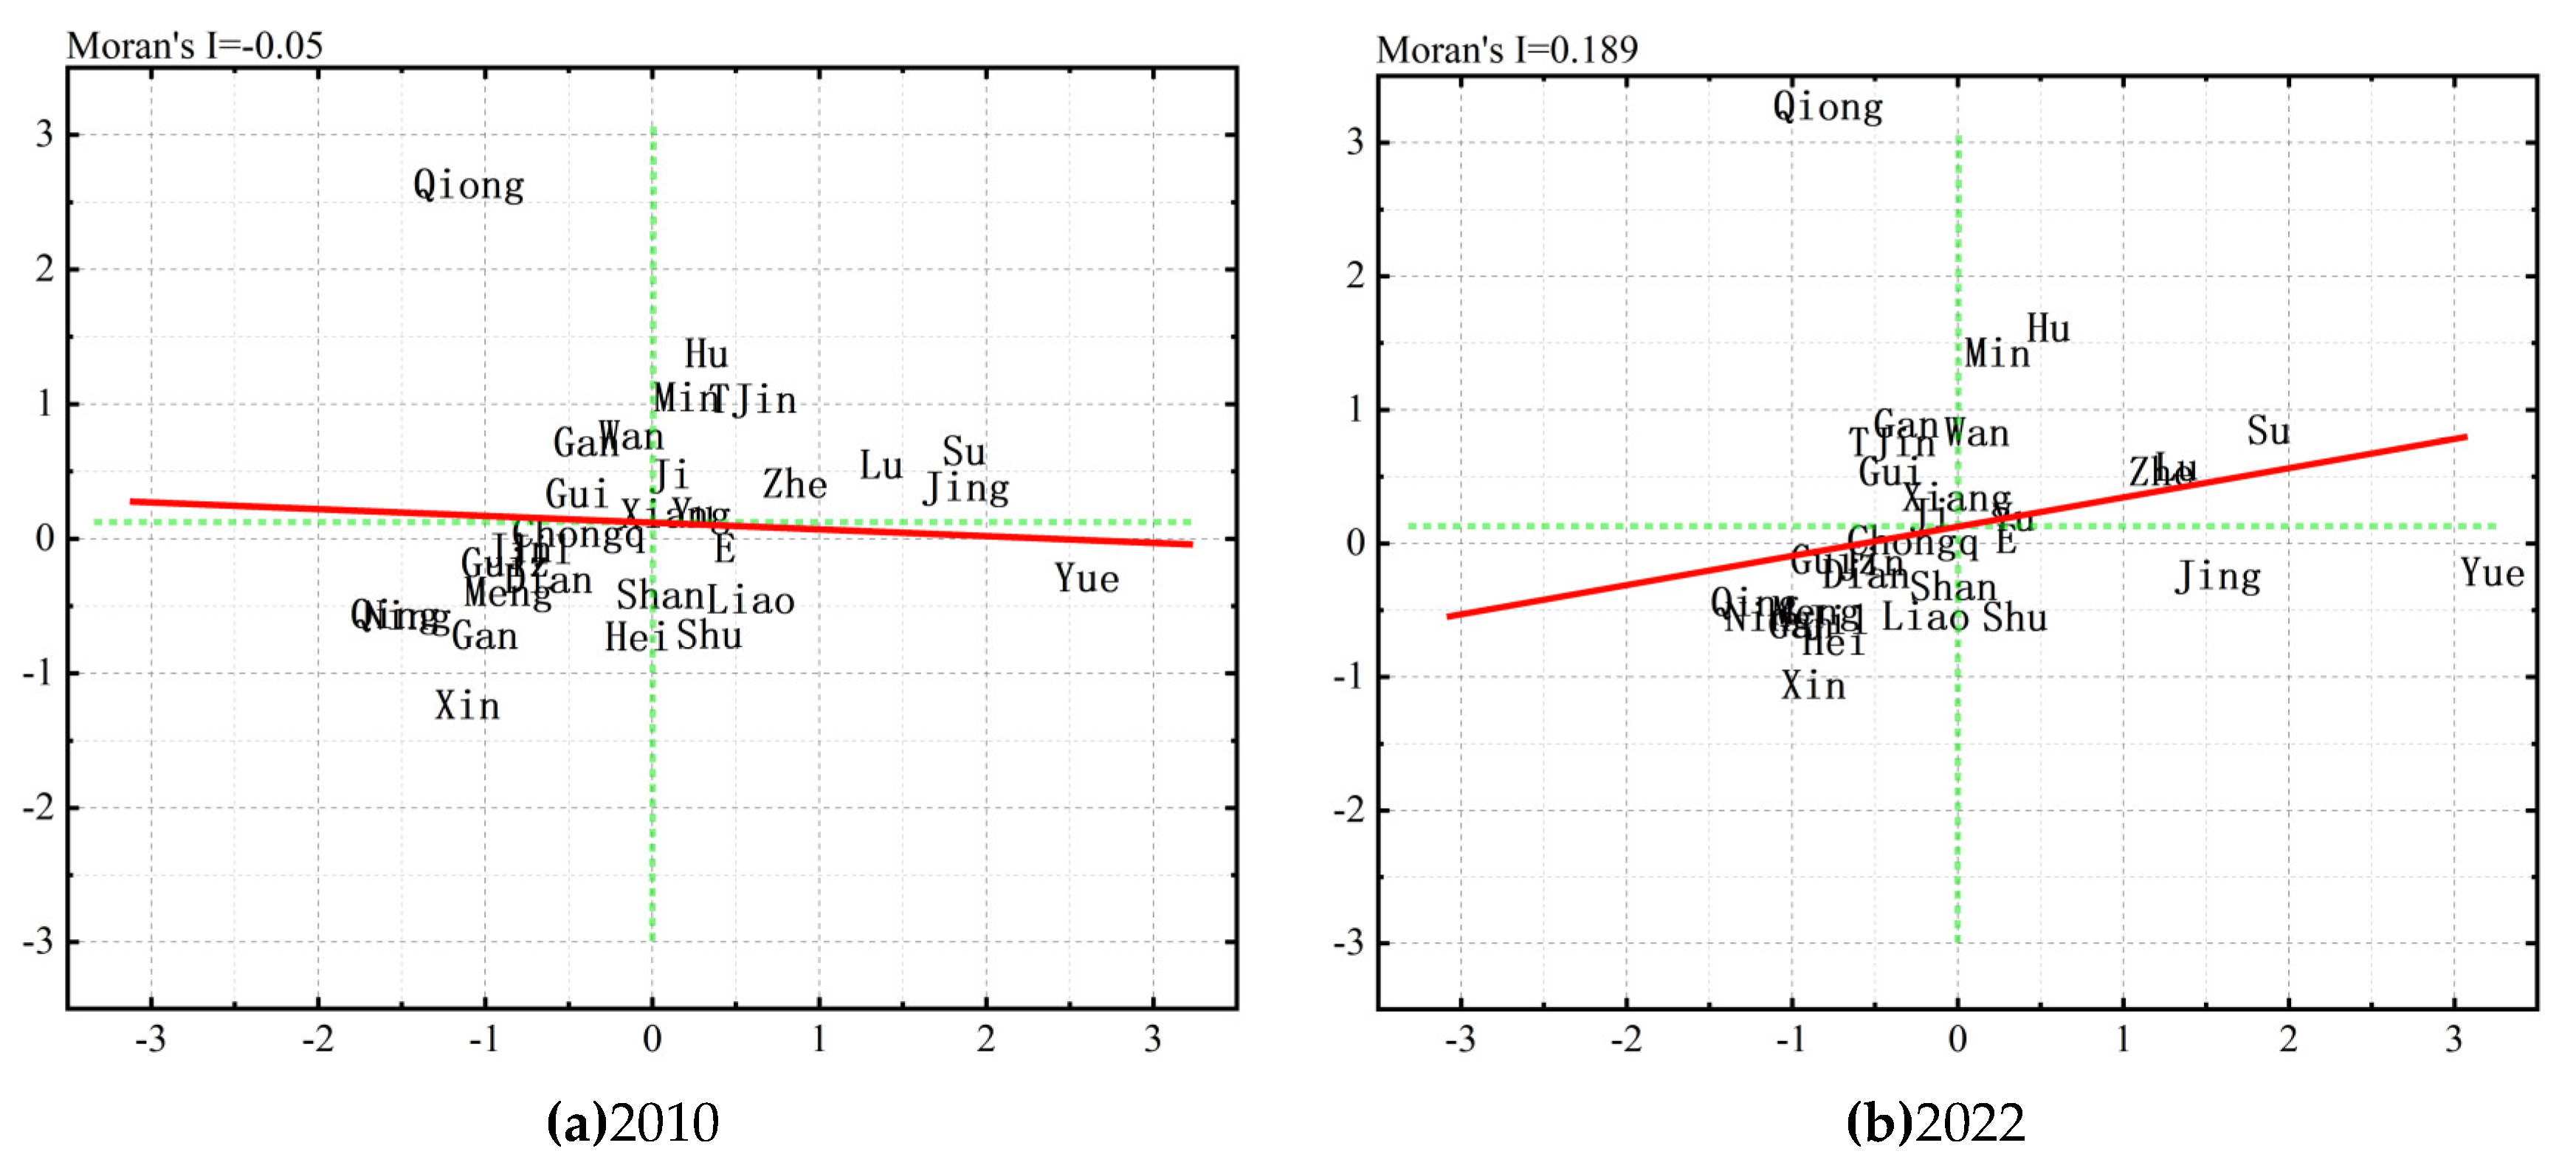
Figure 7.
Geographical Agglomeration Trend Map for the Development of New Quality Productivity: 2010 (Left) vs. 2022 (Right).
Figure 7.
Geographical Agglomeration Trend Map for the Development of New Quality Productivity: 2010 (Left) vs. 2022 (Right).
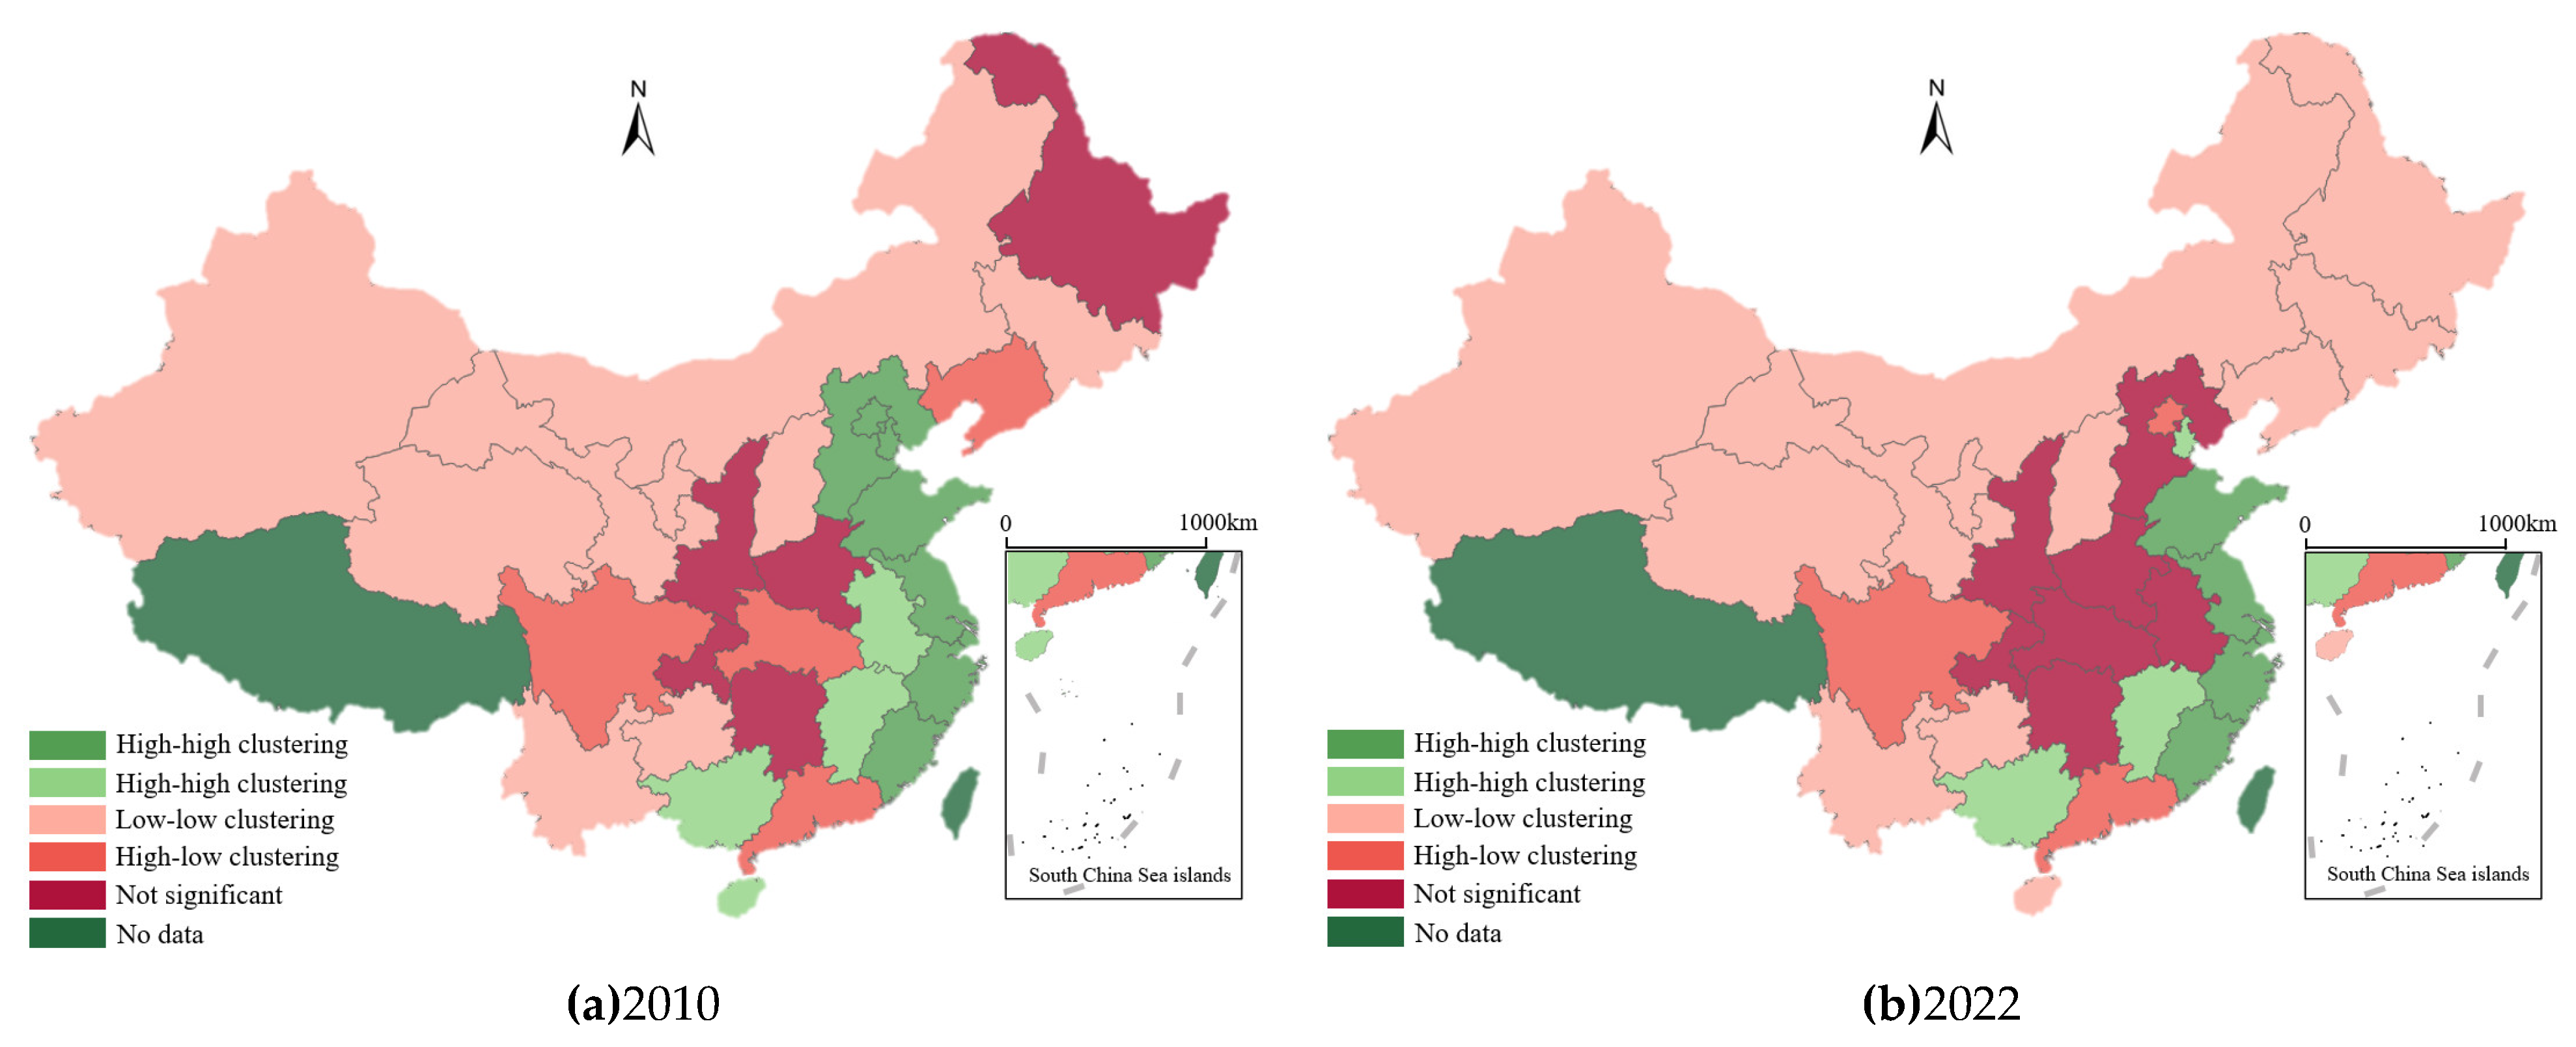
Figure 8.
Quantile Regression Plot.
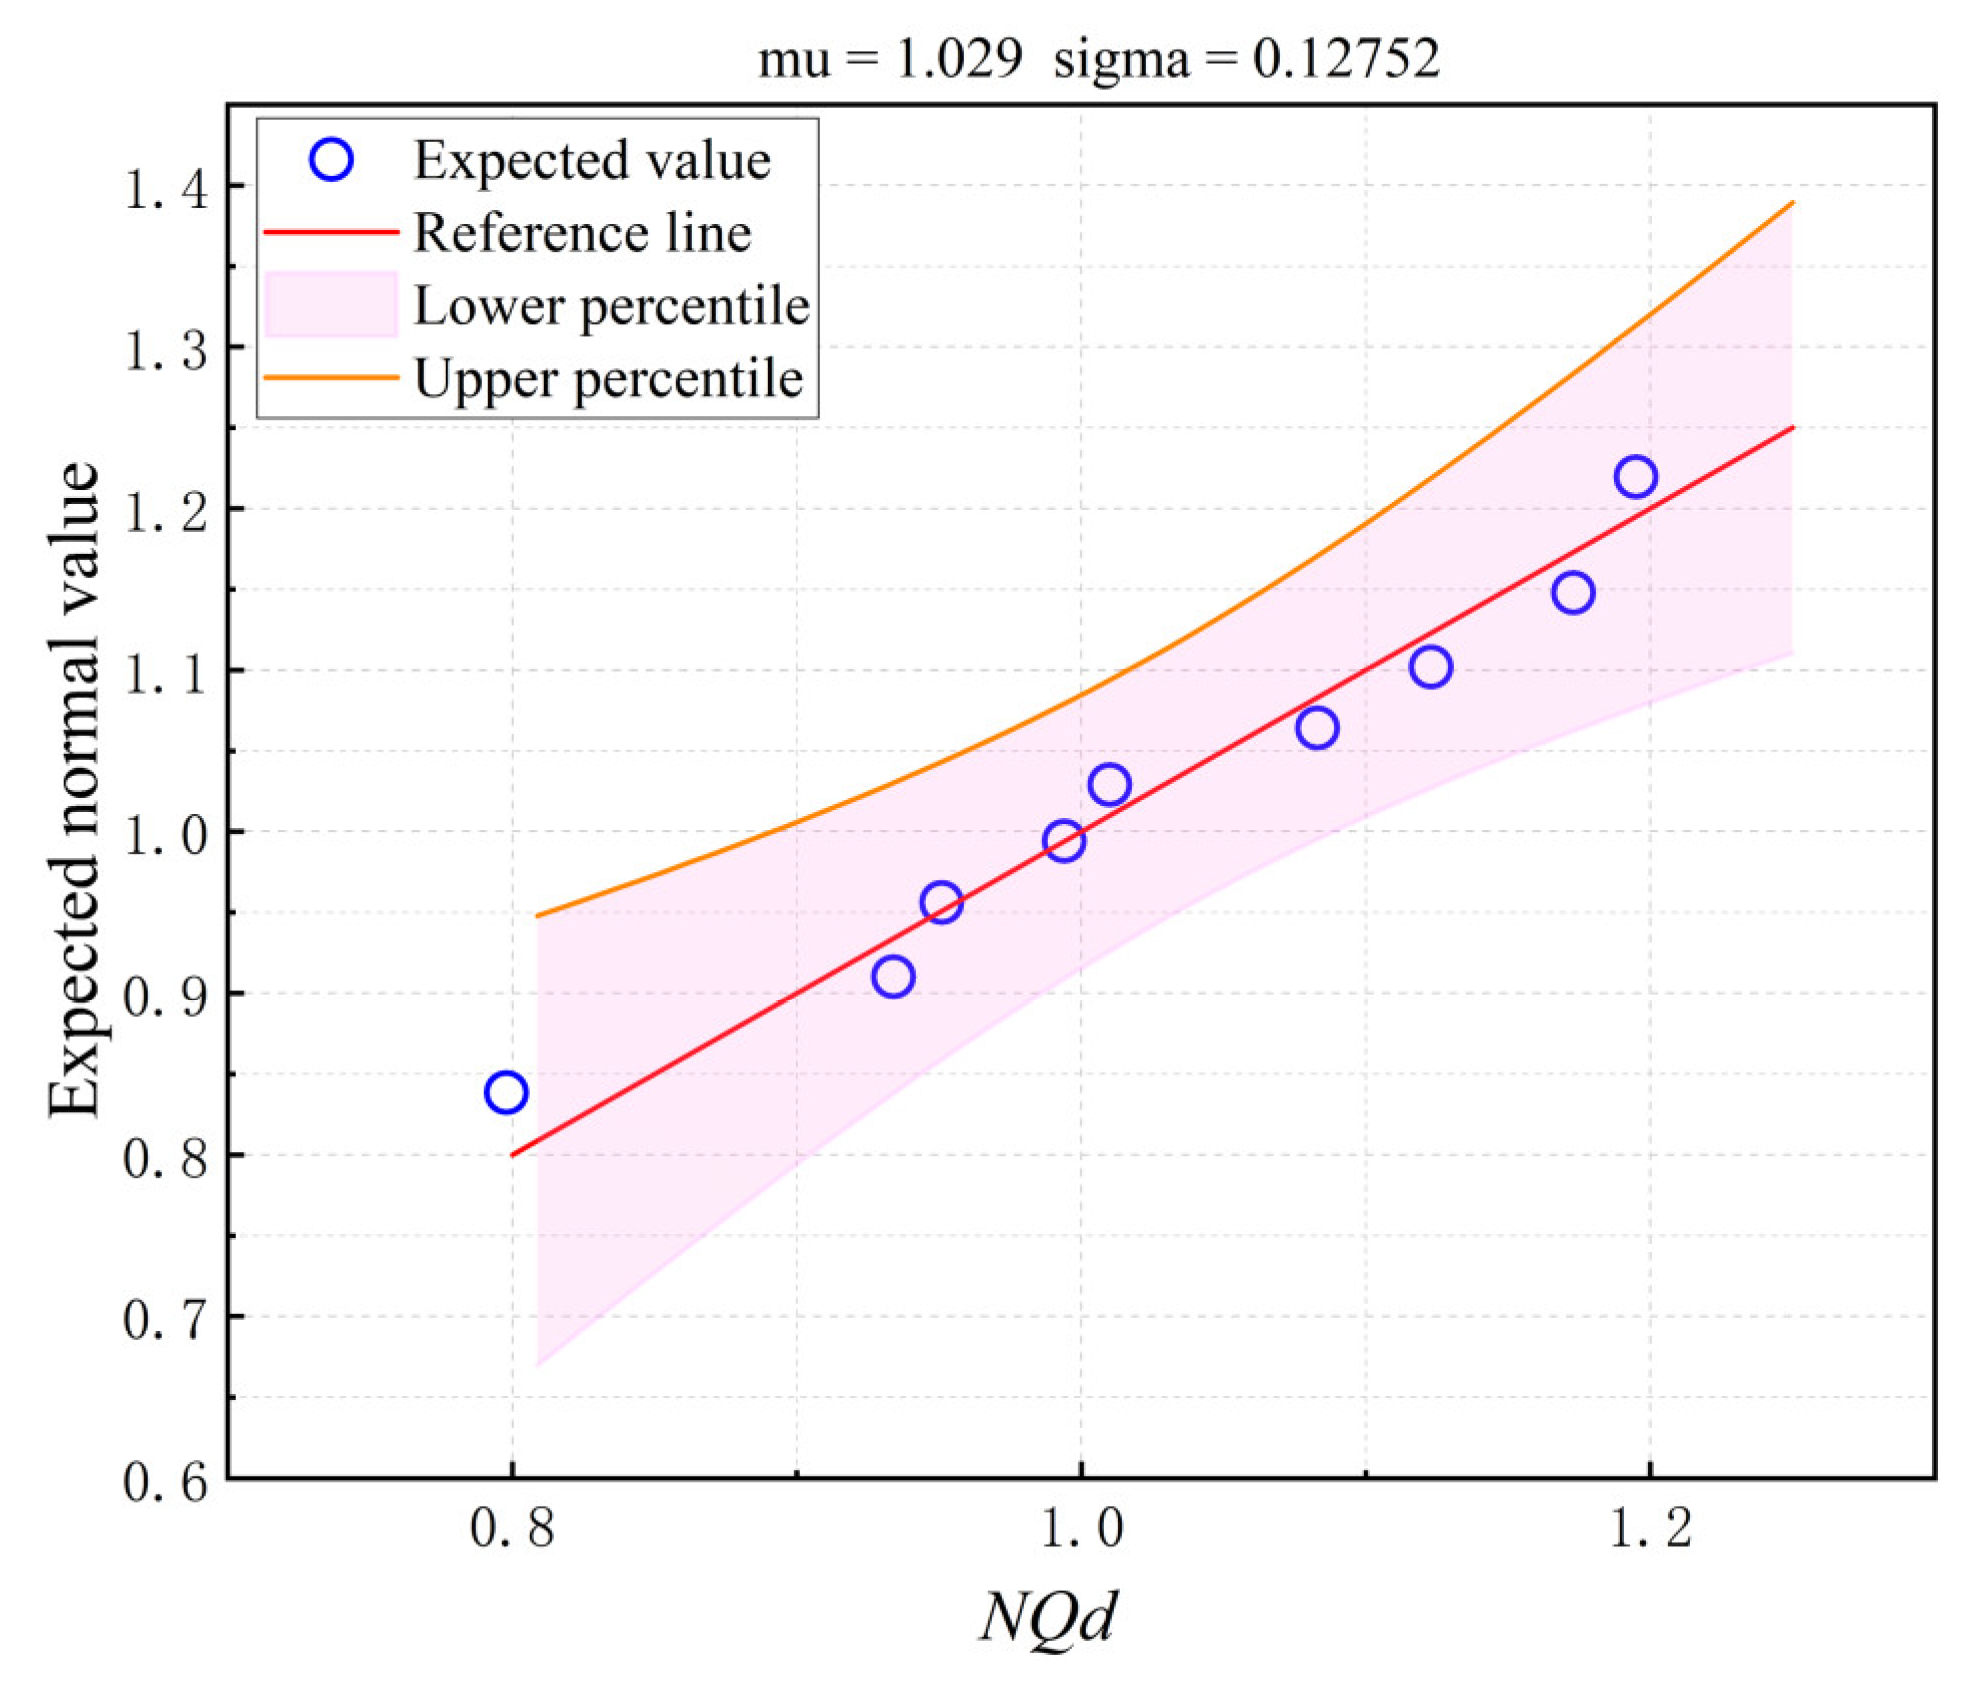

Table 1.
Evaluation Indicator System for the Development Level of New Quality Productivity.
| Primary Indicator | Secondary Indicator | Tertiary Indicator | Nature | Definition |
|---|---|---|---|---|
| High-quality Productivity | Innovation Productivity | Innovation R&D | + | Regional patent grants |
| Innovative Industry | + | Revenue of high-tech industries | ||
| Innovation Input | + | Large-scale industrial firms’ innovation funding | ||
| Technical Productivity | Technical R&D | + | Full-time R&D staff in large industrial enterprises | |
| Technical Scale | + | Urban jobs in IT and communication sectors | ||
| Technology Market | + | Tech market sales volume | ||
| High-efficiency Productivity | Industrial Digitalization | Network Penetration | + | Broadband access port count |
| Software Business | + | Revenue of software business | ||
| E-commerce | + | E-commerce sales | ||
| Digital Industrialization | Telecommunication Business Communication | + | Total volume of telecommunication business | |
| Circuit Transfer | + | Length of optical cable lines | ||
| Electronic Information Manufacturing | + | Mobile phone penetration rate | ||
| High-quality Productivity | Resource-saving Type | Energy Intensity | - | Energy consumption / GDP |
| Water Intensity | - | Industrial water usage / GDP | ||
| Energy Consumption | - | Electricity consumption /GDP | ||
| Environment-friendly Type | Waste Utilization | + | Efficient use of industrial solid waste | |
| Wastewater Discharge | - | Industrial wastewater discharge / GDP | ||
| Waste Gas Emission | - | Industrial SO2 emission / GDP |
Table 2.
Evaluation Indicator System for the Development Level of Artificial Intelligence.
| Primary Indicator | Sub-Indicator | Nature | Definition |
|---|---|---|---|
| Technological Innovation | Innovation Level | + | Number of AI patent applications |
| Development Scale | + | Number of AI patent applications | |
| R&D Investment | + | Education funding | |
| Educational Talent | Science and Technology Talent | + | Number of legal entities in scientific research and technical service industries |
| Higher Education Institutions | + | Number of general higher education institutions | |
| Higher Education Talent | + | Number of students in general higher education institutions | |
| Industrial Development | Automation Equipment Index | + | Number of industrial robots |
| Inclusive Finance Index | + | Digital Inclusive Finance Index | |
| Industrial Optimization | + | Tertiary Industry Growth Index | |
| Social Environment | Information Service Index | + | Number of legal entities in information transmission, software, and information technology services |
| Judicial Capacity Building | + | Number of rule of law workers | |
| Software Economic Contribution | + | Software business revenue |
Table 3.
Descriptive Statistical Analysis of Key Variables.
| Variable Definitions | Symbol | N | Mean | Statistics | Min | Max | |
|---|---|---|---|---|---|---|---|
| Dependent Variable | Level of New Quality Productivity Development | NQd | 14430 | 0.2513 | 0.1386 | 0.0855 | 0.9515 |
| Independent Variable | Level of Artificial Intelligence Development | AIL | 14430 | 0.1663 | 0.1261 | 0.0209 | 0.8981 |
| Control Variables | Labor Force Level | Labl | 14430 | 7.6002 | 0.7685 | 5.5451 | 8.8639 |
| Degree of Openness | Opnd | 14430 | 0.2555 | 0.2945 | 0.0003 | 1.5481 | |
| Fiscal Support Intensity | FisuP | 14430 | 0.25 | 0.1051 | 0.11 | 0.76 | |
| Urbanization Level | UrblV | 14430 | 0.5904 | 0.1235 | 0.3401 | 0.9301 | |
| Technology Market Development Level | TechL | 14430 | 0.0204 | 0.0297 | 0.0000 | 0.1901 | |
| Mediating Variables | R&D Innovation Level | RDi | 14430 | 0.0170 | 0.0114 | 0.0034 | 0.0652 |
| Industrial Structure Upgrade | Inds | 14430 | 1.1252 | 0.6457 | 0.4943 | 5.2968 |
Table 4.
Annual Moran’s Index Table.
| Artificial Intelligence Development Level | New Quality Productivity Development Level | |||||||
|---|---|---|---|---|---|---|---|---|
| Year | Moran’s I | Z | P | Result | Moran’s I | Z | P | Result |
| 2010 | 0.15 | 1.675 | 0.027 | Significant | -0.05 | 0.795 | 0.213 | Insignificant |
| 2011 | 0.115 | 1.363 | 0.047 | Significant | 0.062 | 0.915 | 0.18 | Insignificant |
| 2012 | 0.135 | 1.541 | 0.086 | Insignificant | 0.115 | 1.413 | 0.079 | Insignificant |
| 2013 | 0.111 | 1.33 | 0.062 | Insignificant | 0.133 | 1.575 | 0.058 | Insignificant |
| 2014 | 0.136 | 1.559 | 0.092 | Insignificant | 0.147 | 1.687 | 0.046 | Significant |
| 2015 | 0.15 | 1.69 | 0.039 | Significant | 0.167 | 1.868 | 0.031 | Significant |
| 2016 | 0.169 | 1.876 | 0.03 | Significant | 0.169 | 2.072 | 0.019 | Significant |
| 2017 | 0.168 | 1.887 | 0.03 | Significant | 0.171 | 1.96 | 0.025 | Significant |
| 2018 | 0.169 | 1.277 | 0.021 | Significant | 0.176 | 1.871 | 0.031 | Significant |
| 2019 | 0.173 | 1.604 | 0.044 | Significant | 0.171 | 1.829 | 0.034 | Significant |
| 2020 | 0.174 | 1.866 | 0.031 | Significant | 0.178 | 1.797 | 0.036 | Significant |
| 2021 | 0.179 | 2.002 | 0.023 | Significant | 0.188 | 2.063 | 0.02 | Significant |
| 2022 | 0.188 | 1.903 | 0.029 | Significant | 0.189 | 2.068 | 0.019 | Significant |
Table 5.
Baseline Regression Results.
| Variable | (1) | (2) | (3) | (4) | (5) | (6) |
|---|---|---|---|---|---|---|
| AIL | 0.816*** (55.568) |
0.817*** (57.215) |
0.779*** (41.671) |
0.780*** (41.862) |
0.955*** (46.178) |
0.914*** (43.434) |
| Labl | 0.088*** (4.690) |
0.073*** (3.805) |
0.075*** (3.929) |
0.024 (1.456) |
0.059*** (3.508) |
|
| Opnd | -0.043*** (-3.118) |
-0.042*** (-3.022) |
-0.001 (-0.006) |
0.014 (1.211) |
||
| FisuP | 0.077* | 0.099*** (3.014) |
0.099*** (3.172) |
|||
| Urblv | -0.352*** | -0.365*** (-13.805) |
||||
| TechL | 0.658*** (5.841) |
|||||
| Cons | 0.116*** (42.552) |
-0.556*** (-3.882) |
-0.424*** (-2.866) |
-0.460*** (-3.101) |
0.095 (0.730) |
-0.171 (-1.290) |
| Province Fixed Effects | YES | YES | YES | YES | YES | YES |
| Year Fixed Effects | YES | YES | YES | YES | YES | YES |
| N | 390 | 390 | 390 | 390 | 390 | 390 |
| R2 | 0.8958 | 0.9019 | 0.9045 | 0.9055 | 0.9352 | 0.9409 |
Note:***p<0.01,**p<0.05,*p<0.1, the same for the following.
Table 6.
Robustness Test Results.
| (1) | (2) | (3) | |
|---|---|---|---|
| Substitute explanatory variable | Change regression model | Trimming of the sample | |
| AIL | 0.948*** (41.352) |
0.937*** (42.031) |
|
| Cons | -0.584*** (-2.997) |
0.090 (1.312) |
-0.157 (-1.183) |
| Control Variables | YES | YES | YES |
| Year Fixed Effects | YES | YES | YES |
| Province Fixed Effects | YES | YES | YES |
| N | 390 | 390 | 390 |
| R2 | 0.8709 | 0.9348 | 0.9383 |
Table 7.
Endogeneity Test Results.
| (1) | (2) | (3) | (4) | |
| Lagged Two Periods | Lagged Three Periods | Lagged Four Periods | Word Frequency of Artificial Intelligence | |
| NQd | ||||
| AIL | 1.018*** (39.738) |
0.991*** (39.146) |
0.981*** (38.748) |
0.423** (2.003) |
| Control Variables | YES | YES | YES | YES |
| Cragg-Donald Wald Fstatistic | 9258.496 | 5882.402 | 3813.912 | 13.282 |
| Kleibergen-Paap rk Wald F statistic | 1958.256 | 1528.673 | 1269.487 | 13.146 |
| Kleibergen-Paap rk LM statistic | 324.360 | 295.133 | 265.476 | 13.072 |
| Year Fixed Effects | YES | YES | YES | YES |
| Province Fixed Effects | YES | YES | YES | YES |
| N | 390 | 390 | 390 | 390 |
| R2 | 0.9449 | 0.9492 | 0.9563 | 0.8260 |
Table 8.
Regional Heterogeneity Analysis Results.
| Variable | (1) | (2) | (3) | (4) | (5) | (6) |
| Eastern | Central and Western | Coastal | Non-coastal | Technology-intensive Area | Non-technology-intensive Area | |
| AIL | 0.863*** (31.591) |
1.025*** (19.238) |
0.860*** (29.598) |
1.059*** (29.265) |
0.890*** (29.380) |
0.981*** (21.954) |
| Cons | -0.689*** (-3.544) |
0.318 (1.605) |
-0.020 (-0.080) |
-0.042 (-0.274) |
0.143 (0.600) |
0.029 (0.194) |
| Control Variables | YES | YES | YES | YES | YES | YES |
| Year Fixed Effects | YES | YES | YES | YES | YES | YES |
| Province Fixed Effects | YES | YES | YES | YES | YES | YES |
| N | 169 | 221 | 143 | 247 | 130 | 260 |
| R2 | 0.9694 | 0.8331 | 0.9707 | 0.8773 | 0.9709 | 0.8256 |
Table 9.
Heterogeneity Analysis Results of Empowerment Effects.
| Variable | (1) | (2) | (3) |
| High Technology | High Efficiency | High Quality | |
| AIL | 0.545*** (57.211) |
0.279*** (14.745) |
0.090*** (8.635) |
| Cons | -0.034 (-0.571) |
-0.440*** (-3.676) |
0.303*** (4.625) |
| Control Variables | YES | YES | YES |
| Year Fixed Effects | YES | YES | YES |
| Province Fixed Effects | YES | YES | YES |
| N | 390 | 390 | 390 |
| R2 | 0.9692 | 0.8434 | 0.8603 |
Table 10.
Quantile Regression Results.
| Percentiles | (1) | (2) | (3) | (4) |
| q=0.2 | q=0.4 | q=0.6 | q=0.8 | |
| AIL | 0.934*** (12.228) |
0.994*** (21.290) |
1.083*** (21.172) |
1.173*** (24.921) |
| Cons | -0.118*** (-2.736) |
-0.066 (-0.723) |
0.113 (1.124) |
0.456*** (3.813) |
| Control Variables | YES | YES | YES | YES |
| Year Fixed Effects | YES | YES | YES | YES |
| Province Fixed Effects | YES | YES | YES | YES |
| N | 390 | 390 | 390 | 390 |
| R2 | 0.6124 | 0.6650 | 0.7187 | 0.7777 |
Table 11.
Mediation Effect Test Results Table.
| Variable | Category | Effect Value | 95% Confidence Interval | Standard Error | p-value | Effect Contribution |
|---|---|---|---|---|---|---|
| RDi | Direct Effect | 0.439 | [0.375,0.504] | 0.000 | 0.000 | 46.496% |
| Mediation Effect | 0.484 | [0.371,0.502] | ||||
| Inds | Direct Effect | 0.439 | [0.375,0.504] | 0.061 | 0.000 | 51.279% |
| Mediation Effect | 0.534 | [0.411,0.563] |
Table 12.
Model Test Results.
| Test | Numerical Value |
|---|---|
| LM(error )test | 106.192*** |
| Robust LM(error )test | 97.510*** |
| LM(lag )test | 10.519*** |
| Robust LM(lag)test | 1.837 |
| LR test null hypothesis: SDM is reducible to SEM | 30.07*** |
| LR test null hypothesis: SDM can degenerate into SAR | 25.04*** |
| Hausman test | 33.67*** |
| LR test null hypothesis: Individual fixed effects are superior to double fixed effects | 73.70*** |
| LR test null hypothesis: Time fixed effects are superior to double fixed effects | 658.89*** |
Table 13.
Model Estimation Results.
| SDM | |||
|---|---|---|---|
| 0.181*** (2.805) |
|||
| AIL | 0.937*** (54.804) |
W*AIL | 0.194*** (3.104) |
| Labl | 0.001 (0.071) |
W*Labl | 0.102*** (3.023) |
| Opnd | -0.003 (-0.214) |
W*Opnd | -0.019 (-0.919) |
| FisuP | 0.034 (1.211) |
W*FisuP | -0.106* (-1.895) |
| UrblV | -0.374*** (-6.056) |
W*UrblV | 0.164 (1.297) |
| TechL | 0.715*** (8.160) |
W*TechL | -0.280 (-1.611) |
| Year fixed effects | YES | ||
| Province fixed effects | YES | ||
| N | 390 | ||
| R2 | 0.9394 | ||
Table 14.
The decomposition results of the spatial effects model.
| Variable | Direct Effect | Indirect Effect | Total Effect |
|---|---|---|---|
| AIL | 0.936*** | 0.030 | 0.906*** |
| (57.023) | (1.020) | (26.686) | |
| Labl | 0.006 | 0.121*** | 0.127*** |
| (0.406) | (2.897) | (2.777) | |
| Opnd | -0.004 | -0.024 | -0.027 |
| (-0.328) | (-0.949) | (-0.948) | |
| FisuP | 0.033 | -0.111* | -0.078 |
| (1.212) | (-1.714) | (-1.054) | |
| UrblV | -0.369*** | 0.128 | -0.241 |
| (-6.128) | (0.900) | (-1.548) | |
| TechL | 0.710*** | -0.187 | 0.523** |
| (8.255) | (-0.942) | (2.360) |
Disclaimer/Publisher’s Note: The statements, opinions and data contained in all publications are solely those of the individual author(s) and contributor(s) and not of MDPI and/or the editor(s). MDPI and/or the editor(s) disclaim responsibility for any injury to people or property resulting from any ideas, methods, instructions or products referred to in the content. |
© 2024 by the authors. Licensee MDPI, Basel, Switzerland. This article is an open access article distributed under the terms and conditions of the Creative Commons Attribution (CC BY) license (https://creativecommons.org/licenses/by/4.0/).
Copyright: This open access article is published under a Creative Commons CC BY 4.0 license, which permit the free download, distribution, and reuse, provided that the author and preprint are cited in any reuse.


