Submitted:
16 May 2024
Posted:
16 May 2024
You are already at the latest version
Abstract
Micronutrient deficiencies remain a public health burden among non-pregnant women in developing countries, including Nepal. Hence, this study examined micronutrient deficiencies among non-pregnant Nepalese women aged 15-49 using the 2016 Nepal National Micronutrient Status Survey (NNMSS). Data on 2143 non-pregnant women was extracted from the 2016 NNMSS. The study analysed ferritin, soluble transferrin receptor (sTfR), red blood cell (RBC) folate and zinc. Multivariable logistic analysis was carried out to assess factors associated with micronutrient deficiencies. Prevalence of ferritin, sTfR, folate, and zinc were 19%, 13%, 16% and 21%, respectively. Non-pregnant women from the Janajati region were significantly less prone to ferritin [adjusted odds ratio (AOR): 0.45; 95% confidence interval (CI): 0.25, 0.80], and those who had body mass index (BMI) of 25 kg/m2 or higher had significantly higher odds of ferritin [AOR: 2.69; 95% CI: 1.01, 7.17]. Non-pregnant women aged 35-49 years were significantly less predisposed to folate deficiency [AOR: 0.58; 95% CI: 0.40, 0.83], and the likelihood of zinc deficiency was significantly lower among non-pregnant women from richer households [AOR: 0.48; 95% CI: 0.31, 0.76]. The study provides further insight into screening high-risk subgroups and instituting public health interventions to address the prevailing micronutrient deficiencies among non-pregnant Nepalese women.
Keywords:
Micronutrients
; women
; deficiencies
; non-pregnant women
; Nepal
1. Introduction
Micronutrient deficiency arises from the insufficiencies of minerals and soluble vitamins [1]. The most common micronutrient deficiency includes folate, vitamin A, iron, iodine, and zinc. Deficiencies of these micronutrients may adversely affect an individual’s physical, mental and cognitive development [2,3].There is evidence that an estimated two billion people suffer from deficiencies in vital micronutrients [4,5]. Globally, nutritional iron deficiency (which may cause anaemia, reduced working and learning capacity, increased maternal and infant mortality, low birth weight and impaired function at all stages of human life [6]) seems to be the most prevalent among the micronutrients [7,8].
Nutritional iron deficiency is said to arise when physiological requirements are unable to be met by absorption of iron that arises from diet [9]. Furthermore, in populations where the consumption of plant-based diets is monotonous, dietary iron bioavailability has been found to be low [9]. The status of micronutrients varies significantly between populations and throughout pregnancy. Nutritional iron deficiency has been found to affect all populations across the globe and has been found to be most common in developing countries [10,11]; and this has substantial health and economic costs, which may include poor pregnancy outcomes, impaired academic performance among school children and a decrease in productivity [9]. Zinc plays a key role in the catalytic activity of about 100 enzymes [12], and is also vital in immune function [13,14,15], synthesis of protein [14], wound healing [16], and supports normal pregnancy growth and development, as well as normal growth during childhood and adolescence [17]. Additionally, a zinc shortage has been linked to impaired cognition and behaviour [15]. Deficiency in zinc is characterised by loss of appetite, hair loss, diarrhoea, delayed sexual maturation, impotence in males, as well as eye and skin lesions [18,19]. An individual obtains folate by consuming foods which are high in dietary folate such as green leafy vegetables, legumes, and fortified cereals. Individuals with deficiencies of folate are prone to disorders such as neural tube and other birth defects, heart disease, stroke and depression.
The extant literature is replete with studies on micronutrient deficiencies in Nepal [6,20,21,22,23,24,25]. However, whilst some studies merely examined the prevalence and causes of micronutrients [6,20], others were limited in scope; for instance, one study assessed the micronutrient deficiencies among adolescents but limited them to refugees [22]. Other studies also focus on children aged 6-59 months[26,27]. Although micronutrient deficiencies have significant adverse effects on women's overall well-being and health, little is known about the socio-demographic and dietary habits that contribute to micronutrient deficiencies in non-pregnant Nepalese women. This current study utilised data from the Nepal National Micronutrient Status Survey (NNMSS) to examine the association of iron, folate and zinc deficiencies with individual-, household-, community-level factors, as well as health status and diet habit factors among non-pregnant women in Nepal. By identifying the significant factors associated with these deficiencies, our study can inform the government of Nepal, public health practitioners and other stakeholders to plan more effective interventions for micronutrient deficiency alleviation in Nepal by targeting the most vulnerable populations.
2. Materials and Methods
2.1. Data Source, Design and Participants
The current study utilised data from the 2016 Nepal National Micronutrient Status Survey (NNMSS). The NNMS, which is cross-sectional, population-based, and nationally representative in design, was stratified to showcase representative estimates for Nepal’s five development regions, namely, Eastern, Central, West, Midwest and Far West; and of the three ecological zones of the whole Nepal. The ecological zones are The Terai (plains), Hills, and Mountains. Details of the NNMSS can be obtained from the extant literature [28]. We collected nationally representative samples of adolescent non-pregnant Nepalese women aged between 15 and 49 years.
2.2. Data Collection
Information on each household and for each of the non-pregnant women aged 15-49 years was collected with the use of administered questionnaires. The household questionnaire was used to identify all members of the household who were eligible to participate in the survey (i.e., one of the target groups). The questionnaire for the non-pregnant women was used to collect information on socio-demographic characteristics; participation in key national nutrition and other interventions; recent micronutrient supplementation intake (zinc, iron, folic acid, multiple micronutrients) and if consumed within the last 24 hours, timing since intake for zinc supplementation; time since last meal; intake of various food groups and beverages including animal source foods, dark leafy greens, ability to see during the day and night (night blindness) in the last two weeks; smoking habits; two-week recall of fever, cough, and diarrhoea; and anthropometric measures. Informed consent was obtained after respondents were educated on the survey goals, procedures, risks and benefits, and how important their participation in the survey could be to the improvement of health in the society.
2.3. Outcome Indicators
In this current study, the outcome variables for the present study were deficiencies of the iron (ferritin concentrations), iron (sTfR concentrations), folate and zinc. Assessment of iron deficiency/ferritin covered all five regions and the three ecological zones. The World Health Organisation (WHO)’s recommended indicator of iron deficiency in populations is ferritin, which is a measure of iron stores in the body and is an acute-phase reactant protein which is influenced by inflammation and infections. Ferritin is analysed at low cost using the Enzyme-linked immunosorbent assay (ELISA) method. An indicator of iron insufficiency when iron stores are depleted (and assuming the absence of other causes of abnormal erythropoiesis) is known as soluble transferrin receptor (sTfR), which can be elevated by thalassemia and is thought to be less influenced by inflammation and infection than ferritin. The recommended volume for analysis for both ferritin and sTfR is 30μL. To analyse retinol-binding protein (RBT), the recommended volume was 30μL. The microbiological assay was the gold standard for analysing RBC folate [29]. The recommended volume for analysing RBC folate was 15 μL Iron deficiency was defined as if adjusted ferritin < 15.0 μg/L. Zinc deficiency was classified as zinc < 66.0 μg/dL for non-fasted morning samples and < 59.0 μg/dL for non-fasted afternoon samples for non-pregnant 15–49 years women[30,31]
2.4. Potential Covariates
Our choice of potential confounding factors for this study was informed by past studies on micronutrient deficiency [32,33,34,35,36], and also the available factors in the NNMSS. We grouped the potential confounding factors into individual-level, household-level, community-level, anthropometric, health status and diet habits (a day prior to the survey) factors.
The level of education and marital status of participants made up the individual-level factors. The household-level factors consisted of ethnicity and household wealth index of the participants. We applied the principal components analysis (PCA) method [37] to represent the household wealth index as a score of household assets. We assigned each de jure household member with scores after computing the index. Each household of participants was ranked by their score. The wealth index was categorised into five quintiles: the bottom 20% was classified as “poorest”, the next 20% was classified as poorer, the next 20% as “middle”, the next 20% as richer, and the top 20% as “richest”.
Geographical region and ecological zone (mountain, hills and terai) made up the community-level factors; the mean weight, height, stored body iron (BIS), and body mass index (BMI) constituted the anthropometric factors; health status factors were made up of contraction of fever, cough and diarrhoea in the last two weeks preceding the survey; and the diet habit factor consisted of consumption of the different food groups.
2.5. Statistical Analysis
All statistical analyses of this study were conducted by using STATA/MP version 14 (Stata Corp, College Station, TX, USA). To allow for adjustments for the cluster-sampling design and weight, we used the ‘Svy’ commands [38]. We first executed frequency tabulations to describe the data used in the study and the proportion of deficiencies of iron, folate and zinc; and only those that produced the proportion of >4% were used to determine associated factors because small prevalence (<4%) would result in wider confidence intervals and bias conclusion, and then survey mean analyses to calculate lower quartile (<25th percentile), middle quartile (≥25th percentile and ≤75th percentile), and upper quartile (baseline plasma values >75th percentile). The Taylor series linearization method was utilised during the estimation of confidence intervals (CIs) around prevalence estimates of the micronutrient deficiencies featured in this study. Additionally, the bivariable and multivariable logistic regression that adjusted for clustering and sampling weights to determine the odds ratios of deficiencies of micronutrients were calculated. We then performed a six-stage model as part of the multivariable logistic regression analysis to calculate the adjusted odds ratios of micronutrient deficiencies.
In the stage model, the individual-level factors were entered into the first model, and a manually executed elimination procedure to assess factors associated with micronutrient deficiencies at a 0.05 significance level was carried out. In the second model, the significant factors in the first stage were added to the household-level factors. The elimination process then followed this. A similar approach for the community-level, anthropometric, health status and diet habits factors in the third, fourth, fifth and sixth stages, was used.
In the final model, any co-linearity was tested for and reported. The odds ratios with 95% confidence intervals were then calculated to determine the adjusted risk of independent (possible confounding) variables.
3. Results
3.1. Characteristics of the Sample
Characteristics of the study participants are presented in Table 1. The study sample consisted of 2143 non-pregnant women aged between 15 and 49 years. The majority of the participants had no schooling (48%) and came from the Brahmi/Chettri caste group. The mean weight and height of the participants were 51.3 ± 9.9 kg and 151.4 ± 6.0 cm, respectively. The mean body iron stores (BIS) were 4.9 ± 3.8 mg/kg, and the majority of the participants (67%) had a BMI of between 19 and 25 kg/m2. About one-third of the non-pregnant women received iron and folic acid (IFA) supplements, while only 2% of them received any multivitamins. Apart from starchy foods and legumes and nuts, which the majority of participants consumed, a large majority of them did not consume other food groups.
3.2. Prevalence of Micronutrient Deficiencies
The serum concentrations of the micronutrients assessed in the current study are shown in Table 2. The mean serum concentration of iron (ferritin biomarker) was 38.9 ± 27.5 μg/L, and the mean serum concentration of folate was 593.3 ± 308.5 nmol/L. Proportions and 95% confidence intervals of deficiencies in the micronutrients are shown in Figure 1. Prevalence of deficiencies of the featured micronutrients was 19%, 13%, 16% and 21% for iron (ferritin concentrations), iron (sTfR concentrations), folate and zinc, respectively.
3.3. Factors Associated with Micronutrient Deficiencies
The odds of being iron deficient (sTfR concentrations) in non-pregnant women from the Janajati ethnic group were significantly lower compared with those from the Brahmin/Chettri ethnic group [AOR: 0.45; 95% CI: (0.25, 0.80)] (Table 3). However, non-pregnant women from the same ethnic group were significantly more likely to have iron deficiency (sTfR levels) compared with those from the Brahmi region [AOR: 2.42; 95% CI: (1.39, 4.21)].
The likelihood of iron deficiency (ferritin concentrations) was significantly higher among non-pregnant women whose BMI was ≥25 kg/m2, compared with those whose BMI was 18.5 ≤kg/m2 [AOR: 2.69; 95% CI: (1.01, 7.17)] (Table 3).
Non-pregnant women from other ethnic groups other than the Janajati and Dalit castes were significantly more predisposed to folate deficiency compared with those from the Brahmin ethnic group [AOR: 2.79; 95% CI: (1.69, 4.61)] (Table 3). Furthermore, non-pregnant women from the Far-western region were significantly more likely to be folate deficient compared with those from the eastern region [AOR: 3.10; 95% CI: (1.48, 6.49)]. Non-pregnant women aged 25-34 years were significantly less prone to folate deficiency compared with those aged 15-24 years [AOR: 0.63; 95% CI: (0.48, 0.83)]. The likelihood of folate was significantly lower among non-pregnant women from the richest households compared with those from the poorest households [AOR: 0.55; 95% CI: (0.30, 0.99)]. Non-pregnant women who consumed vitamin A-rich foods were significantly more prone to folate deficiency compared with those who did not [AOR: 2.34; 95% CI: (1.52, 3.61)] (Table 3).
The odds of zinc deficiency among non-pregnant women from the richer households were significantly lower compared to those from the poorest households [AOR: 0.48; 95% CI: (0.31, 0.76)]. The likelihood of zinc deficiency was also significantly higher among non-pregnant women aged 35-49 years compared with those ages 15-24 years [AOR: 1.39; 95% CI: (1.01, 1.93)].
4. Discussion
In the current study, we identified factors associated with deficiencies in some micronutrients (i.e., ferritin concentrations, sTfR concentrations, folate and zinc) among non-pregnant Nepalese women aged 15-49 years. Some of the factors were: ethnic differences, regional differences, non-consumption of folic acid (IFA) supplements, high BMI (sTfR concentrations), low BMI (ferretin concentrations), non-consumption of some food groups such as meats and fish and household poverty.
The risk of iron deficiency (ferritin concentrations) among non-pregnant women from the Janajati ethnic group of Nepal was found to be significantly less compared with those from the Brahmin ethnic group. Another study done in Nepal also found the increased odds of iron deficiency (ferritin concentration) among children belonging to the Brahmin ethnic group [27]. However, for iron deficiency among this group of Nepalese women with sTfR as a biomarker, those from the Janajati ethnic group were significantly more prone, compared with their Brahmin counterparts. In Benin, women from the Boo ethnic group were a risk factor to iron deficiency [36]. This finding highlights differences by ethnicity in the odds of iron deficiency and serves as a significant indicator of unequal distribution in nutrition in Nepal. There is, therefore, the need for further research on micronutrient deficiencies among and within various ethnic settings of Nepal. Other previous studies revealed that some sections of a country may be associated with iron deficiency, and such findings have been found to often be higher in rural areas compared to urban ones [39,40]. We also found that non-pregnant women from the far-western region had significantly higher odds of being folate deficient than their counterparts from the eastern region. According to the human development index and human poverty index [41], the far-western region of Nepal is the most underdeveloped region of the country with low land productivity, poor access to health and education and its far distance from the centre Kathmandu [42]. The practice of gender-based food distribution discrimination, discrimination during menstruation cycle, employment constraints for women and lack of land ownership all have tremendous impact on food availability for women in this region [42,43]. Further research should be conducted to assess the differences in order to understand why non-pregnant women in some geographical regions are more prone to micronutrient deficiencies than those from other ethnic settings. Suitable interventions should target those disadvantaged ethnic groups to improve the burden of micronutrient deficiencies in them.
In multivariable analysis, compared to non-pregnant underweight women (BMI < 18.5 kg/m2), the significantly higher odds of occurrence of iron deficiency observed among overweight non-pregnant women (BMI ≥25 kg/m2). The finding is also consistent with previous studies which found that some adolescents who were at risk of being overweight or were overweight were almost twice as likely to have iron deficiency compared with those with normal weight [44,45]. Other findings from previous studies have shown BMI to be inversely associated with anaemia which is caused mostly by iron deficiency [33,46,47]. The findings show a similar relationship between iron deficiency and BMI among both adolescents and non-pregnant women.
Our study showed that, non-pregnant women from the poorest households were found to be significantly more predisposed to folate deficiency compared with their counterparts from the richest households. This finding was consistent with an observation made in a previous study in Japan that dietary intake of folate was significantly associated with socio-economic status among Japanese workers [48]. Several other previous studies made similar findings [49,50,51,52]. Furthermore, we found that non-pregnant women from poorest households were more likely to be deficient in zinc. Foods rich in zinc include red meat and poultry. Obviously, only individuals from relatively richer families can afford such foods that are likely to contain and zinc. Additionally, women from wealthier households consume foods high in Zinc and have lower intestinal infections. This confirms our findings that deficiencies of folate and zinc were associated with household poverty. Our finding is also consistent with a Canadian and US study which found a direct relationship between folate deficiency and household poverty [53,54]. This finding is not surprising, as people would need money to purchase folic acid supplements to boost their folate levels.
We found that non-pregnant women aged 35-49 years were significantly less prone to folate deficiency compared with their counterparts aged 15-24 years, which seemed to suggest that younger individuals were at a higher risk of folate deficiency compared to older ones. This finding seemed to be contrary to findings of a previous study which observed a high prevalence of folate deficiency in individuals aged 65 years or older, as a result of reduced dietary intake and intestinal malabsorption [55]. However, we found that non-pregnant women aged 35-49 years had significantly higher odds of zinc deficiency compared to those aged between 15 and 24 years, indicating a positive association of zinc deficiency and age. This is in consonance with a past research in Norway which found an increased prevalence of zinc deficiency with age [56]. The positive correlation between increased age and zinc deficiency may be attributed to a decrease in the “absorptive capacity of the small bowel and a general decline in energy and intake of food among the aged” [57]. Further research is needed to examine how the age of non-pregnant women relate to folate and zinc deficiencies.
Our study also revealed that non-pregnant women who had a fever prior to the survey were significantly less predisposed to zinc deficiency. We were unable to find any study on the association of contraction of fever and zinc deficiency, although previous studies have found other diseases associated with zinc deficiency to include malabsorption syndrome, chronic liver disease, chronic renal disease, sickle cell disease, diabetes and other chronic diseases [58].
One of the main strengths of this current study was that it utilised datasets from the NNMSS, which is population-based and nationally representative. Consequently, findings of the study may be generalisable to any part of Nepal. Nonetheless, the current study is not without limitations. Most importantly, the study was cross-sectional in design; therefore, causation between these deficiencies (iron, zinc and folate) and associated factors could not be established. Recall bias may have influenced our findings because self-reported data were collected and analysed. Further, we were unable to account for other potential confounders of micronutrient deficiencies in non-pregnant women.
5. Conclusions
Factors associated with some micronutrient deficiencies in non-pregnant Nepalese women were revealed in this current study. The factors included being from the Janajati ethnic group, low BMI, non-consumption of some food groups such as meats and fish, geographic region and household poverty. These findings would provide the Nepalese government and other stakeholders the requisite tools to establish appropriate public health interventions to minimise the burden of micronutrient deficiency among non-pregnant women in Nepal. Particular attention should be paid to the Janajati ethnic group, poor households, and public health programmes that deal with the supply of IFA supplementation. Other vulnerable factors that should be targeted in interventional programmes should include non-pregnant women from the far-western region as well as those in the youngest age bracket, 15-24 years.
Author Contributions
Conceptualization, K.E.A. and AR; Methodology, K.E.A and L.N.P.; Software, K.E.A.; Validation, S.C., S.R., N.P. and S.K.S.; Formal Analysis, K.E.A. and L.N.P Resources, B.S; Data Curation, K.E.A, L.N.P, B.S. and S.C.; Writing—Original Draft Preparation, K.E.A.; Writing—Review and Editing, K.E.A., S.C., S.R., N.P., S.K.S. L.N.P, B.S and A.R.; Supervision, B.S, L.N.P and K.E.A.; Project Administration, K.E.A., S.C, N.P, B.S, LNP and A.R. All authors have read and agreed to the published version of the manuscript.
Funding
This research received no external funding.
Institutional Review Board Statement
Not applicable.
Informed Consent Statement
Not applicable. The study used existing secondary data available in public domain survey data sets with all identifier information removed.
Data Availability Statement
The study was conducted by analysing existing survey datasets available by applying to UNICEF Nepal, with all identifying information removed. Since this was a secondary data analysis and did not involve any interaction with the participants, written informed consent for the present analysis was not necessary. The data collection methods used in this analysis, including the consent process, were previously described in the Nepal National Micronutrient Status Survey Report 2016 [28]. The participants were not required to provide written informed consent for this present analysis since it was a secondary data analysis that did not involve any interaction with them.
Acknowledgments
The research was funded by USAID Nepal and UNICEF Nepal.
Conflicts of Interest
The authors declare no conflicts of interest.
References
- Sharma M, Atri A. Malnutrition, nutritional deficiencies, and obesity. Essentials of International Health. Burlington, Mass, USA: Jones & Bartlett Learning; 2011. p. 194.
- Black MM. Micronutrient deficiencies and cognitive functioning. The Journal of nutrition. 2003;133(11):3927S-31S. [CrossRef]
- Kibirige D, Wekesa C, Kaddu-Mukasa M, Waiswa M. Vitamin B12 deficiency presenting as an acute confusional state: a case report and review of literature. African health sciences. 2013;13(3):850-2. [CrossRef]
- Muthayya S, Rah JH, Sugimoto JD, Roos FF, Kraemer K, Black RE. The global hidden hunger indices and maps: an advocacy tool for action. PLoS One. 2013;8(6):e67860. [CrossRef]
- Ruel-Bergeron JC, Stevens GA, Sugimoto JD, Roos FF, Ezzati M, Black RE, et al. Global update and trends of hidden hunger, 1995-2011: the hidden hunger index. PloS one. 2015;10(12):e0143497. [CrossRef]
- Bhandari S, Banjara MR. Micronutrients deficiency, a hidden hunger in Nepal: prevalence, causes, consequences, and solutions. International scholarly research notices. 2015;2015. [CrossRef]
- World Health Organization. Micronutrient Deficiencies: Iron Deficiency Anemia Geneva, Switzerland: World Health Organization; 2014 [cited 2018 May 11]. Available from: http://www.who.int/nutrition/topics/ida/en/.
- Balarajan Y, Ramakrishnan U, Özaltin E, Shankar AH, Subramanian S. Anaemia in low-income and middle-income countries. The Lancet. 2011;378(9809):2123-35. [CrossRef]
- Zimmermann MB, Hurrell RF. Nutritional iron deficiency. The Lancet. 2007;370(9586):511-20. [CrossRef]
- Gernand AD, Schulze KJ, Stewart CP, West Jr KP, Christian P. Micronutrient deficiencies in pregnancy worldwide: health effects and prevention. Nature Reviews Endocrinology. 2016;12(5):274-89. [CrossRef]
- Tahsin T, Khanam R, Chowdhury NH, Hasan AT, Hosen MB, Rahman S, et al. Vitamin D deficiency in pregnancy and the risk of preterm birth: a nested case–control study. BMC pregnancy and childbirth. 2023;23(1):322. [CrossRef]
- Trumbo P, Yates AA, Schlicker S, Poos M. Dietary reference intakes: vitamin A, vitamin K, arsenic, boron, chromium, copper, iodine, iron, manganese, molybdenum, nickel, silicon, vanadium, and zinc. Journal of the American Dietetic Association. 2001;101(3):294-301.
- Solomons NW. Mild human zinc deficiency produces an imbalance between cell-mediated and humoral immunity. Nutrition reviews. 1998;56(1):27-8. [CrossRef]
- Prasad AS. Zinc: an overview. Nutrition (Burbank, Los Angeles County, Calif). 1995;11(1 Suppl):93-9.
- Singh S, Awasthi S, Kumar D, Sarraf SR, Pandey AK, Agarwal GG, et al. Micronutrients and cognitive functions among urban school-going children and adolescents: A cross-sectional multicentric study from India. PLoS One. 2023;18(2):e0281247. [CrossRef]
- Heyneman CA. Zinc deficiency and taste disorders. The Annals of pharmacotherapy. 1996;30(2):186-7. [CrossRef]
- Maret W, Sandstead HH. Zinc requirements and the risks and benefits of zinc supplementation. Journal of Trace Elements in Medicine and Biology. 2006;20(1):3-18. [CrossRef]
- Prasad AS. Zinc deficiency: its characterization and treatment. Metal ions in biological systems. 2004;41:103.
- Wang LC, Busbey S. Acquired acrodermatitis enteropathica. New England Journal of Medicine. 2005;352(11):1121-. [CrossRef]
- Devkota SC, De A, Sathian B. Nutritional Deficiencies: Major Public Health Problem in Nepal. American Journal of Public Health Research. 2015;3(4A):1-5. [CrossRef]
- Ng’eno BN, Perrine CG, Whitehead RD, Subedi GR, Mebrahtu S, Dahal P, et al. High Prevalence of Vitamin B12 Deficiency and No Folate Deficiency in Young Children in Nepal. Nutrients. 2017;9(1):72. [CrossRef]
- Woodruff BA, Blanck HM, Slutsker L, Cookson ST, Larson MK, Duffield A, et al. Anaemia, iron status and vitamin A deficiency among adolescent refugees in Kenya and Nepal. Public Health Nutrition. 2006;9(1):26-34. [CrossRef]
- Stewart CP, Christian P, Schulze KJ, LeClerq SC, West KP, Khatry SK. Antenatal micronutrient supplementation reduces metabolic syndrome in 6-to 8-year-old children in rural Nepal. The Journal of nutrition. 2009;139(8):1575-81. [CrossRef]
- Christian P, Shrestha J, LeClerq SC, Khatry SK, Jiang T, Wagner T, et al. Supplementation with micronutrients in addition to iron and folic acid does not further improve the hematologic status of pregnant women in rural Nepal. The Journal of nutrition. 2003;133(11):3492-8. [CrossRef]
- Jiang T, Christian P, Khatry SK, Wu L, West KP. Micronutrient deficiencies in early pregnancy are common, concurrent, and vary by season among rural Nepali pregnant women. The Journal of nutrition. 2005;135(5):1106-12. [CrossRef]
- Mehata S, Parajuli KR, Rayamajhee B, Yadav UN, Mehta RK, Singh DR. Micronutrients deficiencies and its correlation with the soil-transmitted helminthic infections among children and non-pregnant women in Nepal: findings from Nepal national micronutrient status survey. Scientific Reports. 2022;12(1):22313. [CrossRef]
- Chitekwe S, Parajuli KR, Paudyal N, Haag KC, Renzaho A, Issaka A, et al. Individual household and national factors associated with iron, vitamin A and zinc deficiencies among children aged 6-59 months in Nepal. Maternal and Child Nutrition. 2022;18:1-11. [CrossRef]
- Ministry of Health Nepal, New ERA, UNICEF, EU, USAID, CDC. Nepal National Micronutrient Status Survey – 2016. Kathmandu, Nepal: Minisry of Health, Nepal, 2017.
- O'broin S, Kelleher B. Microbiological assay on microtitre plates of folate in serum and red cells. Journal of Clinical Pathology. 1992;45(4):344-7. [CrossRef]
- Ford ND, Bichha RP, Parajuli KR, Paudyal N, Joshi N, Whitehead Jr RD, et al. Factors associated with anaemia in a nationally representative sample of nonpregnant women of reproductive age in Nepal. Maternal & child nutrition. 2022;18:e12953. [CrossRef]
- Organization. WH. Haemoglobin concentrations for the diagnosis of anaemia and assessment of severity. World Health Organization, 2011.
- Henjum S, Torheim LE, Thorne-Lyman AL, Chandyo R, Fawzi WW, Shrestha PS, et al. Low dietary diversity and micronutrient adequacy among lactating women in a peri-urban area of Nepal. Public health nutrition. 2015;18(17):3201-10. [CrossRef]
- Harding KL, Aguayo VM, Namirembe G, Webb P. Determinants of anemia among women and children in Nepal and Pakistan: An analysis of recent national survey data. Maternal & child nutrition. 2017. [CrossRef]
- Balcı YI, Karabulut A, Gürses D, Çövüt İE. Prevalence and risk factors of anemia among adolescents in Denizli, Turkey. Iranian journal of pediatrics. 2012;22(1):77. [PubMed]
- Alzaheb RA, Al-Amer O. The Prevalence of Iron Deficiency Anemia and its Associated Risk Factors Among a Sample of Female University Students in Tabuk, Saudi Arabia. Clinical Medicine Insights: Women's Health. 2017. [CrossRef]
- Alaofè H, Burney J, Naylor R, Taren D. Prevalence of anaemia, deficiencies of iron and vitamin A and their determinants in rural women and young children: a cross-sectional study in Kalalé district of northern Benin. Public health nutrition. 2017;20(7):1203-13. [CrossRef]
- Filmer D, Pritchett LH. Estimating Wealth Effects Without Expenditure Data—Or Tears: An Application To Educational Enrollments In States Of India*. Demography. 2001;38(1):115-32. [CrossRef]
- Huang FL. Analyzing group level effects with clustered data using Taylor series linearization. Practical Assessment, Research, and Evaluation. 2014;19(1).
- Preziosi P, Prual A, Galan P, Daouda H, Boureima H, Hercberg S. Effect of iron supplementation on the iron status of pregnant women: consequences for newborns. The American journal of clinical nutrition. 1997;66(5):1178-82. [CrossRef]
- Organization WH. Iron deficiency anaemia: assessment, prevention and control: a guide for programme managers. 2001.
- UNDP. Nepal Human Development Report 2009. Statr transformation and human development. Kathmandu: United Nation Development Program, 2009.
- Nepali PB, Pyakuryal KN. Livelihood Options for Landless and Marginalised Communities in an Agrarian Society: A Case Study from Far Western Nepal'. Pak J Agri Sci. 2011;48(1):1-10.
- Bishokarma NK, Amir R. Gender and food insecurity: food entitlement in resource scarce areas in the far-western region of Nepal. J Glob Innov Agric Soc Sci. 2014;2(1):45-51. [CrossRef]
- Pinhas-Hamiel O, Newfield R, Koren I, Agmon A, Lilos P, Phillip M. Greater prevalence of iron deficiency in overweight and obese children and adolescents. International journal of obesity. 2003;27(3):416. [CrossRef]
- Nead KG, Halterman JS, Kaczorowski JM, Auinger P, Weitzman M. Overweight children and adolescents: a risk group for iron deficiency. Pediatrics. 2004;114(1):104-8. [CrossRef]
- Balarajan YS, Fawzi WW, Subramanian S. Changing patterns of social inequalities in anaemia among women in India: cross-sectional study using nationally representative data. BMJ open. 2013;3(3):e002233. [CrossRef]
- Kamruzzaman M, Rabbani MG, Saw A, Sayem MA, Hossain MG. Differentials in the prevalence of anemia among non-pregnant, ever-married women in Bangladesh: multilevel logistic regression analysis of data from the 2011 Bangladesh Demographic and Health Survey. BMC women's health. 2015;15(1):54. [CrossRef]
- Miyaki K, Song Y, Taneichi S, Tsutsumi A, Hashimoto H, Kawakami N, et al. Socioeconomic status is significantly associated with the dietary intakes of folate and depression scales in Japanese workers (J-HOPE Study). Nutrients. 2013;5(2):565-78. [CrossRef]
- Vogel T, Dali-Youcef N, Kaltenbach G, Andres E. Homocysteine, vitamin B12, folate and cognitive functions: a systematic and critical review of the literature. International journal of clinical practice. 2009;63(7):1061-7. [CrossRef]
- Mischoulon D, Raab MF. The role of folate in depression and dementia. The Journal of clinical psychiatry. 2007.
- Itikala PR, Ruuska SE, Oakley GP, Kloeblen-Tarver AS, Klein L. Periconceptional intake of folic acid among low-income women. JAMA. 2000;283(23):3074-. [CrossRef]
- Tinker SC, Cogswell ME, Devine O, Berry RJ. Folic acid intake among US women aged 15–44 years, National Health and Nutrition Examination Survey, 2003–2006. American Journal of Preventive Medicine. 2010;38(5):534-42. [CrossRef]
- Colapinto CK, O’Connor DL, Tremblay MS. Folate status of the population in the Canadian Health Measures Survey. Canadian Medical Association Journal. 2011;183(2):E100-E6. [CrossRef]
- Caudill MA, Le T, Moonie SA, Esfahani ST, Cogger EA. Folate status in women of childbearing age residing in Southern California after folic acid fortification. Journal of the American College of nutrition. 2001;20(2):129-34. [CrossRef]
- Araújo JR, Martel F, Borges N, Araújo JM, Keating E. Folates and aging: Role in mild cognitive impairment, dementia and depression. Ageing research reviews. 2015;22:9-19. [CrossRef]
- Kvamme J-M, Grønli O, Jacobsen BK, Florholmen J. Risk of malnutrition and zinc deficiency in community-living elderly men and women: the Tromsø Study. Public health nutrition. 2015;18(11):1907-13. [CrossRef]
- Haase H, Rink L. The immune system and the impact of zinc during aging. Immunity & Ageing. 2009;6(1):9. [CrossRef]
- Prasad AS. Zinc deficiency: has been known of for 40 years but ignored by global health organisations. British Medical Journal Publishing Group; 2003. [CrossRef]
Figure 1.
Prevalence of micronutrient deficiencies in non-pregnant women in Nepal. Bars indicate 95% confidence intervals.
Figure 1.
Prevalence of micronutrient deficiencies in non-pregnant women in Nepal. Bars indicate 95% confidence intervals.
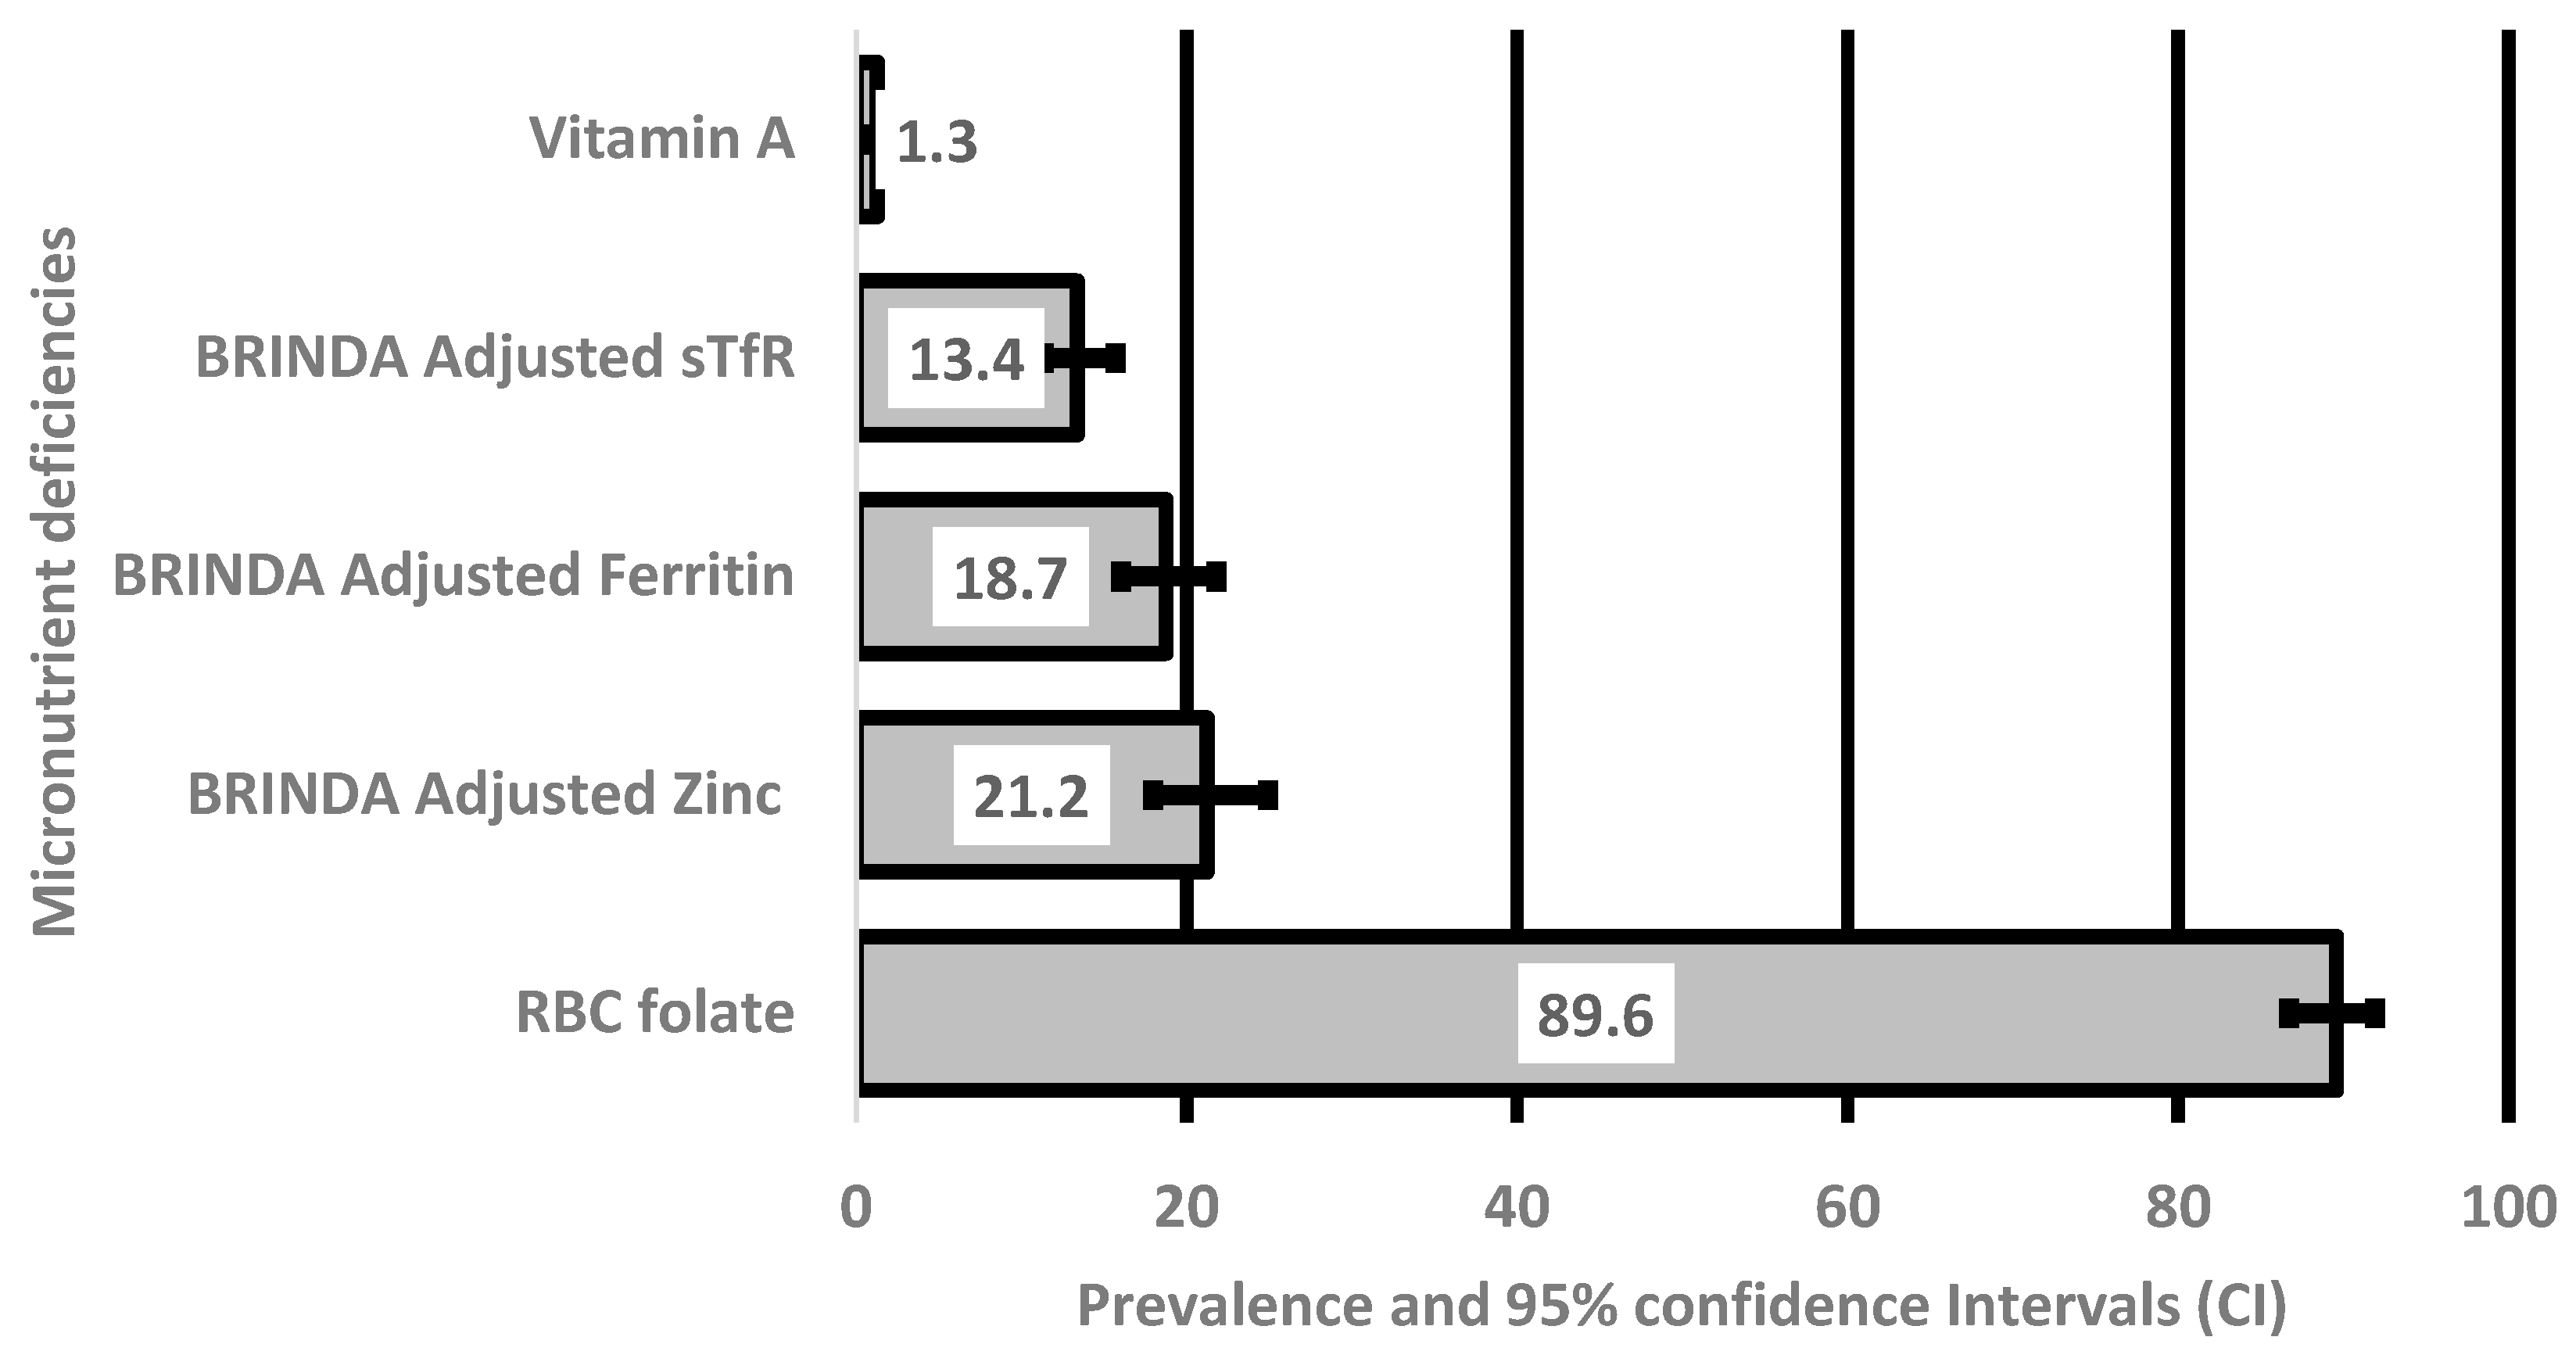

Table 1.
Characteristics of non-pregnant Nepalese women aged 15-49 years (n=2143).
| Characteristics | % |
|---|---|
| Individual-level factors | |
| Age (years) | |
| 15-24 | 31.2 |
| 25-34 | 35.9 |
| 35-49 | 35.9 |
| Level of education completed. | |
| No education | 47.7 |
| Completed Primary | 26.0 |
| Secondary or more | 26.3 |
| Household-level factors | |
| Household Wealth Index | |
| Poorest | 15.4 |
| Poorer | 18.6 |
| Middle | 20.2 |
| Richer | 20.6 |
| Richest | 25.2 |
| Ethnicity (Caste) | |
| Brahmin/Chettri | 36.8 |
| Dalit | 15.4 |
| Janajati | 31.1 |
| Others | 16.7 |
| Anthropometry | |
| Mean weight (SD) | 9.9 |
| Mean height (SD) | 6.0 |
| BIS (mg/kg) | |
| Mean BIS (SD) | 3.8 |
| BMI (kg/m2) | |
| <=18.5 | 9.9 |
| 19-25 | 67.0 |
| 25+ | 23.1 |
| Health status during the last 28 days | |
| Fever | 13.8 |
| Cough | 14.6 |
| Diarrhoea | 9.2 |
| Supplementation | |
| Received IFA supplements | |
| Yes | 33.5 |
| No | 66.5 |
| Received multivitamins | |
| Yes | 2.0 |
| No | 98.0 |
| Community-level factors | |
| Residence | |
| Urban | 13.7 |
| Rural | 86.3 |
| State | |
| Province 1 | 17.4 |
| Province 2 | 20.3 |
| Province 3 | 20.2 |
| Province 4 | 10.1 |
| Province 5 | 17.6 |
| Province 6 | 4.9 |
| Province 7 | 9.4 |
| Geographical region | |
| Eastern | 22.6 |
| Central | 35.3 |
| Western | 19.5 |
| Mid-western | 13.2 |
| Far-western | 9.4 |
| Ecological zone | |
| Mountain | 6.3 |
| Hill | 42.2 |
| Terai | 50.5 |
| Food consumed a day before the survey | |
| Tubers/starchy foods | 85.5 |
| Legumes and nuts | 74 |
| Nuts and seeds or any food from nuts or seeds | 6.0 |
| Dairy products | 43.6 |
| Eggs | 10.1 |
| Liver, kidney, heart or other organ meat or blood | 6.9 |
| Other meats (chicken, goat, buffalo, pigs, ducks) | 25.9 |
| Fish (fresh or dried fish, shellfish, prawn, crab etc.) | 5.5 |
| Consumed other vitamin A-rich fruits | 49.4 |
| Vitamin A-rich fruits | 10.5 |
| Other fruits | 81.7 |
| Dark green leafy vegetables | 13.7 |
| Other vegetables | 34.9 |
| Mean food groups (sd) | 1.7 |
SD: standard deviation; BIS: body iron stores, IFA: iron and folic acid;.
Table 2.
Cut-off values and levels of Ferritin, sTfR, RBC folate and zinc deficiencies among pregnant women aged 15-49 years in Nepal.
Table 2.
Cut-off values and levels of Ferritin, sTfR, RBC folate and zinc deficiencies among pregnant women aged 15-49 years in Nepal.
| Micronutrient | Mean (sd) | Quartiles | Deficiency* | |||
| Q25 | Q50 | Q75 | n | % | ||
| Iron Deficiency/ Ferritin (n=2135) | 38.9 (27.5) | 18.6 | 32.4 | 53.1 | 400 | 18.7 |
| Iron Deficiency/ sTfR (n=2135) | 6.7 (4.6) | 4.6 | 5.5 | 6.9 | 286 | 13.4 |
| Folic acid/ RBC folate (n=2140) | 593.3 (308.5) | 405.0 | 549.1 | 726.7 | 340 | 15.9 |
| Zinc (n=2135) | 84.5 (35.8) | 62.5 | 80.6 | 99.2 | 453 | 21.2 |
Table 3.
Factors associated with iron (ferritin and sTfR levels), RBC folate and zinc deficiencies among non-pregnant Nepalese women aged 15-49 years.
Table 3.
Factors associated with iron (ferritin and sTfR levels), RBC folate and zinc deficiencies among non-pregnant Nepalese women aged 15-49 years.
| Characteristic | Unadjusted OR (95% CI) | p-value | Adjusted OR (95% CI) | p-value |
| Iron deficiency (ferritin as a marker) | ||||
| Ethnicity (Caste) | ||||
| Brahmin/Chettri | 1.00 | 1.00 | ||
| Dalit | 0.72 (0.49, 1.09) | 0.116 | 0.45 (0.20, 0.98) | 0.044 |
| Janajati | 0.59 (0.43, 0.82) | 0.002 | 0.45 (0.25, 0.80) | 0.007 |
| Others | 0.96 (0.68, 1.35) | 0.819 | 0.73 (0.34, 1.57) | 0.416 |
| BMI (kg/m2) | ||||
| ≤18.5 | 1.00 | 1.00 | ||
| 19-25 | 1.27 (0.78, 2.05) | 0.333 | 2.12 (0.74, 6.08) | 0.162 |
| 25+ | 1.05 (0.64, 1.74) | 0.833 | 2.69 (1.01, 7.17) | 0.048 |
| BIS (mg/kg) body weight(continuous) | 0.29 (0.23, 0.36) | <0.001 | 0.27 (0.21, 0.34) | < 0.001 |
| Height (in cm) | 0.99 (0.97, 1.01) | 0.103 | 0.96 (0.92, 0.99) | 0.022 |
| Administered any IFA supplements | ||||
| No | 1.00 | 1.00 | ||
| Yes | 0.72 (0.55, 0.94) | 0.019 | 0.39 (0.21, 0.71) | 0.002 |
| Iron deficiency (sTfR as marker) | ||||
| Ethnicity (Caste) | ||||
| Brahmin/Chettri | 1.00 | 1.00 | ||
| Dalit | 0.89 (0.59, 1.34) | 0.561 | 1.08 (0.63, 1.86) | 0.764 |
| Janajati | 1.23 (0.82, 1.84) | 0.303 | 2.42 (1.39, 4.21) | 0.002 |
| Others | 1.18 (0.62, 2.23) | 0.614 | 1.15 (0.51, 2.57) | 0.731 |
| BIS (mg/kg) body weight (continuous) | 0.58 (0.53, 0.62) | <0.001 | 0.56 (0.52, 0.60) | <0.001 |
| BMI (kg/m2) | ||||
| ≤18.5 | 1.00 | 1.00 | ||
| 19-25 | 0.73 (0.49, 1.08) | 0.118 | 0.49 (0.27, 0.91) | 0.025 |
| 25+ | 0.79 (0.49, 1.29) | 0.345 | 0.95 (0.48, 1.86) | 0.87 |
| Folic acid/RBC folate | ||||
| Ethnicity (Caste) | ||||
| Brahmin/Chettri | 1.00 | 1.00 | ||
| Dalit | 1.63 (0.99, 2.65) | 0.051 | 1.44 (0.89, 2.34) | 0.135 |
| Janajati | 1.02 (0.70, 1.48) | 0.936 | 1.00 (0.66, 1.51) | 0.997 |
| Others | 2.12 (1.29, 3.49) | 0.003 | 2.79 (1.69, 4.61) | <0.001 |
| Geographical region | ||||
| Eastern | 1.00 | 1.00 | ||
| Central | 1.34 (0.60, 3.01) | 0.472 | 1.23 (0.59, 2.56) | 0.569 |
| Western | 1.34 (0.62, 2.87) | 0.451 | 1.37 (0.64, 2.92) | 0.408 |
| Mid-western | 2.34 (1.23, 4.44) | 0.01 | 2.21 (1.10, 4.46) | 0.027 |
| Far-western | 2.99 (1.52, 5.87) | 0.002 | 3.10 (1.48, 6.49) | 0.003 |
| Age (years) | ||||
| 15-24 | 1.00 | 1.00 | ||
| 25-34 | 0.62 (0.47, 0.82) | 0.001 | 0.63 (0.48,0.83) | 0.001 |
| 35-49 | 0.56 (0.39, 0.82) | 0.003 | 0.58 (0.40, 0.83) | 0.004 |
| Household Wealth Index | ||||
| Poorest | 1.00 | 1.00 | ||
| Poorer | 0.71 (0.45, 1.13) | 0.145 | 0.85 (0.57, 1.27) | 0.431 |
| Middle | 0.73 (0.47, 1.15) | 0.172 | 0.85 (0.55, 1.30) | 0.446 |
| Richer | 0.63 (0.40, 0.99) | 0.045 | 0.71 (0.49, 1.02) | 0.062 |
| Richest | 0.40 (0.21, 0.77) | 0.007 | 0.55 (0.30, 0.99) | 0.048 |
| Consumed Vitamin A-rich fruits | ||||
| No | 1.00 | 1.00 | ||
| Yes | 2.43 (1.47, 4.00) | 0.001 | 2.34 (1.52, 3.61) | <0.001 |
| Zinc | ||||
| Household Wealth Index | ||||
| Poorest | 1.00 | 1.00 | ||
| Poorer | 0.67 (0.43, 1.04) | 0.072 | 0.66 (0.42, 1.03) | 0.066 |
| Middle | 0.72 (0.50, 1.03) | 0.074 | 0.73 (0.51, 1.06) | 0.096 |
| Richer | 0.47 (0.31, 0.73) | 0.001 | 0.48 (0.31, 0.76) | 0.002 |
| Richest | 0.60 (0.40, 0.91) | 0.016 | 0.61 (0.42, 0.91) | 0.016 |
| Age (years) | ||||
| 15-24 | 1.00 | 1.00 | ||
| 25-34 | 0.99 (0.72, 1.38) | 0.973 | 1.00 (0.72, 1.38) | 0.997 |
| 35-49 | 1.37 (0.98, 1.92) | 0.068 | 1.39 (1.01, 1.93) | 0.048 |
| Had fever | ||||
| No | 1.00 | 1.00 | ||
| Yes | 0.69 (0.51, 0.94) | 0.018 | 0.69 (0.51, 0.94) | 0.018 |
OR: Odds ratio; CI: confidence interval; RBC: red blood cells.
Disclaimer/Publisher’s Note: The statements, opinions and data contained in all publications are solely those of the individual author(s) and contributor(s) and not of MDPI and/or the editor(s). MDPI and/or the editor(s) disclaim responsibility for any injury to people or property resulting from any ideas, methods, instructions or products referred to in the content. |
© 2024 by the authors. Licensee MDPI, Basel, Switzerland. This article is an open access article distributed under the terms and conditions of the Creative Commons Attribution (CC BY) license (http://creativecommons.org/licenses/by/4.0/).
Copyright: This open access article is published under a Creative Commons CC BY 4.0 license, which permit the free download, distribution, and reuse, provided that the author and preprint are cited in any reuse.


