
Submitted:
14 May 2024
Posted:
14 May 2024
You are already at the latest version
Abstract
As the educational landscape evolves, understanding and fostering student adaptability has become increasingly critical. This study presents a comparative analysis of (XAI) techniques to interpret machine learning models aimed at classifying student adaptability levels. Leveraging a robust dataset, we employed several machine learning algorithms with a particular focus on Random Forest, which demonstrated a 91% accuracy. Our study utilizes (SHAP), (LIME), Anchors, (ALE), and counterfactual explanations to reveal the specific contributions of various features impacting adaptability predictions. Consistently, 'Class Duration' and 'Financial Condition' emerge as key factors, while the study also underscores the subtle effects of 'Institution Type' and 'Load-shedding'. This multi-faceted interpretability approach bridges the gap between machine learning performance and educational relevance, presenting a model that not only predicts but also explains the dynamic factors influencing student adaptability. The synthesized insights advocate for educational policies accommodating socioeconomic factors, instructional time, and infrastructure stability to enhance student adaptability. The implications extend to informed and personalized educational interventions, fostering an adaptable learning environment. This methodical research contributes to responsible AI application in education, promoting predictive and interpretable models for equitable and effective educational strategies.
Keywords:
Comparative Analysis
; Educational Data Mining
; Educational Predictive Modelling
; (XAI)
; Feature Importance
; Machine Learning Interpretability
; Model Transparency
; Predictive Analytics in Education
; Student Adaptability
; AI in Education Policy
1. Introduction
A critical area of concern for educators, policymakers, and academics in the quickly changing field of education is comprehending and improving student adaptation [1,2]. The ability of students to effectively navigate and respond to diverse learning environments, technological advancements, and varying educational methodologies highlights the importance of adaptive learning systems tailored to individual needs [3].
The field of education has seen a revolutionary change with the introduction of machine learning techniques, which have provided new ways to forecast and enhance student adaptation [4]. However, the black-box nature of complex machine learning models often impedes their interpretability, raising concerns regarding their applicability in educational settings where transparency and comprehensibility are paramount. The inability of educators to understand the machine learning algorithms' decision-making process due to their black-box nature has been a key barrier in the learning space [5,6]. Because of this, there is increasing interest in building and evaluating interpretable machine learning models that can be used to identify student adaptability factors. These models should not only produce precise predictions but also offer valuable insights into the decision-making process.
Student adaptability is a complex construct encompassing the ability to effectively adapt, learn, and succeed in diverse educational settings. It involves factors such as socio-economic background, individual learning styles, technological proficiency, and environmental influences [7,8]. Understanding and measuring adaptability require a holistic approach that integrates diverse data sources and utilizes sophisticated models capable of capturing intricate patterns within these datasets. Even though machine learning models perform predictably well across a range of areas, their opacity poses a substantial difficulty when used to educational settings. Interpretability issues make it more difficult for stakeholders to understand model predictions and restrict the discovery of useful information that is essential for creating customized interventions that improve student flexibility. In order to close this gap, new developments in interpretable machine learning methods provide ways to decipher how complicated models make decisions [9,10,11].
In response to the evolving challenges and opportunities in education, this study innovates by introducing a comparative analysis of a novel combination of interpretable machine learning models tailored to enhancing our understanding of student adaptability. Through the meticulous employment of SHapley Additive exPlanations (SHAP), Local Interpretable Model-agnostic Explanations (LIME), Anchor, Accumulated Local Effects (ALE), and counterfactual explanations, we navigate the intricacies of balancing model interpretability against predictive accuracy. By leveraging a dataset rich in student attributes and adaptability levels, our research offers unprecedented insights into the predictors of adaptability, navigating the complexities inherent in educational data. Grounded in cutting-edge techniques and established educational theories, our methodology facilitates a detailed examination of the myriad factors influencing student outcomes. The application of machine learning in this context, with its capacity to analyze complex datasets and reveal intricate patterns, marks a significant advancement in educational research. This study not only underscores the predictive power and interpretability of machine learning models but also highlights their potential to inform targeted, effective educational interventions, thereby pioneering a comprehensive exploration aimed at unveiling and acting upon the factors influencing student adaptability, thereby fostering informed and personalized educational strategies.
The rest paper is arranged as follows: Section 2 provides an overview of related work on (XAI) and interpretable models for student adaptability. Section 3 describes the methodology. Section 4 presents the results of the experiments, while Section 5 discusses comparative analysis of XAI techniques and synthesis of findings. Finally, Section 6 discusses future work and conclusions.
2. Related Work
Numerous studies have explored the correlation between student adaptability and academic performance, retention rates, and overall learning outcomes. The link between learning flexibility and self-regulated learning (SRL) in junior high school students is examined in this study by She et al [12], with an emphasis on the mediating roles of academic motivation and self-management. Under China's "double reduction" educational program, the research looks at how these elements work together to support SRL, which is an important ability for students to succeed. The study's conclusions show the independent and cumulative mediation functions of academic motivation and self-management, as well as the noteworthy benefits of learning adaptability on SRL. This offers information to help students improve their learning practices and adjust to changes in schooling.
Martin et al.'s systematic review [13] summarizes research on adaptive learning from 2009 to 2018, with an emphasis on publishing patterns, instructional settings, techniques, and technology. After analyzing 61 articles, the study found that the number of publications peaked in 2015 and that higher education particularly in Taiwan and the US was the main topic of interest. The study focuses on several stages of instructional design in the field of adaptive learning research, such as learner characteristics, needs assessment, and system design and implementation. Furthermore, it classifies adaptive technologies into systems, applications, teaching techniques, and design solutions, and adaptive strategies into categories based on learner models, content, and instructional models. In the review, it is emphasized how important it is to have more diverse research and rigorous methods in adaptive learning.
In their investigation of student adaptation following COVID-19-induced online learning, Tiwari et al. [14] explore into Education 4.0. By using Explainable Machine Learning (XML), it investigates students' acceptance of Industry 4.0 features. Using a range of machine learning techniques, it finds that Neural Networks are the most accurate (93%) at classifying adaptation. The study emphasizes how crucial explainability is for machine learning models. It uses dataset analysis, model performance research, and (SHAP) techniques to clarify feature importance and model predictions. In the end, it emphasizes how important elements affecting students' capacity to adjust include age, socioeconomic situation, and type of internet. This thorough study helps teachers comprehend how pupils adjust to online learning and what effects it has.
Adnan et al. [15] (XAI) model that predicts student performance in virtual learning environments at various course stages with detailed interpretability, utilizing Random Forest among other algorithms and incorporating SHAP values for insight into decision-making processes. This enhances educational data mining by enabling early performance prediction. In a related context, Gligorea et al. [16] develop an interpretable machine learning framework to analyze and predict student performance, focusing on commitment and grades, and improving framework efficiency through algorithmic tuning and GPU-based infrastructure. Another study [5] explores early prediction of student performance using machine learning and XAI. Logistic regression yielded the best results, and the integration of XAI helped educators understand the predictions, aiming to support at-risk students promptly.
The adaptability of Bangladeshi pupils to online learning amid the COVID-19 pandemic is investigated by Suzan et al. [1] the study uses machine learning models including Decision Tree, Random Forest, Naive Bayes, SVM, KNN, and ANN and conducts surveys across different educational levels. The Random Forest Classifier, which focuses on sociodemographic characteristics, has the best accuracy (89.63%). This study provides insightful information for educational policymakers by illuminating the difficulties and degrees of adaptation faced by students in the context of online learning. The results highlight the need of comprehending student flexibility for the successful implementation of online learning and offer directions for future study in evaluating sociodemographic impacts on students' mental health in online learning.
LIME was introduced by Ribeiro et al [9]. LIME increases user trust in machine learning models, which are sometimes viewed as mysterious black boxes, by providing clear explanations for every classifier's predictions. By building an interpretable model around the prediction, the method offers faithful and understandable local explanations. Additionally, it suggests a way to use a group of representative individual forecasts to explain the global model. The study illustrates how LIME may be used to explain a wide range of models and how useful it is in situations when trust is needed, such as when choosing models, enhancing classifiers, and comprehending model choices. Rao et al.'s [17] study explores (XAI) in healthcare predictive models, highlighting its potential to enhance trust, transparency, and clinical decision-making in medical diagnostics.
A unique model-agnostic method called anchors is introduced in the publication "Anchors: High-Precision Model-Agnostic Explanations" by Ribeiro et al [11]. Anchors are used to explain complicated model behaviors using high-precision rules. Anchors give clarity and simplicity of comprehension by representing local variables necessary for predictions. With high-probability assurances, the authors suggest an algorithm to calculate these explanations for every given black-box model. The versatility of anchors is shown in a number of domains, such as text, tabular data, and pictures. A user research demonstrates that, in comparison to current linear explanations, anchors enable more precise and effective prediction of model behavior on unseen instances. This method offers a compromise between accuracy and understandability in model explanations, addressing the interpretability problem in machine learning.
To examine several approaches to machine learning counterfactual explanations, highlighting their significance for comprehending and assessing AI judgments. Using determinantal point processes, Mothilal et al.'s research [18], focuses on producing a variety of realistic counterfactuals while taking user context into account for realism. Their tests demonstrate that their approach generates locally correct counterfactuals, improving machine learning systems' decision-making capabilities. Van Looveren and Klaise [19] provide a fast, model-independent technique for creating counterfactual scenarios with class prototypes that works with a variety of data kinds. By using this approach, black-box model interpretability is enhanced and computational difficulties are resolved. Finally, Wachter et al. [20], address counterfactual explanations in relation to the General Data Protection Regulation (GDPR), emphasizing how they can make automated judgments more transparent without jeopardizing the specifics of private algorithms. Collectively, these works highlight the significance of counterfactual explanations in making AI more understandable and accountable.
3. Methodology
3.1. Dataset
This research dataset is taken from Kaggle.com [21] and consists of an instance with 1205 rows and 14 features (columns) with these columns: Gender, Age, Education Level, Institution Type, IT Student, Location, Load-shedding, Financial Condition, Internet Type, Network Type, Class Duration, Self Lms, Device, and the Adaptivity Level which is the target feature with the adaptivity level set to Low, Moderate or high adaptivity level. This dataset was chosen for its rich representation of student demographics, allowing a detailed exploration of student adaptability's multifaceted nature, highlighting the interplay of socio-economic, institutional, and personal factors impacting student adaptability. In order to ensure a thorough assessment of the prediction performance and interpretability of the machine learning models used, we used 80% of the dataset (964 instances) for training the models and the remaining 20% (241 instances) for testing the models for this study.
We trained and tested our machine learning models using an 80/20 split in this study's methodology. The choice was taken in light of our dataset's size and characteristics, which limited the possibility of assigning a distinct validation set without appreciably decreasing the size of the training set. In order to guarantee the accuracy of our model predictions, we placed a high priority on keeping a solid training dataset. We do identify this as a research drawback, though, since an extra layer of model evaluation and fine-tuning may have been supplied by a second validation step.
3.2. Research Framework
This paper's main contribution is its innovative approach to evaluating student adaptability predictions from ML models, a critical component in educational settings. The proposed method, outlined in Figure 1, is a comprehensive, multi-stage process that begins with meticulous data collection, ensuring a robust foundation for subsequent analysis. The preprocessing stage addresses the typical challenges of educational data, such as encoding categorical variables and normalizing features, to prepare a clean, analysis-ready dataset.
The method's thorough training of a wide range of machine learning models, from simpler ones like Multinomial Logistic Regression to more complex ensembles, is one of its distinguishing features. This inclusive approach not only compares predictive power across various algorithms but also enhances the process of interpretation analysis by providing diverse perspectives on the same dataset. The central tenet of the methodology is the application of multiple XAI techniques, such as SHAP, LIME, Anchors, Counterfactuals, and ALE. This diverse mix allows for a detailed exploration of how different features influence the adaptability predictions, providing global and local interpretability. Each XAI technique offers unique insights: SHAP quantifies feature contributions, LIME provides locally faithful explanations, Anchors generate high-precision rules, Counterfactuals suggest minimal changes for outcome alteration, and ALE analyzes feature effects, averting confounding interactions.
The subsequent comparative analysis of these XAI techniques is a methodological innovation that critiques their coherence, identifies consistencies, and pinpoints anomalies in their explanations. The final synthesis of findings distills a holistic understanding of the ML models, offering actionable insights for educational stakeholders. This methodology empowers educators and policymakers with a deeper comprehension of the predictive models, facilitating informed decisions to foster student adaptability in diverse learning environments.
3.3. Data Preprocessing
We process the data by loading the dataset using the data manipulation library ‘Pandas’ in Python. Understanding the dataset's structure is necessary for further investigation. The characteristics and target columns may be identified by reviewing the column titles; to understand the data distributions depicted in Table 1, summary statistics for numerical columns must be collected. Categorical variables are converted into a numerical format using One-Hot Encoding. Scaling of numerical features using the `StandardScaler` method ensures uniformity in the magnitude of features. The mapping for our target variable was Moderate: 2, Low: 1, High: 0. The handling of unbalanced data is then considered and customized to meet the needs of the model and particular dataset features. The dataset is then split into training and testing sets using `train_test_split` for building the model and model evaluation.
Adaptivity Level is the target variable for classification. This column contains three different levels: Moderate, Low and High. Feature distribution of the adaptivity level in the dataset yields the following frequency counts: Moderate: 625, Low: 480 and High: 100, from these counts, you can see that the dataset is not perfectly balanced.
The student adaptivity levels are shown in Figure 2 as a balanced frequency chart after using the Synthetic Minority Over-sampling Technique (SMOTE). This visualization represents the distribution of adaptivity levels (Moderate, Low, and High) after addressing the initial class imbalance inherent in the dataset. Before the application of SMOTE, the adaptivity levels were not proportionately distributed, which could have led to a predictive model biased toward the majority class. By synthesizing new examples of the minority classes, SMOTE equalizes the representation of each adaptivity level, as depicted in the figure.
Each bar in the graph corresponds to one of the three adaptivity levels, and the height reflects the frequency of instances within the dataset after balancing. The near-equal heights of the bars indicate that each class now has a similar number of instances (625), thus ensuring that the predictive models trained on this dataset are not biased towards any particular adaptivity level.
3.4. Model Training
We undertake a series of extensive classification experiments by applying several machine learning algorithms to classify levels of student adaptability. They were analyzed and classified as shown in Table 2.
3.5. Explainable Artificial Intelligence (xAI) Used
The classifications made by the models are then analyzed using several (XAI) techniques to interpret the model's decision-making process. These techniques include:
3.5.1. SHAP (Shapley Additive exPlanations)
SHAP is a high-level machine learning interpretability method built on game theory concepts to explain the output of any machine learning technique. It was developed by Lundberg and Lee as a unifying approach to explaining the predictions of machine learning algorithms. The SHAP value measures the predictive influence of each feature on the base prediction. The base prediction is typically the average prediction of the dataset used to train the model [10]. The SHAP value for the i-th feature is calculated using the formula:
where: is the SHAP value for the -th feature, S is a subset of all features F excluding the -th feature, (S) is the prediction made by the model using only the features in set S, ∣S∣ is the number of features in set S, and ∣F∣ is the total number of features.
For example, consider a machine learning model that predicts student adaptability based on various features. Let's calculate the SHAP value for the feature ‘Class Duration’. The base prediction (the average prediction of the training dataset) might have a 50% chance of a student being adaptable. If a particular student studies 5 hours a day and this changes the prediction to 70% adaptability, the SHAP value for ‘Class Duration’ in this case would quantify how much of that 20% increase is attributed to studying 5 hours specifically, compared to the average student. To apply this, one would calculate the difference in prediction with and without the ‘Class Duration’ feature over all possible combinations of other features, weighted by the number of features included. This exhaustive calculation considers all possible interactions with other features, thus allocating the ‘Class Duration’ feature its fair share of influence on the increase in adaptability prediction.
The SHAP framework meets several desirable qualities, including consistency, missingness, and local accuracy, and it is model-agnostic any machine learning technique can adopt [22,23,24,25]. These characteristics guarantee the accuracy and dependability of SHAP explanations, which makes them especially useful in critical situations where interpretability is just as crucial as predictive performance. SHAP is used in many fields, such as energy to predict power consumption trends, healthcare to assess patient risk, and finance to evaluate credit risk. Its broad use highlights how crucial interpretability is to machine learning [24,26].
The practical application of SHAP in our study allows us to identify the most influential factors determining student adaptability. For example, SHAP analysis revealed that "Class Duration" and "Financial Condition" are critical in predicting adaptability levels. This insight is invaluable for educational institutions seeking to understand the determinants of student success and can inform targeted interventions to support student adaptability.
3.5.2. LIME (Local Interpretable Model-Agnostic Explanations)
LIME is a machine learning technique that provides an accurate and understandable explanation for the classification made by machine learning models [9]. LIME works by perturbing input data and observing changes in the model's predictions. It then selects the most influential features for a particular prediction and fits a simple model, such as a linear regression, to these features. LIME seeks to explain the reasoning behind a model’s prediction y for an individual instance x by approximating the complex model f locally with an interpretable model g. This interpretable model, typically a linear model, operates on a binary feature representation z′, which is derived from the original feature space of x. The local surrogate model is defined as:
where: represents the prediction of the interpretable model, β_0 is the intercept term of the linear model, represents the weight associated with the -th feature in the interpretable space, and is the binary representation of the i-th feature.
LIME aims to optimize the following objective function:
where: ξ(x) is the local explanation for the instance x, measures the fidelity of in approximating f within the locality defined by , quantifies the complexity of the interpretable model , and G denotes the family of interpretable models, such as linear regressions or decision trees.
Consider a machine learning model that predicts a student's adaptability level. For a particular student, the model predicts a "High" adaptability level. LIME is employed to explain this prediction, focusing on features like ‘Class Duration’, ‘Financial Condition’, and ‘Institution Type’, etc. Perturbing the input data around the student's features, LIME fits a local linear model to these perturbations to approximate the prediction of the original complex model f. The linear model constructed by LIME provide the following coefficients for an interpretable explanation:
Adaptability Score=0.10+0.25×Class Duration−0.15×Financial Condition+0.10×Institution Type. An increase in ‘Class Duration’ by one unit (e.g., one hour) enhances the adaptability score by 0.25, suggesting the critical role of engagement time in educational adaptability. A decline in ‘Financial Condition’ from ‘Mid’ to ‘Poor’ (encoded as a decrease by one unit) reduces the adaptability score by 0.15, highlighting the potential barriers faced by economically disadvantaged students. A positive change in ‘Institution Type’ from ‘Government’ to ‘Non-Government’ (encoded as an increase from 0 to 1) raises the adaptability score by 0.10, possibly reflecting the influence of institutional resources and support.
LIME explanation shows how each feature impacts the adaptability prediction. The positive coefficient for ‘Class Duration’ underscores the importance of classroom engagement in fostering adaptability, suggesting that longer classes may lead to better student outcomes. The negative coefficient for ‘Financial Condition’ points to the need for targeted support to students from less wealthy backgrounds. The positive coefficient for ‘Non-Government’ institutions indicates potential benefits of these environments, which may include innovative teaching methods or more personalized attention.
Educational policymakers can leverage these insights to ensure that class time is used effectively, provide additional resources for students in need, and encourage beneficial practices observed in ‘Non-Government’ institutions. This approach proves especially valuable in domains where decisions are individual-specific, such as healthcare, education, and finance [27]. The localized interpretability provided by LIME empowers stakeholders to make informed decisions, promoting adaptability and improving outcomes in these critical areas.
3.5.3. Anchor
The Anchor algorithm is designed to provide high-precision rules, known as anchors, which offer interpretable and reliable explanations for the decisions of machine learning models [8]. The interpretable explanations as high-precision rules, which are local conditions sufficient to guarantee the prediction with high confidence. An anchor explanation for a prediction can be expressed as:
where: are anchor conditions (predicates) for features, P is the predicted class or outcome, and c is the confidence level associated with the rule. The algorithm aims to maximize the precision (confidence) of the anchor while ensuring that the coverage (the proportion of instances for which the anchor applies) is above a user-defined threshold. The objective function can be formulated as:
where: Precision(A) is the probability that the prediction P is correct given that anchor A applies, Coverage(A) is the proportion of instances in the dataset for which anchor A applies, and θ is the coverage threshold.
Suppose our machine learning model has predicted the adaptability level of students. To provide an interpretable explanation using the Anchor algorithm, consider an instance where the model predicts a student's adaptability level as "Moderate." After the application of the Anchor algorithm, the following rule-based explanation is produced:
IF (Network Type >1) ∧(Age≤1) ∧ (Gender > 0) ∧ (Institution Type>0) ∧ (Financial Condition ≤ 1) THEN Predict ‘Moderate’ with confidence 97.32%.
This explanation infers that for this particular student, the presence of certain conditions such as having access to a 3G or 4G network, being in the '16-20' age group, being female, attending a non-government institution, and not being classified as 'Rich' in financial status, are collectively sufficient to predict a 'Moderate' adaptability level with high confidence. This rule-based explanation provides clarity on the factors influencing the adaptability prediction. It suggests that access to quality internet and certain demographic characteristics are significant predictors of adaptability. The high confidence level associated with this anchor allows educators to trust the prediction under the specified conditions. By identifying and understanding these anchor conditions, educational institutions can tailor support and interventions to improve student adaptability. For instance, efforts can be made to enhance internet access for students, and special attention can be given to gender-specific educational experiences and resources for students from different socio-economic backgrounds.
3.5.4. Accumulated Local Effects (ALE)
ALE is a technique used to interpret the predictions of machine learning models, specifically focusing on understanding how features affect predictions on average. ALE addresses the limitation of global methods that average effects over the entire data distribution, which can be misleading if there are interactions between features. This method was developed to provide a better understanding of the feature effects by averaging them locally and thus avoiding the introduction of such interactions, as described by [28].
The ALE of a feature is given as at a particular value is calculated by integrating the marginal effects of over the range of the dataset, while marginalizing over the distribution of other features. For a given feature , the ALE is computed as follows:
where: is the prediction model, is the partial derivative of the model prediction with respect to the feature , is the minimum value of the feature in the dataset, and is the conditional expectation over the distribution of the dataset given the feature .
Consider a dataset where we aim to understand the impact of ‘Class Duration’ on the adaptability level of students. We can calculate the ALE for ‘Class Duration’ by following these steps:
- Discretize ‘Class Duration’ into a grid of values.
- For each interval in the grid, compute the difference in the model's prediction as ‘Class Duration’ changes within that interval.
- Accumulate these local effects across the grid to estimate the average effect of ‘Class Duration’ on the model's prediction.
Presume after computing the ALE, we find that increasing ‘Class Duration’ from 1 hour to 3 hours increases the model's prediction for ‘High’ adaptability by 0.2 on average. This implies that longer class durations are associated with a higher likelihood of students being classified as highly adaptable.
The ALE plot for ‘Class Duration’ might show a positive slope, which indicates that as ‘Class Duration’ increases, so does the adaptability prediction. Educational stakeholders can interpret this to mean that policies or interventions designed to extend class durations could potentially improve student adaptability levels. By integrating ALE into the predictive modeling process, educators and policymakers can gain a more detailed understanding of the factors that influence student outcomes. This understanding is crucial for designing educational environments that foster adaptability, a key component of student success in dynamic learning contexts.
3.5.5. Counterfactual Explanations
Counterfactual explanations are interpretability methods in machine learning that focus on "what-if" scenarios, illustrating minimal changes needed for desired output predictions. Originating from the philosophy of causation and decision-making, they provide insights into complex model decision-making, especially in classification tasks. Popularized by [14], they aim to provide explanations for machine learning model decisions that meet legal and non-discrimination requirements.
Counterfactual explanations in machine learning involve finding an instance x′ that is minimally different from the original instance x but leads to a different prediction outcome. Counterfactual explanation seeks to solve the following optimization problem:
where: f(x) is the prediction of the original instance, f(x′) is the prediction of the counterfactual instance, and d(x, x′) is a distance metric (such as Euclidean distance) that quantifies the dissimilarity between the original instance and the counterfactual.
For example, imagine a machine learning model predicts a ‘Low’ adaptability level for a student based on features such as ‘Class Duration’, ‘Financial Condition’, and ‘Institution Type’. A counterfactual explanation might reveal that a slight increase in 'Class Duration' could change the prediction to ‘High’ adaptability.
For instance, if the original feature values are
x=[1 (Low Class Duration),0 (Poor Financial Condition),0 (Government Institution)] and the model's prediction f(x) is 'Low adaptability', a counterfactual explanation would search for a new set of feature values x′ that lead to a different prediction f(x′) = ‘High adaptability’. Suppose the counterfactual feature values are x′= [2 (High Class Duration),0,0], indicating that only ‘Class Duration’ needs to be increased to alter the prediction. The counterfactual explanation therefore might suggest that improving the ‘Class Duration’ from Low to High could enhance the student’s adaptability level according to the model.
Counterfactual insights, like increased instructional time positively affecting student adaptability, guide educational resource allocation and intervention strategies. Educators, leveraging counterfactual explanations, pinpoint influential factors in the learning process for targeted improvements. This forms a feedback loop, enhancing both educational strategies and machine learning models. Beyond education, counterfactual explanations facilitate understanding and actionable insights in finance, revealing changes for loan approval, and in healthcare, illustrating shifts in patient risk categories based on lifestyle or clinical parameters [29,30].
4. Results and Discussion
4.1. Experimental Setup
A personal computer with a Core i7-6600v central processing unit (CPU), 16 GB DDRAM, and 256 GB solid state drive was used for the research. A version of Python 3.11.5 packaged by Anaconda, Inc. was used. It ran Windows 10 Pro as its operating system.
4.2. Model Selection and Prediction
A thorough comparison between many machine learning algorithms was carried out in an effort to identify the best model for the classification of student adaptability levels. These include Multinomial Logistic Regression, Decision Tree, Random Forest, K-Nearest Neighbors (KNN), XGBoost, Gradient Boosting, Gaussian Naïve Bayes, Support Vector Machine (SVM), Ensemble methods, AdaBoost, CatBoost, and Neural Networks. Tables II and III include confusion matrices and a variety of performance metrics, providing a comprehensive summary of each model's predictive performance.
The three adaptability classes (High, Low, and Moderate) of each model's predictions were broken down in depth by the confusion matrices as shown in Table 3. For example, the Multinomial Logistic Regression model accurately predicted ‘High’ adaptability 11 times, but it also incorrectly categorized 7 ‘Moderate’ and 5 ‘Low’ instances as ‘High’. Understanding the predictive dynamics of each classifier, including their advantages and disadvantages in differentiating between classes, depends on the specificity of the data.
To give a complete view of each model's effectiveness, the associated performance measures were generated, including accuracy, precision, recall, and F1 score for each class, as shown in Table 4. Random Forest model had a strong predictive capacity overall, with precision values of 0.93, 0.94, and 0.94 for the High, Low, and Moderate classes, respectively. These results are further supported by the F1 scores, where high values show a balanced precision-recall trade-off.
A comparison of the accuracy obtained by several machine learning algorithms used in the classification of student adaptability levels is shown in Figure 3. The accuracy of an algorithm is represented by each bar, which is measured as the proportion of test cases that are correctly classified, with Random forest coming the overall best with 91%, followed by Neural Network and Catboost with 90% each. Performance metrics and confusion matrices highlight how crucial model selection is in the field of educational data analytics. In particular, the Random Forest, CatBoost, and Neural Network models have demonstrated encouraging possibilities for use in learning environments with the goal of predicting and improving student adaptability.
4.3. Result Analysis with XAI Techniques
With our range of machine learning models, of which Random Forest performed the best with 91% predictive accuracy, we sought to understand the decision-making processes that buttress their performance XAI. The following XAI techniques were used to illuminate the contributions and influences of features within our models.
4.3.1. SHAP (Shapley Additive exPlanations)
Using the mean SHAP as a guide, Figure 4 provides a detailed examination of how different factors affect the adaptability levels of students. SHAP values quantify the contribution of each feature to the predictive model’s output, offering a measure of importance based on average impact magnitude. This bar graph segregates the influence of features into three adaptability predictions: High (green), Moderate (blue), and Low (pink). The length of each bar represents the mean absolute SHAP value, which is a composite measure of both the strength and consistency of a feature’s effect on the model's predictions. ‘Class Duration’ emerges as a dominant feature, its substantial mean SHAP value indicating a significant and positive correlation with student adaptability across all levels. Its greatest impact is observed in the High adaptability category, suggesting that extended instructional periods may enhance a student's ability to adapt to varying educational demands.
‘Financial Condition’ is another prominent feature, especially in predicting Low adaptability, highlighting the potential obstacles faced by students with fewer economic resources. Similarly, ‘Institution Type’ displays a varied influence, with a positive association for High adaptability, possibly reflecting the superior resources and support available at certain institutions.
On the other hand, ‘Load-shedding’ predominantly affects Low adaptability predictions, alluding to the detrimental effects of inconsistent electricity on educational continuity. Meanwhile, demographic attributes such as ‘Age’ and ‘Gender’ show moderate effects, indicating their complex but less pronounced roles. Technology-related attributes, namely ‘IT Student’ status and ‘Device’ usage, although impactful, have lesser mean SHAP values, suggesting their influence is secondary compared to educational and socio-economic factors.
This figure illustration using SHAP values highlights how diverse student adaptation is. It gives educational stakeholders a data-driven platform to build focused interventions that enhance positive aspects and lessen negative ones, creating a climate that encourages flexible learning.
The use of SHAP in a prediction model to ascertain student adaptability levels is seen in Figure 5. The figure is divided into three parts: (a) the attribute attributes under analysis, (b) the corresponding SHAP values, and (c) the force plot. The base value (f(x)) represents the average output when no features affect the prediction. In this instance, the model predicted a 'Low' adaptability level, indicated by a prediction value of 1. Features with red segments, such as 'Education Level' and 'Network Type', contribute to a higher adaptability prediction ('Moderate' or 'High'), while features with blue segments, such as 'Financial Condition' and 'Self Lms', are associated with a lower adaptability prediction ('Low'). The force plot elucidates the model's complex reasoning for an individual prediction. For example, a favorable 'Financial Condition' and access to 'Internet Type' influence the adaptability prediction away from 'High', while the absence of engagement with 'Self Lms' and lower 'Education Level' push the prediction towards 'Low' adaptability. The analysis of this figure helps educational institutions understand the complex causes of student adaptability and fit their resources and interventions accordingly.
4.3.2. LIME (Local Interpretable Model-Agnostic Explanations
A single prediction from a machine learning model that categorizes student adaptability levels is shown in Figure 6, along (LIME) study. The adaptation levels that the model predicts are 'Moderate' (probability = 0.62) and 'Low' (probability = 0.38). The prediction for 'High' adaptability is highly unlikely based on the given feature values.
The middle section illustrates the weighted impact of each feature on the prediction decision, with positive contributions towards a 'Not Low' adaptability prediction. For instance, 'Class Duration' and 'Institution Type' exhibit the most significant positive influence, suggesting that longer class durations and certain institutional characteristics may be associated with higher adaptability. Conversely, features such as 'Device' and 'IT Student' status have a notable negative weight, implying that the absence of certain technological factors may lead the model to predict a lower adaptability level.
The rightmost section lists the values of the features for the specific instance being explained, with orange representing positive contributions and blue for negative ones. This visualization aids in understanding the local behavior of the machine learning model, providing transparency into how feature values are aggregated into a predictive outcome. The LIME interpretation offers valuable insights for educators and policymakers by pinpointing specific areas that could be addressed to potentially improve a student's adaptability. It also emphasizes the intricate nature of the factors that impact educational outcomes and highlights the requirement for sophisticated approaches in educational interventions.
4.3.3. ANCHOR Explanation
Table 5, illustrate how Anchor algorithm predicts a 'Moderate' level of adaptability in students when present, based on specific features. Network Type greater than 1.00 indicates that at least 3G or 4G connectivity is associated with a 'Moderate' adaptability prediction, reflecting the importance of reliable internet access for students' ability to adapt to contemporary educational demands. Age less than or equal to 1.00 corresponds to students in the age group '16-20', revealing that adaptability may be particularly complex during late adolescence. Gender greater than 0.00 suggests that female students are predicted to have 'Moderate' adaptability, indicating gender-specific educational experiences or socialization patterns that influence adaptability. Institution Type greater than 0.00 refers to students attending 'Non-Government' institutions, suggesting that these institutions may have different resource levels or pedagogical approaches. Financial Condition less than or equal to 1.00 captures 'Mid' or 'Poor' economic backgrounds, emphasizing the role of socioeconomic status in shaping a student's adaptability.
The precision and coverage metrics accompanying these rules indicate a high level of reliability and relevance within the dataset, suggesting these findings are consistent and pertinent to a subset of the student population. By integrating these interpretive insights into the study, educators and policymakers can better understand the factors contributing to student adaptability levels and inform initiatives to upgrade digital infrastructures. The distinction between government and non-government institutions in adaptability predictions may reflect differential access to resources, student support, and extracurricular opportunities, prompting a re-evaluation of resource distribution to ensure all institutions can foster student adaptability.
4.3.4. Accumulated Local Effects (ALE) Explanation
The ALE feature importance analysis, as visualized in Figure 7, provides compelling insights that can guide educational strategies and policy-making. The significant importance of 'Class Duration' suggests that students benefit from extended learning sessions, which may offer a more immersive educational experience. This finding supports the pedagogical approach of increasing instructional time to enhance understanding and retention. Policymakers might consider revising academic schedules to integrate long class periods or more intensive study sessions that could better support students' adaptability and learning outcomes.
The importance of ‘Age’ as a predictive factor of adaptability underscores the importance of developmental considerations in educational planning. Younger students may require more structured support to foster adaptability, such as resilience training and social-emotional learning programs. In contrast, older students may benefit from opportunities that challenge their adaptability skills, such as project-based learning and collaborative assignments that mirror real-world scenarios.
The impact of ‘Financial Condition’ on adaptability predictions reinforces the link between economic factors and educational success. This suggests an urgent need for policies that aim to level the playing field, such as providing financial aid, resources, and support systems for students from less affluent backgrounds. Ensuring that all students have equal access to educational resources is not just a matter of fairness but also a strategic investment in the adaptability and resilience of the future workforce.
Gender, network type, and education level highlight the multifaceted nature of adaptability. These findings suggest a tailored approach where educational interventions are sensitive to gender dynamics, technological access, and institutional characteristics. For example, initiatives to bridge the digital divide by improving network connectivity can have far-reaching effects on students' ability to access and engage with digital learning platforms, a necessity in an increasingly connected world.
Furthermore, the lower importance of features such as 'Self Lms', 'IT Student', and ‘Device’ does not diminish their value but rather indicates that their influence on adaptability may be more conditional or indirect. This could inform a carefully balanced approach to technology integration in education, ensuring that technology enhances learning without widening the gap between different student groups.
Lastly, the feature 'Load-shedding' highlights the external challenges students face, pointing to the broader social and infrastructural issues that can affect educational outcomes. Addressing such challenges may require collaborative efforts that extend beyond the education sector, involving partnerships with community organizations and government agencies to provide stable learning environments.
The ALE feature importance analysis thus serves as a guide for developing comprehensive educational policies and practices that consider the complex interplay of individual, institutional, and societal factors affecting student adaptability. By focusing on these key features, educators and policymakers can create more supportive and effective learning environments that cater to the diverse needs of students, fostering an educational ecosystem that is both equitable and conducive to developing adaptable learners.
Our analysis utilized (ALE) plots to visualize the impact of three critical features Class Duration, Age, and Financial Condition on the predicted adaptability levels of students. The resulting plots offer insightful revelations that intersect with contemporary educational theories and bear significant policy implications, see Figure 8.
Class Duration:
The ALE plot for ‘Class Duration’ indicates that longer class times are positively associated with 'High' adaptability predictions. This finding aligns with educational theories that stress the importance of sustained engagement for deeper learning and adaptability. It suggests that extended instructional periods may provide students with more opportunities to assimilate information, engage with challenging concepts, and develop critical thinking skills, all of which are crucial for adaptability in rapidly changing educational landscapes. Policy-wise, this supports arguments for restructuring school schedules to allow for longer class periods, potentially leading to improved educational outcomes.
Age:
The relationship between ‘Age’ and adaptability is less direct, as shown by the minor fluctuations across adaptability levels. However, the general trend indicates that ‘Low’ adaptability decreases with age. This could reflect the development of coping mechanisms and resilience as students mature, a concept supported by developmental theories. The varied adaptability across age groups could inform the design of age-specific curricula and support services, tailoring educational strategies to the developmental stage of the student cohort.
Financial Condition:
The steep positive slope for ‘High’ adaptability with improved 'Financial Condition' underscores the pivotal role of economic stability in educational success, as posited by numerous studies linking financial security with better academic performance. The plot highlights a stark reality: students from more affluent backgrounds are likely to be more adaptable, possibly due to greater access to resources, extracurricular activities, and learning support. This insight has profound policy implications, emphasizing the need for equity-focused financial initiatives such as scholarships, grants, and resource allocation to schools serving economically disadvantaged communities.
The ALE plots also reveal the multidimensional nature of student adaptability, validating educational theories, influencing classroom and curriculum design, and emphasizing the need for comprehensive policies to address diverse factors contributing to student adaptability.
4.3.5. Counterfactual Explanation
Figure 9 details a counterfactual analysis for Instance 3, where a model's original prediction of a student’s adaptability level as 'Moderate' (coded as 2) is altered to 'Low' (coded as 1). This analysis is pivotal in understanding the sensitivity of the predictive model to changes in feature values. The original feature vector [1321011011111] encapsulates the student's profile, with each element corresponding to various features such as Gender, Age, Education Level, etc., as outlined in the research methodology. The counterfactual vector [1. 3. 2. 1. 0. 1. 1. 0. 1. 1. 0.49932724 1. 1.] presents the minimal adjustment required to flip the prediction outcome. Notably, the alteration occurs at the eleventh feature, which we can infer relates to 'Class Duration' given the 'Feature differences' array indicating a change of [0.5]. This modification in 'Class Duration' decreases its value by 0.5. Considering our encoding scheme, where 'Class Duration' might be defined within a range (e.g., '0' for Low, '1' for Moderate, '2' for High), a decrease suggests a shift towards a shorter class duration. The model's understanding that a reduced ‘Class Duration’ indicates a ‘Low’ adaptability level may stem from a pattern observed in the data, where shorter class durations are linked to low adaptability.
The implications of this finding are significant for educational practices. It suggests that ensuring adequate class time may be critical for student adaptability, echoing educational theories that emphasize the role of engagement time in skill development and learning adaptability. Policymakers may need to consider this relationship when designing curriculum schedules, advocating for sufficient instructional time to foster an adaptable learning mindset. Also, this counterfactual result raises important questions for future research. Why might a slight reduction in 'Class Duration' correlate with a lower adaptability prediction? Does this relationship hold across various subjects and learning contexts? Such questions highlight the need for a deeper examination of the educational factors that contribute to student adaptability and the development of interventions that can effectively support students' learning journeys.
The comparison between the original and counterfactual feature values for Instance 3 is shown in Figure 10. This comparison offers valuable insight into how the model predicts student adaptability levels. The bar chart highlights the differences between the original features that led to a 'Moderate' adaptability prediction and the counterfactual features that would result in a 'Low' adaptability prediction. The original feature values are denoted in blue, while the counterfactual values that could potentially alter the model’s outcome are shown in orange. Notably, most features remain unchanged between the original and counterfactual scenarios, except for 'Class Duration', which shows a decrement of 0.5 in the counterfactual case. This decrease suggests that a reduction in 'Class Duration' is influential in shifting the adaptability prediction from 'Moderate' to 'Low'.
The result also emphasizes the significant role that 'Class Duration' plays in the adaptability model, where a slight reduction in duration is the single change needed to alter the prediction. This finding has important implications for educational strategies, suggesting that maintaining or increasing class duration could be a critical factor in supporting higher adaptability levels among students. Educators and administrators may use these insights to reassess the structure of the school day and the allocation of time to different subjects. The chart encourages a data-driven approach to curriculum planning, ensuring that students have sufficient time for in-depth exploration and learning, which is crucial for developing adaptability skills. This counterfactual analysis complements other interpretability techniques, such as SHAP and LIME, by providing a direct and tangible scenario where altering a single feature can change a student's predicted adaptability level. Such information is invaluable for policy formulation, as it highlights specific leverage points where educational interventions could be targeted to yield the most significant impact on student outcomes.
5. Comparative Analysis of XAI Techniques and Synthesis of Findings
After completing an extensive training program involving a varied set of machine learning models, our research delved into a thorough examination of model predictions using a range of (XAI) techniques. Each technique offered unique insights into the decision-making processes underlying the adaptability predictions, with SHAP and ALE providing a global view of feature contributions, LIME and Anchors elucidating local, instance-specific explanations, Counterfactuals revealing the sensitivity of predictions to feature perturbations, and ALE plots assessing the average feature effects across the data distribution. A comparative analysis of the XAI outputs revealed both similarities and divergence in feature importance rankings and explanations. Accordance across methods reinforced the perceived significance of certain features, such as 'class duration' and 'financial condition', suggesting these are robust determinants of adaptability predictions. Divergences prompted a careful reconsideration of complex feature interactions and model behavior in various scenarios, guiding further analytical probing.
This study leverages a diverse set of (XAI) techniques, including SHAP, LIME, Anchors, Counterfactual, and ALE, to comprehensively interpret student adaptability prediction models. The amalgamation of these methods sheds light on key features influencing adaptability levels, contextualizing predictions within the educational landscape. This holistic understanding forms the foundation for potential educational interventions, emphasizing the necessity of considering engagement duration and addressing socioeconomic factors.
The research makes a unique and valuable contribution to the areas of machine learning interpretability and educational policy-making by utilizing a combination of different XAI approaches to clarify the decision-making processes of educational data models. It not only enhances the interpretability of educational data through a systematic comparative analysis of various XAI techniques but also identifies and examines the complex socio-economic, institutional, and demographic factors influencing student adaptability. The thorough exploration and results of this study provide the basis for developing detailed and targeted interventions. A notable feature of this research is its innovative methodology, which integrates and compares insights from several XAI techniques to gain a comprehensive understanding of model predictions. This method offers a detailed perspective on how various factors affect student adaptability, enabling the creation of well-informed and impactful educational policies and practices. By bridging the theoretical aspects of machine learning with practical, actionable insights, the study demonstrates the value of XAI in crafting educational strategies that are both equitable and tailored to enhance student outcomes. These contributions represent a significant advancement in the responsible application of AI within the educational sector, ensuring that predictive models are leveraged in a manner that is both transparent and beneficial to student learning and adaptability.
6. Conclusions
This study uses (XAI) techniques to understand factors influencing student adaptability in education. The application of various methods, such as SHAP, LIME, Anchors, ALE, and counterfactual explanations, provides a comprehensive understanding of the dynamics influencing student adaptability. Key factors such as 'Class Duration', 'Financial Condition', 'Age', and 'Institution Type' are crucial in shaping students' ability to adapt in educational settings. These findings emphasize the importance of considering socio-economic and institutional factors when formulating educational strategies. XAI has the potential to foster a data-informed educational landscape, allowing for personalized learning pathways and adaptive educational systems. Integrating AI and analytics into educational policy and practice can enhance educational outcomes and create a more inclusive and effective learning environment. Future inquiries should focus on analyzing longitudinal data to capture the temporal changes in adaptability and integrating qualitative data for richer, more personalized insights. Evaluating the real-world effects of interventions informed by XAI and updating the interpretability framework to align with new machine learning advancements will be crucial. Ensuring the ethical application of AI and maintaining transparency in AI-driven educational tools remain essential for the responsible progression of this field.
We suggest adding a validation stage to the model creation procedure for future studies. This innovation may make it easier to fine-tune and validate the model in more subtle ways, which might improve interpretability and prediction performance. Investigating how a certain validation set affects the generalizability of machine learning models in educational contexts may yield insightful information that advances our knowledge of student flexibility and the efficient use of XAI methods.
References
- Hasan Suzan, M.; Samrin, N.A.; Biswas, A.A.; Pramanik, A. Students’ Adaptability Level Prediction in Online Education Using Machine Learning Approaches. In 2021 12th International Conference on Computing Communication and Networking Technologies (ICCCNT); IEEE: Kharagpur, India, 2021; pp. 1–7. [Google Scholar] [CrossRef]
- Loderer, K.; Rinas, R.; Daumiller, M. Student adaptability, emotions, and achievement: Navigating new academic terrains in a global crisis. Learning and Individual Differences 2021, 90, 102046. [Google Scholar] [CrossRef] [PubMed]
- Peng, H.; Ma, S.; Spector, J.M. Personalized Adaptive Learning: an emerging pedagogical approach enabled by a smart learning environment. In Lecture notes in educational technology; 2019; pp 171–176. [CrossRef]
- Haleem, A.; Javaid, M.; Qadri, M.A.; Suman, R. Understanding the role of digital technologies in education: A review. Sustainable Operations and Computers 2022, 3, 275–285. [Google Scholar] [CrossRef]
- Jang, Y.; Choi, S.; Jung, H.; Kim, H. Practical early prediction of students’ performance using machine learning and eXplainable AI. Education and Information Technologies 2022, 27, 12855–12889. [Google Scholar] [CrossRef]
- Adadi, A.; Berrada, M. Peeking Inside the Black-Box: A survey on Explainable Artificial Intelligence (XAI). IEEE Access 2018, 6, 52138–52160. [Google Scholar] [CrossRef]
- White, G.L. Adaptive Learning Technology Relationship with Student Learning Outcomes. Journal of Information Technology Education 2020, 19, 113–130. [Google Scholar] [CrossRef] [PubMed]
- Liem, G.A.D.; Martin, A.J. Young people’s responses to environmental issues: Exploring the roles of adaptability and personality. Personality and Individual Differences 2015, 79, 91–97. [Google Scholar] [CrossRef]
- Ribeiro, M.T.; Singh, S.; Guestrin, C. “Why Should I Trust You?”: Explaining the Predictions of Any Classifier. In Proceedings of the 22nd ACM SIGKDD International Conference on Knowledge Discovery and Data Mining; ACM: San Francisco California USA, 2016; pp. 1135–1144. [Google Scholar] [CrossRef]
- Lundberg, S.; Lee, S.-I. A Unified Approach to Interpreting Model Predictions. arXiv November 24, 2017. Available online: http://arxiv.org/abs/1705.07874 (accessed on 8 May 2024).
- Ribeiro, M.T.; Singh, S.; Guestrin, C. Anchors: High-Precision Model-Agnostic Explanations. AAAI 2018, 32. [Google Scholar] [CrossRef]
- She, C.; Li, Q.; Jiang, W.; Xing, Q. Learning adaptability facilitates self-regulated learning at school: the chain mediating roles of academic motivation and self-management. Frontiers in Psychology 2023, 14. [Google Scholar] [CrossRef] [PubMed]
- Martin, F.; Chen, Y.; Moore, R.L.; Westine, C.D. Systematic review of adaptive learning research designs, context, strategies, and technologies from 2009 to 2018. Educational Technology Research and Development 2020, 68, 1903–1929. [Google Scholar] [CrossRef]
- Tiwari, R. G.; Jain, A.; Kukreja, V.; Ujjwal, N. Education 4.0: Explainable Machine Learning for Classification of student Adaptability. 2022 International Conference on Data Analytics for Business and Industry (ICDABI) 2022. [CrossRef]
- Adnan, M.; Uddin, I.; Khan, E.; Alharithi, F.S.; Amin, S.; Alzahrani, A.A. Earliest possible global and local interpretation of students’ performance in virtual learning environment by leveraging explainable AI. IEEE Access 2022, 10, 129843–129864. [Google Scholar] [CrossRef]
- Gligorea, I.; Yaseen, M.U.; Cioca, M.; Gorski, H.; Oancea, R. An interpretable framework for an efficient analysis of students’ academic performance. Sustainability 2022, 14, 8885. [Google Scholar] [CrossRef]
- Rao, S.; Mehta, S.; Kulkarni, S.; Dalvi, H.; Katre, N.; Narvekar, M. A Study of LIME and SHAP Model Explainers for Autonomous Disease Predictions. In 2022 IEEE Bombay Section Signature Conference (IBSSC); IEEE, 2022; pp 1–6. [CrossRef]
- Mothilal, R.K.; Sharma, A.; Tan, C. Explaining Machine Learning Classifiers through Diverse Counterfactual Explanations. FAT* 2020 - Proc. 2020 Conf. Fairness, Accountability, Transpar. 2020, 607–617. [CrossRef]
- Van Looveren, A.; Klaise, J. Interpretable Counterfactual Explanations Guided by Prototypes. Lect. Notes Comput. Sci. (including Subser. Lect. Notes Artif. Intell. Lect. Notes Bioinformatics) 2021, 12976 LNAI, 650–665. [CrossRef]
- Wachter, S.; Mittelstadt, B.; Russell, C. Counterfactual Explanations Without Opening the Black Box: Automated Decisions and the GDPR. SSRN Electron. J. 2017, 1–52. [Google Scholar] [CrossRef]
- Suzan, M.M.H.; Samrin, N.A. Students Adaptability Level in Online Education. Www.Kaggle.Com. https://www.kaggle.com/datasets/mdmahmudulhasansuzan/students-adaptability-level-in-online-education.
- Lundberg, S.M.; Erion, G.G.; Lee, S. Consistent Individualized Feature Attribution for Tree Ensembles. 2018, 18.
- Pereira, F.D.; Fonseca, S.C.; Oliveira, E.H.T.; Cristea, A.I.; Bellhauser, H.; Rodrigues, L.; Oliveira, D.B.F.; Isotani, S.; Carvalho, L.S.G. Explaining Individual and Collective Programming Students’ Behaviour by Interpreting a Black-Box Predictive Model. IEEE Access 2021, 117097–117119. [Google Scholar] [CrossRef]
- Christoph Molnar. Interpretable Machine Learning: A Guide for Making Black Box Models Explainable (2nd Ed.), 2nd ed.; 2022.
- Shrikumar, A.; Greenside, P.; Kundaje, A. Learning Important Features Through Propagating Activation Differences. 2017.
- García-Magariño, I.; Muttukrishnan, R.; Lloret, J. Human-Centric AI for Trustworthy IoT Systems with Explainable Multilayer Perceptrons. IEEE Access 2019, 7, 125562–125574. [Google Scholar] [CrossRef]
- Guidotti, R.; Monreale, A.; Ruggieri, S.; Turini, F.; Pedreschi, D.; Giannotti, F. A Survey Of Methods For Explaining Black Box Models; 2018; pp 1–45.
- Apley, D.W.; Zhu, J. Visualizing the effects of predictor variables in black box supervised learning models. arXiv.org. https://arxiv.org/abs/1612.08468.
- Grath, R.M.; Costabello, L.; Van, C.L.; Sweeney, P.; Kamiab, F.; Shen, Z.; Lecue, F. Interpretable credit application predictions with counterfactual explanations. arXiv.org. https://arxiv.org/abs/1811.05245.
- Tanyel, T.; Ayvaz, S.; Keserci, B. Beyond known reality: exploiting counterfactual explanations for medical research. arXiv (Cornell University) 2023. [CrossRef]
Figure 1.
Block Diagram for implementing the Proposed framework.
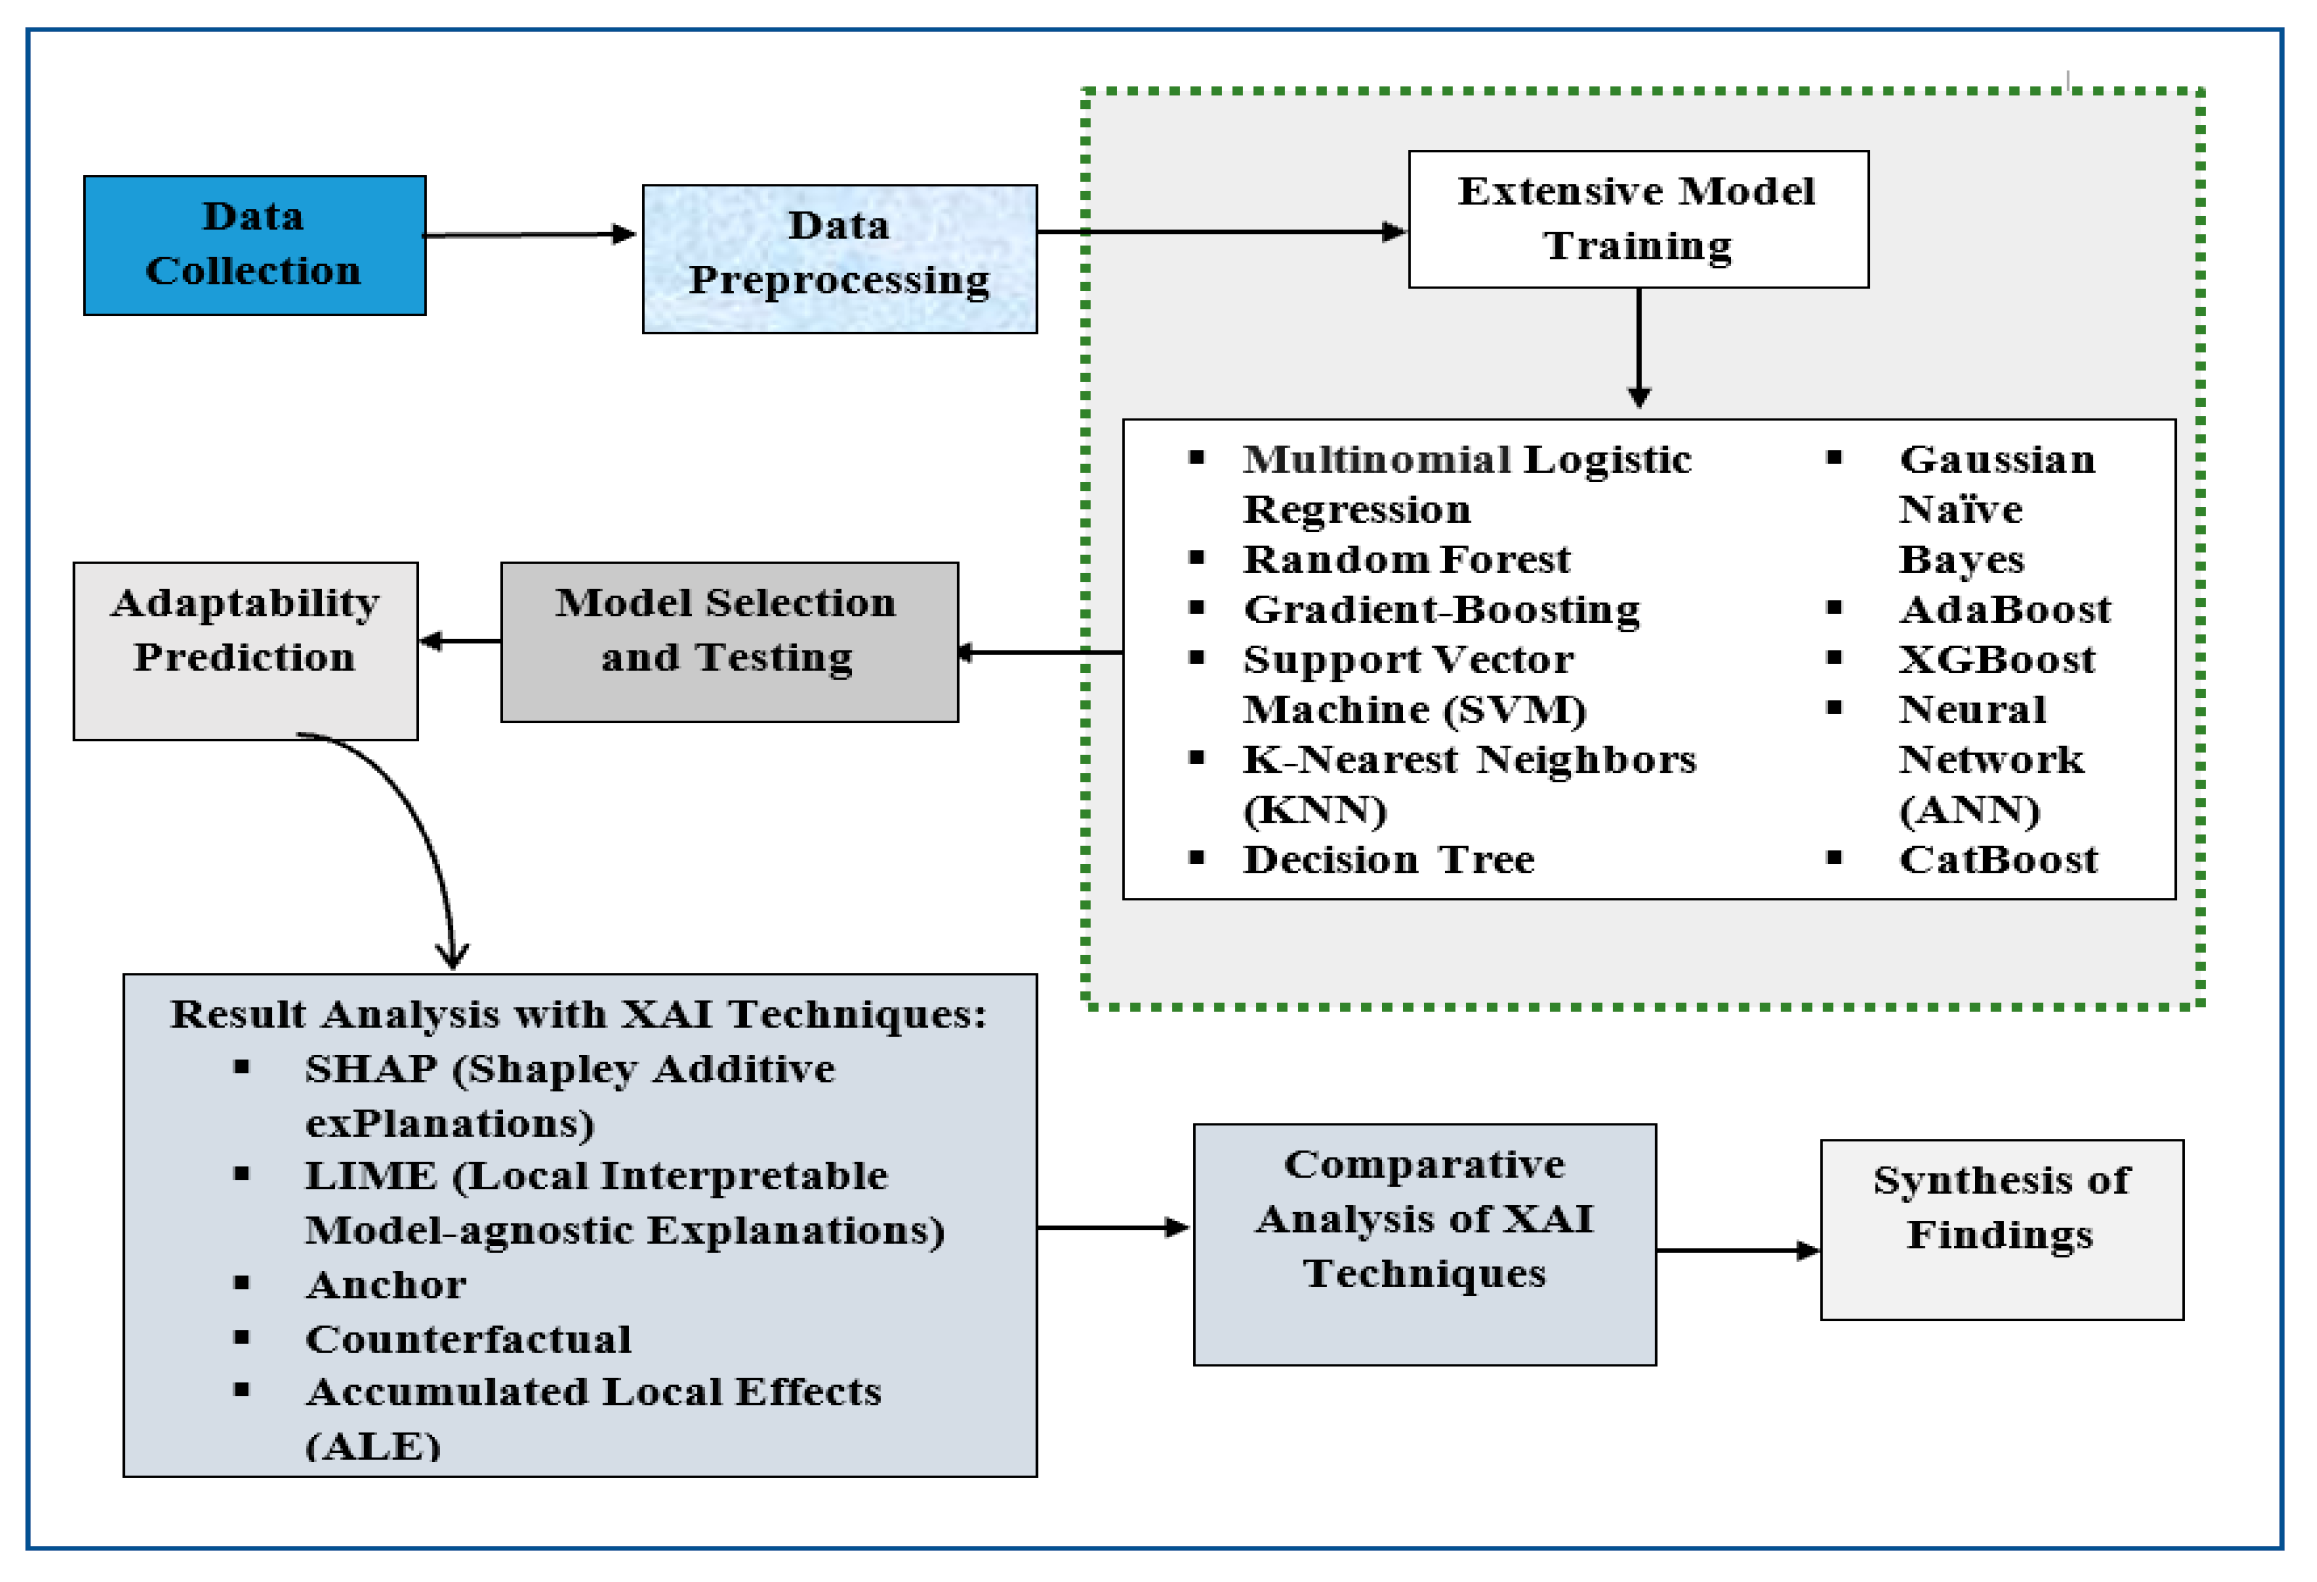
Figure 2.
Balanced Frequency plot of Adaptivity level.
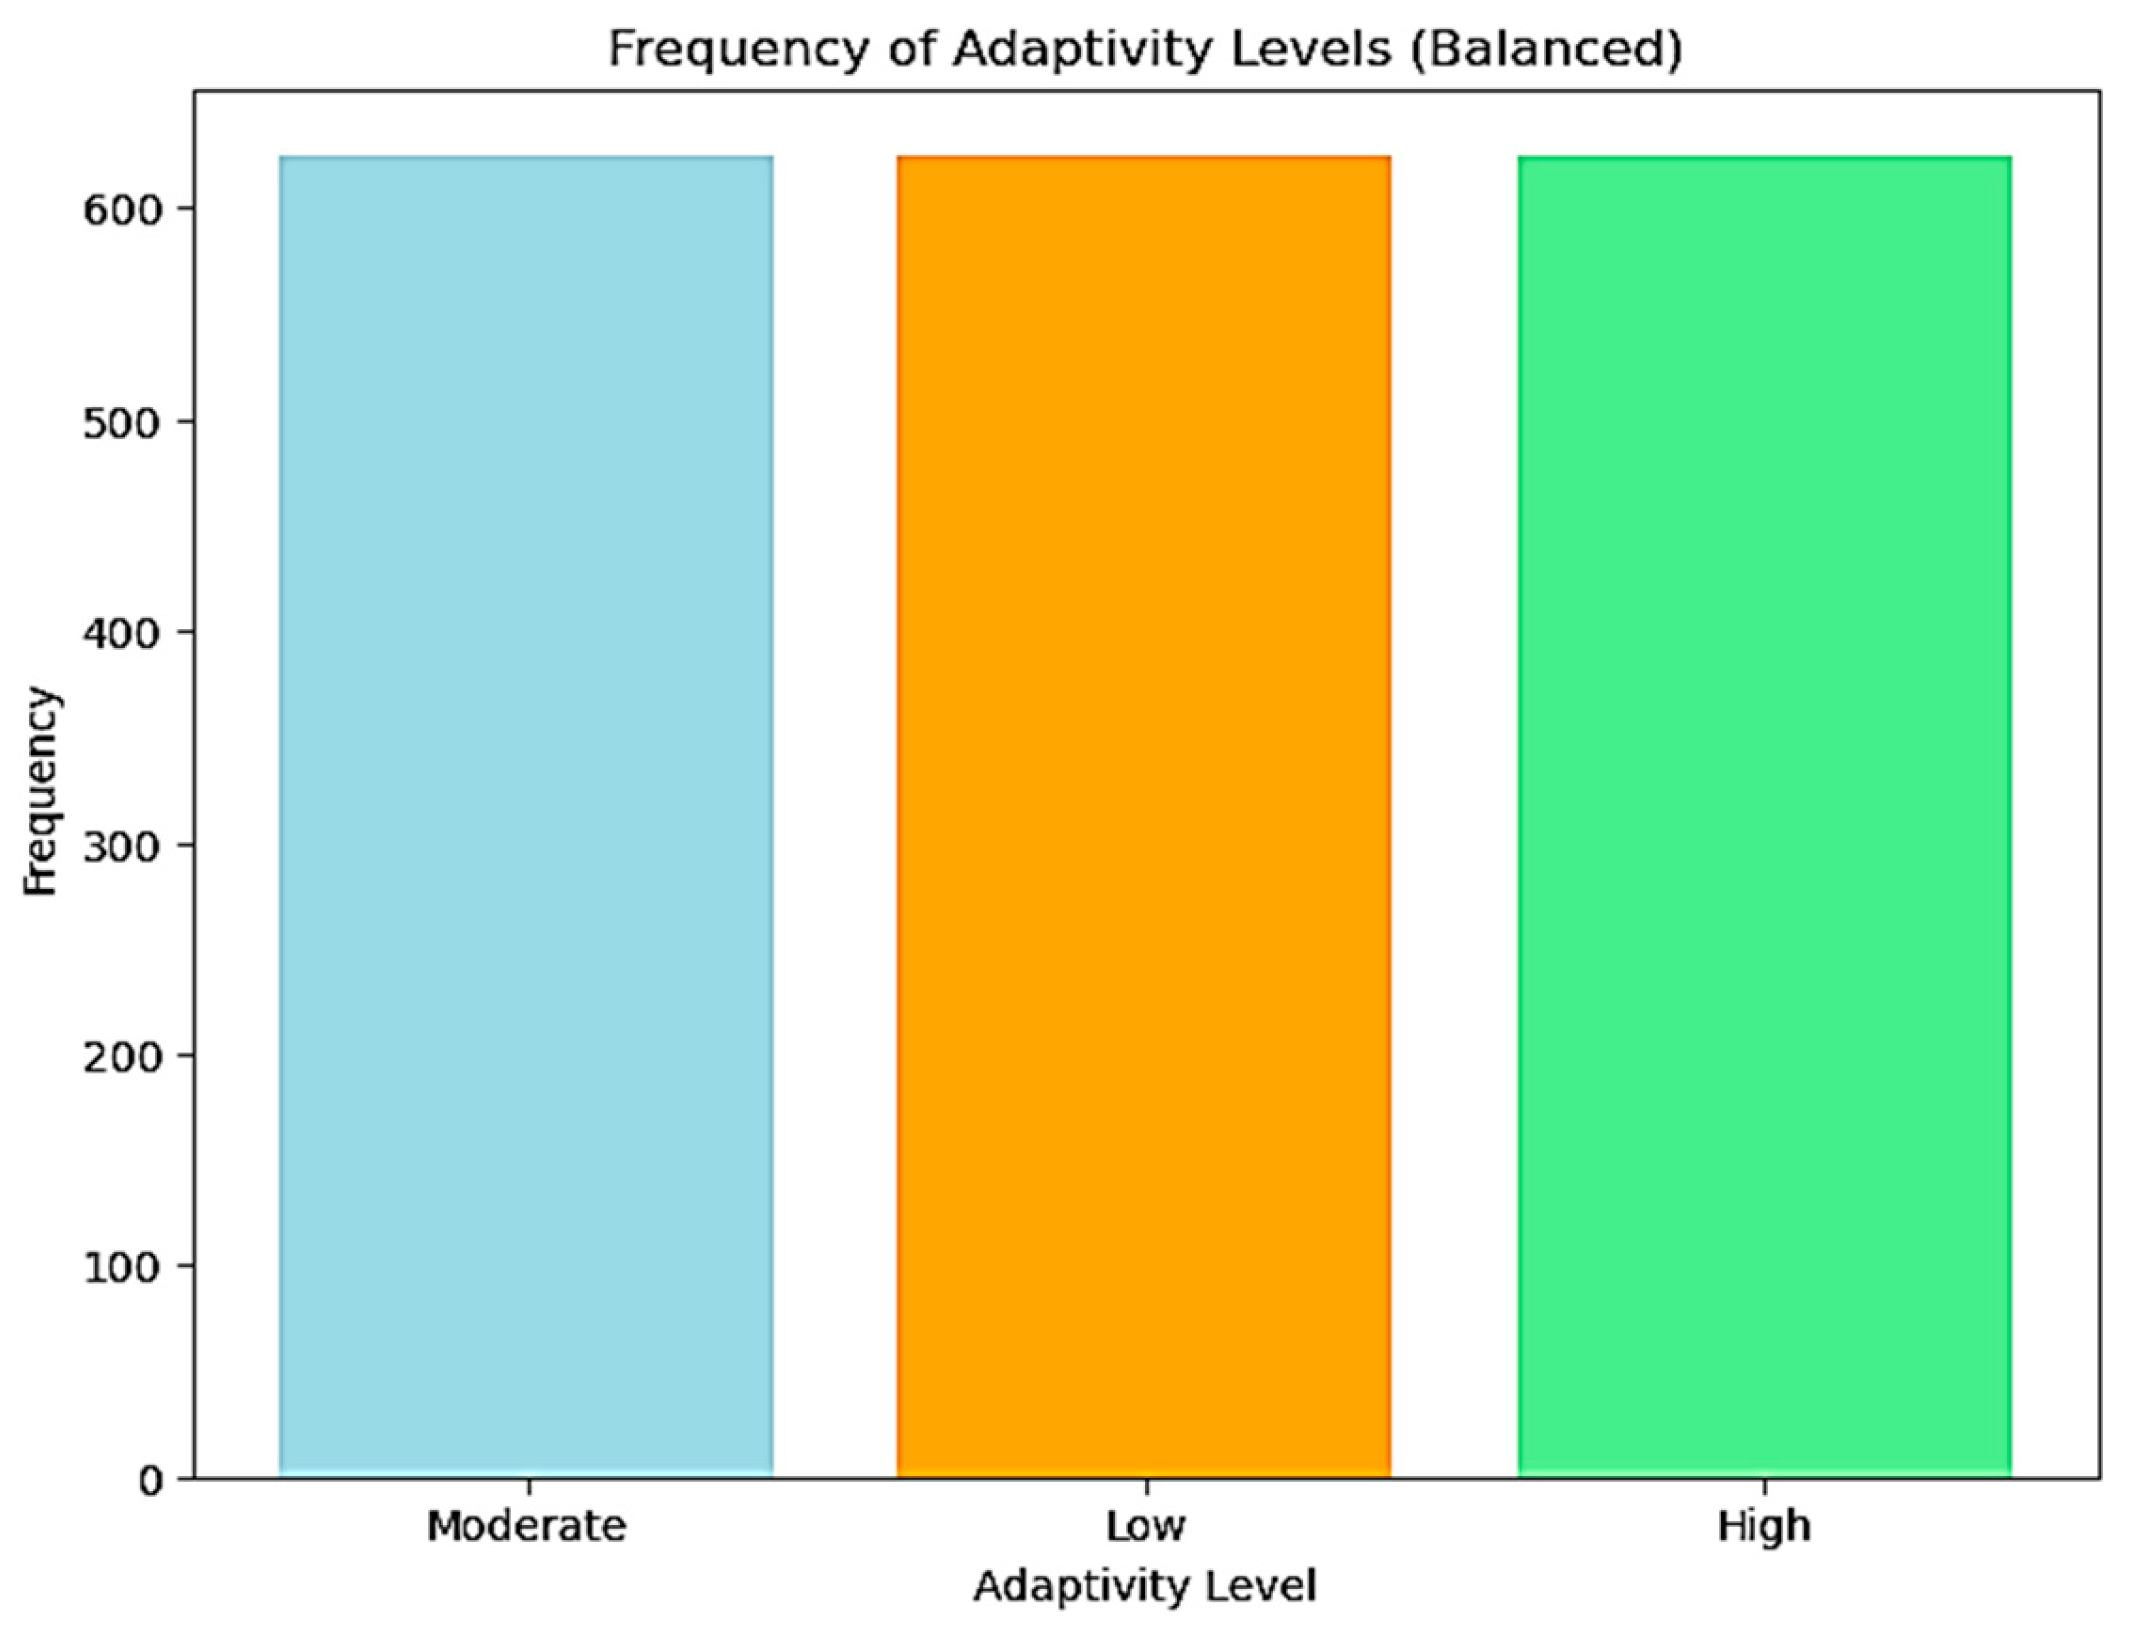
Figure 3.
Model Accuracy Comparison.
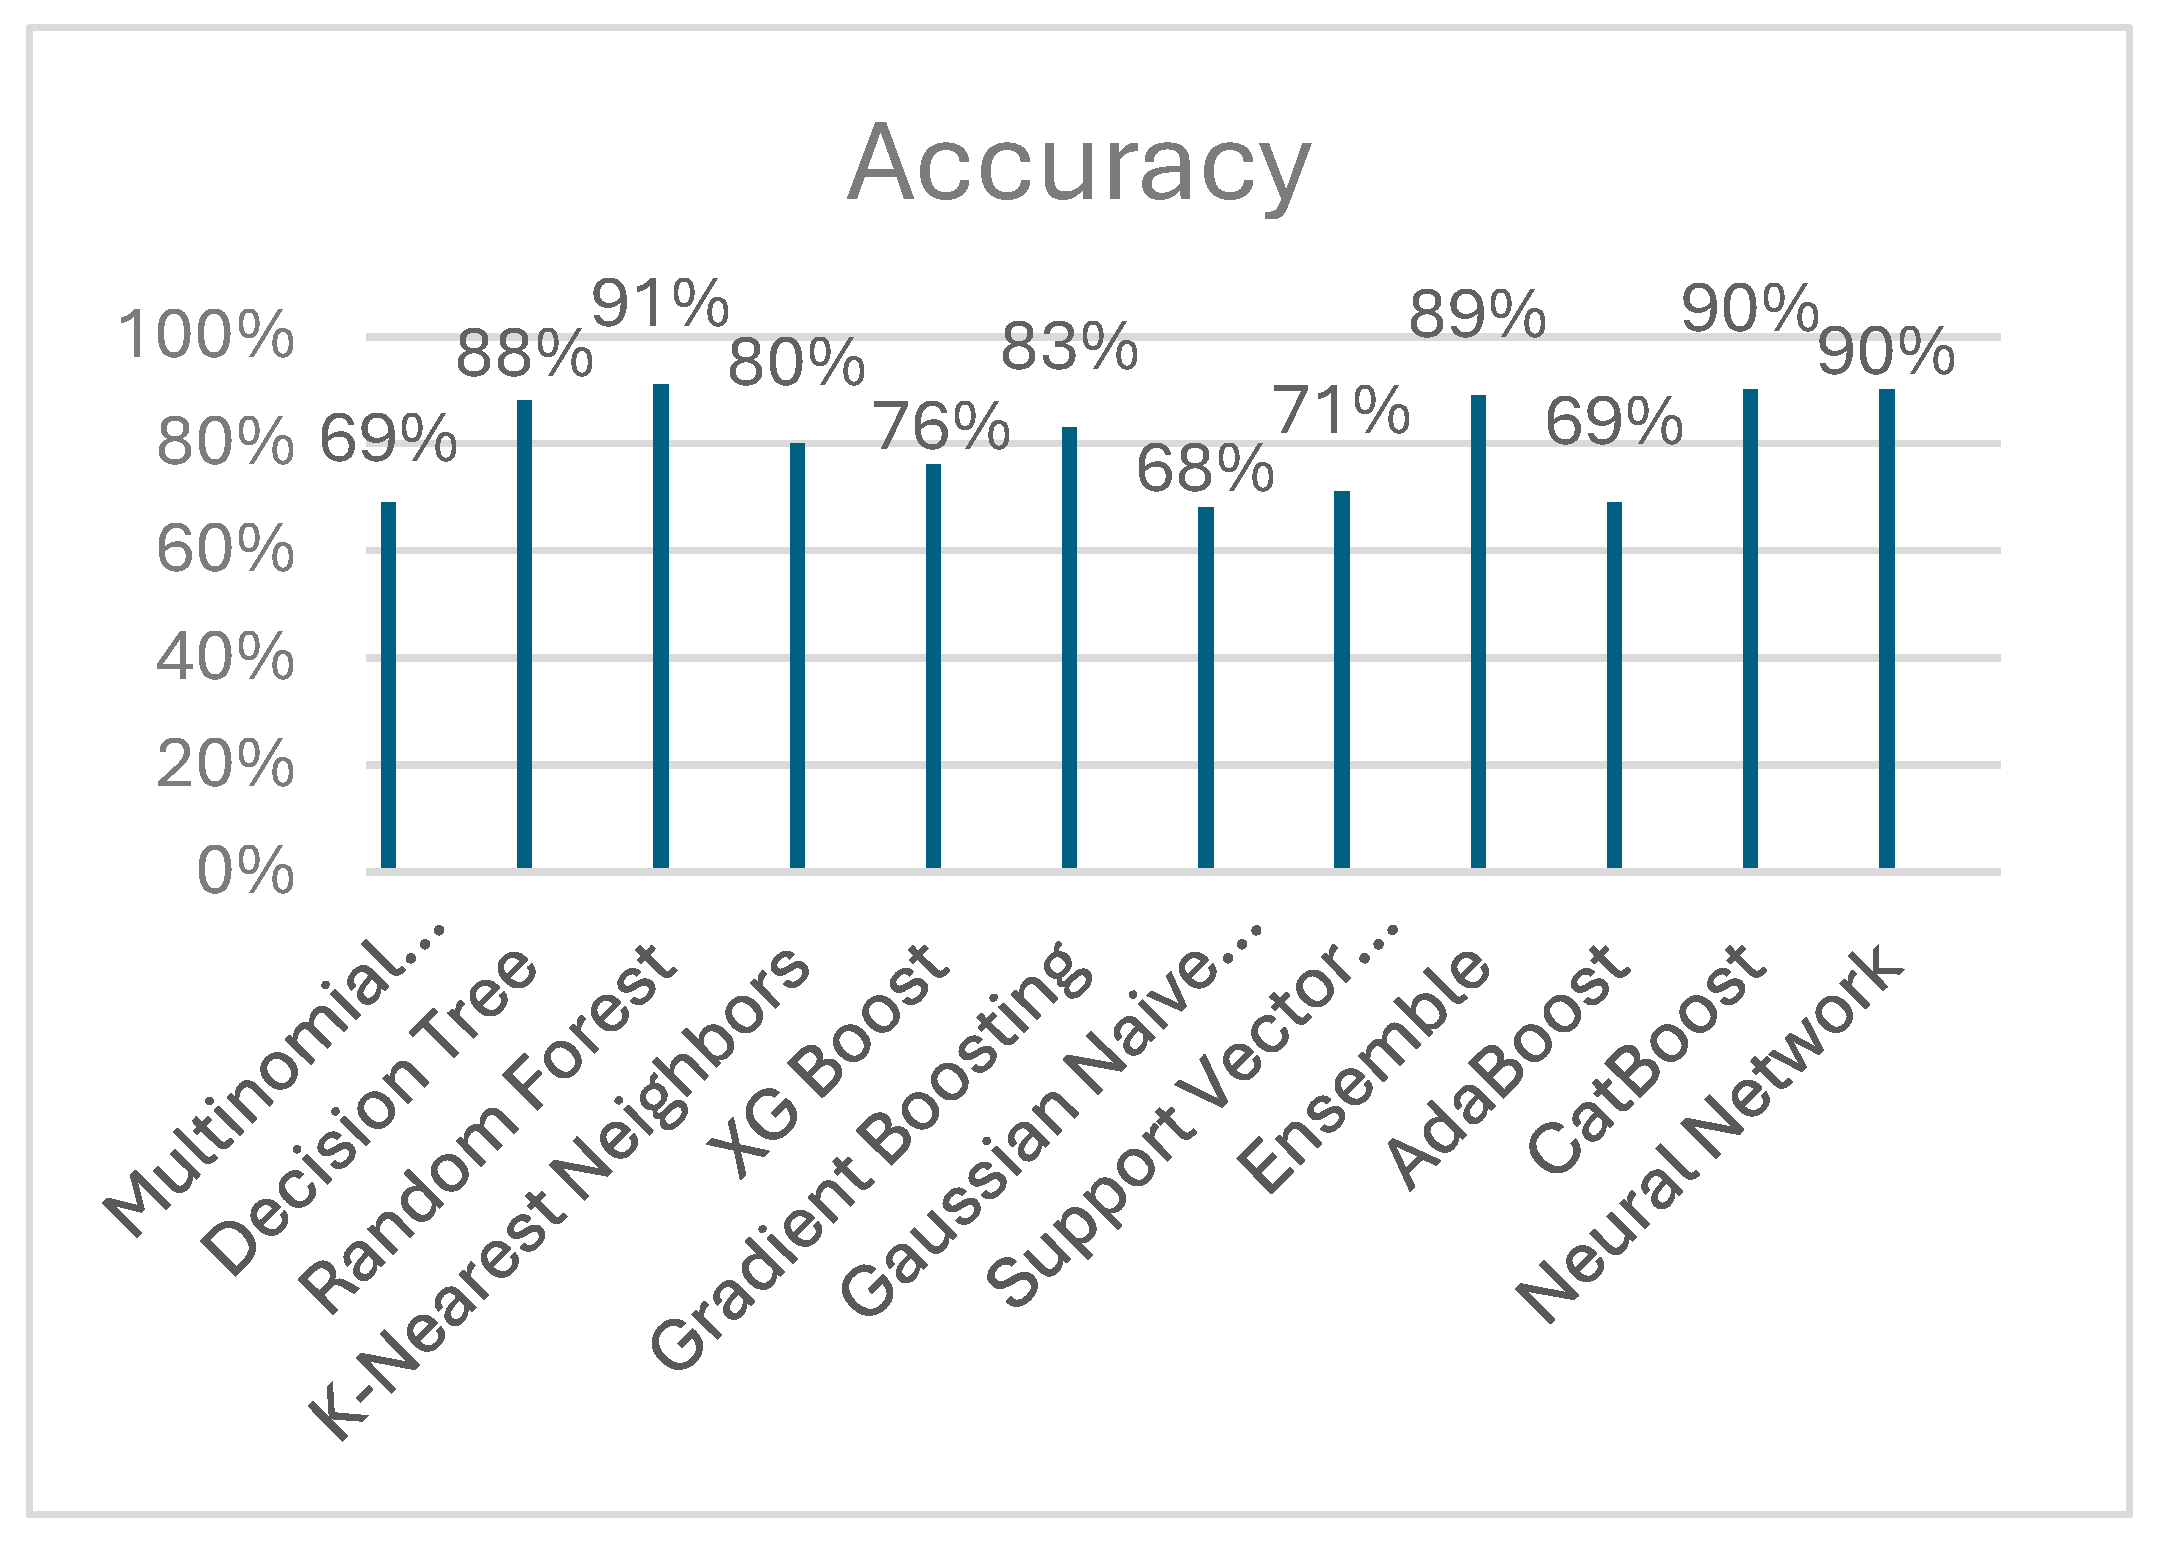
Figure 4.
(Global Explanation) Mean Impact of Features on Predicted Student Adaptability Levels Using SHAP Values.
Figure 4.
(Global Explanation) Mean Impact of Features on Predicted Student Adaptability Levels Using SHAP Values.
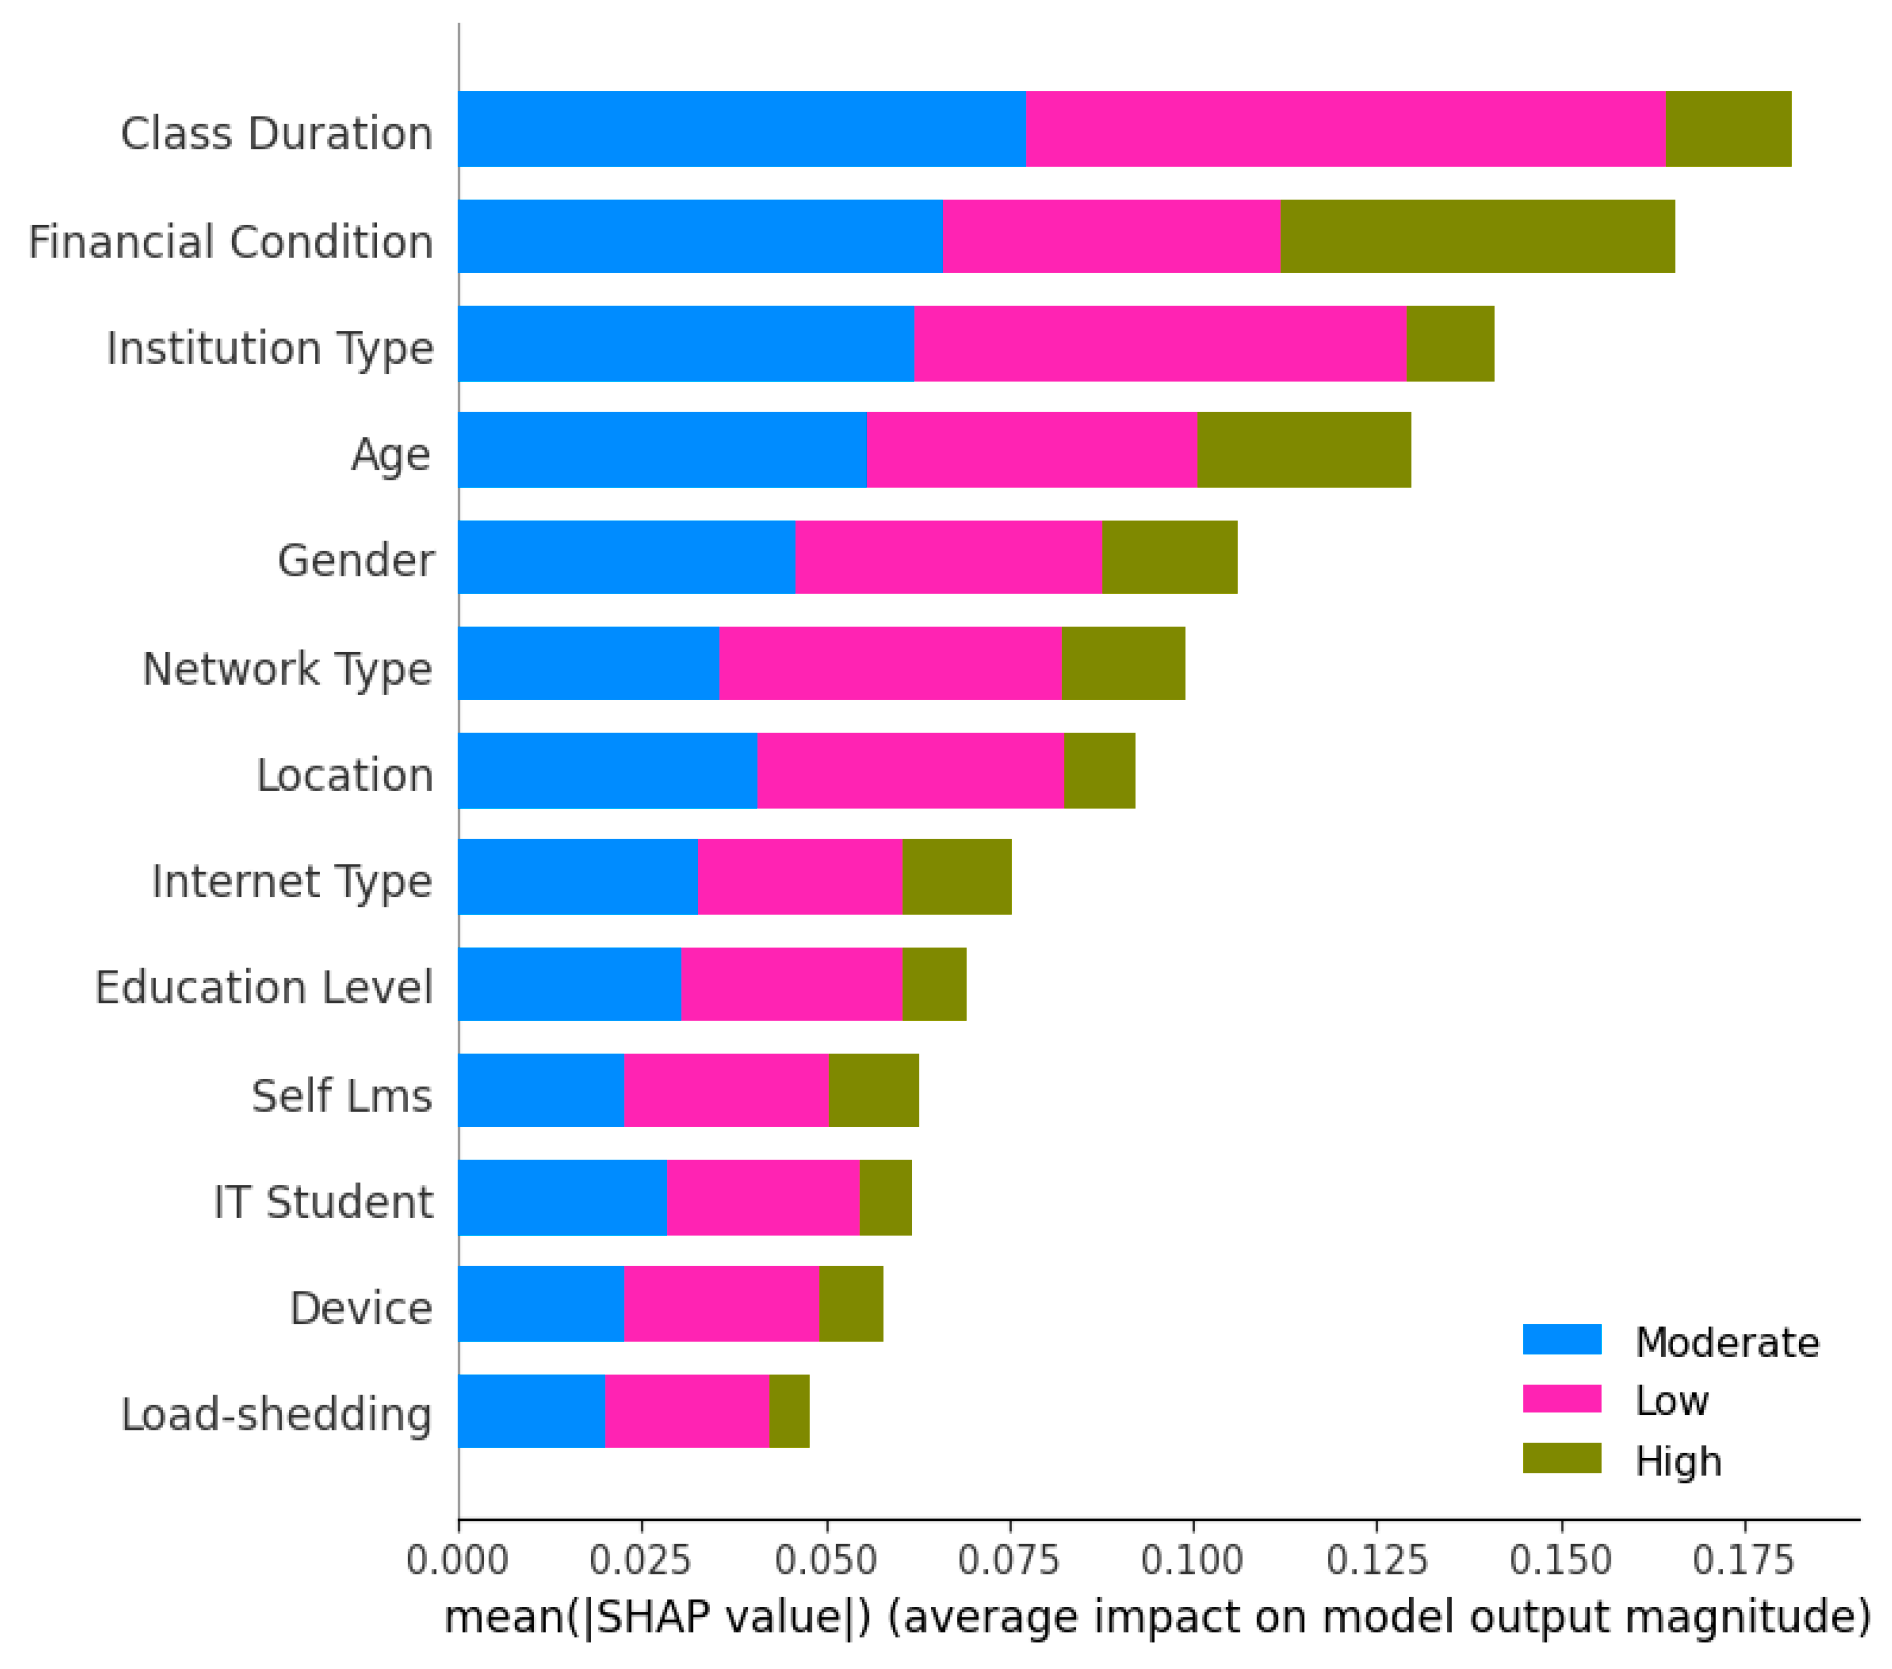
Figure 5.
SHAP Force Plot for an Individual Prediction of Student Adaptability. (a) Instance for an explanation (b) SHAP value of the instance (c) Instance local explanation.
Figure 5.
SHAP Force Plot for an Individual Prediction of Student Adaptability. (a) Instance for an explanation (b) SHAP value of the instance (c) Instance local explanation.
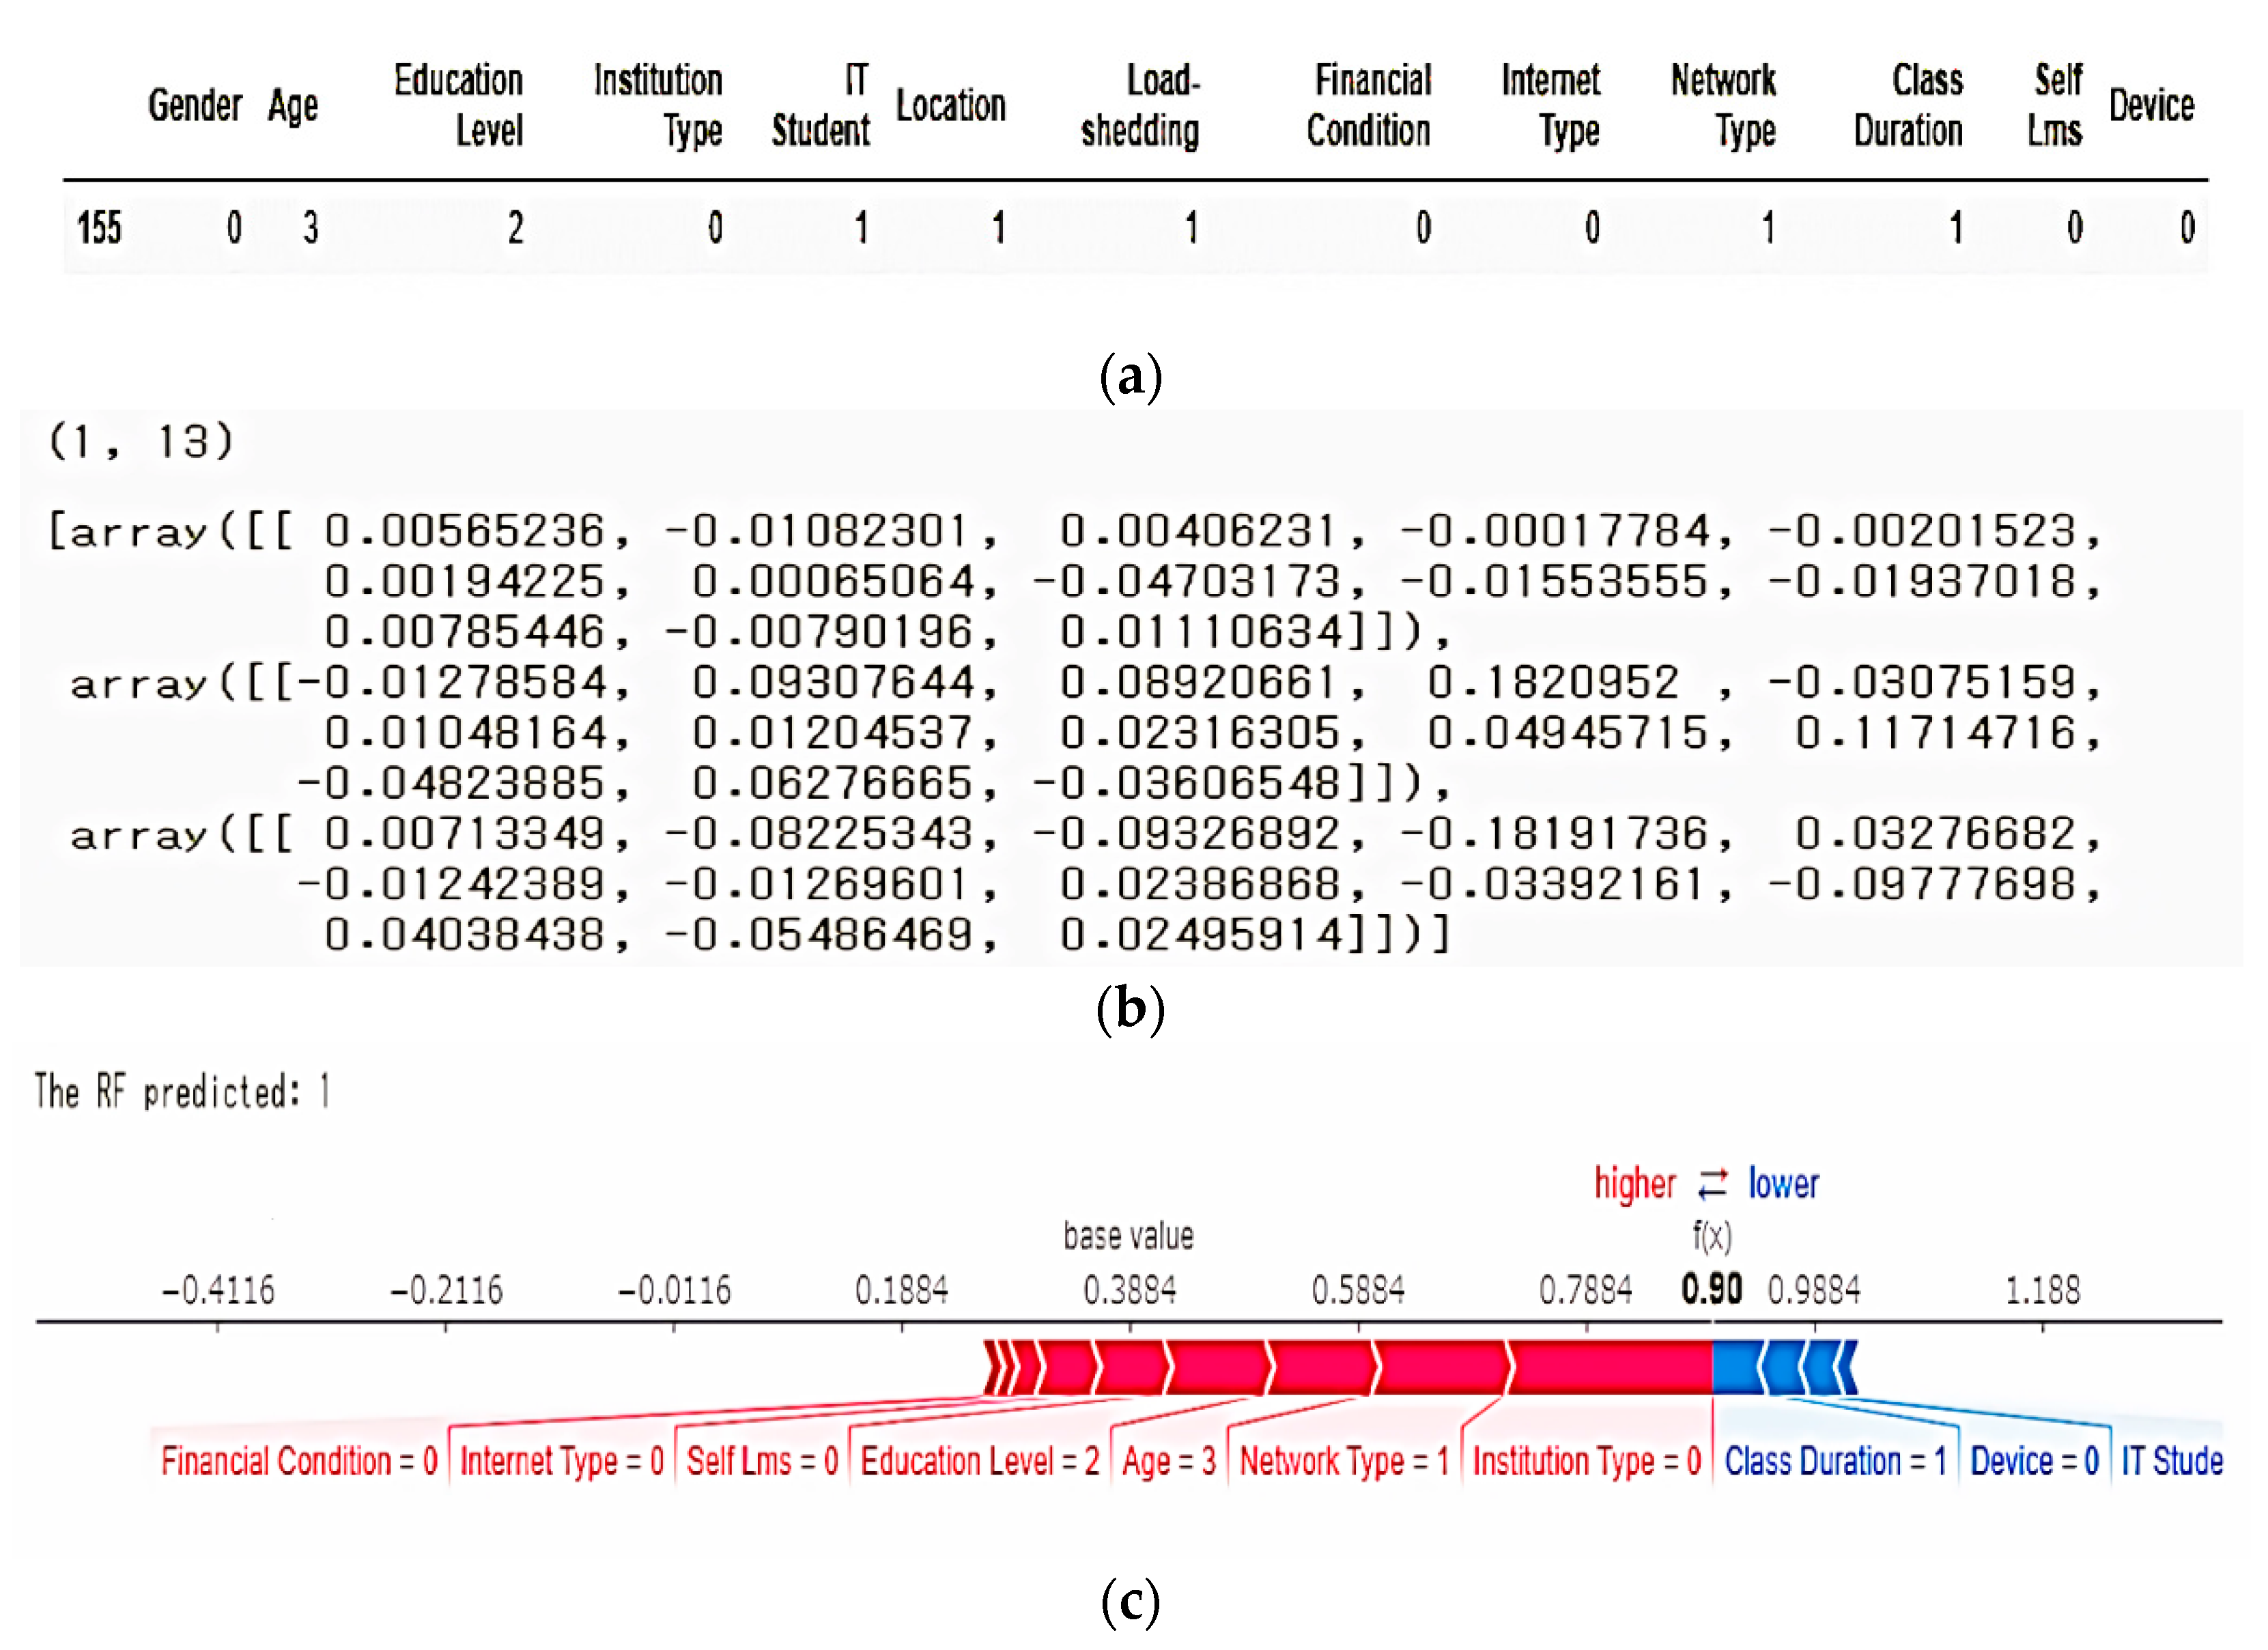
Figure 6.
(Local) Interpretation of a Model Prediction Using LIME.

Figure 7.
ALE Feature Importance for Predicting Student Adaptability Level.
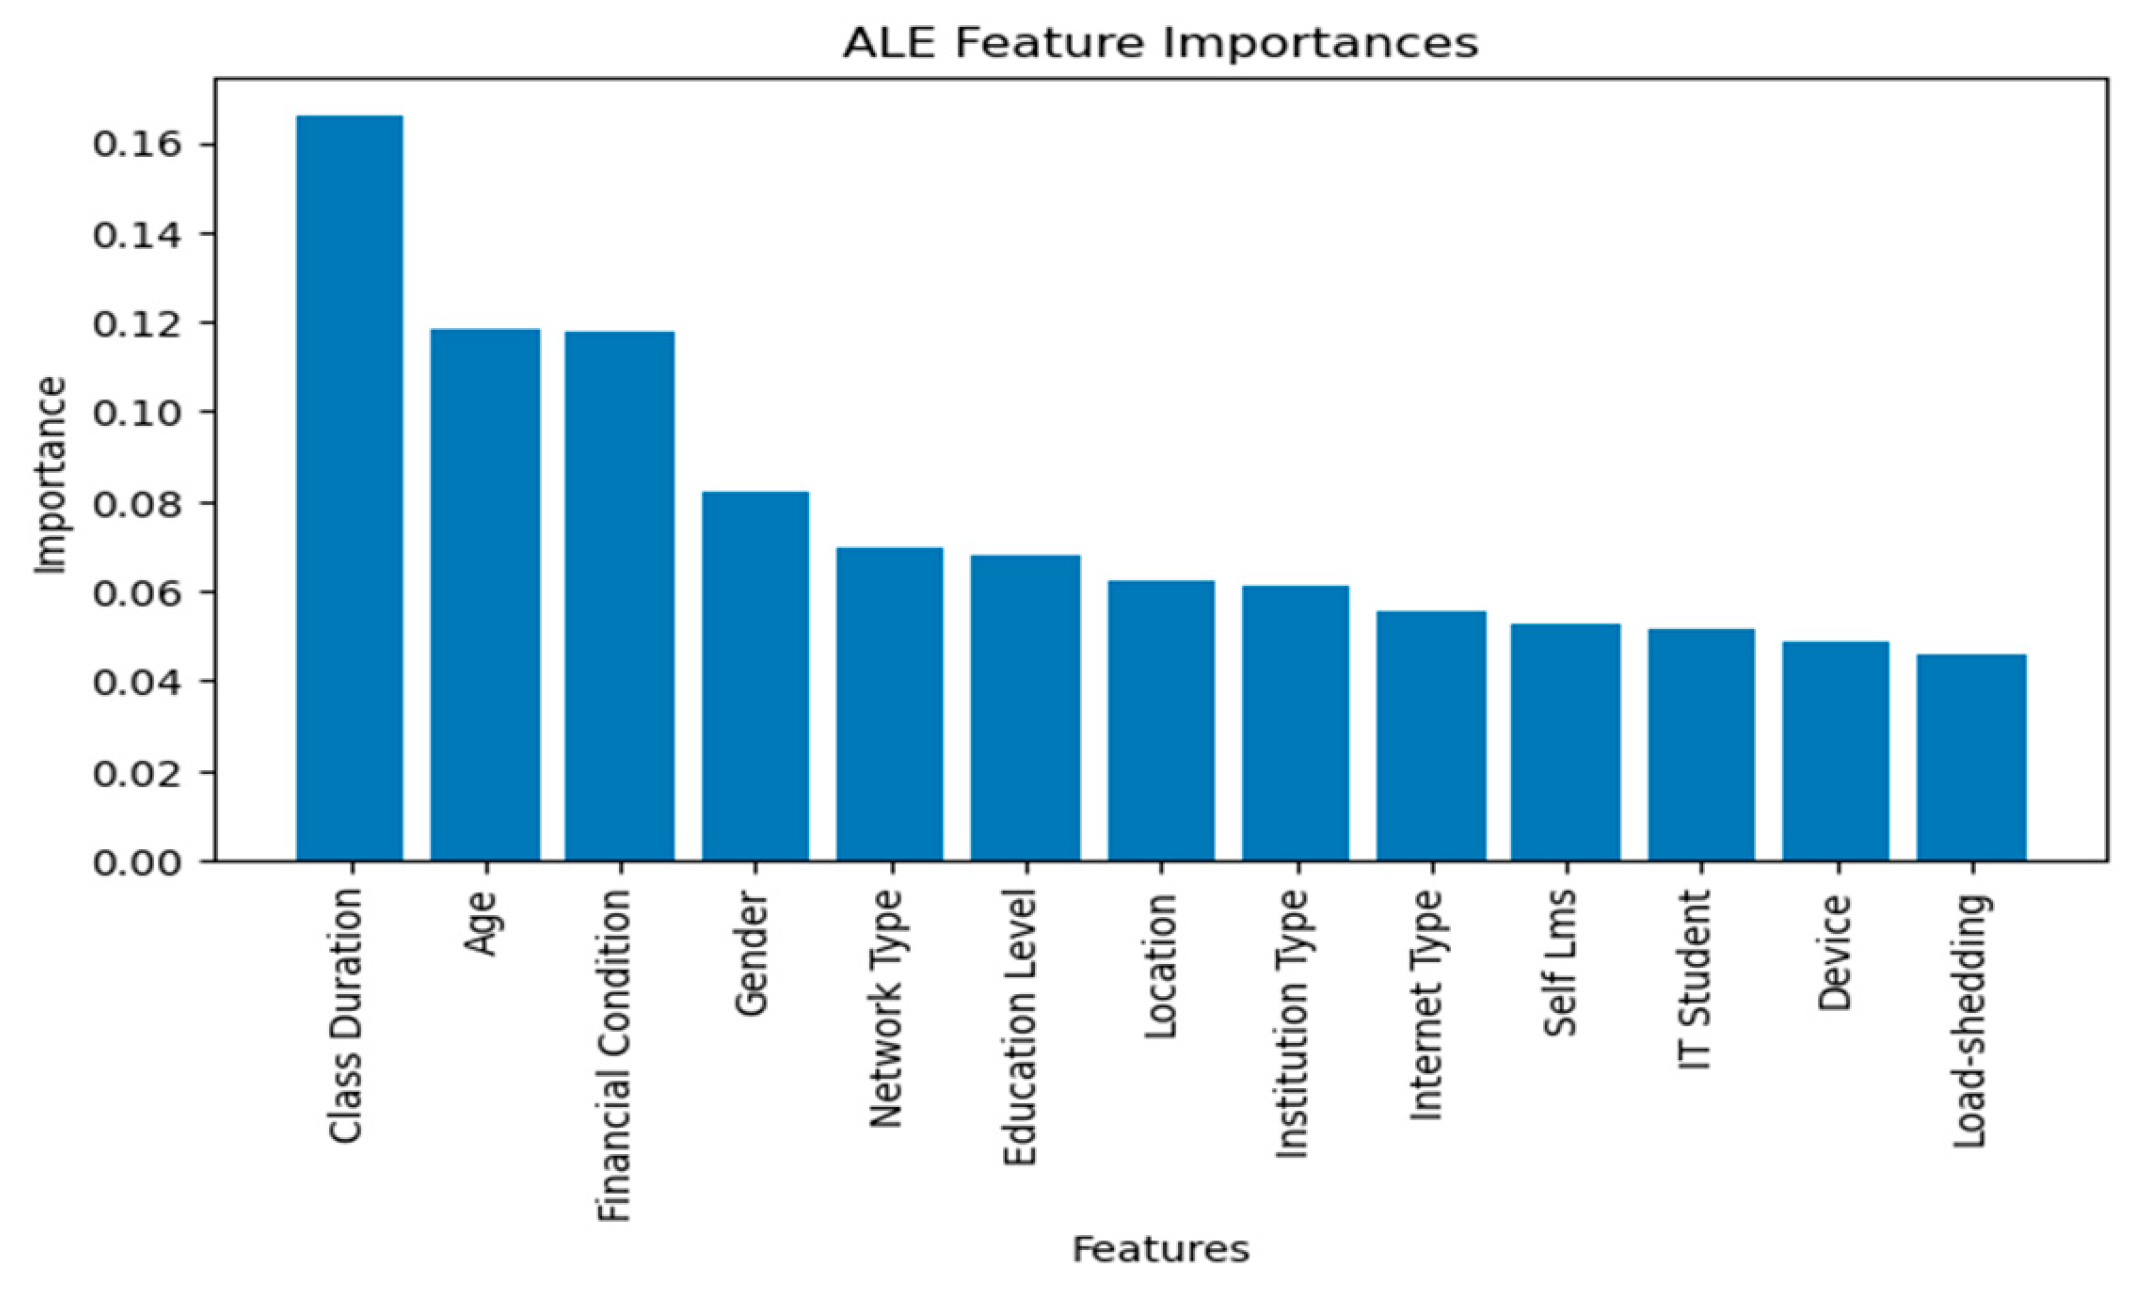
Figure 8.
ALE Plots for Three Most Influential Features, (a) Class Duration, (b) Age, and (c) Financial Condition on Student Adaptability Predictions.
Figure 8.
ALE Plots for Three Most Influential Features, (a) Class Duration, (b) Age, and (c) Financial Condition on Student Adaptability Predictions.
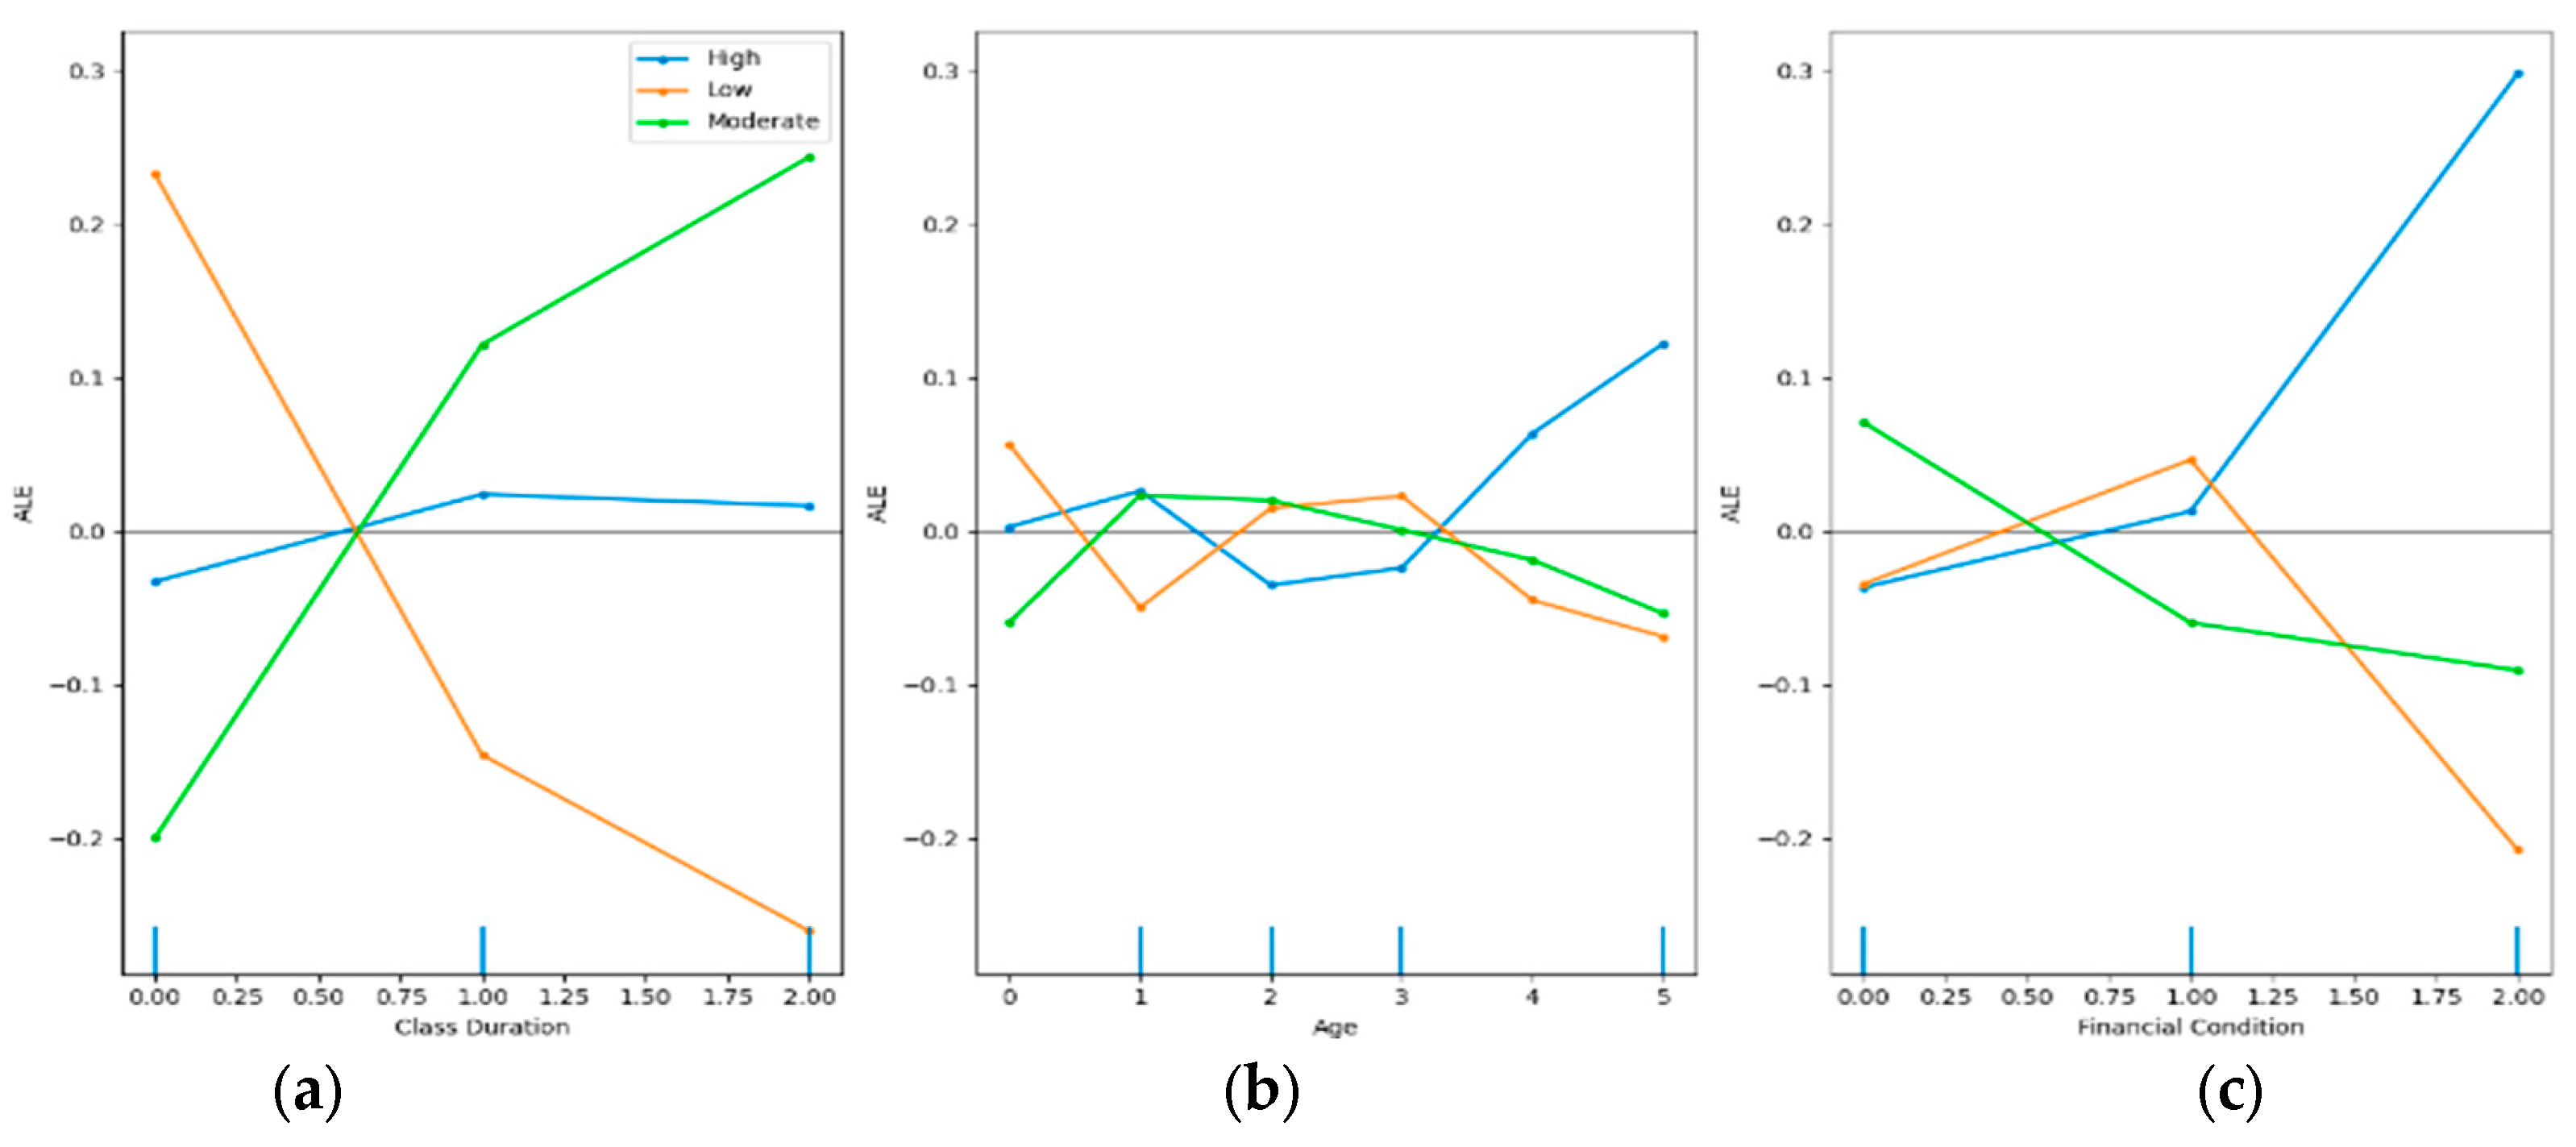
Figure 9.
Counterfactual Analysis Illustrating Adaptability Prediction Shift.
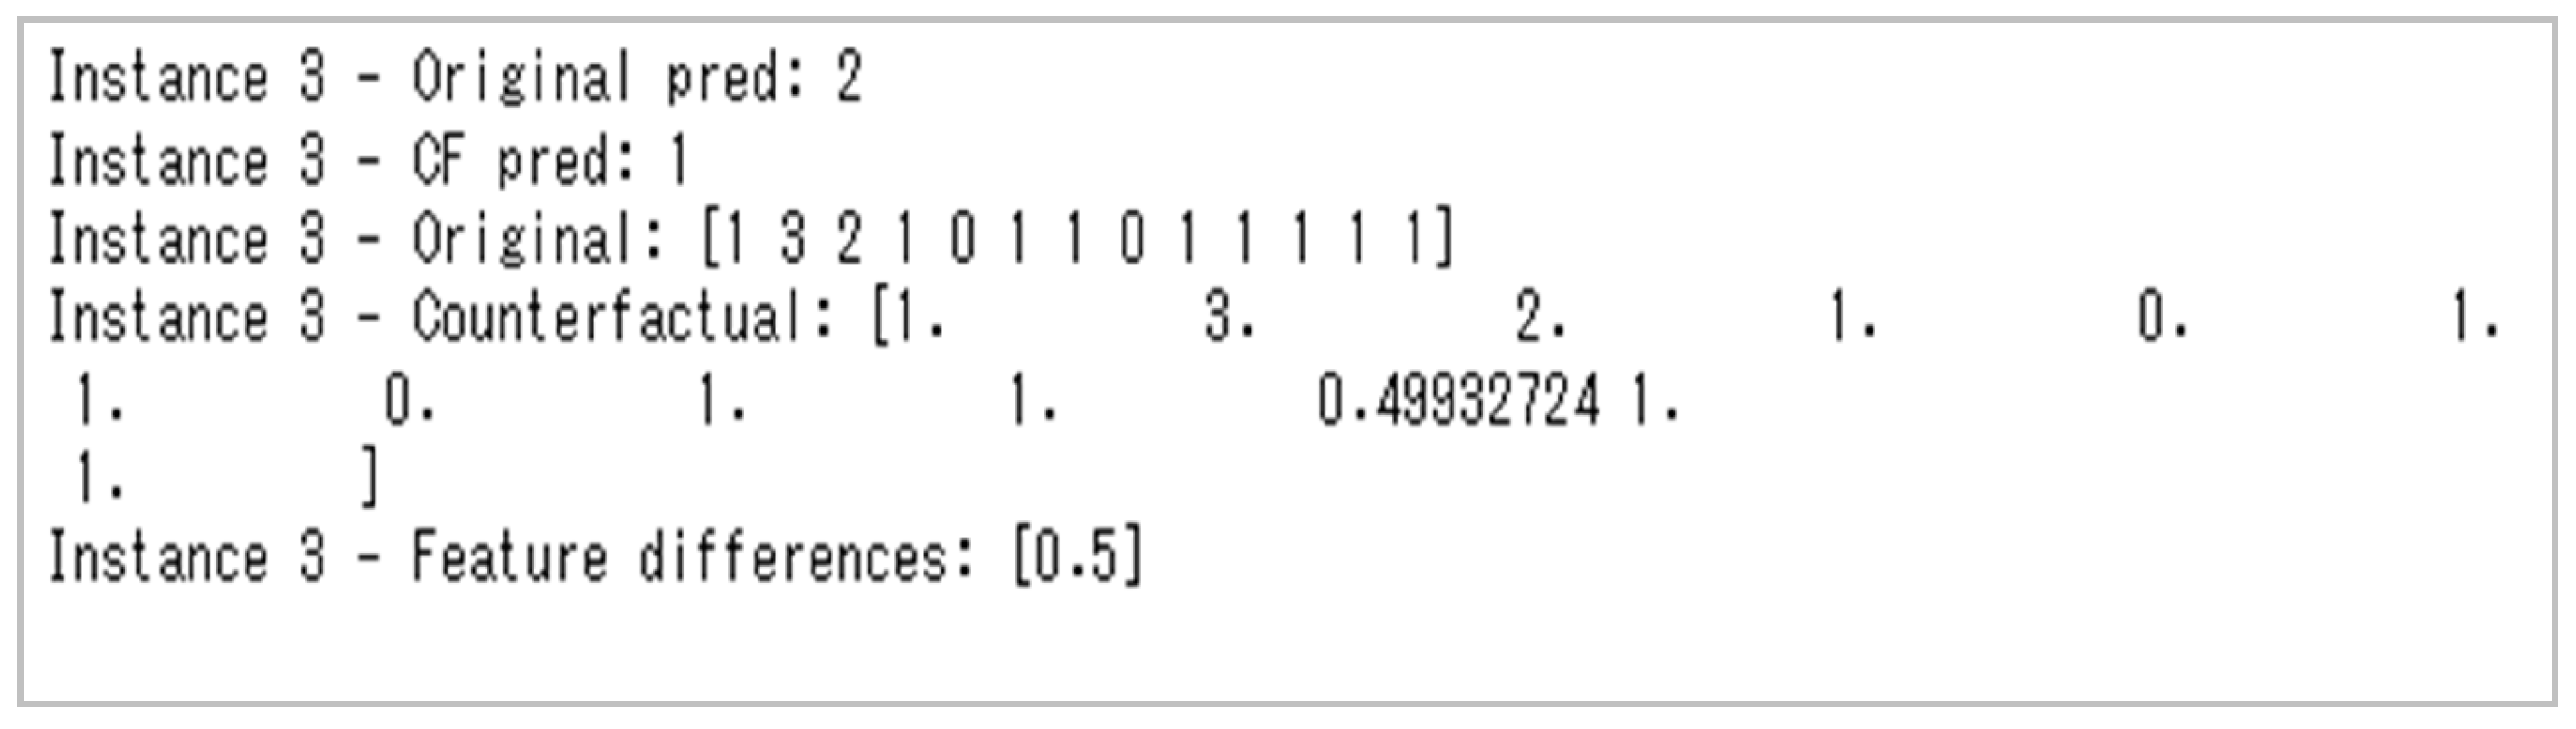
Figure 10.
Comparative Analysis of Original and Counterfactual Feature Values for Instance 3.
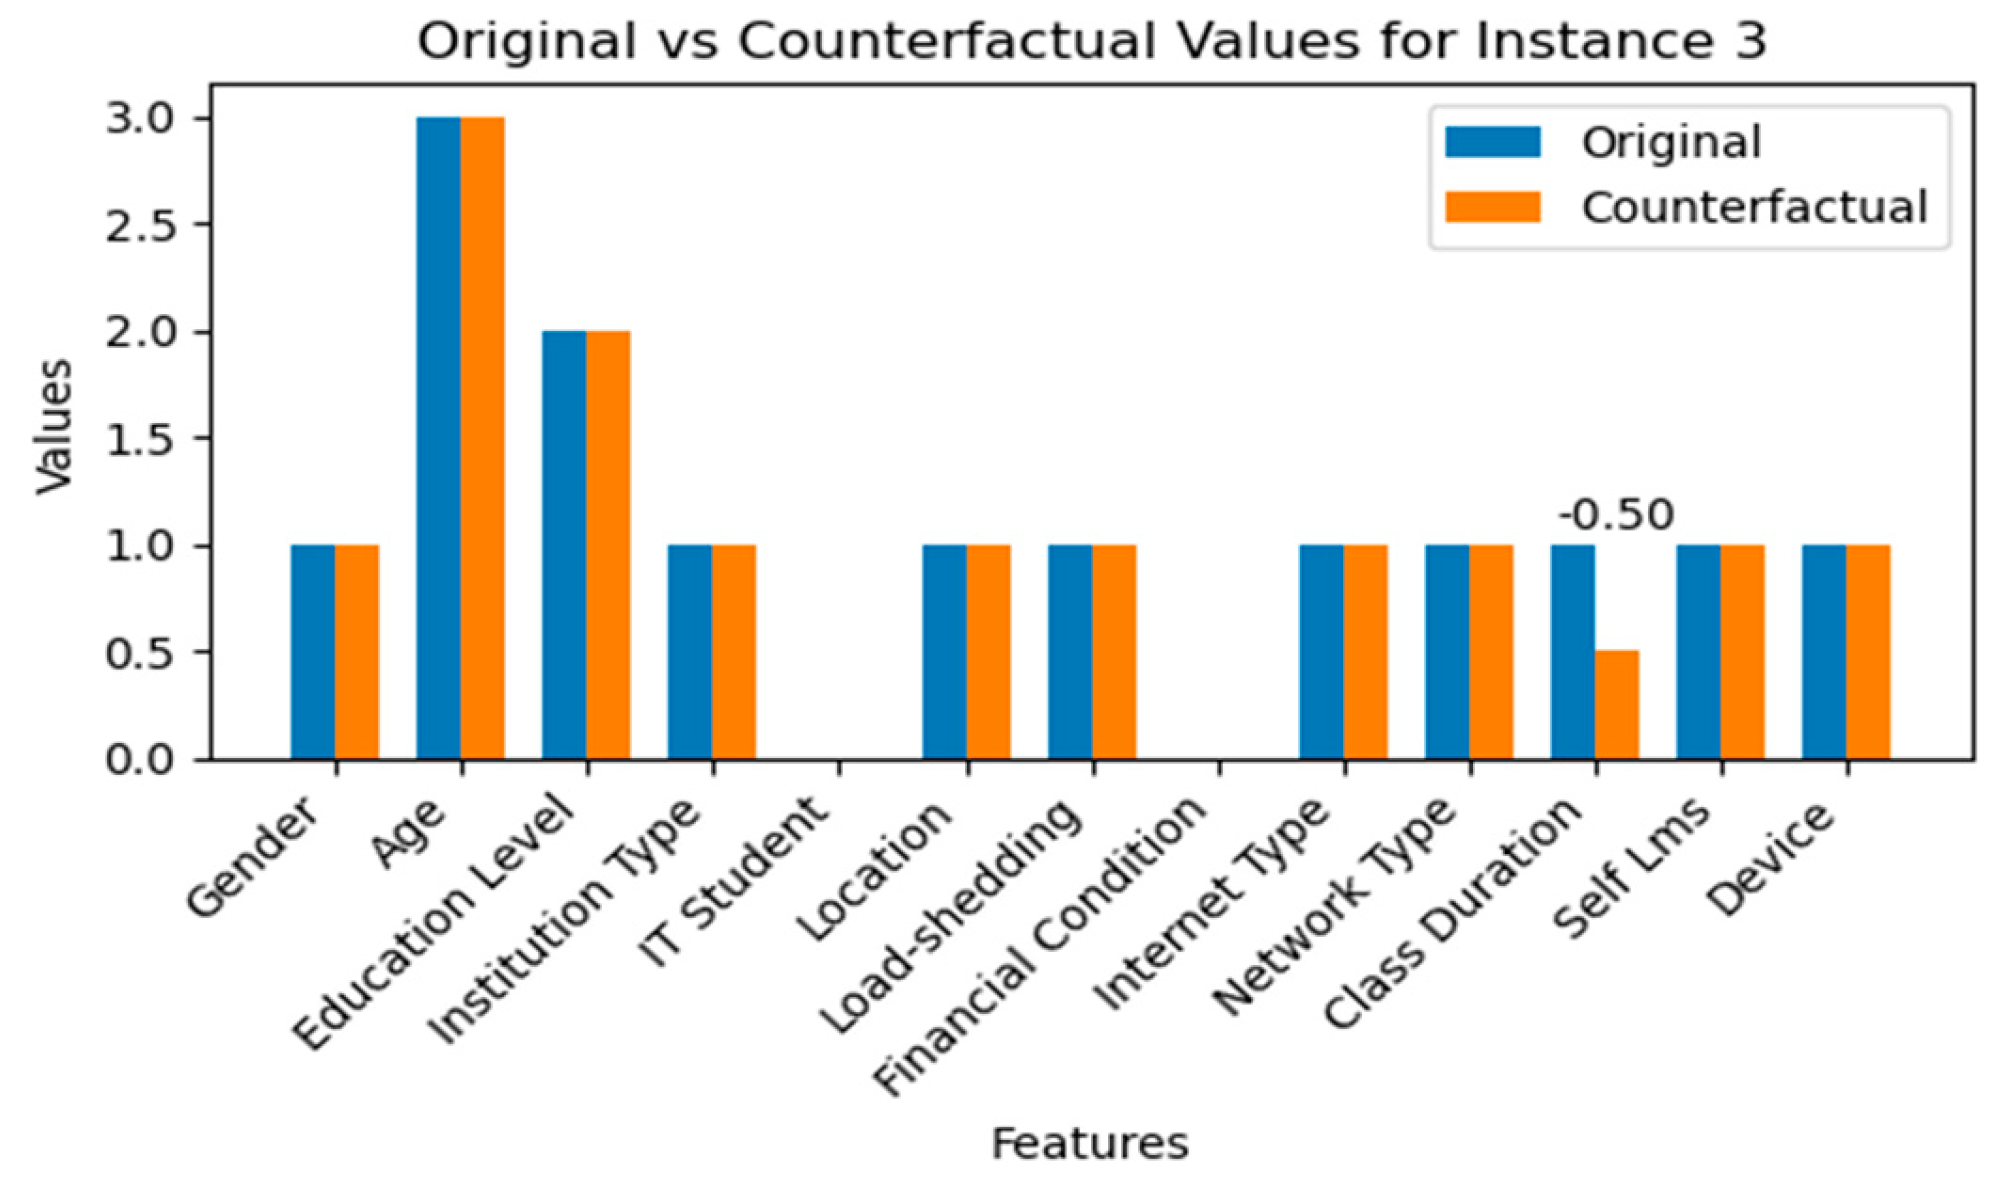

Table 1.
Summary statistics of the dataset.
| Variable | Count | Unique | Top | Freq |
|---|---|---|---|---|
| Gender | 1205 | 2 | Boy | 603 |
| Age | 1205 | 6 | 21-25 | 374 |
| Education Level | 1205 | 3 | School | 530 |
| Institution Type | 1205 | 2 | Non-Government | 623 |
| IT Student | 1205 | 2 | No | 501 |
| Location | 1205 | 2 | Yes | 135 |
| Load-shedding | 1200 | 2 | Low | 1004 |
| Financial Condition | 1206 | 3 | Mid | 676 |
| Internet Type | 1205 | 2 | Mobile | 655 |
| Network Type | 1205 | 3 | 4G | 775 |
| Class Duration | 1205 | 3 | 1-3 | 840 |
| Self Lms | 1205 | 2 | No | 955 |
| Device | 1205 | 3 | Mobile | 1013 |
| Adaptivity Level | 1205 | 3 | Moderate | 625 |
Table 2.
Models Trained and Their Parameters.
| S/N | Model | Parameters | Values |
|---|---|---|---|
| 1 | Multinomial Logistic Regression |
MaximumIterations(max_iter) multi_class |
1000 auto |
| 2 | Decision Tree | max_depth min_samples_leaf min_samples_split criterion splitter max_features |
range (1, 20, 2) range (1, 100, 5) range (2, 10) gini and entropy best and random sqrt |
| 3 | Random Forest | random_state | 0 |
| 4 | K-Nearest Neighbors | n_neighbors | 5 |
| 5 | XG Boost | max_depth learning_rate n_estimators |
5 0.01 200 |
| 6 | Gradient Boosting | n_estimators random_state |
100 42 |
| 7 | Gaussian Naive Bayes | Gaussian Naive Bayes | Normal no special setup |
| 8 | Support Vector Machine (SVM) | Kernel Regularization Parameter (C) Random State |
Linear 1.0 42 |
| 9 | Ensemble | Random Forest Classifier random_state Gradient Boosting Classifier random_state Logistic Regression max_iter random_state Ensemble method used |
42 42 1500 42 voting |
| 10 | AdaBoost | Base Classifier max_depth n_estimators random_state |
Decision Tree 1 50 42 |
| 11 | CatBoost | Iterations Depth learning_rate verbose random_state early_stopping_rounds |
1500 6 0.1 200 42 50 |
| 12 | Neural Network | Input Layer Activation Function First Hidden Layer: Units Second Hidden Layer Units Third Hidden Layer Units Output Layer Units Activation Function |
X_train_stand ReLU 64 32 16 3 Softmax |
Table 3.
Confusion Matrices of the Deployed Models.
| Actual | Model | Class Name | Predicted | ||
| High | Low | Moderate | |||
| Multinomial Logistic Regression | High | 11 | 5 | 7 | |
| Low | 1 | 57 | 45 | ||
| Moderate | 3 | 14 | 98 | ||
| Decision Tree | High | 15 | 0 | 8 | |
| Low | 2 | 95 | 6 | ||
| Moderate | 1 | 7 | 107 | ||
| Random Forest | High | 15 | 0 | 8 | |
| Low | 2 | 97 | 4 | ||
| Moderate | 0 | 7 | 108 | ||
| K-Nearest Neighbors | High | 10 | 1 | 12 | |
| Low | 1 | 89 | 13 | ||
| Moderate | 2 | 19 | 94 | ||
| XG Boost | High | 12 | 0 | 11 | |
| Low | 3 | 67 | 33 | ||
| Moderate | 2 | 8 | 105 | ||
| Gradient Boosting | High | 13 | 0 | 10 | |
| Low | 2 | 87 | 14 | ||
| Moderate | 0 | 14 | 101 | ||
| Gaussian Naive Bayes | High | 13 | 3 | 7 | |
| Low | 2 | 62 | 39 | ||
| Moderate | 6 | 20 | 89 | ||
| Support Vector Machine (SVM) | High | 13 | 1 | 9 | |
| Low | 3 | 57 | 43 | ||
| Moderate | 4 | 9 | 102 | ||
| Ensemble | High | 12 | 1 | 10 | |
| Low | 0 | 92 | 11 | ||
| Moderate | 0 | 4 | 111 | ||
| AdaBoost | High | 8 | 3 | 12 | |
| Low | 2 | 69 | 32 | ||
| Moderate | 3 | 22 | 90 | ||
| CatBoost | High | 15 | 0 | 8 | |
| Low | 2 | 95 | 6 | ||
| Moderate | 0 | 8 | 107 | ||
| Neural Network | High | 15 | 0 | 8 | |
| Low | 2 | 93 | 8 | ||
| Moderate | 0 | 7 | 108 | ||
Table 4.
Performance Metrics of The Deployed Models.
| Model | Class Name |
Precision | Recall | F1-score |
|---|---|---|---|---|
| Multinomial Logistic Regression | High | 0.73 | 0.48 | 0.58 |
| Low | 0.75 | 0.55 | 0.64 | |
| Moderate | 0.65 | 0.85 | 0.74 | |
| Decision Tree | High | 0.88 | 0.65 | 0.75 |
| Low | 0.88 | 0.92 | 0.90 | |
| Moderate | 0.88 | 0.89 | 0.88 | |
| Random Forest | High | 0.88 | 0.65 | 0.75 |
| Low | 0.93 | 0.94 | 0.94 | |
| Moderate | 0.90 | 0.94 | 0.92 | |
| K-Nearest Neighbors | High | 0.77 | 0.43 | 0.56 |
| Low | 0.82 | 0.86 | 0.84 | |
| Moderate | 0.79 | 0.82 | 0.80 | |
| XG Boost | High | 0.71 | 0.52 | 0.60 |
| Low | 0.89 | 0.65 | 0.75 | |
| Moderate | 0.70 | 0.91 | 0.80 | |
| Gradient Boosting | High | 0.87 | 0.57 | 0.68 |
| Low | 0.86 | 0.84 | 0.85 | |
| Moderate | 0.81 | 0.88 | 0.84 | |
| Gaussian Naive Bayes | High | 0.62 | 0.57 | 0.59 |
| Low | 0.73 | 0.60 | 0.66 | |
| Moderate | 0.66 | 0.77 | 0.71 | |
| Support Vector Machine (SVM) | High | 0.65 | 0.57 | 0.60 |
| Low | 0.85 | 0.55 | 0.67 | |
| Moderate | 0.66 | 0.89 | 0.76 | |
| Ensemble | High | 1.0 | 0.52 | 0.69 |
| Low | 0.95 | 0.89 | 0.92 | |
| Moderate | 0.84 | 0.97 | 0.90 | |
| AdaBoost | High | 0.62 | 0.35 | 0.44 |
| Low | 0.73 | 0.67 | 0.70 | |
| Moderate | 0.67 | 0.78 | 0.72 | |
| CatBoost | High | 0.88 | 0.65 | 0.75 |
| Low | 0.92 | 0.92 | 0.92 | |
| Moderate | 0.88 | 0.93 | 0.91 | |
| Neural Network | High | 0.88 | 0.65 | 0.75 |
| Low | 0.93 | 0.90 | 0.92 | |
| Moderate | 0.87 | 0.94 | 0.90 |
Table 5.
(Local) Anchor Explanation for a 'Moderate' Adaptability Prediction.
| Anchor Explanation Condition | |
|---|---|
| Feature | Condition |
| Institution Type | >1.00 |
| Age | <=1.00 |
| Gender | >0.00 |
| Financial Condition | <=1.00 |
| Precision | 0.9732360097323601 |
| Coverage | 0.0888 |
| Predicted Class | Moderate |
Disclaimer/Publisher’s Note: The statements, opinions and data contained in all publications are solely those of the individual author(s) and contributor(s) and not of MDPI and/or the editor(s). MDPI and/or the editor(s) disclaim responsibility for any injury to people or property resulting from any ideas, methods, instructions or products referred to in the content. |
© 2024 by the authors. Licensee MDPI, Basel, Switzerland. This article is an open access article distributed under the terms and conditions of the Creative Commons Attribution (CC BY) license (http://creativecommons.org/licenses/by/4.0/).
Copyright: This open access article is published under a Creative Commons CC BY 4.0 license, which permit the free download, distribution, and reuse, provided that the author and preprint are cited in any reuse.


