Submitted:
30 April 2024
Posted:
13 May 2024
You are already at the latest version
Abstract
CAMx-LPiG (Comprehensive Air Quality Model with Extensions – Linear Plume in Grid) is an online hybrid model, based on the Chemistry and Transport Model (CTM) CAMx, that includes a sub-grid scale module to simulate the dispersion of linear road traffic emissions, called LPiG. LPiG is a plume in grid module specifically developed by extending the capabilities of the Lagrangian puff sub-grid model available in CAMx. The online integration of the local scale model within the Eulerian CTM allows for a multiscale simulation of air quality from the regional scale to the urban scale, preserving a coherent description of the chemical state of the atmosphere at all spatial scales and avoiding any double counting of the emissions simulated by the sub-grid module. In this work the model is presented and evaluated against measured NO2 concentrations for the city of Milan for the month of January 2017. The model is able to introduce road traffic induced gradient in NO2 concentration at sub-grid resolution. Moreover, CAMx-LPiG is shown to reduce the bias compared to CAMx stand-alone simulations.
Keywords:
Air Quality
; Hybrid modelling
; Road Traffic
; Plume in Grid
; CAMx
; Urban Air Quality
1. Introduction
Most of the world’s population lives in urban areas and this trend is projected to increase from 55% to 68% by 2050 (United Nations Department of Economic and Social Affairs Population Division, 2018). High population density and a large number of activities lead to several environmental issues and exposure to high levels of atmospheric pollutants concentration for urban residents. Air pollution’s impact on human health should be a major concern for policymakers because in Europe 251000-495000 preventable deaths due to PM2.5 levels and 31000-76000 due to NO2 are estimated (year of reference 2018) (EEA, 2020). According to the European Environment Agency (EEA), improving air quality in urban areas should be a priority (EEA, 2020). With the latest WHO air quality guidelines on exposure to air pollution (World Health Organization, 2021), 94% of the EU urban population exceeds the guideline value for NO2 and 97% for PM2.5 (EEA, 2022).
Among all pollution sources, road traffic is one of the most impacting, especially in urban areas. According to emission data in EU countries, road transport is the main source of NOx emissions (39%) and the fourth for PM10 emissions (10%) (EEA, 2022). In terms of ambient concentration, road traffic is estimated to be responsible for 72% of NO2 and for more than 50% of PM10 in the city of Milan (Pepe et al., 2019).
Road traffic emissions have been decreasing since the year 2000 (EEA, 2020) and it is expected that technological improvement of vehicles, together with urban mobility policies, will result in a further reduction in coming years. In Europe, the Green Deal aims to reduce 90% of transport-related greenhouse gas emissions by 2050, with only zero-emission new cars to be sold from 2035. The application of this policy would imply a short-term complete transition from internal combustion vehicles to electric ones. A reliable quantification of the environmental impacts of this transition is crucial since it could help policymakers in their decision processes and chemical transport models (CTMs) could be useful to this aim.
Eulerian CTMs are suitable for regional case studies, but they are not accurate enough to simulate urban dispersion phenomenon (i.e., road traffic) because of their spatial resolution. To improve the accuracy of the simulation for local sources, different models are needed, such as gaussian, puff, CFD (Computational fluid dynamics), Lagrangian and street-specific box models. The problem with the stand-alone application of local models is that they usually handle the interaction between the local concentration increments and background concentrations with a simplified approach. A good compromise would be a multiscale hybrid approach, by combining Eulerian CTM with local sub-grid models. Nowadays, this approach is one of the main challenges in air quality model research (Sokhi et al., 2022). The coupling of models can be offline, when the two models are run independently and results are combined after a post-processing phase, or online, meaning that the models interact during the simulation and the final output includes the effects of both modeling tools.
In recent years, several studies about offline hybrid modelling techniques were published (Jensen et al., 2017; Kumar et al., 2016; Lefebvre et al., 2011; Oh et al., 2021).
Other examples of off-line hybrid approaches are SHERPA-CITY (Degraeuwe et al., 2021) and UTAQ (Ferrari et al., 2020) modelling systems, both implementing a gaussian kernel approach to compute pollutant concentration at urban level. The two systems are designed to provide fast screening analysis of long-term abatement strategies (SHERPA-CITY) and short-term forecast (UTAQ). Background concentrations for both modelling approaches are derived from large scale Eulerian models, after removing the contribution of the sources explicitly simulated by the gaussian module.
As previously mentioned, such approaches present two main issues, i.e., emissions double counting and the proper simulation of atmospheric reactions that generate secondary pollutants, both requiring complex post-processing of the modelling results. On-line hybrid models can overcome these issues. Among hybrid models, we mention gaussian models (PinG) (Briant and Seigneur, 2013), box models (MUNICH) (Kim et al., 2018) or both (EPISODE City Chem) (Karl et al., 2019) combined with an Eulerian CTM that is developed specifically to improve the dispersion modelling of road traffic emissions. In particular, the double counting issue in hybrid models is solved by dumping the pollutant mass of the linear source that is being simulated at the end of each timestep to the CTM grid (PinG, EPISODE City-Chem) or by a two-way exchange of pollutants at rooftop height between the box model and the Eulerian component after a fixed time is passed (MUNICH). For what concerns chemistry, MUNICH implements the full CB05 chemical kinetic mechanism whilst a simplified approach for atmospheric chemistry is applied in the local dispersion module in PinG and Episode City-Chem.
In this paper, we propose a novel extension of the CAMx Plume in Grid module (PiG), called Linear Plume in Grid (LPiG), developed to handle linear sources with a sub-grid approach within the Eulerian model CAMx. This online hybrid version of the CAMx model is suitable for the assessment of mobility scenarios. PiG techniques are usually applied for large point sources and have a long history of applications in CTMs (Karamchandani et al., 2011). Few approaches using PiG modules to treat road traffic are available in literature and follow different approaches, from the discretization of roads with a high number of point sources (Karamchandani et al., 2009) to the implementation of a gaussian plume model for linear sources (Briant and Seigneur, 2013). In this work, we modified the original PiG module to extend its capabilities to deal with road traffic emissions, thanks to the inclusion of linear source geometry in PiG.
CAMx LPiG is specifically developed to be used along with the bottom-up modeling chain that we developed in previous works (Piccoli et al., 2024). The goal is to create a modelling tool that can extend the capabilities of the bottom-up modeling chain to assess the impact of mobility policy scenarios on air quality. Particularly, the modelling tool implements a full multiscale approach, ranging from local to urban and regional scale, by simulating the dispersion and transformation process related to each emission source at the proper scale. The proposed approach should allow to improve air quality modelling in urban areas in a simple, flexible, and reliable way.
The modifications to the PiG module of CAMx are presented in Section 2 along with a description of the modeling system and the study case, the results of the application of the hybrid model and its evaluation are shown in Section 3 while a discussion of the model performances is presented in Section 4.
2. Materials and Methods
The new hybrid module CAMx-LPiG is an extension of the bottom-up modeling chain presented in XX and developed to assess the road traffic impacts on emission, air quality and human health. The bottom-up modeling chain allows for a high-resolution estimation of traffic emissions, down to road-link level. The new optional module LPiG, here presented, explicitly simulates the dispersion and chemical transformation of the emissions of each road, handled as a linear source, thus allowing for a high-resolution analysis of the road transport contribution to atmospheric pollution. The updated modeling chain is presented in Figure 1, with in orange the new contribution presented in this work. LPiG has been implemented in CAMx trying to minimize the modifications to the original code, therefore it should be easily used by all CAMx users to explicitly simulate the local contribution to atmospheric pollution of road transport.
Along with the hybrid module, this work presents a new post processing module to diminish the computational burden of the hybrid air quality simulation. The post-processing modules reduces the number of road links while maintaining the road network geometry and is presented in Section 2.2.3.
2.1. LPiG Description
The Linear Plume in Grid Module (LPiG) is based on the original Plume in Grid (PiG) module (Ramboll, 2020) of the Comprehensive Air Quality Model with Extensions (CAMx). The original CAMx-PiG module is a Lagrangian Puff scheme, based on the SCICHEM model (EPRI, 2000), which aims at simulating the emissions dispersion from single stacks at the sub-grid scale. The idea behind the CAMx-LPiG development is to create a PiG-like module capable to simulate the first phases of road traffic emissions dispersion at the sub-grid scale. In designing the LPiG code, we tried to keep as much as possible of the PiG code structure, to make CAMx-LPiG module simple, robust and user friendly. Furthermore, LPiG input files are similar to PiG ones, except for some LPiG specific variables (Section 2.1.4). For what concerns atmospheric chemistry, CAMx-LPiG implements both chemistry options available for the original PiG scheme, namely:
- -
- Greatly Reduced Execution and Simplified Dynamics (GREASD), that is a simplified NOx chemistry scheme developed for a computationally efficient treatment of early life plumes conditions, also including basic PM chemistry.
- -
- Incremental Reactions for Organics and NOx (IRON), that is a more complete chemistry scheme for gas species, but not including PM chemistry.
The key features of the CAMx-LPiG sub-model are presented in the following subsections addressing: the initial puff size and its evolution (Section 2.1.1), the changes in the puff release intervals to reduce the computational burdens (Section 2.1.2), the update of the GREASD chemistry option for LPiG puffs (Section 2.1.3). Finally, the LPiG input files’ structure is described in the Appendix B.
2.1.1. LPiG Formulation
The original CAMx-PiG scheme simulates the dispersion of a point source emission as a stream of puffs released into the atmosphere. At the end of the emission period (see Section 2.1.2), each puff has longitudinal length and directional orientation defined by the position of the so-called leading point L and trailing point T, which represent the endpoints of the puff in the wind direction. In the advection phase of the subsequent time steps, these points are transported according to the wind fields, thus changing the position of the puff center point (i.e., the point midway the endpoints), stretching its shape, and varying its centerline orientation.
The CAMx-LPiG scheme follows the same approach but introduces some relevant modifications in the setting of the puff conditions in order to properly handle a linear source (i.e., a road segment). It is important to note that in this first release of LPiG, the puff dispersion is simulated considering the streets as “open road”, therefore non considering any effects due to surrounding buildings. Consequently, so far, LPiG is applied only to the main roads where pollutant dispersion is less influenced by the interaction with the urban canopy, and it can be used to provide a first guess evaluation of the local contribution of each road segment with respect to other sources. This choice has been supported by the following reasons: a) the sub-grid module allows anyhow to reproduce the key features of the release of road traffic emissions avoiding the strong dilution that instantaneously spreads the emission over an area of, at least, 1 km2; b) this implementation did not require to introduce additional input data, such as the description of the urban canopy geometry and specific high resolution meteorological data; c) the same approach has been implemented in other air quality planning and managing tools such as SHERPA-CITY (Degraeuwe et al., 2021) and UTAQ (Ferrari et al., 2020).
First of all, a new variable Ly, which accounts for the puff dimension in the direction normal to its orientation (i.e., the LT segment), is introduced in order to consider the actual width of the road segment. Thinking of the linear source as a sequence of aligned point sources, at the end of the emission periods the puffs emitted by these sources will cover a surface (“smoke surface”) in the horizontal plane determined by the puff mean motion. The basic idea for CAMx-LPiG development is to mimic this smoke surface by means of one single “synthetic” puff (synpuff) emitted by one single point source (named “associated point source”). A representation of the synpuff area is available for three representative wind configurations in the SM Figures S1–S3. This point source is located in the center of the road segment and has the same emission rate of the road. The position of the center point of the synpuff, its size (i.e., the length of its major and minor axis) and orientation at the end of the emission period are calculated and accounted for during the whole puff life in order to simulate the dispersion of the linear source emission. The synpuff center point of the street source s at the end of the emission period (t = 0) is defined as the midpoint between its leading and trailing point :
The vector coordinates and are calculated based on the vector coordinate of the leading and trailing point of the puff emitted by the associated point source (, ) and on two correction vectors in order to account for the actual length (Ls) and width (Ws) of the linear source:
Where is the unit vector aligned with road direction, is the unit vector normal to the street direction and is the angle between the wind direction and s, uhn is the unit vector aligned with the mean wind velocity at hour h.
If the linear source length and width are null (Ls = Ws = 0), then the corrective terms in Equation (2) are null as well, and the scheme LPiG degenerates in the PiG scheme for point sources. A thorough explanation of the origin of the corrective terms in Equation (2) is given in the supplementary material (Section S1).
Once the position of the leading and trailing point of the synpuff has been calculated, the position of its center point is given by Equation (1) and the length of its major axis LE1,s is given by the Euclidean distance between the leading and trailing point ().
The length of the minor axis LE2,s is calculated based on the assumption that the area of the smoke surface is equal to the synpuff area plus the area of the road surface. The area of the smoke surface is given by the product of the road segment length Ls, the distance between the leading point and trailing point of the associated point source, and the absolute value of the sine of , plus a term due to the width of the road segment Ws, the distance between the trailing and leading points of the associated point source and the absolute value of cosine of . The area of the puff is assumed to have a rectangular shape for the sake of simplicity. It follows that the length LE2,s of the minor axis of the synpuff is equal to the ratio between the area of the smoke surface and the length of its major axis:
During the time steps that follow the emission, the synpuff is subject to the advection due to the mean wind condition. During the advection phase the synpuff modifies its shape due to the variation in the distance between the leading point and the trailing point in case of non-uniform mean velocity. The original CAMx-PiG algorithm is used to perform the advection along the synpuff x and z axis, whilst along the y axis the synpuff length is recomputed during the puff life based on the following assumptions:
- The synpuff volume V is constant during the advection phase.
- The synpuff has a shape of a parallelepiped with sides Lx, Ly, Lz
- The relative variation of the plume spread along the puff minor axis is equal to the relative variation of the length of the minor axis.
Assumptions 1 and 2 make it possible to write the balance equation for the synpuff volume for two subsequent time steps (t= 1, 2) of the advection period:
where the variables Lx, Ly and Lz depend on the synpuff size at the end of the emission period (i.e., LE1,s and LE2,s) and on the turbulent dispersion coefficients along the same direction:
During the advection phase, LE1,s is modified due to advection of the leading and trailing point of the puff according to the corresponding local wind conditions. In order to keep the puff volume constant, the minor effective length LE2,s needs to be modified accordingly.
Finally, at the end of each CAMx timestep, in order to evaluate the contribution of each linear source at sub grid level, the puff concentration is sampled with a user-defined high-resolution grid. As for CAMx-PiG, CAMx-LPiG computes the sub grid concentrations supposing that the spatial concentration distribution within the puff can be approximated by a 2D Gaussian formula, where the concentration C of a generic pollutant “l” in the high-resolution grid “hr” (ground-level fields) is expressed as follows:
where Lx and Ly are defined by the Equation 5 and is the mass of pollutant “l” enclosed in the puff volume. Likewise CAMx PiG, LPiG supposes that the concentration is uniformly distributed along the vertical direction, therefore there is no dependency from the z coordinate.
2.1.2. Emission Timestep
In the original PiG sub-model, a puff is emitted for every source at the timestep of the finest computational domain used for CAMx simulation. When working with fine grids (i.e., 1 km) the emission timestep is often lower than a minute, thus generating a high number of puffs that slow down the execution of the model. To reduce the computational time needed to simulate a high number of road links (e.g., the network of primary roads in a city center), LPiG limits the number of emitted puffs from linear sources to one puff every 10 min circa, that is 6 or 7 synpuffs per hour. The exact number of puffs depends on the computational time step (sec) of the master grid of the Eulerian model. At the beginning of each hour, the number of puffs emitted from each linear source () is computed as:
where CEILING is the Fortran function that returns the least integer greater than or equal to the argument passed to the function and (sec) is the emission time step of the LPiG sources and is equal to:
where (sec) is the master grid time step and NINT is the Fortran function that rounds its argument to the nearest whole number.
For the last puff of the hour, the emission timestep needs to be recomputed to prevent the total emission time to exceed the hour, which would lead to emitting more pollutants mass than needed. The last time step is equal to:
Considering that LPiG can be applied with a CAMx setup adopting an arbitrary number of nested domains, the following assumptions are made during the puff emission and life:
- -
- The initial age of the leading point of the puff is equal to the computational time step of the grid in which the puff is emitted and not to .
- -
- The puff is not divided into multiple puffs if the emission time exceeds the specific maximum timestep or if its dimension exceeds half of the finest grid cell.
- -
- The puff evolution (chemistry, diffusion and advection) is not modified, the puff is free to evolve with the timestep of the grid where it is located.
The updates to the puff emission timestep described in this paragraph allowed us to reduce the computational burden of CAMx LPiG, with negligible differences with the original PiG formulation for the emission timestep. In the SM Section S2, a brief test case highlighting the differences between the original PiG emission timestep and the modified one is presented. For this test case, the maximum difference in concentrations does not exceed 1.5%, with a decrease in computational time of 77%.
2.1.3. GREASD Chemistry Modifications
As previously stated, the LPiG code can work with both the chemistry options available in PiG. IRON PiG mechanism can solve all the equations for gas phase reactions according to the chemical schemes available in CAMx (i.e., CB05, CB06, SAPRC7) but the computational time strongly increases with the number of roads processed by LPiG. Moreover, with the IRON PiG option all particulate matter must be considered inert, thus excluding all secondary PM from the simulations. To solve these issues CAMx developers introduced the GREASD PiG option. GREASD PiG mechanism was developed to treat the early stages of large point stack plumes dispersion and includes 23 mainly inorganic reactions for NOx/O3 chemistry. The complete chemistry that includes VOC reactions is dealt later at the grid scale by the Eulerian model, when the plumes have reached their final stage (Karamchandani et al., 1998). Considering that many available hybrid and local scale models implement a simplified chemistry scheme, when dealing with road traffic plumes, that can start from simple photo stationary reactions set up to more complex reaction sets that closely resemble the GREASD reaction sets (Berkowicz et al., 1997; Briant and Seigneur, 2013; Karl et al., 2019; Valencia et al., 2018), we consider the photochemical reactions included in the GREASD option to be valid also for the early stages of road traffic plumes handled by LPiG. However, the GREASD chemical option of PiG cannot be used “as is” for LPiG sources. In GREASD PiG puffs are dumped to the CAMx grid when they reach the last stage of puff life, when organic chemistry starts to play an important role on the puff chemistry (Ramboll, 2020).
However, this condition is valid only for power plant plumes and leads to a too short lifetime of road traffic plumes (about 1 minute). Therefore, for LPiG sources the life of the puff does not end when the previous condition is met, but a maximum life span for the puff is set equal to the puff emission time step (). This condition allows us to capture the sub-grid spatial concentration gradient due to the linear sources, while limiting the computational burden that would arise from having many active puffs on the grid. Lastly, the maximum puff life span condition allows only one puff to be active for each road link, thus reducing the overlap between puffs that can lead to concurrent consumption of background ozone from multiple puffs.
2.2. Case Study Definition
2.2.1. Modeling Set-Up
The hybrid model based on Eulerian CAMx model (version 7.1) with the Lagrangian CAMx-LPiG module was implemented for a case study over the city of Milan in the winter month of January 2017. CAMx model was applied over two computational domains (Figure 2). The coarser domain (ITA) covers the Italian peninsula with 4 km of horizontal resolution and is composed by 284x364 cells and 14 terrain-following vertical levels. The finer nested domain (MIL) covers the metropolitan area of Milan with 1 km resolution and is made up by 70x70 grid cells. CAMx-LPiG was applied to a 50 m of resolution urban sampling grid (URB), covering the city center of Milan and corresponding to four cells of ITA domain.
Additional details on CAMx setup are reported in Table 1.
2.2.2. Meteorological and Emission Data
The air quality simulation was driven by meteorological input data obtained from a customized configuration of the numerical weather prediction (NWP) model Weather Regional Forecast (WRF) (Skamarock et al., 2008). WRF data have the same spatial resolution for the ITA domain with a bigger extent (289x367 cells) to avoid boundary effects, but a slightly different resolution (1.33x1.33 km) for the MIL domain. Thus, the meteorological data for the MIL domain were obtained by downscaling the WRF output at 1.33 km to 1 km thanks to the WRFCAMX processor (Ramboll, 2020). We set the vertical levels of the domains to 56.
Emission data from the Italian national emission inventory, providing data at province administrative level for year 2015, were used for ITA domain (ISPRA, 2020). For MIL domain, we used data from the regional emission inventory of the Lombardy region INEMAR 2014 (ARPA Lombardia, 2017), which provides emission data at municipality level recalibrated for year 2017; however, road traffic emissions in the city of Milan have been computed with a dedicated bottom-up approach. Both the inventories were processed with the Sparse Matrix Operator for Kernel Emission model (SMOKE v3.5) (UNC, 2013) to obtain hourly gridded emission fields over the two domains. Biogenic and sea salt emissions for the ITA domain were estimated using the Model of Emissions of Gases and Aerosols from Nature (MEGAN v2.03) (Guenther et al., 2006) and SEASALT model (Gong, 2003), respectively. Biogenic emissions for MIL domain were obtained by downscaling the 4-km MEGAN output. Boundary and initial conditions necessary for CAMx were obtained from the CHIMERE model using INERIS’ Prev’Air service (Rouil et al., 2009).
Road traffic emissions for the city of Milan (i.e., for the cells of the MIL domain covering the city) were purposely estimated according to an accurate bottom-up approach with HERMESv3_BU model (High-Elective Resolution Modelling Emission System version 3 – Bottom up) (Guevara et al., 2020). HERMESv3_BU model computes traffic emissions (both exhaust and non-exhaust, as well as dust resuspension) at high spatial (i.e., single road link) and temporal (i.e., hourly) resolution combining traffic activity data (traffic flow and mean vehicle speed data) with emission factors from Tier 3 methodology of EMEP/EEA (EMEP/EEA, 2016), which correspond to the values reported by the European COPERT 5 model (https://copert.emisia.com/). In our work, emissions for both private and public transport were separately calculated: the former based on data from a simulation for private traffic carried out by the Environment and Mobility agency of the city of Milan (AMAT – Agenzia Mobilità Ambiente Territorio), the latter from public transport data available on the open data portal of the city of Milan (Comune di Milano, 2023). Results were then summed in order to assess total emission at single road link level. A comprehensive description of the bottom-up approach for the estimate of road traffic emissions used in this work is available in (Piccoli et al., 2024).
At this stage, we simulated with CAMx-LPiG only the main streets within the URB domain in order to reduce the computational cost; thus, 1448 road links out of 19220 from the original road graph of the city of Milan were selected. The selected roads are the primary streets of the city centre, accounting for 14.32% of NOx emissions from road traffic in the city of Milan. The road graph was further simplified by merging down to 545 road links that lie in a straight line. Figure 3 shows the road links explicitly simulated with CAMx-LPiG. The simulated road network considers the three ring roads of Milan city centre and the main connections between them. The innermost ring road is situated in a Low Emission Zone (LEZ - AREA C) where both congestion charging and restrictions based on Euro emission class and vehicle type are applied.
2.2.3. Connection of CAMx-LPiG with the Bottom-Up Modeling Chain
The results of the bottom-up estimate of road traffic emissions were used to feed the hybrid model CAMx-LPiG (Linear Plume in Grid), introducing additional processing steps aiming at: a) converting HERMESv3_BU output data in CAMx-LPiG format; b) simplifying the road network explicitly simulated with CAMx-LPiG (Figure 3) to reduce the computational burden of the LPiG module.
To achieve such goals, the following steps are put in place:
- Sum emission for public and private transport to one single file.
- Reduce the number of road links by merging consecutive road-links that lie in straight lines and opposite direction lanes of the same carriageway (Figure 4). Road-links were defined to be in a straight line if the angle between two consecutive links is less than 4.5°.
- Sum emission for the merged links.
- Write the netCDF emission file for CAMx point sources for the merged links.
The merging operation reduced the number of links from 1448 to 547 while maintaining the overall road network geometry shown in Figure 3. For CAMx-LPiG road links, information on road width was necessary. The traffic model shapefile did not provide this information, so we used the number of lanes available in another shapefile of the road network available on the Milan municipality’s open data portal. Using the map matching algorithm Fast Map Matching (FMM) (Yang and Gidófalvi, 2017), we matched the road links of the two different shapefiles to retrieve information on road width. We assumed a standard width of 3.5m for a single lane.
2.2.4. Model Evaluation Data
Simulations were separately performed with CAMx and CAMx-LPiG hybrid model for the month of January 2017. The results of the CAMx-LPiG application are evaluated against NO2 concentration values to assess the hybrid model simulation performances. The CAMx-LPiG concentrations are also compared with the standard application of CAMx with the same inputs, meaning that road emissions are not separately processed but simulated directly by the Eulerian 1-km grid model.
In this work, the evaluation is focused on NO2 because it is the main pollutant associated with road traffic (REF?) and it is one of most critical pollutant in urban areas, also showing relevant spatial gradients, mainly due to road emissions. Moreover, NO2 is a reactive pollutant whose chemistry is explicitly evaluated by GREASD scheme. For all these reasons NO2 represents a key pollutant to investigate the model performance. Model evaluation for NO2 is performed at three urban traffic monitoring sites of the regional environmental protection agency (ARPA) of Lombardy, represented in Figure 3. These monitoring sites are in close proximity to streets of the road network considered by the CAMx-LPiG module. In particular, sites S1 and S2 are located on the outer ring road of the city centre whereas site S3 is on the inner ring road in the Low Emission Zone. The characteristics of each monitoring site are reported in Table 2.
In addition, an evaluation for NOx is presented in the SM Section S3. At local scale, NOx can be considered as a primary pollutant, therefore its evaluation is useful to assess the model ability to simulate the dispersion mechanisms.
3. Results
3.1. Application of CAMx-LPiG
The plots of the monthly mean concentration fields for NO2 over Milan city centre (referred as “maps” in Figure 3) computed by CAMx-LPiG and by the standard CAMx simulation are presented in Figure 5. The comparison between the model results clearly shows that the hybrid model can reproduce local concentration increments and gradients in the proximity of the road links simulated with the LPiG module, proving its ability to investigate the sub-grid concentration gradients inside the Eulerian model. In both model applications, the south-western part of the city centre presents higher concentration (in the order of 35 ppbV as monthly average for January), but the CAMx-LPiG application estimates up to 4 ppbV higher concentrations (i.e., about 10%) than the standard CAMx in the proximity of the simulated road links. From the visual analysis of the maps, we can say that CAMx-LPiG is able to introduce concentration increments and gradients also in the western and northern part of the area, reflecting the structure of the simulated road network. These gradients are proportional to the local traffic intensity, as shown by the difference in NO2 concentration increments estimated for road links inside the LEZ (inner most road ring) and the rest of the simulated road network.
In order to evaluate the magnitude of such increments and the extension of the gradients, monthly mean NO2 concentration obtained through CAMx-LPiG simulation were sampled on 500 m-long transects perpendicular to the road links and analyzed. Overall, 308 transects were analyzed (Figure 6); for each transect, concentration data were taken at 10 points every 50-m approximately. The local concentration increments for each transect i and sampling point j was calculated as:
where is the mean sampled concentration for January.
The local relative increment was computed as:
data were then pooled together into five 50-m long bins based on the distance from the road (L1-L5 and R1-R5, the farthest and the closest on the left and right side, respectively) and the resulted distributions have been represented in the boxplots of Figure 7.
As expected, the concentration increment sharply decreases moving away from the road on either side, reaching zero in its average value at a distance of 250 m (Figure 7). In the first 50 m from the road, mean values for the concentration increment are in the order of 1.5-2 ppb (i.e., +5%), and mostly within the 1-2.3 ppb range; however, increments as high as 4-5 ppb (i.e., about 13%) have been estimated for some transects.
Despite the progressive reduction with road distance, significant increments (1.5-3 ppb, i.e., +5%-10%) were sometimes obtained far away from the road, too. This because a transect can intersect one or more other road links, so that the actual concentration increment profile is the result of the superimposition of increments from other roads that alter the typical exponential-decay profile of a single road link. Additionally, for high-trafficked roads the length of the transects may be too short to bring the increments to zero; however, extending the transects furthermore would only increase the chances of superimposition of road increments. Therefore, the 500-m transect length is a good compromise to appreciate the local contribution of road emissions in addition to background concentrations by means of LPiG module.
3.2. Model Evaluation
3.2.1. Daily Concentrations
The time series of the observed and modeled NO2 daily concentrations, both as CAMx and as CAMx-LPiG results, are shown in Figure 8 for the three monitoring sites for January 2017. At all sites CAMx-LPiG provides slightly higher concentrations than CAMx. The monthly median simulated value increases from a maximum of 1.8 ppb (37.2 ppb for CAMx-LPiG vs. 35.4 ppb for CAMx) at site S1 to a minimum of 0.6 ppb (35.3 ppb vs. 34.7 ppb) at site S3. However, the effect of LPiG module becomes larger on high concentration days: with respect to CAMx simulation, the values of the 95th percentile of the daily concentrations show a maximum increase of 5.1 ppb at site S1 (50.8 ppb vs 45.5 ppb, i.e., +11%) and of 2.4/2.8 ppb at the other sites, with a relative increment of about 5.5%. The difference between CAMx-LPiG and CAMx output reflects the exposition to traffic emissions and the location of the monitoring site. The concentration increment given by CAMx-LPiG is more evident for site S1, located on the high-trafficked outer ring road, and is lower at site S3, because of the lower volume of traffic that circulates in the LEZ with respect to the main ring roads.
During the first half of the month model results are in fairly good agreement with the observations, both in terms of concentration values and of their time pattern. However, underestimations are observed on Jan. 5th at all sites (about 10 ppb less than observed) and on Jan. 8th-9th (5 to 7 ppb less); conversely, overestimations, ranging from 10 ppb at S2 and S3 up to about 20 ppb at S1, occur on Jan. 12th. From Jan. 13th the differences between observations and model results become more evident and systematic, even though the growing concentration trend until Jan. 25th is reproduced by the models. These differences are due to a strong and sudden decrease of modelled concentrations (-20/-30 ppb) estimated at all sites on Jan. 13th-14th, opposite to the trend of the observations. Finally, the observed and modelled time series tend to converge again during the last days of the month. However, some rather large discrepancies still occur on Jan. 26th (negative bias) and on Jan. 27th (positive bias), when model results show a peak around 50 ppb and the observed values are around 40 ppb.
A comprehensive view of CAMx-LPiG performance is given in Figure 9, where NO2 modelled concentrations are plotted versus the corresponding daily mean observations at the three monitoring sites. Almost all (96.5%) of model-observation pairs are within the FAC2 area (i.e., ±50%) and 76% within the lines with a slope of 0.7 and 1.42 (i.e., ±30%).
The values of performance indicators for the NO2 daily means simulated by CAMx-LPiG for January 2017 are reported in Table 3. Overall, model results underestimate the observed concentrations at all sites: the observed monthly averages are in the 37.7-40.9 ppb range whereas modelled values are in the 33.8-35.8 ppb range. Values for the Mean Bias are -3.9 ppb at site S2, -4.1 at site S1, and -6.1 ppb at site S3; Normalized Mean Bias (NMB) values range between -10.3% (S1) and 15% (S3). The largest underestimation (-6.1 ppb for the monthly average) is observed at site S3, where the observed values are at their highest level. Nevertheless, the highest values for correlation (COR = 0.67) and Index Of Agreement (IOA=0.72) are obtained at site S3, followed by site S1 (0.50 and 0.68) and site S2 (0.28 and 0.53), where performance metrics suffer from the reduced data availability.
Comparing to CAMx simulation (Table S2), the slightly higher concentrations produced by CAMx-LPiG allows to reduce the general tendency to underestimate the observations. MB decreases from -6.7 ppb to -4.1 ppb (-38%) at site S1, from -5.7 ppb to -3.9 ppb (-31%) at site S2, and from -7.3 ppb to -6.1 ppb (-16%) at site S3. As already pointed out, the lower impact of the explicit treatment of road emissions for site S3 is due to the lower traffic intensity in the LEZ that covers the city centre.
3.2.2. Hourly Concentrations
The time series of the observed and modeled NO2 hourly concentrations in January 2017 are shown in Figure 10 for the three monitoring sites. As for the daily means time series, after a good performance in the first half of the month, both model simulations tend to underestimate the observation from January 14th to January 25th. At all sites the main discrepancy concerns the daily minimum values, while the peak concentrations are correctly estimated most of the times. The local concentration increments provided by CAMx-LPiG improve the estimation of the first quartile (q25) and the median of the whole data distribution at all sites and of the third quartile (q75) at site S1 and S3. However, the quartiles remain still underestimated. Conversely, CAMx-LPiG tends to slightly overestimate the 95th percentiles (q95) of the hourly data that are better reproduced by CAMx simulation.
The values of performance indicators for the hourly NO2 averages simulated by CAMx-LPiG for January 2017 are reported in Table 4 (data for CAMx reported in Table S3). Overall, a high number (82.3%) of model-observation pairs are within the FAC2 area, with FAC2 values ranging from 0.80 at site S2 and 0.84 at site S3. Still, in agreement with the results for the daily averages, observations are overall underestimated. The scatter plot of hourly values for CAMx-LPiG is presented in Figure 11. As expected, most of the observed-model concentration points that fall outside the FAC2 zone are due to underestimation of the observed value. Additionally, as a consequence of the higher time resolution, both COR (0.31-0.49 range) and IOA (0.53-0.63 range) are generally lower than for the daily values. Compared with CAMx, we notice an improvement in the bias related metrics (2.8% to 6.5% decrease in NMB), while there is a mild deterioration to no change in the other metrics.
Despite the rather low correlation, the model quality objective (MQO), as defined in the FAIRMODE’s report on model quality objectives (Janssen and Thunis, 2022), is satisfied for all three sites (Figure 12). The target plot for the hourly values, developed by FAIRMODE group for the validation tool DELTA, puts in evidence the goodness of model results (MQI<1 at all sites) and the reasons for the difficulties of the model in reproducing the observed concentration, essentially related to the low correlation and negative bias.
However, model performance is strongly variable during the day, as shown in Figure 13, where the modelled and observed hourly time series at the three monitoring sites are plotted for the mean day of January. Even though the time pattern is acceptably reproduced, the model results underestimate the observed concentration during night-time and in the central part of the day at all sites. On the first hours of the night, the negative bias is up to 20 ppb, in the early afternoon around 15 ppb, and in the late evening about 10 ppb. Conversely, observations are overestimated on morning rush hours at site S1 and S2, and on evening rush hours at all sites. The positive bias, about 10-15 ppb, is already particularly evident in CAMx simulation for site S1 and S3 and becomes more relevant when the increments of CAMx-LPiG are accounted for, especially at site S1.
As for the daily concentrations, CAMx-LPiG provides higher concentrations than CAMx following an hourly pattern, common at the three sites, that mirrors traffic intensity in the urban area. However, the difference between the estimated concentrations depends on the traffic exposure of the monitoring sites: differences are larger at the sites located on the outer ring road (S1, S2), namely on rush hours, and very small for most of the day at site S3 in the Low Emission Zone. With respect to the standard CAMx results, the CAMx-LPiG increments are practically negligible from midnight to 5:00 at all sites (maximum hourly mean increase of 0.70 ppb at sites S1 and S2) when road emissions are very low (see Figure 15). Then, with the increase of the traffic the increment rises to an early morning maximum at 7 AM of 3.2 ppb at site S2 and 2.9 ppb at site S1; for site S3 the maximum morning increase is in the same orders (2.41 ppb) but is estimated at 9:00. In the morning and afternoon, the departures between model results remain of small significance, probably due to the predominant role of vertical dispersion, at both scales. Finally, during the evening rush hours differences between the two models rise again up to greater values than in the morning peak. Maximum CAMx-LPiG evening increments are 6.26 ppb at site S1 at 6 PM, 4.8 ppb at site S2 at 5 PM, and 2.6 ppb at site S3 at 6 PM; however, at all sites differences persist for all the evening hours and decline only after 9 PM. The boxplots for the hourly increments of CAMx-LPiG compared to CAMx are presented in Figure S7.
4. Discussions
In Section 3.1 we presented the cross-road profiles of NO2 concentration increments estimated by the hybrid model CAMx-LPiG. While such increments can help to close the gap between model predictions and observations (i.e., partially reducing the mean bias absolute value), an ad-hoc validation of such increments cannot be carried out using the current observation network. A possible approach to this problem is the comparison of the simulated increments to the results of measurement campaigns aimed to understand the influence of traffic pollution on near road air quality. The results of two meta-analysis on those studies showed that most of the decay in NO2 concentration happens in the first 200-500m before reaching background values in a gradual way (Karner et al., 2010; Zhou and Levy, 2007). Karner et al. 2010 found an increase of edge of the road measurements with respect to background concentration of 42%. Comparing these results with the cross-road increments of Figure 7, CAMx-LPiG showed a limited increase compared to concentration at 250 from roadside (mean increase of circa 5% with few values exceeding 10%). While this comparison can be useful to understand the CAMx-LPiG performances in simulating road traffic related effects on air quality, we should be mindful of the differences between the experimental studies on which the two meta-analyses are based on and the modelling results. First, most of the experiments are based on motorways/highways impacts on air quality rather than urban roads. Furthermore, most of the data comes from daytime measurements campaign (Karner et al., 2010), while the data from this study is a mean for the month of January. Keeping in mind the inherent differences between LPiG and the considered datasets, the comparison points out that CAMx-LPiG shows a smoother transect concentration with respect to literature data. Possible reasons of such difference could be: a) the overestimation of the puff horizontal and vertical dispersion due to the absence, in this first version of CAMx-LPiG, of the treatment of the urban canopy; b) the sampling resolution of the gaussian concentration function set to 50 m, due to computational limitations. It is worth noting that, although the puff dispersion is probably overestimated, the total modelled concentration shows a moderate to low negative bias, that could be related to an overall good performance of the CAMx model at urban scale, whose contribution is particularly relevant also at traffic receptor (Pepe et al., 2019. It is worth noting that in some cases the CAMx contribution could even give rise to a slight overestimation of the contribution of the surrounding sources. Also, the latter effect can be ascribed to the absence of the urban canopy.
The evaluation of the daily concentrations showed a prolonged period of underestimation in the second half of the month. In order to understand the possible reasons of the underestimation, in Figure 14 we propose a brief validation of the meteorological data validation for the city of Milan.
The position of the meteorological stations used in the validation is showed in Figure S8. The validation shows good performance for the mixing ratio, with a high correlation coefficient and IOA and low mean bias. The temperature is underestimated by the WRF model, but it presents a good correlation score. Precipitation is poorly reproduced, but it does not play a key role during the considered period. The most important field to investigate is wind speed. The most important field to investigate is wind speed. As showed in the Figure 14, model and observation are generally well aligned during the first decade of the month. From the 13th to the 26th of January the meteorological model systematically overestimates the observed wind speed and reproduces some unobserved events of strong wind. This period coincides with the underestimation of NO2 concentrations. It is worth to note that the wind speed overestimation takes place when observed wind speed shows extremely low values that are generally not captured by meteorological models. Moreover, WRF model shows clear discrepancies in reproducing both temperature and mixing ratio. The overall analysis of the meteorological performance seems to indicate that WRF is not able to capture the strong stagnant conditions taking place from 13th to 26th of January. Further investigations are needed to understand whether the observed discrepancies in concentration values are related to the incorrect reconstruction of the meteorological conditions over the whole airshed or they are also related to the absence of local scale information on the urban canopy, such as building heights and street canyons, that could play a more relevant role on atmospheric dispersion during stagnant conditions.
Finally, another aspect to be improved is the reproduction of the daily concentration profile. The mean day profile of the simulated NO2 concentration differs from the observed one, especially during night-time conditions and in the central hours of the day at all sites (Figure 13). The temporal emission profile and meteorological conditions are the two main factors affecting the diurnal concentration profile. As for the former, the daily evolution of NOx emission rate at the corresponding model cells of the three monitoring stations is shown in Figure 15.
Figure 15.
Hourly variation of NOx emissions at the three monitoring stations: Viale Marche (S1, red), Viale Liguria (S2, blue), and Via Senato (S3, green).
Figure 15.
Hourly variation of NOx emissions at the three monitoring stations: Viale Marche (S1, red), Viale Liguria (S2, blue), and Via Senato (S3, green).
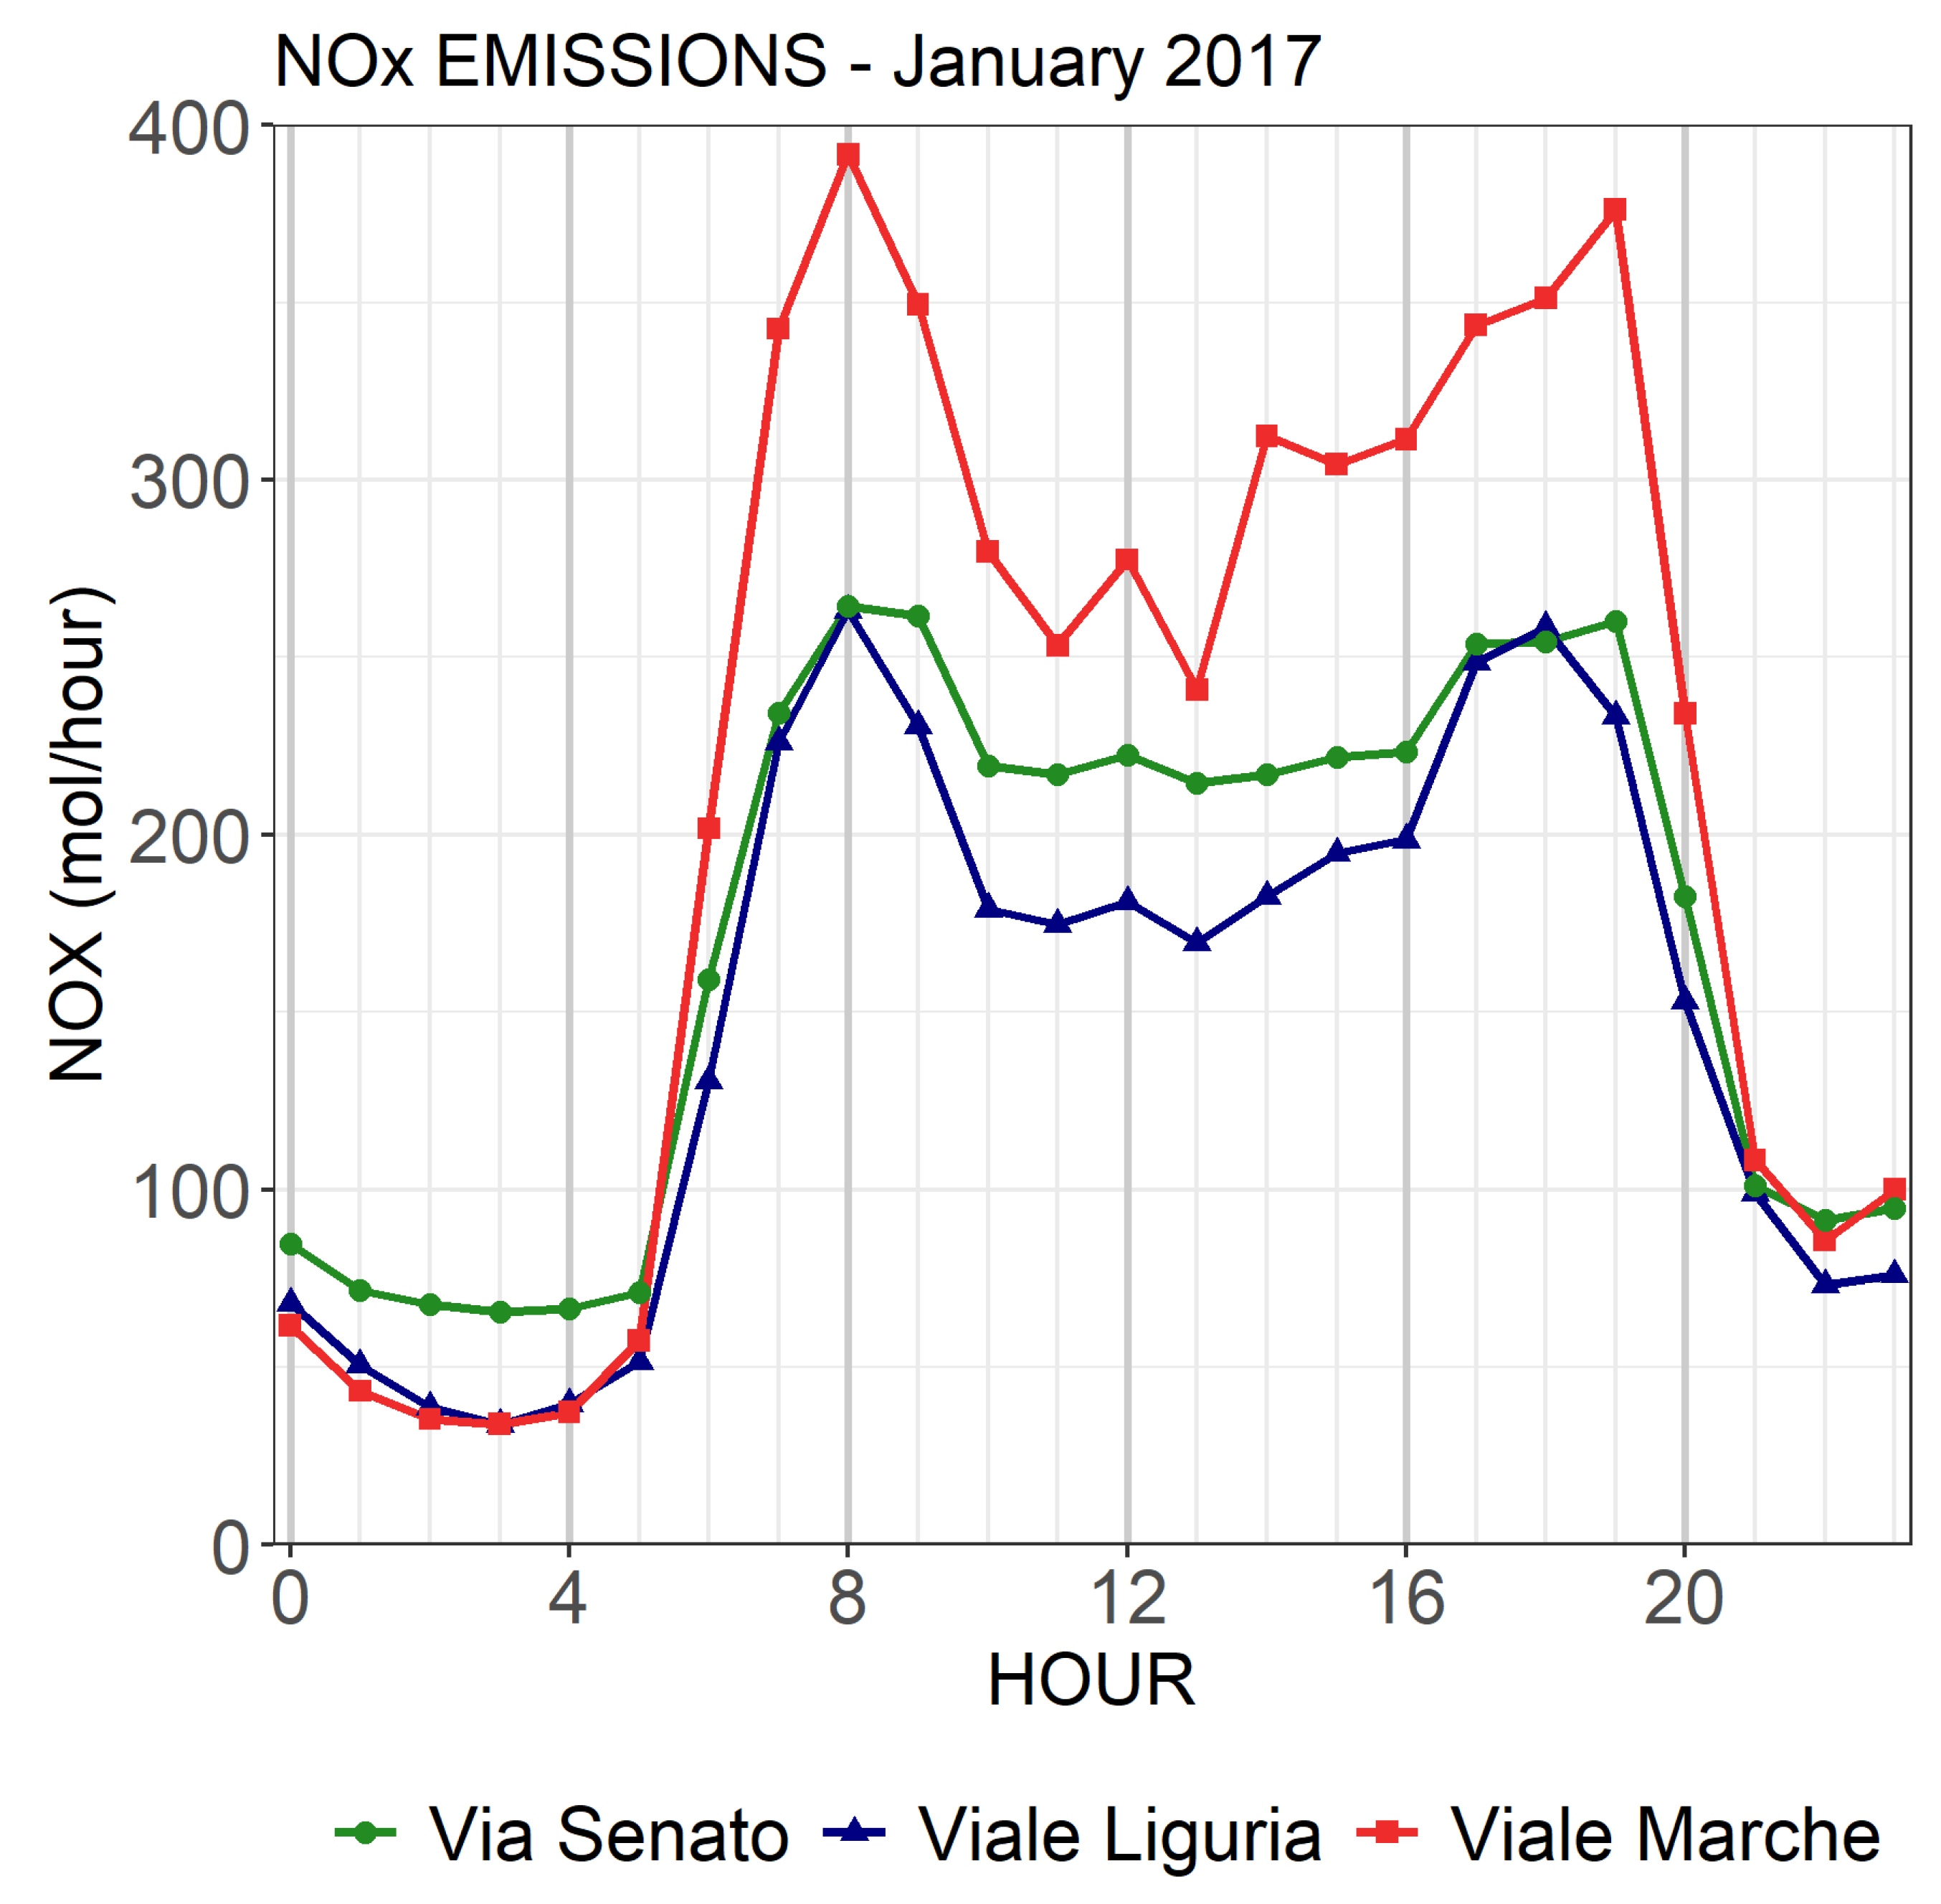
The NOX emission profile, that is based on observed traffic data, presents a very reasonable trend with two rush hours peaks, at 08:00 and at 18:00/19:00. This trend is shown also by the observed and modelled hourly concentrations profiles presented in Section 3.2.2 (Figure 13). The period at which peak concentration is reached for both morning and evening rush hours for S2 and S3 is generally well modelled, though partially overestimated during the afternoon period. Differently, while measured concentrations tend to remain stable most part of the night-time, modelled concentrations sharply decline after 19:00 to a night-time minimum. Furthermore, the midday decline is more accentuated in the modelled concentrations than in observed values. The midday underestimation could be driven by the development of the Planet Boundary Layer (PBL) height during daytime (Figure 16). In PiG, and therefore also in LPiG, the puff growth along the vertical dimension is due to vertical turbulence and is capped by the PBL height, hence an over estimation of the vertical dispersion can strongly affect the LPiG simulated concentrations.
The PBL diurnal profiles at the three monitoring stations is shown in Figure 16. As expected, the PBL increases after sunrise (around 8:00 CET in January for Milan) and decreases to a minimum after sunset (around 17:00 CET in January for Milan). The midday underestimation coincides in time with the maximum PBL values (14:00 CET), suggesting that the CAMx low BIAS could be related to an overestimation of the maximum PBL height during daytime. Differently, during afternoon hours the model overestimates the observed values. NO2 overestimation is probably caused by a corresponding overestimation of NOX concentrations (see as an example Figure S.10) due to a too sharp decrease of PBL depth during afternoon hours. Finally, during night-time hours CAMx-LPiG shows a clear underestimation of both NOX and NO2 that can be ascribed to an excess of dilution during evening and night hours. The obtained results confirm that the reconstruction of the meteorological fields at urban scale and their effects on pollutant dispersion need to be improved in order to better reproduce the atmospheric fate of the pollutant emissions at both urban and local scale.
5. Conclusions
In this paper we presented the CAMx-LPiG (Comprehensive Air Quality Model with Extensions – Linear Plume in Grid) online hybrid model, based on the Chemistry and Transport Model (CTM) CAMx and including a sub-grid scale module to simulate the dispersion of linear road traffic emissions, called LPiG. CAMx-LPiG was applied to assess the urban traffic emission impact on air quality in the urban area of Milan. The LPiG module was developed in CAMx 7.1, starting from PiG routines and introducing extensive modifications, especially in the setting of the initial puff shape, emission release time and puff lifetime. The use of a fine sampling grid for the puff module concentration results in a better reproduction of the spatial concentration gradients of modelled pollutants with respect to the stand-alone Eulerian model. The introduction of the LPiG module can bring substantial improvements on road traffic pollution studies because it allows to evaluate the contribution of each road link to air quality. The online approach adopted in CAMx-LPiG allows also to avoid the typical problems of off-line hybrid modelling systems such as emission double counting. It also gives the possibility to treat the NOx/O3 chemistry and basic PM chemistry inside the puff in a consistent and efficient manner with respect to the surrounding Eulerian grid, thus avoiding. The structure of the model inputs is the same as the original PiG module, so to maintain a user-friendly approach for CAMx users.
The model application showed potential effectiveness in simulating NO2 concentrations. Promising performances are found for a winter month, where CAMx-LPiG showed a negative bias smaller than CAMx at urban traffic monitoring stations. However, the concentrations increments provided by CAMx-LPiG, are still not enough to fill the gap between NO2 model predictions and observations. Even though the comparison with other works dealing with near-road dispersion of traffic emissions is to be taken with caution, it appears that the effects of road traffic might be underestimated by CAMx-LPiG. Furthermore, the effect of the urban canopy, currently neglected, looks like a crucial factor to improve both the reconstruction of the meteorological fields and the local atmospheric dispersion simulated by the hybrid component LPiG.
It is also worth mentioning that CAMX-LPIG was developed in the framework of a comprehensive bottom-up modelling chain that aims to simulate the impacts of road transport on air quality and human health in urban contexts, with an emphasis on future scenarios for mobility studies. The hybrid module is an important development towards this goal, allowing us to investigate the spatial patterns of concentrations at a finer resolution compared to the Eulerian CAMx grid. CAMx-LPiG takes full advantages of the single road link emission estimate obtained with the bottom-up approach, by explicitly simulating the single road link dispersion instead of spreading it across all the Eulerian model cell area. The high resolution achievable with CAMx-LPiG would be crucial to improve the estimate of the population exposure to air pollutants, as we plan to add a module to move from a static exposure estimate at the Eulerian grid scale to a dynamic exposure assessment at the sub-grid scale.
Future works are already planned to improve CAMx-LPiG. In particular, one of the main limitations of the model in the current version and probably one of the causes of the observed discrepancies in the evaluation process is the lack of specific treatment for meteorology and puff dispersion inside the urban canopy. As already mentioned, in the current version of CAMx-LPiG the puff emitted at street level considering it as an open road. Therefore, emission puffs are subject to the same advection and growth processes of a puff emitted in the free atmosphere with meteorological parameters that have a resolution of 1km. Furthermore, another aspect that can be improved upon is the initial dispersion by including traffic specific turbulent dispersion coefficients (sigma) that consider vehicle induced turbulence.
Another aspect that could improve the performance of the hybrid module LPiG is the treatment of chemical evolution of the puffs. In this application the GREASD option was selected. In the original PiG module this option was designed to treat the early chemical evolution of large NOx plumes, thus it includes mainly inorganic gas-phase reactions. The twenty-three reactions of the GREASD options deal with the NOx/O3 chemistry and as a first approximation we considered the GREASD option valid also for the traffic puff early life. However, testing with the full gas chemistry option is ongoing to check the validity of this first assumption.
Finally, the last limitations are related to the concurrent consumption of background ozone of overlapping puffs. When multiple puffs overlap with each other an excessive consumption of background ozone can occur, leading to unrealistic ozone and NO2 concentrations. The original PiG has a feature to treat overlapping puffs that will be tested in order to be extended also to linear sources.
In conclusion, CAMx LPIG proved to be a useful tool to evaluate the effects of road traffic emissions at several scale ranging from the regional/urban down the city scale, helping to identify hotspot of high pollutant concentration. Moreover, thanks to its versatility, it can represent a valuable tool to analyze the effects on air quality of mobility policies, applied at different spatial scales, even to a single road, also including the transition to electric mobility. Finally, the foreseen model developments should allow to improve the reconstruction of the meteorological processes taking place at the urban scale and therefore to better simulate the pollution processes taking place at street level with respect to the overall urban area.
Funding
This work has been financed by the Research Fund for the Italian Electrical System under the Three-Year Research Plan 2022-2024 (DM MITE n. 337, 15.09.2022), in compliance with the Decree of April 16th, 2018.
Acknowledgments
Authors are very grateful to Andrea Amicarelli for his valuable contribution in the design and code implementation of the algorithms for the extension of the PiG module for the treatment of linear sources.
Software Availability
CAMx-LPiG is an original modification of the original CAMx software version 7.1 and is written in FORTRAN. The new code includes new routines and modification to existing ones. Since the LPiG module is integrated in CAMx, the model is designed to work in Unix/Linux environments. The source code for CAMx-LPiG is publicly available via Zenodo (https://doi.org/10.5281/zenodo.7656604). The code is distributed under the original CAMx license and the GNU lesser general public license for the new LPiG material.
Appendix A. List of Statistical Indices
Mean BIAS (MB)
Normalized Mean Bias (NMB)
Index of Agreement (IOA)
Root Mean Square Error (RMSE)
Correlation (CORR)
Where:
Mt = modelled concentration at time t (upper line indicates mean variable for all period)
Ot = observed concentration at time t (upper line indicates mean variable for all period)
N= number of cases.
Appendix B. LPiG Input Files
The structure of the CAMx input files for point emission is valid also for linear sources, even if some of the variables have a different meaning, due to the 2-dimensional features of line sources. Particularly:
- -
- the sign of variable dstk (stack diameter in original CAMx point sources file) allows to identify point/linear sources that are handled by the sub-grid schemes PiG/LPiG (dstk <0) from point sources that are handled only at grid level (dstk ≥0). The absolute value of the variable dstk in CAMx-LPiG represents the average width of the road segment, while in PiG it represents the stack diameter of the point source.
- -
- the sign of variable hstk (stack height in the original CAMx point sources file) allows to distinguish point sources (hstk ≥0) from linear sources (hstk<0). In CAMx-LPiG, the emission height is not read from hstk but is replaced by the effective emission height, assumed equal to 2m, as in ADMS-local, a gaussian model for urban air quality (Seaton et al., 2022).
- -
- in the original CAMx point source file, xstk and ystk variable are the horizontal coordinates of the barycenter of the stack whereas variables tstk and vstk are the temperature and the exit velocity (in vertical direction) of the emission at the stack, respectively. For linear sources xstk and ystk represent the horizontal coordinates of one vertex of the road segment (i.e., xA, yA) and tstk and vstk are used for the horizontal coordinates of the other vertex (i.e., xD, yD); the emission temperature is set to 373 K (Venetsanos et al., 2002), and the vertical component of the emission velocity is set to 0.1 m/s.
The differences between the PiG and LPiG variables are summarized in Table A1.

Table A1.
PiG and LPiG input variables meaning.
| PiG | LPiG | Notes | ||
| xstk | X coordinate | xa | X coordinate of the first street vertex. | |
| ystk | Y coordinate | ya | Y coordinate of the first street vertex. | |
| hstk | Stack height | LPiG_f | LPiG Flag. | If hstk<0 the source is treated with LPiG. |
| tstk | Temperature | xb | X coordinate of the second street vertex. | |
| vstk | Exit velocity | Yb | Y coordinate of the second street vertex. | |
| dstk | Stack diameter | Ws | Road width. | If dstk<0 the source is treated with a sub grid module (PiG/LPiG) |
References
- ARPA Lombardia, 2017. Inemar [WWW Document]. URL https://www.inemar.eu/xwiki/bin/view/Inemar/HomeLombardia (accessed 5.17.23).
- Berkowicz, R., Hertel, O., Larsen, S.E., Sørensen, N.N., Nielsen, M., 1997. Modelling traffic pollution in streets.
- Briant, R., Seigneur, C., 2013. Multi-scale modeling of roadway air quality impacts: Development and evaluation of a Plume-in-Grid model. Atmospheric Environment 68, 162–173. [CrossRef]
- Comune di Milano, 2023. Portale Open Data | Comune di Milano [WWW Document]. URL https://dati.comune.milano.it/ (accessed 5.17.23).
- Degraeuwe, B., Pisoni, E., Christidis, P., Christodoulou, A., Thunis, P., 2021. SHERPA-city: A web application to assess the impact of traffic measures on NO2 pollution in cities. Environmental Modelling & Software 135, 104904. [CrossRef]
- EC: Communication from the Commission, 2019. The European Green Deal.
- EEA, 2022. Air quality in Europe 2022. Report no. 05/2022. European Environmental Agency.
- EEA, 2020. Air quality in Europe - 2020 report, EEA Report.
- EMEP/EEA, 2016. EMEP/EEA air pollutant emission inventory guidebook 2016: Technical guidance to prepare national emission inventories. European Environment Agency. 124.
- EPRI, 2000. SCICHEM Version 1.2: Technical Documentation. Final Report prepared by ARAP/Titan Corporation, Princeton, NJ, for EPRI, Palo Alto, CA.
- Ferrari, F., Maffeis, G., Flemming, J., Gianfreda, R., 2020. UTAQ, A TOOL TO MANAGE THE SEVERE AIR POLLUTION EPISODES. Environ. Eng. Manag. J. 19, 1915–1926. [CrossRef]
- Gong, S.L., 2003. A parameterization of sea-salt aerosol source function for sub- and super-micron particles. Global Biogeochemical Cycles 17, 1097. [CrossRef]
- Guenther, A., Karl, T., Harley, P., Wiedinmyer, C., Palmer, P.I., Geron, C., 2006. Estimates of global terrestrial isoprene emissions using MEGAN (Model of Emissions of Gases and Aerosols from Nature). Atmospheric Chemistry and Physics 6, 3181–3210. [CrossRef]
- Guevara, M., Tena, C., Porquet, M., Jorba, O., Pérez García-Pando, C., 2020. HERMESv3, a stand-alone multi-scale atmospheric emission modelling framework-Part 2: The bottom-up module. Geoscientific Model Development 13, 873–903. [CrossRef]
- ISPRA, 2020. Italian Emission Inventory 1990-2018. Informative Inventory Report 2020. Istituto Superiore per la Protezione e la Ricerca Ambientale.
- Janssen, S., Thunis, P., 2022. FAIRMODE guidance document on modelling quality objectives and benchmarking – Version 3.3. Publications Office of the European Union. [CrossRef]
- Jensen, S.S., Ketzel, M., Becker, T., Christensen, J., Brandt, J., Plejdrup, M., Winther, M., Nielsen, O.K., Hertel, O., Ellermann, T., 2017. High resolution multi-scale air quality modelling for all streets in Denmark. Transportation Research Part D: Transport and Environment 52, 322–339. [CrossRef]
- Karamchandani, P., Koo, A., Seigneur, C., 1998. Reduced Gas-Phase Kinetic Mechanism for Atmospheric Plume Chemistry. Environmental Science & Technology 32, 1709–1720. [CrossRef]
- Karamchandani, P., Lohman, K., Seigneur, C., 2009. Using a sub-grid scale modeling approach to simulate the transport and fate of toxic air pollutants, in: Environmental Fluid Mechanics. pp. 59–71. [CrossRef]
- Karamchandani, P., Vijayaraghavan, K., Yarwood, G., 2011. Sub-grid scale plume modeling. Atmosphere 2, 389–406. [CrossRef]
- Karl, M., Walker, S.-E., Solberg, S., Ramacher, M.O.P., 2019. The Eulerian urban dispersion model EPISODE – Part~2: Extensions to the source dispersion and photochemistry for EPISODE–CityChem v1.2 and its application to the city of Hamburg. Geoscientific Model Development 12, 3357–3399. [CrossRef]
- Karner, A.A., Eisinger, D.S., Niemeier, D.A., 2010. Near-Roadway Air Quality: Synthesizing the Findings from Real-World Data. Environmental Science & Technology 44, 5334–5344. [CrossRef]
- Kim, Y., Wu, Y., Seigneur, C., Roustan, Y., 2018. Multi-scale modeling of urban air pollution: Development and application of a Street-in-Grid model (v1.0) by coupling MUNICH (v1.0) and Polair3D (v1.8.1). Geoscientific Model Development 11, 611–629. [CrossRef]
- Kumar, A., Patil, R.S., Dikshit, A.K., Kumar, R., Brandt, J., Hertel, O., 2016. Assessment of impact of unaccounted emission on ambient concentration using DEHM and AERMOD in combination with WRF. Atmospheric Environment 142, 406–413. [CrossRef]
- Lefebvre, W., Vercauteren, J., Schrooten, L., Janssen, S., Degraeuwe, B., Maenhaut, W., de Vlieger, I., Vankerkom, J., Cosemans, G., Mensink, C., Veldeman, N., Deutsch, F., Van Looy, S., Peelaerts, W., Lefebre, F., 2011. Validation of the MIMOSA-AURORA-IFDM model chain for policy support: Modeling concentrations of elemental carbon in Flanders. Atmospheric Environment 45, 6705–6713. [CrossRef]
- Oh, I., Hwang, M.K., Bang, J.H., Yang, W., Kim, S., Lee, K., Seo, S.C., Lee, J., Kim, Y., 2021. Comparison of different hybrid modeling methods to estimate intraurban NO2 concentrations. Atmospheric Environment 244, 117907. [CrossRef]
- Pepe, N., Pirovano, G., Balzarini, A., Toppetti, A., Riva, G.M., Amato, F., Lonati, G., 2019. Enhanced CAMx source apportionment analysis at an urban receptor in Milan based on source categories and emission regions. Atmospheric Environment: X 2, 100020. [CrossRef]
- Piccoli, A., Agresti, V., Bedogni, M., Lonati, G., Pirovano, G., 2024. A bottom-up modelling chain to evaluate the impact of urban road transport policies on air quality and human health. submitted to Urban Climate - in review.
- Ramboll, 2020. CAMx User’s Guide Version 7.10.
- Rouil, L., Honoré, C., Vautard, R., Beekman, M., Bessagnet, B., Malherbe, L., Meleux, F., Dufour, A., Elichegaray, C., Flaud, J.M., Menut, L., Martin, D., Peuch, A., Peuch, V.H., Poisson, N., 2009. Prev’air: An Operational Forecasting and Mapping System for Air Quality in Europe. Bulletin of the American Meteorological Society 90, 73–84. [CrossRef]
- Seaton, M., O’Neill, J., Bien, B., Hood, C., Jackson, M., Jackson, R., Johnson, K., Oades, M., Stidworthy, A., Stocker, J., Carruthers, D., 2022. A Multi-model Air Quality System for Health Research: Road model development and evaluation. Environmental Modelling & Software 155, 105455. [CrossRef]
- Skamarock, W.C., Klemp, J.B., Dudhia, J., 2008. A Description of the Advanced Research WRF Version 3. Tech. Note NCAR/TN-475+STR. [CrossRef]
- Sokhi, R.S., Moussiopoulos, N., Baklanov, A., Bartzis, J., Coll, I., Finardi, S., Friedrich, R., Geels, C., Grönholm, T., Halenka, T., Ketzel, M., Maragkidou, A., Matthias, V., Moldanova, J., Ntziachristos, L., Schäfer, K., Suppan, P., Tsegas, G., Carmichael, G., Franco, V., Hanna, S., Jalkanen, J.-P., Velders, G.J.M., Kukkonen, J., 2022. Advances in air quality research – current and emerging challenges. Atmospheric Chemistry and Physics 22, 4615–4703. [CrossRef]
- UNC, 2013. SMOKE v3.5 User’s Manual.
- United Nations Department of Economic and Social Affairs Population Division, 2018. World Urbanization Prospects The 2018 Revision.
- Valencia, A., Venkatram, A., Heist, D., Carruthers, D., Arunachalam, S., 2018. Development and evaluation of the R-LINE model algorithms to account for chemical transformation in the near-road environment. Transportation Research Part D: Transport and Environment 59, 464–477. [CrossRef]
- Venetsanos, A.G., Vlachogiannis, D., Papadopoulos, A., Bartzis, J.G., Andronopoulos, S., 2002. STUDIES ON POLLUTANT DISPERSION FROM MOVING VEHICLES.
- World Health Organization, 2021. WHO global air quality guidelines: particulate matter (PM2.5 and PM10), ozone, nitrogen dioxide, sulfur dioxide and carbon monoxide. World Health Organization.
- Yang, C., Gidófalvi, G., 2017. Fast map matching, an algorithm integrating hidden Markov model with precomputation. 32, 547–570. [CrossRef]
- Zhou, Y., Levy, J.I., 2007. Factors influencing the spatial extent of mobile source air pollution impacts: a meta-analysis. BMC Public Health 7, 89. [CrossRef]
Figure 1.
Diagram of the bottom of emission modelling chain with the new hybrid module LPiG (in orange).
Figure 1.
Diagram of the bottom of emission modelling chain with the new hybrid module LPiG (in orange).
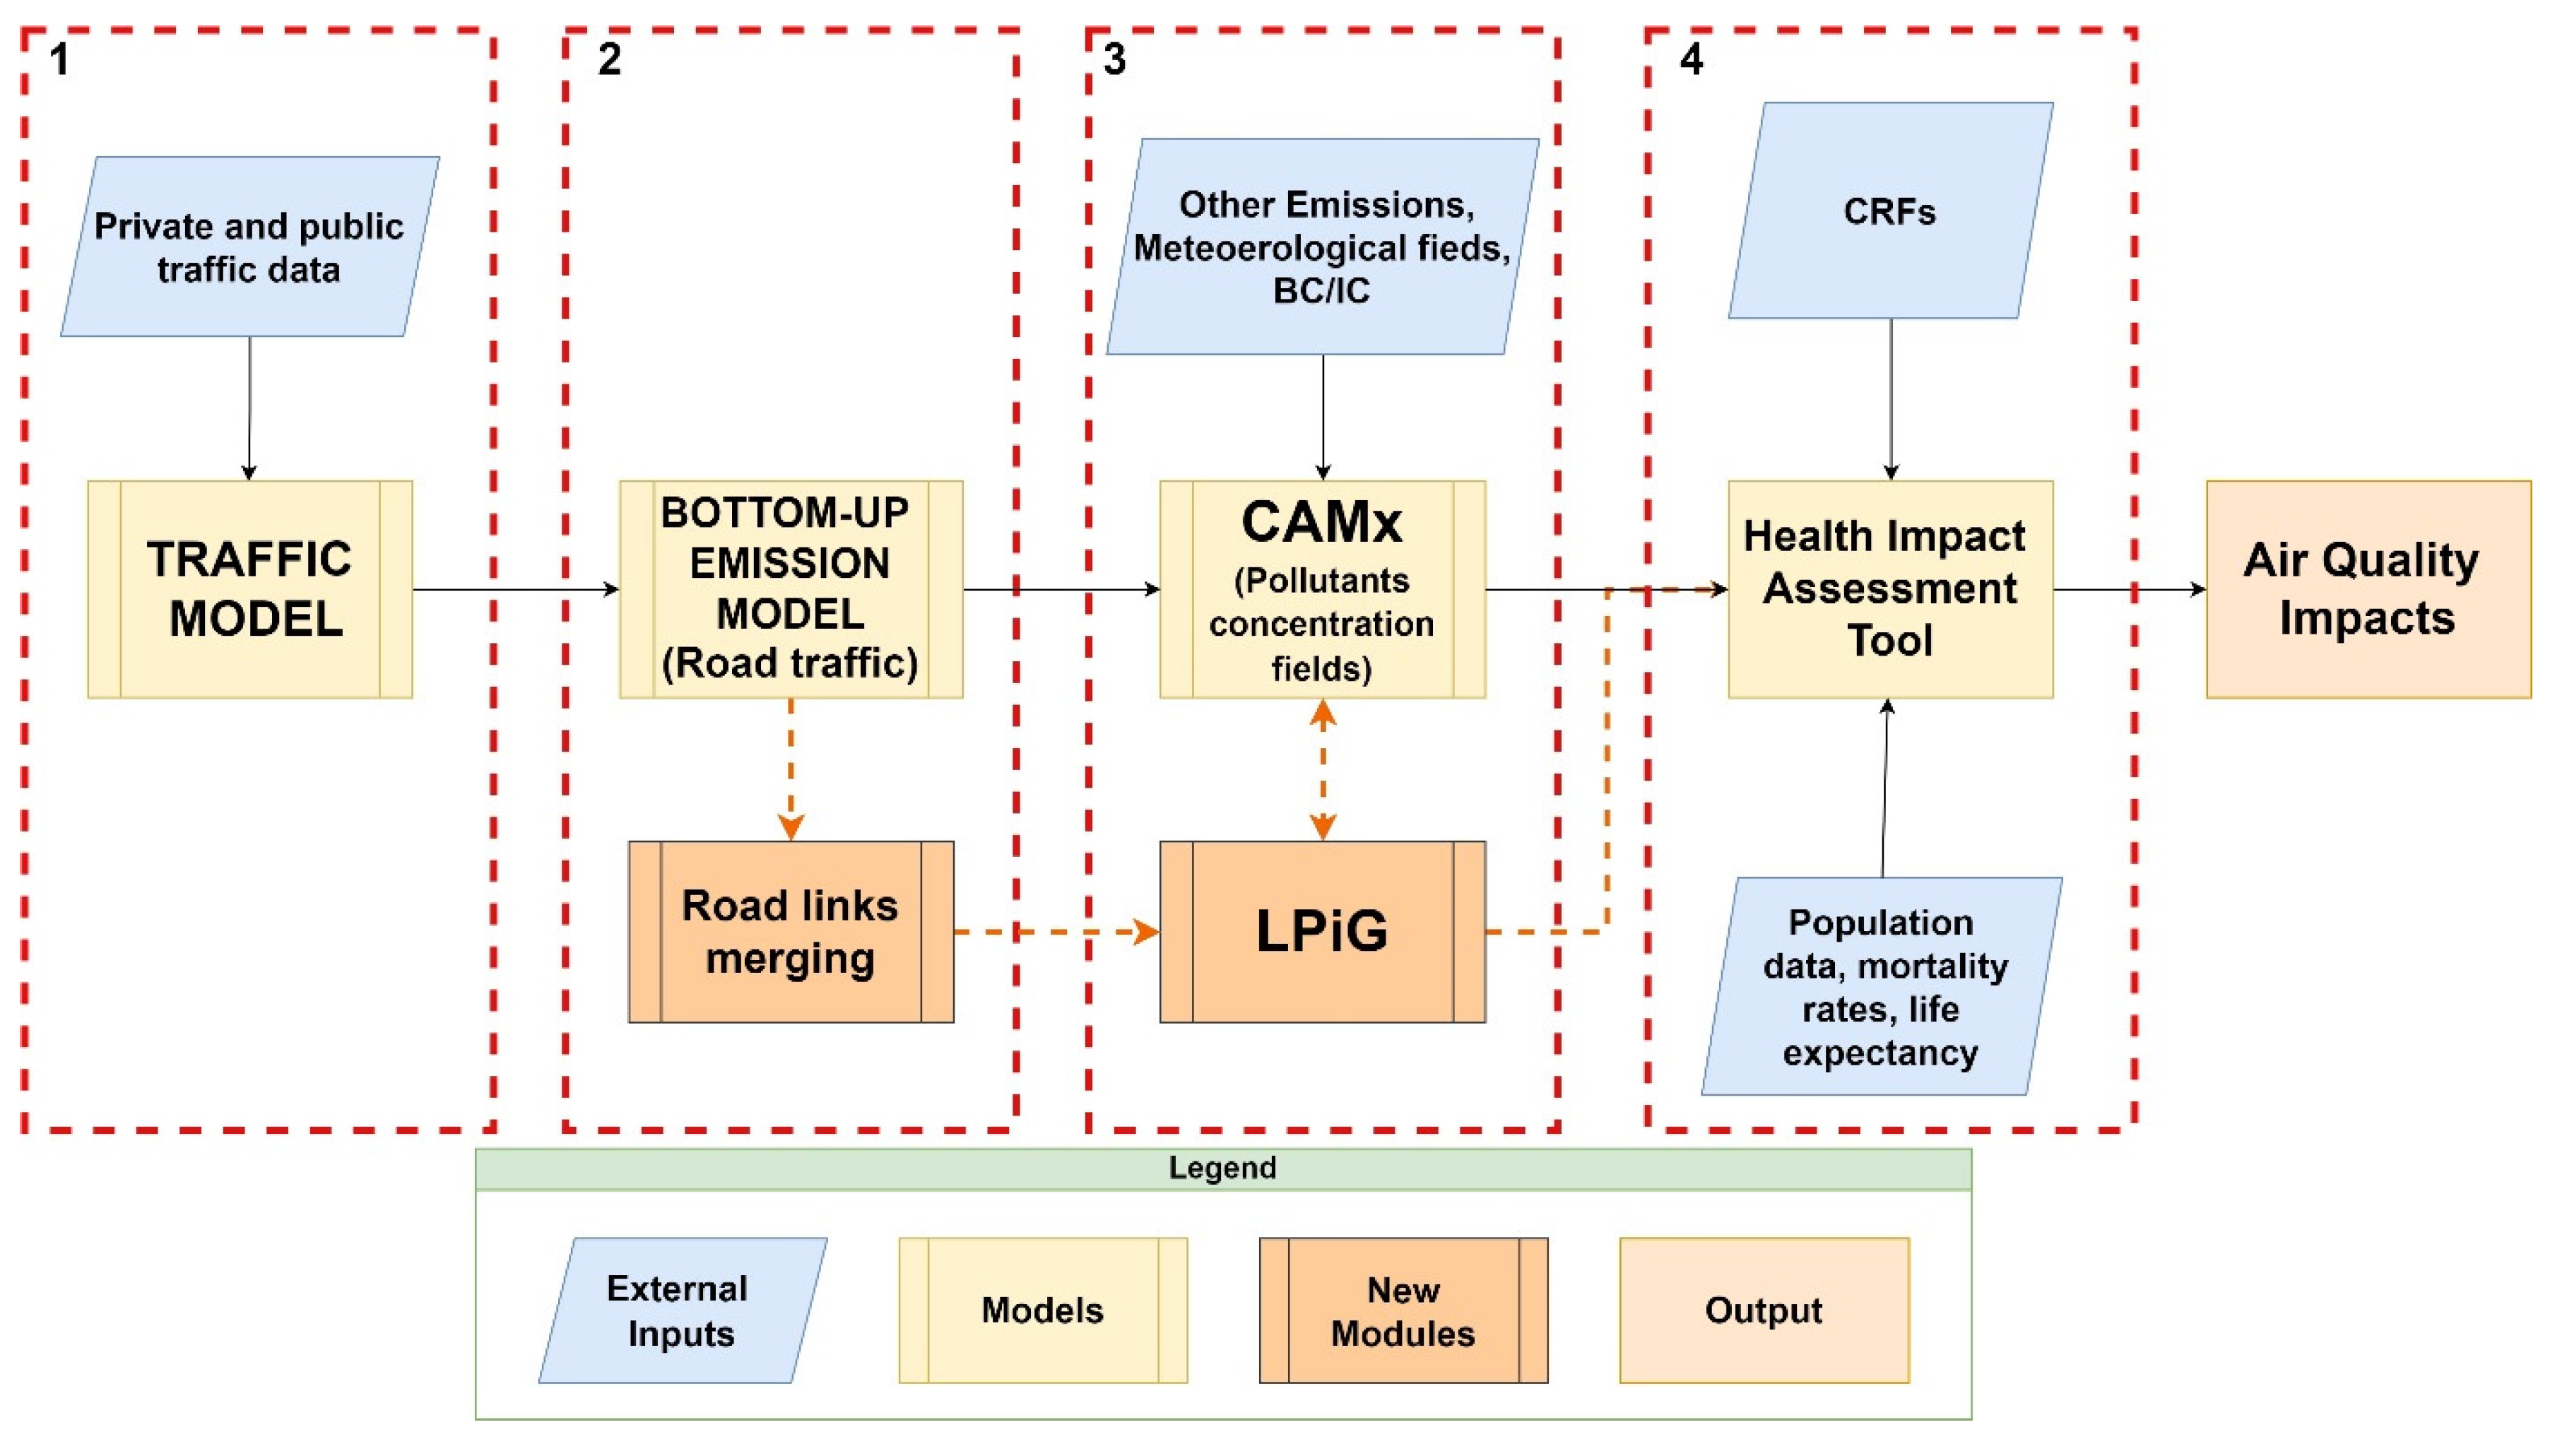
Figure 2.
Set of nested domains used in CAMx and high-resolution sampling grid for CAMx. The coarse 4-km Italian domain (ITA) is depicted in black, the fine metropolitan 1-km domain (MIL) in red, and the 50-m high resolution grid (URB) for the sampling of the hybrid model in blue.
Figure 2.
Set of nested domains used in CAMx and high-resolution sampling grid for CAMx. The coarse 4-km Italian domain (ITA) is depicted in black, the fine metropolitan 1-km domain (MIL) in red, and the 50-m high resolution grid (URB) for the sampling of the hybrid model in blue.
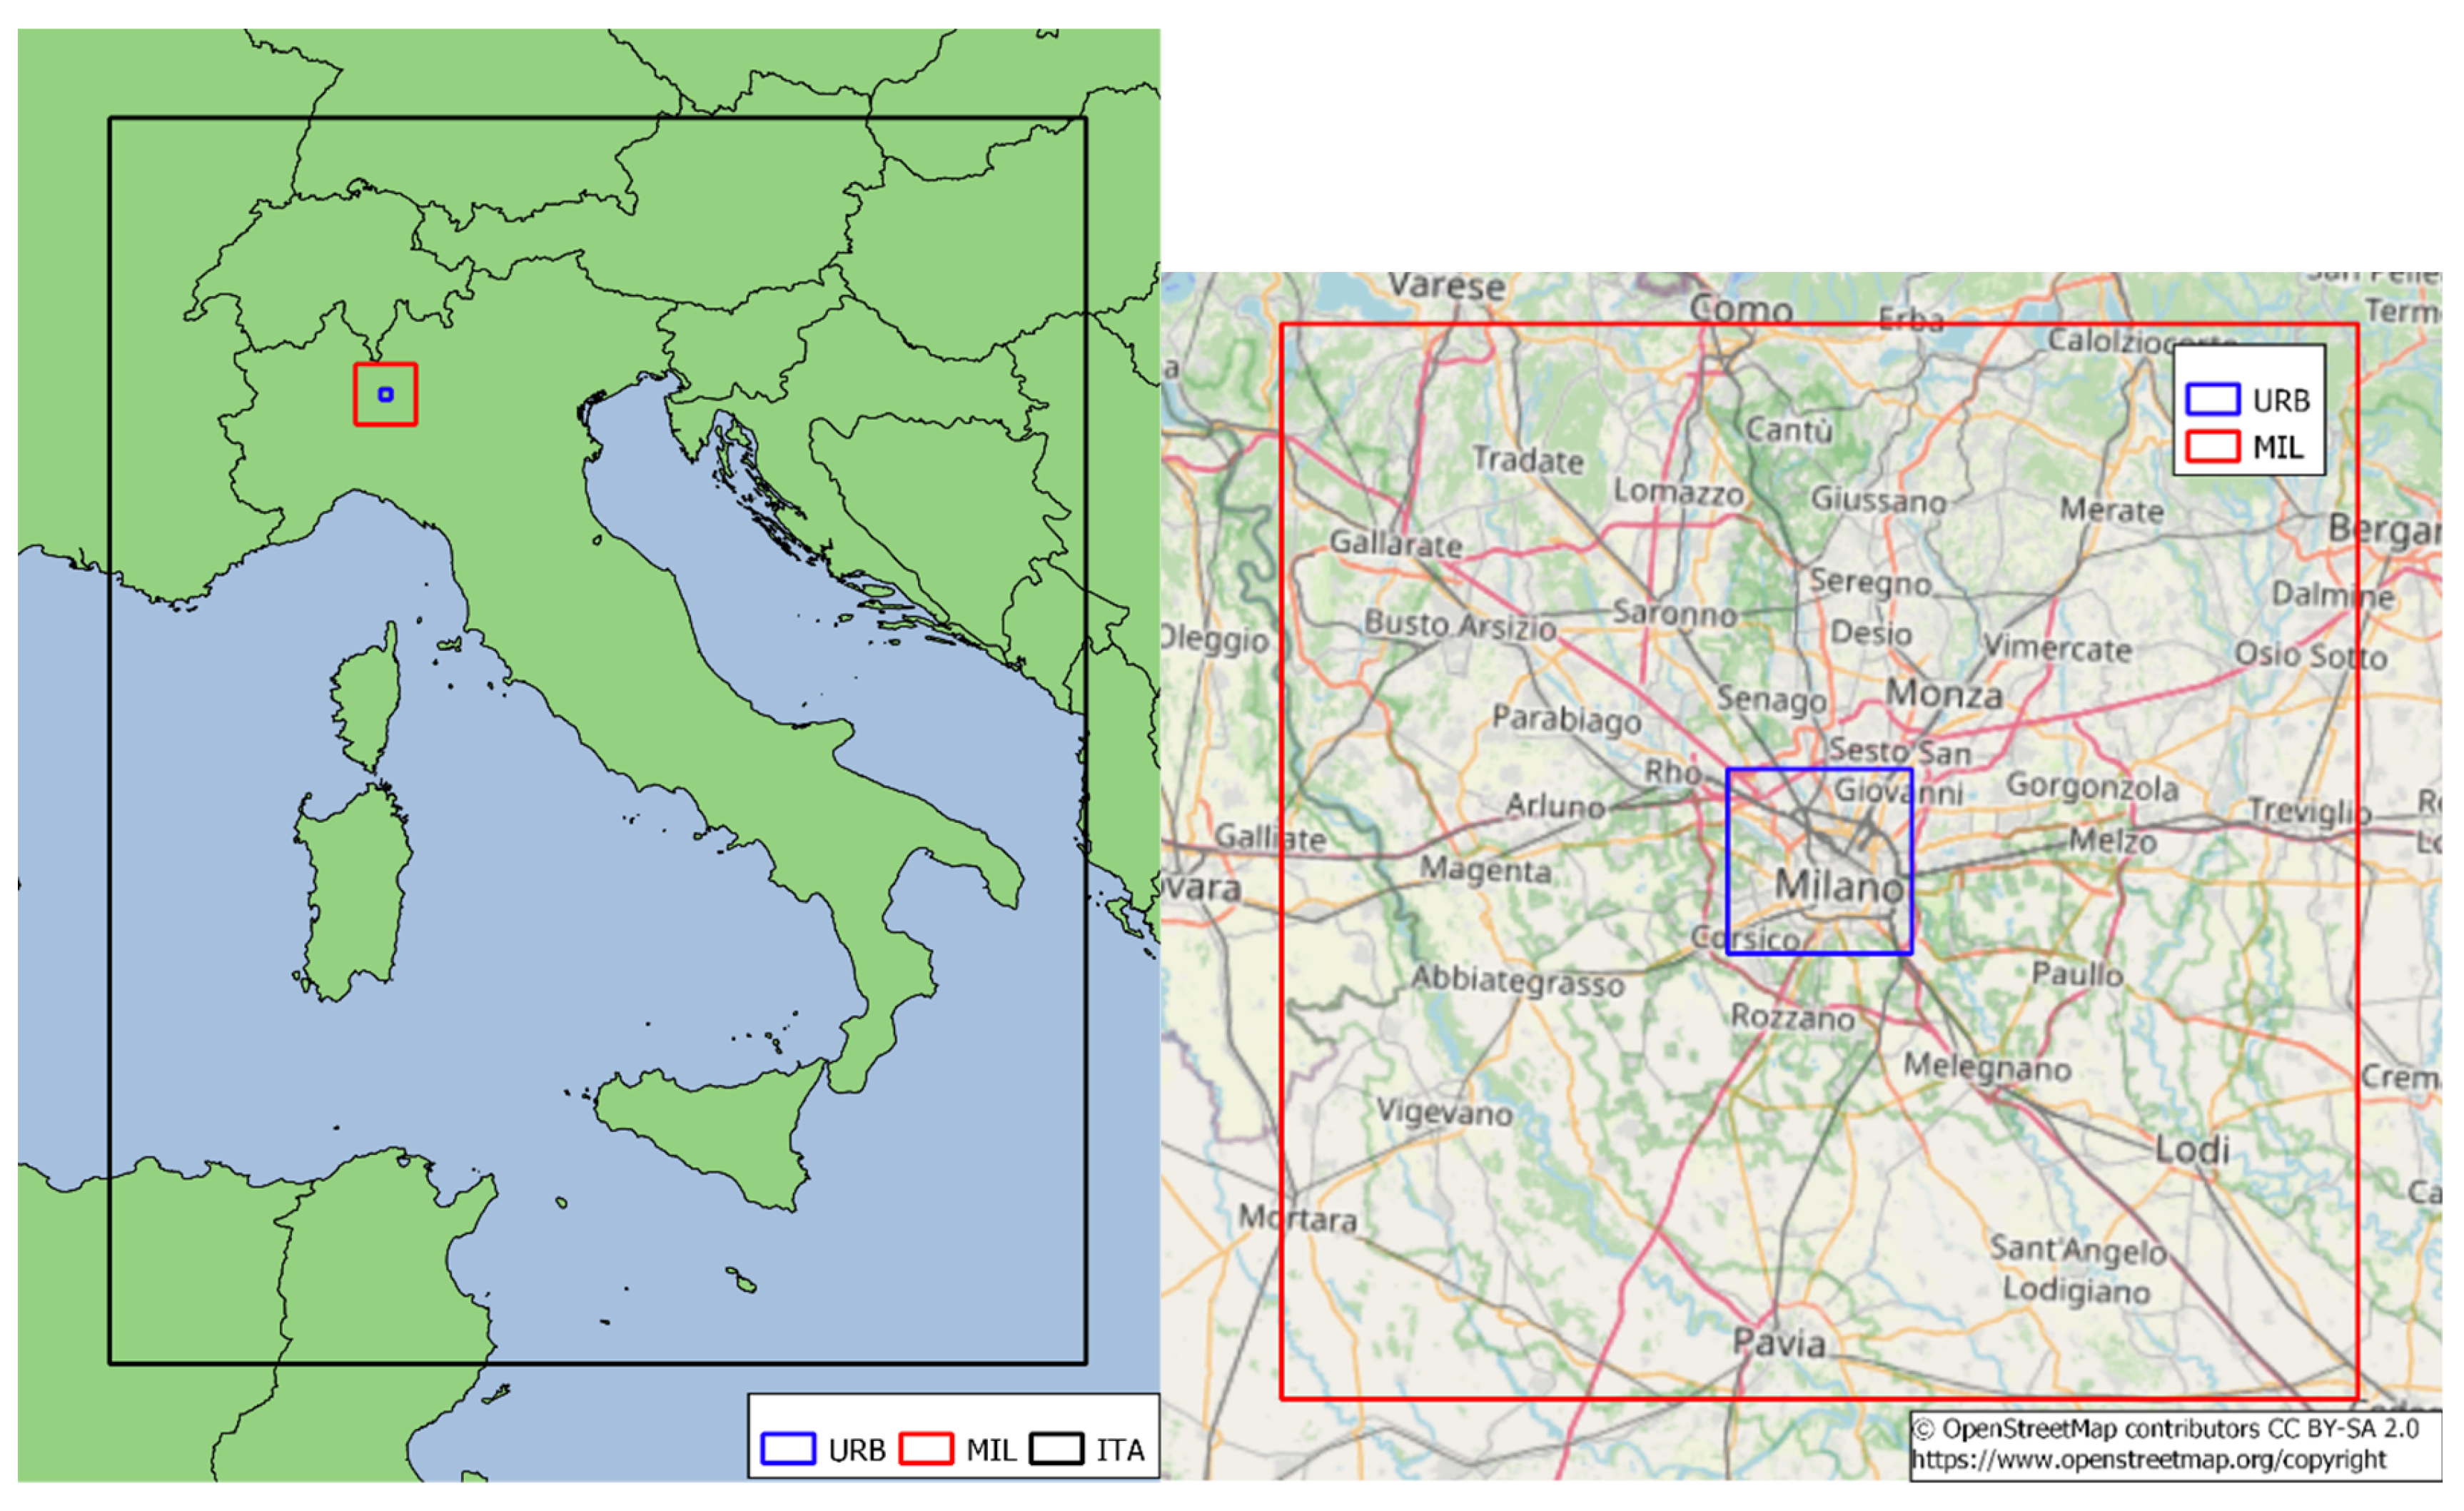
Figure 3.
Road Links simulated with the LPiG Module (orange), Air quality stations used for model evaluation, border of Milan municipality (black), LPiG sampling grid (blue) and portion of the domain represented in the air quality maps (red), corresponding to Milan city centre.
Figure 3.
Road Links simulated with the LPiG Module (orange), Air quality stations used for model evaluation, border of Milan municipality (black), LPiG sampling grid (blue) and portion of the domain represented in the air quality maps (red), corresponding to Milan city centre.
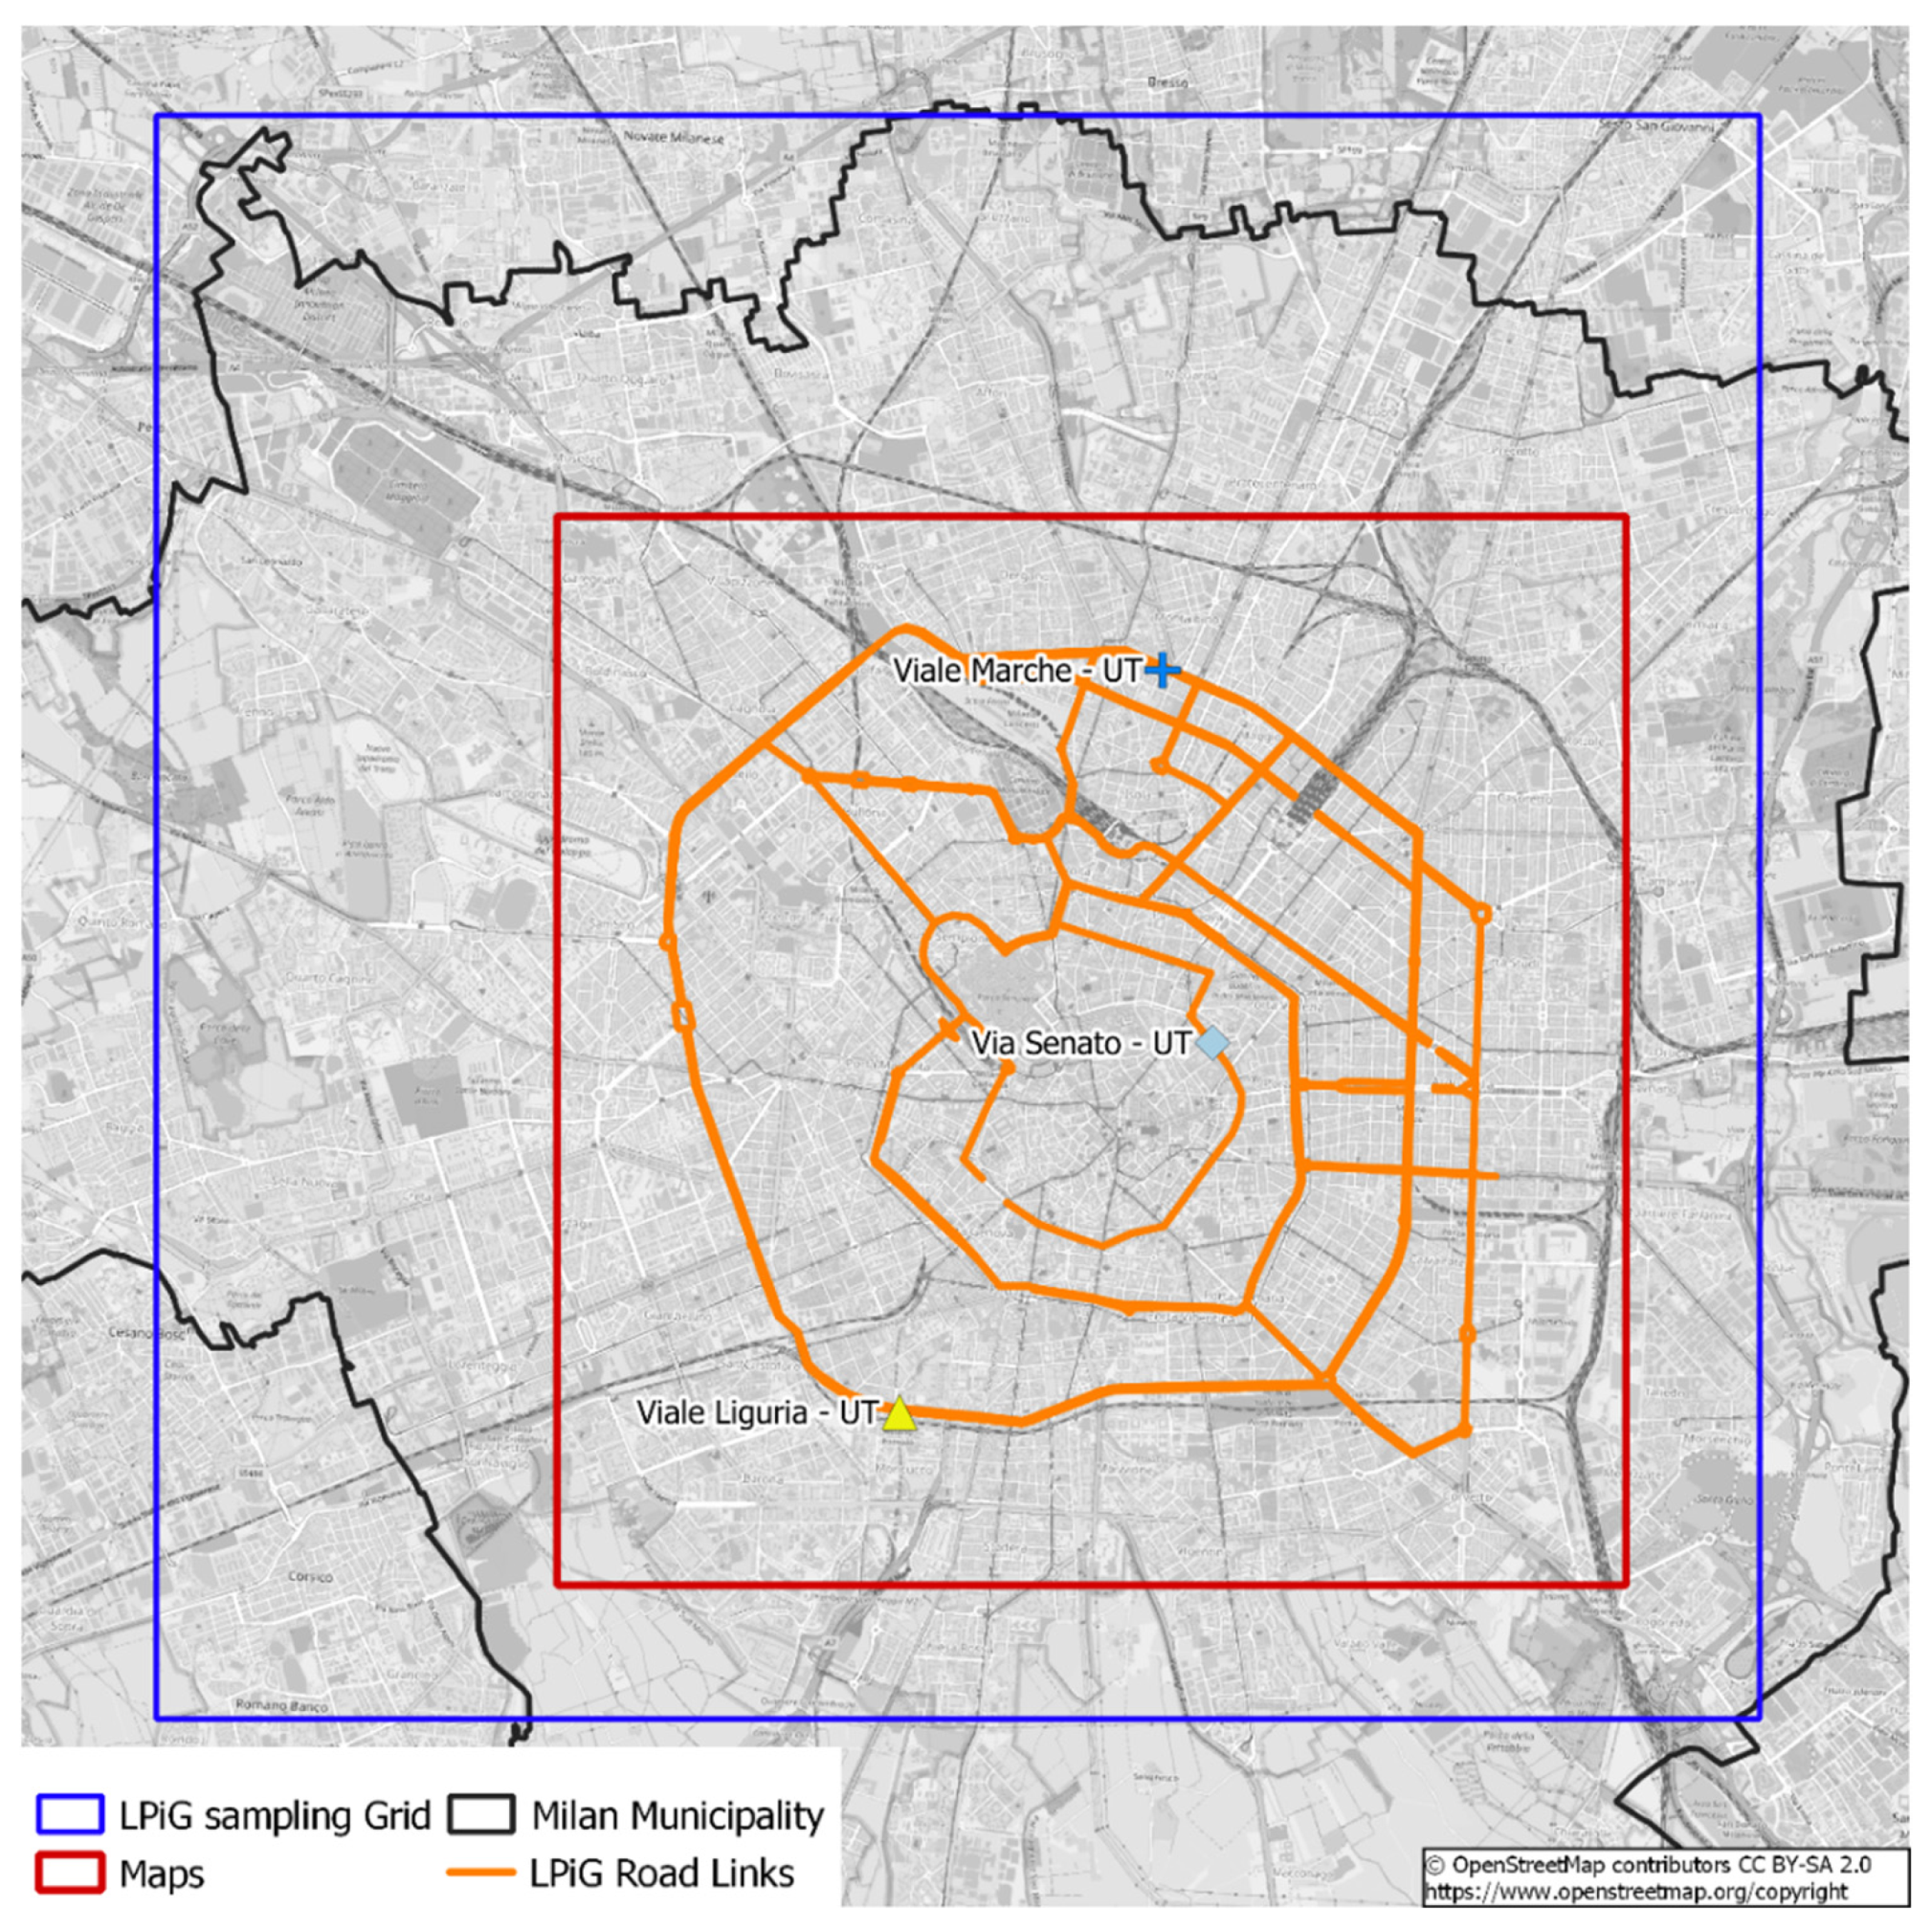
Figure 4.
Merge example from point 2 and results. First panel: opposite direction links of the same carriageway. Second Panel: consecutive links with the angle between them less than 4.5°. Example of links that are not merged. Third panel: consecutive links with the angle between them greater than 4.5°. Fourth panel: non-consecutive links.
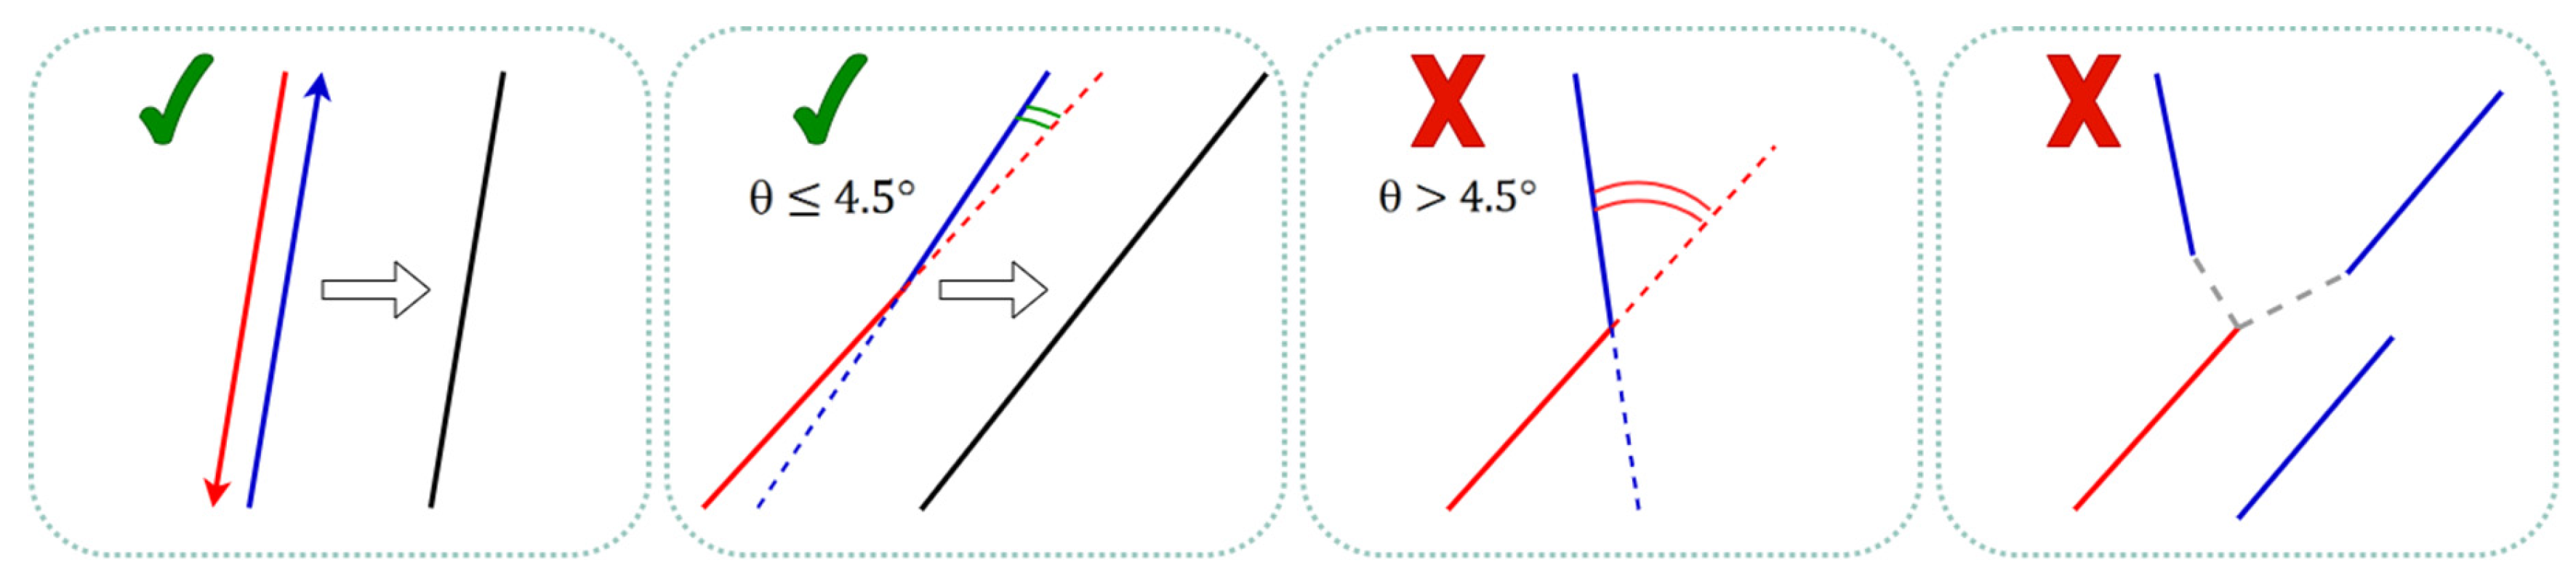
Figure 5.
CAMx-LPiG (left) and CAMx (right) NO2 monthly mean concentration for January 2017 over Milan city centre (referred as “Maps” in Figure 3).
Figure 5.
CAMx-LPiG (left) and CAMx (right) NO2 monthly mean concentration for January 2017 over Milan city centre (referred as “Maps” in Figure 3).
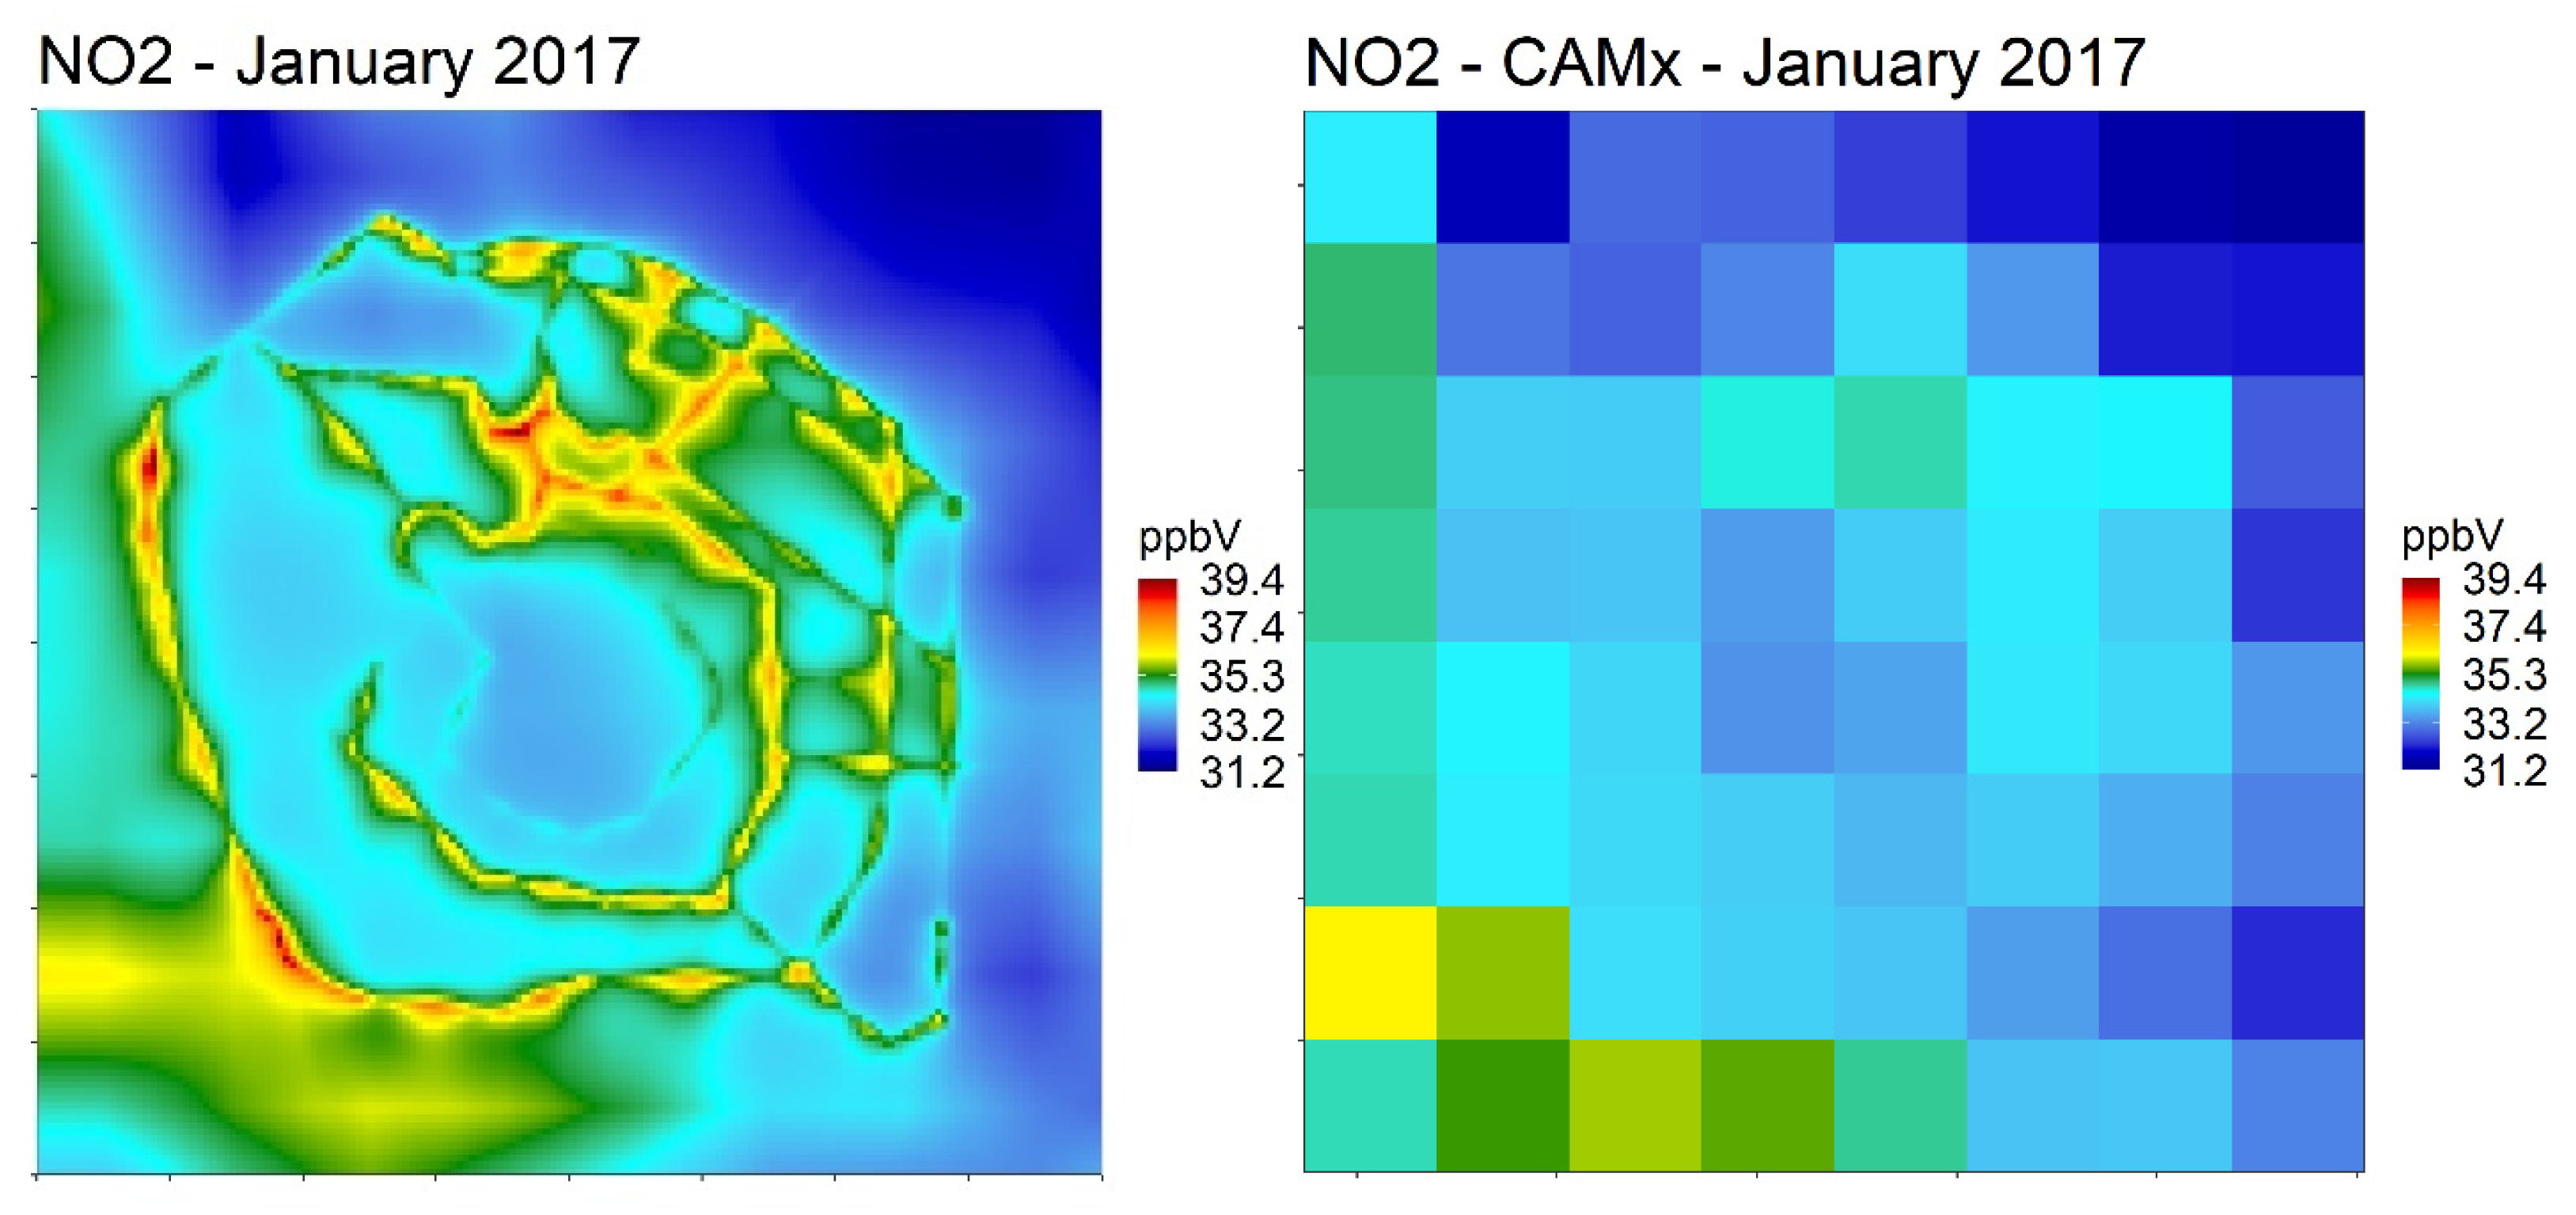
Figure 6.
Sampled transects (black) and NOX concentrations.
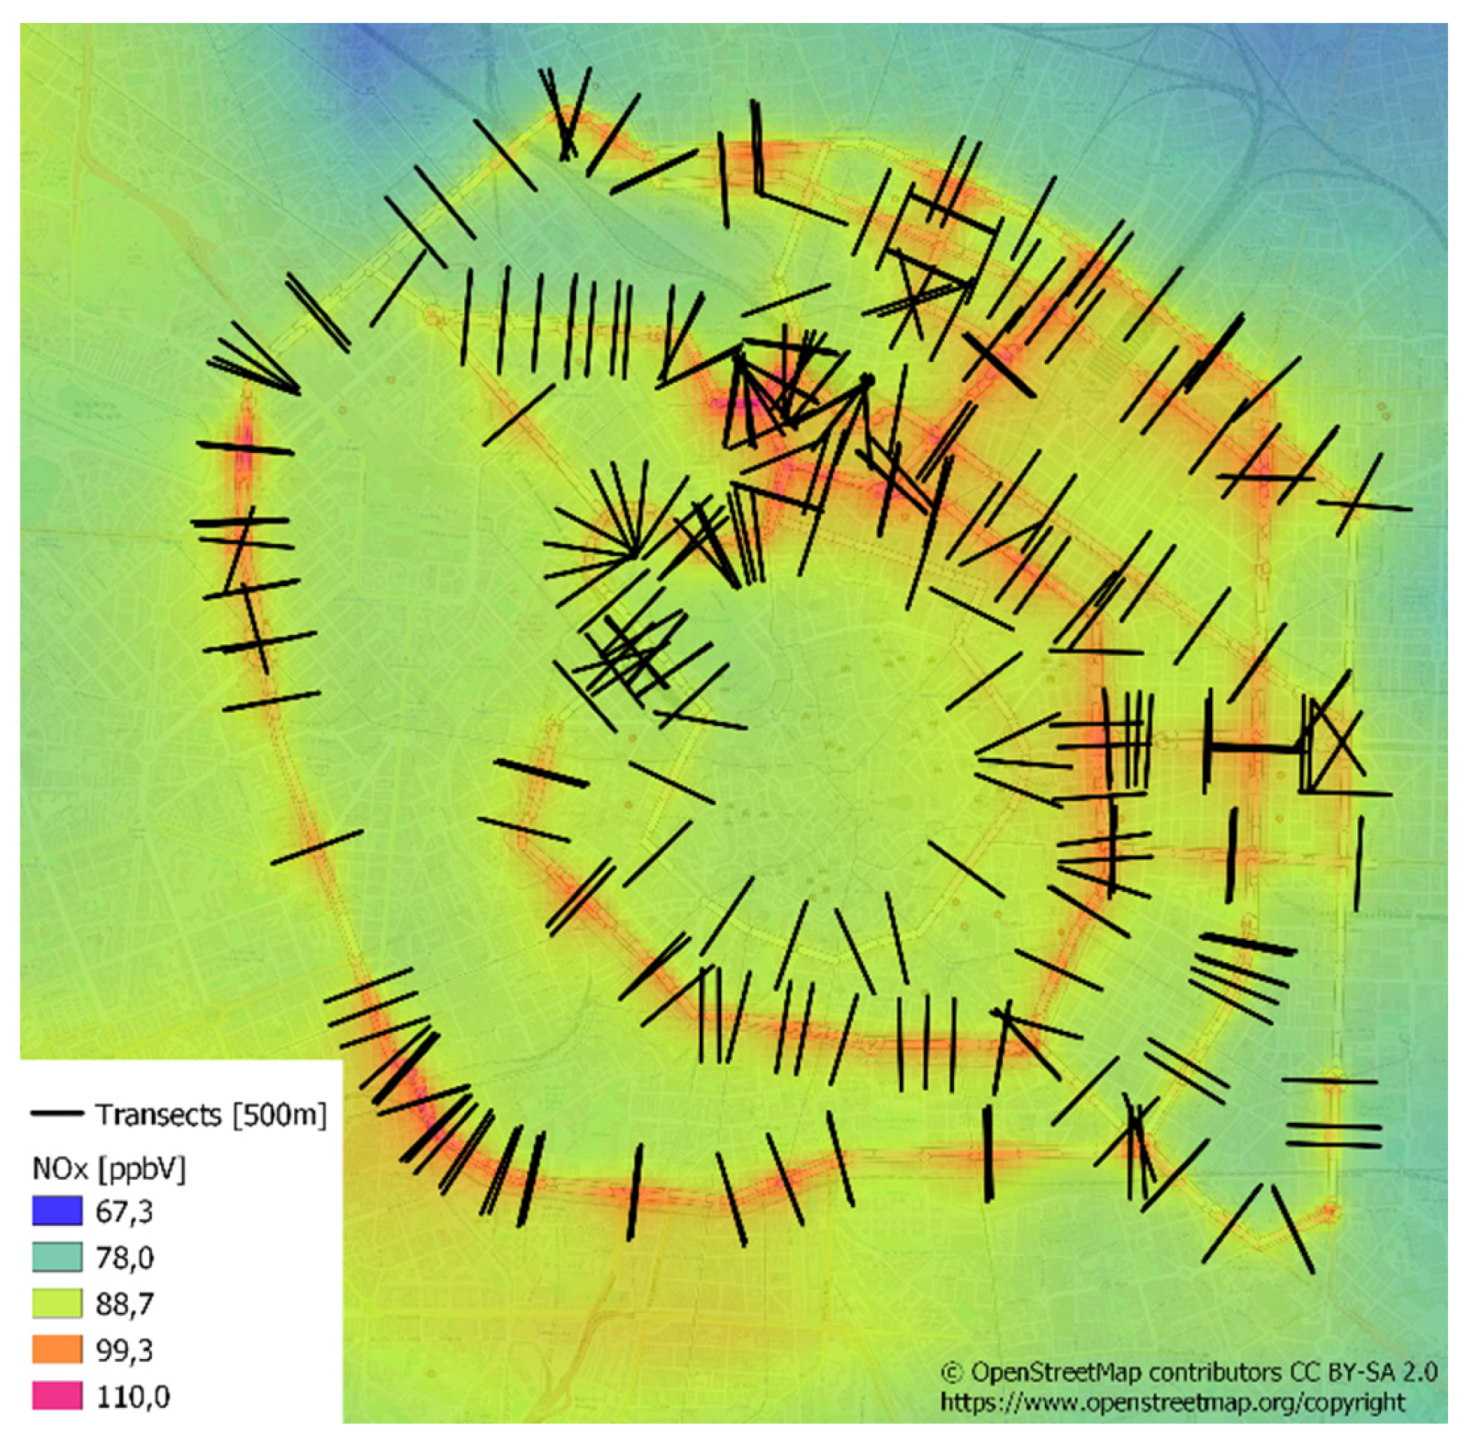
Figure 7.
Boxplots of local cross-road increment for NO2 monthly mean concentration in absolute terms (ppbV, left) and relative terms (right).
Figure 7.
Boxplots of local cross-road increment for NO2 monthly mean concentration in absolute terms (ppbV, left) and relative terms (right).
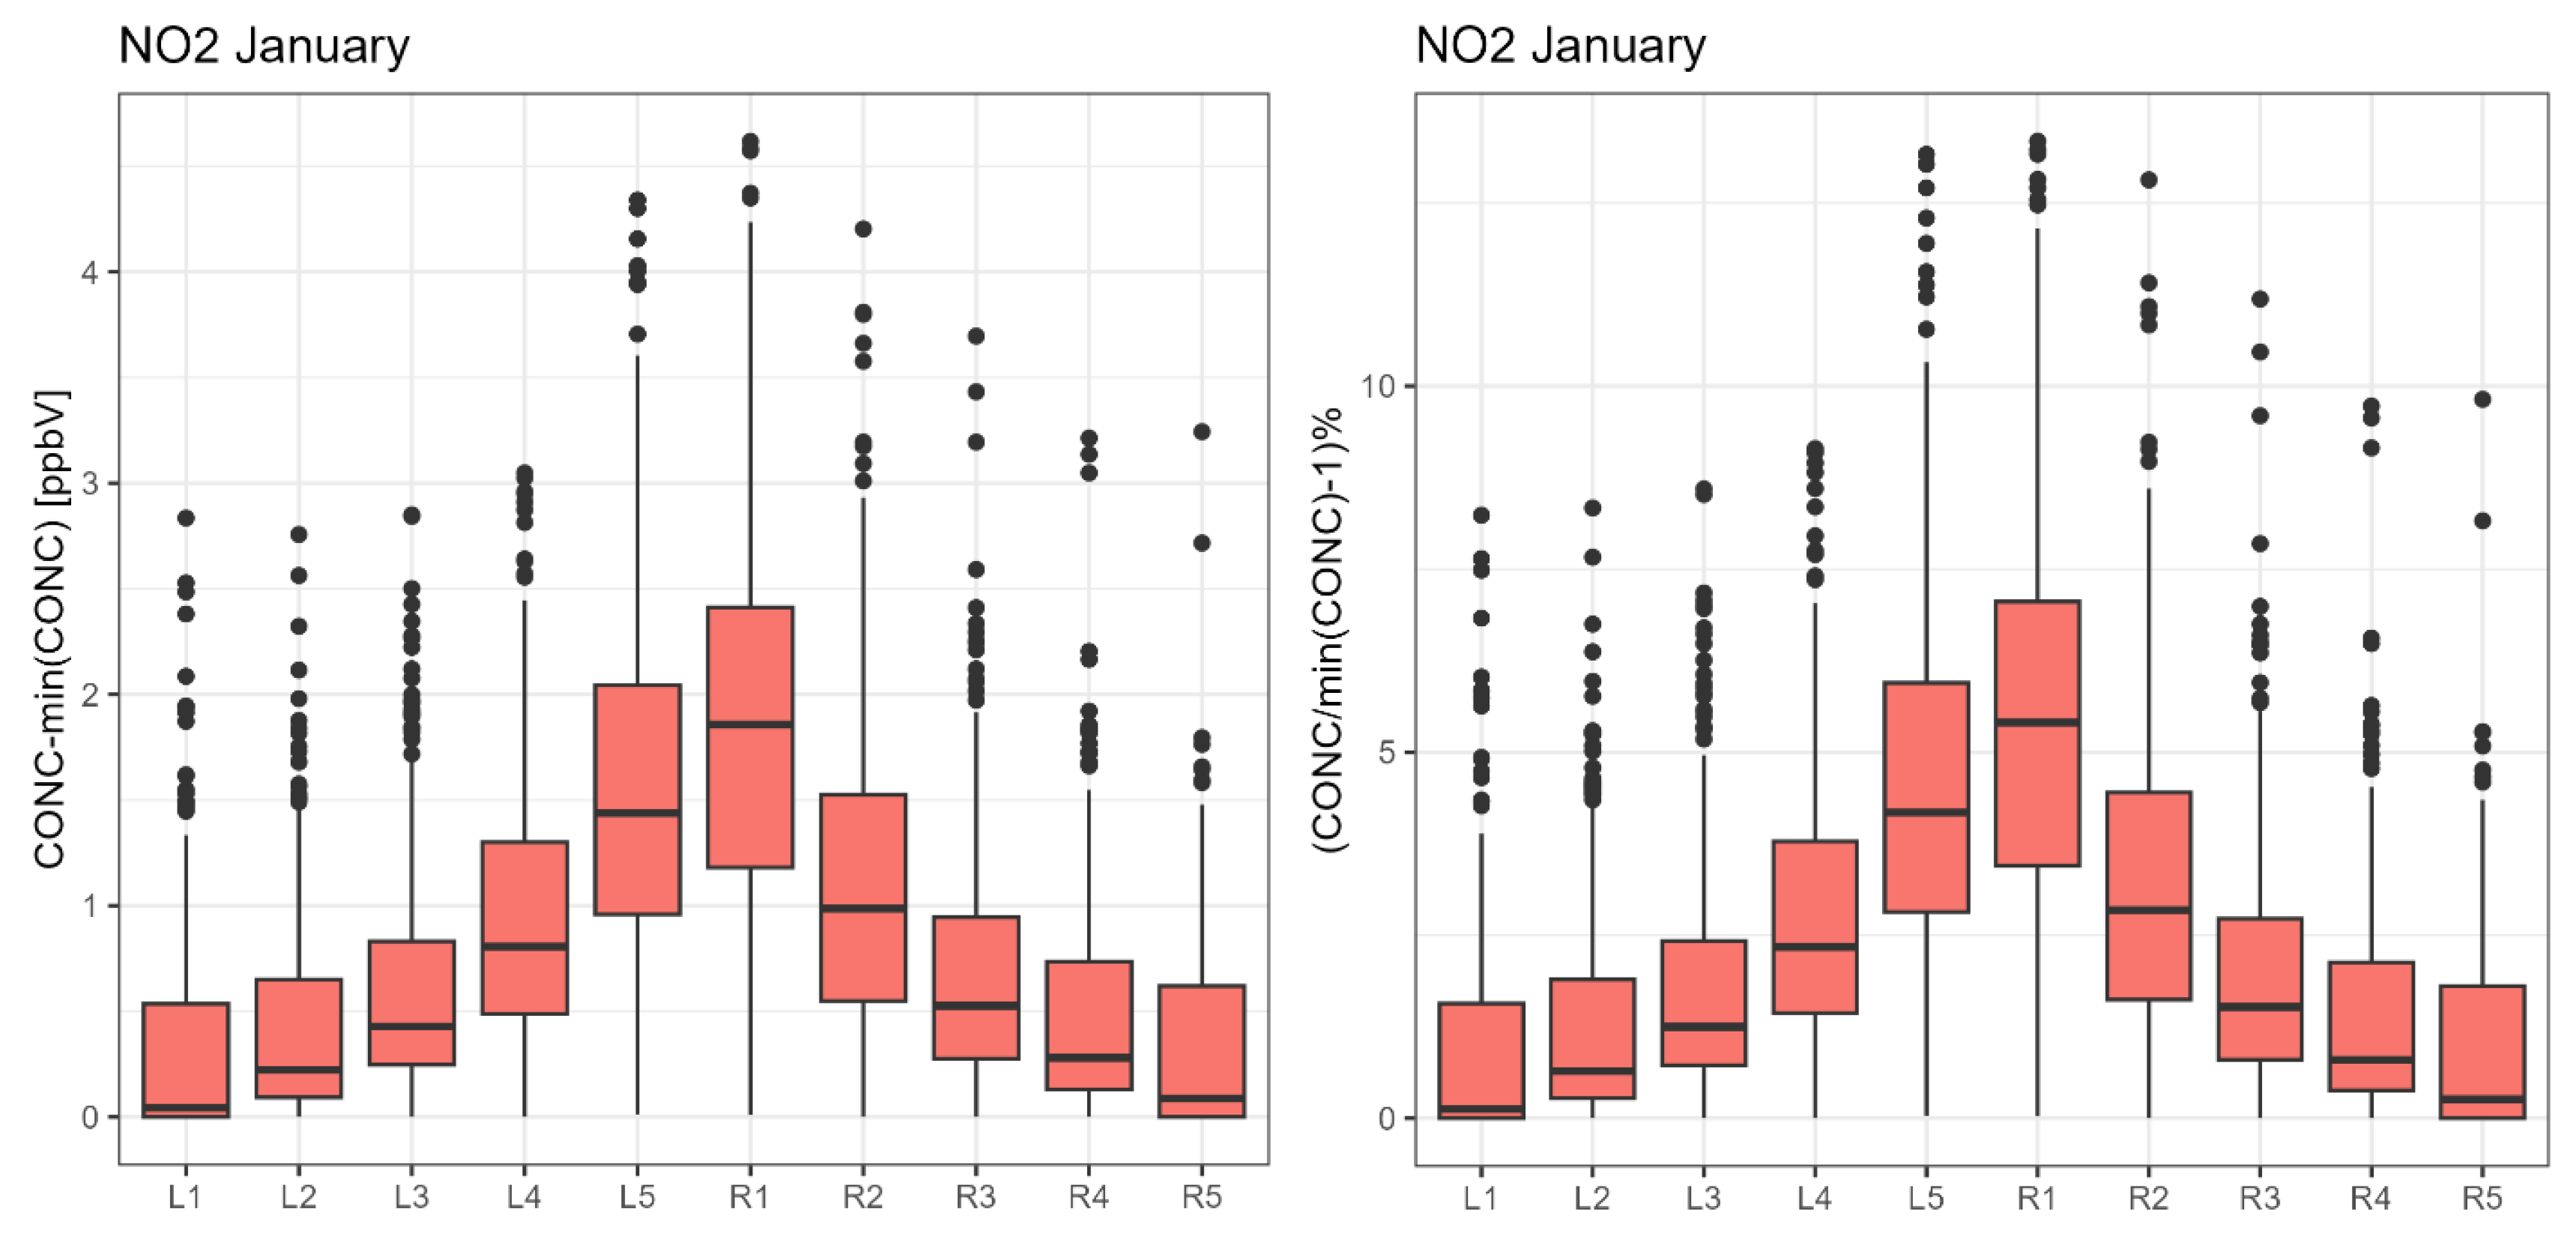
Figure 8.
Time series of daily mean NO2 concentrations at the AQ stations of Viale Marche (Site S1: IT0477A), Viale Liguria (Site S2: IT0761A) and Via Senato (Site S3: IT1016A) in January 2017. (black line: observed values; red line: CAMx-LPiG simulation; green line: CAMx simulation).
Figure 8.
Time series of daily mean NO2 concentrations at the AQ stations of Viale Marche (Site S1: IT0477A), Viale Liguria (Site S2: IT0761A) and Via Senato (Site S3: IT1016A) in January 2017. (black line: observed values; red line: CAMx-LPiG simulation; green line: CAMx simulation).
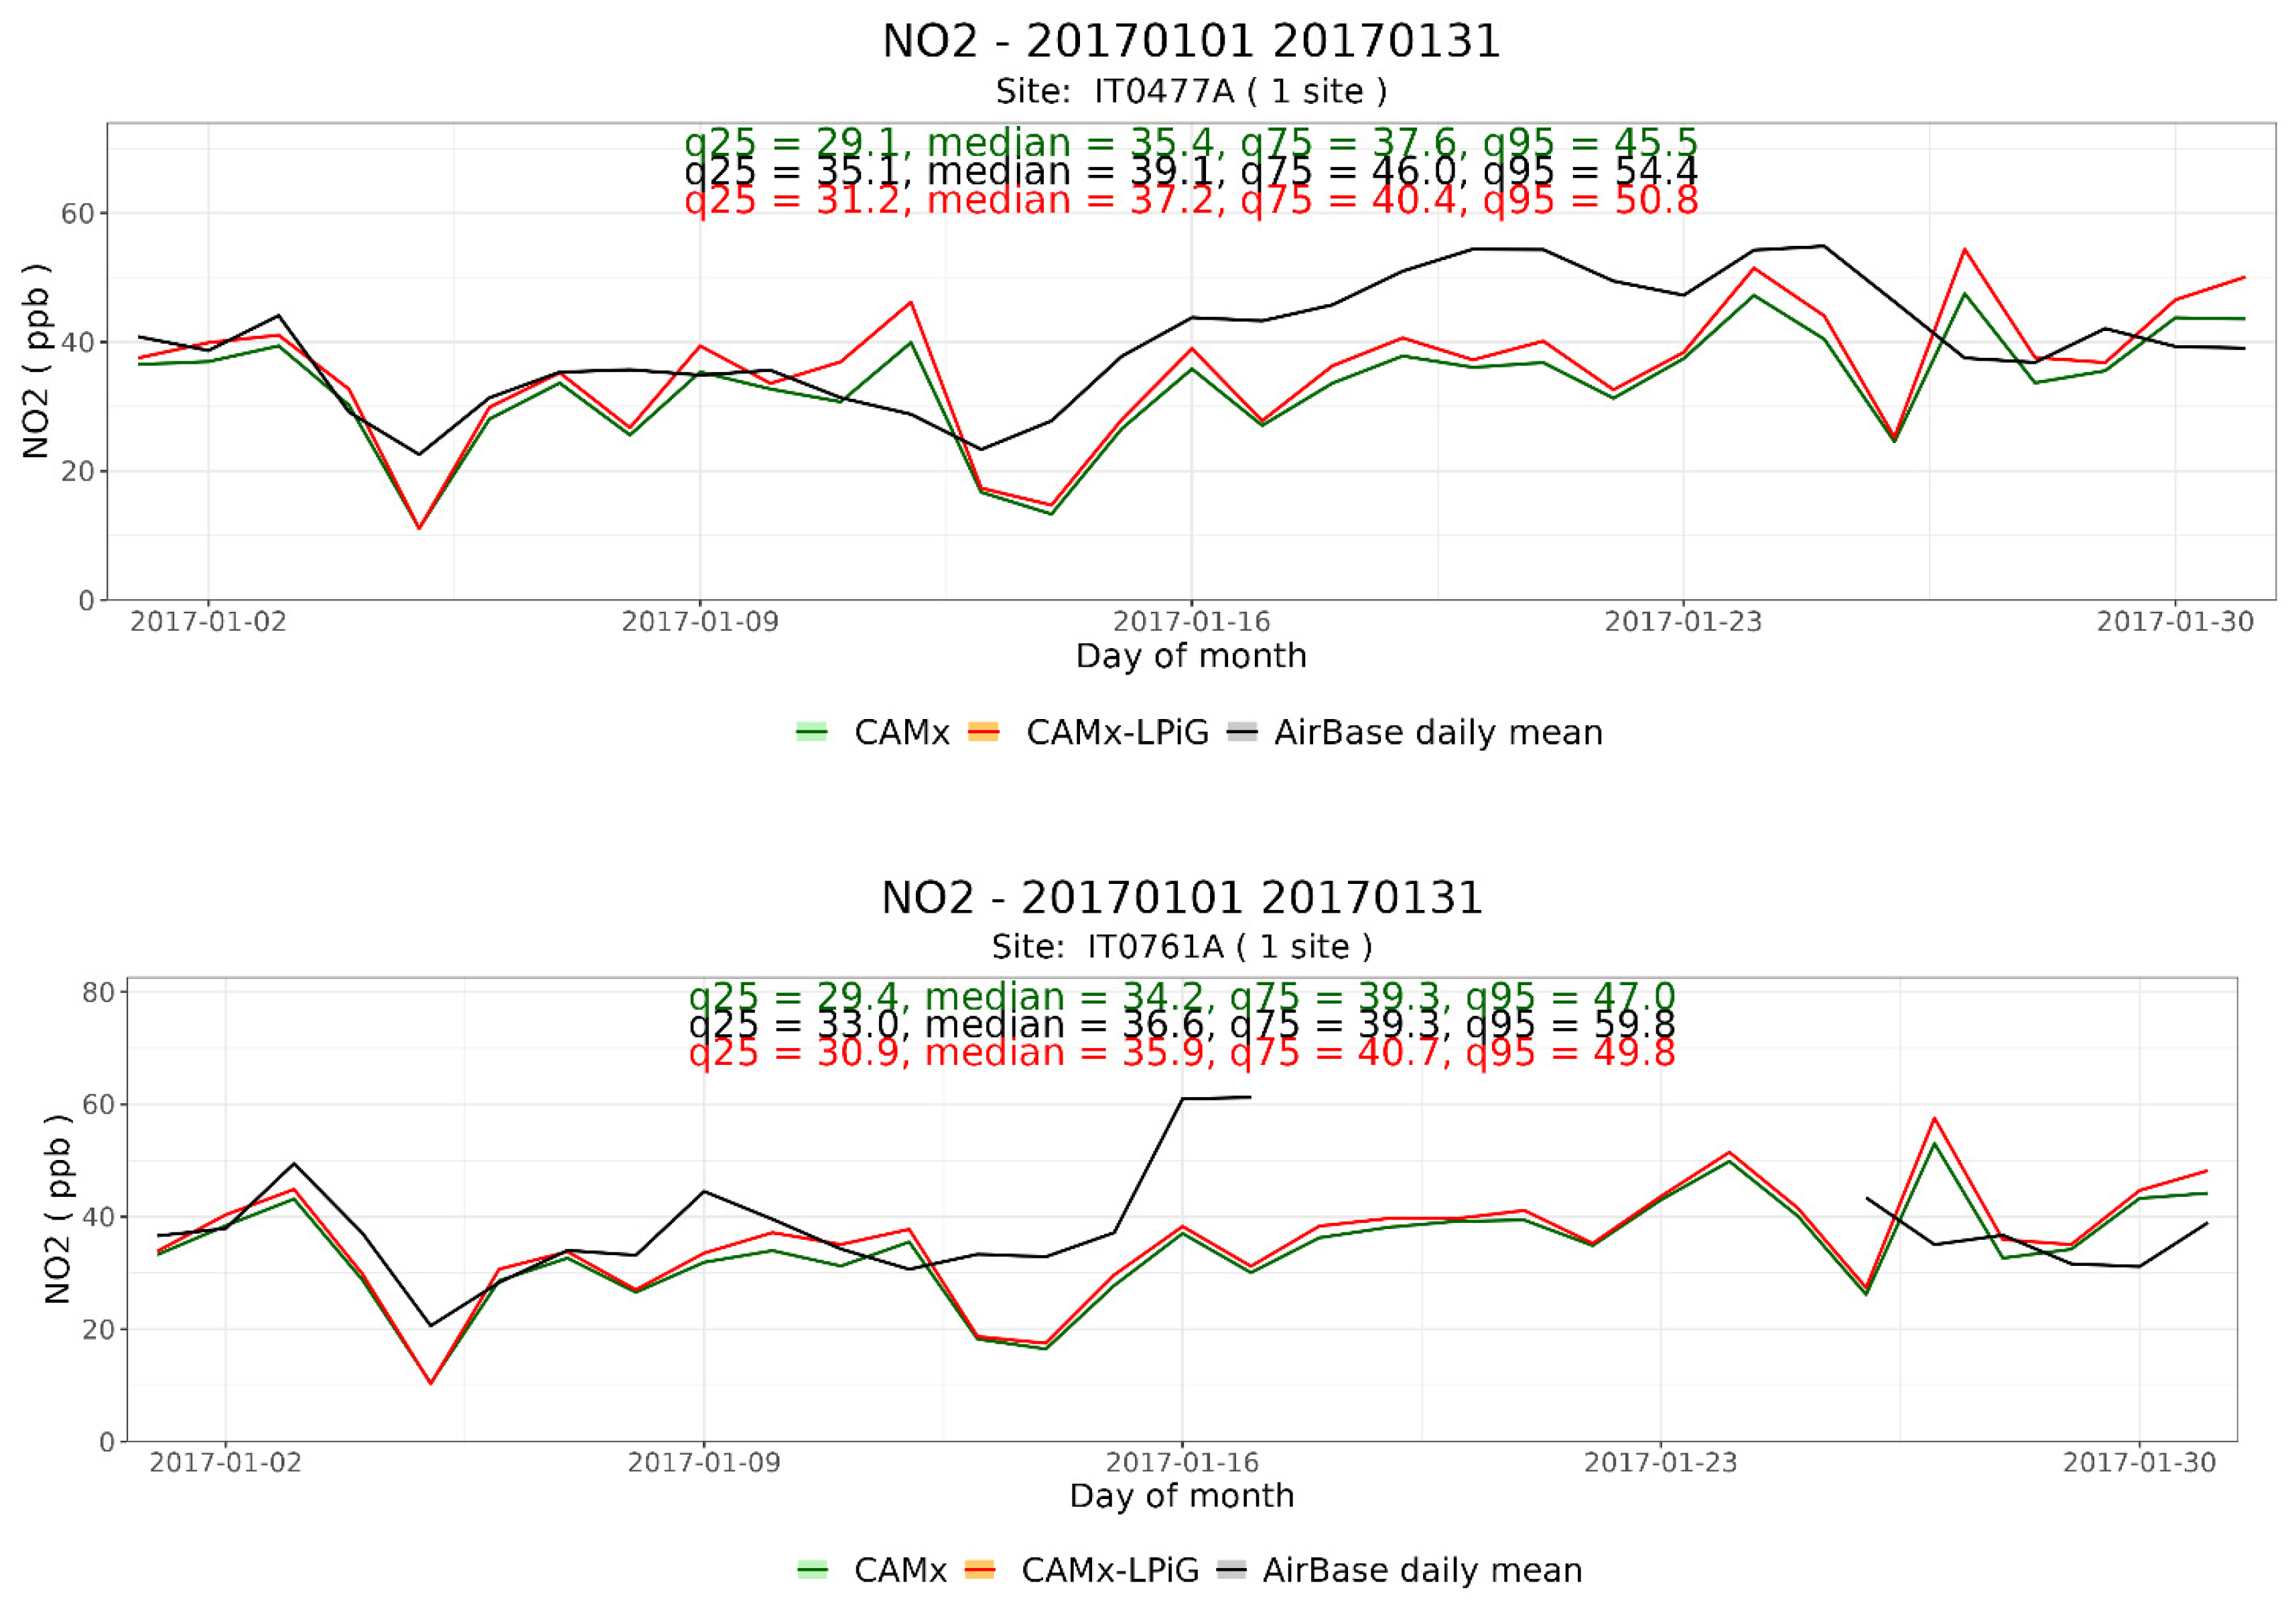
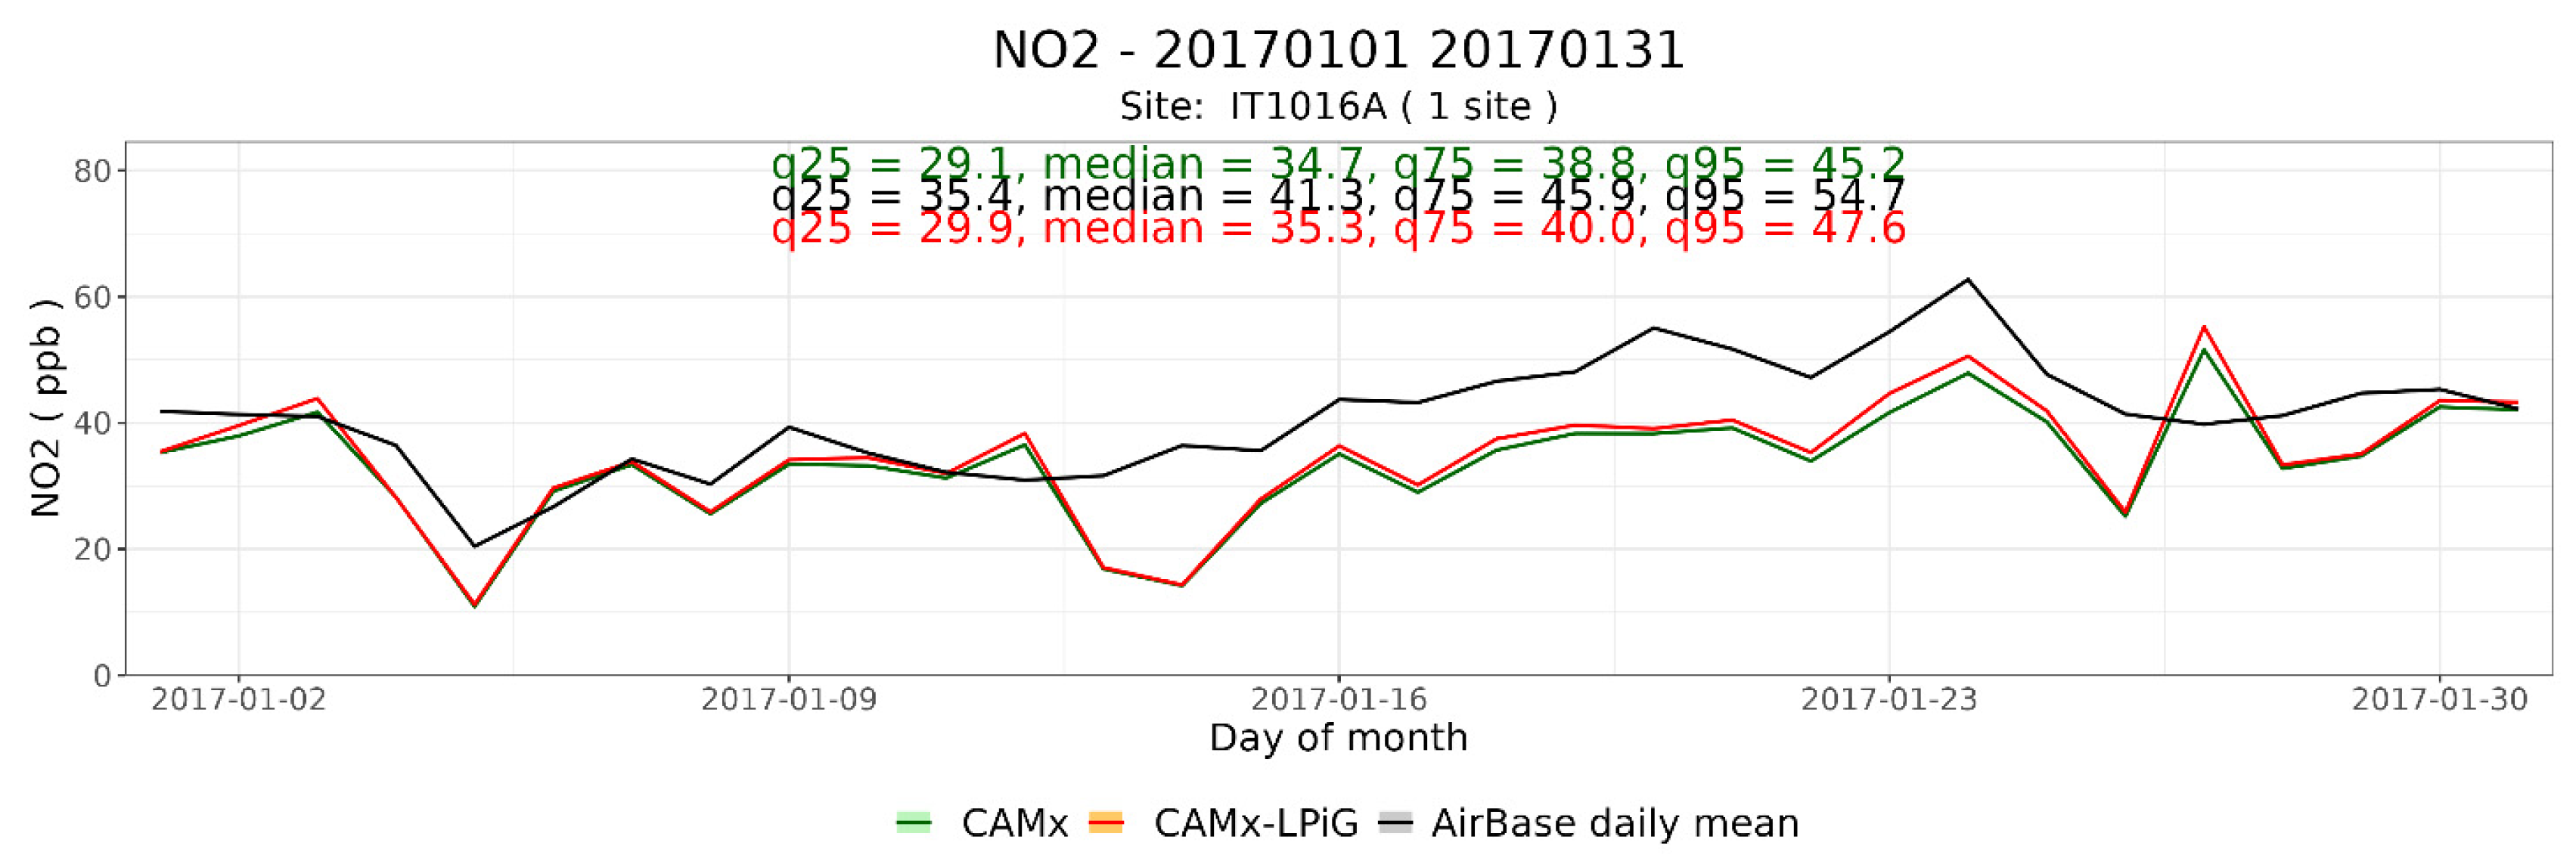
Figure 9.
Scatter plot of Observed vs Modelled NO2 daily mean concentrations at the AQ site of Viale Marche (S1), Viale Liguria (S2) and Via Senato (S3). The dashed line has a slope of 1, the black lines have a slope of 2 and 0.5 and the grey lines have a slope of 0.7 and 1.42.
Figure 9.
Scatter plot of Observed vs Modelled NO2 daily mean concentrations at the AQ site of Viale Marche (S1), Viale Liguria (S2) and Via Senato (S3). The dashed line has a slope of 1, the black lines have a slope of 2 and 0.5 and the grey lines have a slope of 0.7 and 1.42.
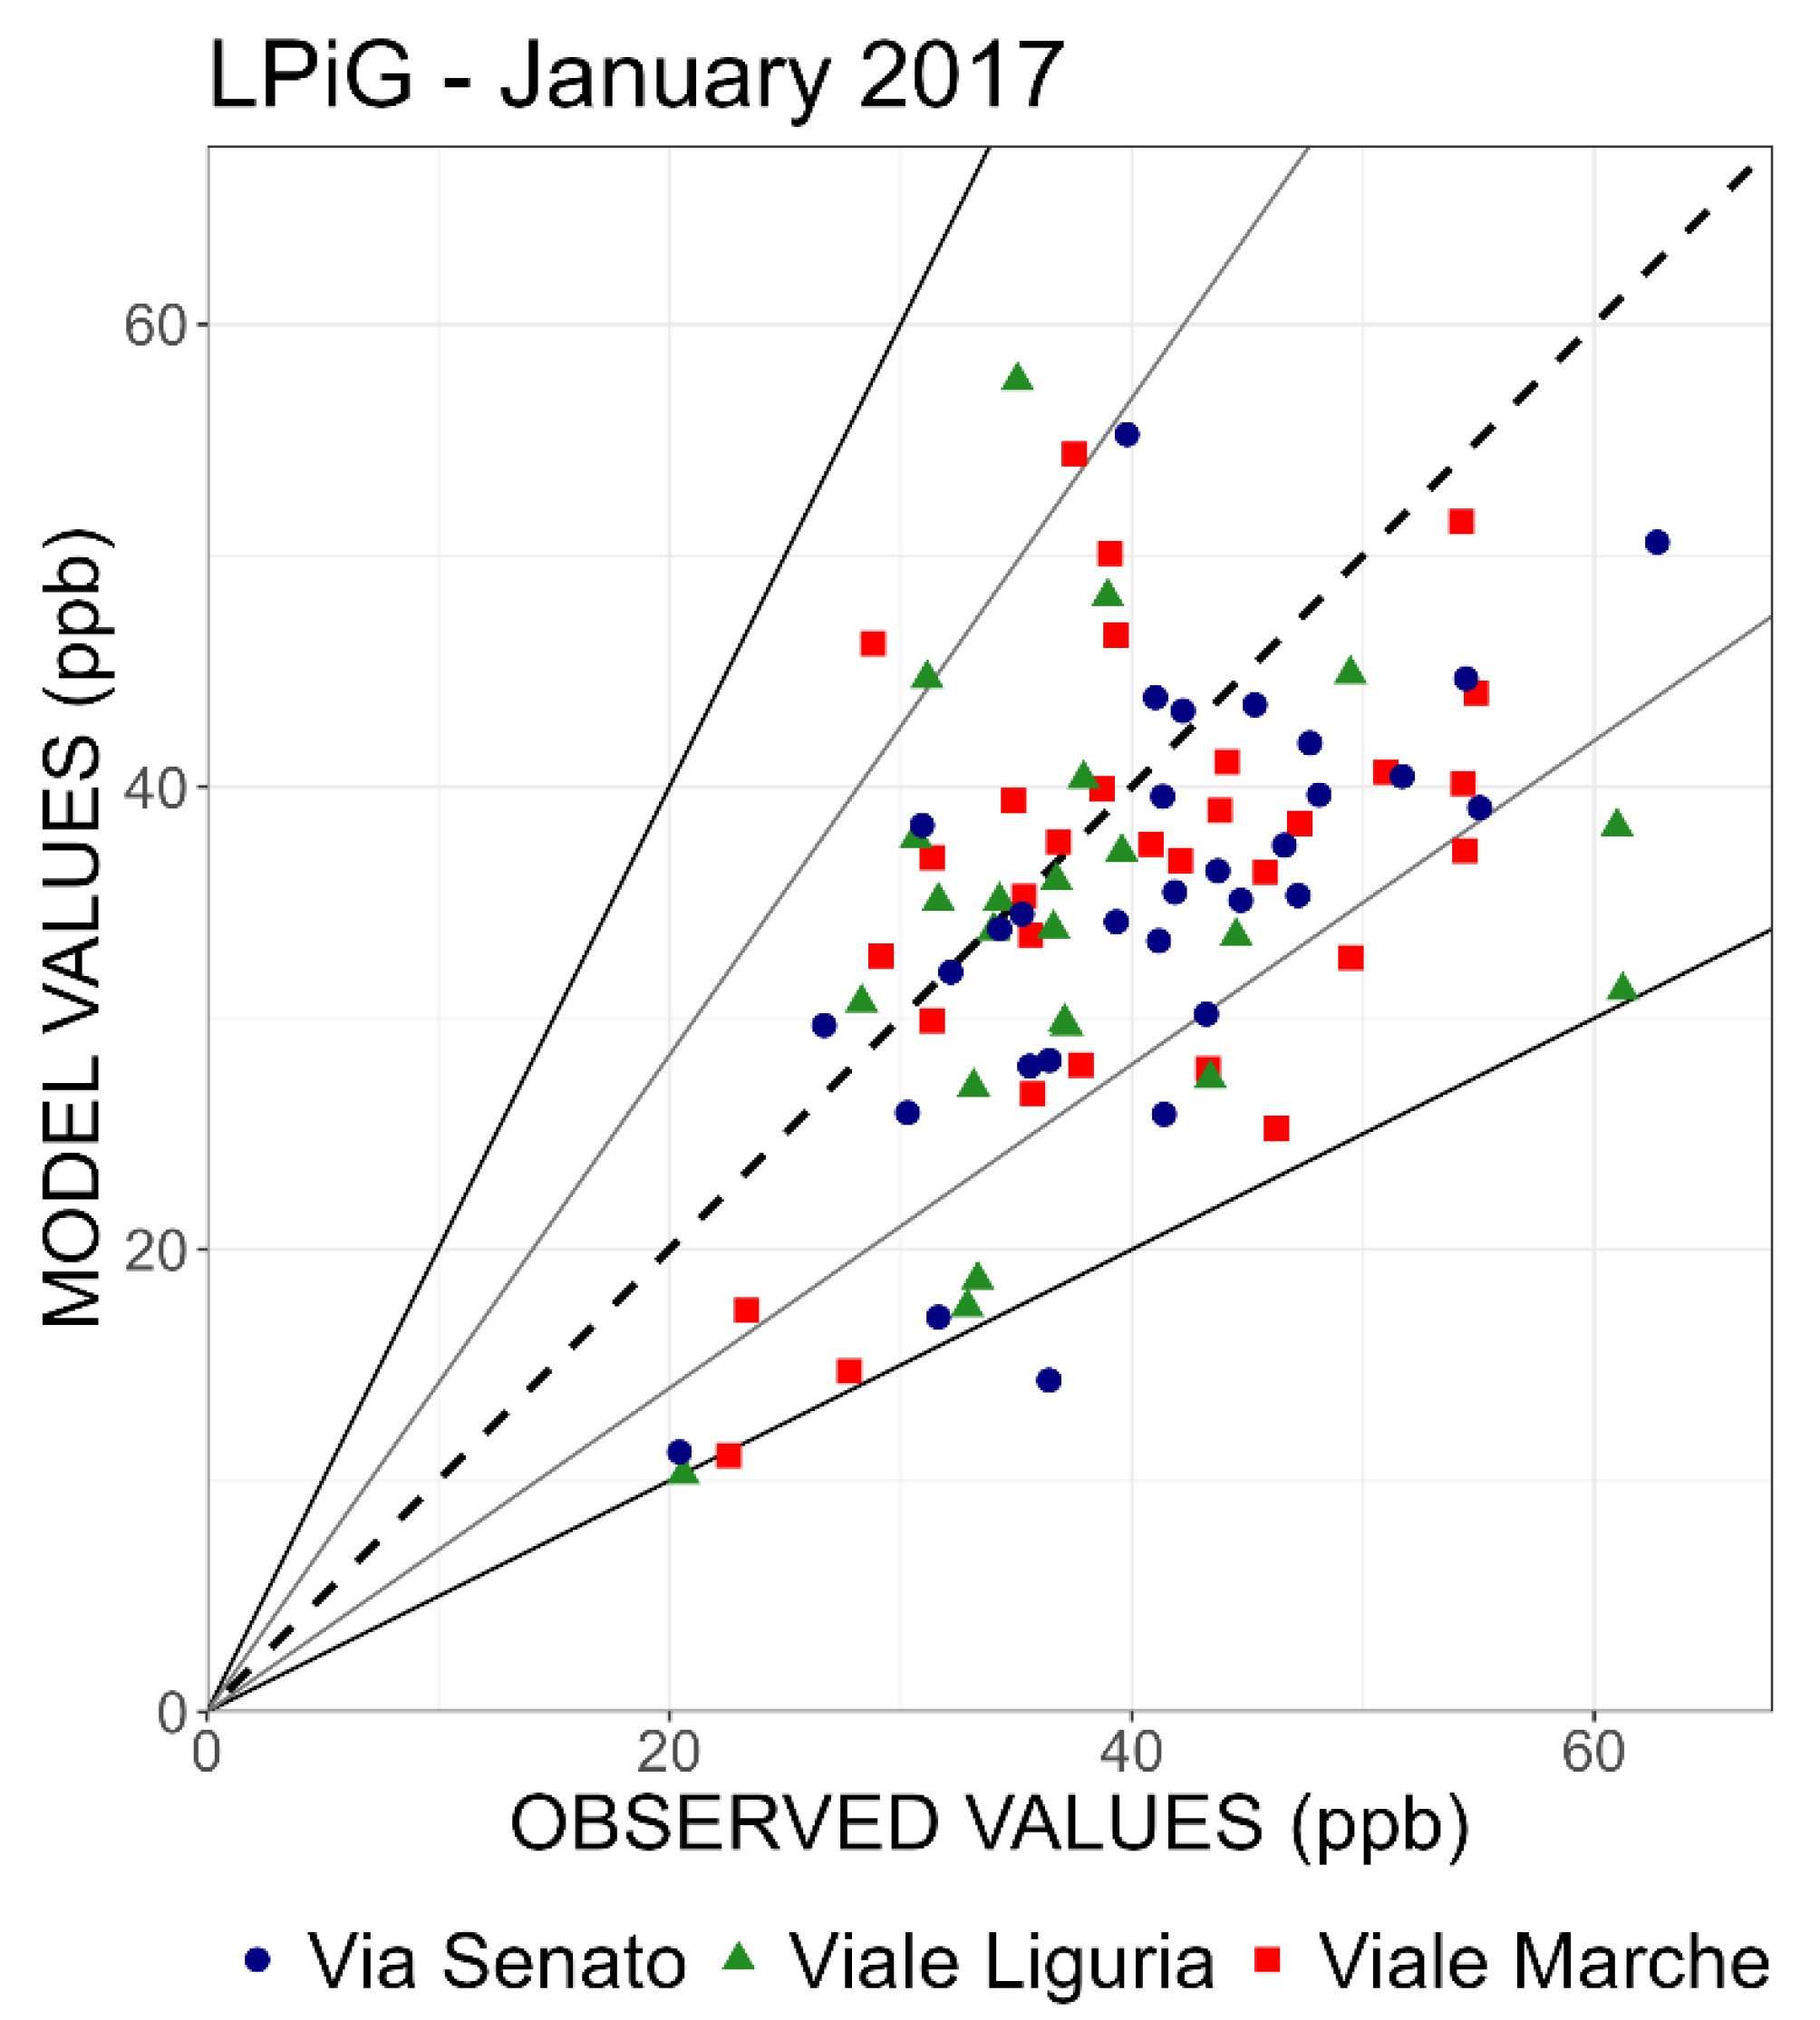
Figure 10.
Time series of hourly NO2 concentrations at the AQ stations of Viale Marche (Site S1: IT0477A), Viale Liguria (Site S2: IT0761A) and Via Senato (Site S3: IT1016A) in January 2017. (Black line: observed values; red line: CAMx-LPiG simulation; green line: CAMx simulation).
Figure 10.
Time series of hourly NO2 concentrations at the AQ stations of Viale Marche (Site S1: IT0477A), Viale Liguria (Site S2: IT0761A) and Via Senato (Site S3: IT1016A) in January 2017. (Black line: observed values; red line: CAMx-LPiG simulation; green line: CAMx simulation).
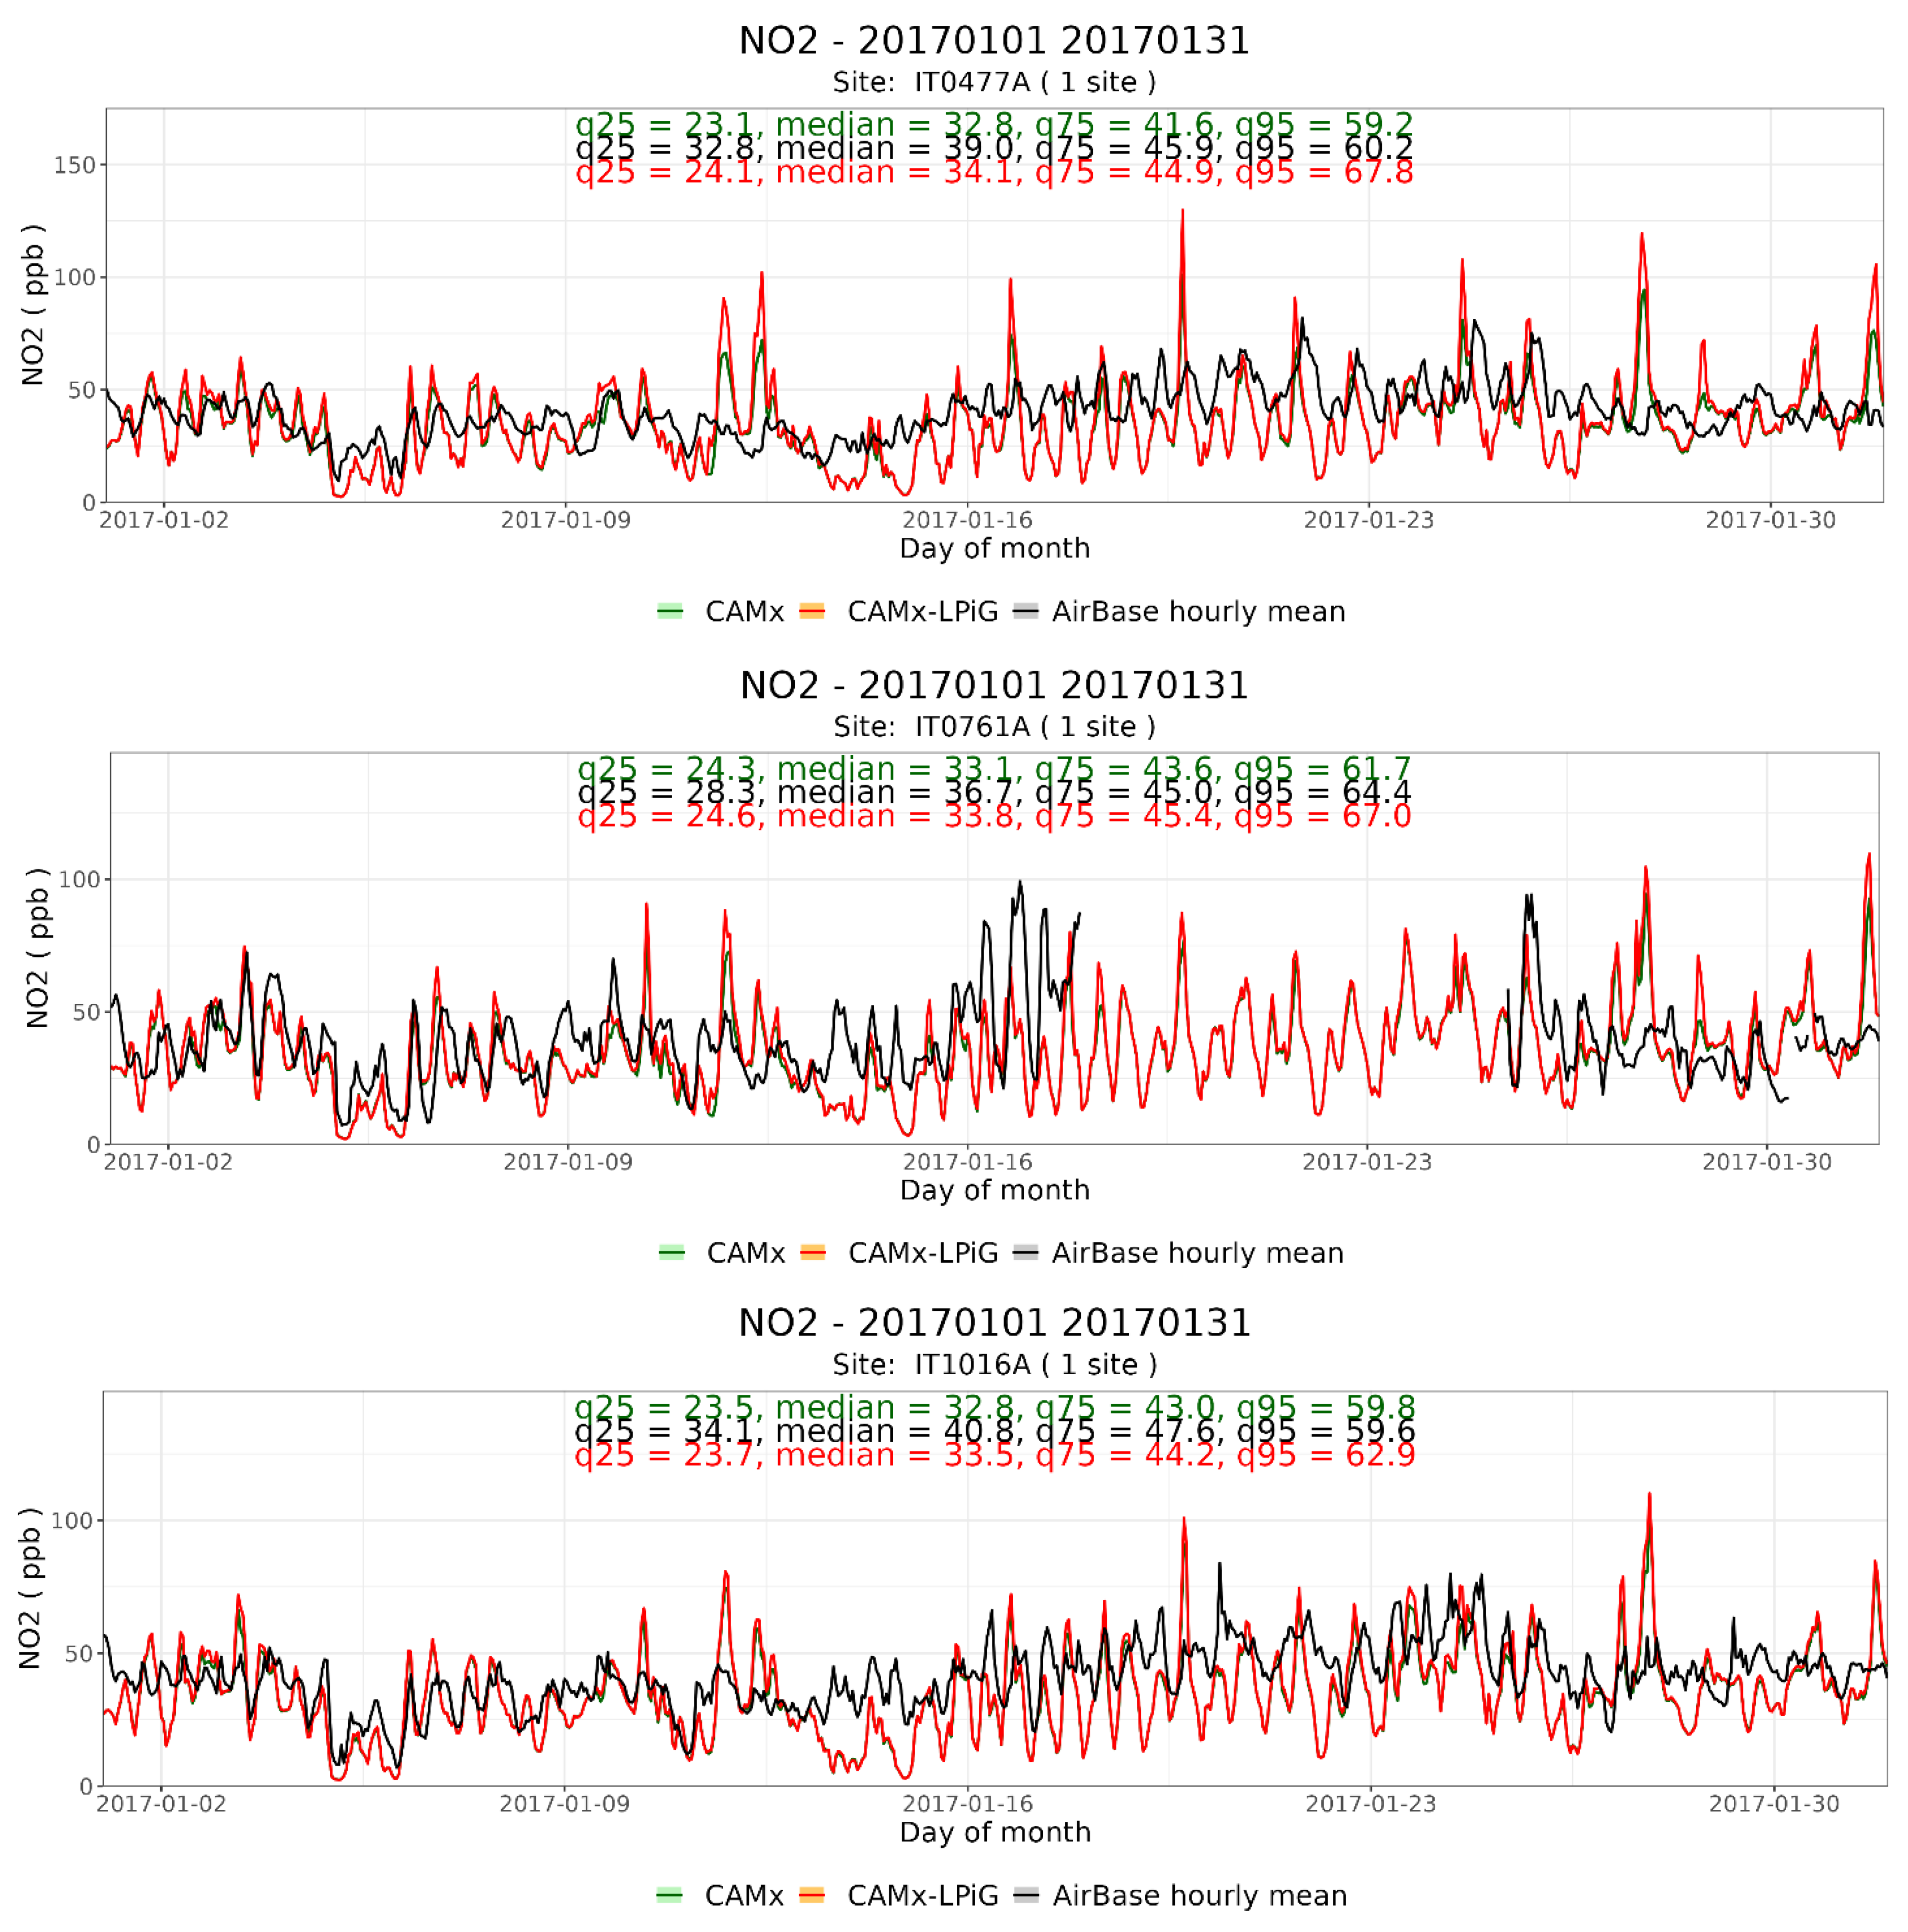
Figure 11.
Scatter plot of Observed vs Modelled NO2 hourly concentrations at the AQ site of Viale Marche, Viale Liguria and Via Senato. The dashed line has a slope of 1, the black lines have a slope of 2 and 0.5 and the grey lines have a slope of 0.7 and 1.42.
Figure 11.
Scatter plot of Observed vs Modelled NO2 hourly concentrations at the AQ site of Viale Marche, Viale Liguria and Via Senato. The dashed line has a slope of 1, the black lines have a slope of 2 and 0.5 and the grey lines have a slope of 0.7 and 1.42.
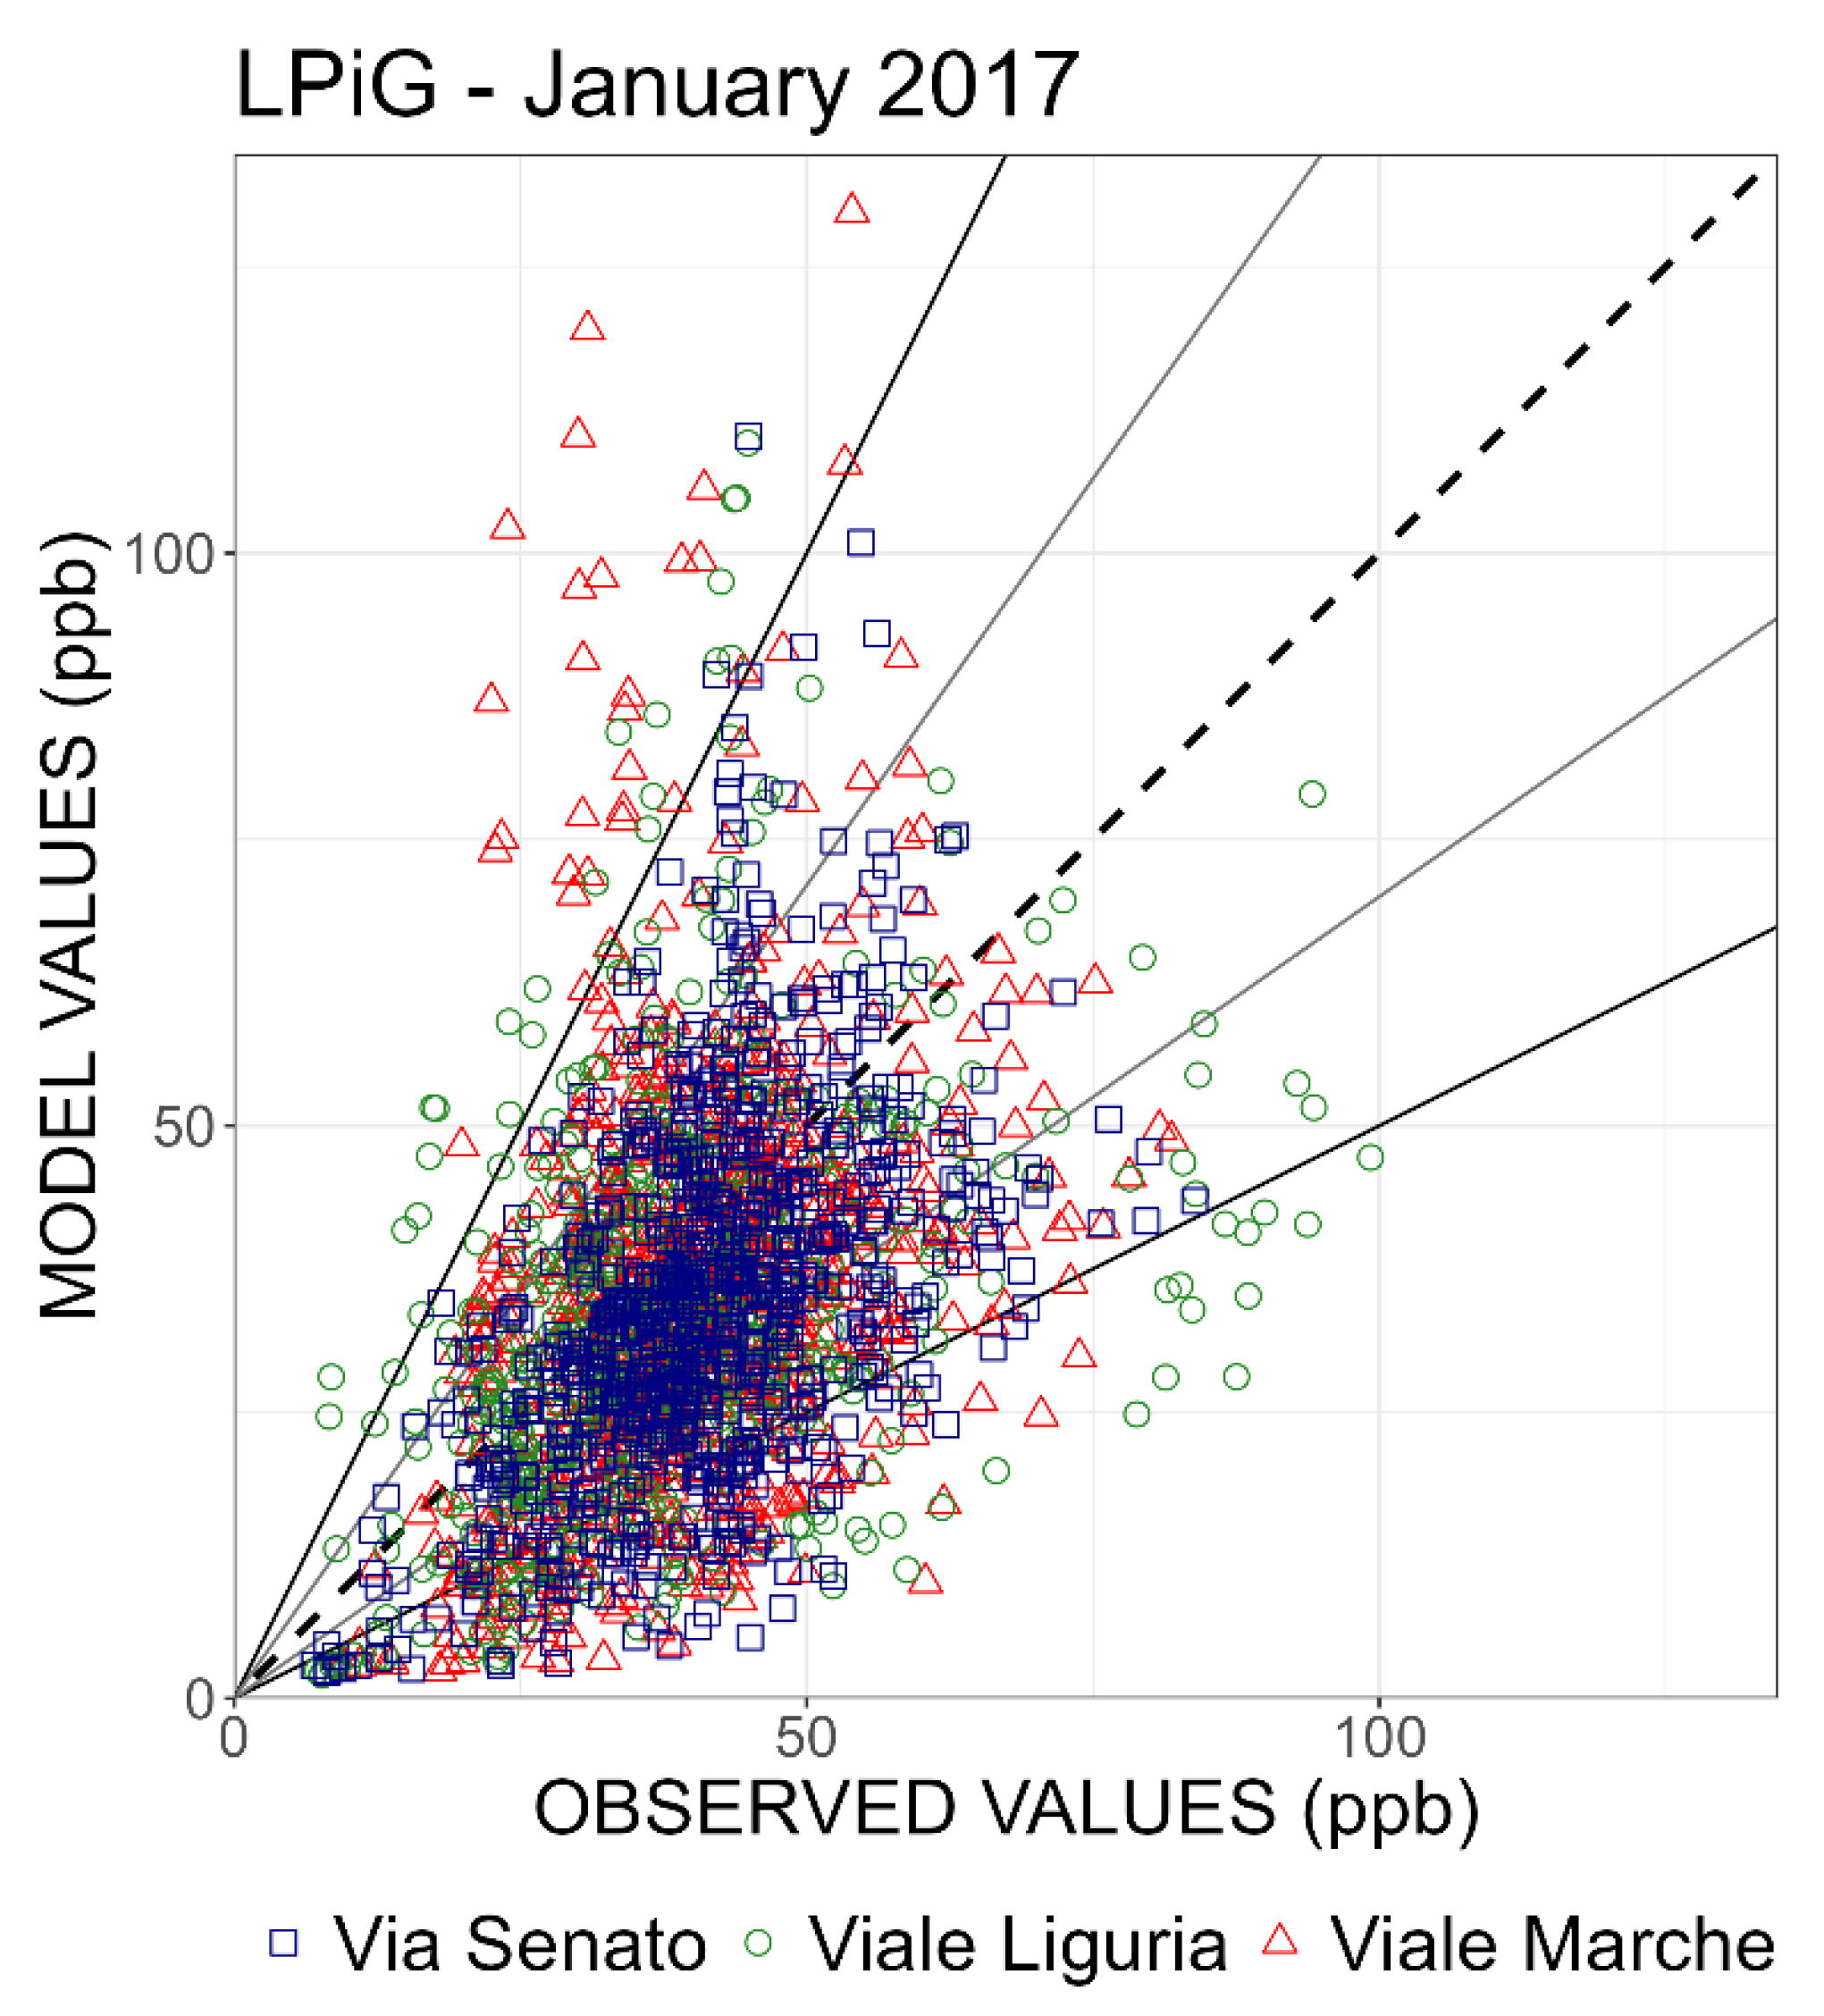
Figure 12.
FAIRMODE target plot for the hourly NO2 concentration at the three monitoring sites in January 2017. The location of the site markers explains whether model error is dominated by bias, correlation, or standard deviation.
Figure 12.
FAIRMODE target plot for the hourly NO2 concentration at the three monitoring sites in January 2017. The location of the site markers explains whether model error is dominated by bias, correlation, or standard deviation.
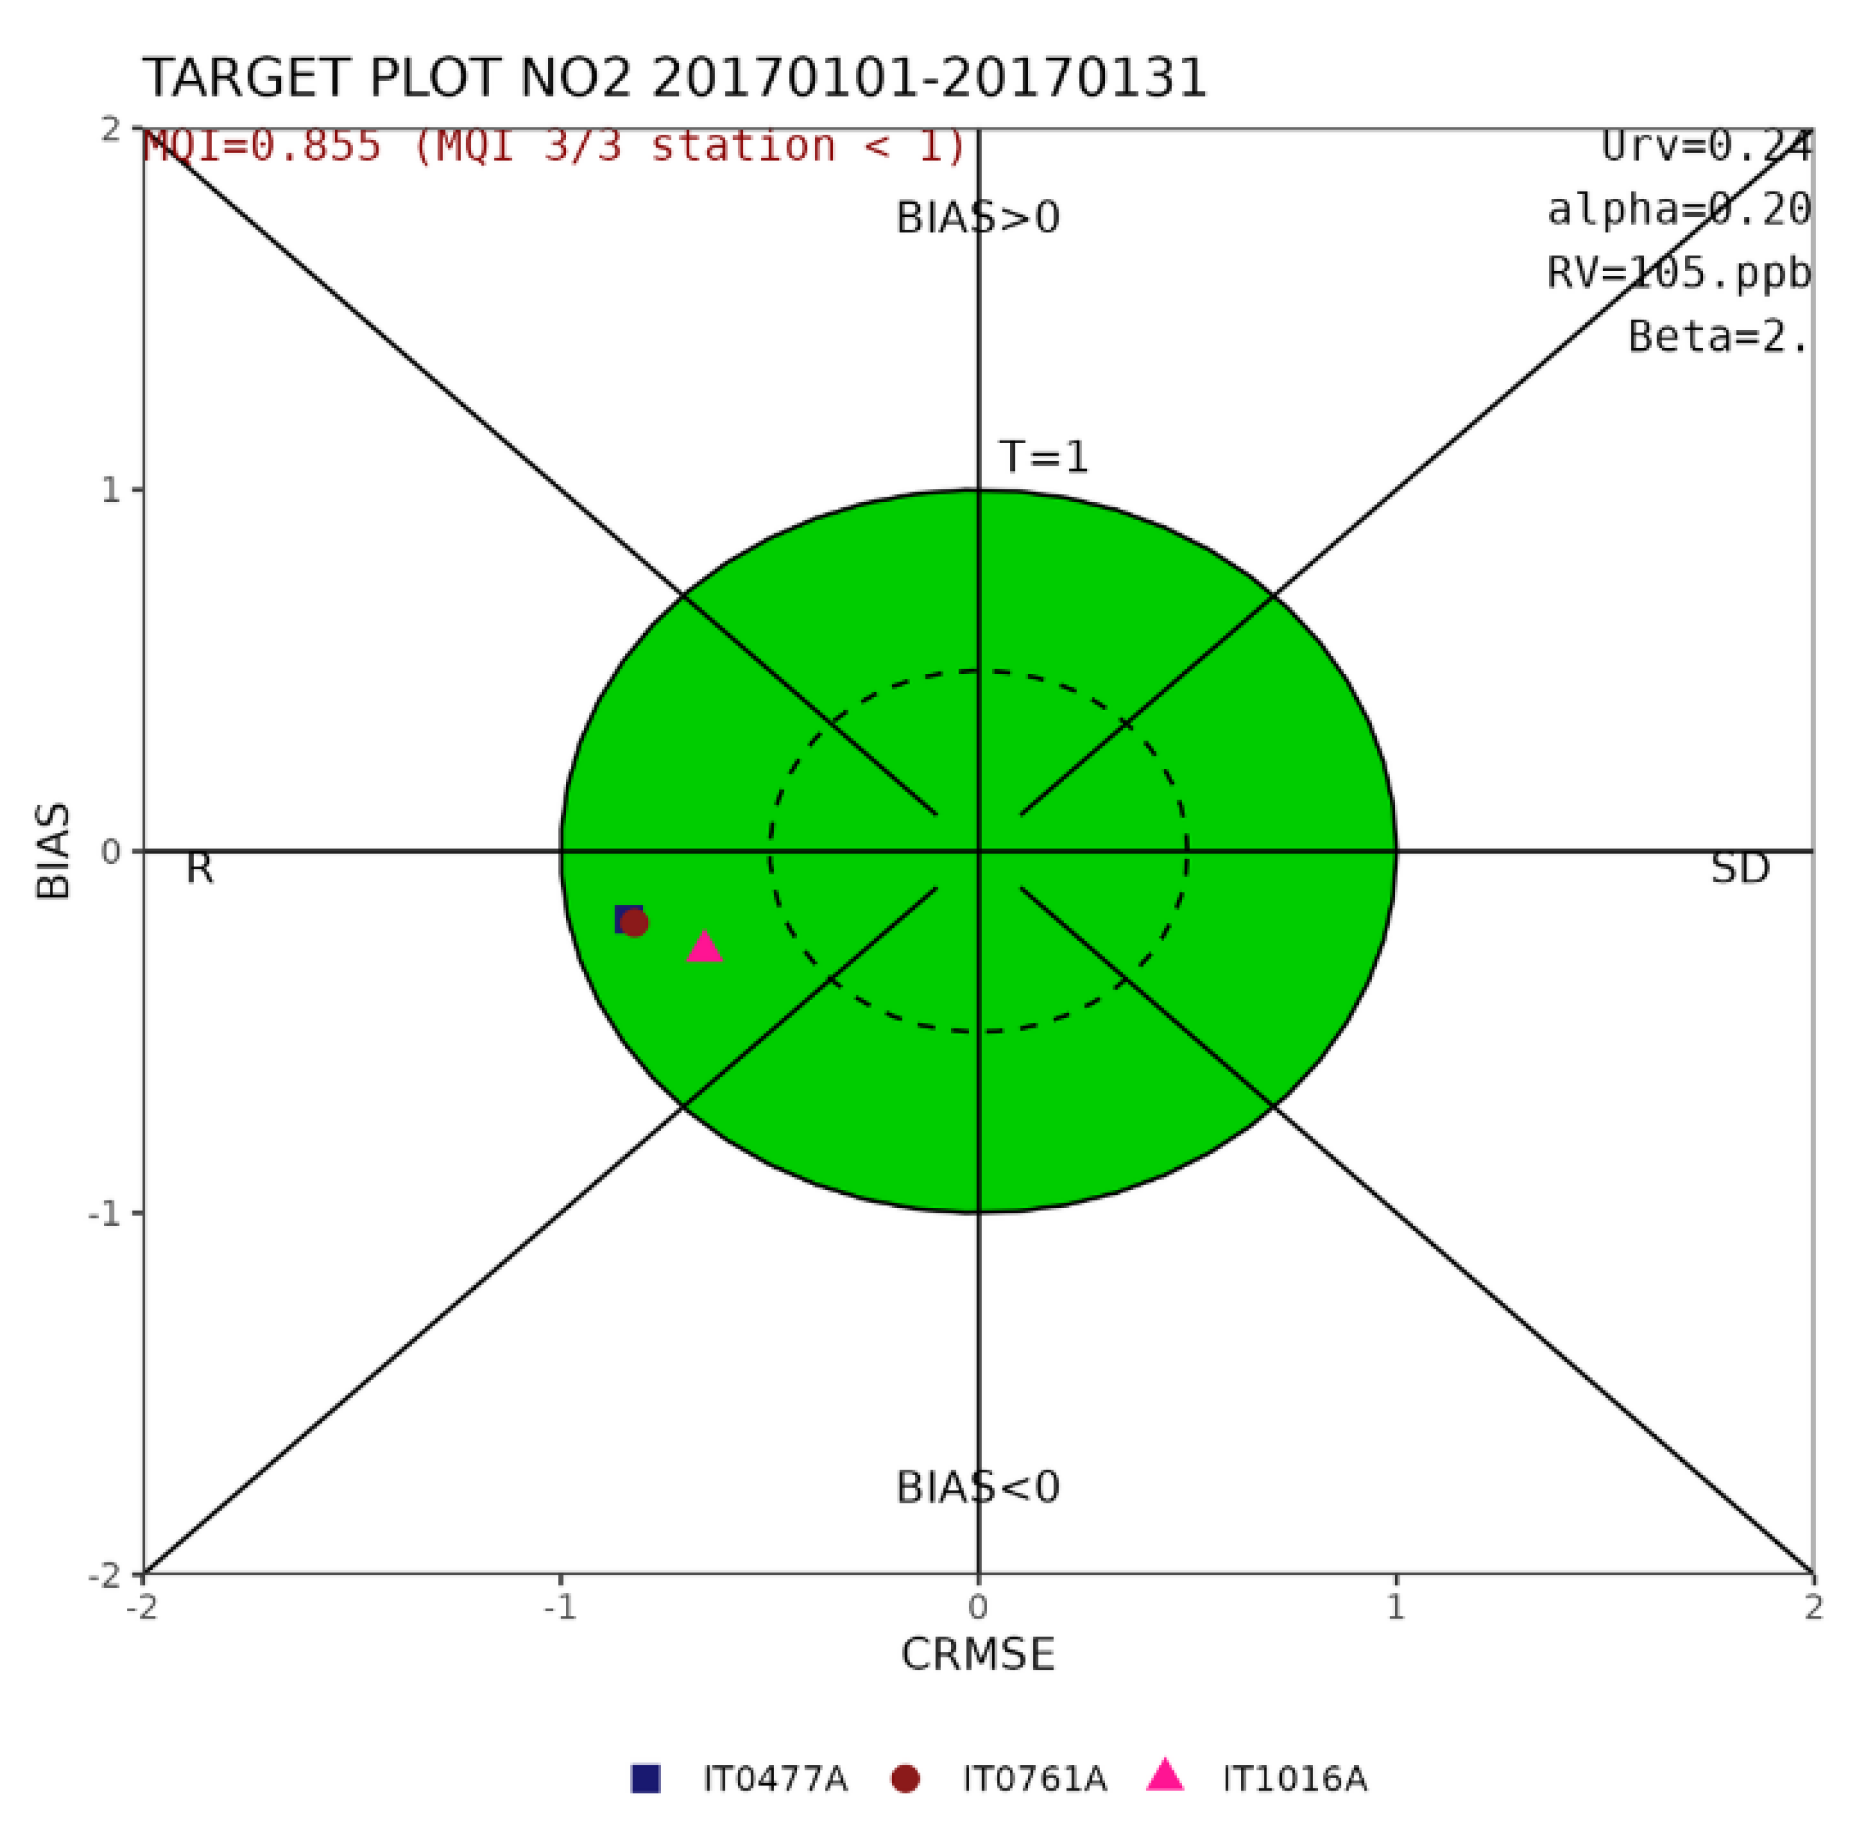
Figure 13.
Hourly NO2 concentration time series for the AQ stations of Viale Marche (S1: IT0477A), Viale Liguria (S2: IT0761A) and Via Senato (S3: IT1016A) for January 2017. The black line represents the observed value, the red line represents the CAMX LPiG simulation, and the green line represent the CAMx simulation. The boxes top and bottom values are the first and third quartiles.
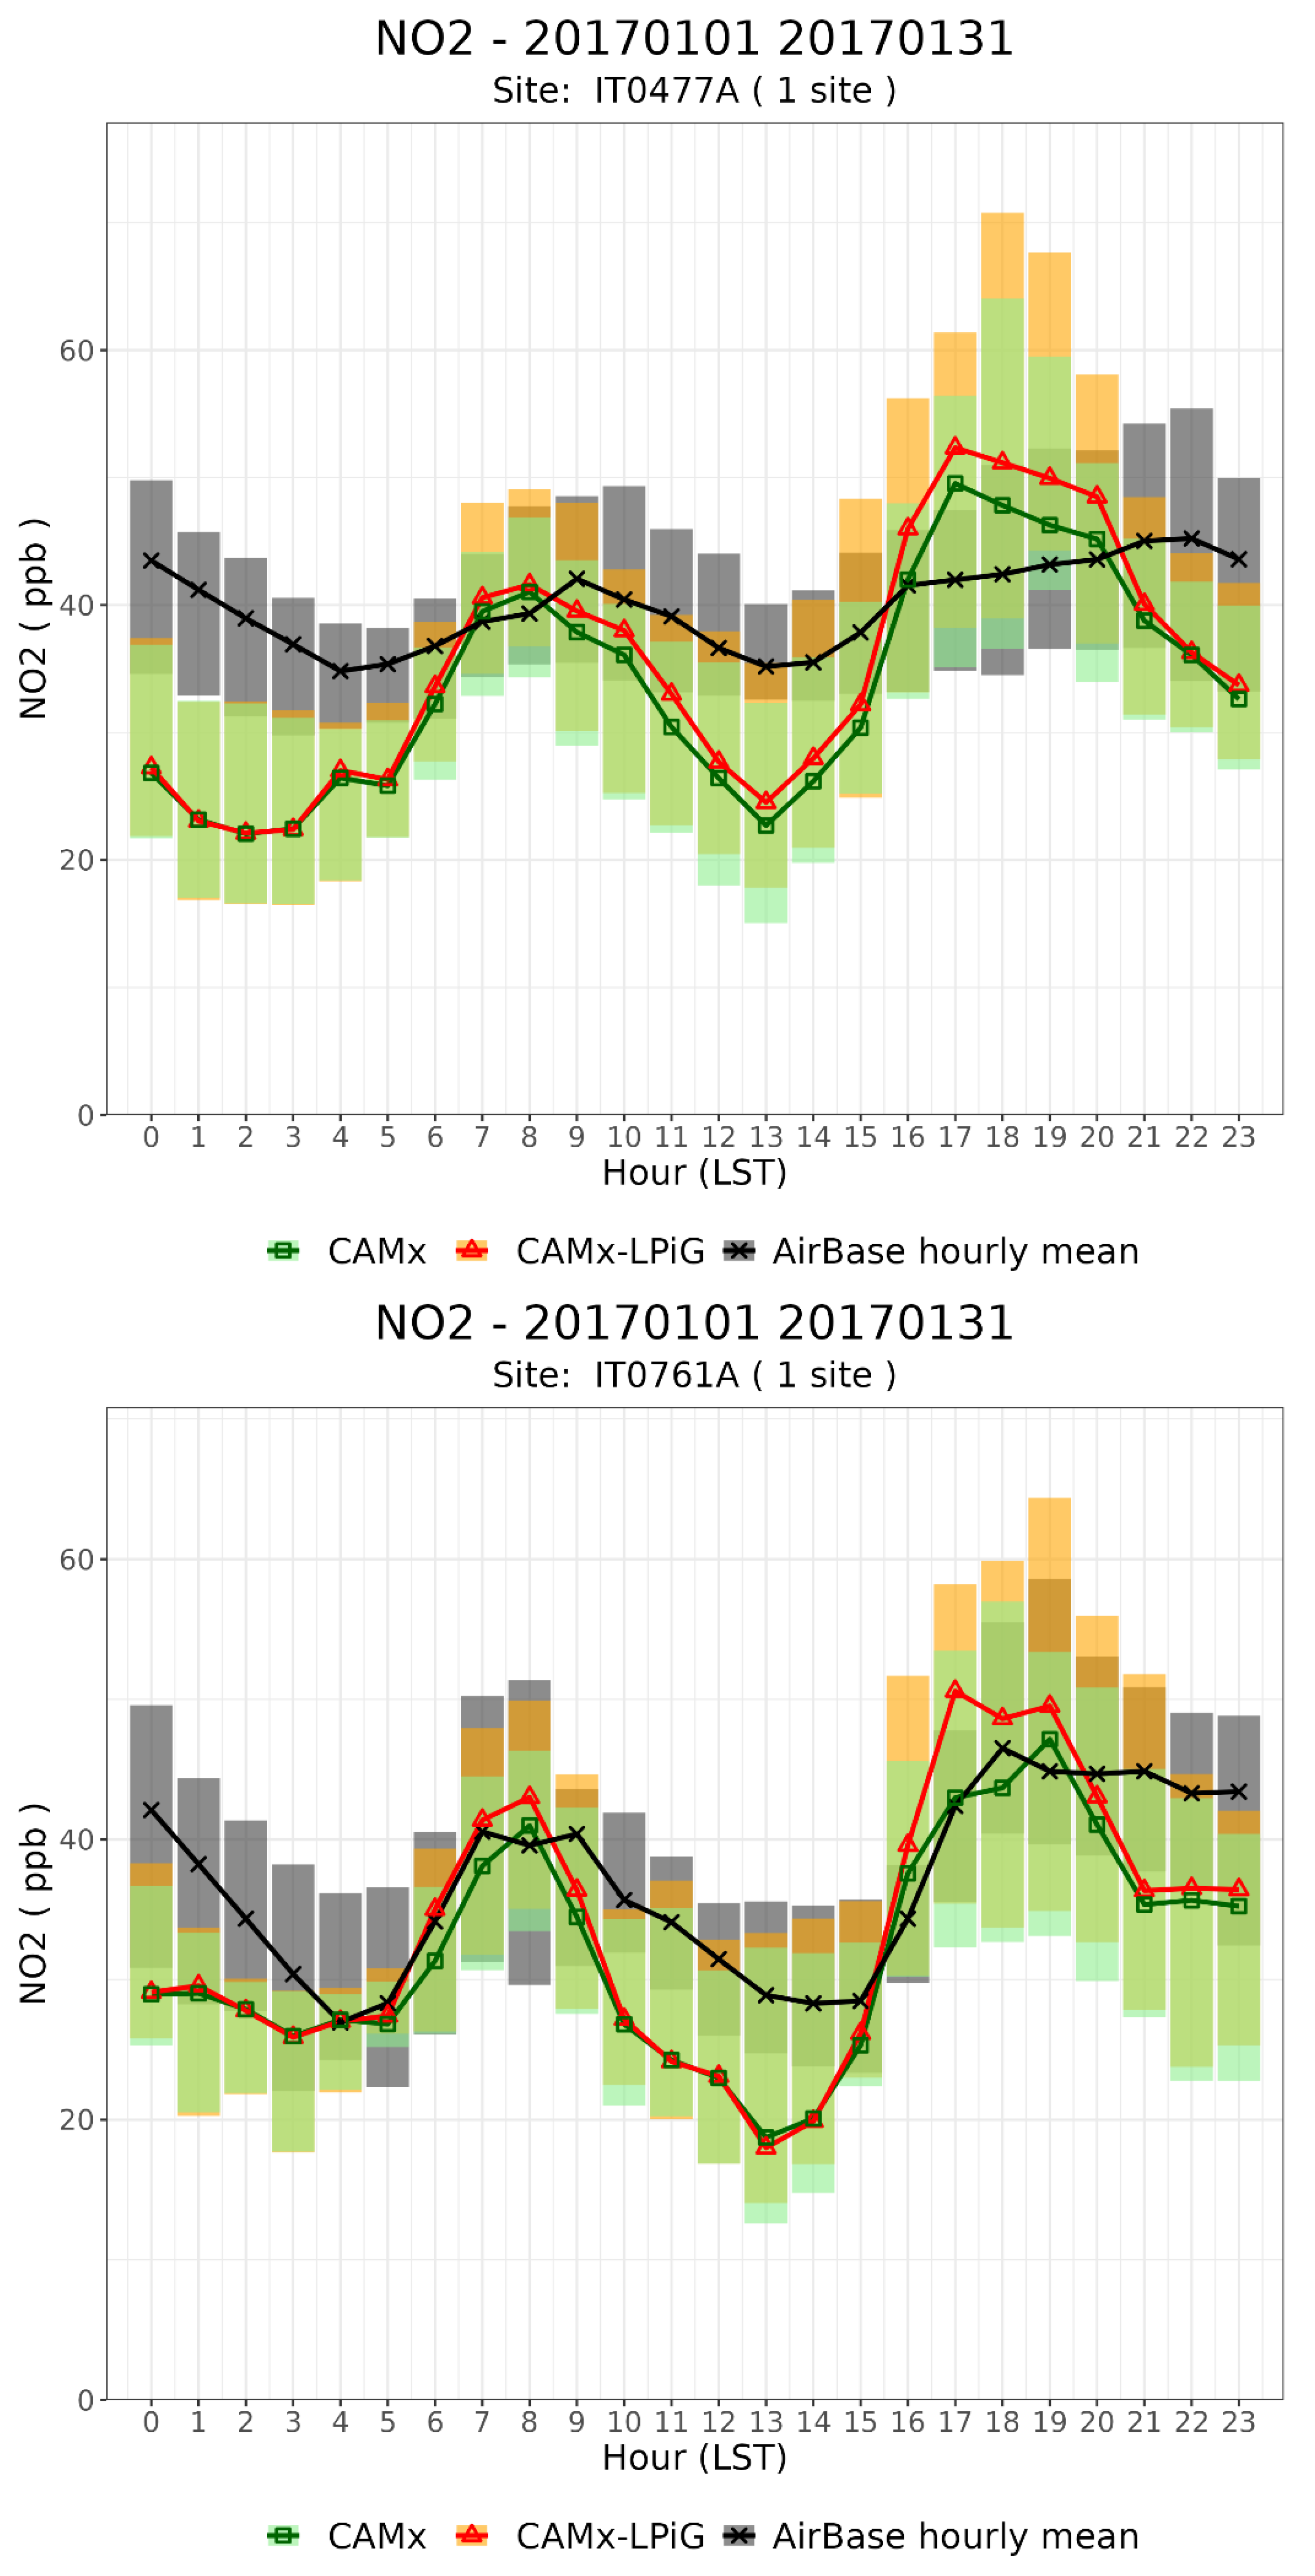
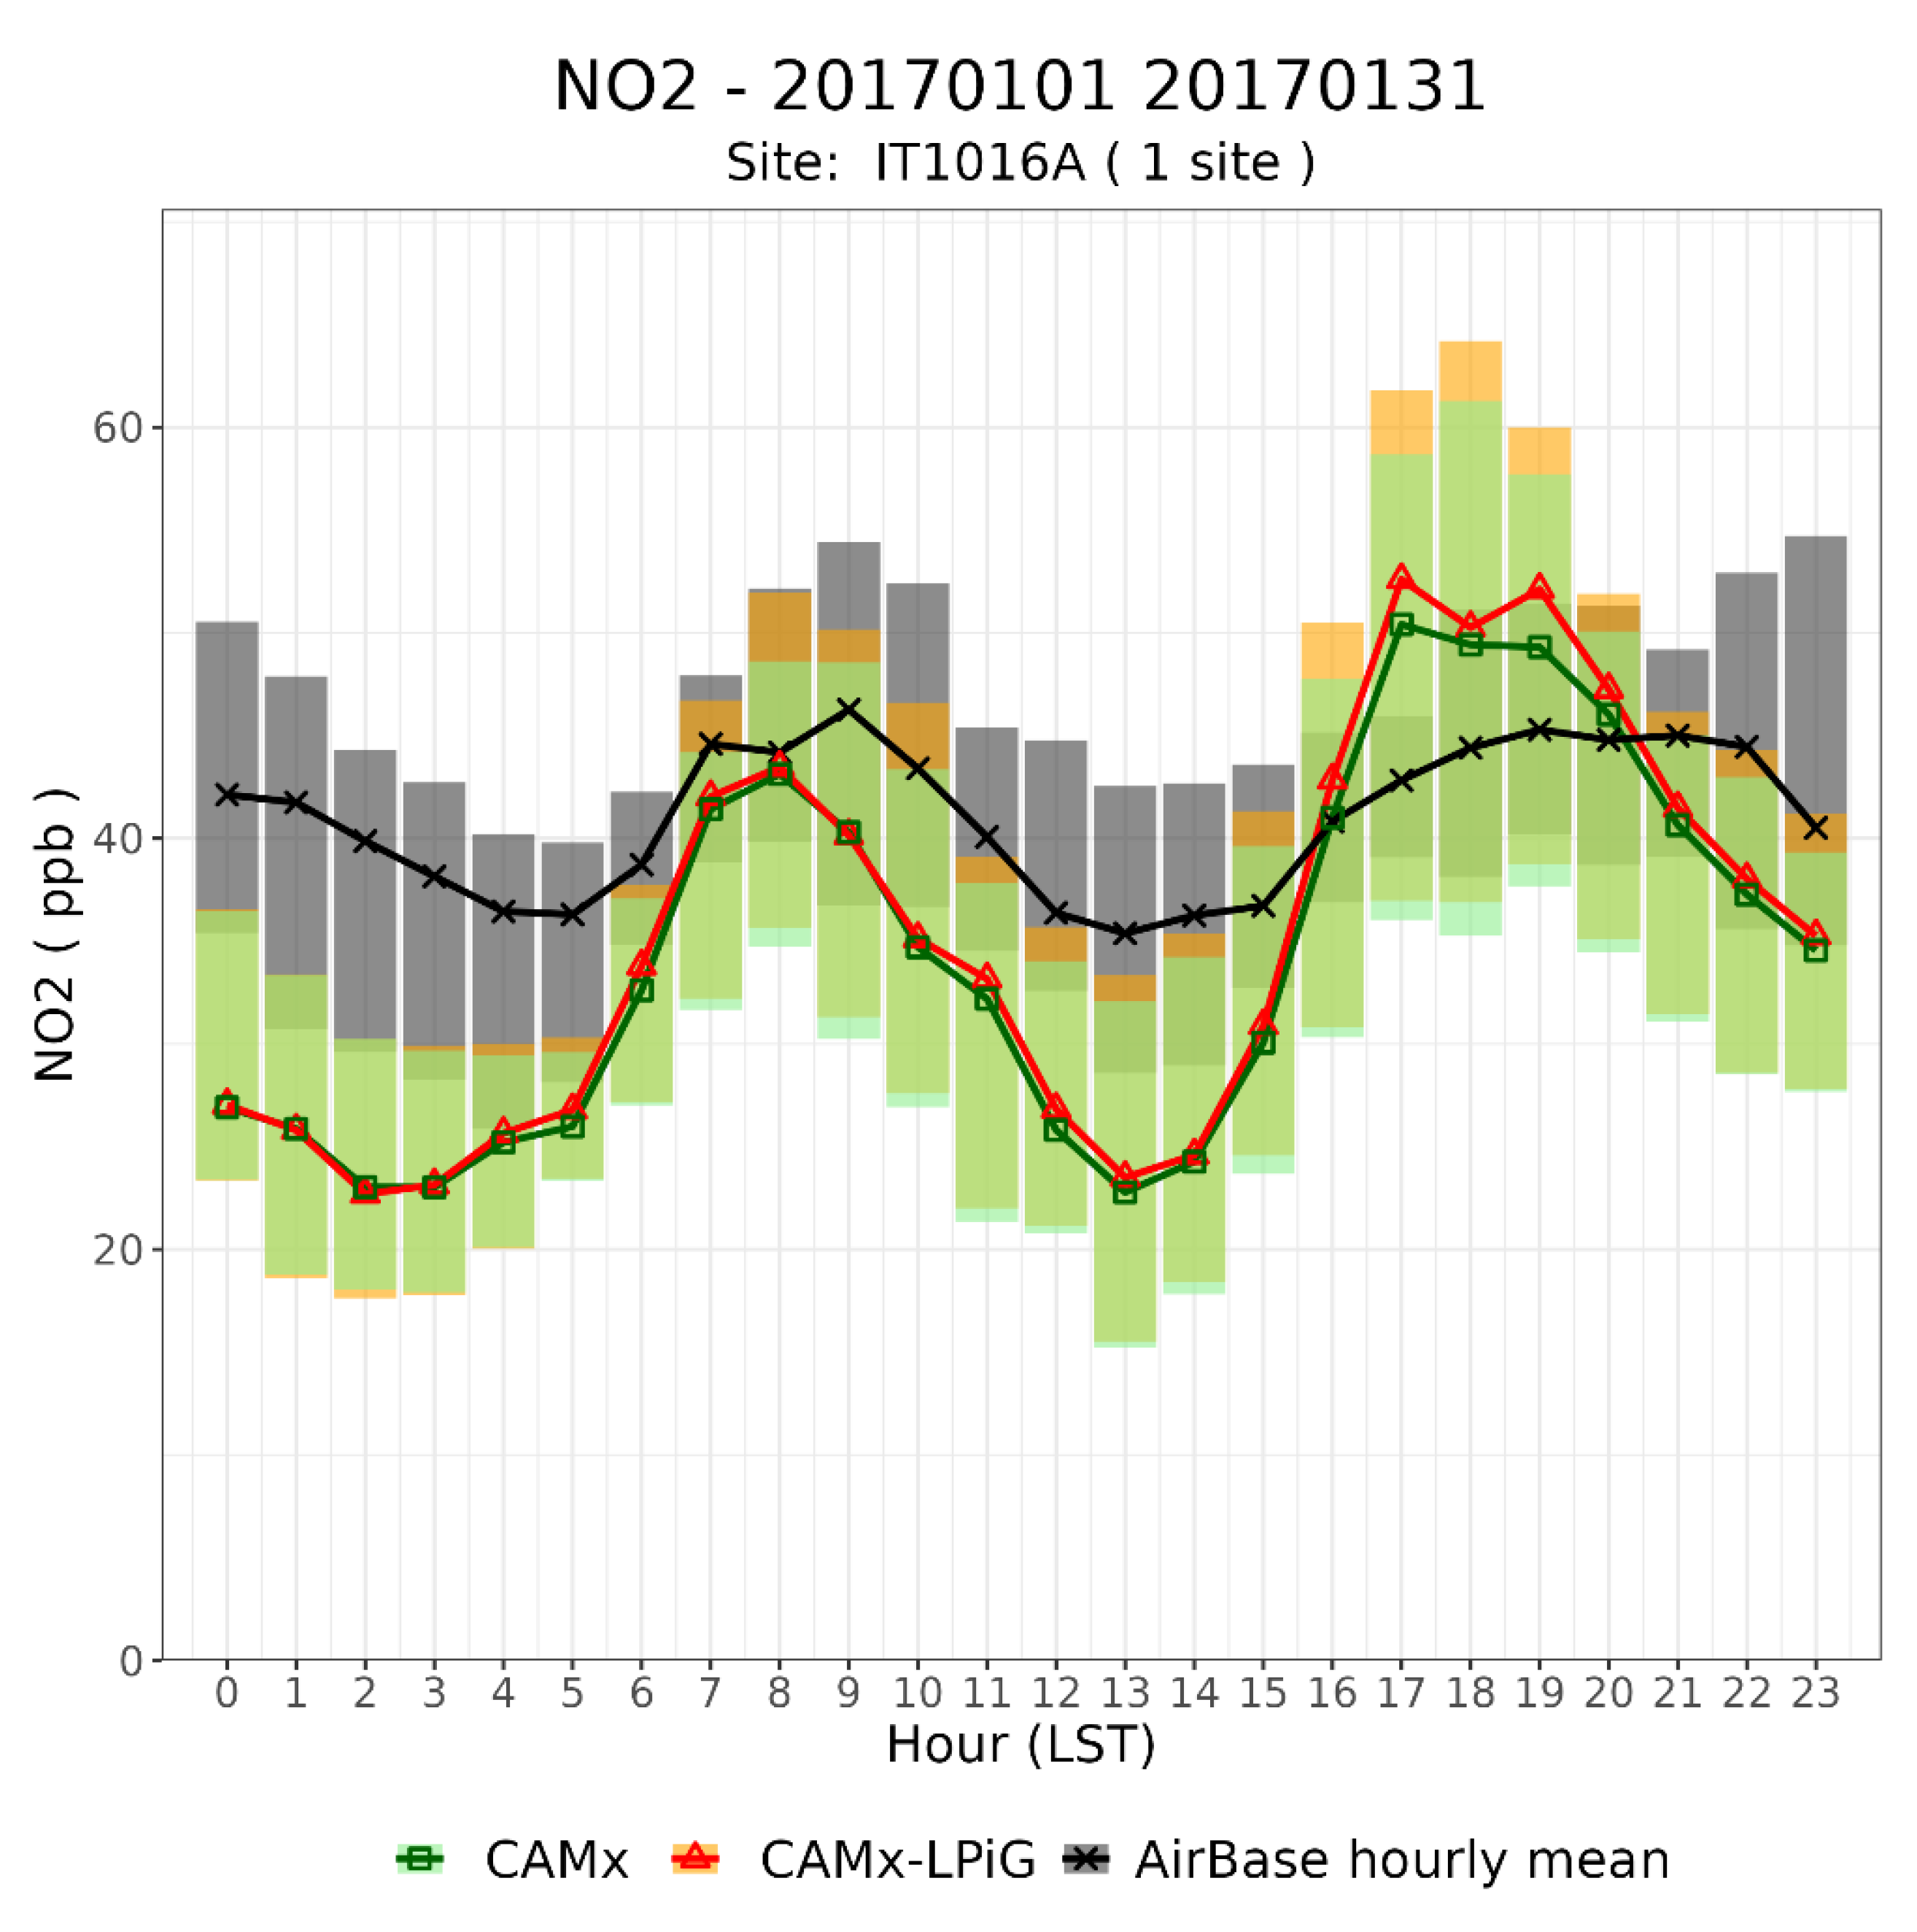
Figure 14.
Validation of hourly meteorological fields (Wind Speed, Mixing Ratio, Temperature and Precipitation) at the available meteorological stations of Milan city centre. Observations are depicted in black (OBS) while model values are depicted in red (MOD). Statistical parameters are reported in the figures (FAC2: Factor of two, MB: Mean Bias, r: Pearson’s correlation coefficient, and IOA: Index of Agreement).
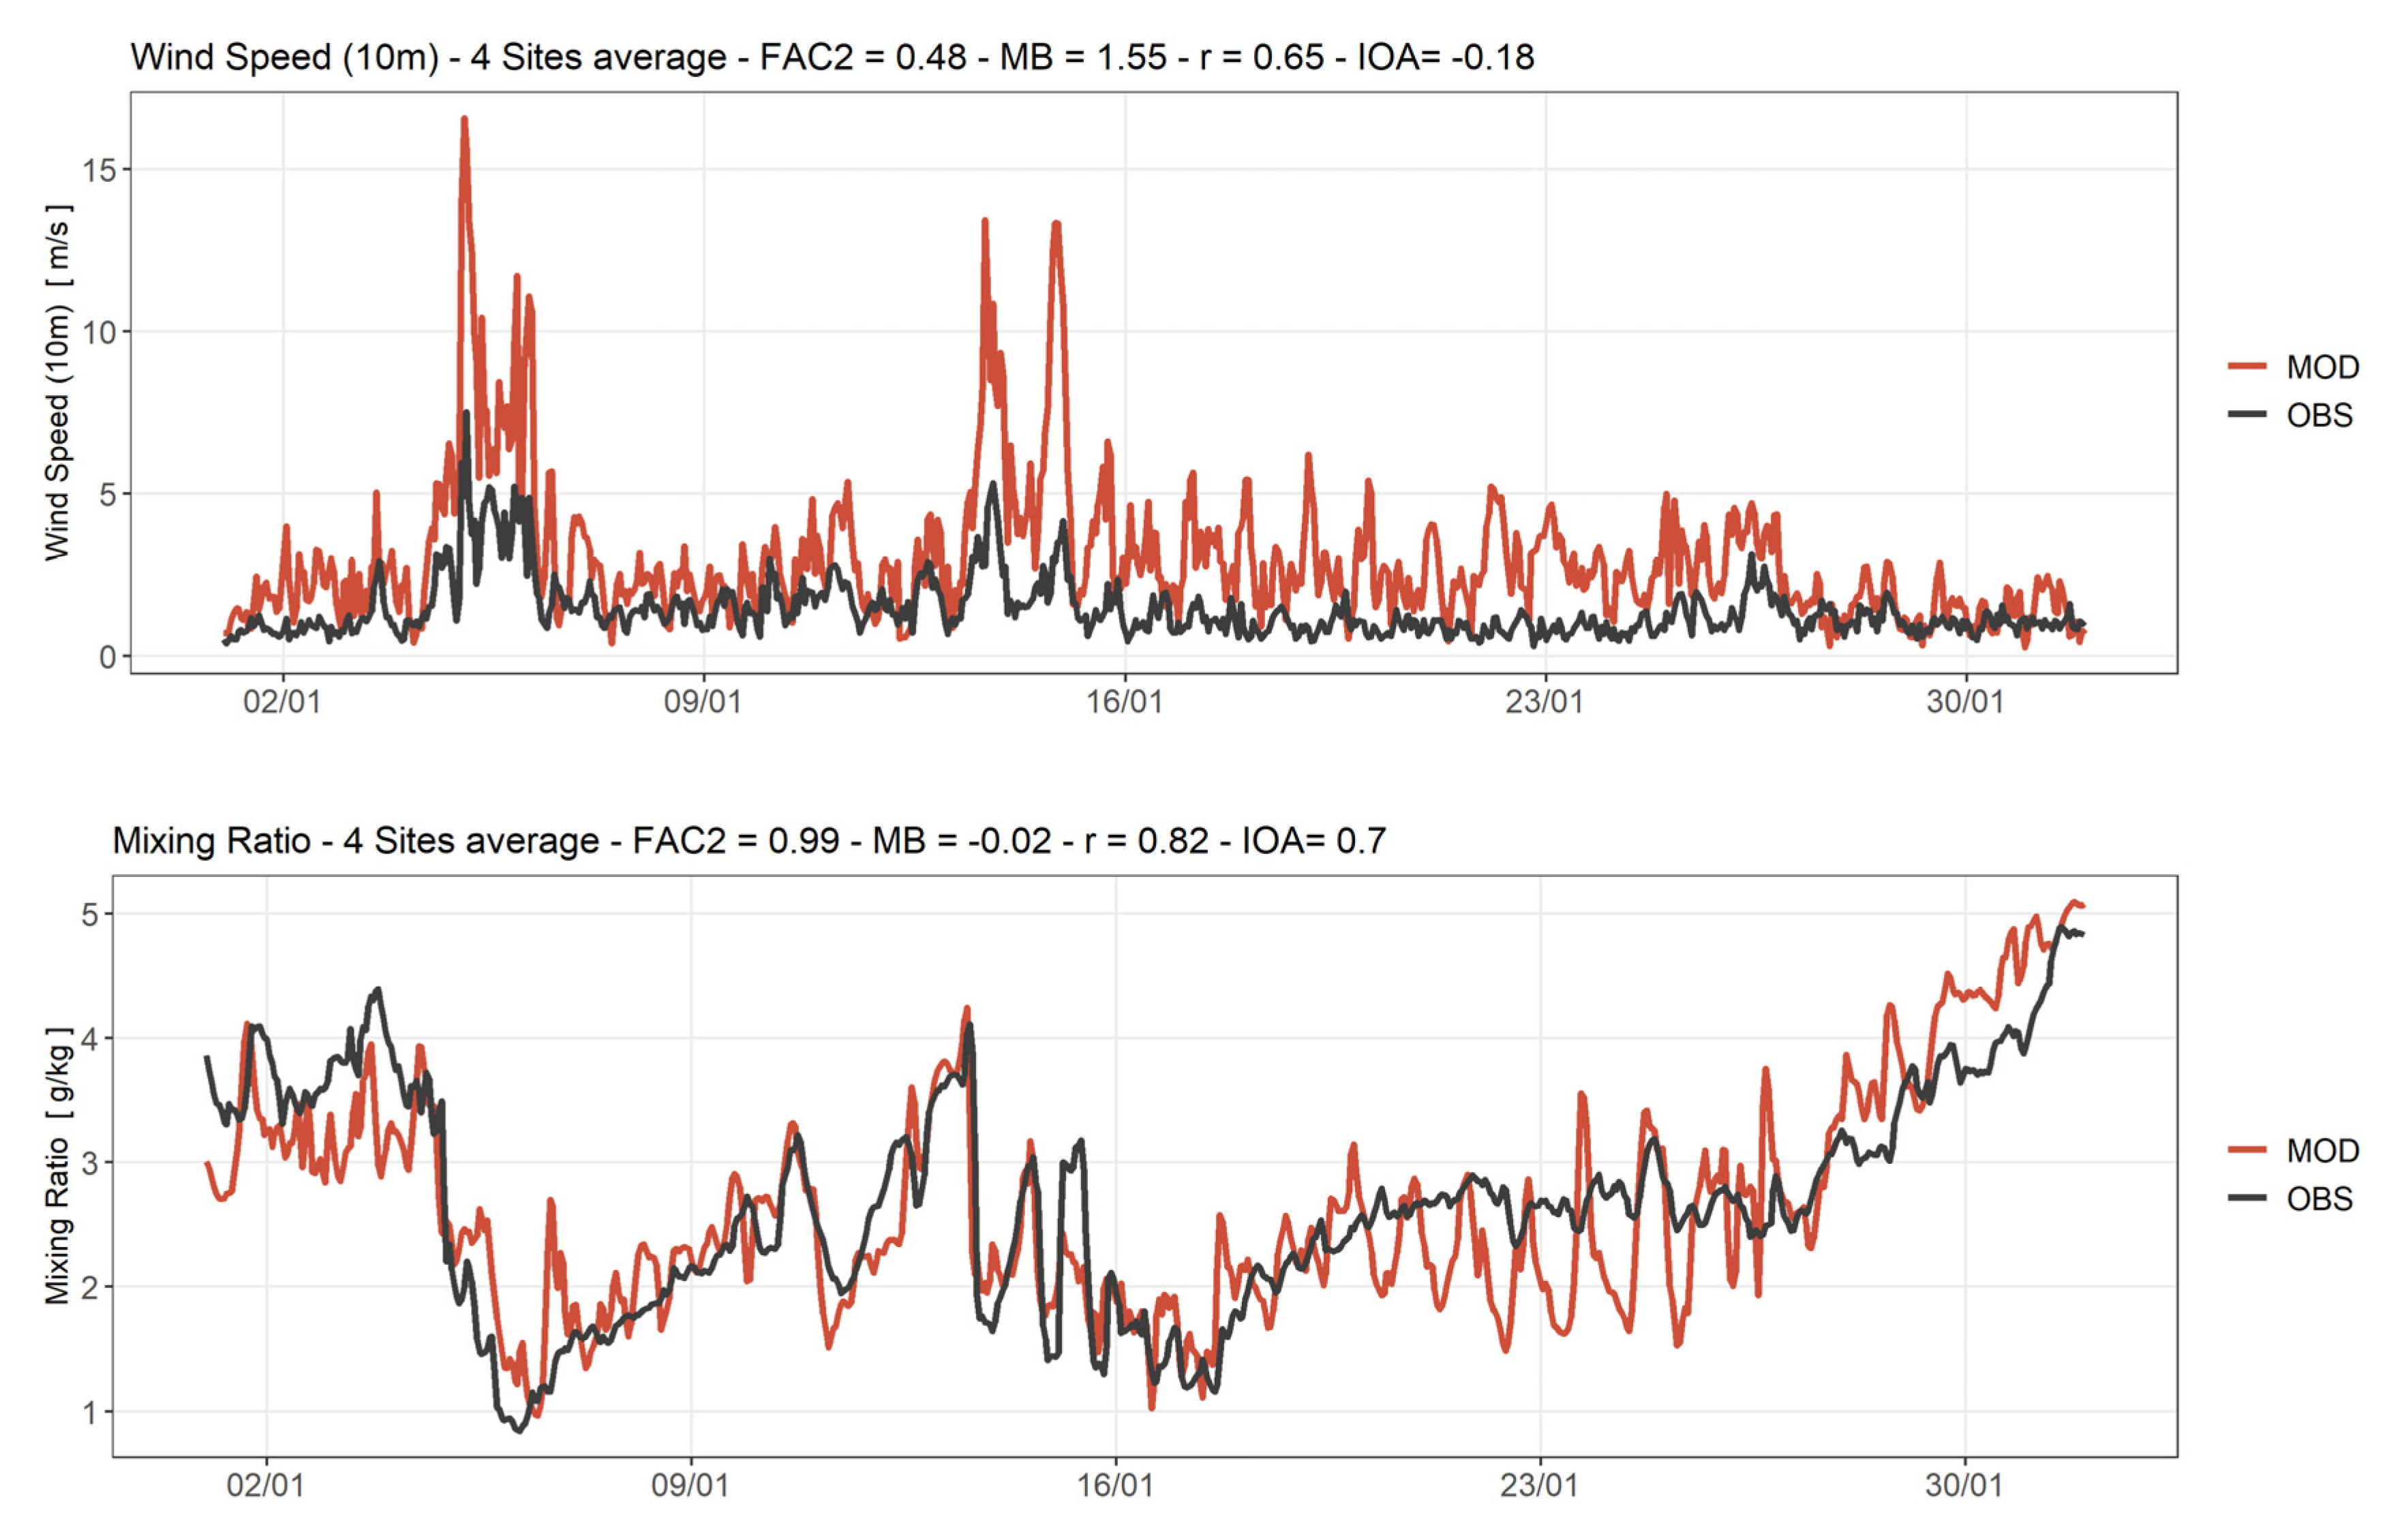
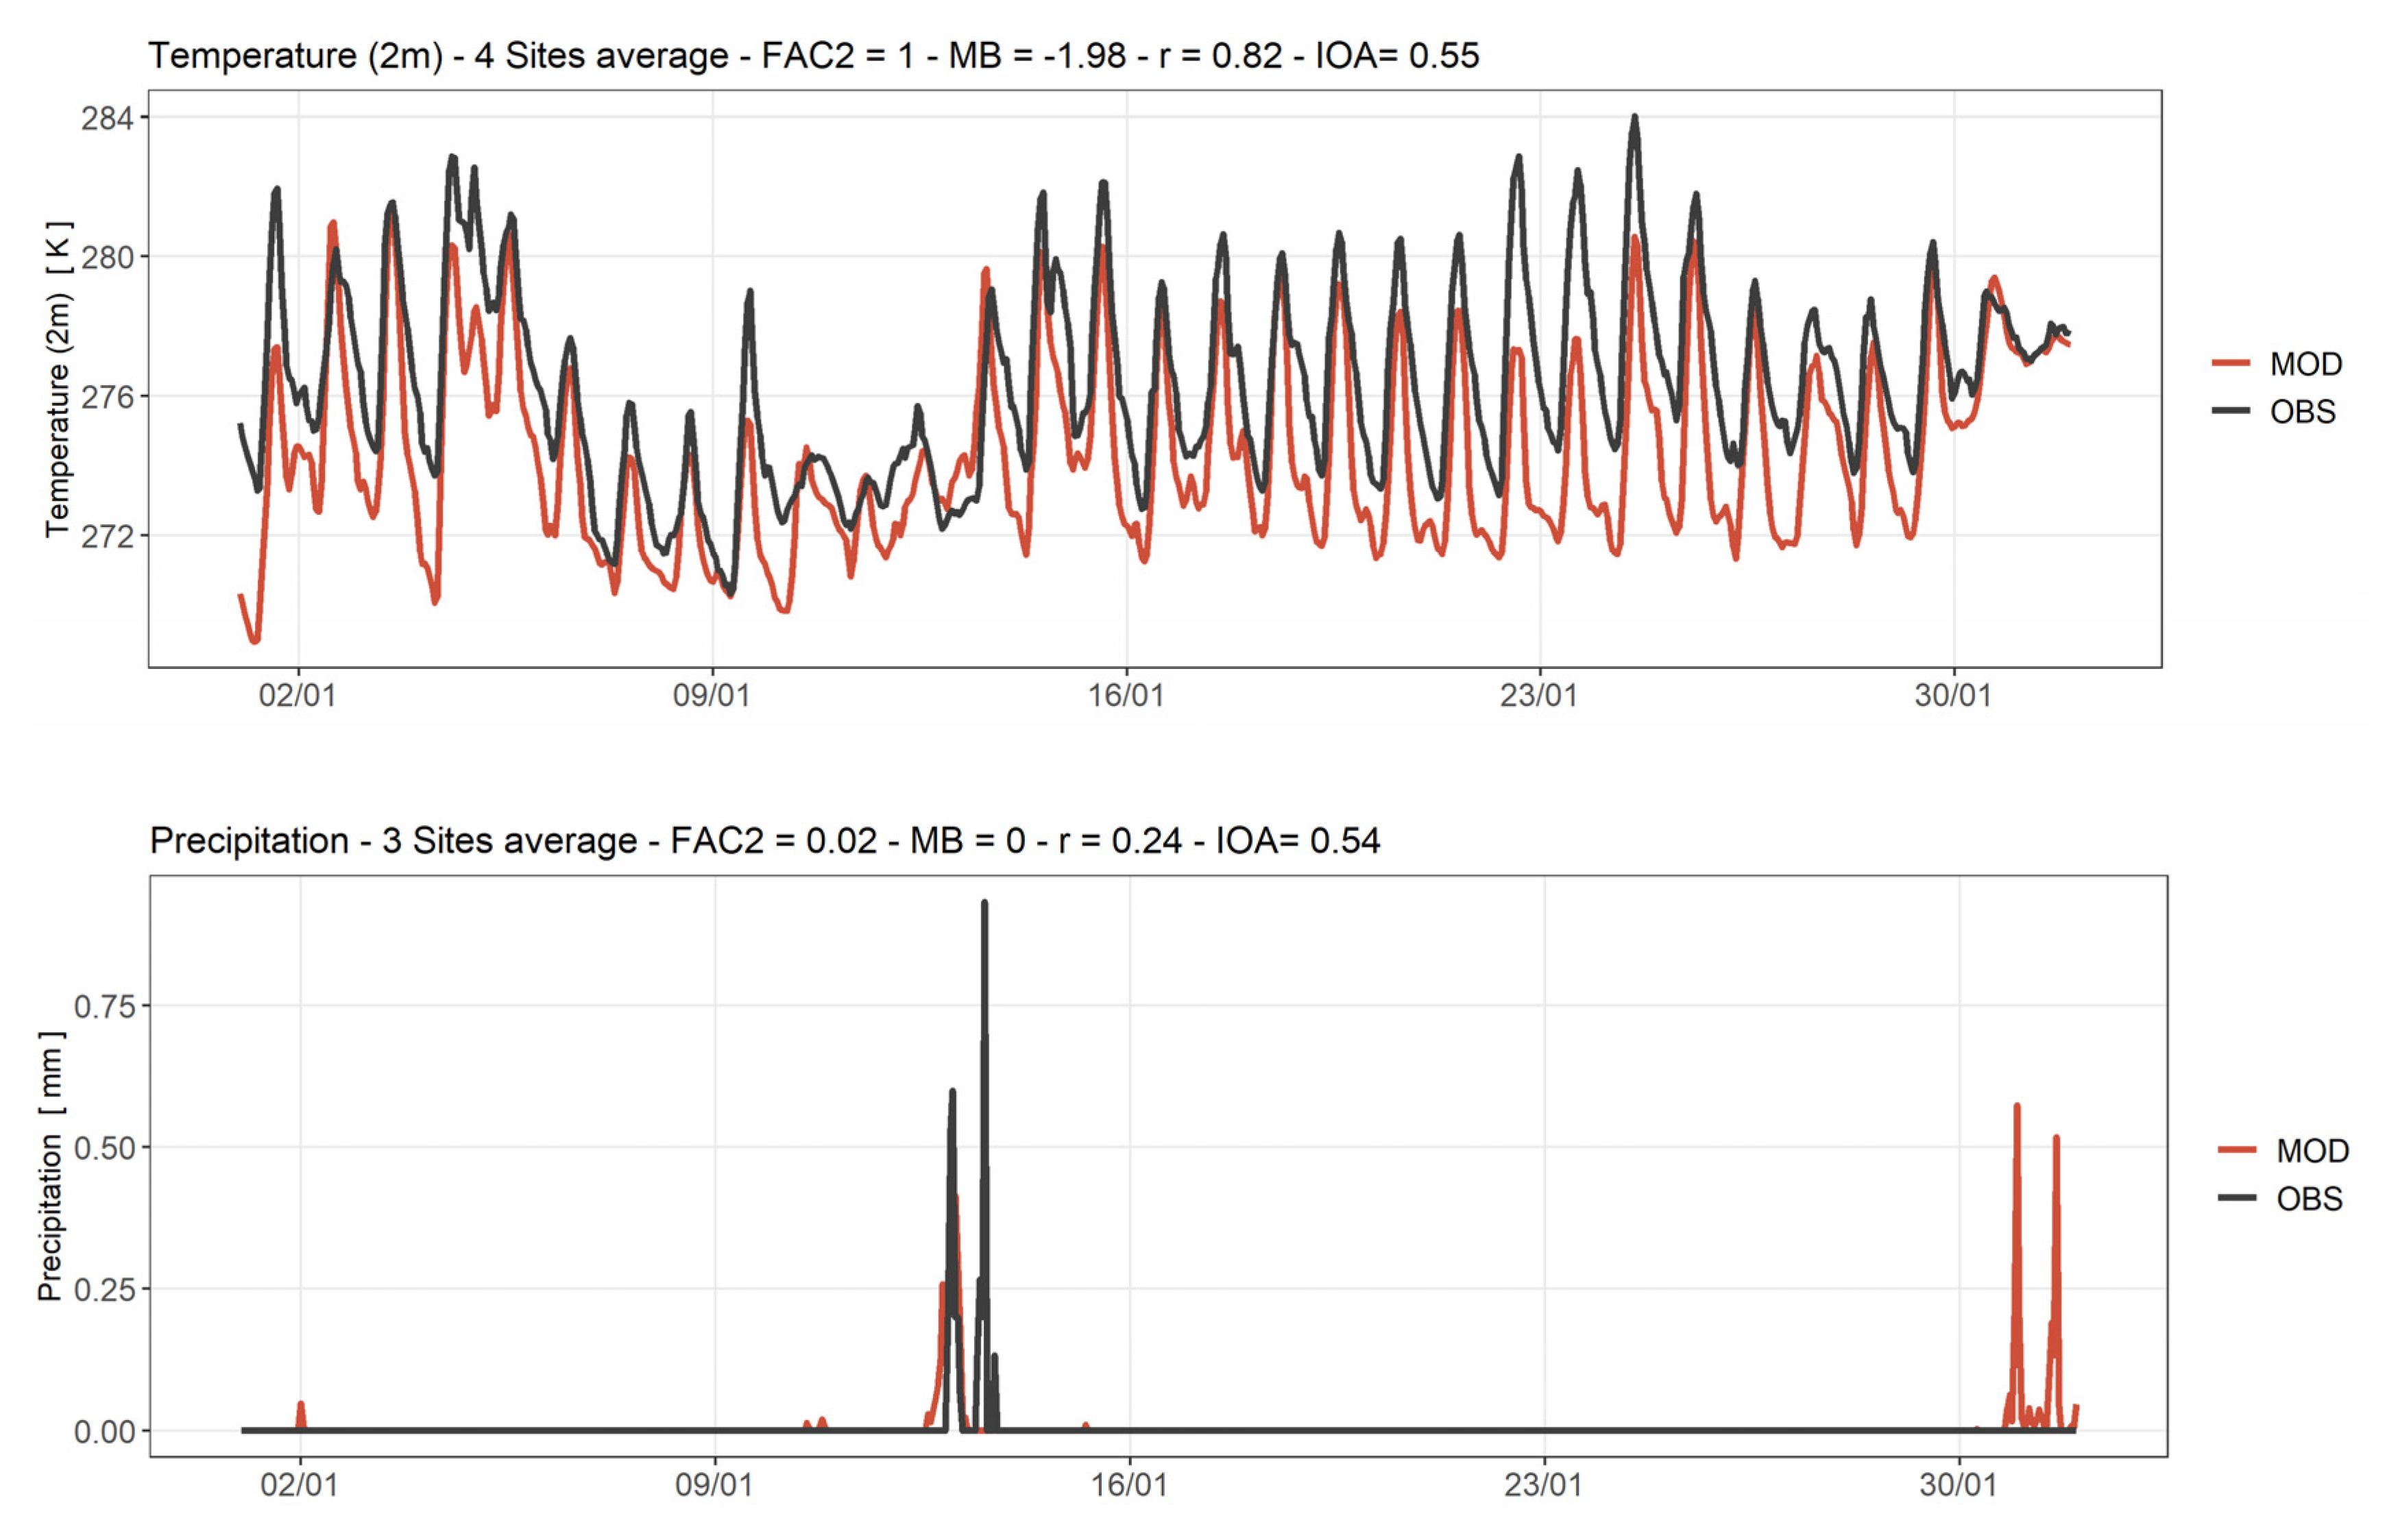
Figure 16.
Hourly variation of PBL height at the three monitoring stations: Viale Marche (S1, red), Viale Liguria (S2, blue), and Via Senato (S3, green) in January 2017.
Figure 16.
Hourly variation of PBL height at the three monitoring stations: Viale Marche (S1, red), Viale Liguria (S2, blue), and Via Senato (S3, green) in January 2017.
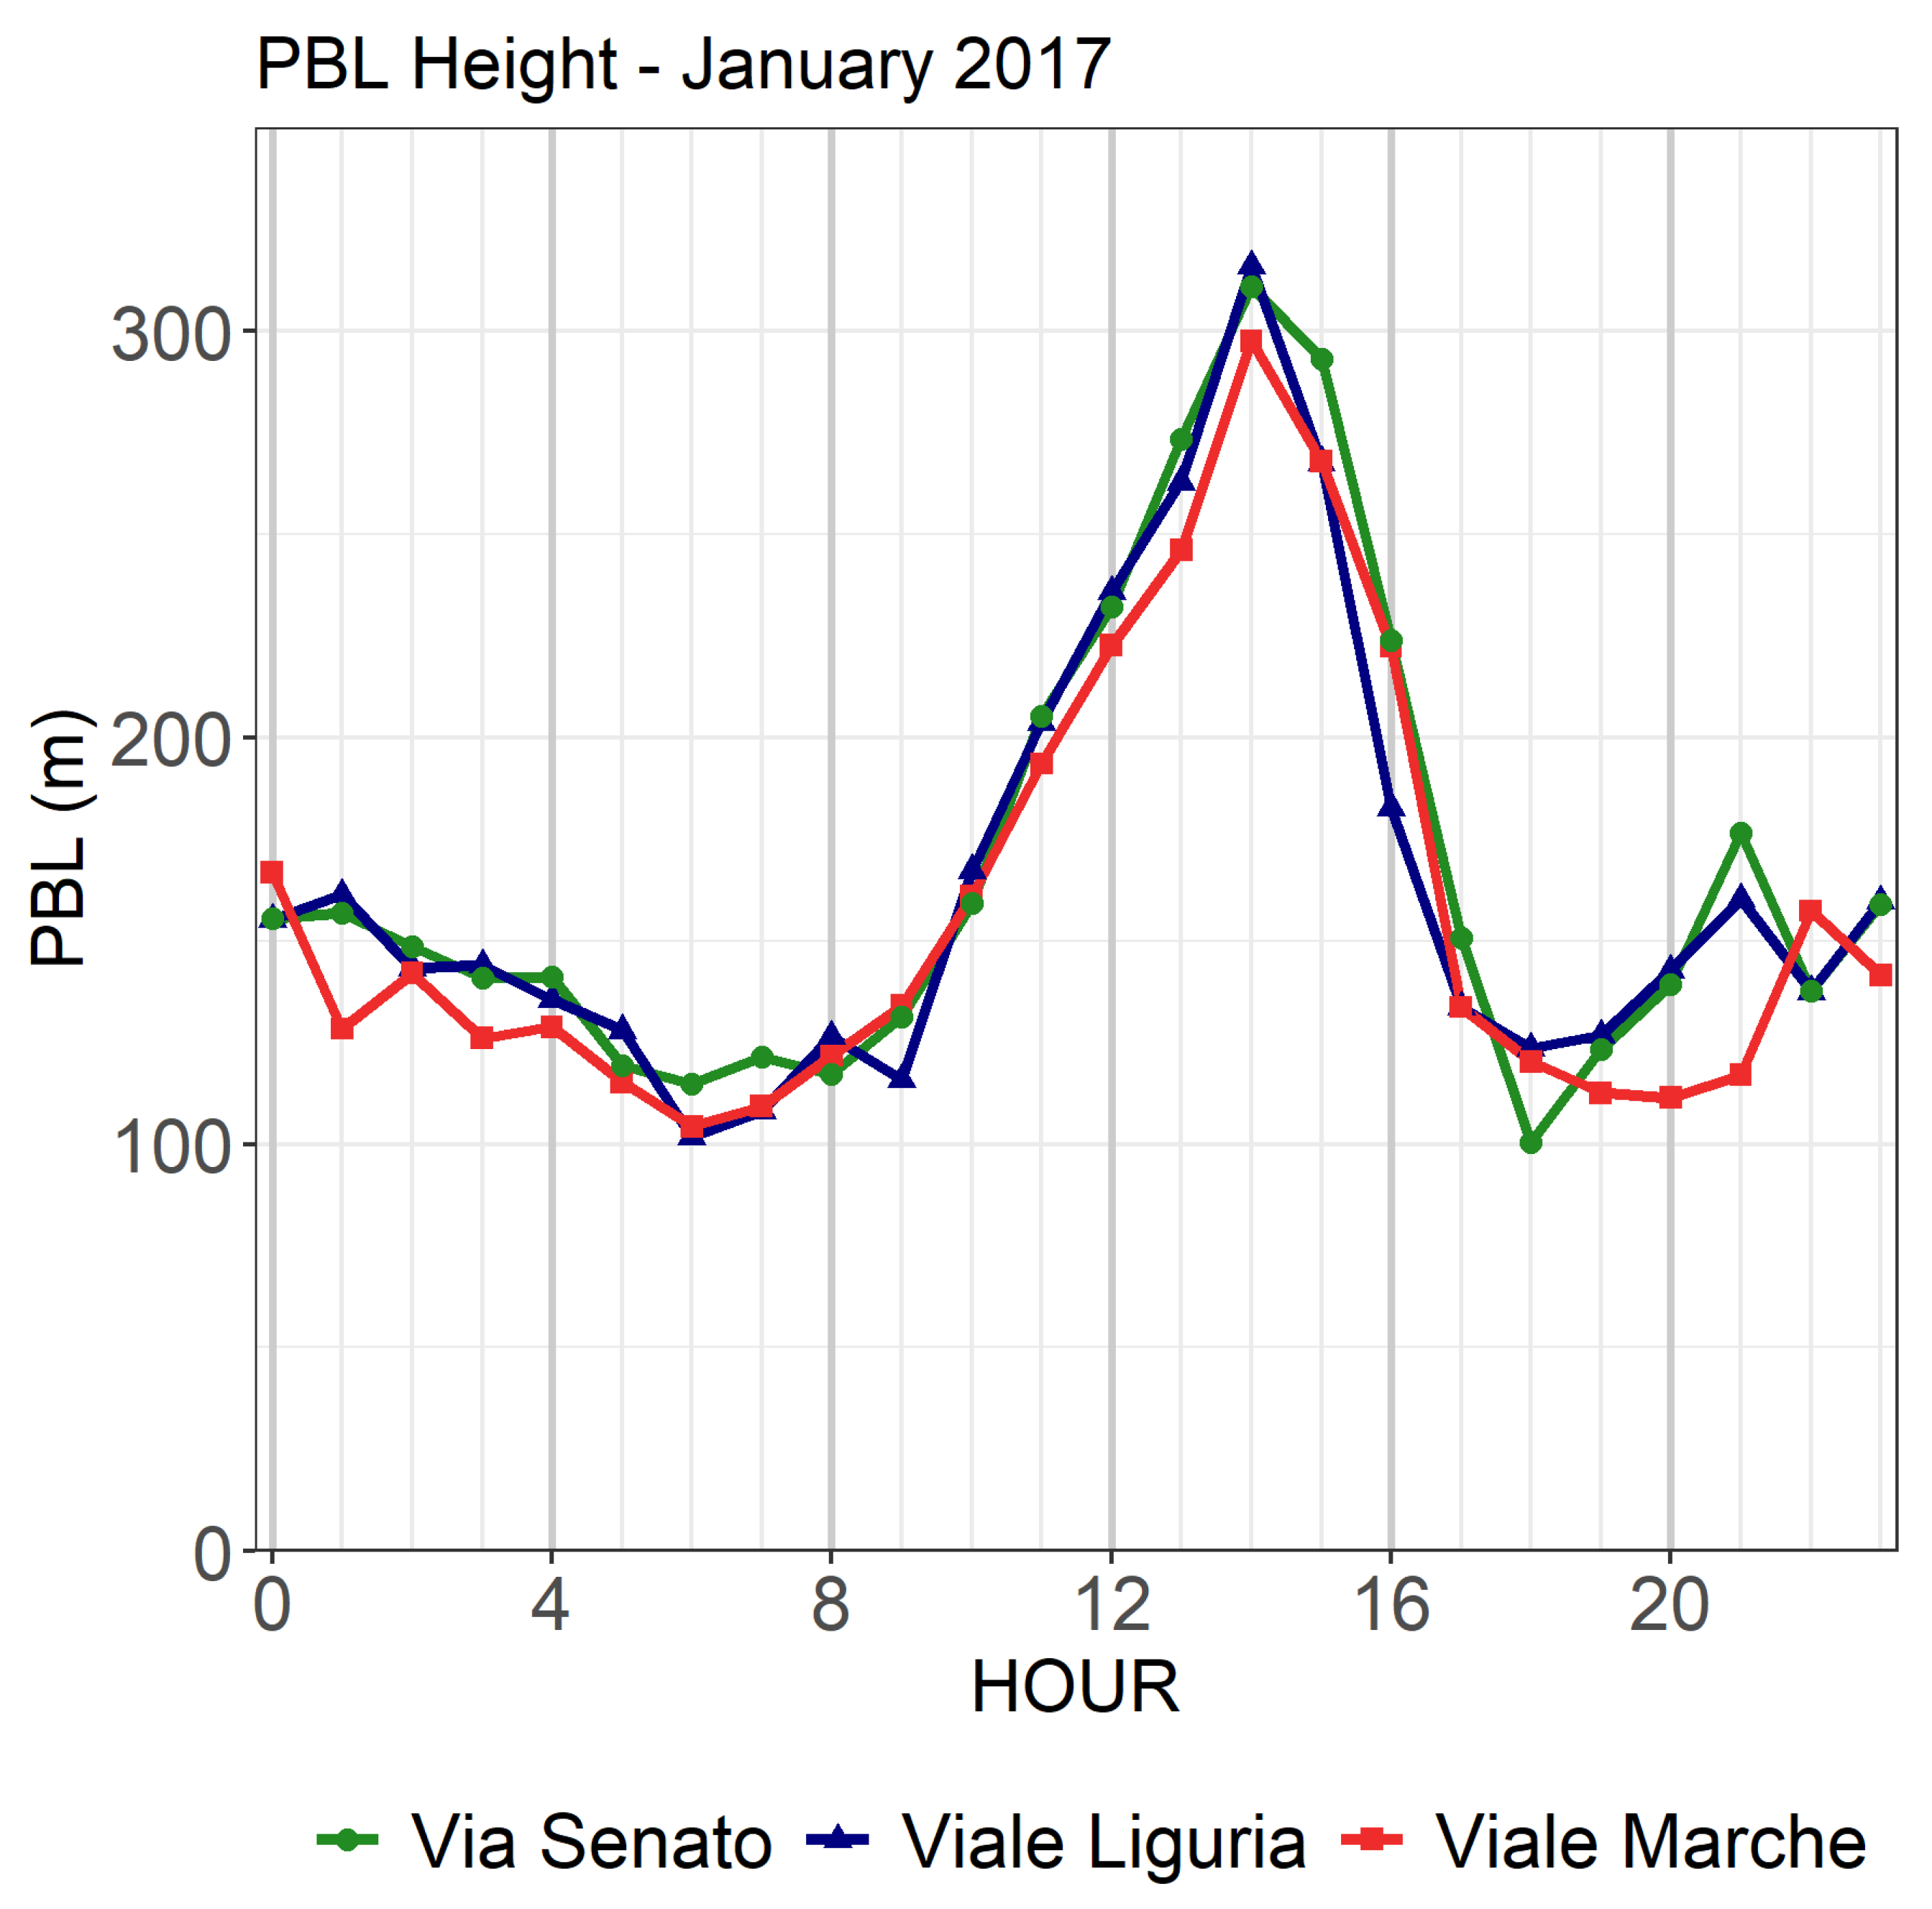
Table 1.
CAMx main settings.
| Parameter | Scheme |
|---|---|
| Chemistry scheme | CB05 |
| Aerosol treatment | CF |
| Inorganic aerosol chemistry | ISORROPIA |
| Organic aerosol chemistry | SOAP2.2 |
| LPiG chemistry option | GREASD |
| Dry deposition scheme | Zhang (Zhang et al., 2003, 2001) |
Table 2.
Air quality monitoring stations characteristics.
| Site | Site code | Name | Type | X (°) | Y (°) | Z (m asl) | Distance from LPiG source | Low Emission Zone |
| S1 | IT0477A | Viale Marche | Urban Traffic | 45.4963 | 9.1909 | 129 | 11 m | No |
| S2 | IT0761A | Viale Liguria | Urban Traffic | 45.4438 | 9.1679 | 115 | 7 m | No |
| S3 | IT1016A | Via Senato | Urban Traffic | 45.4705 | 9.1974 | 118 | 5 m | Yes |
Table 3.
CAMx-LPiG evaluation for the daily mean NO2 concentrations in January 2017. (MB: mean bias; RMSE: root mean square error; NMB: normalized mean bias; COR: correlation coefficient; IOA: index of agreement).
Table 3.
CAMx-LPiG evaluation for the daily mean NO2 concentrations in January 2017. (MB: mean bias; RMSE: root mean square error; NMB: normalized mean bias; COR: correlation coefficient; IOA: index of agreement).
| Site | Data coverage | Monthly mean | MB | RMSE | NMB | COR | IOA | |
| Observed | Modelled | |||||||
| % | ppb | ppb | ppb | ppb | % | - | - | |
| S1 | 100 | 39.9 | 35.8 | -4.1 | 10.3 | -10.3 | 0.50 | 0.68 |
| S2 | 74 | 37.7 | 33.8 | -3.9 | 12.1 | -10.4 | 0.28 | 0.53 |
| S3 | 100 | 40.9 | 34.8 | -6.1 | 9.6 | -15.0 | 0.67 | 0.72 |
Table 4.
CAMx-LPiG evaluation for the hourly mean NO2 concentrations in January 2017. (MB: mean bias; RMSE: root mean square error; NMB: normalized mean bias; COR: correlation coefficient; IOA: index of agreement).
Table 4.
CAMx-LPiG evaluation for the hourly mean NO2 concentrations in January 2017. (MB: mean bias; RMSE: root mean square error; NMB: normalized mean bias; COR: correlation coefficient; IOA: index of agreement).
| Site | Data coverage | Hourly mean | MB | RMSE | NMB | COR | IOA | |
| Observed | Modelled | |||||||
| % | ppb | Ppb | Ppb | ppb | % | - | - | |
| S1 | 100 | 39.9 | 35.8 | -4.1 | 18.8 | -10.3 | 0.31 | 0.53 |
| S2 | 75 | 38.3 | 34.0 | -4.3 | 18.5 | -11.3 | 0.39 | 0.61 |
| S3 | 100 | 40.9 | 34.8 | -6.1 | 15.9 | -15.0 | 0.49 | 0.64 |
Disclaimer/Publisher’s Note: The statements, opinions and data contained in all publications are solely those of the individual author(s) and contributor(s) and not of MDPI and/or the editor(s). MDPI and/or the editor(s) disclaim responsibility for any injury to people or property resulting from any ideas, methods, instructions or products referred to in the content. |
© 2024 by the authors. Licensee MDPI, Basel, Switzerland. This article is an open access article distributed under the terms and conditions of the Creative Commons Attribution (CC BY) license (http://creativecommons.org/licenses/by/4.0/).
Copyright: This open access article is published under a Creative Commons CC BY 4.0 license, which permit the free download, distribution, and reuse, provided that the author and preprint are cited in any reuse.


