Submitted:
11 May 2024
Posted:
13 May 2024
You are already at the latest version
Abstract
Understanding the molecular mechanism whereby an environmental chemical causes a disease is important for downstream purposes. In this study, an analytical workflow was designed to combine several publicly available datasets in order to identify CpG sites and genes that mediate the impact of exposure to environmental chemicals on cardiometabolic traits. Organophosphate and prenatal lead exposure were previously reported to change methylation level at the cg23627948 site. I found as cg23627948 site becomes methylated, the expression of GNA12 gene decreases and this leads to higher body fat percentage. Prenatal perfluorooctane sulfonate expo-sure was reported to increase the methylation level at cg21153102 site. The outcome of analyses revealed higher methylation at this site contributes to higher diastolic blood by changing the expression of CHP1 and GCHFR genes. Furthermore, HKR1 mediates the impact of B12 supple-mentation-cg05280698 hypermethylation on higher kidney function; while, CTDNEP1 mediates the impact of air pollution-cg03186999 hypomethylation on higher systolic blood pressure. This study reports CpG sites and genes that mediate the impact of environmental chemicals on cardiometabolic traits and describes a framework to investigate the underlying molecular paths using publicly available data.
Keywords:
Environmental chemicals
; cardiometabolic traits
; DNA methylation
; epigenome
; Mendelian randomization
; multiomics
1. Introduction
With the advances in technology, exposure of the human body to various chemicals occurs often and through different paths such as ingestion, inhalation, skin contact and via the umbilical cord to the unborn child. According to the World Health Organization report [1], over one third (35%) of ischemic heart disease, the leading cause of deaths and disability worldwide, and about 42% of stroke, the second largest contributor to global mortality, could be prevented by reducing or removing exposure to chemicals. The United States Center for Disease Control and Prevention reported the presence of 148 different environmental chemicals in samples of blood and urine taken from the US population [2]; however despite such issues, the benefits of synthetic chemicals to everyday life are undeniable and human will continue to synthesize new chemicals that did not exist previously [3]. Therefore, from the clinical perspective, it is required to research the impact of exposure to an environmental chemical for purposes such as risk assessment, early diagnosis, and therapeutic interventions.
As reviewed earlier [4,5], in addition to altering the sequence of DNA, epigenome is also considered as a path through which an environmental chemical can alter the transcriptome and cause a disease. Epigenome is a molecular interface that records the interactions between external factors including environmental chemicals and the body in the form of epigenome modifications and consequently provides information for the transcriptome machinery to adjust the expressions of genes in order to keep the homeostasis state of the body. Over the past decades, numerous studies have catalogued the effects of environmental chemicals on epigenomes and information from such studies have been recorded in publicly available databases. In this field of study, several challenges still exist such as what would be the consequence of a chemical related epigenomic modification on disease risks? and what is the underlying molecular process? Although in the past, answering such questions required extensive experiments and longitudinal studies, with the availability of high throughput screening methods there is an alternative solution to investigate such questions computationally.
High throughput screening studies have generated data for various biological features such as epigenome, transcriptome, phenome, etc. Currently, there are initiatives to connect these data through multiomics studies for downstream applications. A variant of these studies uses genome (i.e. SNPs) as a central axis to connect various sources of molecular data and evaluate the nature of relation between them [6,7]. This is a notable paradigm because over the past two decades, genome-wide association studies have been able to quantify the impact of SNPs on various biological features and computational tools have been developed that can process these data to find significant relations between biological features. Motivated by these reasons, in this study I introduced a workflow that by combining publicly available datasets can investigate molecular paths by which an environmental chemical causes a disease.
2. Results
By following the analysis pipeline described in Figure 1. I identified 4 CpG sites that their mQTLs colocalize with GWAS signals for cardiometabolic traits in both discovery (Table 1) and replication steps (Table S1). The list of environmental chemicals associated with these sites as ascertained in the EWAS atlas are available from Table S2. The findings from colocalization analysis were further confirmed by Mendelian randomization (Table S3). The outcome of forward-MR analysis revealed change in methylation level at the identified CpG sites has causal impact on their corresponding traits; besides, reverse-MR ruled out (P>0.05) the possibility of reverse-causation. Next, I integrated eQTL summary association statistics from the eQTLGen consortium to investigate genes that convey the impact of methylation sites on the traits (Table S3). In the following section, I review the findings:
2.1. cg23627948-GNA12-Obesity
Previous studies documented the impact of environmental factors; organophosphate [8] and prenatal lead exposure [9] on the degree of methylation at the CpG site cg23627948, within the chromosome band 7p22 (Table S2). Colocalization analysis revealed mQTLs of cg23627948 overlap (PSMR =1.4e-8, PHEIDI =0.04, Table 1) with risk SNPs for body fat percentage (BFP). The lead SNP, rs798549-C in this region was associated with higher methylation at cg23627948 site (B=1.4, P<1e-200) and higher BFP (B=0.01, P=1.3e-8, Table 1). The outcome of replication analysis confirmed this finding (Table S1). MR analysis revealed higher methylation at cg23627948 site contributes to higher BFP (B=0.01, P=1.0e-8, Table S3). By integrating eQTL data, I noted eQTLs of GNA12 overlap with GWAS signal for BFP, and mQTLs of cg05228408 (Figure 2). The outcome of MR analysis indicated as the methylation at cg23627948 site increases the expression of GNA12 decreases (B=-0.1, P=4.4e-47) and this leads to higher BFP (B=-0.03, P=4.5e-12, Figure 2). GNA12 encodes a subunit of guanine nucleotide binding protein known as G12-protein alpha subunit.
2.2. cg21153102-CHP1/GCHFR-DBP
Within chromosome 15q15.1, I found the methylation site, cg21153102 that becomes methylated due to prenatal perfluorooctane sulfonate exposure (Table S2). The outcome of SMR analysis indicated mQTLs of cg21153102 and SNPs for diastolic blood pressure (DBP) colocalize (PSMR=8.0e-22, PHEIDI=0.3; Table 1). The lead SNP in this locus, rs4924526(A) was associated with higher methylation at cg21153102 (B=1, P<1e-200) and higher risk of DBP (B=0.2, P=3e-23; Table 1). The outcome of MR analysis confirmed higher methylation at cg21153102 site is causally associated with higher DBP (B=0.2, P=1.8e-23; Table S3). By integrating the eQTL data, I found genes CHP1 and GCHFR mediate the impact of methylation site cg21153102 on DBP (Figure 3). Higher methylation at cg21153102 site was associated with lower expression of CHP1 (B=-0.15, P=1.7e-53) but higher expression of GCHFR (B=0.05, P=1.9e-11). Further analyses revealed higher expression of CHP1 contributes to lower DBP (B=-0.6, P=9.8e-13, Figure 3); whereas, GCHFR expression has opposite effect.
CHP1 encodes a phosphoprotein that acts as an endogenous inhibitor of calcineurin activity and also serves as an essential cofactor for the activity of sodium–hydrogen antiporter gene family. GCHFR encodes an enzyme that is involved in biosynthesis of tetrahydrobiopterin.
2.3. cg05280698-HKR1-Kidney Function
Yadava et al. reported [10] vitamin B12 supplementation increases methylation level at cg05280698 site (Table S2). Colocalization analysis revealed mQTLs of this site overlap with a GWAS locus for kidney function (PSMR=4.0e-17, PHEIDI=0.04, Table 1). The lead SNP in this region, rs320881(G) was associated with higher methylation at cg05280698 site (B=0.59, B=2.1e-75) and higher kidney function (B=0.003, P=2.9e-21). The outcome of MR analysis also revealed higher methylation at cg05280698 site contributes to higher kidney function (B=0.01, P=2.3e-9, Table S3). Finally, by integrating eQTL data, I identified HKR1 as the gene that mediates the impact of cg05280698 site on kidney function (Figure 4). It appears as the cg05280698 site becomes methylated the expression of HKR1 decreases (B=-0.42, B=5.4e-87) and this leads to higher kidney function (B=-0.01, B=5.1e-11, Figure 4). HKR1 is a member of the Krüppel-like family of transcription factors which are zinc finger DNA-binding proteins that regulate gene expression.
2.4. cg03186999-CTDNEP1-SBP
According to the data from the EWAS Atlas, air pollution lowers methylation level at cg03186999 site (Table S2); furthermore, the outcome of SMR analysis indicated mQTLs of cg03186999 and SNPs for systolic blood pressure (SBP) colocalize (PSMR=4.6e-16, PHEIDI=0.01; Table 1).
The lead SNP in this region, rs402514(T) was associated with lower SBP (B=-0.28, P=5.1e-19) but higher methylation at cg03186999 site (B=0.62, P=8.0e-86). The outcome of Mendelian randomization further confirmed lower methylation at this site contributes to higher SBP (B=-0.4, P=7.2e-16; Table 2). Furthermore, by integrating eQTLs data, I found CTDNEP1 as the gene that mediates the impact of cg03186999 sites on SBP. The outcome of analysis revealed higher methylation at cg03186999 contributes to higher expression of CTDNEP1 (B=0.3, P=2.4e-46, Figure 5) and this consequently lowers the systolic blood pressure (B=-1.07, P=1.0e-19). CTDNEP1 encodes a phosphatase enzyme that is known to be involved in various biological processes.
3. Discussion
This study summarizes the outcomes of analyses in which, by integrating several publicly available datasets, I sought to investigate molecular paths through which environmental chemicals influence cardiometabolic traits. Through a discovery and replication design and by applying rigorous statistical criteria, I identified 4 CpG sites and their related genes that convey the impacts of environmental factors on cardiometabolic traits. The identified CpG sites could be tracked to assess the progress of a disease in individuals who are exposed to a chemical agent. Furthermore, given that the detected CpG-trait associations indicate causality (due to the nature of Mendelian randomization test), the CpG sites could be targeted by epigenome editing approaches such as CRISPERoff [11] for therapeutic interventions. The identified genes provide insight into the mechanism through which a chemical substance acts upon.
I found cg23627948 site mediates the impact of organophosphate [8] and maternal lead exposure [9] on obesity through GNA12 gene which is a member of G protein-coupled receptors α family. Previous studies underlined the role of GNA12 in adipogenesis and energy expenditure [12,13,14]. It was reported GNA12 encoded protein stimulates the proliferation and inhibits the differentiation of preadipocytes [14]. Furthermore, GNA12 facilitates whole-body energy expenditure through USP22/SIRT1-regulated mitochondrial respiration [13]. The GNA12 levels were also recorded to be lower in the liver of high-fat diet fed mice and in patients with steatosis and/or nonalcoholic steatohepatitis [13].
On chromosome 15q51.1 region, two genes CHP1 and GCHFR were identified that mediated the impact of higher methylation at cg21153102 site on diastolic blood pressure. The site is reported to become methylated as a result of exposure to prenatal perfluorooctane sulfonate [15]. CHP1 also known as Calcineurin Like EF-Hand Protein 1, encodes a protein that is involved in various cellular processes. It acts as an endogenous inhibitor of calcineurin activity and thus may lead to hypertension through this path given that a side effect of immunosuppressive medications that act as calcineurin inhibitors is hypertension [16]; moreover, CHP1 serves as an essential cofactor which supports the physiological activity of NHE family members which are transmembrane proteins that act as sodium–hydrogen antiporter. NHE proteins are important in regulating the intracellular pH and maintaining blood pressure homeostasis [17]. The influence of GCHFR on blood pressure could be attributed to its role in production of vasodilator molecule nitric oxide. GCHFR has regulatory role in synthesis of BH4 (tetrahydrobiopterin) in endotheliad cells which acts as an essential cofactor in the production of nitric oxide [18].
HKR1 is a member of the Krüppel-like family of transcription factors which are zinc finger DNA-binding proteins that regulate gene expression. In this study, I found a methylation site within this gene that as it becomes methylated it increases the expression of HKR1 and this contributes to higher kidney function. The site is reported to be methylated in people taking B12 supplements [10]. Of note the site is also reported to become methylated as a result of exercise [19]. The role of HKR1 gene in kidney function remains unknown; however, in a recently published study, Liu et al. [20] conducted a comprehensive investigation of the molecular biology of kidney function in human, they identified kidney specific genes and cataloged methylation sites that impacted the function of such genes. Among their findings, they documented methylation of the HKR1 gene to change the expression of this gene.
CTDNEP1 was another gene associated with blood pressure. It mediated the impact of air pollution-cg03186999 site [21] on systolic blood pressure. CTDNEP1 protein, also known as C-terminal domain nuclear envelope phosphatase 1, is a member of the protein phosphatase family and has been recognized for its roles in various biological processes. Its contribution to blood pressure could be through its regulatory function in bone morphogenetic protein and Wnt signaling pathway [22]. Furthermore, CTDNEP1 is known to dephosphorylates LIPN1, which is implicated in development of hypertension [22,23].
This study provides a framework for future studies that aim to investigate the molecular path through which an environmental factor impacts a trait. It shows by connecting several disjointed data to the genome (i.e. SNPs). It is possible to investigate their inter-dependencies and infer the underlying molecular mechanism. Nonetheless, it has several limitations [2,5] that future studies can improve upon. In both discovery and replication stages, mQTL data were obtained from Illumina HumanMethylation450K Beadchip which covers about 1.6% (450,000 CpG sites) of the CpG sites in the human genome [24]. Therefore, conducting EWAS studies using more dense methylation arrays is necessary. Furthermore, considering that DNA methylation is just one form of epigenomic modifications, cataloguing SNPs underpinning other forms of epigenome modifications is expected. Tissue-specificity is another factor to consider. In this study, I used mQTL, and eQTL data generated using blood samples; although blood is an intermediary tissue; however, conducting the analyses using data from tissues that are pertinent to the trait of interest are more appropriate. Finally, as reviewed earlier [5], previous studies that catalogued epigenome sites associated with chemical exposure suffer from small sample sizes. As such, large cohorts and collaborative meta-analyses are required to comprehensively catalog epigenome sites underpinning a trait.
From the biological perspective, a phenotype (P) to a varying degree, is the outcome of two entities, Genetics (G) and Environment (E) or as it is formulated: P=G+E
Therefore to predict a phenotype in an individual, one needs to know the values of G and the E. Due to initiatives such as human genome project, and GWAS studies determining the G has been successful; however, determining the E component of a phenotype or as it was termed exposome remains unaddressed [25]. This requires recording exposure to various environmental factors and habits and measuring their impacts on a phenotype. Then a multivariate model that includes genetic risk score and environmental risk factors can be constructed to predict the value of P in an individual. Although in the past recording exposome of an individual was difficult with the advances in the information technology and invention of smart devices recording and integrating such data are feasible. This along with characterizing the molecular path through which exposome conveys its impact on a phenotype allow researchers to generate personalized medicine programs that keep each individual healthy and address abnormalities developing at molecular level from an earlier stage.
5. Conclusion
In summary, this study provides a list of CpG sites and their genes that mediate the impact of environmental chemicals on cardiometabolic traits. The CpG sites identified in this study could be monitored for early diagnosis. Furthermore, they could be targeted for therapeutic interventions through universal epigenome editing approaches such as CRISPERoff. The multiomics approach described provided in this article provides a convenient workflow that allows investigating the impact of an environmental factor on body’s biomarkers and consequently on health conditions.
4. Materials and Methods
EWAS Atlas [26] is a curated database of epigenome-wide association studies in which the authors categorized CpG sites to different groups of phenotypes including exposure to environmental factors. From this database, I obtained the list of CpG sites associated with environmental chemicals and examined their contributions to cardiometabolic traits through the procedure described in Figure 1.
For the reported CpG sites, I obtained their mQTLs from data McRae et al. study [27] in which the authors used the Illumina HumanMethylation450 array to measure DNA methylation in blood samples taken from 1,980 subjects of European descent. GWAS data for cardiometabolic traits were also obtained from studies (Table 1) conducted in European populations to minimize the possible bias due to the population stratification. Consequently, to compute the extent of linkage equilibrium (LD) between SNPs, I used genotype data from the European sample (n=503) of the 1000 genomes (phase 3).
Next, I investigated the relationship between a CpG site and a cardiometabolic trait by comparing their patterns of association with SNPs. From the statistical point of view, this is called a colocalization test and the aim of the test is to find genomic regions where SNP-association signals for a CpG site and a trait colocalize. In this study, I used the SMR software (version 1.3.1) [6] to conduct the colocaization analysis (PSMR <5e-8). SMR software can also differentiate between a pleiotropic effect (its null hypothesis) and a linkage effect through a test known as HEIDI (Heterogeneity In Dependent Instruments); furthermore, it provides an efficient way to store and query QTL data. CpG sites and traits that their underlying SNPs colocalize (PSMR<5e-8, PHEIDI>0.01) were then subjected to replication analysis using mQTL data from the Aberdeen Genetics Study which provided blood mQTL data on 847 individuals of British origin using Illumina HumanMethylation450 array [28].
CpG site-trait pairs that their underpinning SNPs colocalize, next were subjected to Mendelian randomization (MR) to investigate if change in methylation level at a CpG site has a causal impact on its identified trait [7]. MR is a form of instrumental variable analysis that investigates the relationship between the predictor (DNA methylation) and the outcome (trait) using an instrument (a set of independent SNPs) that is known to cause change in the predictor. Constructing such an instrument is possible by selecting SNPs that are in linkage equilibrium and are significantly associated with the predictor. For the purpose of this study, I set the degree of linkage disequilibrium between SNPs at r2≤0.05 and the degree of association between a SNP and its CpG site at P≤5e-8. The advantage of using an instrument of SNPs to investigate the relationship between two entities is that such an instrument is inherently immune to the confounding effect of environmental factors that can bias an association test. This is because alleles of independent SNPs are allocated to offspring at conception (Mendel’s second law) through a random process (unaffected by the environmental factors). Furthermore, by excluding pleiotropic SNPs (Methylation ← SNP → Trait) from the instrument (i.e. PHEIDI < 0.01), it is possible to rule out the correlation scenario, and by swapping the places of the predictor and the outcome and repeating the test, we can investigate the possibility of reverse causation. In this study, I used the GSMR algorithm (version 1.1.1) [7] to conduct Mendelian randomization analysis. It has a number of helpful functions (such as comparing the alleles, examining the linkage disequilibrium, etc.) that assist the analyses.
CpG site-traits that showed significant association following MR analysis (forward MR P<5e-8 and reverse MR P>0.05) were then subjected to functional investigation by integrating eQTLs from the eQTLGen consortium. The purpose of this step was to identify genes that mediate the impact of CpG sites on traits. eQTLGen consortium represents a collaborative effort in which the authors have investigated the genetic architecture of blood gene expression by incorporating eQTL data from 37 datasets, compromising a total of 31,684 individuals [29]. The analysis was initiated by first identifying CpG-gene pairs that share significant associations with a SNP (P<5e-8). Next, Mendelian randomization was used to test if change of methylation level at the CpG site has a causal impact on expression of the gene. If a significant association was detected (P<5e-8), I then extended the test by examining the association between the gene and the target trait.
Supplementary Materials
The following supporting information can be downloaded at the website of this paper posted on Preprints.org. The manuscript has the following supplementary tables. Table S1. Colocalization of mQTLs of CpG sites and SNPs of cardiometabolic traits in the replication study. Table S2. Association of CpG sites identified in this study with environmental chemicals according to the EWAS Atlas data. Table S3. The outcome of Mendelian randomization; nature of association between the identified CpG sites, genes and cardiometabolic traits.
Funding
This research received no funding.
Institutional Review Board Statement
Not applicable.
Informed Consent Statement
Not applicable.
Data Availability Statement
mQTL summary statistics were obtained from: https://yanglab.westlake.edu.cn/software/smr/#DataResource. eQTL summary statistics were obtained from the eQTLGen consortium: https://www.eqtlgen.org/. GWAS summary statistics for cardiometabolic traits were obtained from UK Biobank: https://www.ukbiobank.ac.uk/ and CDKGen consortium: https://ckdgen.imbi.uni-freiburg.de/.
Acknowledgments
This research work was enabled in part by computational resources and support provided by the Compute Ontario and the Digital Research Alliance of Canada.
Conflicts of Interest
The author declares no conflicts of interest.
References
- Organization, W.H. The public health impact of chemicals: knowns and unknowns. 2016, World Health Organization.
- Hou, L.; et al. Environmental chemical exposures and human epigenetics. International Journal of Epidemiology 2011, 41, 79–105. [Google Scholar] [CrossRef] [PubMed]
- Naidu, R.; et al. Chemical pollution: A growing peril and potential catastrophic risk to humanity. Environment International 2021, 156, 106616. [Google Scholar] [CrossRef] [PubMed]
- Baccarelli, A. and V. Bollati, Epigenetics and environmental chemicals. Curr Opin Pediatr 2009, 21, 243–51. [Google Scholar] [CrossRef] [PubMed]
- Ruiz-Hernandez, A.; et al. Environmental chemicals and DNA methylation in adults: a systematic review of the epidemiologic evidence. Clin Epigenetics 2015, 7, 55. [Google Scholar] [CrossRef] [PubMed]
- Wu, Y.; et al. Integrative analysis of omics summary data reveals putative mechanisms underlying complex traits. Nature Communications 2018, 9, 918. [Google Scholar] [CrossRef]
- Zhu, Z.; et al. Causal associations between risk factors and common diseases inferred from GWAS summary data. Nature Communications 2018, 9, 224. [Google Scholar] [CrossRef]
- Paul, K.C.; et al. Organophosphate pesticide exposure and differential genome-wide DNA methylation. Sci Total Environ 2018, 645, 1135–1143. [Google Scholar] [CrossRef]
- Wu, S.; et al. Exposure to Low Levels of Lead in Utero and Umbilical Cord Blood DNA Methylation in Project Viva: An Epigenome-Wide Association Study. Environ Health Perspect 2017, 125, 087019. [Google Scholar] [CrossRef] [PubMed]
- Yadav, D.K.; et al. Vitamin B(12) supplementation influences methylation of genes associated with Type 2 diabetes and its intermediate traits. Epigenomics 2018, 10, 71–90. [Google Scholar] [CrossRef]
- Nuñez, J.K.; et al. Genome-wide programmable transcriptional memory by CRISPR-based epigenome editing. Cell 2021, 184, 2503–2519. [Google Scholar] [CrossRef]
- Yang, Y.M.; et al. Gα12/13 signaling in metabolic diseases. Experimental & Molecular Medicine 2020, 52, 896–910. [Google Scholar]
- Kim, T.H.; et al. Gα12 ablation exacerbates liver steatosis and obesity by suppressing USP22/SIRT1-regulated mitochondrial respiration. The Journal of Clinical Investigation 2018, 128, 5587–5602. [Google Scholar] [CrossRef] [PubMed]
- Denis-Henriot, D.; et al. Mutant α-Subunit of the G Protein G12 Activates Proliferation and Inhibits Differentiation of 3T3-F442A Preadipocytes*. Endocrinology 1998, 139, 2892–2899. [Google Scholar] [CrossRef] [PubMed]
- Liu, Y.; et al. Gestational Perfluoroalkyl Substance Exposure and DNA Methylation at Birth and 12 Years of Age: A Longitudinal Epigenome-Wide Association Study. Environ Health Perspect 2022, 130, 37005. [Google Scholar] [CrossRef] [PubMed]
- Hoorn, E.J.; et al. Pathogenesis of calcineurin inhibitor-induced hypertension. J Nephrol 2012, 25, 269–75. [Google Scholar] [CrossRef] [PubMed]
- Siffert, W. and R. Düsing, Sodium-Proton Exchange and Primary Hypertension. Hypertension 1995, 26, 649–655. [Google Scholar] [CrossRef] [PubMed]
- Li, L.; et al. GTP cyclohydrolase I phosphorylation and interaction with GTP cyclohydrolase feedback regulatory protein provide novel regulation of endothelial tetrahydrobiopterin and nitric oxide. Circ Res 2010, 106, 328–36. [Google Scholar] [CrossRef] [PubMed]
- Lindholm, M.E.; et al. An integrative analysis reveals coordinated reprogramming of the epigenome and the transcriptome in human skeletal muscle after training. Epigenetics 2014, 9, 1557–69. [Google Scholar] [CrossRef] [PubMed]
- Liu, H.; et al. Epigenomic and transcriptomic analyses define core cell types, genes and targetable mechanisms for kidney disease. Nature Genetics 2022, 54, 950–962. [Google Scholar] [CrossRef]
- Wang, C.; et al. Short- and intermediate-term exposure to ambient fine particulate elements and leukocyte epigenome-wide DNA methylation in older men: the Normative Aging Study. Environ Int 2022, 158, 106955. [Google Scholar] [CrossRef]
- Rallabandi, H.R.; et al. Research Trends in C-Terminal Domain Nuclear Envelope Phosphatase 1. Life (Basel) 2023, 13. [Google Scholar] [CrossRef] [PubMed]
- Fujiwara, A.; et al. LPIN1 is a new target gene for essential hypertension. J Hypertens, 2022, 40, 536–543. [Google Scholar] [CrossRef] [PubMed]
- Edwards, J.R.; et al. Chromatin and sequence features that define the fine and gross structure of genomic methylation patterns. Genome Res 2010, 20, 972–80. [Google Scholar] [CrossRef] [PubMed]
- Niedzwiecki, M.M.; et al. The Exposome: Molecules to Populations. Annual Review of Pharmacology and Toxicology 2019, 59, 107–127. [Google Scholar] [CrossRef] [PubMed]
- Li, M.; et al. EWAS Atlas: a curated knowledgebase of epigenome-wide association studies. Nucleic Acids Res 2019, 47, D983–d988. [Google Scholar] [CrossRef]
- McRae, A.F.; et al. Identification of 55,000 Replicated DNA Methylation QTL. Sci Rep 2018, 8, 17605. [Google Scholar] [CrossRef] [PubMed]
- Hannon, E.; et al. An integrated genetic-epigenetic analysis of schizophrenia: evidence for co-localization of genetic associations and differential DNA methylation. Genome Biology 2016, 17, 176. [Google Scholar] [CrossRef]
- Võsa, U.; et al. Large-scale cis- and trans-eQTL analyses identify thousands of genetic loci and polygenic scores that regulate blood gene expression. Nature Genetics 2021, 53, 1300–1310. [Google Scholar] [CrossRef]
Figure 1.
Overview of the mutliomics approach used in this study to investigate the molecular path through which an environmental chemical impacts a cardiometabolic trait. Initially, the list of CpG sites that undergone chemical modification as a result of exposure to environmental chemicals were obtained from the EWAS Atlas. Next, colocalization analysis was performed to identify genomic regions that SNPs underlying a CpG site and a cardiometabolic trait correlate with regard to their association signals. Significant CpG-trait pairs from this stage were then subjected to Mendelian randomization to find if change in methylation level at a CpG site has causal impact on a cardiometabolic trait (P<5e-8). Finally, for the purpose of molecular inference, the eQTL data from the eQTLGen consortium were integrated to investigate genes that convey the impact of a CpG site on a trait.
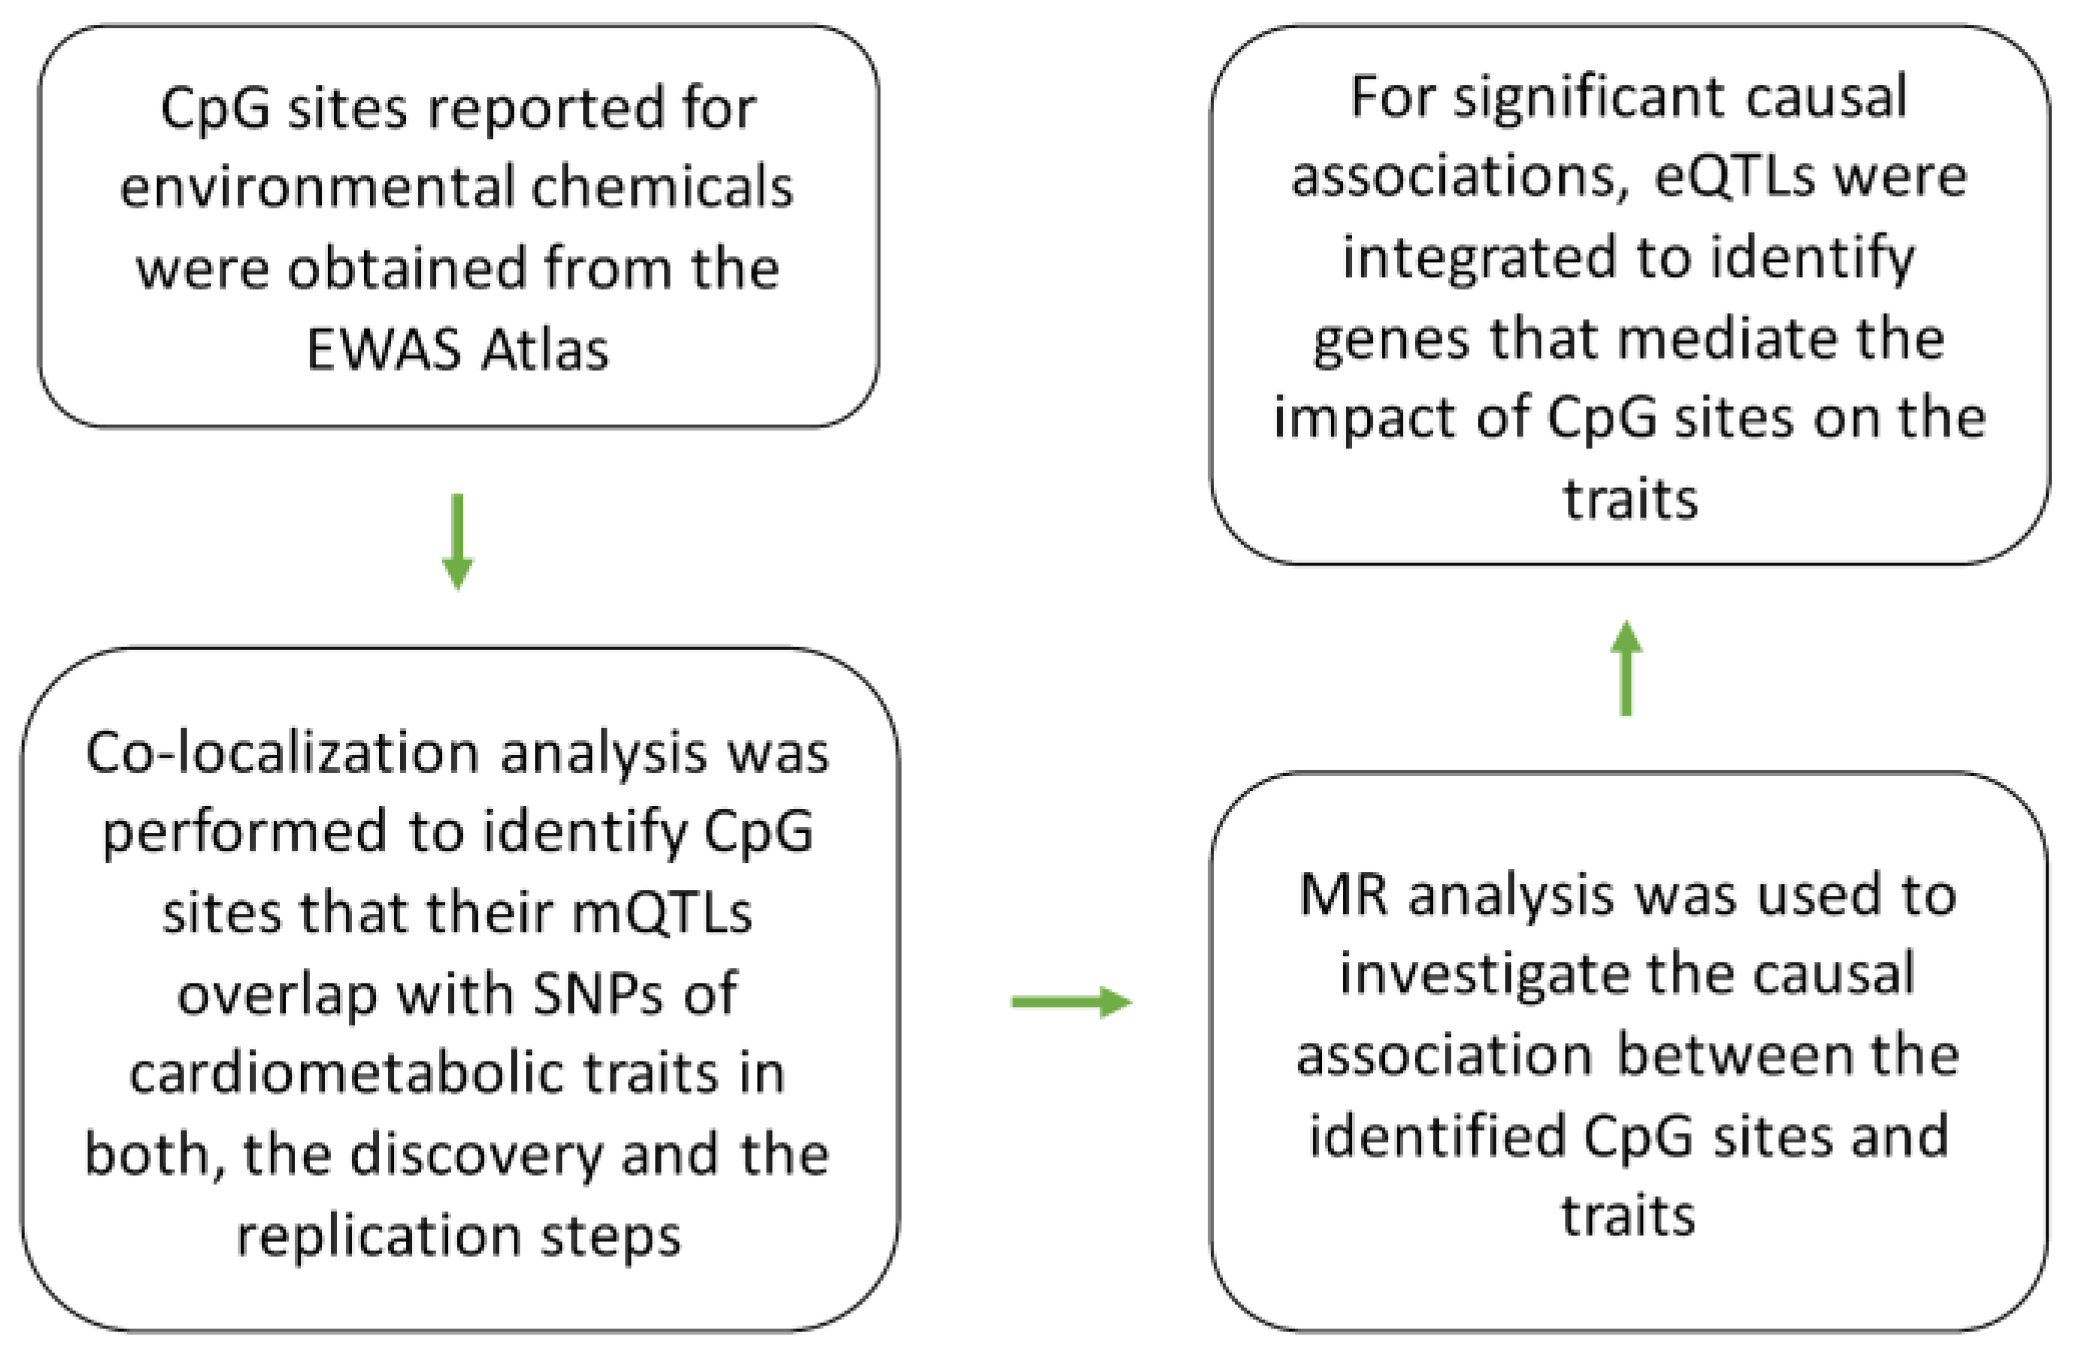
Figure 2.
The mechanism whereby cg23627948 mediates the impact of environmental chemicals on obesity. A) Regional association plots for mQTLs of cg23627948, eQTLs of GNA12, and risk SNPs of obesity overlap. B) cg23627948 site is reported to undergo chemical modification as a result of exposure to environmental factors such as organophosphates and lead. Findings from Mendelian randomization (MR) indicated higher methylation at cg23627948 leads to lower expression of GNA12 this consequently contributes to higher body fat percentage. Complete statistical details are available in Table S3. Points on MR plots represent SNPs; the x-value of a SNP is its effect size (β) on the predictor, and the horizontal error bar indicates standard error. Similarly, the y-value of the SNP indicates its effect size on the outcome, and the vertical error bar indicates the standard error. The dashed line represents the line of best fit (a line with the intercept of 0 and the slope of β from the MR test).
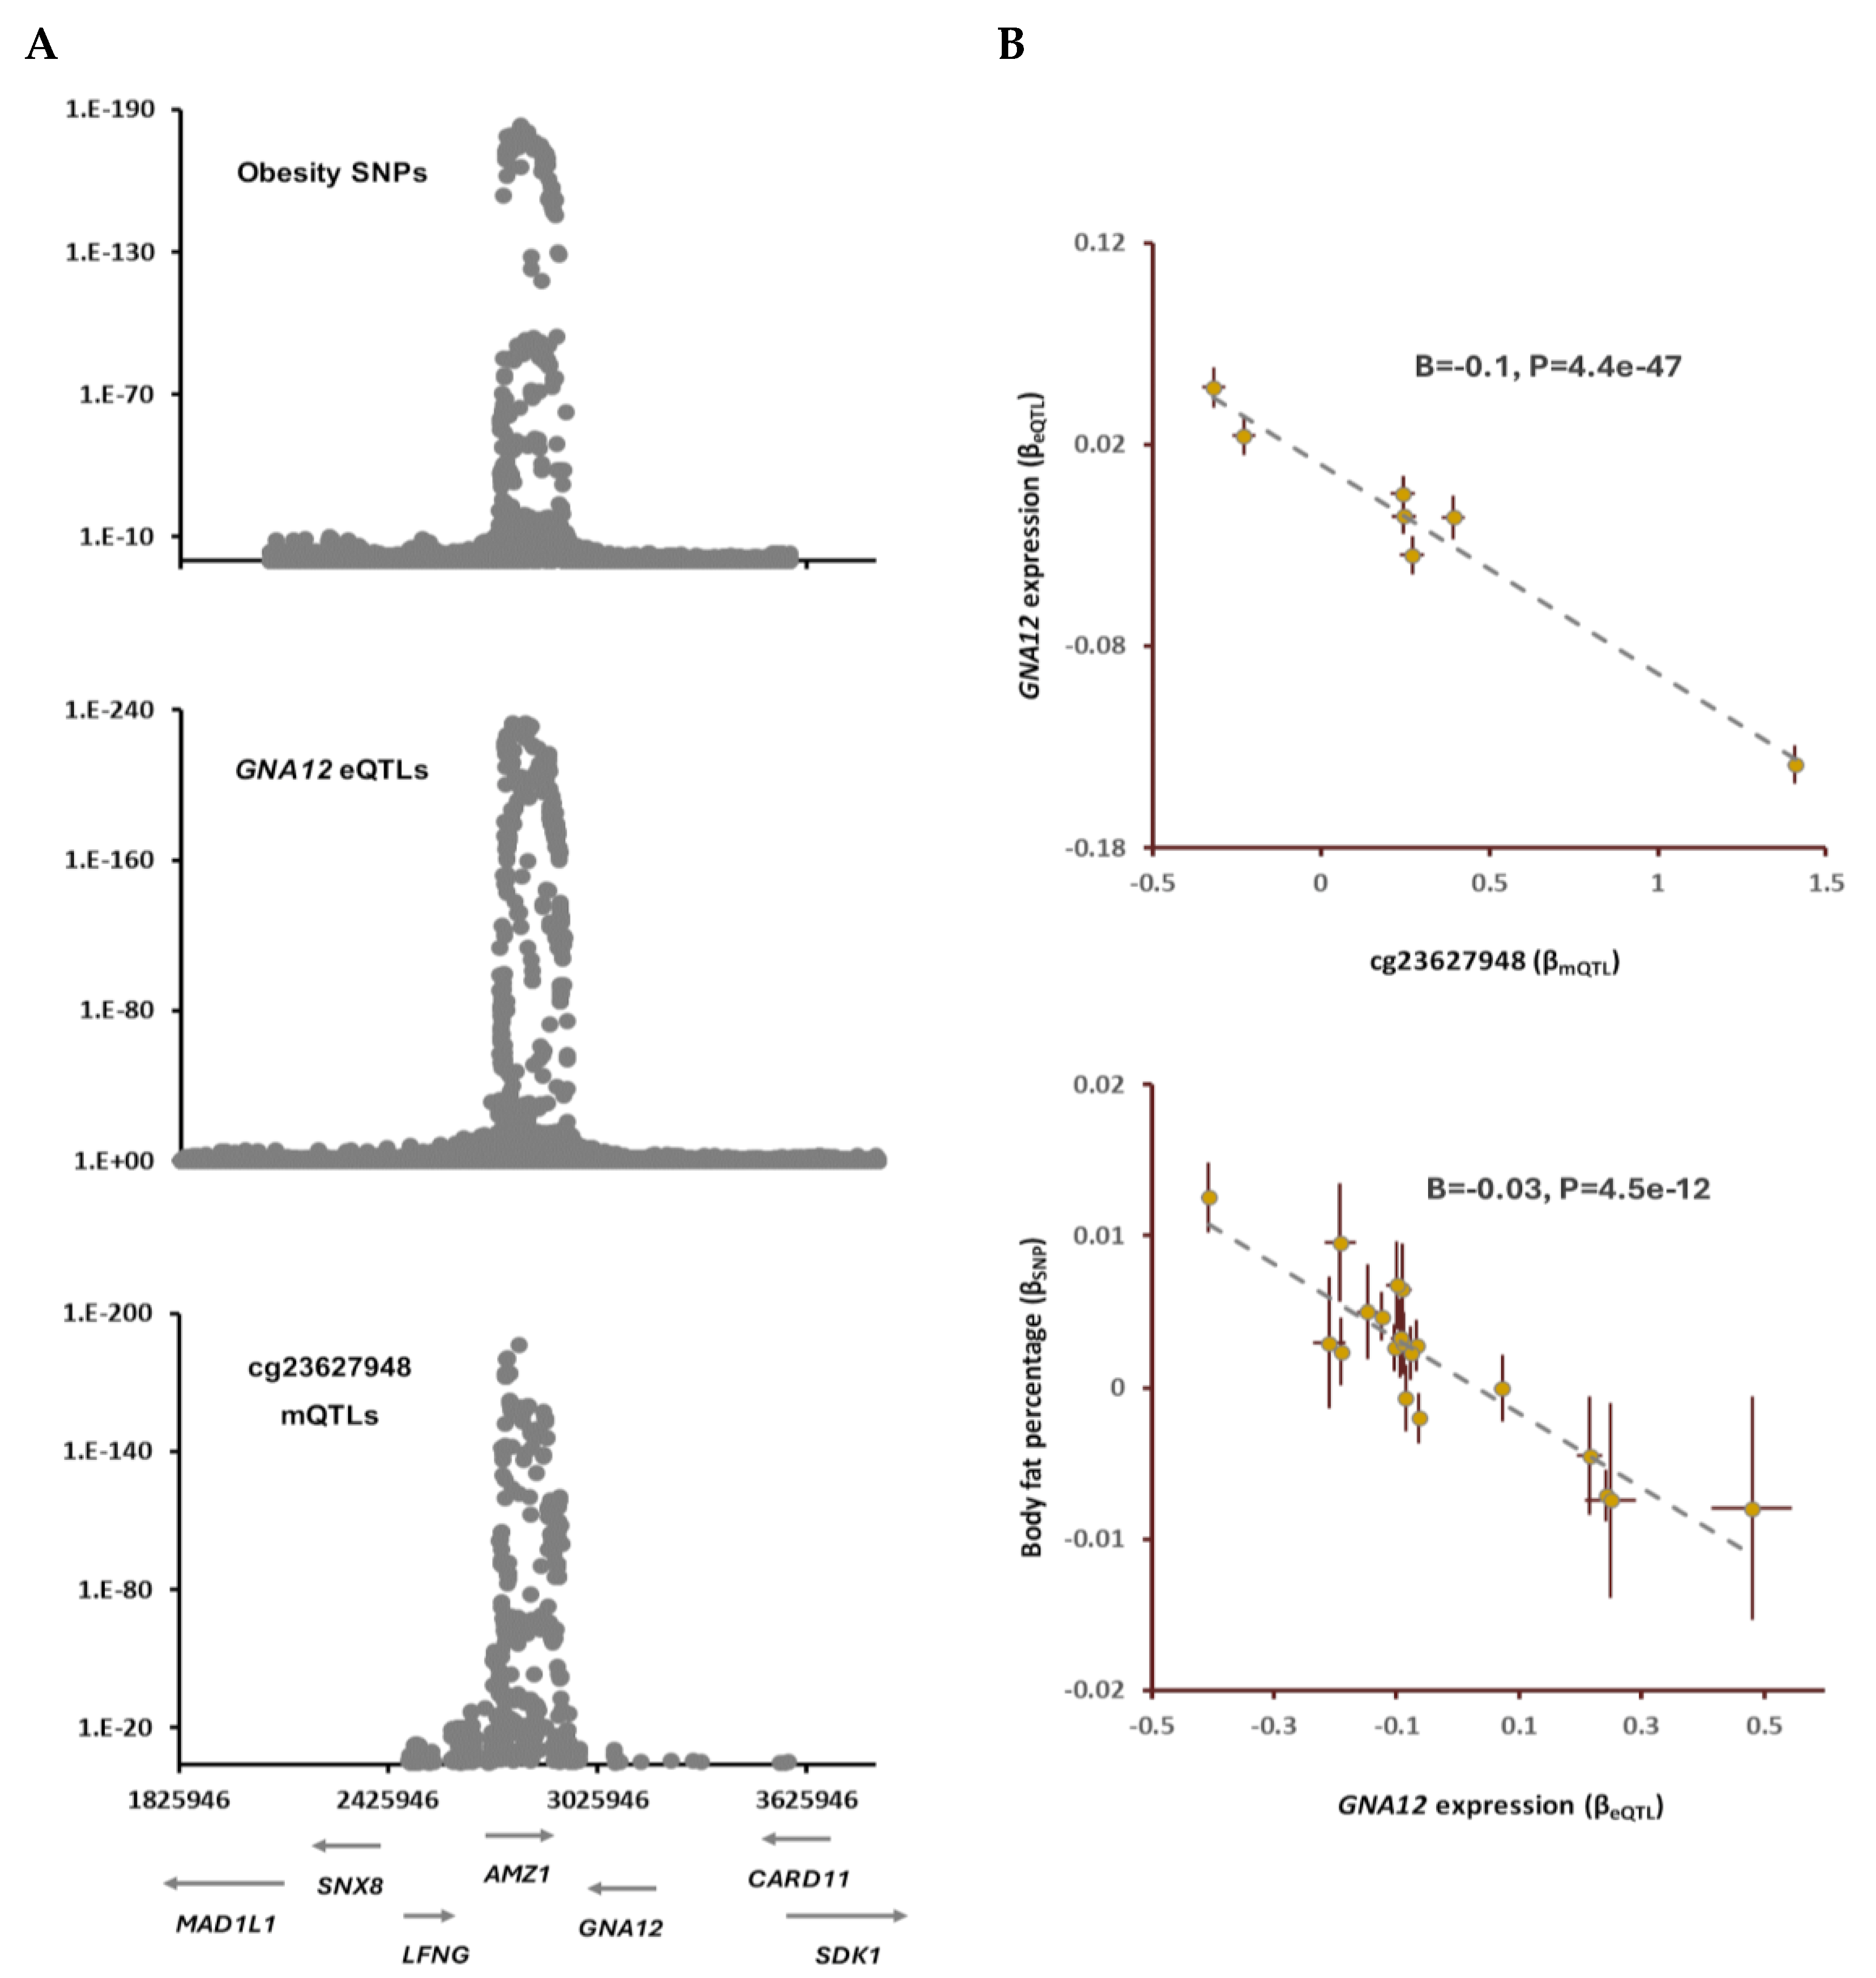
Figure 3.
Higher methylation at cg21153102 site contributes to diastolic blood pressure (DBP) by changing the expression of GCHFR and CHP1. cg21153102 undergoes chemical modification as a result of exposure to perfluorooctane sulfonate (Table S2). I noted as cg21153102 site becomes methylated it increases the expression of GCHFR but lowers levels of CHP1. This consequently leads to higher DBP, because a higher expression of GCHFR and a lower level of CHP1 are associated with higher DBP levels. Complete statistical details are available in Table S3. Points on the plots represent SNPs; the x-value of a SNP is its effect size (β) on the predictor, and the horizontal error bar indicates standard error. Similarly, the y-value of the SNP indicates its effect size on the outcome, and the vertical error bar indicates the standard error. The dashed line represents the line of best fit (a line with the intercept of 0 and the slope of β from the Mendelian randomization test).
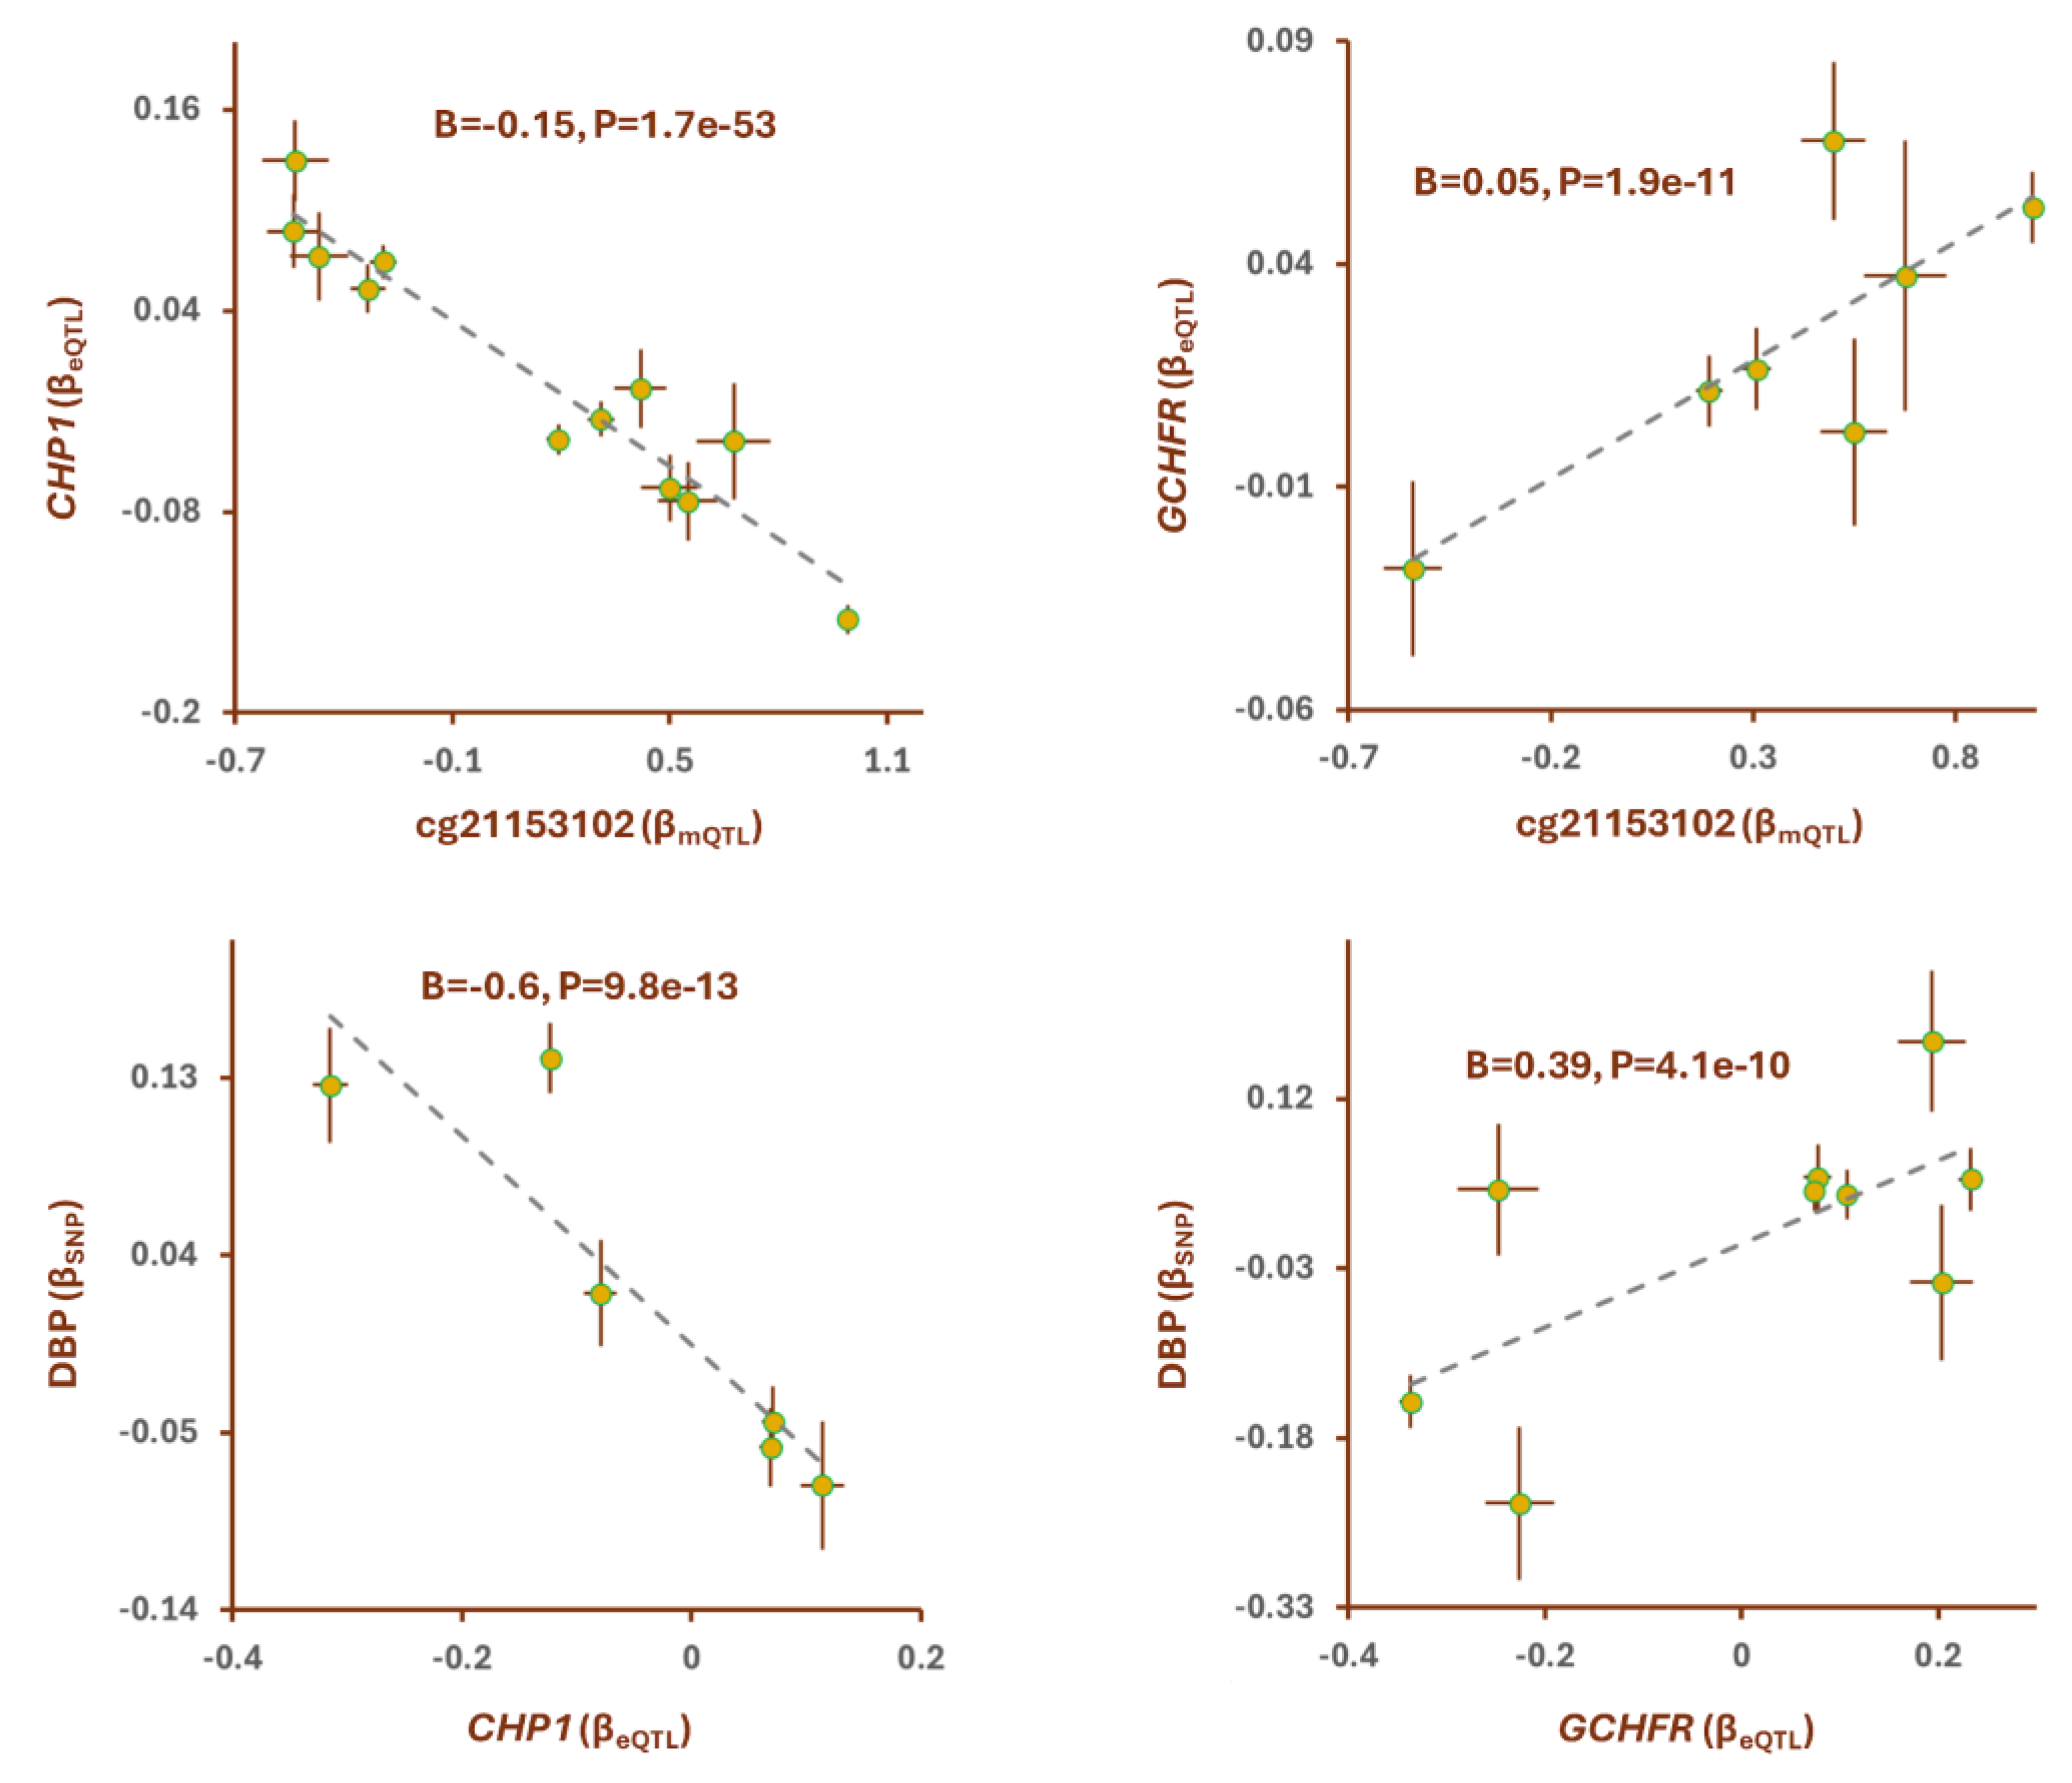
Figure 4.
The mechanism whereby cg05280698 exerts the impact of vitamin B12 supplementation on kidney function. A) regional association plots for mQTLs of cg05280698, eQTLs of HKR1 and SNPs for kidney function overlap. cg05280698 site is reported to become hypertmethlated in people who take vitamin B12 supplementation (Table S2). B) Mendelian randomization (MR) revealed as the site becomes methylated the expression of HKR1 decreases and this leads to higher kidney function. Complete statistical details are available in Table S3. Points on MR plots represent SNPs; the x-value of a SNP is its effect size (β) on the predictor, and the horizontal error bar indicates standard error. Similarly, the y-value of the SNP indicates its effect size on the outcome, and the vertical error bar indicates the standard error. The dashed line represents the line of best fit (a line with the intercept of 0 and the slope of β from the MR test).
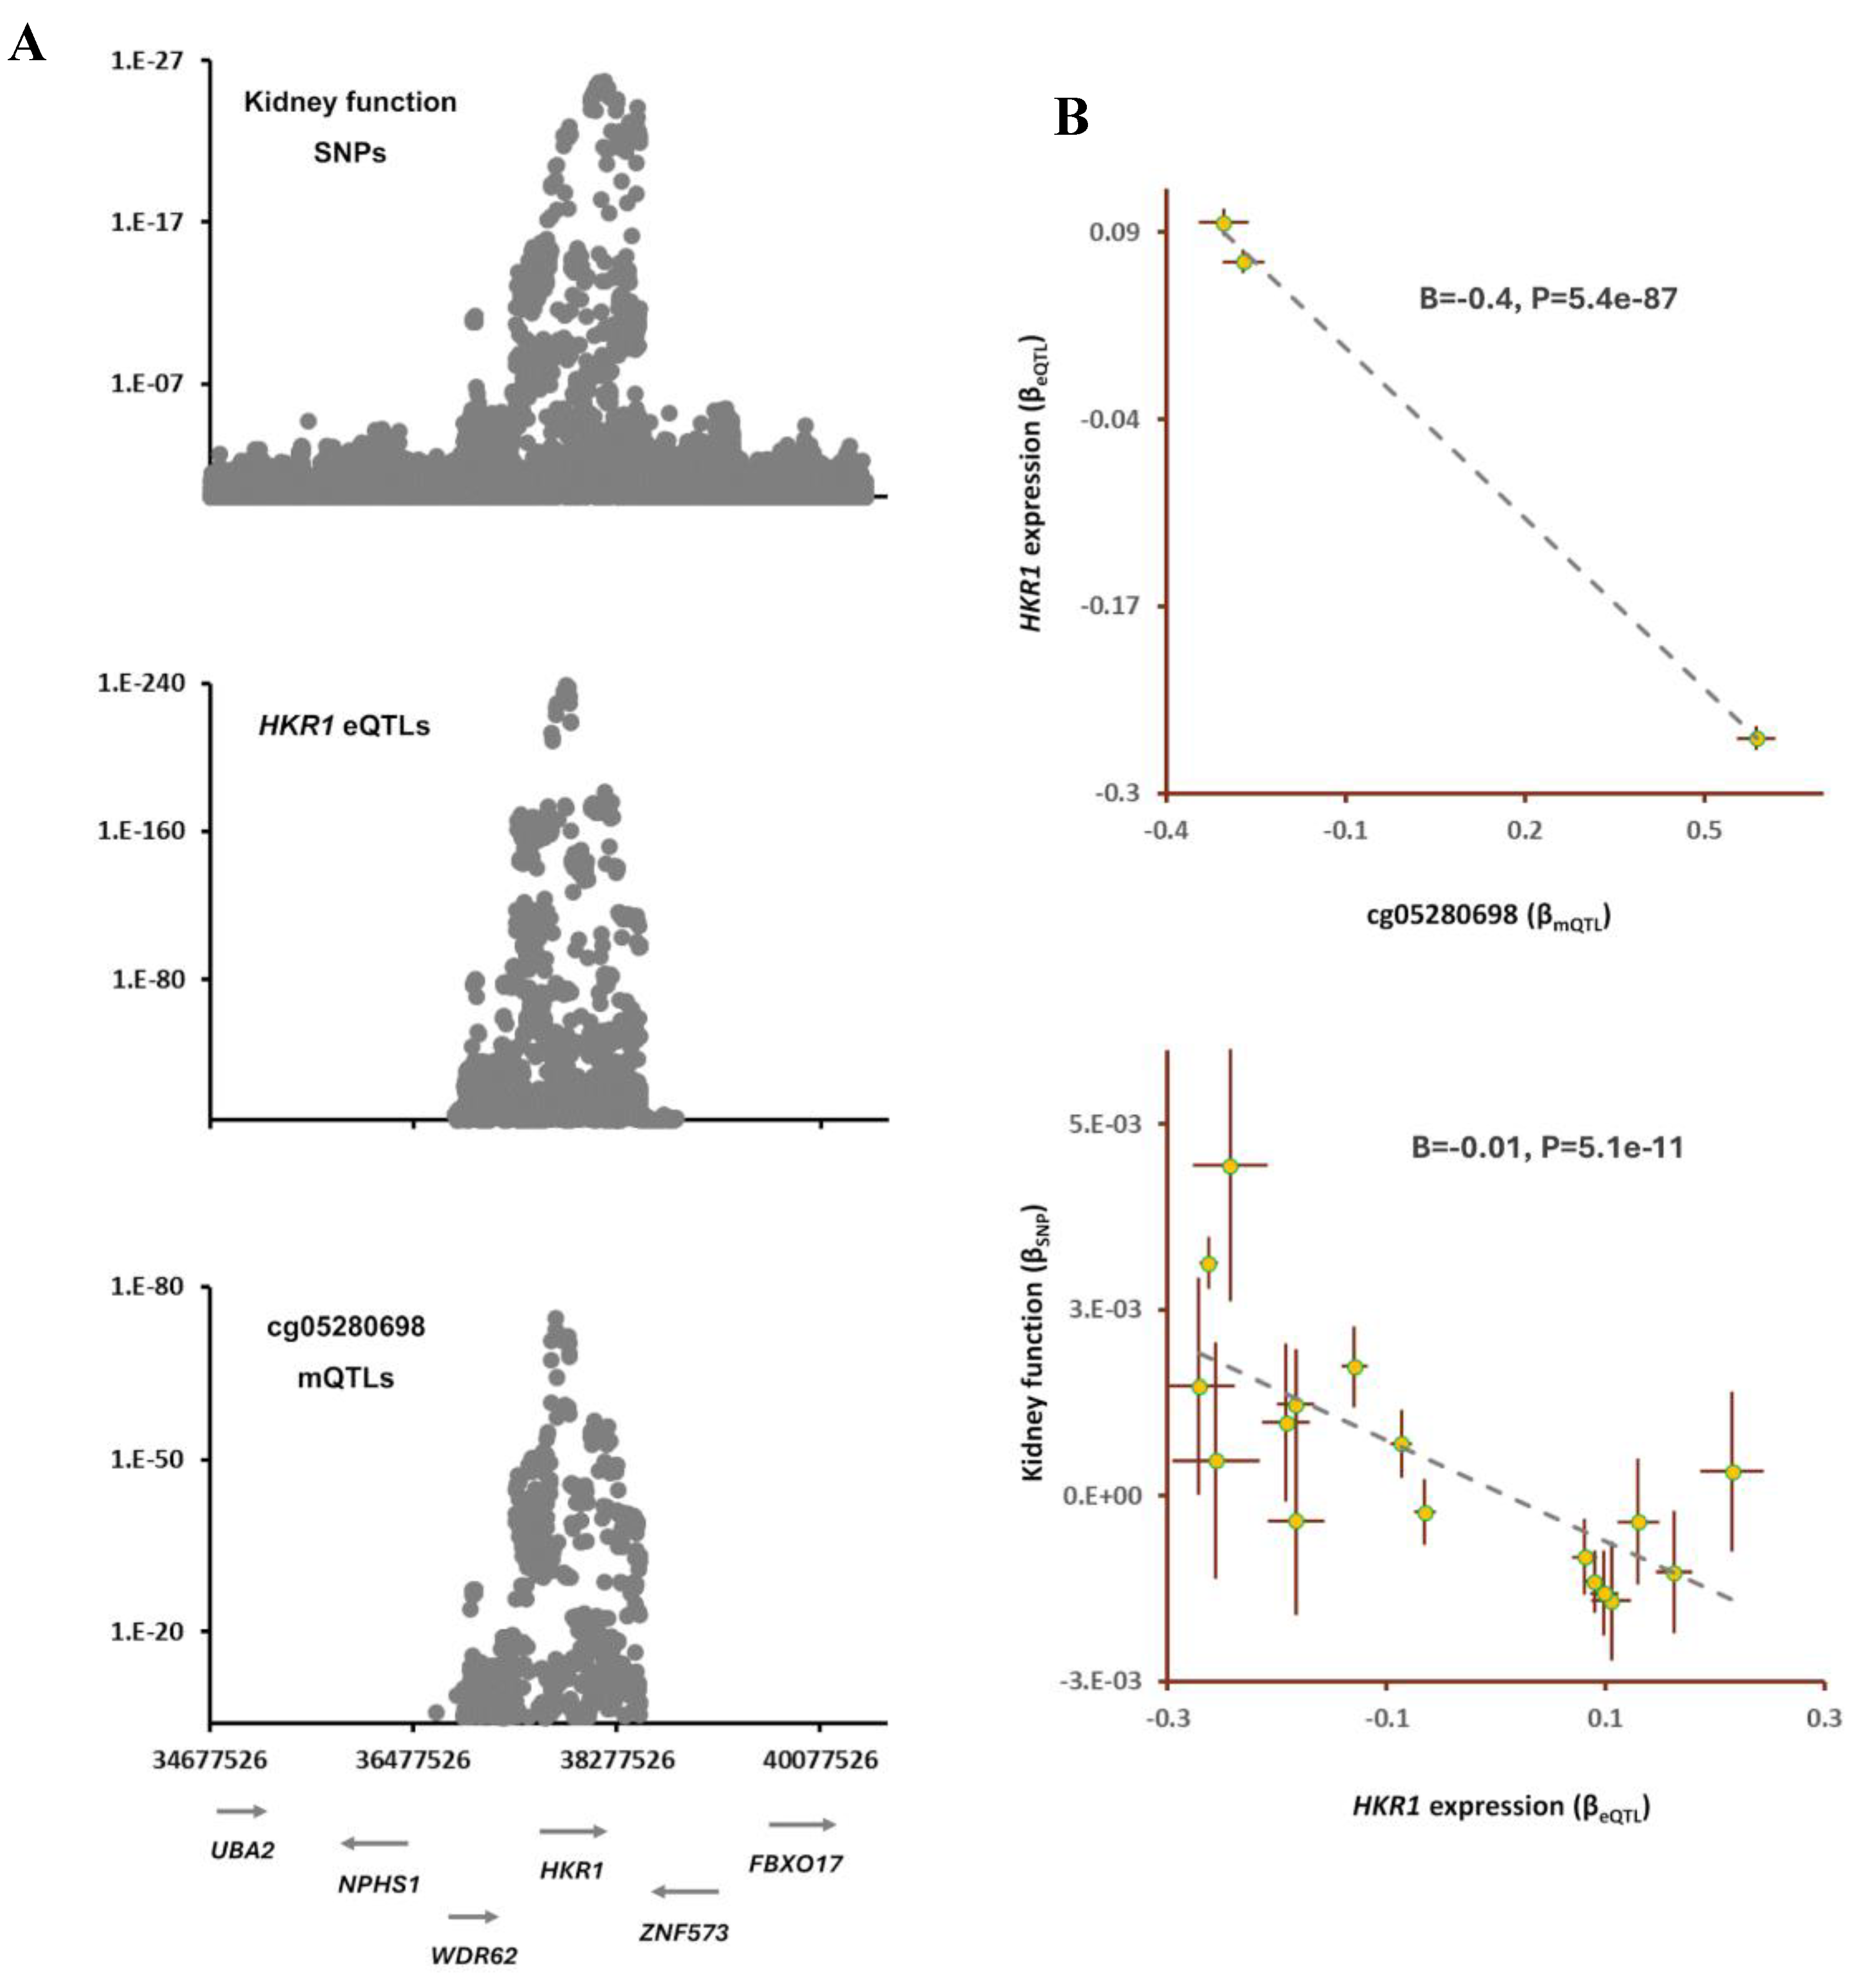
Figure 5.
cg03186999 mediates the impact of air pollution on systolic blood pressure (SBP) by lowering the expression of CTDNEP1. A) I noted an overlap between mQTLs of cg03186999, SNPs for SBP and eQTLs for CTDNEP1. The cg03186999 site is reported to be hypomethylated in individuals exposed to air pollution (Table S2). B) The outcome of Mendelian randomization (MR) analysis confirmed as cg03186999 site becomes hypomethylated, the expression of CTDNEP1 decreases and this leads to higher SBP. Complete statistical details are available in Table S3. Points on MR plots represent SNPs; the x-value of a SNP is its effect size (β) on the predictor, and the horizontal error bar indicates standard error. Similarly, the y-value of the SNP indicates its effect size on the outcome, and the vertical error bar indicates the standard error. The dashed line represents the line of best fit (a line with the intercept of 0 and the slope of β from the MR test).
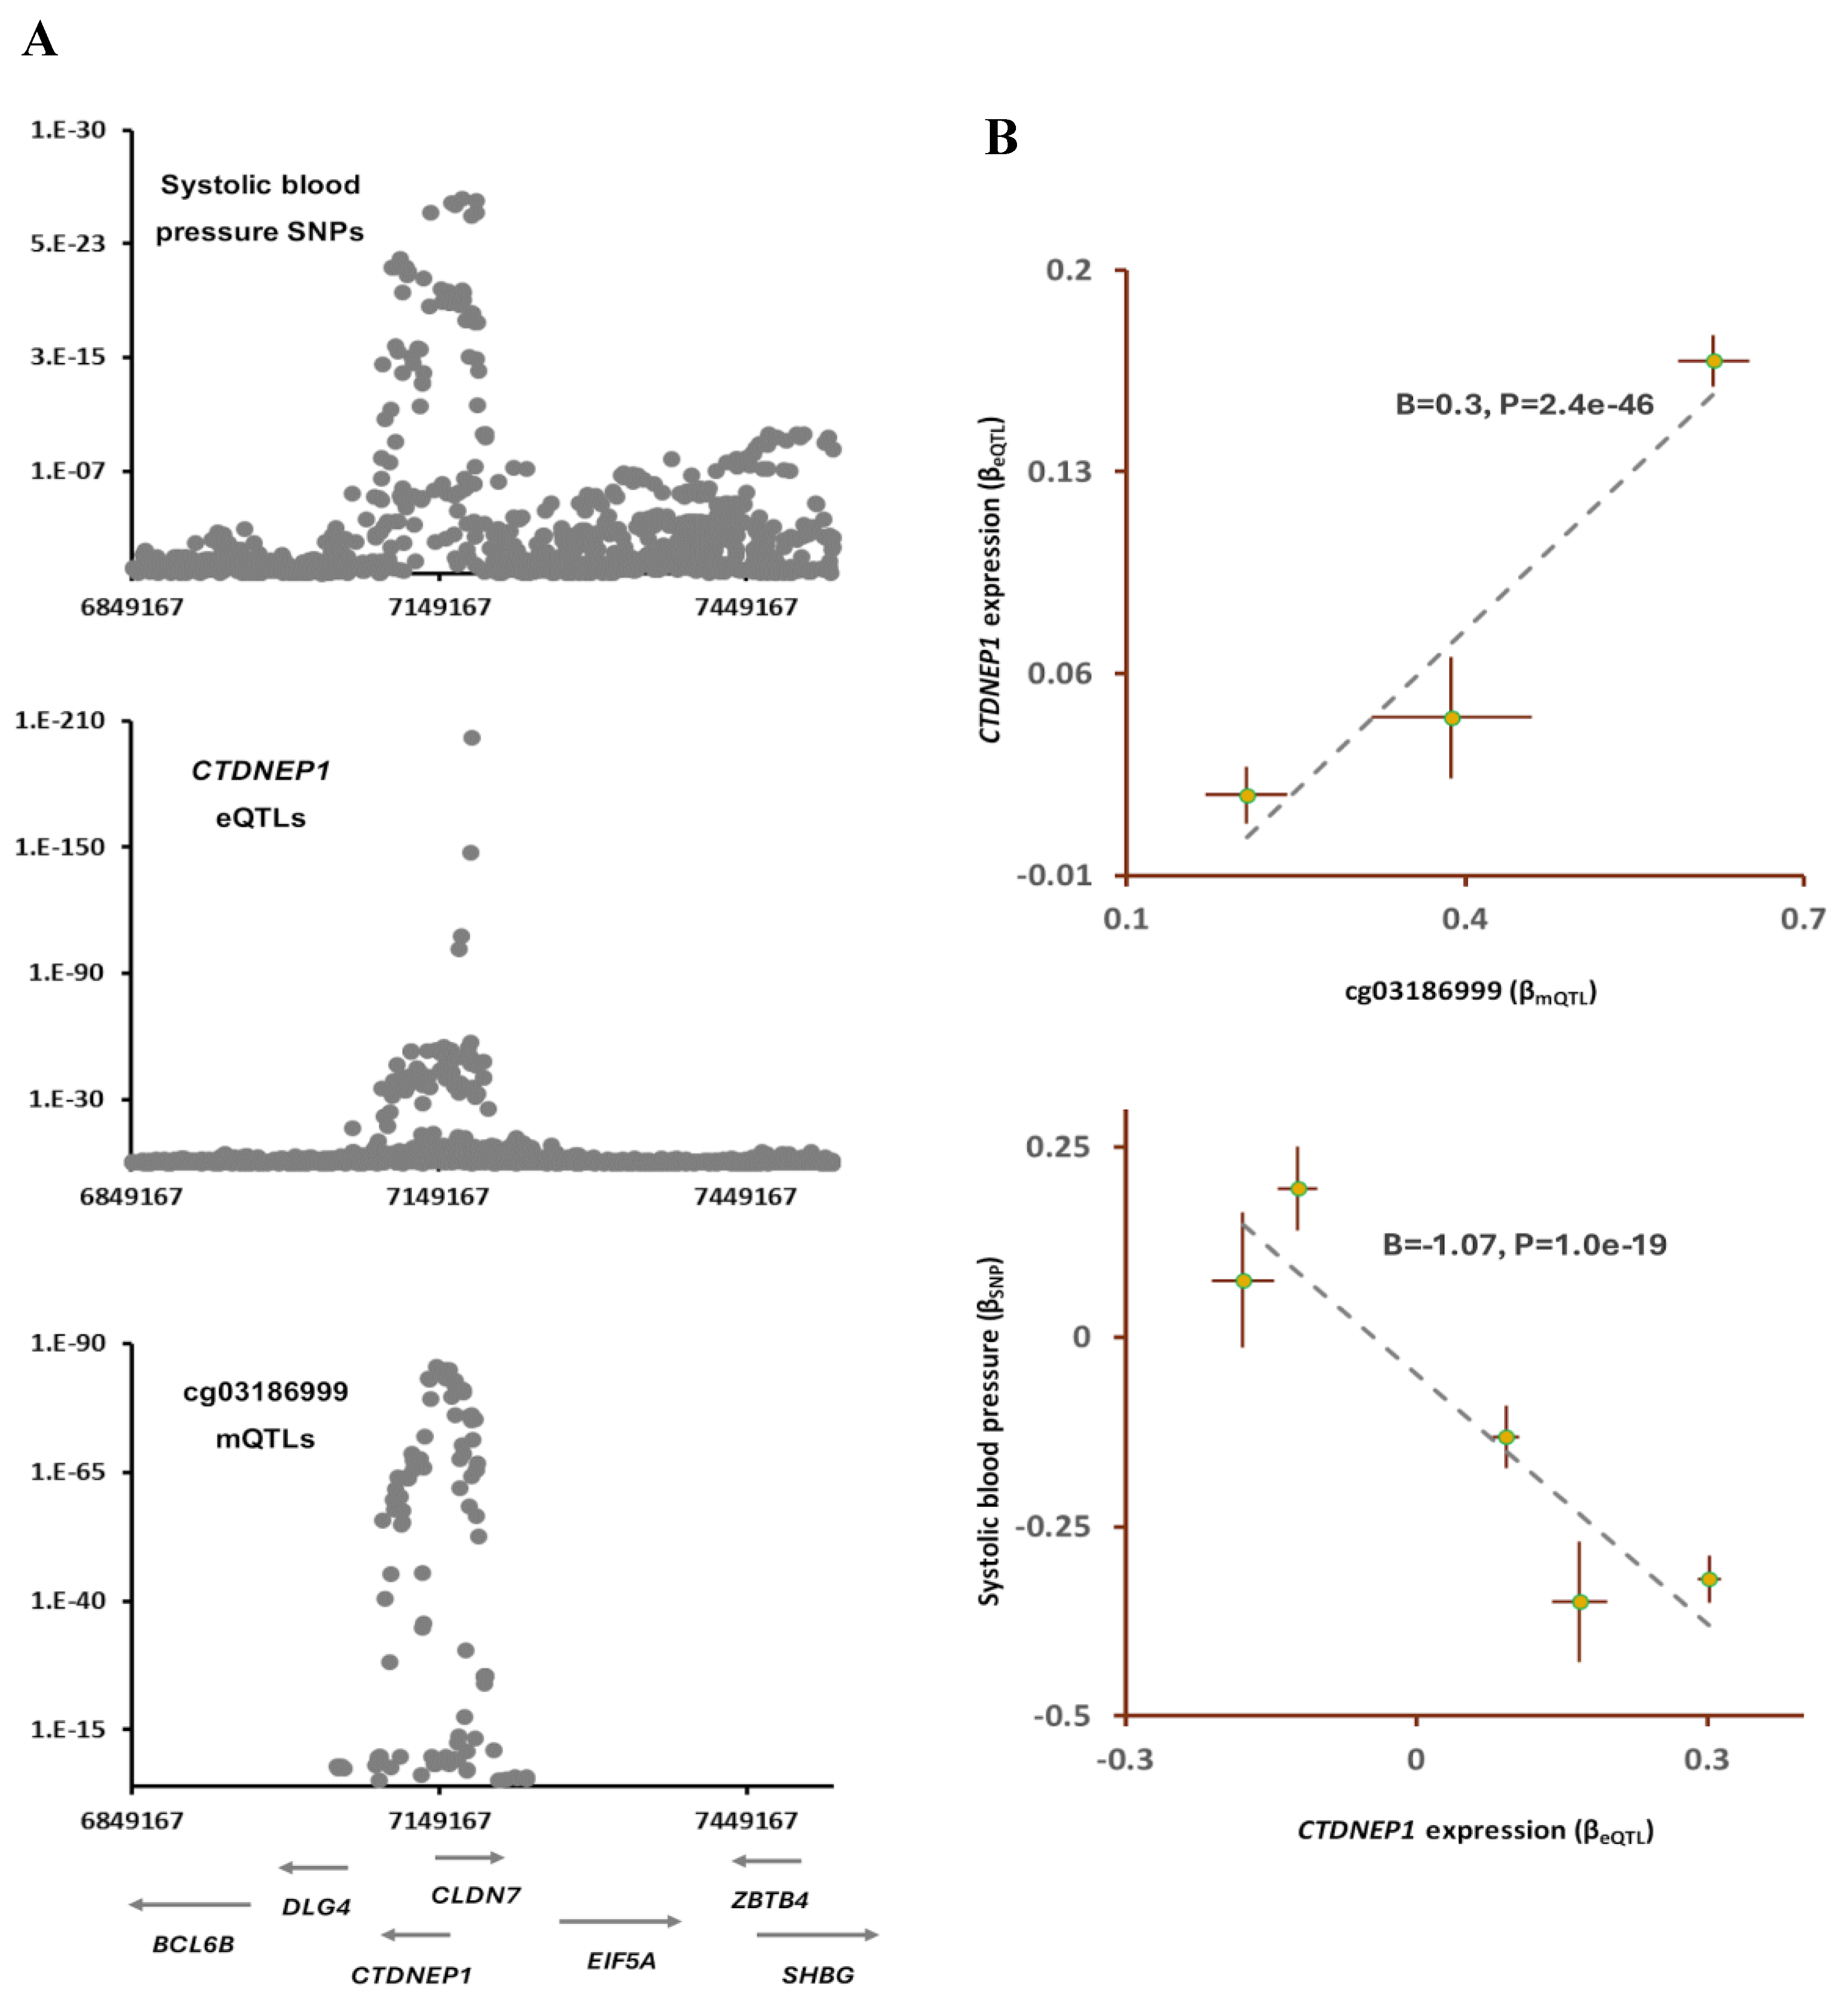

Table 1.
Colocalization analysis revealed CpG sites that their mQTLs overlap with SNPs of cardiometabolic traits.
Table 1.
Colocalization analysis revealed CpG sites that their mQTLs overlap with SNPs of cardiometabolic traits.
|
Trait (Source) |
CpG site | Lead SNP (A1 allele) |
Association* | Colocalization results | |||
| B | P | B | PSMR | PHEIDI | |||
| Body fat percentage (UKBB) |
cg23627948 | rs798549(C) | 0.01 | 1.3E-08 | 0.01 | 1.4E-08 | 0.04 |
| 1.41 | <2E-200 | ||||||
| DBP(UKBB) | cg21153102 | rs4924526(A) | 0.17 | 2.5E-23 | 0.18 | 8.0E-22 | 0.3 |
| 0.99 | <2E-200 | ||||||
| Kidney function (PMID: 31152163) |
cg05280698 | rs320881(G) | 0.003 | 2.9E-21 | 0.01 | 4.0E-17 | 0.04 |
| 0.59 | 2.1E-75 | ||||||
| SBP (UKBB) |
cg03186999 | rs402514(T) | -0.28 | 5.1E-19 | -0.45 | 4.6E-16 | 0.01 |
| 0.62 | 8.0E-86 | ||||||
| * It indicates the association of the lead SNP with the trait (first row of the cell) and the CpG site (second row of the cell). | |||||||
Disclaimer/Publisher’s Note: The statements, opinions and data contained in all publications are solely those of the individual author(s) and contributor(s) and not of MDPI and/or the editor(s). MDPI and/or the editor(s) disclaim responsibility for any injury to people or property resulting from any ideas, methods, instructions or products referred to in the content. |
© 2024 by the authors. Licensee MDPI, Basel, Switzerland. This article is an open access article distributed under the terms and conditions of the Creative Commons Attribution (CC BY) license (http://creativecommons.org/licenses/by/4.0/).
Copyright: This open access article is published under a Creative Commons CC BY 4.0 license, which permit the free download, distribution, and reuse, provided that the author and preprint are cited in any reuse.


