
Submitted:
12 June 2024
Posted:
13 June 2024
You are already at the latest version
Abstract
Traffic accidents are among the most common causes of death worldwide. According to statistics from the World Health Organization (WHO), 50 million people are involved in traffic accidents every year. Canada, particularly Montreal, is not immune to this problem. Data from the Société de l’Assurance Automobile du Québec (SAAQ) shows that there were 392 deaths on Québec roads in 2022, 38 of them related to the city of Montreal. This value represents an increase of 29.3% for the city of Montreal compared to the average for the years 2017 to 2021. In this context, it is important to take concrete measures to improve traffic safety in the city of Montreal. In this article, we present a web-based solution based on machine learning that predicts the severity of traffic accidents in the city of Montreal. This solution uses dataset of traffic accidents that occurred in Montreal between 2012 and 2021. Classification algorithms such as eXtreme Gradient Boosting (XGBoost), Categorical Boosting (CatBoost), Random Forest (RF) and Gradient Boosting (GB) were used to develop the prediction model. When evaluating the prediction model, performance metrics such as precision, recall, F1 score, and accuracy are taken into account. The performance analysis shows an excellent accuracy of 96% for the prediction model based on the XGBoost classifier. The other models (CatBoost, RF, GB) achieved 95%, 93% and 89% accuracy, respectively. The prediction model based on the XGBoost classifier was deployed using a client-server web application managed by Swagger-UI and the Flask Python framework.
Keywords:
Traffic Accidents
; Montreal
; Machine Learning
; Severity Prediction
; Road Safety
; Classification Algorithms
1. Introduction
Traffic accidents remain the leading cause of death worldwide [1] and represent a significant burden on the global economy. The 2023 World Road Safety Report shows that road accidents cause 1.19 million deaths annually [2]. According to the World Health Organization, this figure represents a slight improvement as the mortality rate decreased by 0.06 million compared to the findings of the 2015 Global Road Safety Report. Despite these advances, the impact of traffic accidents on mobility is profound and highlights the urgent need for concerted efforts to halve the number of traffic deaths and injuries by 2030 [2]. In Canada, the ratio of traffic accident injuries to deaths was particularly high, with approximately 108,018 injured in 2021 – 66 times higher than the mortality rate [3].
The successful deployment of an intelligent transportation system (ITS) that ensures safety and comfort for road users depends on the development of an accurate and fast algorithm for predicting accident severity. This feature can significantly help various government agencies by allowing them to assess the severity of accidents whose impact is initially unknown. For example, if the severity of an accident is pre-assessed as serious, emergency responders can proactively prepare the necessary medical equipment, thereby improving the efficiency of their response.
A key challenge in accident management is predicting the severity of the accident. Severity is typically considered a dependent variable, with the factors contributing to the accident treated as independent variables or predictors. Researchers analyze traffic accident data to identify key factors that influence these incidents and develop strategies to improve traffic safety. Factors that influence the severity and frequency of accidents include weather conditions, road conditions, speed limits, etc. This information is collected in extensive databases and analyzed using various analytical methods.
Despite numerous research efforts to predict the severity of traffic accidents [4,5,6,7,8], most have relied on a single classifier, predominantly Random Forest. It has been observed that the precision and generalization ability of these prediction models rarely exceeds 90%.
The increasing frequency of traffic accidents worldwide poses a significant public health challenge and results in millions of deaths and injuries each year. Montreal recorded a notable 29.3% increase in traffic fatalities in 2022 compared to the 2017-2021 average, highlighting the urgent need for improved road safety measures. The aim of these measures is to reduce the number of accidents, save lives and improve the safety and comfort of all road users. This highlights the need for a more reliable approach to predicting accident severity to enable preventive improvements in road safety.
This study makes significant contributions to the field of traffic safety and the application of machine learning in public safety management through:
- Development of a Predictive Model: Introducing a novel machine learning-based model that uses the XGBoost algorithm to predict the severity of traffic accidents in Montreal. Our analysis of a comprehensive dataset from 2012 to 2021 shows excellent accuracy (96%) of the model, outperforming other evaluated classifiers such as CatBoost, RF and GB.
- Performance Evaluation of Classifiers: We thoroughly analyzed performance metrics such as precision, recall, F1 score and accuracy and provided insights into the strengths and limitations of each classifier in the context of traffic safety.
- Real-time Prediction Web Application: We developed an innovative web application that implements the XGBoost prediction model through a user-friendly client-server architecture. This application, based on Swagger-UI and the Python Flask framework, provides users with a platform to input data and receive crash severity predictions, helping the Montreal city government implement data-driven traffic safety measures.
The remainder of this paper is organized as follows: Section 2 provides a comprehensive literature review focusing on relevant research in this area. Section 3 provides an overview of the datasets used in this research. In Section 4, we describe the step-by-step process of developing the Montreal Predictor web app. Section 5 presents the results including interpretation. Finally, Section 6 concludes the paper by summarizing the key findings and discussing possible avenues for future research.
2. Related Work
In recent years, machine learning has attracted considerable attention in the scientific community, leading to its application in a wide range of computer science disciplines, particularly in solving prediction problems [9,10,11,12,13]. This trend also impacts the field of traffic safety, particularly in terms of predicting traffic accidents and assessing the severity of these incidents, which have become key areas of interest in traffic safety research. Numerous studies have used machine learning models to deepen our understanding of the variables that influence the severity of an accident and to develop prediction tools with higher accuracy.
[14] conducted a comprehensive study on predicting traffic accidents and contributing factors using explainable machine learning models. The research mainly focused on understanding the complicated relationships between various factors that lead to traffic accidents. Using the New Zealand traffic accident dataset from 2016 to 2020, the study evaluated several machine learning models including RF, Decision Jungle (DJ), AB, Extreme Gradient Boosting (XGBoost), Light Gradient Boosting Machine (LGBM), and Categorical Boosting (CatBoost). Among them, the RF model was found to be the most effective classifier with an accuracy of 81.45%. To delve deeper into the significance of each factor, the Shapley Additive exPlanations (SHAP) method was used. The results showed that the road category and the number of vehicles involved in the accident have a significant impact on injury severity. Leveraging the insights from SHAP analysis led to performance improvements for the DJ, AdaBoost, and CatBoost models. The study highlights the importance of machine learning in understanding and predicting the severity of traffic accidents and provides valuable insights for traffic safety management systems and policymaking.
[15] delved into the field of traffic safety by introducing an innovative ensemble learning method for accident prediction that utilizes both the geometric orientation of the road and traffic data. They recognized the importance of crash prediction models (CPMs) for traffic safety analysis and wanted to improve the predictive capabilities of traditional CPMs and mitigate the overfitting challenges associated with machine learning algorithms. Their research found that ensemble learning CPMs, when integrated into a classification and regression tree (CART) for variable selection, outperform traditional models in terms of model fit and prediction accuracy. However, they also pointed out the instability of machine learning models in sensitivity testing. By comparing traditional and machine learning models, they proposed an ensemble method that improved the accuracy of traditional CPMs by 10-16% and reduced the variance of machine learning CPMs by 12-36%. This study highlights the potential of ensemble learning in advancing accident prediction models and provides insights for future research in this area.
Using the Deep Forests algorithm by [16], the authors investigate the importance of road safety in sustainable transport. They recognize the challenges in predicting the severity of traffic accidents and highlight the evolution of predictive models from linear to nonlinear forms as well as the transition from traditional statistical regression models to modern machine learning models. Deep Forests, a remarkable machine learning algorithm based on the ensemble of decision trees, has attracted attention due to its accuracy and robustness. Motivated by its potential, researchers used the UK road safety dataset to introduce a novel method for predicting road accident severity using the Deep Forests algorithm. A comparative analysis with other machine learning algorithms revealed the superior stability, minimal hyperparameters, and unmatched accuracy of the Deep Forests algorithm, especially on different training datasets. The study highlights the potential of its findings to improve road safety systems, support government strategies to proactively prevent road accidents and ultimately improve road safety.
[17] worked intensively on predicting traffic accidents using the possibilities of deep learning. Their research was based on the assumption that machine learning, particularly deep learning, has the potential to revolutionize the way we perceive and analyze traffic accidents. By introducing an improved deep learning model, the team wanted to decipher the complex interaction of various elements such as road, traffic dynamics and environmental factors. Their model was divided into two main modules: an unsupervised functional learning module and a supervised fine-tuning module. A key highlight of their work was the integration of a multivariate negative binomial model (MVNB) into the supervised module, which significantly contributed to addressing the unobserved heterogeneity in traffic accident predictions. When tested on data from Knox County, Tennessee, their model demonstrated a commendable ability to reduce input dimensionality while retaining the essence of the original information. In addition, the model embedded in MVNB outperformed other deep learning and SVM models in predicting the severity of traffic accidents. The overall goal of their study was to provide a more robust and accurate model for predicting traffic accidents and highlight the increasing importance of machine learning in the field of traffic safety.
[18] intensively addressed the challenge of predicting accident severity, a central concern in traffic accident studies. They innovatively combined an artificial neural network with an improved metaheuristic algorithm to optimize its structure, training function and factor analysis. Using data from the Interstate Highway in Washington State from 2011 to 2015, they created a theoretical three-layer neural network. To optimize this network, they introduced an improved PSO (Particle Swarm Optimization) method with adaptive inertia weight. A comparative analysis revealed that although different algorithms had similar prediction accuracies, the backpropagation method combined with a nonlinear inertial weight setting in PSO provided superior global and local optimal search capabilities. The study highlighted that non-road-related factors, particularly those related to vehicles, were more important than road-related variables. This research provides a comprehensive traffic accident analysis tool useful for policymakers and traffic safety researchers.
[19] investigated car accidents that occurred between 2018 and 2020 using the national detailed vehicle accident investigation system in China. In addition to the previously examined features, their creative approach included four additional accident features: accident location, accident shape, road information, and collision speed. Using the random forest algorithm, they evaluated the importance of these twelve accident attributes and ultimately selected seven key features. Their goal was to develop a more accurate prediction model for the severity of traffic accidents. The study highlighted the increasing number of cars and the resulting traffic accidents, which lead to significant human and economic losses. Their results highlight the superior performance of the random forest algorithm in predicting the severity of traffic accidents compared to other methods.
A comprehensive study presented at the IEEE Bombay Section Signature Conference 2022 [20] delved into analyzing traffic accident data to gain insights into infrastructure and policy vulnerabilities. Their main goal was to improve road safety by understanding the factors that contribute to accident severity. Using Kernel Density Estimation (KDE) charts, they identified hotspots of accident-prone areas based on their severity over the years and provided insight into the evolution of these danger zones. Additionally, the research used machine learning algorithms to predict accident severity based on various parameters, with the aim of identifying the most influential factors. The dataset used for this study comes from the UK and provides a comprehensive overview of road accidents from 2005 to 2017. The accidents were classified into three levels of severity: minor, serious and fatal. The study also compared the performance of several machine learning models, including Naive Bayes, Logistic Regression, AdaBoost, XGBoost and Random Forest classifiers, to classify accident severity. The results of this research not only provide a detailed understanding of traffic accidents, but also serve as a basis for traffic safety initiatives and policy recommendations.
[21] conducted a data-driven study to examine the causes of traffic accident severity. The aim of the research was to use the UK road accident database to identify the most influential factors that contribute to the severity of a road accident. The study used various mathematical and statistical tools, with a focus on machine learning and data mining techniques. Three data mining algorithms, namely Neighborhood Component Analysis (NCA), k-Nearest Neighbors and Individual Conditional Expectation, were used to identify the most important factors affecting the severity of a traffic accident. The research highlighted the importance of factors such as lighting conditions, driver age, vehicle age, vehicle type, roadway hazards and physical pedestrian crossings in determining the severity of road accidents. The study’s methodology offers a new perspective by focusing on variables based on their statistical significance rather than traditional clusters or individual variables. The results are consistent with previous studies conducted in different countries and highlight the universal nature of these influencing factors in traffic accidents.
In the study by [22], the authors address the urgent problem of traffic accidents, which claim around 1.3 million lives worldwide every year. Recognizing the multiple causes of these accidents, researchers used artificial neural networks (ANNs) to predict traffic disruptions. Specifically, they developed two ANN models to predict accidents on roads in the Republic of Serbia and Republika Srpska (Bosnia and Herzegovina). These models use objective determinants such as road length, terrain type, road width, average daily traffic volume, and speed limits. The aim is to predict not only the occurrence of accidents, but also the severity of their consequences, including deaths, injuries and property damage. The models demonstrated impressive accuracy, with values reaching as high as 0.990 in some cases. By identifying important key factors, the study highlights the potential of ANNs to improve traffic safety and support traffic planning decisions. This research is a groundbreaking achievement in the application of ANNs to predict traffic accidents in the mentioned regions based on objective criteria.
[23] focused intensively on predicting the severity of traffic accidents, with a particular focus on Mauritius. Their research leveraged the capabilities of artificial neural networks (ANNs), particularly multilayer perceptron (MLP), to predict the severity of these incidents. Through careful manual tuning, they determined the optimal values for various hyperparameters and achieved an accuracy rate of about 84.1% with the MLP. This performance exceeded that of other machine learning models they had previously evaluated on the same data set. The study highlighted the importance of understanding the root causes and severity of road accidents given the global impact on safety and infrastructure. Their results highlighted the potential of MLP in predicting the severity of traffic accidents, outperforming other algorithms such as support vector machine, gradient boosting and logistic regression. The research contributes to the broader goal of improving road safety policies and measures through data-driven insights.
In the study by [24], researchers address the pressing issue of pedestrian safety in traffic accidents, particularly in Italy. Every year in Italy there are approximately 20,000 traffic accidents involving pedestrians, with a significant proportion (approximately 30%) occurring at pedestrian crossings, where pedestrians should ideally be most protected. The study presents a novel accident prediction model that aims to improve pedestrian safety assessment. This model, developed using the ISTAT dataset, includes data on fatal and personal injury accidents in Italy over a five-year period. The main goal is to estimate the risk level of a road section using a machine learning approach, specifically the gradient boosting technique. This method was chosen for its ability to detect nonlinear relationships that may be difficult to detect using traditional methods. The results of the model allow the potential risk to be divided into three categories: high, medium and low. The effectiveness of the model is reflected in the precise analysis of the locations in the data set. The overall goal of the research is to provide practitioners with a robust tool for conducting pedestrian accident analysis. The study highlights the importance of understanding the factors that influence pedestrian safety, particularly in urban areas with high pedestrian density. Effective infrastructure measures are crucial for pedestrian safety. This requires a comprehensive understanding of the risk factors and causes of pedestrian accidents. The research also highlights the potential of tree-based machine learning models as promising alternatives in this area due to their ability to understand complex data sets and explore relationships between different variables. The study is part of the SWALK research project, the aim of which is to evaluate the effectiveness of various safety measures to reduce pedestrian accidents and adapt user behavior to road infrastructure.
[25] addressed the increasing concern over traffic accidents, particularly in urban areas, which have changed the global transportation landscape. The main objective of the study was to locate dangerous road sections through spatial pattern analysis of accidents and identify the main factors leading to serious and fatal road traffic crashes (RTCs). Using tree-based ensemble models such as gradient boosting and random forest, as well as logistic regression, they analyzed crash data from Al-Ahsa in Saudi Arabia from 2016 to 2018. The random forest method was particularly suitable for identifying related features. The RTC severities are closely related. The main results showed that the cause of the accident and the type of collision determined the severity of the injury. Distracted driving, abrupt lane changes and speeding contributed significantly to serious accidents. The study also included spatial autocorrelation analysis, with a focus on identifying crash hotspots. The methods used provided a robust approach to locating and classifying accident hotspots, providing valuable insights for policy makers seeking to improve road safety.
[26] conducted a comprehensive study on the severity of highway accidents in Saudi Arabia, with a particular focus on Qassim Province. The research found that Saudi Arabia faces significant road safety challenges among G20 countries, with driver distraction a leading cause of serious accidents. The study used data from January 2017 to December 2019, which came from the Ministry of Transport and Logistics Services. Three machine learning models, namely Random Forest, XGBoost and logistic regression, were used to predict the severity of accidental injury. The study also addressed data imbalances using a resampling technique. SHAPley Additive ExPlanations (SHAP) analysis was used to interpret and classify the factors that contribute to accidental injuries. The results showed that the XGBoost model outperformed the other two in terms of accuracy, precision, recall and other metrics. The results of the study are expected to help policymakers formulate effective strategies to improve road safety in the Qassim region and other parts of Saudi Arabia.
In the study by [27], researchers delved into the prediction and analysis of traffic conditions after accidents in urban highway tunnels, focusing on the YingTian Road Tunnel in Nanjing City. Given the frequent accidents in these tunnels, the study aimed to prevent traffic congestion after accidents. The study analyzed data from 200 traffic accidents and extracted influencing factors in three dimensions: time, traffic flow and tunnel environment. A novel approach was used using Graph Convolutional Long Short-Term Memory Networks (GCN-LSTM) to predict and supplement missing traffic flow data. The study also used Pearson correlation analysis to select seven independent variables, which were then entered into a backpropagation neural network (BP) and random forest model. The aim of these models was to predict the traffic conditions in the tunnel during accidents and the duration of these accidents. The results showed the superiority of the random forest model in terms of accuracy, robustness and generalization, especially in predicting accident duration. The results of this research have significant implications for tunnel operations management during accidents and highlight the importance of accurate predictive models in ensuring smooth traffic flow and minimizing disruptions.
[28] focused on predicting crash injury severity, a key aspect of traffic safety research. Historically, statistical methods dominated this field, but the emergence of machine learning techniques has brought about a paradigm shift due to their superior predictive capabilities. However, these machine learning models often act as black boxes, making their internal workings opaque. In their study, Zhang and his team compared the predictive performance of various machine learning and statistical methods, particularly focusing on their ability to model the severity of an accident. Using data from highway areas in Florida, they evaluated two common statistical methods: the ordered probit (OP) model and the multinomial logit model. In addition, they evaluated four machine learning methods: K-Nearest Neighbor, Decision Tree, Random Forest (RF), and Support Vector Machine. Their results highlighted the superior prediction accuracy of machine learning methods, with RF proving to be the most effective solution for general and major accidents. However, they also pointed out the potential overfitting issues associated with machine learning techniques. Using perturbation-based sensitivity analyses, the study compared the significance of variables across methodologies, highlighting inconsistencies and urging caution in interpretation. The overall goal was to improve crash injury severity prediction models by comparing different algorithms and refining the results. The study highlights the increasing reliance on machine learning in road safety research as it has the potential to revolutionize crash severity prediction.
[29] conducted a comprehensive analysis of the severity of traffic accidents in Setúbal District, Portugal, using data from 2016 to 2019. Given Portugal’s high road fatality rate within the European Union, the study aimed to identify determining factors that contribute to the frequency of accident casualties and the factors that lead to deaths or serious injuries. The research used logistic regression models and compared the results with those of machine learning models. The data comes from the Road Traffic Accident Statistics (BEAV) and includes over 28,000 accidents involving more than 50,000 vehicles and 8,000 victims. The severity of the injuries was classified into fatal, serious and minor injuries. The study also included meteorological data to understand the influence of weather conditions on accident severity. Preliminary results suggest that machine learning models did not significantly outperform statistical models in unbalanced datasets, but showed comparable performance in larger, balanced datasets. The research highlights the importance of understanding the determinants of crash severity to improve road safety policies and strategies.
[30] delved into the challenges trauma and emergency centers face in quickly determining the severity of traffic accidents and emphasized the importance of a timely and appropriate emergency response. Recognizing the limitations of traditional parametric techniques in predicting accident severity, they introduced a two-layer ensemble machine learning model. This innovative approach initially combines four fundamental machine learning models: k-Nearest Neighbors, Decision Tree, Adaptive Boosting and Support Vector Machine. The subsequent layer then classifies the severity of the accident using a feedforward neural network model. The data, spanning six years (2011-2016) and sourced from the UK Department for Transport’s online database, focuses on crash characteristics that can be recorded quickly and easily. The effectiveness of the two-layer ensemble model was compared with five baseline models and showed superior performance in terms of test accuracy and F1 score. In addition, the model’s adaptability was validated using a 3-year crash dataset from Canada, where it once again demonstrated its performance. The study highlights the potential of the two-layer ensemble model in predicting accident severity with remarkable accuracy and enables trauma centers to prepare for timely and appropriate medical interventions based on preliminary accident data from the accident scene.
[31] conducted an in-depth analysis of the severity of traffic accidents using data visualization and machine learning techniques. Their study used a comprehensive dataset from February 2016 to December 2019, covering 49 states in the US. The main goal was to identify the key factors influencing accident severity, taking into account aspects such as location, time, infrastructure and environmental conditions. Their results made it clear that moderate-severity accidents occurred more frequently than very low- or high-risk accidents. Factors such as infrastructure, specific days of the week and changing weather conditions had a significant impact on the severity of the accident. The Random Forest algorithm proved to be the most effective, achieving an impressive 97.2% accuracy in predicting the severity of traffic accidents. The findings from this research can help those involved identify risk scenarios and implement measures to improve road safety.
[32] launched a comprehensive study to predict and classify the severity of motorcycle accidents, particularly in the context of Ghana. Recognizing that there is little research into the severity of motorcycle accidents in Ghana, they used machine learning-based algorithms to examine the likely risk factors and their association with accident severity. The study used data from 2011 to 2015, which came from the National Road Traffic Crash Database of the Building and Road Research Institute (BRRI) in Ghana. Data were categorized into four injury severity levels: fatal, hospitalized, injured, and damage only. Three machine learning models were used, namely J48 Decision Tree Classifier, Random Forest (RF) and Instance-Based Learning with parameter k (IBk). Their performance was compared using the multinomial logit model (MNLM). The results of the study highlighted the superior predictive capabilities of machine learning algorithms over MNLM, with the RF algorithm emerging as the most accurate. Important factors that influence injury severity in a motorcycle accident have been identified, including type of location, time of accident, type of settlement, collision partner, type of collision, road separation, type of road surface, day of the week and road condition. The significance of the study lies in the innovative application of machine learning to analyze the severity of motorcycle accidents, thereby filling a knowledge gap in the Ghanaian context.
Although these studies have made significant progress in their respective fields, our current work is notable for its focus on crash severity in the city of Montreal to improve traffic safety. Our approach leverages the ensemble of supervised machine learning algorithms to develop a web-based application for predicting accident severity in Montreal.
Table 1 briefly summarizes these studies based on their focus, data used, models evaluated and key findings related to urban traffic safety:
3. Data Overview
In this section we provide an overview of the dataset. The discussion focuses on two critical dimensions: First, the provenance of the data used in this study is examined, which provides insights into the provenance and reliability of the data. Second, a detailed description of the dataset is provided, detailing its characteristics and relevance to the research objectives.
3.1. Data Source
This study uses data on traffic accidents in Montreal from 2012 to 2021. The data was compiled from incident reports (R1) from the Montreal Police Service (Service de Police de la Ville de Montréal (SPVM). They were then organized by the SAAQ and standardized in a database. This dataset is publicly available on the Québec Data web portal [33] and is distributed under an attribution license (CC-BY 4.0) [34].
To analyze the geographical distribution of collisions, a special geomatics method was used. This method was developed specifically for Montreal’s urban road network and deliberately eliminates incidents on highways. Geolocation of collisions was determined using various parameters from the SAAQ reports, including civic number, street or intersection. Quality and precision indices were also integrated into the analysis to assess the reliability and accuracy of the location data in relation to the road network. This step was crucial to ensure the high precision of the geolocation results.
3.2. Data Description
Insights into the dataset were obtained using the info method from the Python Pandas library [35]. Below are the attributes used as input in the modeling process:
- street_name (RUE_ACCDN): Name of the street where the collision occurred.
- collision_near (ACCDN_PRES_DE): Landmark near the collision site.
- collision_type (CD_GENRE_ACCDN): Type of collision.
- surface_condition (CD_ETAT_SURFC): Condition of the road surface.
- road_category (CD_CATEG_ROUTE): Category of the road.
- longitudinal_location (CD_LOCLN_ACCDN): Longitudinal location.
- weather_conditions (CD_COND_METEO): Weather conditions.
- light_cars_trucks_count (nb_automobile_camion_leger): Number of light cars and trucks involved.
- heavy_trucks_count (nb_camionLourd_tractRoutier): Number of heavy trucks involved.
- bicycle_count (nb_bicyclette): Number of bikes involved.
- motorcycle_count (nb_motocyclette): Number of motorcycles involved.
- emergency_vehicle_count (nb_urgence): Number of emergency vehicles involved.
- unspecified_vehicle_count (nb_veh_non_precise): Number of unspecified vehicles involved.
- authorized_speed (VITESSE_AUTOR): Authorized speed on the road.
- x_coordinate (LOC_X): X coordinate (Nad83 MTM8).
- y_coordinate (LOC_Y): Y coordinate (Nad83 MTM8).
- hour (HR_ACCDN): Hour of the collision.
The target variable (Severity) is divided into five classes: Damage Below Reporting Threshold, Property Damage Only, Minor, Serious, and Fatal.
Figure 1 below show the distribution of different classes within the Severity attribute using a pie chart.
Analysis of Figure 1 shows significant imbalance between classes within the severity attribute. Therefore, implementing a data balancing strategy is crucial to improve the performance of the predictive model. This issue is discussed in more detail in the methodology section of our article.
A summary of the characteristics of the dataset can also be found in Table 2 below:
Examination of Table 2 shows that the data set contains 218,272 rows and 68 attributes (columns). It includes a mix of data types that include both numeric or continuous variables (int64, float64) and categorical or discrete variables (object). This variety of data types suggests a rich store of information covering a wide range of aspects, from geographical and temporal data (e.g. date and location of the accident) to specific accident details (e.g. the type of vehicles involved and the severity of the accident). The significant number of categorical variables highlights the need for appropriate data processing, particularly the encoding of these variables, when preparing the data for the predictive model.
4. Methodology
This section describes our approach to conceptualizing traffic accident prediction in Montreal as a multiclass classification problem. Each accident is assigned a severity level that classifies it into one of five different categories: damage below the reporting threshold, property damage only, minor, severe and fatal accidents. This categorization forms the basis of our multiclass classification task.
Our research includes a thorough evaluation of several machine learning algorithms: XGBoost, CatBoost, RF and GB. These algorithms are used to analyze the traffic accident dataset in Montreal with the aim of predicting accident severity with high accuracy. The main goal is to find out which algorithm works well in this particular context.
Subsequent sections of this document provide a comprehensive description of the methods implemented in developing the predictive model. This includes an in-depth study of our data pre-processing methods, feature selection process, exploratory data analysis, construction of the predictive model and its subsequent validation and evaluation phases. The ultimate goal is to establish a prediction system that is not only precise, but also precisely tailored to the specific characteristics of the severity of traffic accidents in Montreal.
4.1. Data Preprocessing
In this subsection, we summarize the essential preprocessing steps performed to prepare our dataset for the predictive modeling task. First, temporal attributes such as Collision_Hour and Collision_Date were converted into numerical representations (time, day of the week, day and month) using the to_datetime function from the Pandas library. This standardization helps to adapt the data to the model requirements.
Redundant data, including duplicate or irrelevant columns, has been removed to improve the efficiency and accuracy of the model.
Categorical variables were encoded numerically to ensure compatibility with our predictive models. For example, the Severity attribute was encoded using Label Encoding as shown in Table 3, where each severity level is assigned a unique numerical value to facilitate model processing.
4.2. Dealing with Missing Values
In this subsection, we explain our method to address missing data in the dataset. Columns with missing values are identified, and the percentage of missing data per column is calculated using the Python Pandas library. The proportion of missing data is expressed as the ratio of missing values per column to the total number of rows, multiplied by 100.
To address missing data issues, we implemented an imputation strategy [36,37] subject to the following rules:
- Delete columns that are missing more than 50% of the data.
- For columns of a numeric type that represent categorical variables, we replace missing values with the value from the previous row (using the fillna method from the Python Pandas library with method=ffill). This method is chosen to preserve the order of the data wherever possible, assuming that adjacent entries are likely to have similar or identical categorizations, which is common with time series or ordered datasets.
- For purely numeric columns, replace missing values with the column mean. This approach is used to maintain the overall distribution and central tendency of the data. This is important to avoid biasing results in predictive modeling. However, we are aware of the potential biases that this method introduces and therefore limit its application to columns where the mean is a representative summary statistic of the underlying distribution.
4.2.1. Solving the Data Imbalance Problem
This subsection explains the methodology for resolving data imbalance issues related to the Severity attribute. It is important to highlight that data imbalance can significantly impact the accuracy of a predictive model, often leading to a bias toward the more common classes. This problem is particularly pronounced in the Fatal category of the Severity attribute. Despite its critical importance in representing fatal accidents, its relative rarity in the data set risks the model dismissing it as an outlier, which in turn biases predictions towards more common categories. To address this imbalance, we evaluated the effectiveness of four different balancing algorithms: Synthetic Minority Oversampling Technique (SMOTE) [38], SMOTE combined with Tomek Links (SMOTE-Tomek) [39], SMOTE combined with Edited Nearest Neighbors (SMOTE-ENN) [40], and Adaptive Synthetic Sampling approach (ADASYN) [41]. These methods were tested for their ability to handle data imbalances in conjunction with a random forest classifier. The algorithm that best balances the data and maintains high accuracy was then selected.
4.3. Feature Selection Using the Chi-Square Statistical Method
In this subsection, we present the approach used to select the top thirty input variables that are most highly correlated with the target variable Severity for our prediction model. To achieve this, we use the chi-square statistical method to quantify the importance of input variables relative to the target variable. The selection of features based on the chi-square statistical method is supported by existing studies [42,43,44], which highlight its effectiveness in classification problems with multiple input variables. The chi-square statistical method is given by the following equation 1.
Where:
- is the chi-square statistic.
- n is the number of observation categories.
- is the observed frequency in category i.
- is the expected frequency in category i under the null hypothesis that the observed and expected frequencies are independent.
Table 4 below shows the list of the thirty most relevant input variables, ordered in descending order of correlation with the target variable, according to the importance measure derived from the chi-square statistical method.
4.4. Exploratory Data Analysis
In this subsection, we present visual analysis charts that examine the temporal dynamics of accident severity. The following graphics are discussed:
- Hourly Accident Severity Distribution: This chart illustrates the distribution of accident severity throughout the day, categorized by each hour.
- Weekly Accident Severity Distribution: This chart shows the distribution of accident severity across the days of the week and provides insight into daily patterns.
- Monthly Accident Severity Distribution: This chart shows how accident severity varies from month to month and highlights possible seasonal trends.
- Yearly Accident Severity Distribution: This chart shows annual accident severity
Figure 2 shows the fluctuations in accident frequency over the course of the day, with a clear peak between 3:00 p.m. and 5:00 p.m. This peak can be observed primarily in the categories Damage Below Reporting Threshold, Property Damage Only, and Minor accidents, which is probably related to the increased traffic volume in the evening rush hour. Although Minor accidents are more common, Serious accidents show a similar pattern, with the number of incidents increasing over the same period.
Although the Fatal accidents category is the least common, it is of significant importance to public safety initiatives. In contrast to other categories, fatal accidents do not follow a recognizable daily routine. This suggests that fatal accidents may be influenced less by traffic volume and more by other factors not listed in this graph, such as driving under the influence of alcohol or impaired driving ability.
Figure 3 shows that the categories Damage Below Reporting Threshold, Property Damage Only and Minor accidents occur most frequently during the week and peak on Friday. This pattern is associated with increased traffic as Montreal residents commute to various daily tasks such as work and school. The increase on Fridays is due to people traveling after work and putting weekend plans into action. There is a clear trend, particularly in serious and fatal accidents, with the frequency being lowest on weekdays and increasing significantly on weekends, particularly Saturdays. This observation suggests that although the total number of weekend accidents is decreasing, the proportion of serious accidents is increasing. Possible explanations for this shift include different traffic patterns, weekend driving behavior and other socio-environmental factors unique to Montreal. Overall, the data suggests that the risk of an accident is highest on Friday, while the likelihood of a serious or fatal accident increases over the weekend, with Saturday being particularly dangerous.
Figure 4 makes it clear that incidents in the categories Damage Below Reporting Threshold, Property Damage Only, and Minor are the most common types of accidents during the year. This observation suggests that most accidents in the city of Montreal are not serious in nature. Conversely, accidents that are classified as serious and fatal occur less frequently but show a consistent pattern over time. The data shows a seasonal variation, with the total number of accidents peaking in the winter months of January and February, followed by another peak in the summer months of June and July. These fluctuations are due to adverse weather conditions or an increase in travel activity. In addition, there is a noticeable increase in accidents in December, which is believed to be due to increased travel activity related to preparations for end-of-year celebrations, including Christmas and New Year.
Figure 5 shows the annual distribution of accident severity in the city of Montreal from 2012 to 2021. A trend can be seen in which accidents with pure property damage are the most common, followed by minor injuries. Serious injuries and incidents with damage below the reporting threshold are in the middle range, fatal accidents are the rarest. The year 2013 was characterized by an exceptionally high number of accidents of all levels of severity, particularly those involving pure property damage. From 2014 onwards, there has been a general decline in the number of accidents across all categories, with slight fluctuations. There was a slight increase in accidents in 2018 and 2019, but this trend reversed in 2020. Overall, the city of Montreal is showing a positive trend with falling accident numbers, indicating possible improvements in road safety and the effectiveness of the safety measures implemented. The sharp decline in 2020 could also reflect the impact of external factors such as policy changes, technological advances in vehicle safety or reduced traffic due to circumstances such as the COVID-19 pandemic.
4.5. Development of the Predictive Model
This subsection describes the methodology used to create a predictive model to assess the severity of accidents in Montreal. Our model development strategy is based on the application of four machine learning algorithms: XGBoost, CatBoost, RF, and GB. The selection of these algorithms is based on existing literature [28,45,46,47], highlighting their effectiveness in addressing classification challenges.
We evaluate the performance of these algorithms to determine the most effective classifier. The optimal classifier is then integrated into a web application designed to predict the severity of accidents in Montreal.
In this study, we used 80% of the dataset for training and 20% for testing. Performance metrics such as accuracy, recall, precision and F1 score were used for evaluation.
The following part of this section provides an overview of the learning algorithms used in this study.
4.5.1. Gradient Boosting (GB)
GB is a machine learning method introduced by [48]. This technique involves a boosting process that sequentially creates decision trees. Each tree in the series is intended to correct the errors of its predecessors by building on the information they provided. The process involves adding one weak learner at a time to an incremental additive model while leaving the existing trees unchanged.
Training the GB model involves a series of iterations, gradually improving each tree. After each iteration, the data samples are reweighted: samples that were difficult to classify receive higher weights, while those that were accurately classified receive lower weights. This realignment ensures that subsequent trees focus more on the challenging cases. The contribution of each new tree is added to the cumulative output of the existing trees, continually improving the accuracy of the overall model. Ultimately, the final model represents a weighted sum of all trees, optimized to achieve the best possible classification accuracy for all samples.
4.5.2. eXtreme Gradient Boosting (XGBoost)
Extreme Gradient Boosting (XGBoost) is a powerful ensemble learning technique based on Friedman’s Gradient Boosting framework [48]. In 2016, Chen and Guestrin introduced enhancements to the original Gradient Boosting Decision Tree (GBDT) algorithm, resulting in the development of XGBoost [49]. Both XGBoost and traditional Gradient Boosting are tree-based ensemble methods that combine the predictions of multiple trees to improve classification accuracy. In general, the prediction model () for ensemble methods can be expressed as the sum of the classification scores from all trees (x). XGBoost builds a series of Classification and Regression Trees (CARTs) in parallel, aggregating their results to form the final prediction. The fundamental equation for gradient boosting models is given by equation 2:
where T represents the number of trees, and denotes the space of all possible trees. This model is optimized using the following objective function given by equation 3:
The first term in the objective function is the loss function, which quantifies the difference between the true targets () and the predicted values (). The second term is a regularization component that manages the model’s complexity and prevents overfitting. Unlike standard Gradient Boosting, which primarily employs a learning rate (L) for regularization, XGBoost incorporates an additional regularization term defined by 4:
Here, t is the number of leaves, represents the score of the j-th leaf, and and are regularization parameters. XGBoost is renowned for its high accuracy, efficiency, and ease of use compared to other machine learning algorithms, enabling it to achieve superior performance over traditional GBDT and other widely used models. Experimental results from our case study confirm that XGBoost consistently delivers better outcomes than other machine learning techniques.
4.5.3. Categorical Boosting (CatBoost)
Gradient boosting decision trees like CatBoost are specifically designed to process categorical data using one-hot encoding. [50] claim that implementing minimum variance sampling in node splitting, significantly improves model performance by reducing the amount of data required for each boosting iteration.
4.5.4. Random Forest (RF)
Random Forest is a versatile and powerful machine learning algorithm that uses various decision trees to create a forest. This ensemble method uses the technique of bagging or bootstrap aggregation to improve both the robustness and accuracy of predictions for classification and regression tasks [51]. By training each tree on a random subset of the data and aggregating its predictions, RF significantly reduces the risk of overfitting, making it a reliable choice for complex data-driven problems. Its ability to process large datasets with high-dimensional features, coupled with inherent feature selection capabilities, makes it an indispensable tool in the arsenal of modern data scientists and researchers. The algorithm’s efficiency in creating highly accurate models while maintaining interpretability makes it particularly valuable for both scientific research and practical applications.
5. Results and Discussion
This section describes the performance results of our machine learning models, followed by an analysis of these results.
5.1. Results
The classification report summary (Table 5), together with the confusion matrices (Figure 6), provides a detailed assessment of the predictive performance of each model.
5.1.1. Interpretation of Results
In the previous Table 5, the ensemble methods XGBoost (Figure 6 (c)), CatBoost (Figure 6 (d)), RF (Figure 6 (b)) and GB (Figure 6 (a)) showed different performances, with each model showing strengths in different metrics. XGBoost showed a high weighted average for precision, recall, F1 score and accuracy, all at 0.96, indicating strong consistency of predictions across different classes. CatBoost achieved the highest weighted average scores for these metrics among the tested models, with values around 0.94 to 0.95, reflecting its robustness in dealing with different classifications.
RF also performed well, with a weighted average accuracy of 0.93 and slightly lower precision and recall. However, GB showed slightly lower performance, with weighted average precision, recall, and accuracy values of 0.88 and 0.89, respectively. This indicates a relative decline in the consistency of GB predictions across classes compared to other models.
The precision for the Damage Below Reporting Threshold and Property Damage Only categories varied significantly between models, which could be due to different handling of class imbalances or feature importance. RF and CatBoost showed fewer misclassifications in these categories compared to GB, as suggested by their higher precision and recall values for these classes.
In terms of overall performance, CatBoost and XGBoost were the most robust, achieving the highest scores in most categories and effectively managing the trade-off between precision and recall. This suggests that certain ensemble methods, particularly those focused on boosting such as XGBoost and CatBoost, are more effective for this classification task than others such as GB. RF is also proving to be a strong competitor, particularly when it comes to maintaining high recall and precision across all categories, highlighting its suitability for applications where reducing false negatives is critical.
Based on the previous performance analysis models, the XGBoost-based model was selected for deployment via a web application. This web application is based on a client-server architecture. On the server side, the application is based on the Python Flask framework [52], which provides an endpoint for user interaction. Conversely, on the client side, it uses the Python Flask-Smorest framework and allows user input via a form displayed via Swagger-UI. This setup allows users to pass variables to the server managing the prediction model and receive corresponding predictions about the severity of the Montreal accident.
5.1.2. Comparison of the Results with a Previous Study in the Literature
The performance results of our study are good, especially compared to previous research that use traffic accident data from the city of Montreal for accident prediction. The previous study [53] used a special version of the Random Forest algorithm called Random Forest Balanced, which achieved a traffic accident detection rate of 85% and a false positive rate of 13%. Conversely, our application of the standard RF algorithm, using a balanced dataset, achieved a weighted average accuracy of 0.93, with precision and recall rates of 0.92 and 0.93 respectively. Furthermore, the current study demonstrates a robust ability to accurately classify the severity of traffic accidents into different categories and demonstrates an effective trade-off in identifying all classes associated with the severity of accidents in Montreal.
We attribute the increased accuracy in our model to several factors. Firstly, we utilized enhanced data preprocessing techniques, which included more sophisticated handling of missing values and outliers, to provide a cleaner and more representative dataset for training. Secondly, we employed advanced feature engineering methods that better captured the complexities of traffic data, such as temporal and spatial dependencies, which are crucial for accurate predictions. Lastly, we rigorously optimized the tuning of hyperparameters in the Random Forest model to suit the specific characteristics of our data, unlike the generalized approach used in the previous study. These improvements not only led to more precise predictions but also ensured higher performance consistency across various severity classes compared to the modified approach reported in [53].
6. Conclusions and Future Work
Every year Montreal faces the major challenge of traffic accidents, which not only cause numerous deaths but also have a significant socio-economic impact. In response, our study presents a machine learning-based approach aimed at improving urban traffic safety. We have developed a web application based on a predictive model designed to predict the severity of traffic accidents in Montreal. The basis of our prediction model is based on real data collected from traffic accidents in Montreal between 2012 and 2021 and the use of various machine learning algorithms including XGBoost, CatBoost, RF and GB. The XGBoost algorithm model outperformed the CatBoost, RF and GB models, which recorded accuracies of 95%, 93%, and 89%, respectively. This was discovered after thorough analysis. The accuracy of the XGBoost model was 96%. Additionally, other key performance metrics such as recall and F1-score were taken into account when evaluating these models.
Building on the results of the comparative analysis of these prediction models, we developed a web application that leverages the Python Flask framework and Swagger-UI to provide the most effective prediction model. This application is intended to support the Montreal city government in formulating and implementing strategies to improve road safety in order to reduce the number of fatalities in traffic accidents and improve the overall experience for road users.
Looking forward, we would like to expand the scope of our application to other provinces in Canada. In addition, we will extend the application with a comprehensive graphical interface using the Angular framework. This extension makes it easier to seamlessly integrate additional features such as exploratory data analysis and real-time accident geolocation directly into the user interface.
Supplementary Materials
The following supporting information can be downloaded at the website of this paper posted on Preprints.org
Funding
This research received no external funding.
Data Availability Statement
The dataset used in this study is available on the Données Québec website at https://www.donneesquebec.ca/recherche/dataset/vmtl-collisions-routieres under the attribution license (CC-BY 4.0).
Acknowledgments
This research would not have been possible without access to traffic accident data provided by the city of Montreal. The author would like to thank the city of Montreal for facilitating access to its traffic accident datasets.
Conflicts of Interest
The authors declare no conflict of interest.
References
- Zhang, G.; Yau, K.K.; Chen, G. Risk factors associated with traffic violations and accident severity in China. Accident Analysis & Prevention 2013, 59, 18–25. [Google Scholar] [CrossRef]
- World Health Organization. Global Status Report on Road Safety 2023. Available online: https://www.who.int/teams/social-determinants-of-health/safety-and-mobility/global-status-report-on-road-safety-2023 (accessed on 20 December 2023).
- Transport Canada. Canadian Motor Vehicle Traffic Collision Statistics 2021. Available online: https://tc.canada.ca/en/road-transportation/statistics-data/canadian-motor-vehicle-traffic-collision-statistics-2021 (accessed on 20 December 2023).
- Alkheder, S.; Taamneh, M.; Taamneh, S. Severity prediction of traffic accident using an artificial neural network. Journal of Forecasting 2017, 36, 100–108. [Google Scholar] [CrossRef]
- Çeven, S.; Albayrak, A. Traffic accident severity prediction with ensemble learning methods. Computers and Electrical Engineering 2024, 114, 109101. [Google Scholar] [CrossRef]
- Hashmienejad, S.H.A.; Hasheminejad, S.M.H. Traffic accident severity prediction using a novel multi-objective genetic algorithm. International journal of crashworthiness 2017, 22, 425–440. [Google Scholar] [CrossRef]
- Sameen, M.I.; Pradhan, B. Severity prediction of traffic accidents with recurrent neural networks. Applied Sciences 2017, 7, 476. [Google Scholar] [CrossRef]
- Yan, M.; Shen, Y. Traffic accident severity prediction based on random forest. Sustainability 2022, 14, 1729. [Google Scholar] [CrossRef]
- Dhanya, K.; Vajipayajula, S.; Srinivasan, K.; Tibrewal, A.; Kumar, T.S.; Kumar, T.G. Detection of Network Attacks using Machine Learning and Deep Learning Models. Procedia Computer Science 2023, 218, 57–66. [Google Scholar] [CrossRef]
- Filali, A.; Mlika, Z.; Cherkaoui, S.; Kobbane, A. Preemptive SDN load balancing with machine learning for delay sensitive applications. IEEE Transactions on Vehicular Technology 2020, 69, 15947–15963. [Google Scholar] [CrossRef]
- Hammouri, A.; Hammad, M.; Alnabhan, M.; Alsarayrah, F. Software bug prediction using machine learning approach. International journal of advanced computer science and applications 2018, 9. [Google Scholar] [CrossRef]
- Kumar, R.; Kumar, P.; Kumar, Y. Time series data prediction using IoT and machine learning technique. Procedia computer science 2020, 167, 373–381. [Google Scholar] [CrossRef]
- Muktar, B.; Fono, V.; Zongo, M. Predictive Modeling of Signal Degradation in Urban VANETs Using Artificial Neural Networks. Electronics 2023, 12, 3928. [Google Scholar] [CrossRef]
- Ahmed, S.; Hossain, M.A.; Ray, S.K.; Bhuiyan, M.M.I.; Sabuj, S.R. A study on road accident prediction and contributing factors using explainable machine learning models: analysis and performance. Transportation research interdisciplinary perspectives 2023, 19, 100814. [Google Scholar] [CrossRef]
- Wu, P.; Meng, X.; Song, L. A novel ensemble learning method for crash prediction using road geometric alignments and traffic data. Journal of Transportation Safety & Security 2020, 12, 1128–1146. [Google Scholar] [CrossRef]
- Gan, J.; Li, L.; Zhang, D.; Yi, Z.; Xiang, Q. An alternative method for traffic accident severity prediction: using deep forests algorithm. Journal of advanced transportation 2020, 2020, 1–13. [Google Scholar] [CrossRef]
- Dong, C.; Shao, C.; Li, J.; Xiong, Z. An improved deep learning model for traffic crash prediction. Journal of Advanced Transportation 2018, 2018, 1–13. [Google Scholar] [CrossRef]
- Zhang, C.; He, J.; Wang, Y.; Yan, X.; Zhang, C.; Chen, Y.; Liu, Z.; Zhou, B. A crash severity prediction method based on improved neural network and factor Analysis. Discrete Dynamics in Nature and Society 2020, 2020, 1–13. [Google Scholar] [CrossRef]
- Yang, J.; Han, S.; Chen, Y.; et al. Prediction of Traffic Accident Severity Based on Random Forest. Journal of Advanced Transportation 2023, 2023. [Google Scholar] [CrossRef]
- Gupta, U.; Varun, M.; Srinivasa, G. A Comprehensive Study of Road Traffic Accidents: Hotspot Analysis and Severity Prediction Using Machine Learning. In Proceedings of the 2022 IEEE Bombay Section Signature Conference (IBSSC); IEEE, 2022; pp. 1–6. [Google Scholar] [CrossRef]
- Paul, A.K.; Boni, P.K.; Islam, M.Z. A Data-Driven Study to Investigate the Causes of Severity of Road Accidents. In Proceedings of the 2022 13th International Conference on Computing Communication and Networking Technologies (ICCCNT); IEEE, 2022; pp. 1–7. [Google Scholar] [CrossRef]
- Gatarić, D.; Ruškić, N.; Aleksić, B.; Đurić, T.; Pezo, L.; Lončar, B.; Pezo, M. Predicting Road Traffic Accidents—Artificial Neural Network Approach. Algorithms 2023, 16, 257. [Google Scholar] [CrossRef]
- Sowdagur, J.A.; Rozbully-Sowdagur, B.T.B.; Suddul, G. An Artificial Neural Network Approach for Road Accident Severity Prediction. In Proceedings of the 2022 IEEE Zooming Innovation in Consumer Technologies Conference (ZINC); IEEE, 2022; pp. 267–270. [Google Scholar] [CrossRef]
- Meocci, M.; Branzi, V.; Martini, G.; Arrighi, R.; Petrizzo, I. A predictive pedestrian crash model based on artificial intelligence techniques. Applied Sciences 2021, 11, 11364. [Google Scholar] [CrossRef]
- Islam, M.K.; Reza, I.; Gazder, U.; Akter, R.; Arifuzzaman, M.; Rahman, M.M. Predicting road crash severity using classifier models and crash hotspots. Applied Sciences 2022, 12, 11354. [Google Scholar] [CrossRef]
- Aldhari, I.; Almoshaogeh, M.; Jamal, A.; Alharbi, F.; Alinizzi, M.; Haider, H. Severity Prediction of Highway Crashes in Saudi Arabia Using Machine Learning Techniques. Applied Sciences 2022, 13, 233. [Google Scholar] [CrossRef]
- Shen, Y.; Zheng, C.; Wu, F. Study on Traffic Accident Forecast of Urban Excess Tunnel Considering Missing Data Filling. Applied Sciences 2023, 13, 6773. [Google Scholar] [CrossRef]
- Zhang, J.; Li, Z.; Pu, Z.; Xu, C. Comparing prediction performance for crash injury severity among various machine learning and statistical methods. IEEE Access 2018, 6, 60079–60087. [Google Scholar] [CrossRef]
- Infante, P.; Jacinto, G.; Afonso, A.; Rego, L.; Nogueira, V.; Quaresma, P.; Saias, J.; Santos, D.; Nogueira, P.; Silva, M.; et al. Comparison of statistical and machine-learning models on road traffic accident severity classification. Computers 2022, 11, 80. [Google Scholar] [CrossRef]
- Mansoor, U.; Ratrout, N.T.; Rahman, S.M.; Assi, K. Crash severity prediction using two-layer ensemble machine learning model for proactive emergency management. IEEE Access 2020, 8, 210750–210762. [Google Scholar] [CrossRef]
- Vijithasena, R.; Herath, W. Data Visualization and Machine Learning Approach for Analyzing Severity of Road Accidents. In Proceedings of the 2022 International Conference for Advancement in Technology (ICONAT); IEEE, 2022; pp. 1–6. [Google Scholar] [CrossRef]
- Wahab, L.; Jiang, H. A comparative study on machine learning based algorithms for prediction of motorcycle crash severity. PLoS one 2019, 14, e0214966. [Google Scholar] [CrossRef]
- Ville de Montréal. Collisions routières, [Jeu de données]. Dans Données Québec, 2018. Mis à jour le 19 décembre 2022. [Online; accessed 19 December 2023].
- Licenses, Creative Commons. Attribution 4.0 International (CC BY 4.0). Creative Commons License, 2013. [Website accessed: 2023-12-20].
- McKinney, W.; et al. pandas: a foundational Python library for data analysis and statistics. Python for high performance and scientific computing 2011, 14, 1–9. [Google Scholar]
- Emmanuel, T.; Maupong, T.; Mpoeleng, D.; Semong, T.; Mphago, B.; Tabona, O. A survey on missing data in machine learning. Journal of Big Data 2021, 8, 1–37. [Google Scholar] [CrossRef]
- Nijman, S.; Leeuwenberg, A.; Beekers, I.; Verkouter, I.; Jacobs, J.; Bots, M.; Asselbergs, F.; Moons, K.; Debray, T. Missing data is poorly handled and reported in prediction model studies using machine learning: a literature review. Journal of clinical epidemiology 2022, 142, 218–229. [Google Scholar] [CrossRef]
- Chawla, N.V.; Bowyer, K.W.; Hall, L.O.; Kegelmeyer, W.P. SMOTE: synthetic minority over-sampling technique. Journal of artificial intelligence research 2002, 16, 321–357. [Google Scholar] [CrossRef]
- Swana, E.F.; Doorsamy, W.; Bokoro, P. Tomek link and SMOTE approaches for machine fault classification with an imbalanced dataset. Sensors 2022, 22, 3246. [Google Scholar] [CrossRef] [PubMed]
- Muntasir Nishat, M.; Faisal, F.; Jahan Ratul, I.; Al-Monsur, A.; Ar-Rafi, A.M.; Nasrullah, S.M.; Reza, M.T.; Khan, M.R.H. A comprehensive investigation of the performances of different machine learning classifiers with SMOTE-ENN oversampling technique and hyperparameter optimization for imbalanced heart failure dataset. Scientific Programming 2022, 2022, 1–17. [Google Scholar] [CrossRef]
- He, H.; Bai, Y.; Garcia, E.A.; Li, S. ADASYN: Adaptive synthetic sampling approach for imbalanced learning. In Proceedings of the 2008 IEEE international joint conference on neural networks (IEEE world congress on computational intelligence); IEEE, 2008; pp. 1322–1328. [Google Scholar] [CrossRef]
- Ray, S.; Alshouiliy, K.; Roy, A.; AlGhamdi, A.; Agrawal, D.P. Chi-squared based feature selection for stroke prediction using AzureML. In Proceedings of the 2020 Intermountain Engineering, Technology and Computing (IETC); IEEE, 2020; pp. 1–6. [Google Scholar] [CrossRef]
- Spencer, R.; Thabtah, F.; Abdelhamid, N.; Thompson, M. Exploring feature selection and classification methods for predicting heart disease. Digital health 2020, 6, 2055207620914777. [Google Scholar] [CrossRef]
- Thaseen, I.S.; Kumar, C.A. Intrusion detection model using fusion of chi-square feature selection and multi class SVM. Journal of King Saud University-Computer and Information Sciences 2017, 29, 462–472. [Google Scholar] [CrossRef]
- Guo, M.; Yuan, Z.; Janson, B.; Peng, Y.; Yang, Y.; Wang, W. Older pedestrian traffic crashes severity analysis based on an emerging machine learning XGBoost. Sustainability 2021, 13, 926. [Google Scholar] [CrossRef]
- Dong, S.; Khattak, A.; Ullah, I.; Zhou, J.; Hussain, A. Predicting and analyzing road traffic injury severity using boosting-based ensemble learning models with SHAPley Additive exPlanations. International journal of environmental research and public health 2022, 19, 2925. [Google Scholar] [CrossRef] [PubMed]
- Lu, P.; Zheng, Z.; Ren, Y.; Zhou, X.; Keramati, A.; Tolliver, D.; Huang, Y. A gradient boosting crash prediction approach for highway-rail grade crossing crash analysis. Journal of advanced transportation 2020, 2020, 1–10. [Google Scholar] [CrossRef]
- Friedman, J.H. Greedy function approximation: a gradient boosting machine. Annals of statistics 2001, 1189–1232. [Google Scholar] [CrossRef]
- Chen, T.; Guestrin, C. Xgboost: A scalable tree boosting system. In Proceedings of the 22nd acm sigkdd international conference on knowledge discovery and data mining; 2016; pp. 785–794. [Google Scholar] [CrossRef]
- Bentéjac, C.; Csörgo, A.; Martínez-Muñoz, G. A comparative analysis of gradient boosting algorithms. Artificial Intelligence Review 2021, 54, 1937–1967. [Google Scholar] [CrossRef]
- Sarveshvar, M.; Gogoi, A.; Chaubey, A.K.; Rohit, S.; Mahesh, T. Performance of different machine learning techniques for the prediction of heart diseases. In Proceedings of the 2021 international conference on forensics, analytics, big data, security (FABS); IEEE, 2021; Vol. 1, pp. 1–4. [Google Scholar] [CrossRef]
- Mufid, M.R.; Basofi, A.; Al Rasyid, M.U.H.; Rochimansyah, I.F.; et al. Design an mvc model using python for flask framework development. In Proceedings of the 2019 International Electronics Symposium (IES); IEEE, 2019; pp. 214–219. [Google Scholar] [CrossRef]
- Hébert, A.; Guédon, T.; Glatard, T.; Jaumard, B. High-resolution road vehicle collision prediction for the city of montreal. In Proceedings of the 2019 IEEE International Conference on Big Data (Big Data); IEEE, 2019; pp. 1804–1813. [Google Scholar] [CrossRef]
Figure 1.
Distribution of Accident Rates by Severity Level.
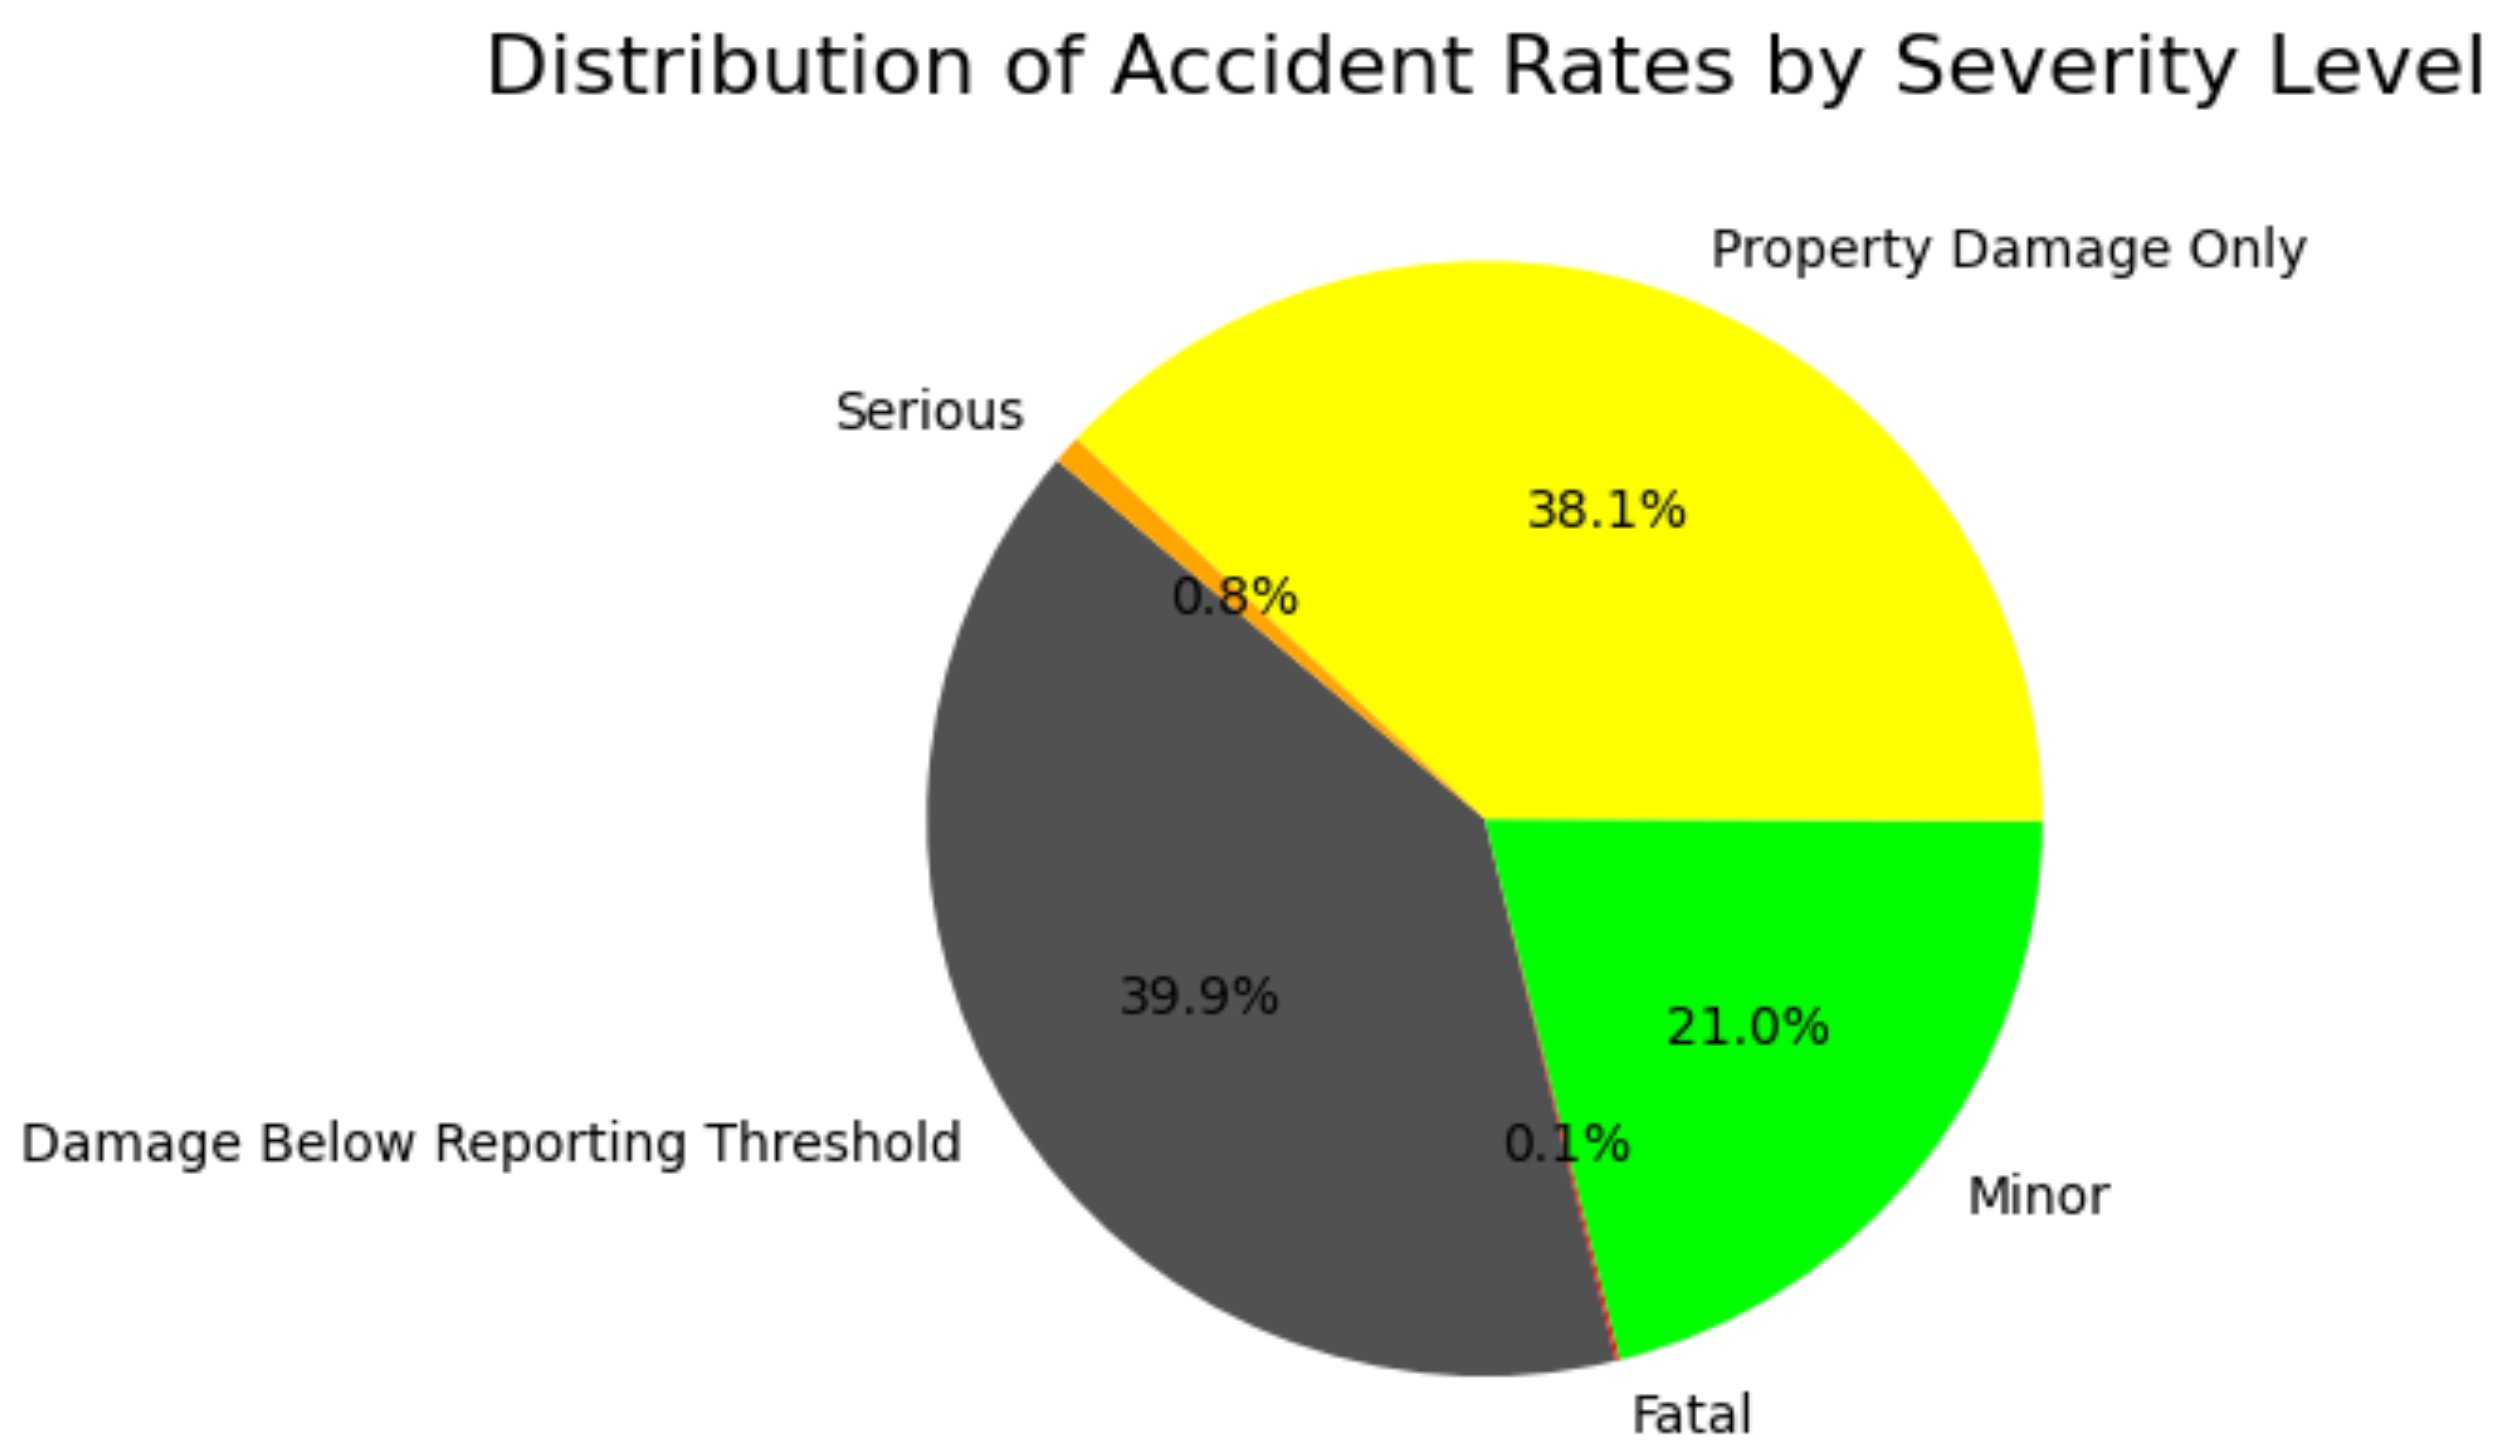
Figure 2.
Hourly Distribution of Accident Severity.
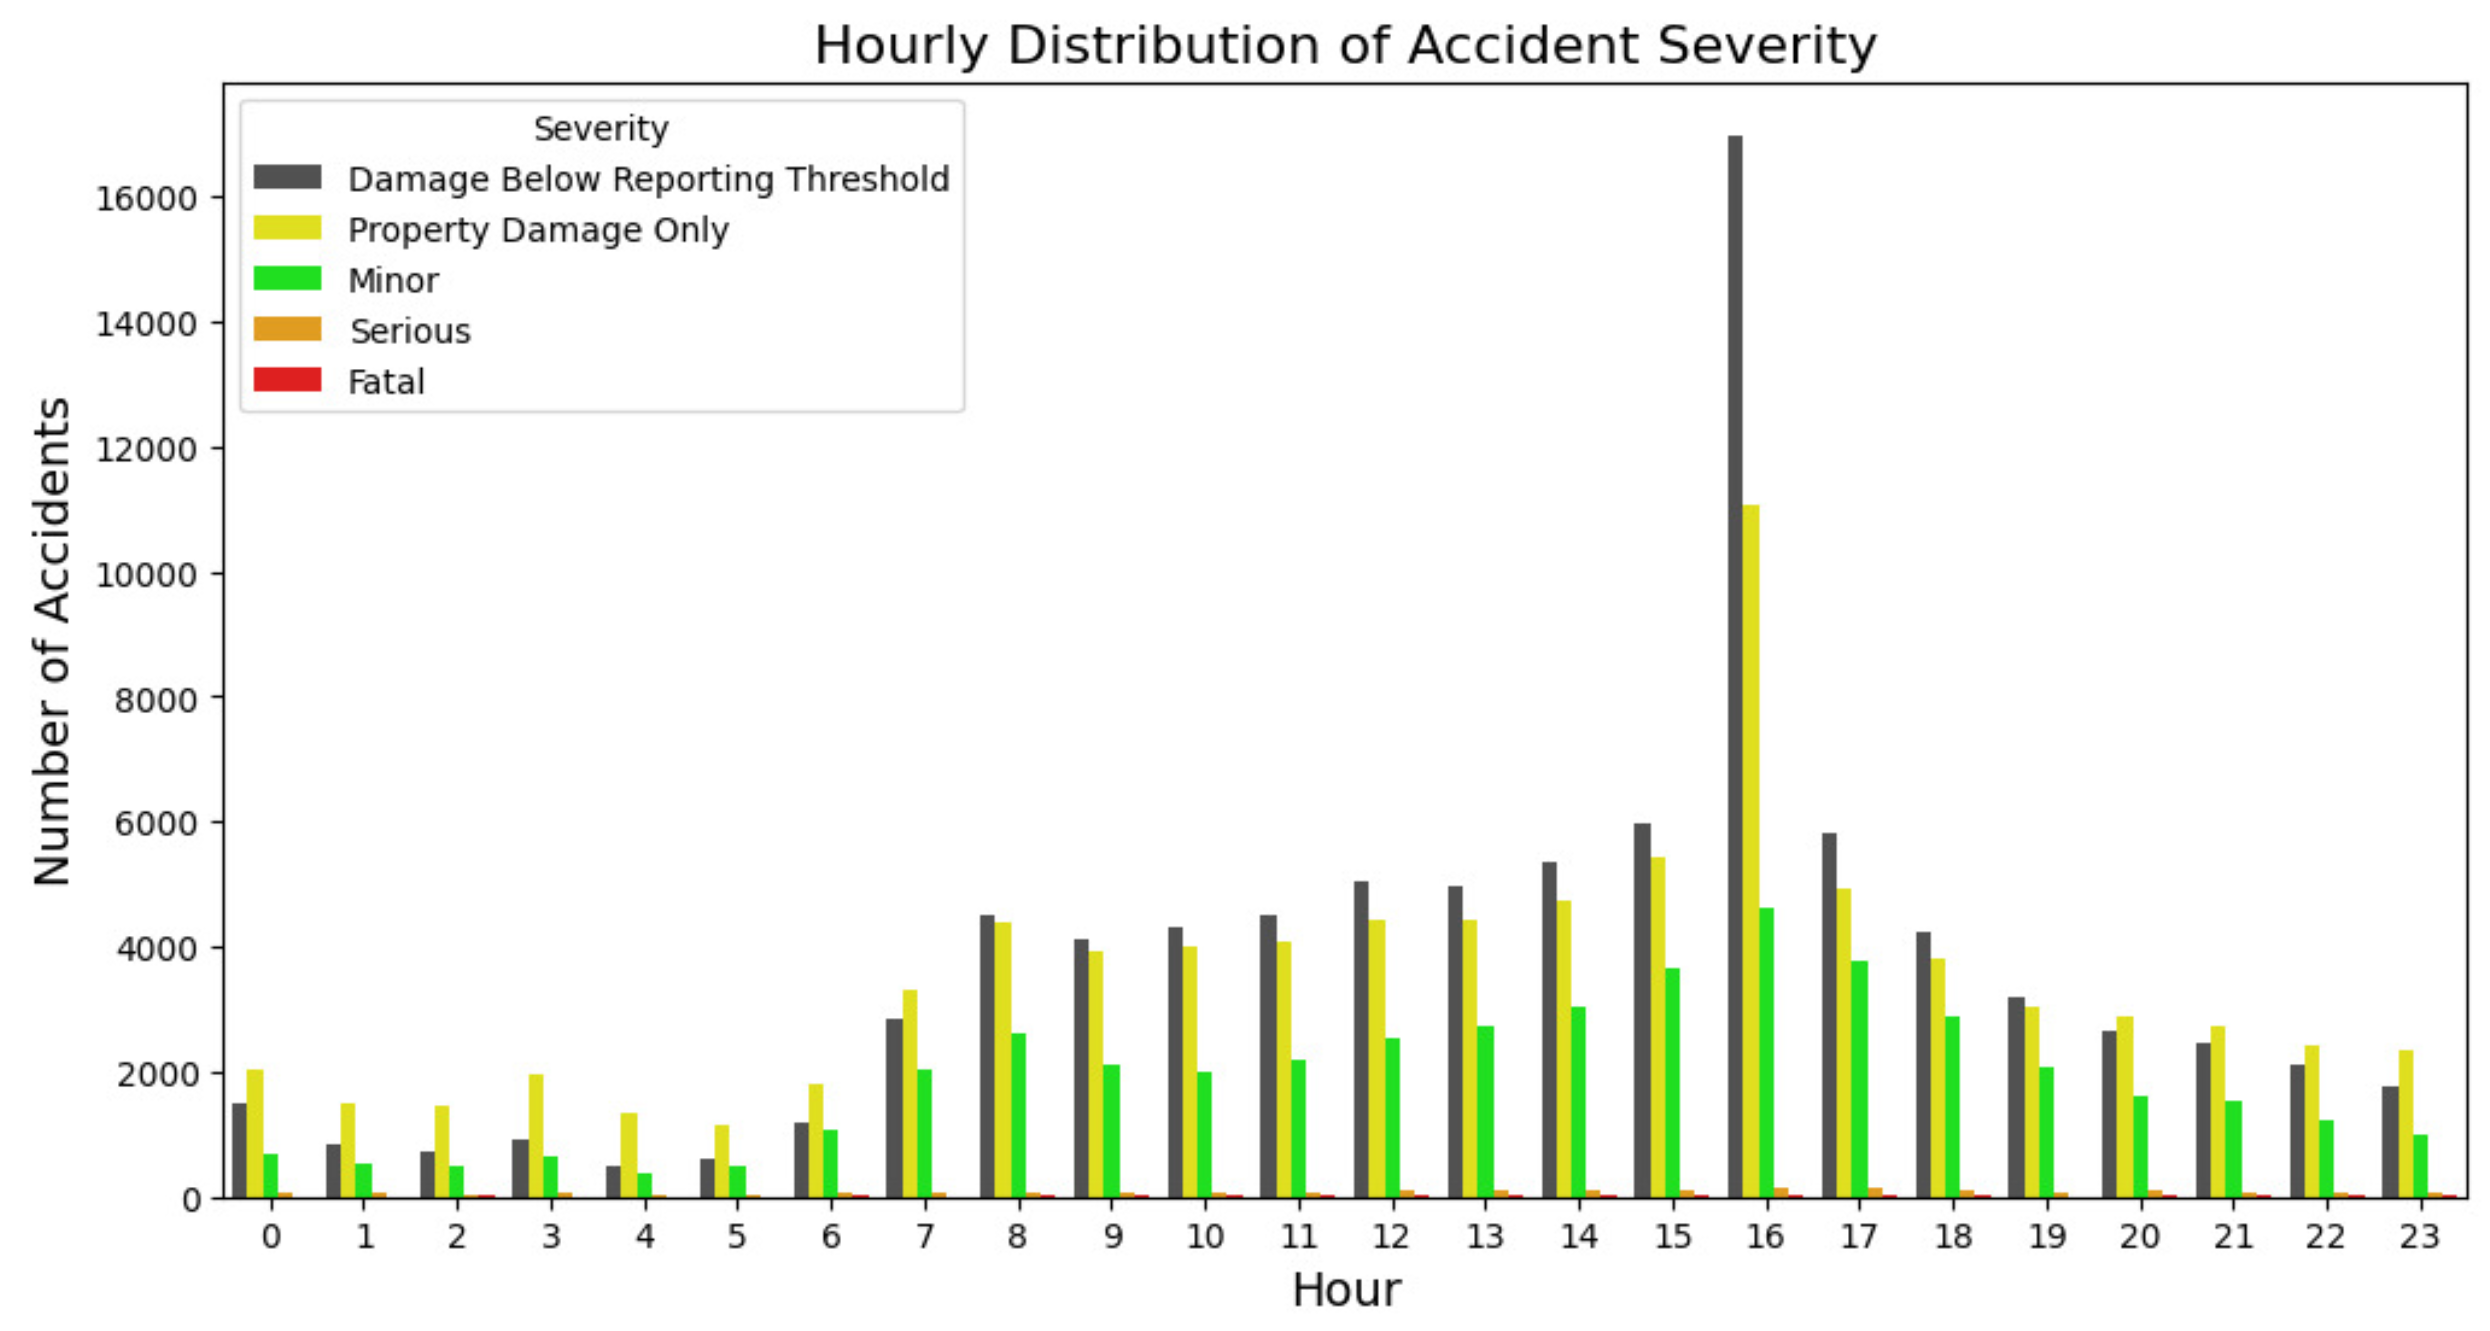
Figure 3.
Weekly Distribution of Crash Severity.
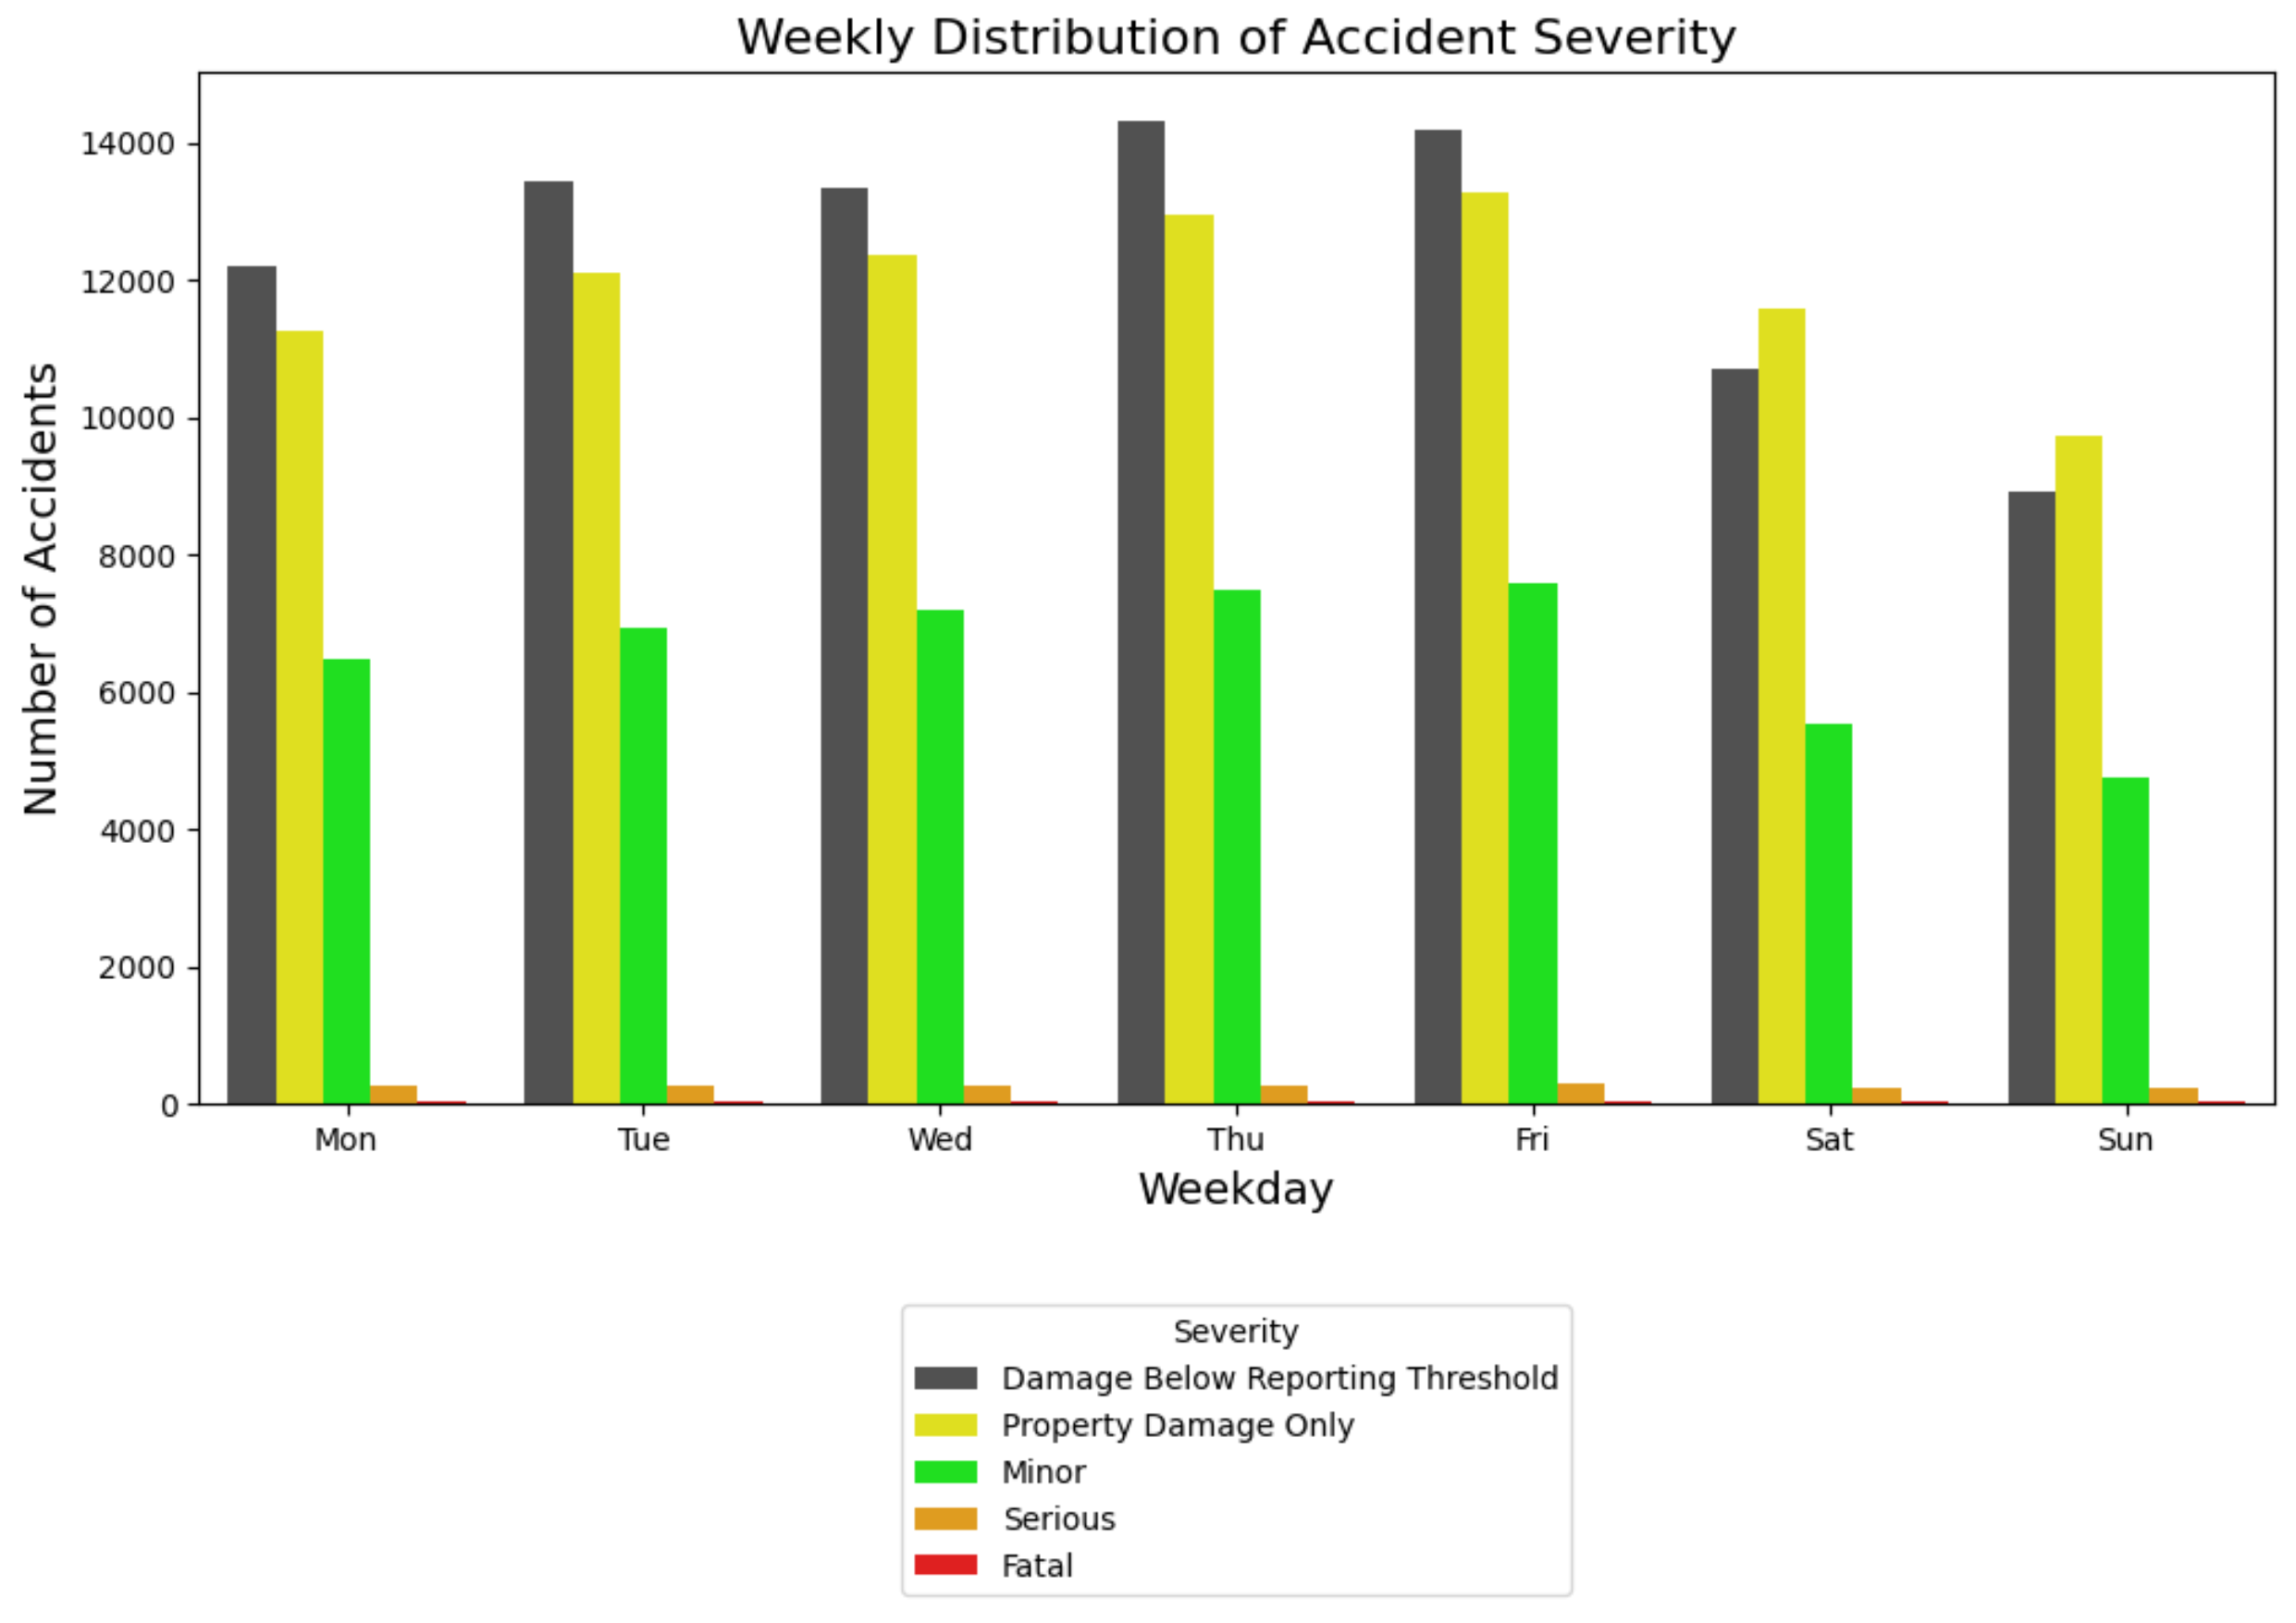
Figure 4.
Monthly Distribution of Accident Severity.
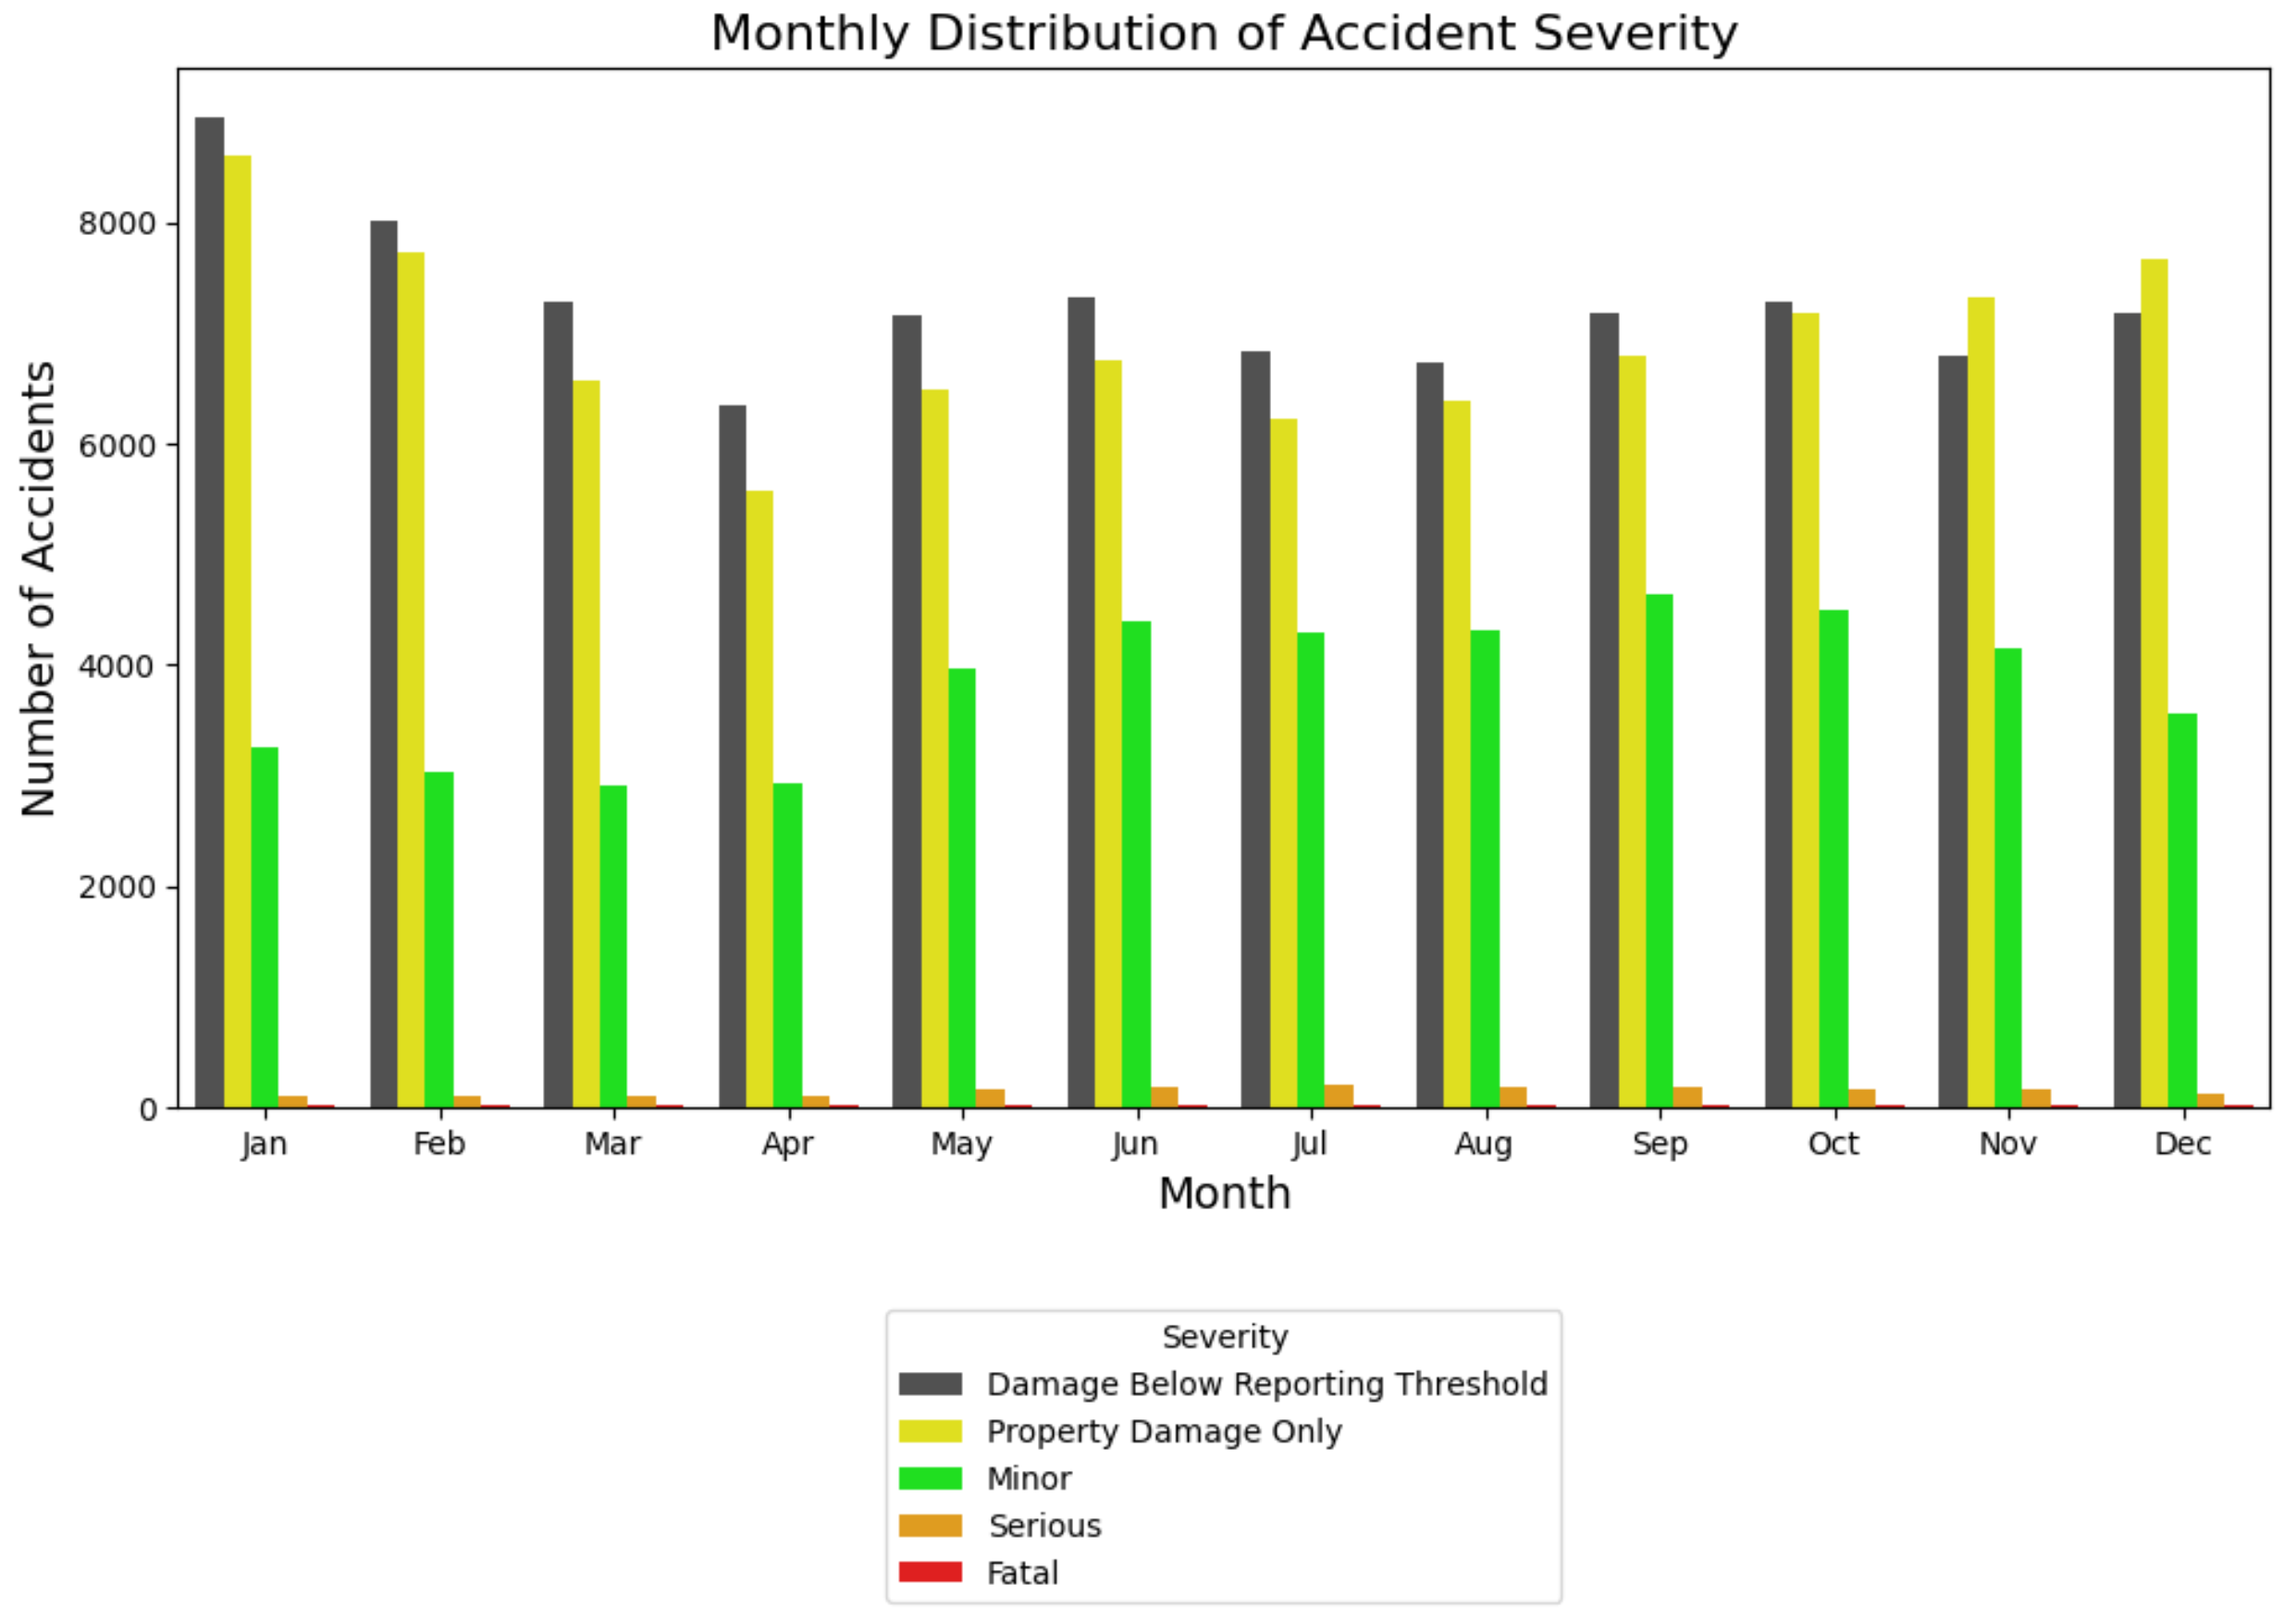
Figure 5.
Monthly Distribution of Accident Severity.
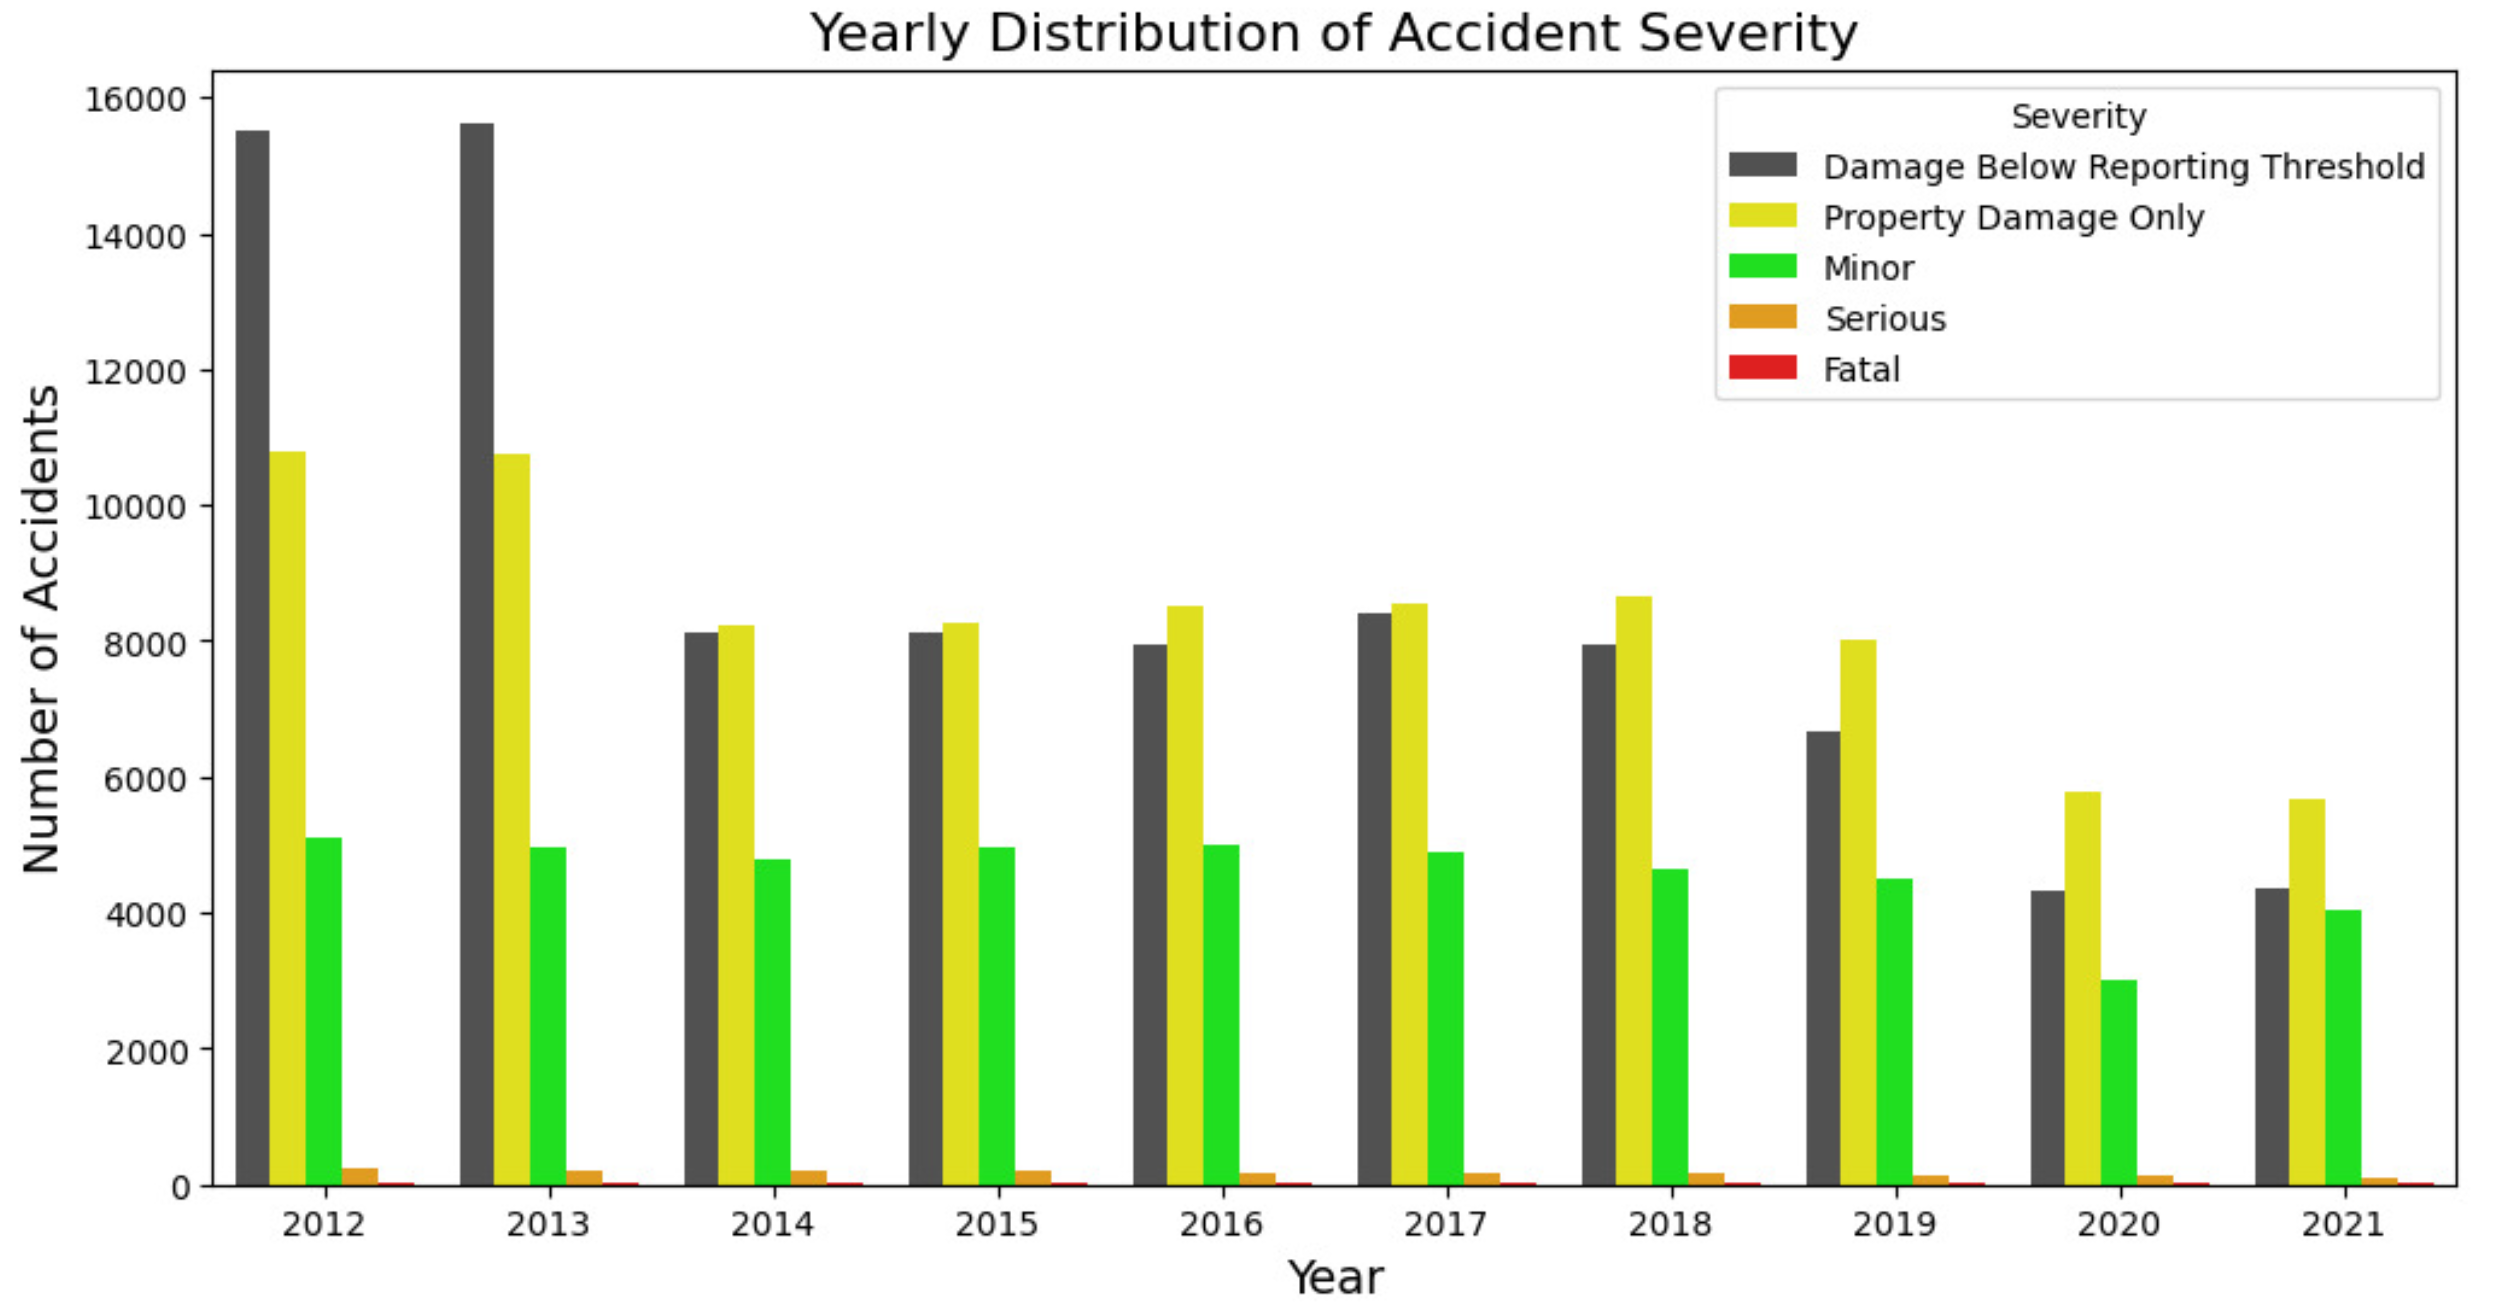
Figure 6.
Confusion Matrices.
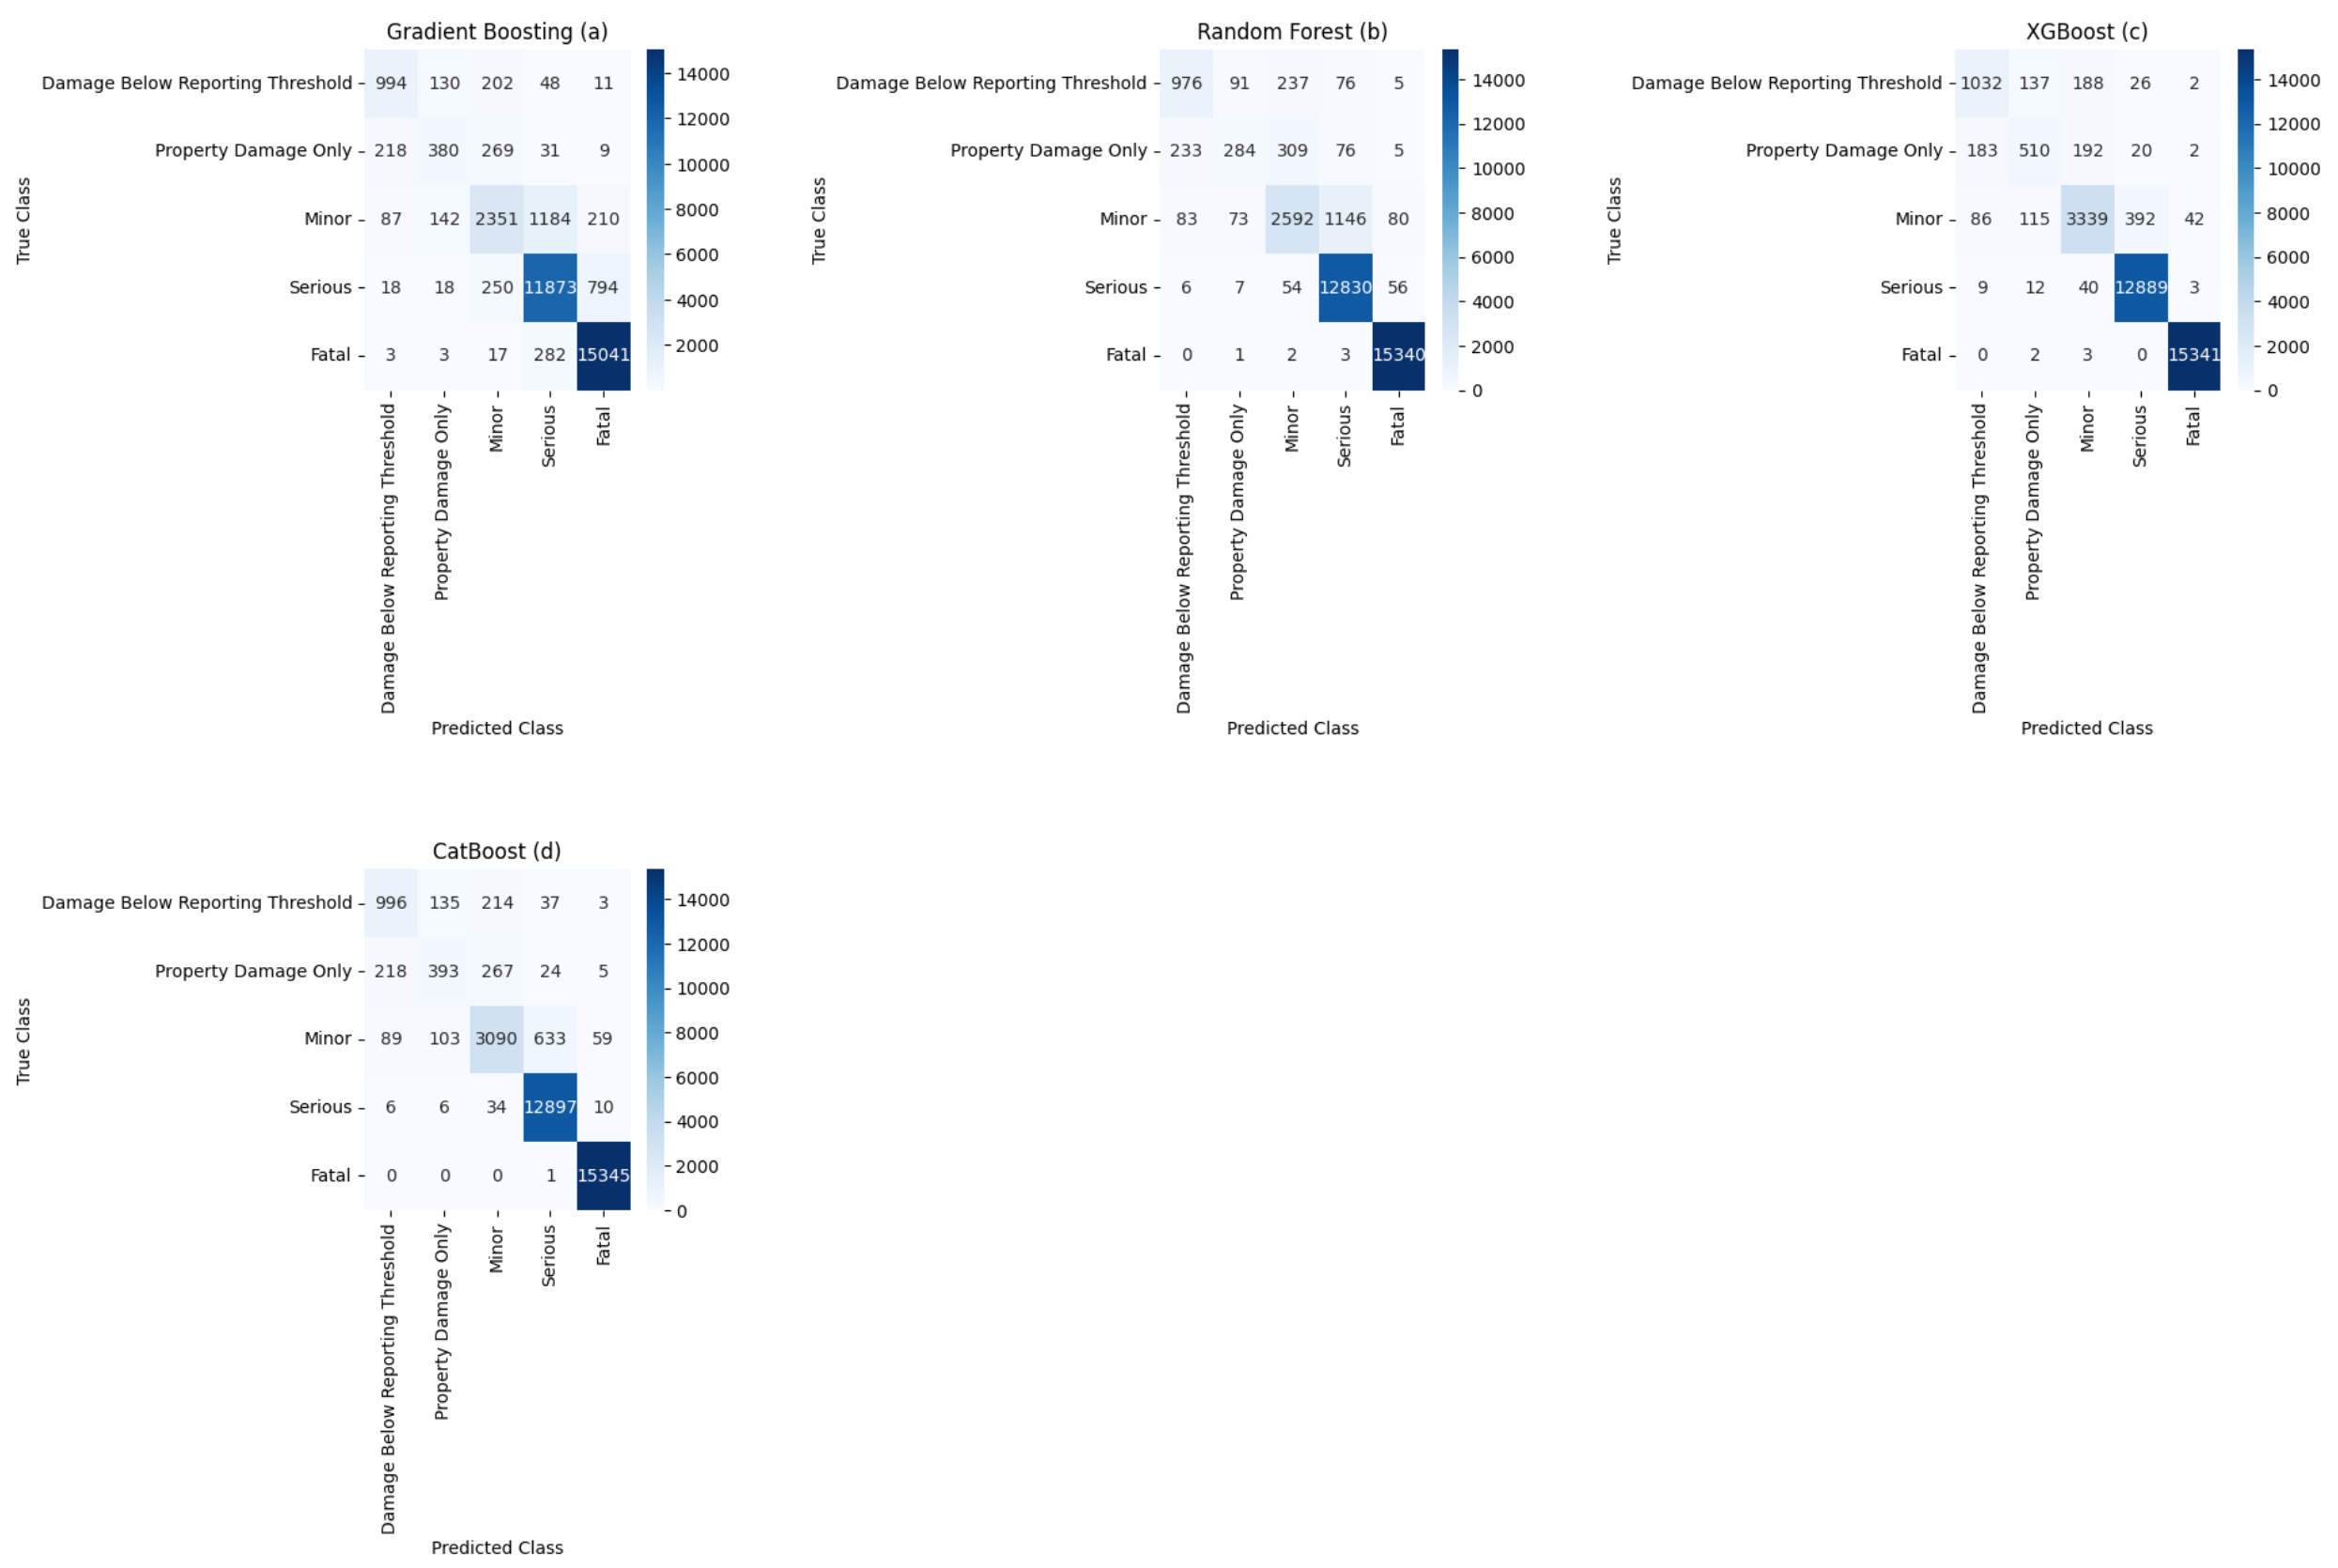

Table 1.
Comparative Analysis of Machine Learning Approaches for Predicting the Severity of Traffic Accidents.
Table 1.
Comparative Analysis of Machine Learning Approaches for Predicting the Severity of Traffic Accidents.
| Study | Focus | Data Used | Models Evaluated | Key Findings |
|---|---|---|---|---|
| [14] | Prediction of traffic accidents | New Zealand dataset (2016–2020) | RF, DJ, AdaBoost, XGBoost, LGBM, CatBoost | RF most effective with 81.45% accuracy. Importance of road category and vehicle number. |
| [15] | Accident prediction based on road and traffic data | Not specified | Ensemble learning CPM-GAs | Improved accuracy and reduced variance in predictions. |
| [16] | Predicting the severity of a traffic accident | UK road safety dataset | Deep Forests | Superior stability and accuracy with minimal hyperparameters. |
| [17] | Traffic accident prediction with deep learning | Data from Knox County, Tennessee | Improved deep learning model, MVNB | The model is characterized by prediction accuracy and dimensionality reduction. |
| [18] | Accident severity prediction | I5 interstate highway, Washington State (2011–2015) | Improved neural network | The focus is on vehicle-related versus road-related factors. |
| [19] | Predicting the severity of a traffic accident | Chinese National Car Accident In-Depth Investigation System (2018–2020) | RF | The RF algorithm is superior in predicting severity. |
| [20] | Analysis of traffic accidents | UK dataset (2005–2017) | Naive-Bayes, LR, AdaBoost, XGBoost, RF | Insights into accident severity and hotspot identification. |
| [21] | Causes of the severity of a traffic accident | UK road accident database | NCA, k-nearest neighbors, Individual Conditional Expectation | Identified significant factors influencing the severity of the accident. |
| [22] | Traffic accident prediction with ANN | Serbia and Bosnia and Herzegovina | ANN | High accuracy in predicting accident events and severity. |
| [23] | Predicting the severity of road accidents in Mauritius | Not specified | ANN (MLP) | MLP outperforms other models with an accuracy of 84.1%. |
| [24] | Pedestrian crash model | Italy, ISTAT dataset (5 years) | Gradient Boosting | Effective in predicting the risk of pedestrian accidents |
| [25] | Analysis of crash severity and hotspots | Al-Ahsa, Saudi Arabia (2016–2018) | Gradient boosting, RF, logistic regression | Identified factors and hotspots for severe R.T.C.s. |
| [26] | Severity of highway accident in Saudi Arabia | Qassim Province (2017–2019) | RF, XGBoost, logistic regression | XGBoost is the most accurate at predicting accident severity. |
| [27] | Traffic accident forecast in tunnels | YingTian Street Tunnel, Nanjing | GCN-LSTM, BP neural network, RF | The RF mode excels at predicting the duration of an accident. |
| [28] | Predicting the severity of injuries in an accident | Highway divergence areas, Florida | K-Nearest Neighbor, Decision Tree, RF, SVM | RF most effective; highlights overfitting problems. |
| [29] | Classification of the severity of a traffic accident | Setúbal, Portugal (2016–2019) | Logistic regression, machine-learning models | Comparing performance between models on balanced datasets. |
| [30] | Accident severity prediction for emergency management | Great Britain (2011–2016) | Two-layer ensemble model | Superior performance in accuracy and F1 score. |
| [31] | Analysis of the severity of traffic accidents | USA (2016–2019) | Random Forest | High accuracy in predicting accident severity. |
| [32] | Predicting the severity of a motorcycle accident in Ghana | Ghana (2011–2015) | J48 Decision Tree, RF, IBk | RF is the most accurate in predicting severity. |
| Current Work | Accident severity prediction in Montreal | Montreal collision data (2012–2021) | XGBoost, CatBoost, RF, GB | The XGBoost model demonstrated highest accuracy (96%) and effectiveness in predicting accident severity. |
Table 2.
Summary of the Dataset.
| Description | Value |
|---|---|
| Number of rows | 218272 |
| Number of columns | 68 |
| Type of data | float64, int64. object |
| Categorical variables | 15 (type object) |
| Numerical variables | 53 (29 int64, 24 float64) |
Table 3.
Example of coding for the Severity attribute.
| Severity of the accident | Numerical coding |
|---|---|
| Damage Below Reporting Threshold | 0 |
| Property Damage Only | 1 |
| Minor | 2 |
| Serious | 3 |
| Fatal | 4 |
Table 4.
The 30 most important attributes selected using the chi-square method.
| Feature | Chi-Square Score | Percentage |
|---|---|---|
| Collision_Near | 495129.765158 | 30.526103 |
| Street_Name | 175285.888584 | 10.806854 |
| Num_Serious_Injuries | 169805.678768 | 10.468984 |
| Num_Deaths | 162050.724638 | 9.990870 |
| Total_Victims | 151493.855851 | 9.340010 |
| Num_Minor_Injuries | 150924.871613 | 9.304931 |
| Pedestrian_Deaths | 98471.014493 | 6.071007 |
| Total_Pedestrian_Victims | 31182.458448 | 1.922484 |
| Pedestrian_Injuries | 30277.689032 | 1.866702 |
| Longitudinal_Location | 24494.472488 | 1.510151 |
| Bicycle_Deaths | 20159.420290 | 1.242883 |
| Bicycle_Injuries | 16883.042752 | 1.040886 |
| Total_Bicycle_Victims | 16847.829913 | 1.038715 |
| X_Coordinate | 14566.502900 | 0.898065 |
| Motorcycle_Deaths | 11630.434783 | 0.717048 |
| Bicycle_Count | 10794.691447 | 0.665522 |
| Unspecified_Vehicle_Count | 8160.399934 | 0.503111 |
| Y_Coordinate | 6016.332705 | 0.370923 |
| Total_Motorcycle_Victims | 4873.843542 | 0.300486 |
| Motorcycle_Injuries | 4830.242330 | 0.297798 |
| Road_Category | 3951.186923 | 0.243601 |
| Emergency_Vehicle_Count | 2492.677718 | 0.153680 |
| Heavy_Trucks_Count | 2031.992082 | 0.125278 |
| Motorcycle_Count | 1912.272853 | 0.117897 |
| Light_Cars_Trucks_Count | 1911.036696 | 0.117821 |
| Collision_Type | 1561.271344 | 0.096257 |
| Hour | 1255.653908 | 0.077414 |
| Authorized_Speed | 1127.238142 | 0.069497 |
| Surface_Condition | 950.290263 | 0.058588 |
| Weather_Conditions | 915.358973 | 0.056434 |
Table 5.
Summary of the Classification Report.
| Class | Precision | Recall | F1-score | Support | Accuracy |
|---|---|---|---|---|---|
| Results for XGBoost | |||||
| Damage Below Reporting Threshold | 0.79 | 0.75 | 0.77 | 1385 | |
| Property Damage Only | 0.66 | 0.56 | 0.61 | 907 | |
| Minor | 0.89 | 0.84 | 0.86 | 3974 | |
| Serious | 0.97 | 1.00 | 0.98 | 12953 | |
| Fatal | 1.00 | 1.00 | 1.00 | 15346 | |
| Weighted Avg | 0.96 | 0.96 | 0.96 | 34565 | 0.96 |
| Results for CatBoost | |||||
| Damage Below Reporting Threshold | 0.76 | 0.72 | 0.74 | 1385 | |
| Property Damage Only | 0.62 | 0.43 | 0.51 | 907 | |
| Minor | 0.86 | 0.78 | 0.82 | 3974 | |
| Serious | 0.95 | 1.00 | 0.97 | 12953 | |
| Fatal | 1.00 | 1.00 | 1.00 | 15346 | |
| Weighted Avg | 0.94 | 0.95 | 0.94 | 34565 | 0.95 |
| Results for RF | |||||
| Damage Below Reporting Threshold | 0.75 | 0.70 | 0.73 | 1385 | |
| Property Damage Only | 0.62 | 0.31 | 0.42 | 907 | |
| Minor | 0.81 | 0.65 | 0.72 | 3974 | |
| Serious | 0.91 | 0.99 | 0.95 | 12953 | |
| Fatal | 0.99 | 1.00 | 1.00 | 15346 | |
| Weighted Avg | 0.92 | 0.93 | 0.92 | 34565 | 0.93 |
| Results for GB | |||||
| Damage Below Reporting Threshold | 0.75 | 0.72 | 0.73 | 1385 | |
| Property Damage Only | 0.56 | 0.42 | 0.48 | 907 | |
| Minor | 0.76 | 0.59 | 0.67 | 3974 | |
| Serious | 0.88 | 0.92 | 0.90 | 12953 | |
| Fatal | 0.94 | 0.98 | 0.96 | 15346 | |
| Weighted Avg | 0.88 | 0.89 | 0.88 | 34565 | 0.89 |
Disclaimer/Publisher’s Note: The statements, opinions and data contained in all publications are solely those of the individual author(s) and contributor(s) and not of MDPI and/or the editor(s). MDPI and/or the editor(s) disclaim responsibility for any injury to people or property resulting from any ideas, methods, instructions or products referred to in the content. |
© 2024 by the authors. Licensee MDPI, Basel, Switzerland. This article is an open access article distributed under the terms and conditions of the Creative Commons Attribution (CC BY) license (http://creativecommons.org/licenses/by/4.0/).
Copyright: This open access article is published under a Creative Commons CC BY 4.0 license, which permit the free download, distribution, and reuse, provided that the author and preprint are cited in any reuse.


