Submitted:
12 May 2024
Posted:
13 May 2024
You are already at the latest version
Abstract
Glioblastoma (GB) is the most aggressive and prevalent glioma within the Central Nervous System. GB exhibit a dismal 5-year survival rate (~6%) due to unfavorable prognosis and lack of viable treatment options. Therefore, novel therapies with plant-derived compounds emerge as very promising. This study aims to investigate the antitumor activity of 7α-acetoxy-6β-hydroxyroyleanone (Roy) in GB cell lines. Roy was isolated from Plectranthus hadiensis Schweinf. and its antitumor mechanism was assessed in a panel of five GB cell lines to mimic tumor heterogeneity. Metabolic activity was evaluated by Alamar Blue® assay, while cell death, cell cycle regulation, mitochondrial membrane potential, and activated caspase-3 were evaluated by flow cytometry. mRNA levels of target genes were measured by qPCR and protein expression was assessed by Western blotting. Cell uptake and impact on mitochondrial morphology were evaluated by confocal microscopy. Roy induced G2/M cell cycle arrest, mitochondrial fragmentation, and apoptosis by inhibiting the expression of anti-apoptotic proteins and increasing activated caspase-3 levels with concentration 6-9 fold lower than those of temozolomide, the first-line treatment. Roy demonstrated a robust antitumor activity against GB cells, without affecting non tumoral cells (microglia and astrocytes), being a promising natural lead compound for the development of novel chemotherapeutic approaches.
Keywords:
Glioblastoma
; Plectranthus hadiensis Schweinf
; Royleanone
; Abietane diterpenes
; Antitumor activity
1. Introduction
Glioblastoma (GB), the most common and malignant primary glioma of the central nervous system (CNS), encompassing brain and spinal cord tumors, is classified by the World Health Organization (WHO) as a grade 4 adult-type diffuse glioma [1]. This highly aggressive and lethal glioma continues to create significant challenges to medicine and patient care. Characterized by rapid growth and high invasiveness, this devastating disease has a dismal prognosis, with a median survival of approximately 15-18 months post-diagnosis even with treatment [2]. This is primarily attributed to the infiltrative behavior and localization of the tumor, as well as, to the extent of surgery and treatment resistance [3,4,5]. The established treatment protocol for GB patients involves surgical resection followed by cycles of chemoradiotherapy and adjuvant chemotherapy (temozolomide-TMZ) [6,7]. TMZ is an alkylating agent that disrupts DNA chains by adding a methyl group to guanine, acting on DNA replication and leading to the activation of pathways involved in apoptosis [8,9]. However, these treatments have limitations, including incomplete tumor resection and the emergence of multidrug resistance (MDR) linked to TMZ therapy, through the activity of O6-methylguanine-DNA methyltransferase (MGMT) and the presence of gene mutations that conduct a permanent activation of multiple survival pathways, contributing to tumor recurrence [6,7,9]. As a result, the ongoing quest for more effective and targeted GB therapies persists, with emerging interest in novel treatments centered on molecules with natural origin. This interest is fueled by the inherent chemical diversity and pharmacological potency of such compounds, which underlie the historical significance of plants as vital sources of medicines [10,11].
In traditional medicine, plants are extensively used to address the treatment of various illnesses and serve as a rich source of bioactive compounds with considerable therapeutic potential, such as anti-inflammatory, antioxidant, antiproliferative, and antitumor activity [10,12,13]. The unique chemical structure of natural bioactive compounds with distinct mechanisms of action against complex diseases such as cancer, position them as fundamental contributors in the quest for novel and more effective anticancer drugs [10]. Terpenes are a well-known category of secondary metabolites, recognized for their established chemopreventive and chemotherapeutic properties (e.g., paclitaxel, the active substance from Taxol®, a clinically employed anticancer drug for ovarian and breast cancer treatment) [10,13,14].
The genus Plectranthus L’Hér. represents a rich source of abietane diterpenes, a class of compounds responsible for diverse and appealing therapeutic bioactivities [13]. One of these abietane diterpenes is 7α-acetoxy-6β-hydroxyroyleanone (Roy), which is isolated from Plectranthus hadiensis Schweinf. (P. hadiensis) [15,16,17]. Roy has garnered considerable interest due to its reported antitumor activity against several cancer cell lines, including lung cancer, leukemia, and glioma [16,17]. The investigation and repurposing of Roy as a potential natural lead compound for GB offers a novel avenue for treatment that may complement existing therapies or serve as a basis for the development of novel therapeutic approaches.
In this study, our objective is to investigate the antitumor effect of Roy as a potential GB treatment. Previously, we assessed the cytotoxic effect of Roy on a panel of different GB cell lines [15], to cover the distinct molecular subtypes and heterogeneity of this tumor, shedding light on its potential antitumor activity. Here, we unveiled the mechanism of action, cytotoxic and pro-apoptotic profile of Roy in GB cells.
2. Materials and Methods
2.1. Plant Material
P. hadiensis was grown in Parque Botânico da Tapada da Ajuda (Lisbon, Portugal) and provided by the Kirstenbosch National Botanical Gardens (Kirstenbosch, South Africa). The voucher specimens 833/2007 and 438/2010 were deposited in the herbarium João de Carvalho e Vasconcellos of the Instituto Superior de Agronomia (Lisbon, Portugal). The plant was air-dried at room temperature and stored in cardboard boxes protected from light and humidity to maintain its stability [15].
2.2. Isolation of Roy
The abietane diterpene Roy (Figure 1) was isolated from the acetonic extract of P. hadiensis leaves, as previously described [15,18]. Roy was then purified by dry-column flash-chromatography, using silica as a stationary phase and a gradient of eluents of increasing polarity (n-Hexane:Ethyl acetate) as a mobile phase. Roy structure was elucidated through nuclear magnetic resonance (NMR) spectra assignments and previously published [18].
2.3. Synthesis of Roy-BODIPY
Roy-Bodipy was synthesized following the protocol previously described [15]. Briefly, succinic anhydride was added to a mixture of BODIPY (fluorescent probe) and triethylamine in anhydrous dichloromethane. The reaction mixture was stirred at room temperature. The solution was diluted with methylene chloride (DCM) and aqueous hydrochloric acid (HCL) (1M) until reach pH 3. The resulting mixture was washed with H2O, the layers were separated, and the organic layer was washed with brine, dried, and concentrated. The crude material of succinimidyl-modified BODIPY was employed in the subsequent stage without undergoing additional purification (88%). A mixture of carboxylic acid (succinimidyl-modified BODIPY) and abietane in anhydrous dichloromethane was cooled to 0 °C and treated under argon atmosphere with 1-[3-(dimethylamino)propyl]-3-ethylcarbodiimide methiodide (EDC) and a catalytic amount of 4-(Dimethylamino)pyridine (DMAP). The reaction mixture was stirred for 90 min. The solution was diluted with DCM and washed with H2O. The layers were separated, and the organic layer was dried and concentrated. The crude material was purified through silica column chromatography to yield Roy-BODIPY (65%). NMR data regarding Roy-Bodipy structure was previously published by our group [15].
2.4. Cell Culture
In order to cover GB heterogeneity, a panel of 5-glioma human cell lines, U87, A172, H4, U373, and U118, was used. All cell lines used in this work were acquired from the American Type Culture Collection (ATCC).
U87 (brain-likely GB, ATCC HTB-14), A172 (GB, ATCC CRL-1620), and H4 (neuroglioma, ATCC HTB-148) cell lines were provided by Prof. Carla Vitorino (Faculty of Pharmacy, University of Coimbra), while U118 (astrocytoma/GB, ATCC HTB-15) and U373 (astrocytoma/GB, ATCC HTB-17) cell lines were provided by Prof. Maria Conceição Pedroso de Lima (Faculty of Sciences and Technology/Center for Neuroscience and Cell Biology, University of Coimbra). The HMC3 (human microglia, ATCC CRL-3304) cell line was provided by Prof. Célia Gomes (Coimbra Institute for Clinical and Biomedical Research (iCBR), Faculty of Medicine, University of Coimbra). Cells were grown in Dulbecco’s Modified Eagle’s Medium-high glucose (DMEM-HG) (Biowest, Nuaillé, France) supplemented with 10% (v/v) of heat-inactivated fetal bovine serum (FBS) (Biowest, Nuaillé, France) and 1% (v/v) of penicillin-streptomycin (Sigma, St. Louis, MO, United States), being maintained at 37 °C, 5% CO2, and 95% of humidity.
2.5. Primary Rat Culture of Astrocytes
Primary cultures of astrocyte-enriched cells were obtained from mixed glial cultures, which were isolated from the cerebral cortex of newborn Wistar rats, as previously described [19]. All animal experiments were authorized by the bioethical committee (Protocol n° 1088/2020) and performed in agreement with the Italian and European Community laws on the use of animals for experimental purposes. Briefly, cerebral cortices were collected and cleared of meninges, trypsinized, and mechanically dissected. Cell suspensions were resuspended in Basal Medium Eagle (BME; Life Technologies Italia, Monza, Italy) with 10% heat-inactivated FBS (Life Technologies), 2 mM glutamine (Sigma, St. Louis, MO, USA), and 100 μM gentamicin sulfate (Sigma, St. Louis, MO, USA) and plated on flasks previously coated with poly-l-lysine (10 μg/ml; Sigma, St. Louis, MO, USA). One week later, microglial cells were harvested from mixed glial cell cultures by mechanical shaking and discarded to obtain a primary culture of astrocyte cells.
2.6. 3-(4,5-Dimethylthiazol-2-yl)-2,5-diphenyl tetrazolium Bromide (MTT) Assay
Primary astrocyte cells (2 × 10⁴ cells/well) were seeded in 96-well plates. After 1 h, cells were treated with a range of Roy concentrations (1 to 64 µM) and further incubated for 24 h. Thereafter, cells were incubated with 3-(4,5-dimethylthiazol-2-yl)-2,5-diphenyl tetrazolium bromide (MTT) (Sigma, St. Louis, MO, USA), at a concentration of 0.1 mg/ml. After 45 min, MTT was carefully removed and 0.1 mol/l of Tris-HCl buffer containing 5% Triton X-100 (Sigma, St. Louis, MO, USA) was added to each well. Absorbance was measured at 570 nm in a Multiplate Spectophotometric Reader (Bio-Rad, CA, USA) [20]. Metabolic activity was expressed as a percentage of control (untreated cells).
2.7. Alamar Blue® Assay
U87, A172, H4, U373, U118 cells (1 × 10⁴ cells/well), and HMC3 cells (2 × 10⁴ cells/well) were seeded in 96-well plates, 24 h before treatment. Cells were treated with a range of Roy concentrations (1 to 64 µM), with the vehicle control (DMSO), or with positive control (TMZ—1 to 100 µM), and further incubated for 48 h. Metabolic activity was assessed through Alamar blue® assay [21]. Briefly, a solution of DMEM-HG medium with 10% (v/v) of a resazurin salt dye stock solution (Sigma. St. Louis, MO, United States) at a 0.1 mg/ml concentration was prepared and added to each well after the 48 h treatment. After 4 h of incubation at 37 °C and 5% CO2, the absorbance of each sample was read at 570 and 600 nm using a BioTeck Synergy HT microplate reader (BioTek Instruments, Inc., Winooski, VT, United States) and Gen5 software. Metabolic activity was obtained in accordance with the following equation:
Half-maximal inhibitory concentration (IC50) values were further calculated using GraphPad Prism Software v.10.1.0 (GraphPad Software, Inc.) [22].
2.8. Cell Cycle
The impact of Roy on cell cycle was analyzed by flow cytometry using propidium iodide (PI)/RNase solution, according to the manufacturer’s protocol (Immunostep, Salamanca, Spain), and as previously described [23]. Briefly, U87, A172, H4, U373, and U118 cells were seeded with a density of 30 × 104 cells/well in a 6-well plate. After 24 h, cells were treated with 16 µM of Roy and further incubated during 48 h. Cells were detached, fixed in 70% ethanol for 60 min at 4 °C, washed twice with PBS, and then stained with 500 µl PI/RNase solution. Cell cycle distribution was analyzed using the ModFit LT software (Verity Software House). Results were acquired using CellQuest software and expressed in percentage of cells in the different cell cycle phases (G0/G1, S, and G2/M) according to the PI intensity. A sub-G1 population was also identified corresponding to apoptotic cells.
2.9. Cell Death Assay
Cell death was measured using the Annexin V (AV)/PI assay by flow cytometry, as previously described [22]. Briefly, 24 h before treatment, 20 × 104 cells per well were seeded in 12-well plates. The cell medium was replaced, and the cells were treated with Roy (16 µM). After 48 h, cells were co-stained with AV-APC and PI according to the manufacturer’s protocol (Biolegend, San Diego, CA, USA). Cells were resuspended in binding buffer (100 µl) and incubated with AV-APC solution (5 µl) and PI solution (2 µl). A six-parameter, four-color FACSCalibur flow cytometer (Becton Dickinson, San Jose, CA, USA) was used and at least 10.000 events were collected by acquisition using CellQuest software (Becton Dickinson, San Jose, CA). The results were analyzed with the Paint-a-Gate software and were expressed in percentage (%).
2.10. Mitochondrial Membrane Potential
Mitochondrial membrane potential (ψmit) was indirectly measured using 5,5,6,6′-tetrachloro-1,1′,3,3′ tetraethylbenzimi-dazoylcarbocyanine iodide (JC-1) (Enzo Life Sciences, Farmingdale, NY, USA) as previously described [24]. Briefly, cells were treated with 16 µM of Roy and further incubated for 48 h. After incubation, cells were washed twice with PBS, centrifuged, and incubated with JC-1 at a final concentration of 5 μg/ml for 15 min at 37 °C in the dark. Cells were washed twice with PBS, resuspended in a total volume of 500 μl, and analyzed by flow cytometry.
2.11. Quantitative Real-Time PCR
B-cell lymphoma-2 (BCL2), Bcl-2-like protein 1 (BCL2L1), caspase 9 (CASP9), Phosphatase And Tensin Homolog (PTEN), tumor protein p53 (TP53), Poly(ADP-Ribose) Polymerase 1 (PARP1), and murine double minute 2 (MDM2) mRNA levels were quantified by quantitative real-time PCR (qRT-PCR). Briefly, cells were seeded with a density of 1 × 10⁶ cells per well 24 h before treatment. After, 16 µM of Roy was added to cells, which were further incubated for 48 h. Total RNA was extracted using TripleXtractor solution (GRISP, Lisbon, Portugal) according to the manufacturer’s protocol. RNA was converted into cDNA through the Xpert cDNA Synthesis Supermix (GRISP, Lisbon, Portugal), following the manufacturer’s protocol. 100 ng of cDNA was amplified by qRT-PCR using the primers in Table 1. Each optimized reaction was performed using Xpert Fast SYBR Green Mastermix 2X with ROX (GRISP, Lisbon, Portugal) and samples were subjected to the amplification protocol described by the manufacturer, using a melting temperature of 60 °C. Relative gene expression was determined by the 2−ΔΔCt method and normalized to the glyceraldehyde-3-phosphate dehydrogenase (GAPDH) gene, the endogenous reference, and relative to the untreated control cells.
2.12. Western Blotting
Cells were seeded in 90 mm cell culture dishes and subjected to a treatment with 16 µM of Roy. After 48 h, cells were washed twice with PBS, detached mechanically, and resuspended in RIPA buffer (50 mM Tris, 150 mM NaCl, 1% NP-40, and 0.1% SDS in the presence of protease inhibitors). Cell lysates were centrifuged at 4 °C, 12,000 RCF for 10 min, and protein content was measured using a bicinchoninic acid assay (BCA) kit (Thermo FisherScientific, Waltham, MA, USA). Equal amounts of total cell protein (30 μg) were separated by electrophoresis on SDS polyacrylamide gels (SDS-PAGE) and transferred for polyvinylidene difluoride (PVDF) membranes. Membranes were blocked with 5% non-fat milk in Tris-buffered saline with 0.1% Tween-20 (TBS-T) for 1h at room temperature, followed by incubation with the primary antibodies overnight at 4 °C. Membranes were washed with TBS-T and incubated with the secondary antibody. The antibodies used were anti-p21 (1:1000, ab7960, Abcam) and anti-Bcl-2 (1:1000, cs2870, Cell Signaling). Anti-β-actin (1:10000, A5441, Sigma) was used as loading control. Membranes were developed using ECL and ImageQuant imaging system (GE Healthcare, Chicago, IL, USA). The densitometric analysis of band intensity was performed using Image Lab software (Bio-Rad, CA, USA), and the values are presented relative to the loading control (β-actin).
2.13. Activated Caspase-3 Expression Analysis
Activated caspase-3 expression levels were measured by flow cytometry using BD Pharmingen™ monoclonal antibody anti-activated caspase-3 labeled with fluorescein isothiocyanate (FITC) (BD Biosciences, Franklin Lakes, NJ, USA), according to the manufacturer’s protocol. Briefly, 1 × 10⁶ cells per condition were treated with 16 µM of Roy for 48 h. Afterward, cells were fixed with BD Cytofix/Cytoperm™ solution for 20 min on ice and then washed by centrifugation at 3450 RPM for 5 min. Cells were then incubated with 20 μl of FITC rabbit anti-active caspase-3. After a 30-min incubation period at room temperature, the cells were washed and resuspended in 400 μl of PBS for flow cytometry analysis. At least 25,000 events were acquired using CellQuest software (Becton Dickinson, San Jose, CA, USA) and analyzed using Paint-a-Gate (Becton Dickinson, San Jose, CA, USA). The results are obtained as mean fluorescence intensity (MFI) arbitrary units, being MFI detected in the cells, which is proportional to the protein concentration in each cell and are presented as percentage (%) of positive cells.
2.14. Confocal Microscopy
Live confocal fluorescent microscopy was used to visualize the internalization and distribution of Roy labeled with BODIPY in GB cells. Cells were seeded in μ-Dish 35 mm, polymer coverslip, ibiTreat (ibidi GmbH, Gräfelfing, Germany). After 24 h, cells were treated with 16 µM of Roy-BODIPY and further incubated during 48 h. 30 min before the end of treatment, cells were incubated with 100 nM of MitoTracker Red FM (ThermoFisher Scientific, Waltham, MA, USA) and 1 μg/ml of Hoechst 33342 (ThermoFisher Scientific, Waltham, MA, USA) for mitochondrial network and nuclei, respectively, in the presence of serum-free medium and protected from light. Images were acquired using a laser scanning confocal inverted microscope (LSM 710 configured to an Axio Observer Z1 microscope, QUASAR detection unit, ZEN Black software (Carl Zeiss, Germany)) using a pinhole of 1 airy unit, a 63× oil objective (Plan-Apochromat, 1.4 NA), and Diode 405-30 (405 nm), Argon/2 (488 nm) and DPSS 561-10 (561 nm) lasers. Images were analyzed with ImageJ software (Scion Corporation, USA). 2D analysis of the mitochondrial network morphological features was performed using Fiji/ImageJ software (NIH). The mean area and perimeter (representing the mitochondrial size) and the form factor (FF) and aspect ratio (AR) (representing the mitochondrial shape) were analyzed using the mitochondrial analyzer function from Fiji/ImageJ software (NIH) [25].
2.15. Statistical Analysis
Data were analyzed using GraphPad Prism v.10.1.0. All experiments are representative of at least three independent experiments and acquired results were expressed as mean ± standard deviation (SD). Statistical analysis was performed by using t-student test, one-way and two-way ANOVA, using the unpaired comparison and the Dunnett and Šidák multiple comparison tests, respectively. A value of p < 0.05 was considered significant.
3. Results
3.1. Roy Effect in the Metabolic Activity of GB Cells
Treatment with Roy significantly inhibited the metabolic activity of GB cells, being much more effective than TMZ, even at the highest concentration (100 µM was used taking into account the dose of TMZ used in the clinic (75 mg/m2) [26]) (Figure 2A). This result is further corroborated by the IC50 values outlined in Figure 2C. The cell lines U373 and U118 displayed higher sensitivity to the treatment, in comparison to U87, A172, and H4 cells. Across all cell lines, the concentrations of Roy required to achieve a 50% reduction in cell viability were notably lower than the corresponding TMZ concentrations (Figure 2C). Noteworthy, differences emerged in the IC50 values necessary to induce cell death: U118 (14.44 µM) and U373 (17.02 µM) cells exhibited IC50 values that were 15 and 24 times lower than the necessary TMZ concentration to induce the same effect (213.49 and 409.01 μM for U118 and U373 cells, respectively) (Figure 2C). Higher IC50 values were observed for Roy (59.37, 84.60, and 46.82 μM, respectively) in U87, A172, and H4 cells compared to U118 and U373 cells. Nevertheless, Roy still displayed superior efficacy, requiring concentrations around 6, 9, and 11 times lower than those of TMZ needed to achieve a 50% inhibition of proliferation in U87, H4, and A172 cells (371.21, 444.91, and 948.39 μM, respectively) (Figure 2C).
3.2. Roy Effect in Cell Viability of GB Cells
The findings from metabolic activity assessments indicate that Roy exhibits a greater therapeutic potential against GB cells compared to TMZ, the primary first-line treatment. This discovery suggests a promising initial step towards overcoming the challenges associated with TMZ treatment. Subsequently, we delved into the mechanism of cell death using AV/PI staining. This technique facilitates the recognition of live cells from those undergoing apoptosis or necrosis by evaluating membrane permeability and integrity. The experimental setup involved the treatment of all cell lines with 16 µM of Roy, a non-toxic concentration for non-tumoral cells (Figure 2B and Figure 3). After a 48-h treatment period, treated cells were analyzed by flow cytometry (Figure 4). As anticipated, treatment with Roy led to a notable reduction in the percentage of viable cells compared to untreated control cells (Figure 4A,B,D,E), with exception for H4 cells, for which a significant difference was not observed (Figure 4C). Concomitant with these findings, we measured a significant increase in the proportion of cells in the early and late stages of apoptosis/necrosis (Figure 4A,B,D,E). Additionally, a higher percentage of cells in early apoptosis was observable in U87, U373, and U118 cells (Figure 4A,D,E), while an increasing number of cells entered the late stages of apoptosis/necrosis within A172 cells (Figure 4B).
3.3. Roy Effect in Cell Cycle Regulation of GB Cells
Considering the increase in the population of cells undergoing early and late apoptosis (Figure 4), as well as the potential cytostatic activity of Roy, we explored the effects of Roy treatment on cell cycle regulation. This analysis was performed by flow cytometry, using a PI/RNase staining protocol (Figure 5A,B). By quantifying DNA content, we were able to identify a distinct arrest in G2/M phase in U87, A172, and H4 cells, while such effect was not as evident in U373 and U118 cells, being observed an arrest in G0/G1 phase, when comparing to the control condition (untreated cells) (Figure 5A). Notably, DNA fragmentation was discernible as a sub-G1 peak upon Roy treatment in U373 and U118 cells (Figure 5B). In addition, Roy treatment induced a decrease in PARP1 mRNA levels in all cell lines (Figure 5C), probably indicating an inhibition of DNA repair mechanisms and, subsequently, preventing cells from entering mitosis. Taken together, these results support our observations with AV/PI staining, where we detected a higher percentage of cells undergoing apoptosis (Figure 4). Interestingly, although treatment of H4 cells with 16 µM Roy had no visible effect on metabolic activity (Figure 2A) and cell death profile (Figure 4C), an increase in cells in the G2/M phase and a reduction in PARP1 mRNA levels is easily visible (Figure 5A,C).
3.4. Effect of Roy on Mitochondrial Membrane Potential of GB Cells
Following, we investigated potential effects on mitochondria potentially explaining Roy-triggered cell death, a facet we analyzed using JC-1 staining and flow cytometry [24]. JC-1, a cationic and lipophilic dye, accumulates within mitochondria, forming red-fluorescent aggregates in healthy cells. Contrarily, in apoptotic cells, the mitochondrial membrane potential collapses, leading to an inability of JC-1 to aggregate inside the mitochondria and resulting in green monomers. This results in JC-1 retaining its monomeric form within the cytosol. Consequently, an increase in the monomer/aggregate (M/A) ratio correlates with a decrease in mitochondrial membrane potential and, by extension, an increase in cells undergoing apoptosis.
Across all cell lines, a statistically significant increase in the M/A ratio was noted in conditions treated with Roy when compared to untreated cells (control condition) (Figure 6). Furthermore, the increase of the M/A ratio was particularly pronounced within GB (Figure 6A,B) and astrocytoma/GB (Figure 6D,E) cells following exposure to 16 µM of Roy. Conversely, neuroglioma cells displayed the lowest M/A ratios (Figure 6C). Nonetheless, a consistent trend was evident in all cell lines, with the M/A ratio increasing with Roy treatment (Figure 6).
3.5. Roy Effect on Tumor Suppressor Genes mRNA Levels and Anti-Apoptotic Proteins Expression in GB Cells
In the context of the aforementioned findings, it became evident that Roy can cause GB cell death. With this in mind, we measured the mRNA levels of tumor suppressor genes and oncogenes involved in signaling pathways associated with proliferation and cell death. The transcriptional profiles of PTEN, TP53, MDM2, BCL2, and BCL2L1 were evaluated in GB cells following a 48-h Roy treatment period (Figure 7). Notably, we observed that Roy’s treatment prompted an upregulation of transcripts related to tumor suppressor genes, namely PTEN and TP53 (found to be downregulated in GB cells), in comparison to the control group (untreated cells) (Figure 7). Moreover, we also observed the downregulation of MDM2 mRNA expression, a proto-oncogene and negative regulator of p53 expression, was verified upon treatment with Roy, supporting the observed increase of TP53 mRNA levels (Figure 7).
Additionally, after treatment with Roy, mRNA levels of the anti-apoptotic genes BCL2L1 and BCL2 were found to be decreased (Figure 7), accompanied by a decrease in Bcl-2 and p21 protein levels (Figure 8), which may indicate activation of pro-apoptotic mechanisms. Both proteins, Bcl-2 and cytoplasmatic p21, are found to be upregulated in gliomas and are responsible for the inhibition of cell death and progression of cancer.
3.6. Roy Effect in Caspase Levels of GB Cells
To evaluate the potential of Roy treatment to induce caspase-mediated cell death, we assessed CASP9 mRNA levels and quantified activated caspase-3—a final effector caspase involved in programmed cell death. The outcomes yielded a twofold effect of Roy treatment: all cell lines displayed a tendency for the upregulation of CASP9 mRNA levels (Figure 9A) and an increase in the proportion of cells expressing activated caspase-3 (Figure 9B), in comparison with the control group. These findings are aligned with our expectations, given that CASP9, the gene encoding the caspase-9 protein, assumes the role of an initiator caspase, orchestrating the activation of caspase-3. This gives substantial credence to the proposition that Roy elicited a programmed cell death executed through apoptosis, underpinned by activation of the caspase cascade.
3.7. Internalization of Fluorescently-Labeled Roy and Its Effect on the Mitochondrial Morphology in GB Cells
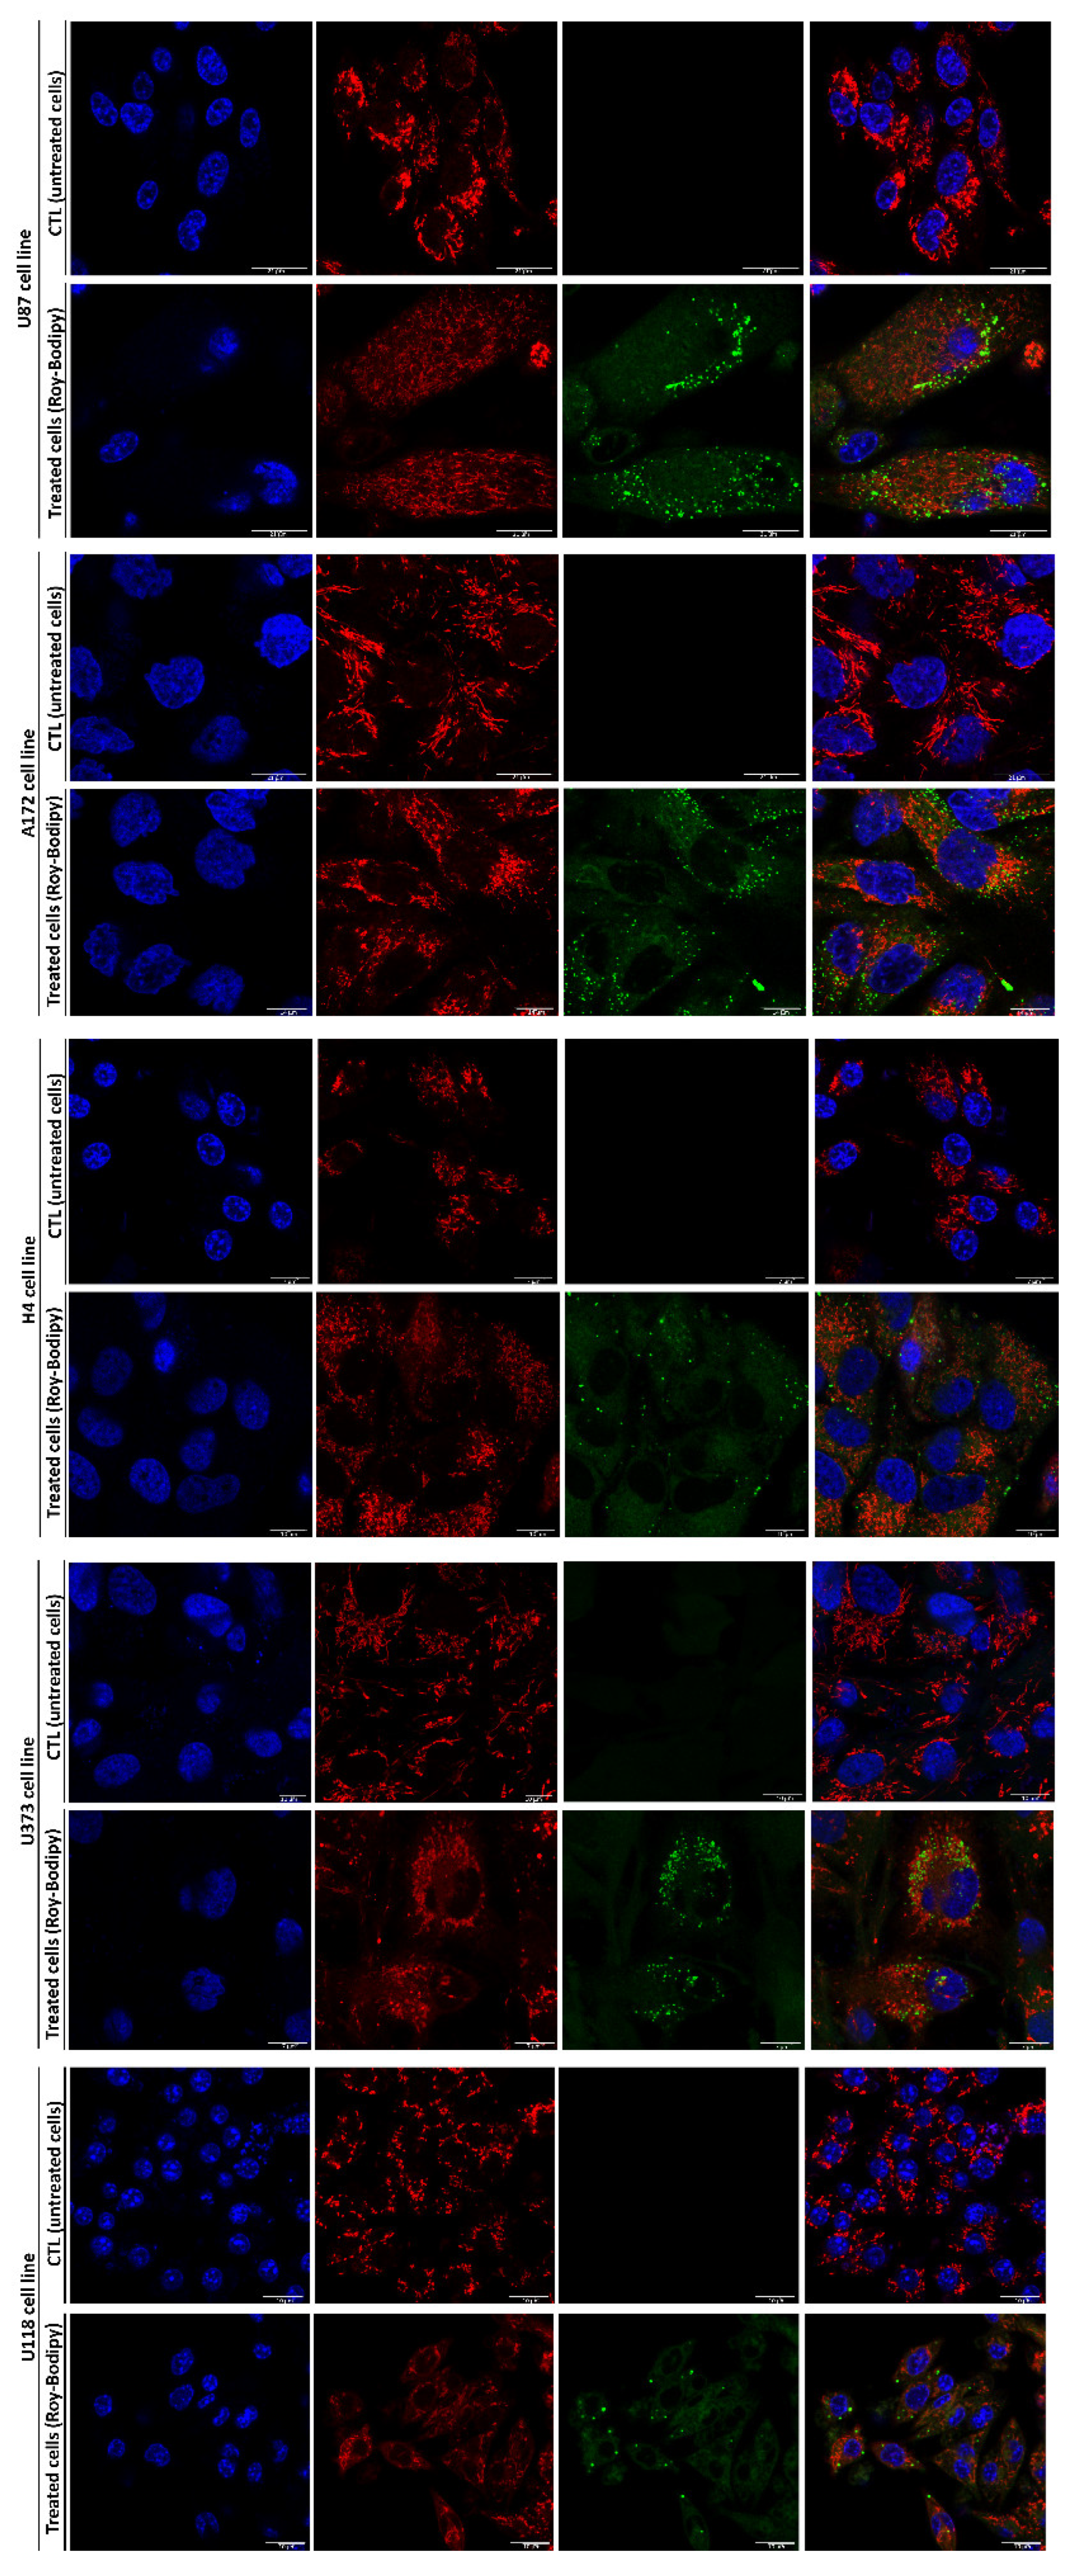
To complement the findings presented within this study, we investigated the uptake of Roy in GB cells and its effect on the mitochondrial morphology using confocal microscopy. We added Roy conjugated with a fluorescent probe (Roy-BODIPY) to cells and incubated them with MitoTracker red and Hoechst 33342 to label the mitochondrial network and nuclei, respectively, and imaged using confocal microscopy (Figure 10). Roy exhibited the ability to be internalized by GB, neuroglioma, and astrocytoma/GB cells and be accumulated within the cytoplasm (Figure 10). Furthermore, a quantitative assessment of mitochondrial morphological traits revealed Roy’s capability to induce structural modifications in mitochondria within GB cells, including changes in the size, represented by the reduction in mean area and perimeter, as well as alterations in shape, reflected by decreases in FF and AR, metrics assessing mitochondrial elongation and perimeter (Supplementary Figure S1) [25]. This analysis suggests that Roy triggers mitochondrial fragmentation in GB cells, consistent with the previously observed decrease in mitochondrial membrane potential (Figure 6) [27]. However, in U118 cells, Roy appears to have no discernible effect on mitochondrial morphology (Supplementary Figure S1), despite the significant decrease in mitochondrial membrane potential (Figure 6E) and an increase in cells undergoing early apoptosis (Figure 4E and Figure 5B).
This visual validation and quantitative analysis serve as a tangible reinforcement of the observed antitumor impact in GB cells upon exposure to a concentration of 16 µM of Roy.
Figure 10.
Cellular uptake of Roy-bodipy in U87, A172, H4, U373, and U118 cells. Cells were treated with 16 µM of Roy for 48 h and further analyzed by confocal microscopy. Representative background-corrected image of GB cells stained with the fluorescent probes MitoTracker red, Hoechst 33342, and BODIPY in untreated cells and cells treated with 16 μM of Roy-BODIPY for 48 h. Hoechst 33342, MitoTracker red, and BODIPY fluorescence intensities were color-coded to blue, red, and green, respectively.
4. Discussion
The pursuit of effective treatments for cancer has driven the exploration of diverse therapeutic avenues, including the very diverse molecules from natural sources. Natural products are an important reservoir of biologically active molecules with high therapeutic significance, with an important role in the discovery of novel anticancer drugs [10,11]. Their inherent complexity and distinct molecular structures have provided a unique array of therapeutic mechanisms by which they can interfere with cancer cell growth and survival pathways, having an immunomodulatory role [11,12]. In this context, the conceptualization of innovative treatments grounded in natural lead compounds appears as a plausible approach to address the challenge posed by GB. This grade 4 glioma remains one of the most challenging cancers to treat due to its heterogeneity, aggressive nature, infiltrative growth, and resistance to conventional therapies [1,28]. Regarding this, terpenes, a prominent class of secondary metabolites in plants, are an example of natural compounds with enhanced therapeutic potential, including marked antitumor properties, that are worth exploring for designing future therapies for GB [13]. In addition, terpenes alluring bioactivities have already rendered them noteworthy assets across diverse industries, such as cosmetics and pharmaceuticals [10,14,22].
Thus, during this work, we addressed the potential antitumor activity of Roy, an abietane diterpene, proposing it as a good natural lead compound for tackling GB via novel therapeutic approaches. The chemotherapeutic potential of Roy was evaluated within a panel of five glioma cell lines. This strategy aimed to mimic in vitro the heterogeneity exhibited by GB, as these cell lines express distinct molecular signatures associated with the molecular subtypes identified in this tumor (proneural, classical, and mesenchymal), which can manifest de novo or evolve from low-grade gliomas [28,29,30].
Treatment with Roy led to a reduction in the metabolic activity of GB cells, being this effect more pronounced when compared to the standard TMZ treatment (first-line therapy). Across all cell lines, the concentrations of Roy needed to achieve a 50% reduction in cell viability were notably lower than the concentrations of TMZ required to produce similar outcomes. Moreover, lower concentrations of Roy (16 µM) were able to affect the metabolic activity of tumoral cells, without the same impact in non-tumoral cells being observed (HMC3 microglia cell line and primary astrocyte cells). Although, for 64 μM, Roy exhibited a significantly high cytotoxicity in non-tumoral cells, showing a concentration-dependent tumor-specificity. This preliminary analysis underscores the inherent antitumor effect of Roy against GB cells, consistent with the cytotoxic profile observed for this diterpene in previous studies [15,16,17], being the potential antitumor mechanism of Roy further explored in this study. As expected, assessment of cell death revealed that administration of Roy induced apoptosis in GB cells, which was further substantiated by a decrease in the mitochondrial membrane potential within GB cells, a shift that corresponds with the onset of apoptosis [24]. This effect was particularly significative in U373 and U118 cells, being observed an increase in sub-G1 phase, which corresponds to DNA fragmentation and is closely linked to heightened apoptotic cells [31]. Moreover, a discernible increase in the population of cells within the G2/M phase was observed for U87, A172, and H4 cells, while, for U373 and U118 cells, was identified an arrest at G0/G1 phase. Notably, all cell lines showed a decrease in PARP1 mRNA levels following Roy treatment, a gene encoding PARP1, a critical protein in DNA damage repair mechanisms. Therefore, it is plausible that Roy induces DNA damage and has a cytostatic effect by hampering cell proliferation and enforcing cell cycle arrest at the G2/M phase. This effect is probably due to its capability to inhibit DNA repair mechanisms and prevent damaged cells to enter in mitosis, consequently the cells undergo apoptosis [17,32].
Moreover, downregulation of the oncogene MDM2 mRNA levels and upregulation of tumor suppressor genes PTEN and TP53 mRNA levels were observed in GB cells following Roy treatment in comparison to non-treated cells. PTEN, a negative regulator of the phosphatidylinositol 3-kinase (PI3K)/protein kinase B (Akt) signaling cascade, and TP53, the encoding gene for the p53 protein—a pivotal transcriptional regulator recognized as the “guardian of the genome”—acted as sentinels responding to stress signals, preventing DNA damage while inducing apoptosis and arresting cell cycle [33,34]. Therefore, this could suggest suppression of the PI3K/Akt signaling pathway through heightened PTEN mRNA levels, leading to the inhibition of MDM2 expression and activation of p53 [35]. Additionally, downregulation of the anti-apoptotic genes BCL2L1 and BCL2 mRNA levels and reduction of Bcl-2 and cytoplasmic p21 protein levels in all GB cells was also observed following Roy treatment. BCL2L1 is the gene encoding the Bcl-xl protein, which together with Bcl-2 belong to the Bcl-2 protein family, which is renowned for its involvement in regulating apoptosis, and its dysregulation can have profound implications for cancer development, progression, and response to therapy [36]. Bcl-2, an anti-apoptotic protein that functions to prevent cells from undergoing apoptosis, is overexpressed in gliomas, although, a decrease in its expression was observed following Roy treatment [36]. Furthermore, overexpression of cytoplasmatic p21, which has been linked to promoting cell survival and resistance to apoptosis in cancer, including glioma, was inhibited after Roy treatment. Despite the oncogenic role of p21 (cytoplasmic p21) in cancer is still an active area of research, it is reported that interaction between cytoplasmic p21 and Bcl-2 may counteract the apoptotic signals initiated by pro-apoptotic factors. This interaction can lead to the suppression of apoptotic pathways and enhance cancer cell survival [37,38]. Herein, upon subjecting GB cells to a lower concentration of Roy, we observed an upregulation of tumor suppressor genes mRNA levels and a decrease in the expression of anti-apoptotic proteins, triggering apoptosis in treated cells. These findings were corroborated by the expression of activated caspase-3, an effector caspase, which was accompanied by upregulation of CASP9 mRNA levels (encodes caspase-9, an initiator caspase). Caspase-3 is a pivotal protein involved in apoptosis, the programmed cell death that maintains tissue homeostasis by eliminating damaged, unnecessary, or potentially harmful cells [39,40]. Hence, the induction of activated caspase-3 expression through Roy treatment triggered the anticipated apoptosis in GB cells. This underlines that the antitumor mechanism of Roy operates via the initiation of caspase-mediated apoptosis. Overall, during this work, we delved into the inherent antitumor efficacy of Roy in various glioma cell lines, with the aim of addressing GB heterogeneity, a hallmark of this type of tumor. In a broad sense, this natural compound affected the mitochondrial network and triggered caspase-mediated apoptosis across all cells. However, we observed distinct mechanisms at play when it came to cell cycle regulation with Roy treatment. For GB and neuroglioma cells, it caused cell cycle arrest in the G2/M phase, while for astrocytoma/GB cells, it led to arrest in the G0/G1 phase. The variation observed among these cell lines may be linked to their distinct molecular signatures associated with GB subtypes (Proneural—U373 and U118 cells; Classical—A172 and H4 cells; and Mesenchymal—U87 cells). Moreover, the antitumor effect of Roy was confirmed by the effective internalization of this natural lead compound by GB cells, as evidenced by confocal microscopy. To be noted, Roy induced structural changes in mitochondria within GB cells, thereby triggering mitochondrial fragmentation (tubular to globular shape) and affecting the mitochondrial network. This aligns with the observed decrease of the mitochondrial membrane potential and increase of cell death following treatment with Roy, thus confirming our expectations. However, these structural changes were not observed in U118 cells, despite a notable decrease in mitochondrial membrane potential accompanied with a substantial increase of cells in apoptosis, following treatment.
The outcomes of this study underline the robust antitumor impact of Roy on GB cells, channeling apoptosis mediated by activation of the caspase cascade. This modulation likely entails cell cycle arrest, mitochondrial fragmentation, upregulation of tumor suppressor genes, and inhibition of anti-apoptotic proteins.
5. Conclusions
The findings from this study strongly demonstrate that the concentration of Roy required to achieve a 50% reduction in cell viability in GB cells was significantly lower than the concentration needed by TMZ, the first-line treatment, to produce a similar effect. Roy treatment not only hindered genes associated with DNA repair but also triggered caspase-mediated apoptosis. Additionally, Roy suppresses the expression of anti-apoptotic proteins, promoting cell death.
In resume, our research identifies a promising therapeutic approach for treating malignant glioma. It offers a hopeful avenue to overcome the limitations linked to conventional treatments. This underlines the potential of Roy as a prospective natural lead candidate to integrate future therapies for GB. Further studies will be addressed to understand the potential of Roy effect in an animal model of GB.
Supplementary Materials
The following supporting information can be downloaded at: Preprints.org.
Author Contributions
Conceptualization, M.M. and C.C.; methodology, M.M.; methodology (acquisition of plant material and isolation of Roy), E.M.D.-M.; methodology (qRT-PCR optimization), J.J.; methodology (acquisition of flow cytometry data), A.C.G.; methodology (establishment of primary cultures), F.M.; methodology (optimization of MTT assay), R.S.; methodology (acquisition of microscope images), T.R.R.; methodology (Optimization WB), S.C.; formal analysis, M.M.; investigation, M.M.; resources, H.G., B.M., E.S., L.F., P.J.O., P.R. and C.C.; writing—original draft preparation, M.M.; writing—review and editing, M.M., A.C.G., S.C., H.G., B.M., E.S., L.F., P.J.O., T.E., P.R. and C.C.; supervision, C.C. and T.E.; funding acquisition, C.C. All authors have read and agreed to the published version of the manuscript.
Funding
This research was funded by Foundation for Science and Technology (FCT, Portugal), through the following projects: UIDB/04539/2020, UIDP/04539/2020, and LA/P/0058/2020 (CIBB) Strategic Projects. M.M. is supported by a Foundation for Science and Technology (FCT) PhD grant (Reference: SFRH/BD/146441/2019). J.J. is supported by a Foundation for Science and Technology (FCT) PhD grant (Reference: SFRH/BD/145531/2019). These PhD grants are financed by national budget and co-financed through the European Social Fund (ESF) and the Regional Operational Por_Centro.
Institutional Review Board Statement
The animal study protocol was approved by the bioethical committee (Protocol n° 1088/2020) and performed in agreement with the Italian and European Community laws on the use of animals for experimental purposes.
Informed Consent Statement
Not applicable.
Data Availability Statement
All data generated or analyzed during this study are included in the published article.
Acknowledgments
E.M.D.-M. gratefully acknowledges being the recipient of a predoctoral FPU-UAH 2019 fellowship from University of Alcalá de Henares. The authors would like to thank the support of iLAB—Microscopy and Bioimaging Lab a facility of Faculty of Medicine of University of Coimbra, and member of the national infrastructure PPBI-Portuguese Platform of BioImaging (POCI-01-0145-FEDER-022122) and supported by FSE CENTRO-04-3559-FSE-000142.
Conflicts of Interest
The authors declare no conflicts of interest. The funders had no role in the design of the study; in the collection, analyses, or interpretation of data; in the writing of the manuscript; or in the decision to publish the results.
References
- Louis, D.N.; Perry, A.; Wesseling, P.; Brat, D.J.; Cree, I.A.; Figarella-Branger, D.; Hawkins, C.; Ng, H.K.; Pfister, S.M.; Reifenberger, G.; et al. The 2021 WHO Classification of Tumors of the Central Nervous System: A Summary. Neuro. Oncol. 2021, 23, 1231–1251. [Google Scholar] [CrossRef] [PubMed]
- Wen, P.Y.; Packer, R.J. The 2021 WHO Classification of Tumors of the Central Nervous System: Clinical Implications. Neuro. Oncol. 2021, 23, 1215–1217. [Google Scholar] [CrossRef] [PubMed]
- Hazaymeh, M.; Löber-Handwerker, R.; Döring, K.; Abboud, T.; Mielke, D.; Rohde, V.; Malinova, V. Prognostic Differences and Implications on Treatment Strategies between Butterfly Glioblastoma and Glioblastoma with Unilateral Corpus Callosum Infiltration. Sci. Rep. 2022, 12, 19208. [Google Scholar] [CrossRef] [PubMed]
- Kow, C.Y.; Kim, B.J.H.; Park, T.I.-H.; Chen, J.C.C.; Vong, C.K.; Kim, J.Y.; Shim, V.; Dragunow, M.; Heppner, P. Extent of Resection Affects Prognosis for Patients with Glioblastoma in Non-Eloquent Regions. J. Clin. Neurosci. 2020, 80, 242–249. [Google Scholar] [CrossRef] [PubMed]
- Tan, A.C.; Ashley, D.M.; López, G.Y.; Malinzak, M.; Friedman, H.S.; Khasraw, M. Management of Glioblastoma: State of the Art and Future Directions. CA. Cancer J. Clin. 2020, 70, 299–312. [Google Scholar] [CrossRef] [PubMed]
- Rončević, A.; Koruga, N.; Soldo Koruga, A.; Rončević, R.; Rotim, T.; Šimundić, T.; Kretić, D.; Perić, M.; Turk, T.; Štimac, D. Personalized Treatment of Glioblastoma: Current State and Future Perspective. Biomedicines 2023, 11, 1579. [Google Scholar] [CrossRef] [PubMed]
- Angom, R.S.; Nakka, N.M.; Bhattacharya, S. Advances in Glioblastoma Therapy: An Update on Current Approaches. Brain Sci. 2023, 13, 1536. [Google Scholar] [CrossRef] [PubMed]
- Chien, C.-H.; Hsueh, W.-T.; Chuang, J.-Y.; Chang, K.-Y. Dissecting the Mechanism of Temozolomide Resistance and Its Association with the Regulatory Roles of Intracellular Reactive Oxygen Species in Glioblastoma. J. Biomed. Sci. 2021, 28, 18. [Google Scholar] [CrossRef]
- Ortiz, R.; Perazzoli, G.; Cabeza, L.; Jiménez-Luna, C.; Luque, R.; Prados, J.; Melguizo, C. Temozolomide: An Updated Overview of Resistance Mechanisms, Nanotechnology Advances and Clinical Applications. Curr. Neuropharmacol. 2021, 19, 513–537. [Google Scholar] [CrossRef]
- Howes, M.J.R. The Evolution of Anticancer Drug Discovery from Plants. Lancet Oncol. 2018, 19, 293–294. [Google Scholar] [CrossRef]
- Rodrigues, T.; Reker, D.; Schneider, P.; Schneider, G. Counting on Natural Products for Drug Design. Nat. Chem. 2016, 8, 531–541. [Google Scholar] [CrossRef] [PubMed]
- Rayan, A.; Raiyn, J.; Falah, M. Nature Is the Best Source of Anticancer Drugs: Indexing Natural Products for Their Anticancer Bioactivity. PLoS One 2017, 12, 1–12. [Google Scholar] [CrossRef] [PubMed]
- Domínguez-Martín, E.M.; Magalhães, M.; Efferth, T.; Díaz-Lanza, A.M.; Cabral, C.; Rijo, P. Chapter 12—Terpenes: A Hope for Glioblastoma Patients. In New Insights Into Glioblastoma: Diagnosis, Therapeutics and Theranostics; Vitorino, C., Balaña, C., Cabral, C.B.T., Eds.; Academic Press, 2023; pp. 227–269. ISBN 978-0-323-99873-4. [Google Scholar]
- Yang, W.; Chen, X.; Li, Y.; Guo, S.; Wang, Z.; Yu, X. Advances in Pharmacological Activities of Terpenoids. Nat. Prod. Commun. 2020, 15, 1934578x20903555. [Google Scholar] [CrossRef]
- Domínguez-Martín, E.M.; Magalhães, M.; Díaz-Lanza, A.M.; Marques, M.P.; Princiotto, S.; Gómez, A.M.; Efferth, T.; Cabral, C.; Rijo, P. Phytochemical Study and Antiglioblastoma Activity Assessment of Plectranthus Hadiensis (Forssk.) Schweinf. Ex Sprenger Var. Hadiensis Stems. Molecules 2022, 27, 3813. [Google Scholar] [CrossRef] [PubMed]
- Śliwiński, T.; Sitarek, P.; Skała, E.; M. S. Isca, V.; Synowiec, E.; Kowalczyk, T.; Bijak, M.; Rijo, P. Diterpenoids from Plectranthus Spp. as Potential Chemotherapeutic Agents via Apoptosis. Pharmaceuticals 2020, 13, 123. [Google Scholar] [CrossRef] [PubMed]
- Sitarek, P.; Toma, M.; Ntungwe, E.; Kowalczyk, T.; Skała, E.; Wieczfinska, J.; Śliwiński, T.; Rijo, P. Insight the Biological Activities of Selected Abietane Diterpenes Isolated from Plectranthus spp. Biomolecules 2020, 10, 194. [Google Scholar] [CrossRef] [PubMed]
- Ntungwe, E.; Domínguez-Martín, E.M.; Teodósio, C.; Teixidó-Trujillo, S.; Armas Capote, N.; Saraiva, L.; Díaz-Lanza, A.M.; Duarte, N.; Rijo, P. Preliminary Biological Activity Screening of Plectranthus Spp. Extracts for the Search of Anticancer Lead Molecules. Pharmaceuticals 2021, 14, 402. [Google Scholar] [CrossRef] [PubMed]
- Massenzio, F.; Peña-altamira, E.; Petralla, S.; Virgili, M.; Zuccheri, G.; Miti, A.; Polazzi, E.; Mengoni, I.; Piffaretti, D.; Monti, B. Microglial Overexpression of FALS-Linked Mutant SOD1 Induces SOD1 Processing Impairment, Activation and Neurotoxicity and Is Counteracted by the Autophagy Inducer Trehalose. BBA - Mol. Basis Dis. 2018, 1864, 3771–3785. [Google Scholar] [CrossRef]
- Polazzi, E.; Altamira, L.E.P.; Eleuteri, S.; Barbaro, R.; Casadio, C.; Contestabile, A.; Monti, B. Neuroprotection of Microglial Conditioned Medium on 6-Hydroxydopamine-Induced Neuronal Death: Role of Transforming Growth Factor Beta-2. J. Neurochem. 2009, 110, 545–556. [Google Scholar] [CrossRef]
- Magalhães, M.; Farinha, D.; de Lima, M.C.P.; Faneca, H. Increased Gene Delivery Efficiency and Specificity of a Lipid-Based Nanosystem Incorporating a Glycolipid. Int. J. Nanomedicine 2014, 9, 4979–4989. [Google Scholar] [CrossRef]
- Magalhães, M.; Domínguez-Martín, E.M.; Jorge, J.; Gonçalves, A.C.; Díaz-Lanza, A.M.; Manadas, B.; Efferth, T.; Rijo, P.; Cabral, C. Parvifloron D-Based Potential Therapy for Glioblastoma: Inducing Apoptosis via the Mitochondria Dependent Pathway. Front. Pharmacol. 2022, 13, 1–12. [Google Scholar] [CrossRef] [PubMed]
- Alves, R.; Gonçalves, A.C.; Jorge, J.; Alves, J.; Alves da Silva, A.; Freitas-Tavares, P.; Nascimento Costa, J.M.; Almeida, A.M.; Sarmento-Ribeiro, A.B. Everolimus in Combination with Imatinib Overcomes Resistance in Chronic Myeloid Leukaemia. Med. Oncol. 2019, 36, 30. [Google Scholar] [CrossRef] [PubMed]
- Gonçalves, A.C.; Alves, V.; Silva, T.; Carvalho, C.; Oliveira, C.R. de; Sarmento-Ribeiro, A.B. Oxidative Stress Mediates Apoptotic Effects of Ascorbate and Dehydroascorbate in Human Myelodysplasia Cells in Vitro. Toxicol. Vitr. 2013, 27, 1542–1549. [Google Scholar] [CrossRef] [PubMed]
- Chaudhry, A.; Shi, R.; Luciani, D.S. A Pipeline for Multidimensional Confocal Analysis of Mitochondrial Morphology, Function, and Dynamics in Pancreatic β-Cells. Am. J. Physiol. Metab. 2019, 318, E87–E101. [Google Scholar] [CrossRef] [PubMed]
- Clinic, M. Https://Www.Mayoclinic.Org/Drugs-Supplements/Temozolomide-Oral-Route/Proper-Use/Drg-20066228.
- Miyazono, Y.; Hirashima, S.; Ishihara, N.; Kusukawa, J.; Nakamura, K.; Ohta, K. Uncoupled Mitochondria Quickly Shorten along Their Long Axis to Form Indented Spheroids, Instead of Rings, in a Fission-Independent Manner. Sci. Rep. 2018, 8, 350. [Google Scholar] [CrossRef] [PubMed]
- Magalhães, M.; Cabral, C.; Costa, B.M.; Manadas, B. Chapter 5—Secretome Analysis of Patient-Derived Glioblastoma Cells for Potential Biomarker Identification. In New Insights Into Glioblastoma: Diagnosis, Therapeutics and Theranostics; Vitorino, C., Balaña, C., Cabral, C.B.T., Eds.; Academic Press, 2023; pp. 81–97. ISBN 978-0-323-99873-4. [Google Scholar] [CrossRef]
- Verhaak, R.G.W.; Hoadley, K.A.; Purdom, E.; Wang, V.; Qi, Y.; Wilkerson, M.D.; Miller, C.R.; Ding, L.; Golub, T.; Mesirov, J.P.; et al. Integrated Genomic Analysis Identifies Clinically Relevant Subtypes of Glioblastoma Characterized by Abnormalities in PDGFRA, IDH1, EGFR, and NF1. Cancer Cell 2010, 17, 98–110. [Google Scholar] [CrossRef] [PubMed]
- Lane, R.; Simon, T.; Vintu, M.; Solkin, B.; Koch, B.; Stewart, N.; Benstead-Hume, G.; Pearl, F.M.G.; Critchley, G.; Stebbing, J.; et al. Cell-Derived Extracellular Vesicles Can Be Used as a Biomarker Reservoir for Glioblastoma Tumor Subtyping. Commun. Biol. 2019, 2, 315. [Google Scholar] [CrossRef] [PubMed]
- Plesca, D.; Mazumder, S.; Almasan, A.B.T.-M. in E. DNA Damage Response and Apoptosis. In Programmed Cell Death, The Biology and Therapeutic Implications of Cell Death, Part B; Academic Press, 2008; Volume 446, pp. 107–122. ISBN 0076-6879. [CrossRef]
- Pan, Z.; Zhang, X.; Yu, P.; Chen, X.; Lu, P.; Li, M.; Liu, X.; Li, Z.; Wei, F.; Wang, K.; et al. Cinobufagin Induces Cell Cycle Arrest at the G2/M Phase and Promotes Apoptosis in Malignant Melanoma Cells. Front. Oncol. 2019, 9. [Google Scholar] [CrossRef] [PubMed]
- Koul, D. PTEN Signaling Pathways in Glioblastoma. Cancer Biol. Ther. 2008, 7, 1321–1325. [Google Scholar] [CrossRef]
- Abraham, A.G.; O’Neill, E. PI3K/Akt-Mediated Regulation of P53 in Cancer. Biochem. Soc. Trans. 2014, 42, 798–803. [Google Scholar] [CrossRef]
- Pearson, J.R.D.; Regad, T. Targeting Cellular Pathways in Glioblastoma Multiforme. Signal Transduct. Target. Ther. 2017, 2, 17040. [Google Scholar] [CrossRef] [PubMed]
- Warren, C.F.A.; Wong-Brown, M.W.; Bowden, N.A. BCL-2 Family Isoforms in Apoptosis and Cancer. Cell Death Dis. 2019, 10, 177. [Google Scholar] [CrossRef] [PubMed]
- Abbas, T.; Dutta, A. P21 in Cancer: Intricate Networks and Multiple Activities. Nat. Rev. Cancer 2009, 9, 400–414. [Google Scholar] [CrossRef] [PubMed]
- Shamloo, B.; Usluer, S. P21 in Cancer Research. Cancers 2019, 11, 1178. [Google Scholar] [CrossRef] [PubMed]
- Yadav, P.; Yadav, R.; Jain, S.; Vaidya, A. Caspase-3: A Primary Target for Natural and Synthetic Compounds for Cancer Therapy. Chem. Biol. Drug Des. 2021, 98, 144–165. [Google Scholar] [CrossRef]
- Elmore, S. Apoptosis: A Review of Programmed Cell Death. Toxicol. Pathol. 2007, 35, 495–516. [Google Scholar] [CrossRef]
Figure 1.
Chemical structure of 7α-acetoxy-6β-hydroxyroyleanone (Roy).
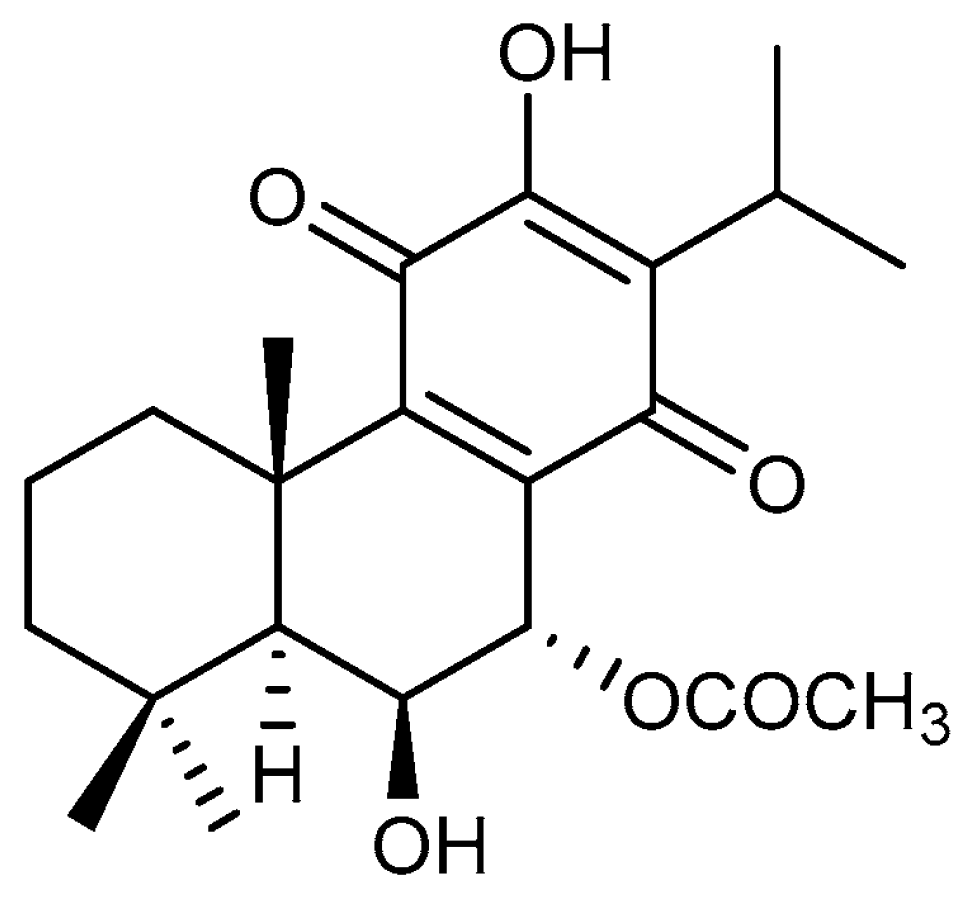
Figure 2.
Impact of Roy on the metabolic activity of glioblastoma cell lines and non-tumoral cells. A) U87, A172, H4, U373, and U118 cells were treated either with Roy (1, 4, 16, and 64 µM) or with temozolomide (1, 10, 50, and 100 µM), and B) HMC3 cells were treated with different concentrations of Roy (1, 4, 16, and 64 µM) for 48 h, and subsequently Alamar blue® assay was performed. Metabolic activity was expressed as percentage of control (CTL) (untreated cells). Asterisks (* p < 0.05, ** p < 0.01, *** p < 0.001, and **** p < 0.0001) represent the values that significantly differ from the control. Data are representative of three independent experiments and are expressed as mean ± SD. C) IC50 values for Roy and TMZ in a panel of glioblastoma cell lines.
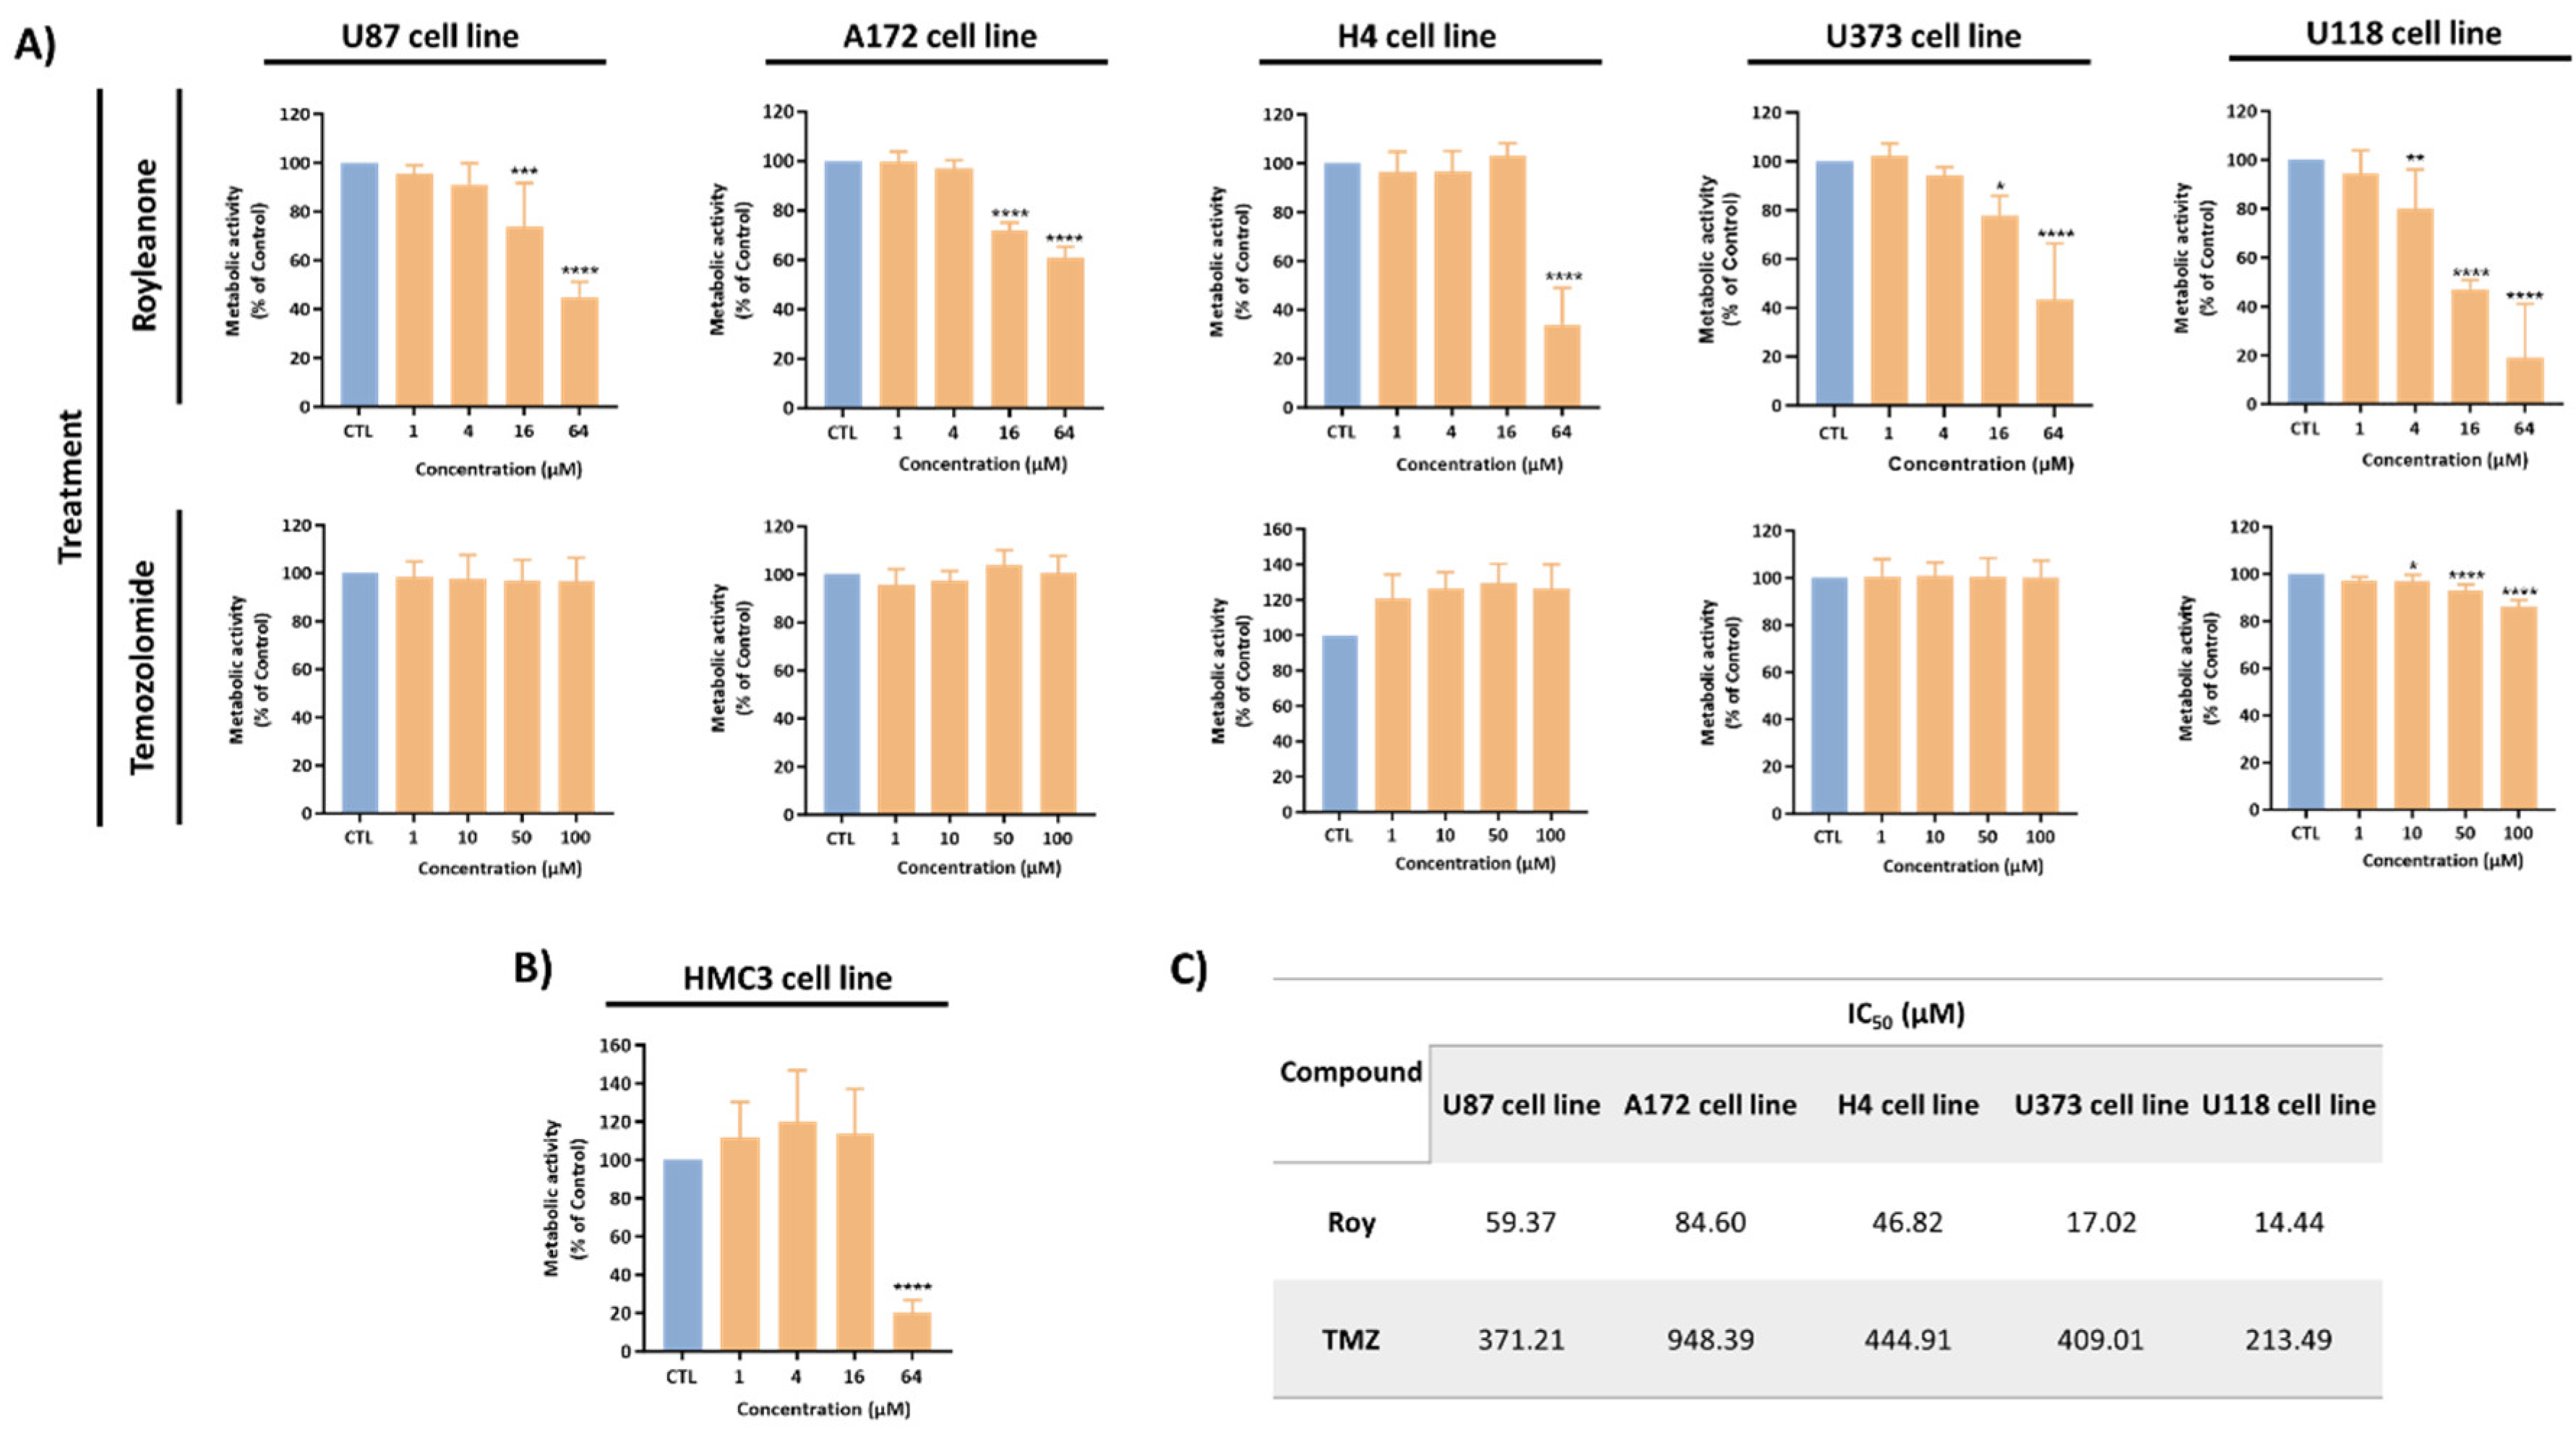
Figure 3.
Impact of Roy on the metabolic activity of non-tumoral cells. Primary astrocyte cells were exposed to Roy’s treatment (1, 4, 16, and 64 µM) for 24 h and MTT assay was performed. Metabolic activity was expressed as percentage of control (CTL) (untreated cells). Asterisks (**** p < 0.0001) represent the values that significantly differ from the control. Data are representative of three independent experiments and are expressed as mean ± SD.
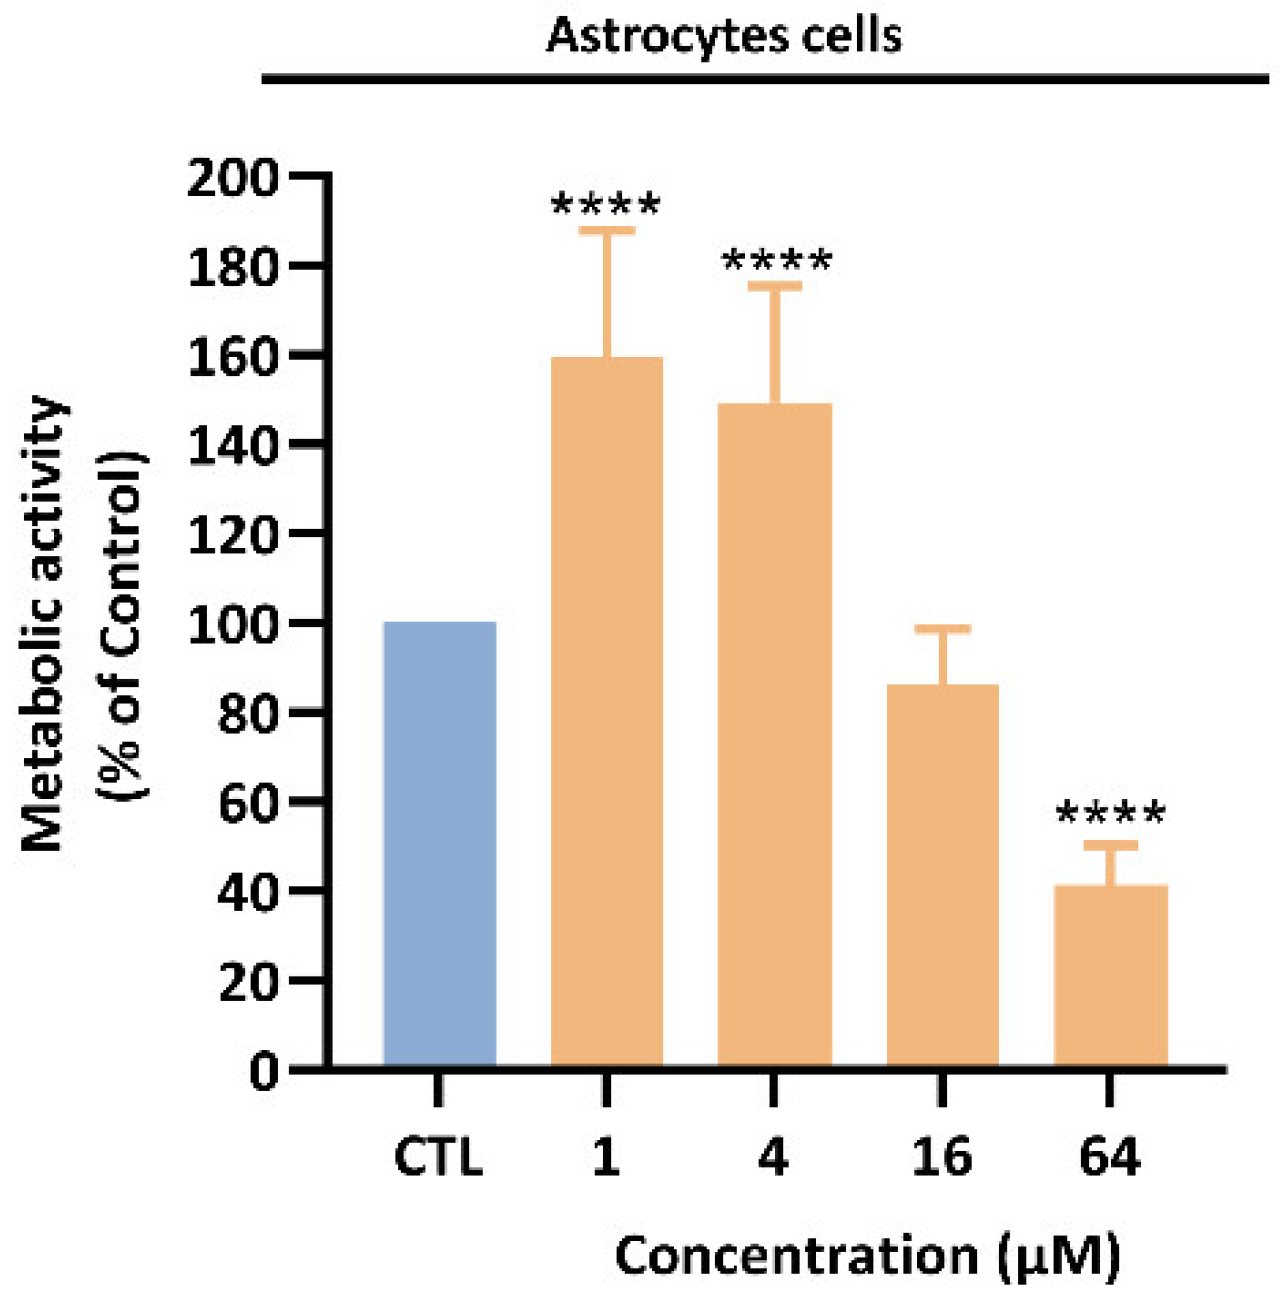
Figure 4.
Cell death profile in U87 (A), A172 (B), H4 (C), U373 (D), and U118 (E) cell lines after treatment with Roy. Cells were treated with 16 µM of Roy and further incubated for 48 h. After, cells were co-stained with Annexin V and PI, and the percentage of non-apoptotic cells or cells in apoptosis was determined by flow cytometry. Asterisks (** p < 0.01, *** p < 0.001, and **** p < 0.0001) represent the values that significantly differ from the control group (CTL) (untreated cells). Data are representative of five independent experiments and are expressed as mean ± SD.
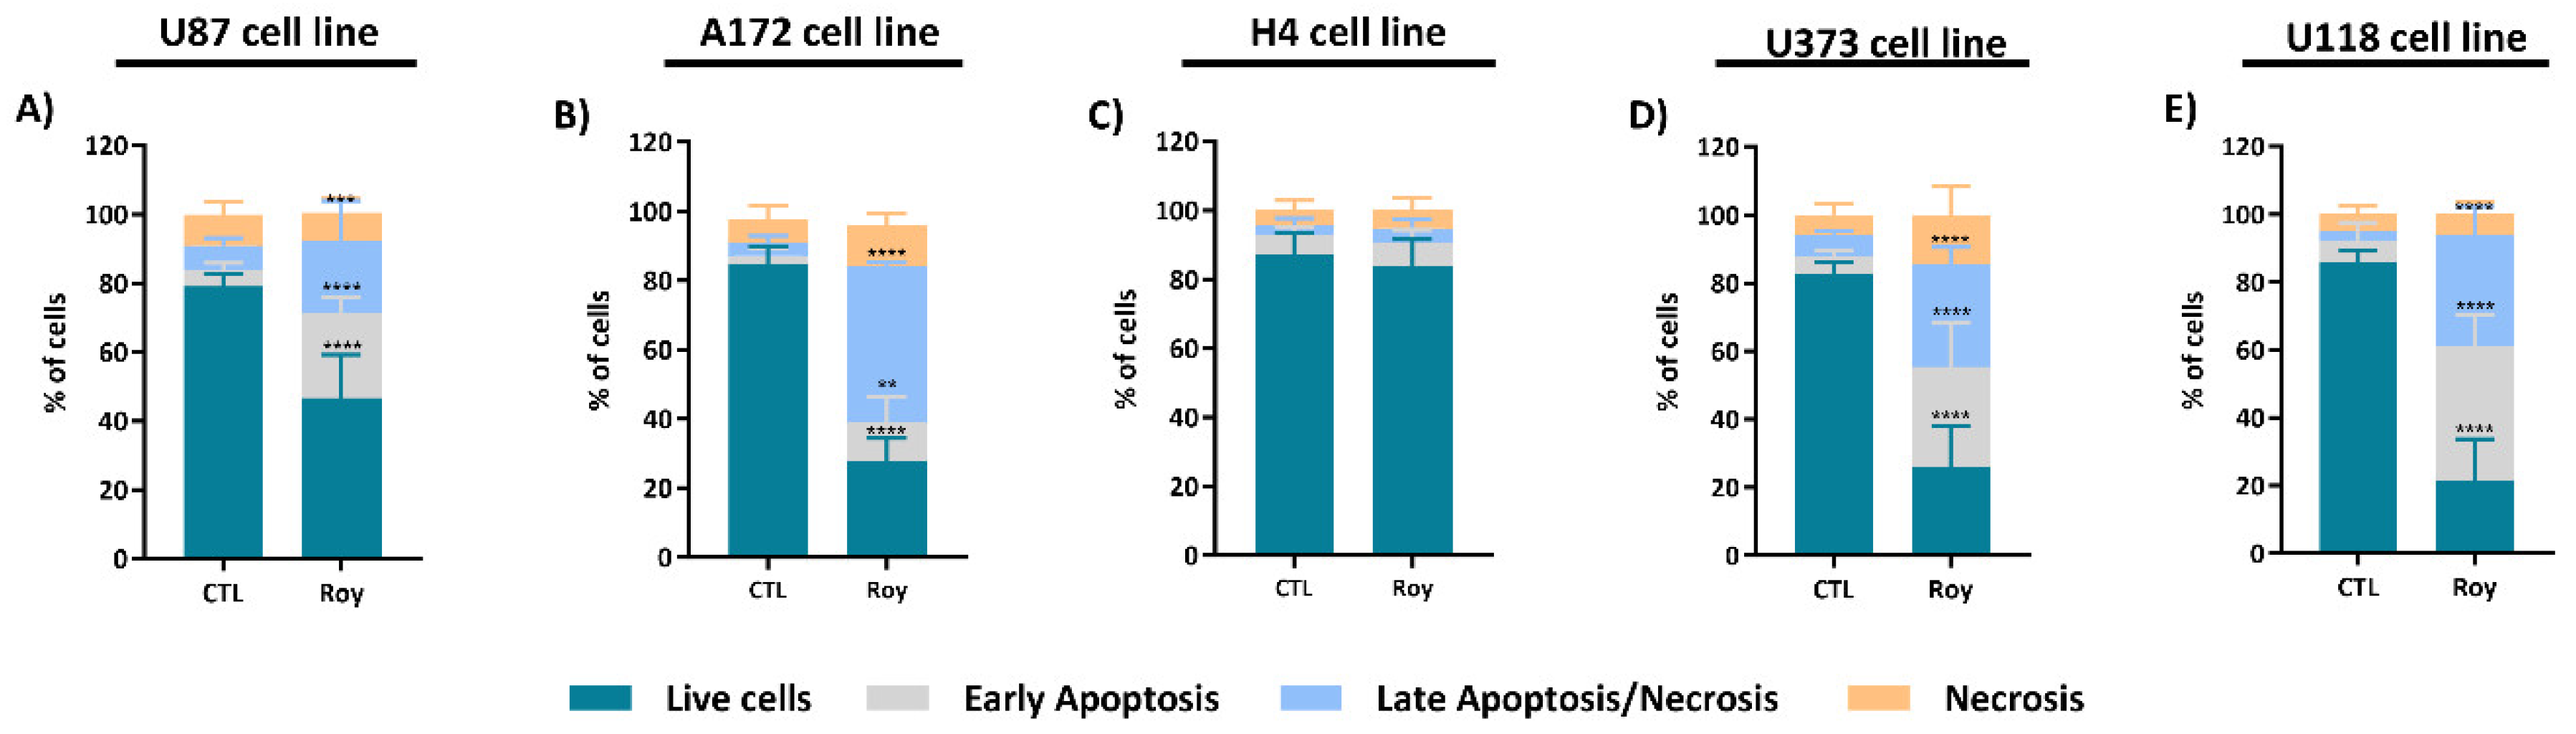
Figure 5.
Effects of Roy on cell cycle progression (A), on DNA fragmentation associated with sub-G1 peak (B), and PARP1 mRNA levels (C) in U87, A172, H4, U373, and U118 cell lines. Cells were treated with 16 µM of Roy for 48 h. A) Cells were stained using a PI/RNase protocol and cell cycle was evaluated by flow cytometry. The proportion of cells in G0/G1, S, and G2/M cell cycle phases was expressed as a percentage of the total cell population. B) Sub-G1 peak associated with DNA fragmentation was assessed using PI/RNase staining protocol. Data was expressed in percentage of cells in Sub-G1. C) Relative expression of PARP1 mRNA levels was assessed by qRT-PCR and the results normalized to GAPDH expression. Asterisks (* p < 0.05, ** p < 0.01, *** p < 0.001, and **** p < 0.0001) represent values that significantly differ from the control group (CTL) (untreated cells). Data are representative of five independent experiments and are expressed as mean ± SD.
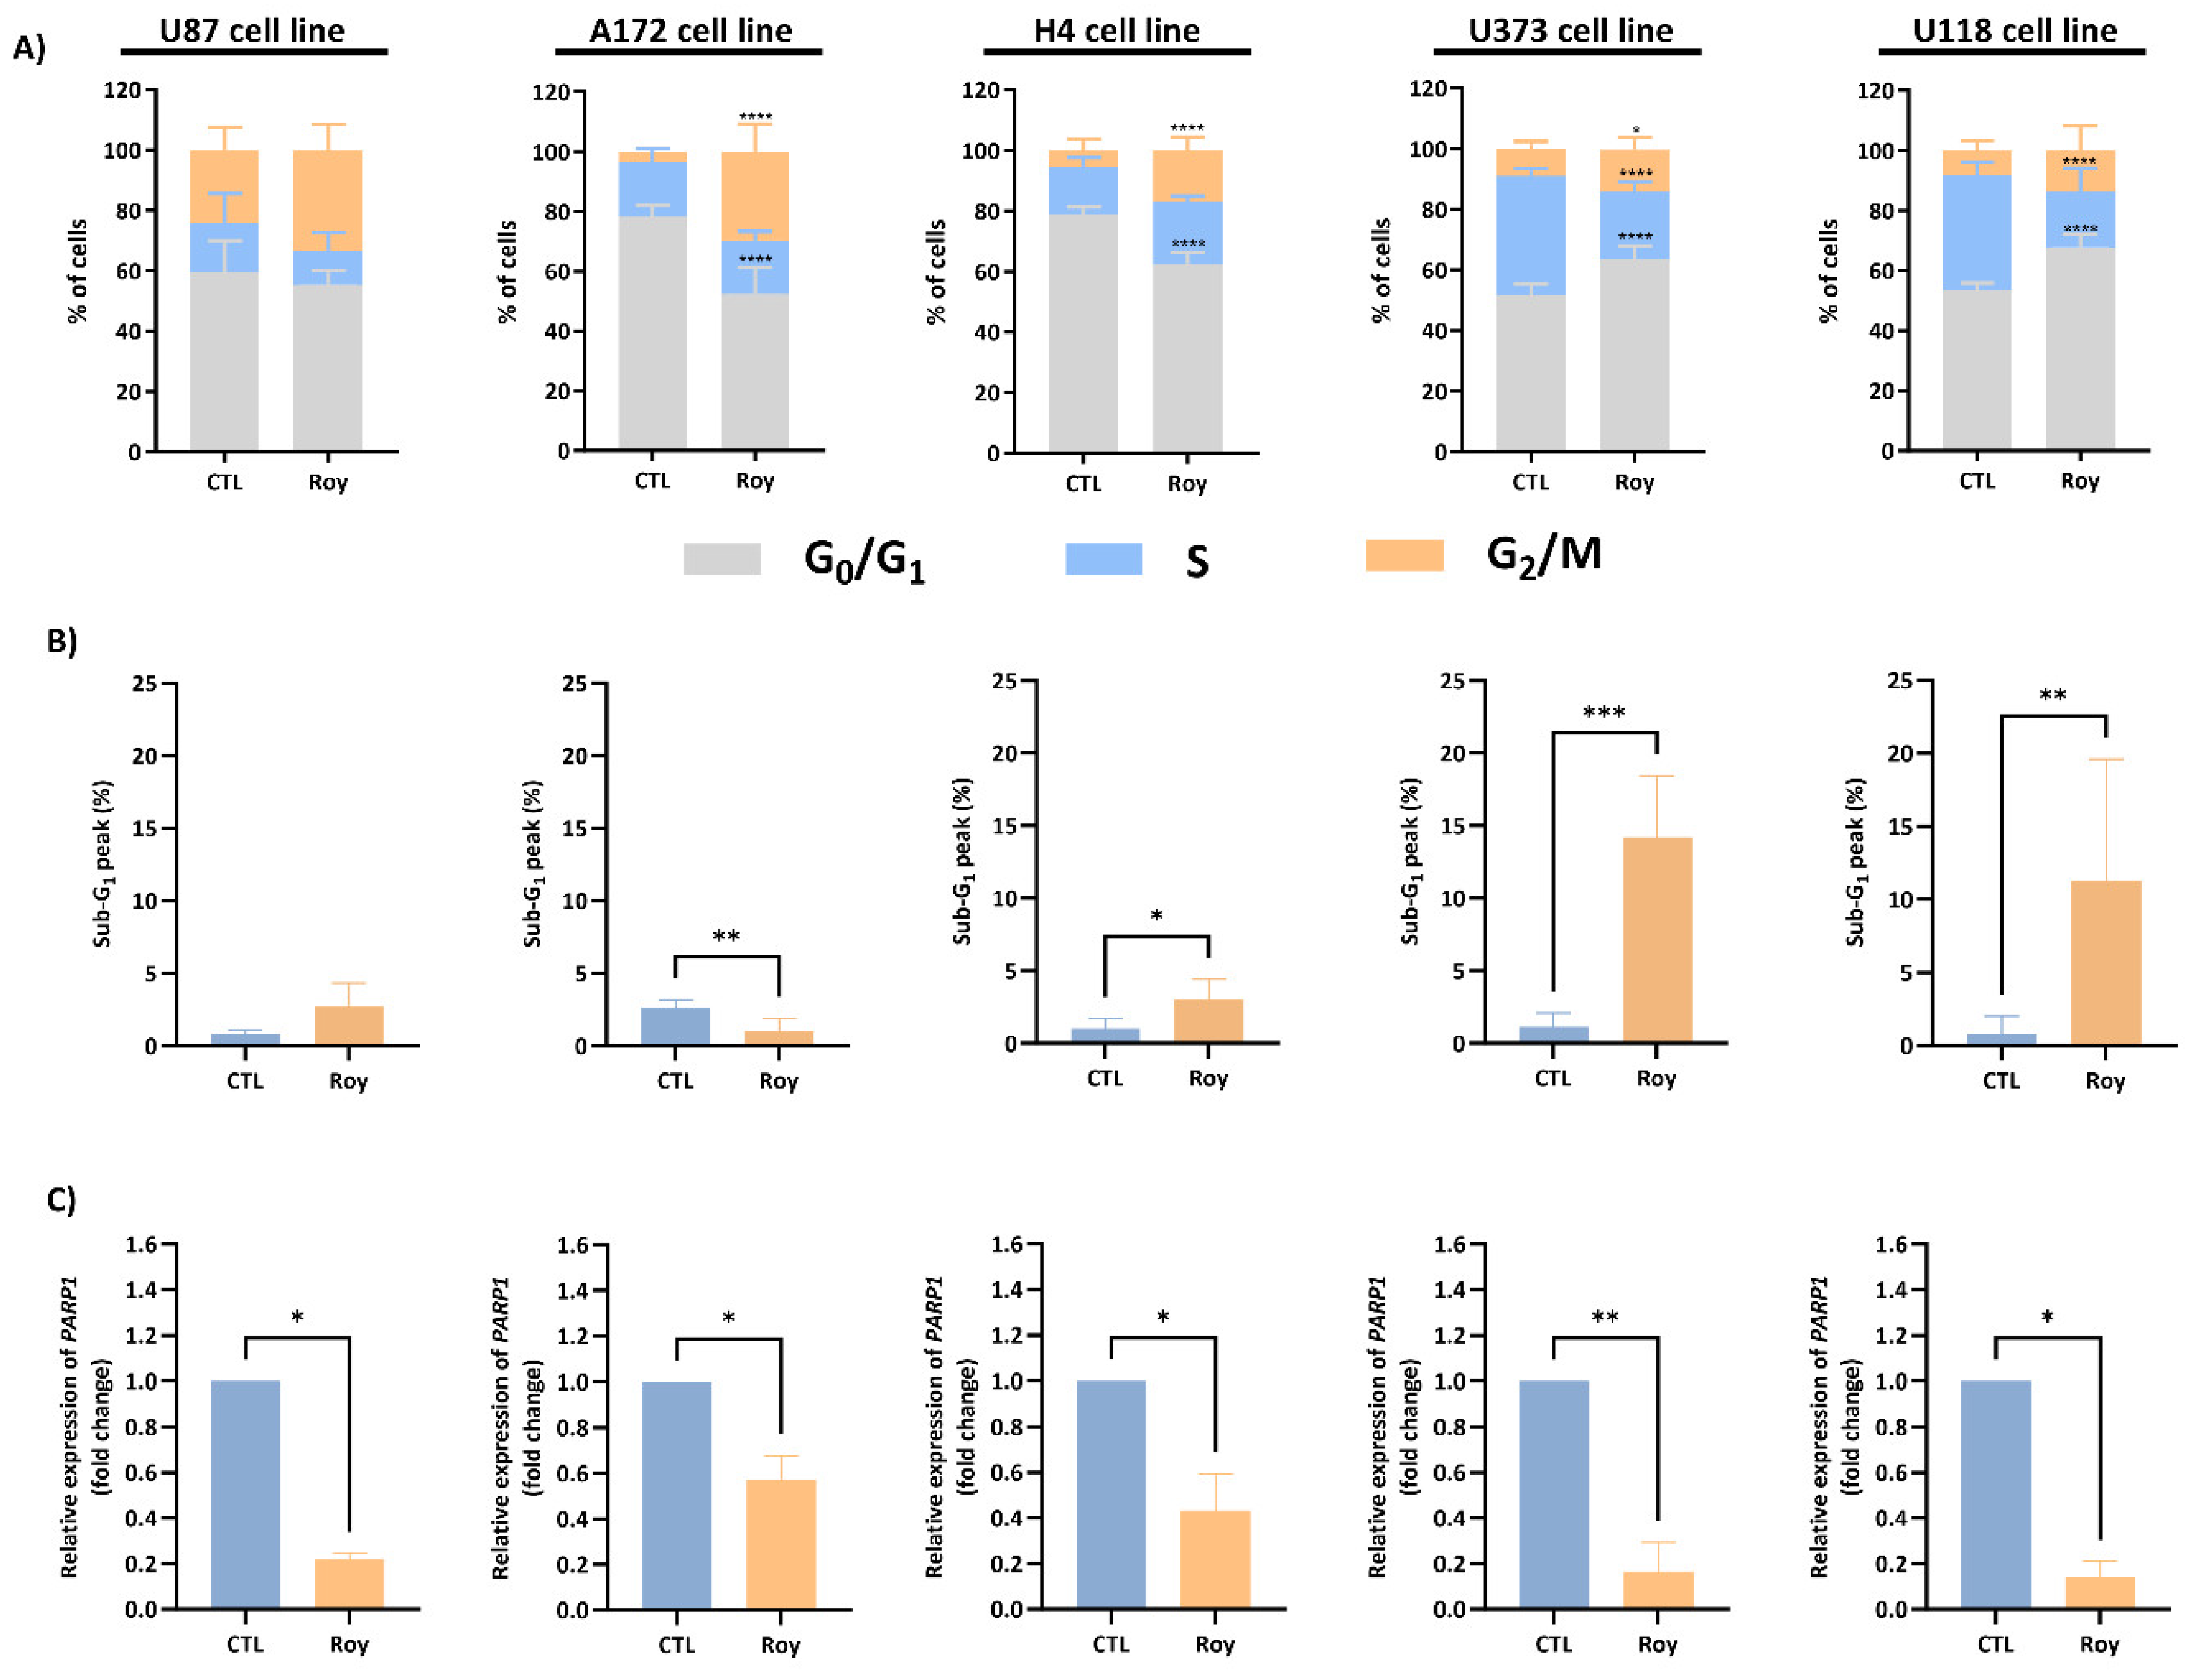
Figure 6.
Analysis of mitochondrial membrane potential (∆ψmit) in U87 (A), A172 (B), H4 (C), U373 (D), and U118 (E) cell lines. After treatment with 16 µM of Roy for 48 h, cells were incubated with the JC-1 probe and analyzed by flow cytometry. The monomeric or aggregate form of JC-1 probe depends on the mitochondrial membrane potential. An increase in the monomer/aggregate (M/A) ratio indicates a decrease in the mitochondrial polarization. Data are expressed as M/A ratio of JC-1, which was calculated as the fraction of MFI observed for each molecule. Asterisks (* p < 0.05 and ** p < 0.01) represent the values that significantly differ from the control condition (CTL) (untreated cells). Data were presented as mean ± SD and are representative of five independent experiments.
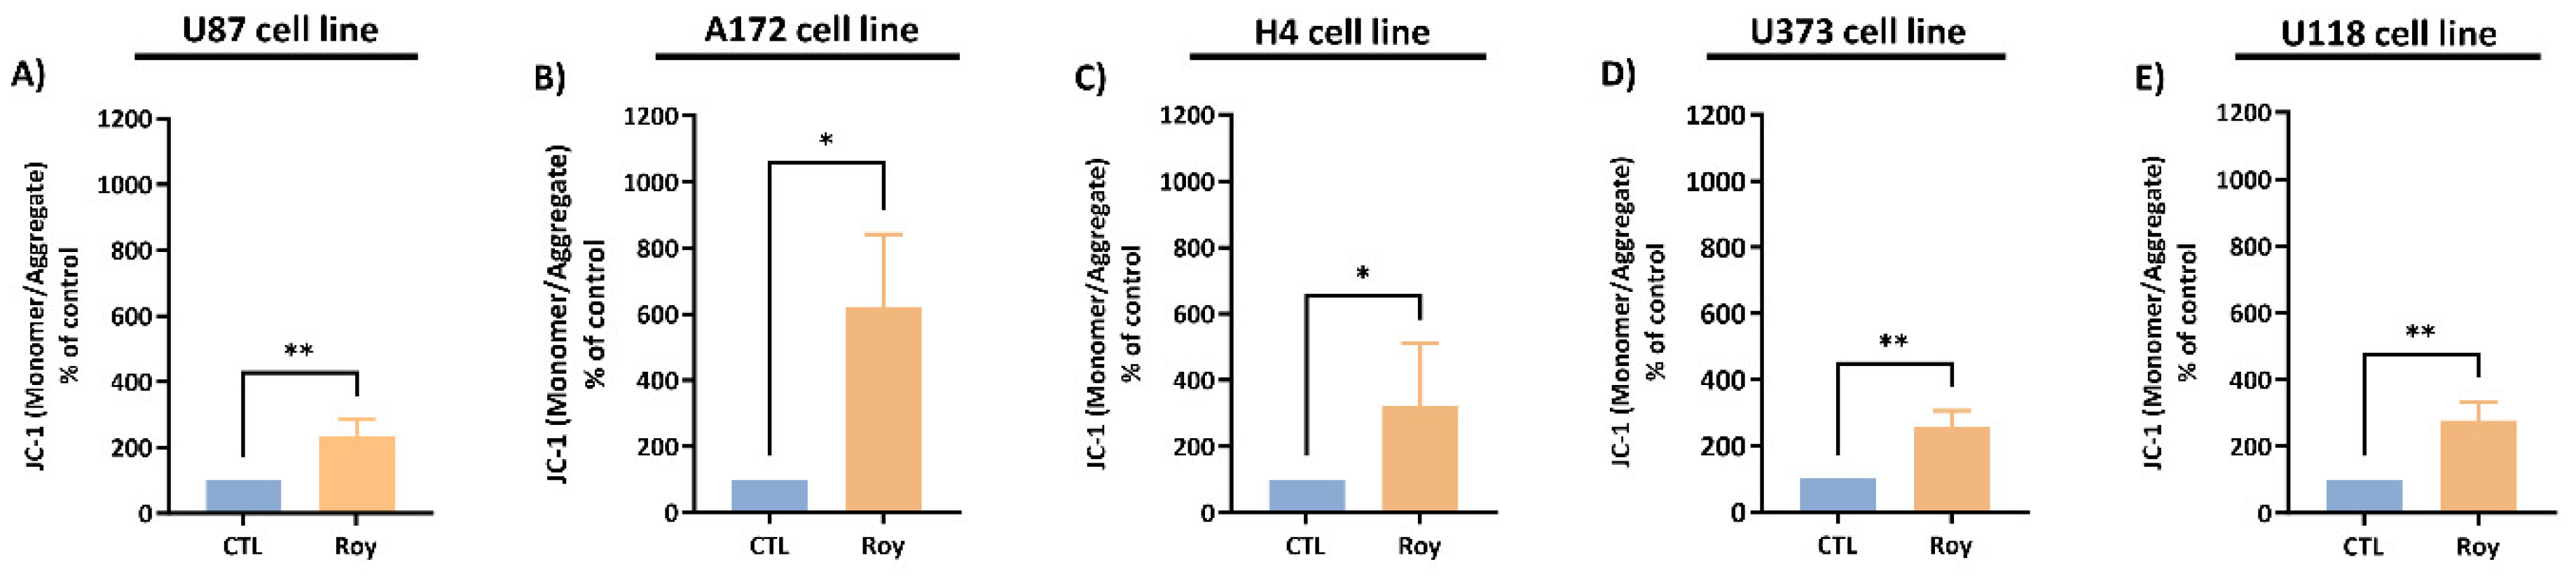
Figure 7.
Assessment of PTEN, MDM2, TP53, BCL2L1, and BCL2 mRNA levels in U87, A172, H4, U373, and U118 cells, after Roy treatment (16 µM) for 48 h. After incubation, the relative expression of PTEN, MDM2, TP53, BCL2L1, and BCL2 was assessed by qRT-PCR, and the results normalized to GAPDH expression. Asterisks (* p < 0.05 and ** p < 0.01) represent the values that significantly differ from the control condition (CTL) (untreated cells). Data are presented as mean ± SD and it is representative of five independent experiments.
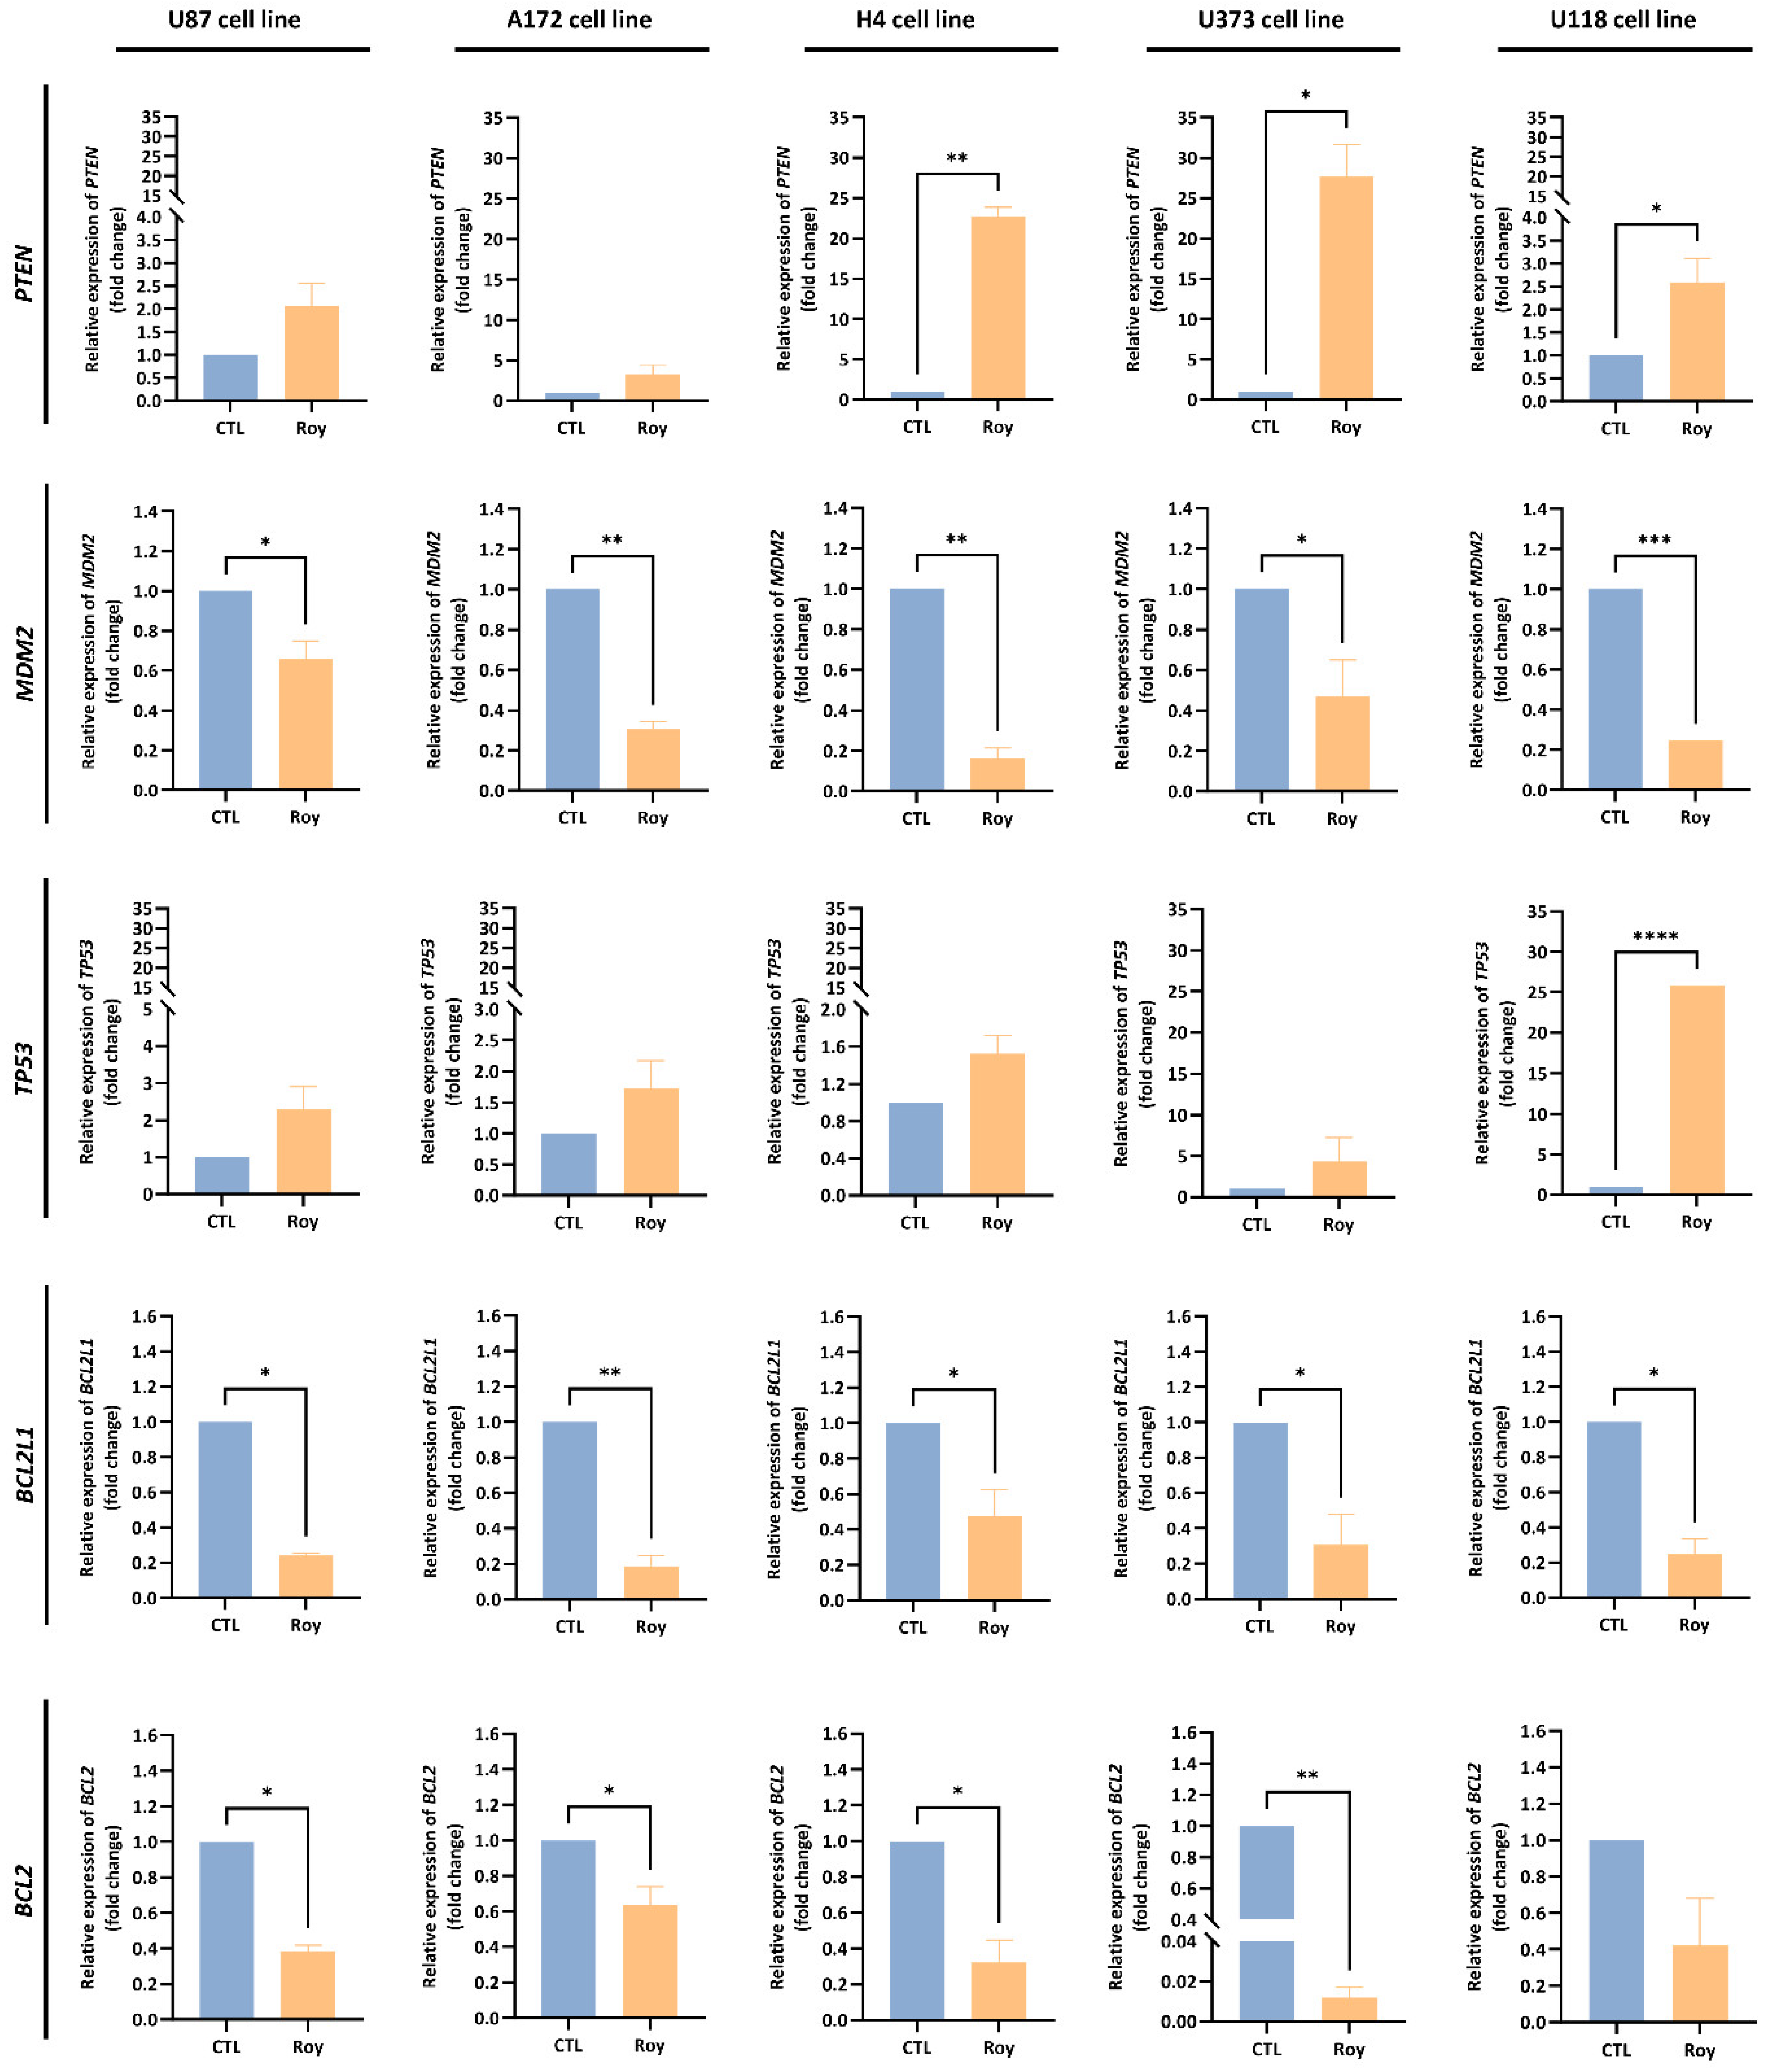
Figure 8.
Impact of Roy in the expression of the anti-apoptotic proteins, Bcl-2 and cytoplasmic p21, in U87, A172, H4, U373 and U118 cells. Representative western blot result and protein content of Bcl-2, p21, and β-actin (cytosolic marker) in whole-cell homogenates from untreated cells or cells treated with Roy (16 µM) for 48 h. Blots were inverted and contrast-optimized for visualization purposes. Quantification of the bands was performed using the original blots. Quantification of protein levels was normalized to β-actin levels and to the control condition (untreated cells) and representative of three independent assays.
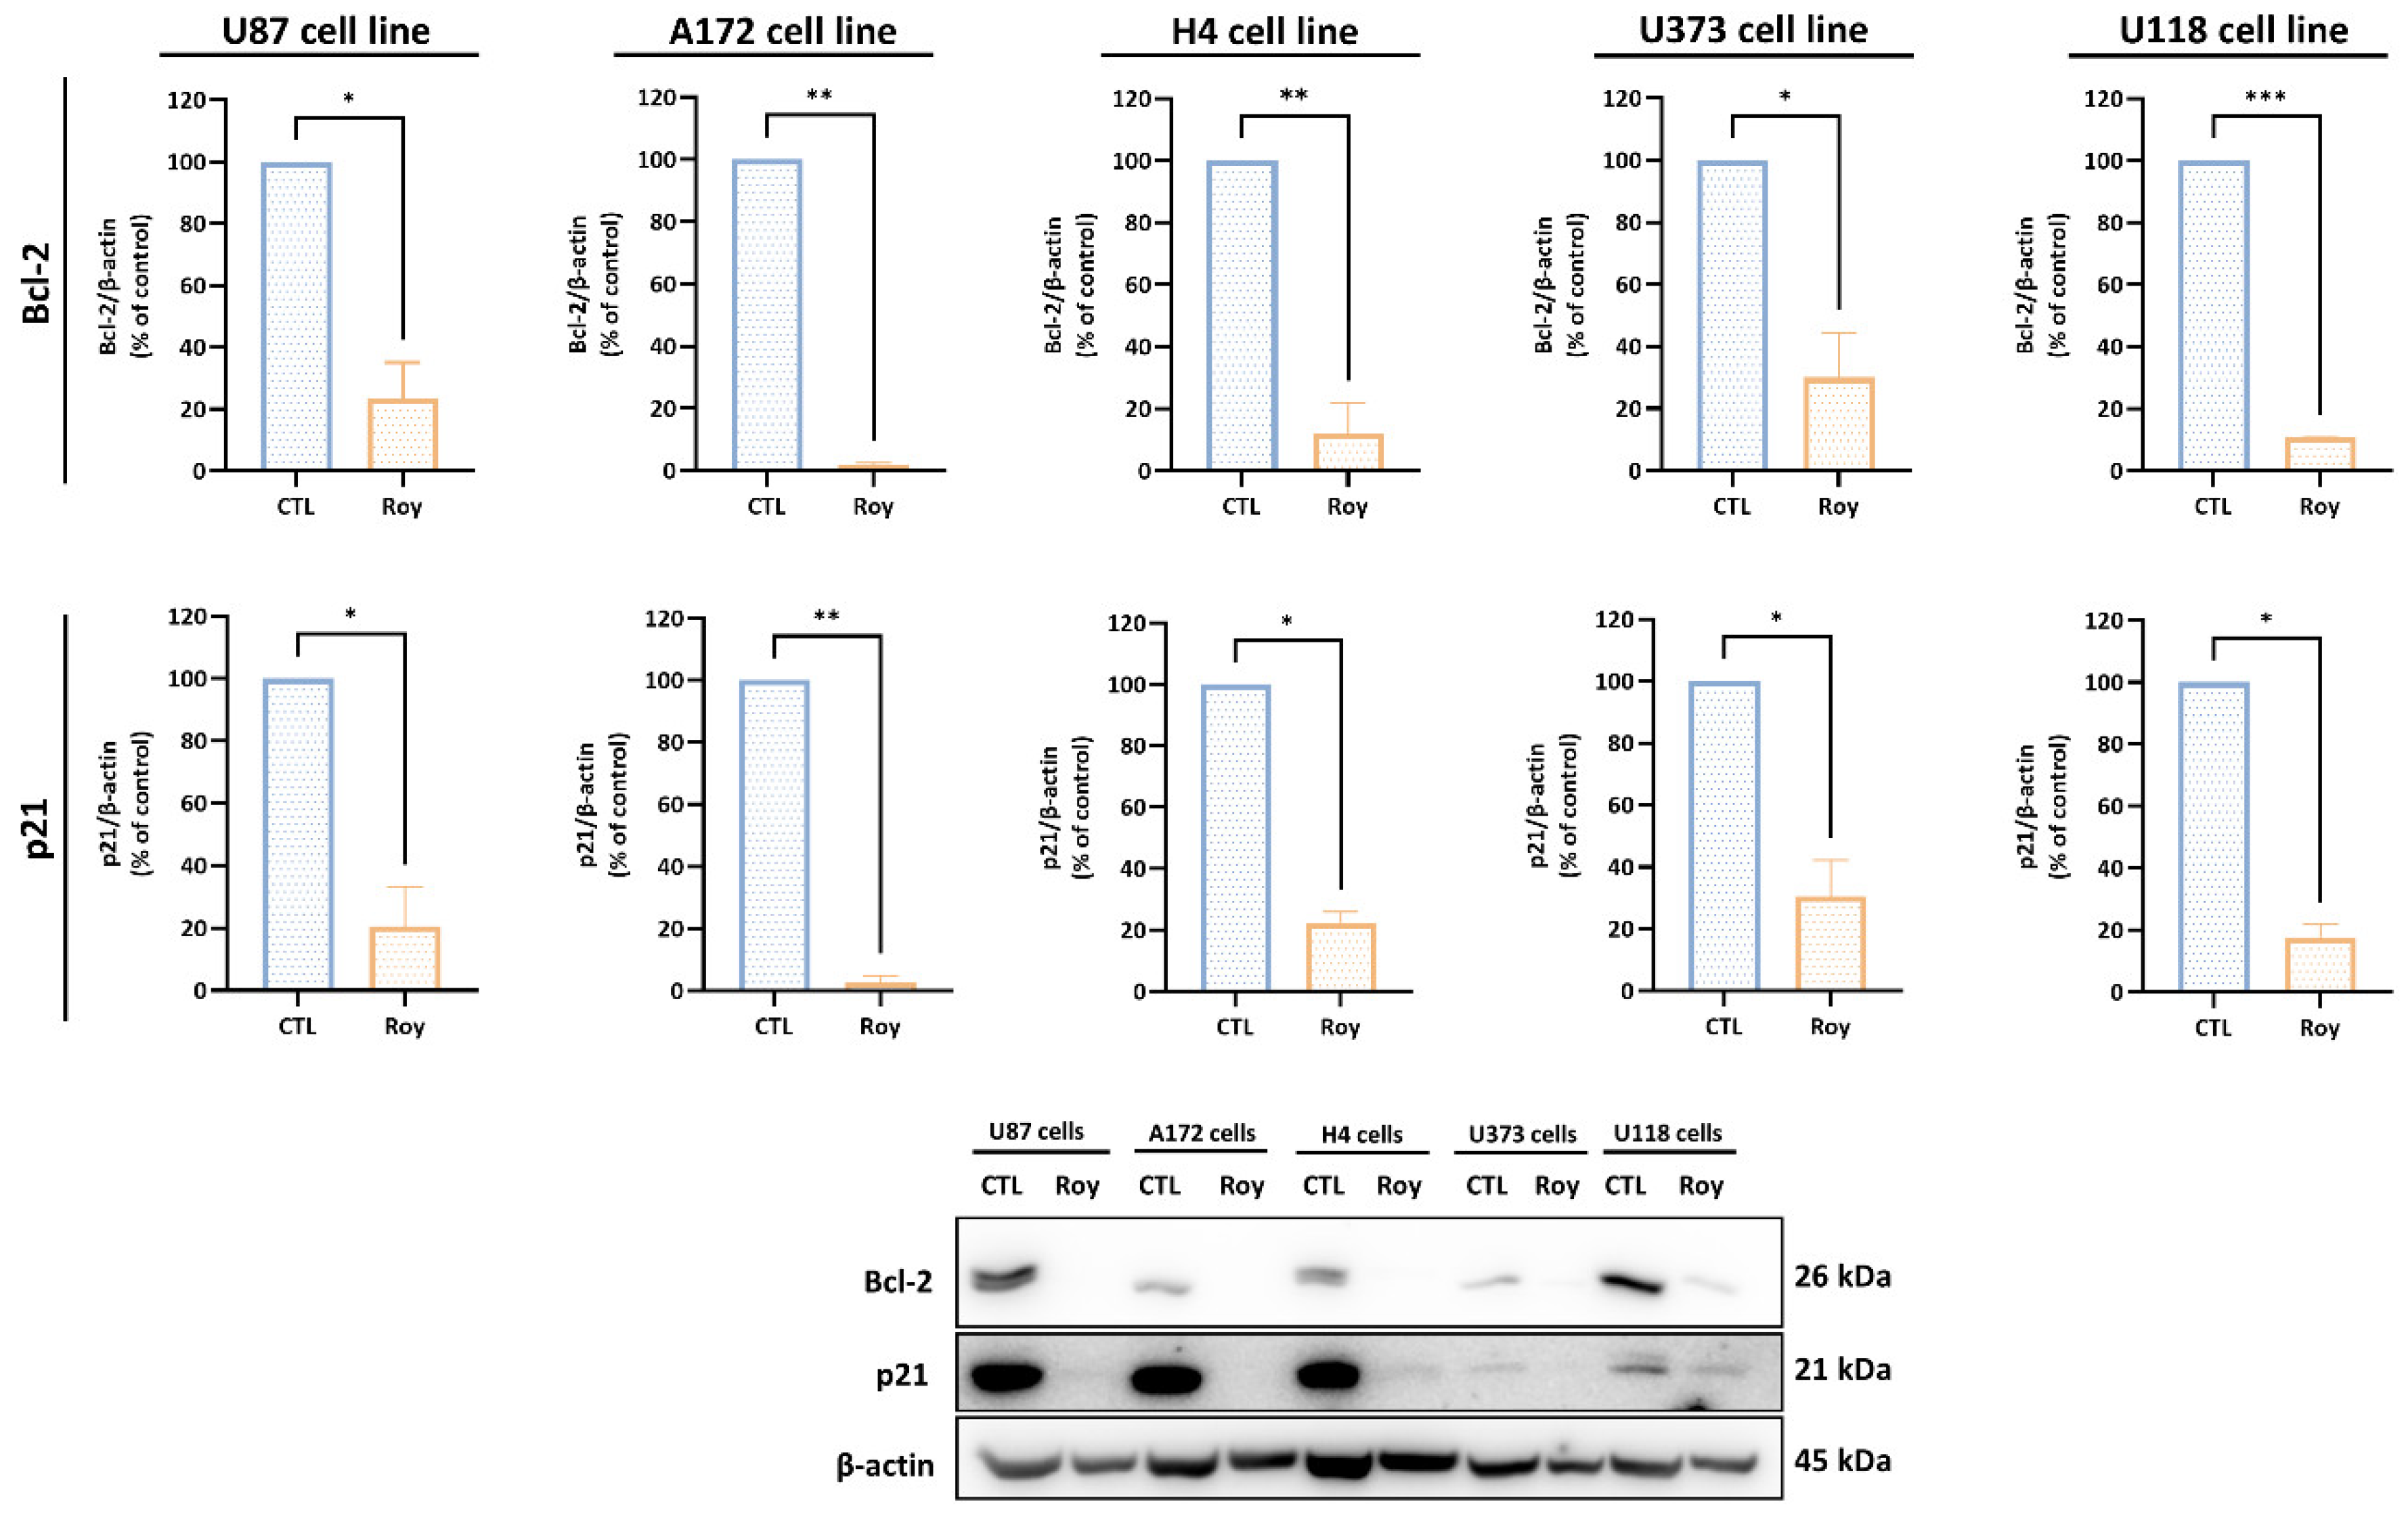
Figure 9.
Analysis of caspase-mediated cell death in U87, A172, H4, U373, and U118 cells after treatment with 16 µM Roy for 48 h. A) Relative expression of CASP9 mRNA levels was assessed by qRT-PCR and the results normalized to GAPDH expression. B) Activated caspase-3 expression levels as a percentage (%) of positive cells were measured by flow cytometry. Asterisks (* p < 0.05 and *** p < 0.001) represent the values that significantly differ from the control condition (CTL) (untreated cells). Data are presented as mean ± SD and it is representative of five independent experiments.
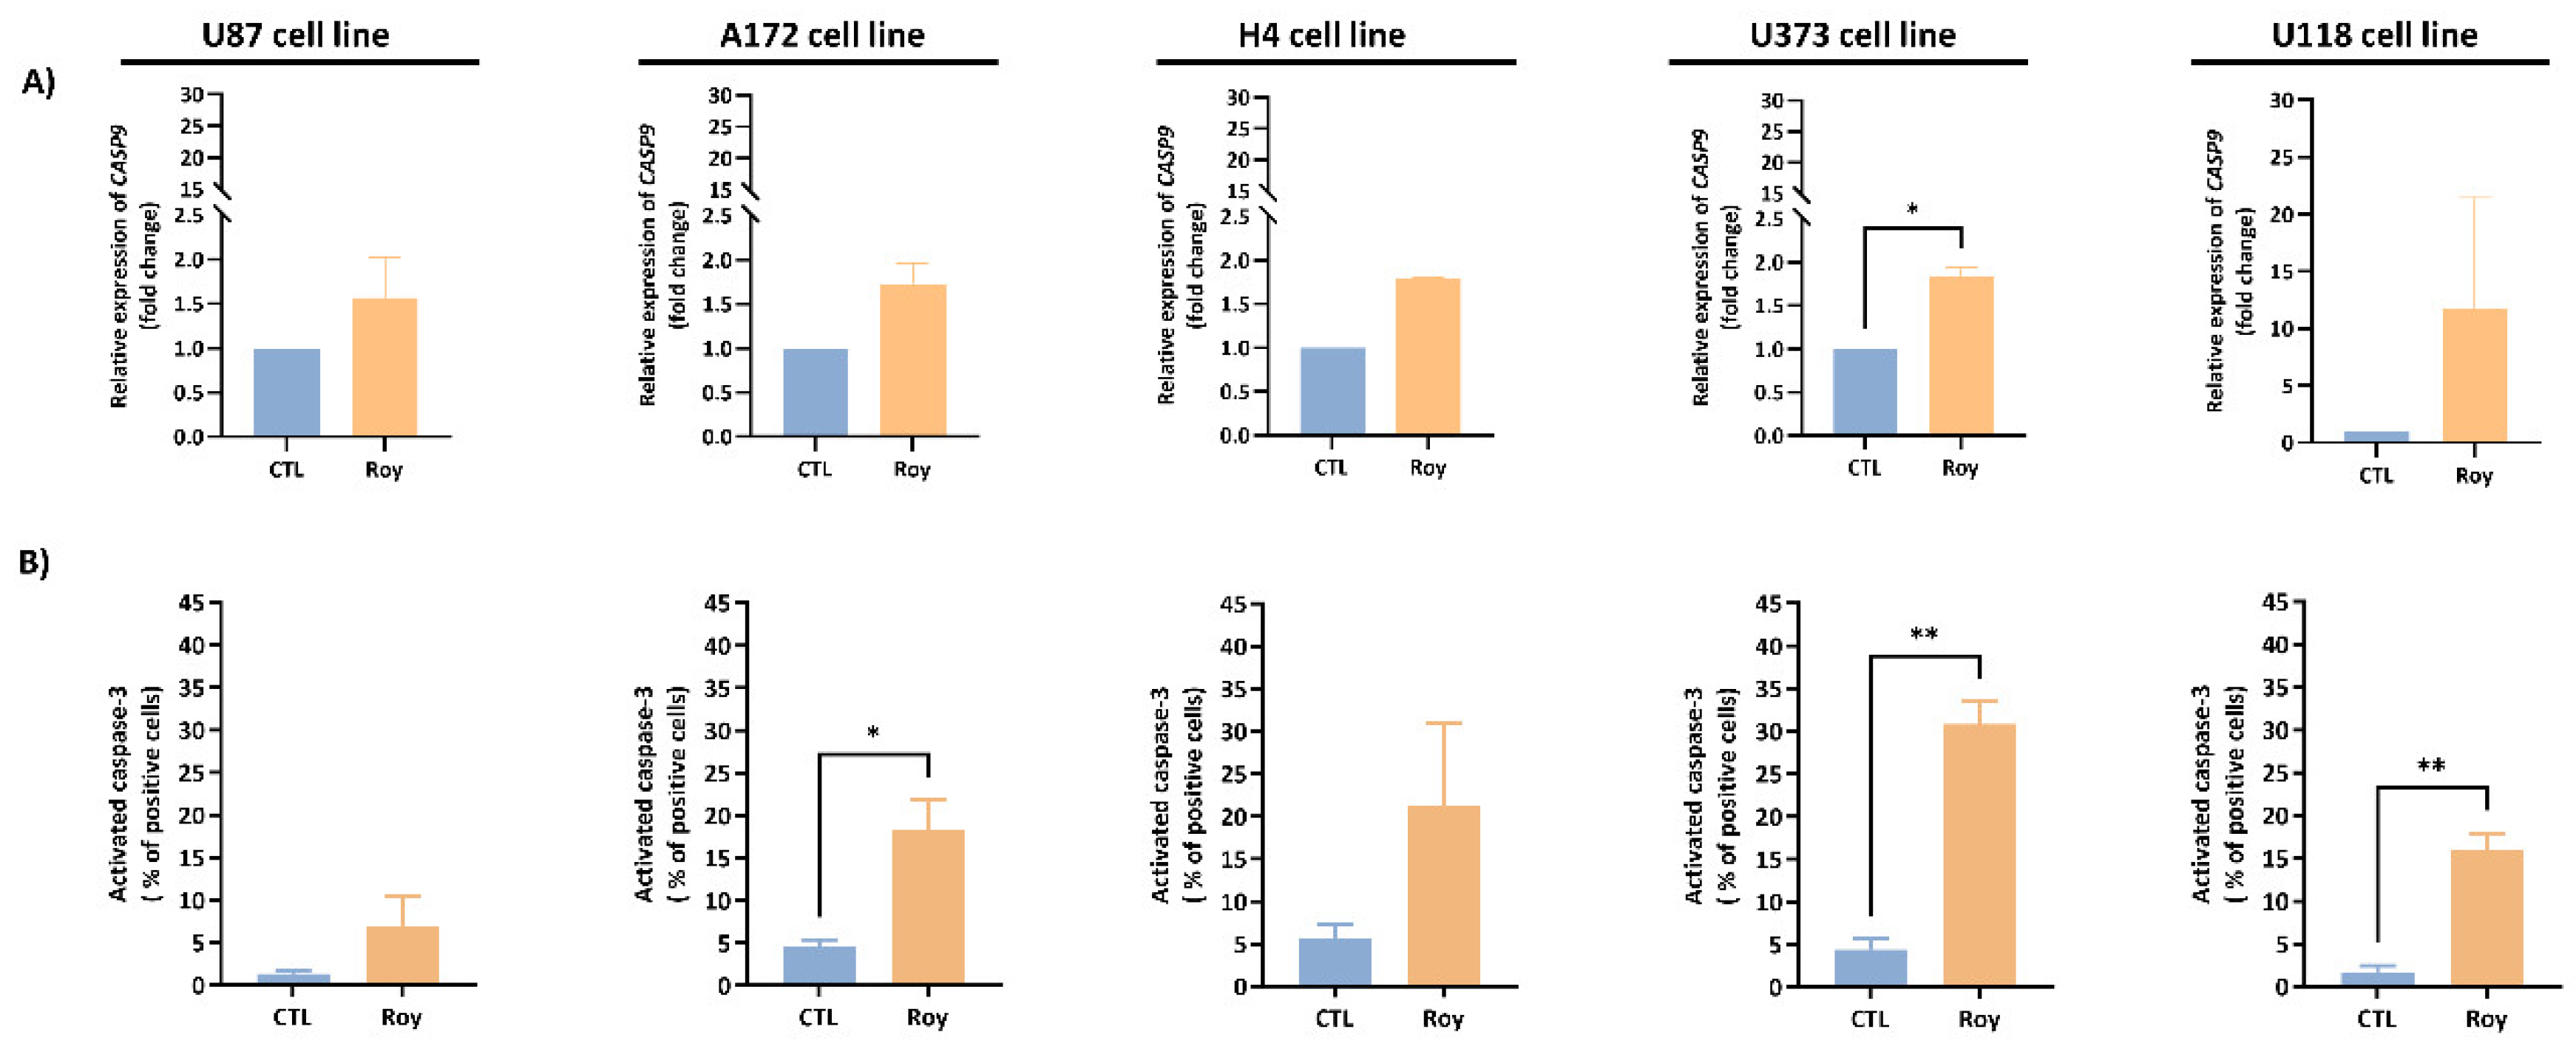

Table 1.
Sequence of the primers and respective concentration used in quantitative real-time PCR (qRT-PCR).
Table 1.
Sequence of the primers and respective concentration used in quantitative real-time PCR (qRT-PCR).
| Gene | Primers concentration (nM) | Forward (5′-3′) | Reverse (5′-3′) |
|---|---|---|---|
| BCL2 | 100 | GAGGATTGTGGCCTTCTTTGAG | AGCCTCCGTTATCCTGGATC |
| BCL2L1 | 150 | GCCACTTACCTGAATGACCACC | AACCAGCGGTTGAAGCGTTCCT |
| PARP1 | 300 | CGGAGTCTTCGGATAAGCTCT | TTTCCATCAAACATGGGCGAC |
| MDM2 | 150 | TGTTTGGCGTGCCAAGCTTCTC | CACAGATGTACCTGAGTCCGATG |
| CASP9 | 150 | GTTTGAGGACCTTCGACCAGCT | CAACGTACCAGGAGCCACTCTT |
| PTEN | 100 | TGAGTTCCCTCAGCCGTTACCT | GAGGTTTCCTCTGGTCCTGGTA |
| TP53 | 75 | CAGCACATGACGGAGGTTGT | TCATCCAAATACTCCACACGC |
| GAPDH | 150 | GTCTCCTCTGACTTCAACAGCG | ACCACCCTGTTGCTGTAGCCAA |
Disclaimer/Publisher’s Note: The statements, opinions and data contained in all publications are solely those of the individual author(s) and contributor(s) and not of MDPI and/or the editor(s). MDPI and/or the editor(s) disclaim responsibility for any injury to people or property resulting from any ideas, methods, instructions or products referred to in the content. |
© 2024 by the authors. Licensee MDPI, Basel, Switzerland. This article is an open access article distributed under the terms and conditions of the Creative Commons Attribution (CC BY) license (http://creativecommons.org/licenses/by/4.0/).
Copyright: This open access article is published under a Creative Commons CC BY 4.0 license, which permit the free download, distribution, and reuse, provided that the author and preprint are cited in any reuse.


