Submitted:
08 May 2024
Posted:
10 May 2024
You are already at the latest version
Abstract
In forests, the microbial populations living in the soil can directly affect the carbon decomposed by the surface plants, and promote carbon storage and stability. In this study, 3 plots of 25.82 m×25.82 m were set up in 5 stand types, respectively. Soil samples were collected from 0~20 cm, 20~40 cm and 40~60 cm layers. Soil microbial composition, organic carbon component, pH, water content, bulk density, nitrogen, phosphorus, potassium and other physicochemical indexes and correlations were determined, and the correlations between soil carbon components and soil microbial functional modules in different mixed modes were analyzed. The results showed that: (1) The SOC of the same soil layer varied significantly, which also showed significant differences on the composition of soil bacteria and fungal microbial communities. Moreover, the bacterial community was more sensitive to the vegetation change environment, and the fungal community structure was more resistant to the influence of soil environment changes. (2) Fun_mod 1,6 and Bac_mod 7 were the microbial functional modules that played a decisive role in the process of soil carbon pool change, and the diversity and composition of bacterial community had more positive effects on soil organic carbon than that of fungal community. (3) Linear fitting and RDA results showed that POC in soil had the strongest correlation with SOC content, indicating that soil microorganisms affected the storage and stability of soil carbon mainly by regulating the conversion of surface plants (carbon sources) into POC. The soil environment of different mixed modes has different effects on soil carbon accumulation. Soil microorganisms affect soil carbon storage and stability mainly by regulating the conversion of surface plants (carbon sources) into POC forms.
Keywords:
mixed broadleaf-conifer modes
; soil microbial communities
; carbon components
; functional module
; regulatory mechanism
1. Introduction
Soil organic carbon(SOC) is a significantly important carbon store in forest ecosystems. Its content is a vital indicator to reflect soil fertility and evaluate soil quality, and take an vital role in regulating soil physical and chemical properties, providing nutrients, improving soil structure, and maintaining soil stability [1-2]. SOC is mainly composed of three components: active carbon, slow carbon and inert carbon[3]. Among them, active organic carbon is more easily decomposed and transformed than slow and inert organic carbon, and can quickly respond to changes in the external environment. Slow and inert carbon plays a decisive role in storage and stability[4-5], the mutual conversion mechanism between soil carbon components regulates the stability of forest soil carbon pool[6]. Expanding the forest area through artificial afforestation has always been considered as an effective measure to improve the SOC Storage and stability[7]. Artificial coniferous pure forest is the main mode of artificial afforestation in China because of its high productivity and simple management. However, low-quality single coniferous forests can bring about ecological problems such as loss of species diversity, frequent pests and diseases, and decreased productivity (reduced carbon sink capacity) [8-9], The study shows that mixed pure forest and native broad-leaved tree can improve the carbon sink capacity of forest ecosystem[10-11], The reason is that differences in litter and root secretions of different tree species affect soil physicochemical properties[12] and microbial community structure[13], And thus affect the change of SOC content. For this reason, the mixed forest will become one of the most promising forest management models in the world[14].
Soil microbes play an important role in the forest soil carbon cycle[16], and their metabolites play a key role in maintaining the versatility of ecosystems, such as soil physical structure and SOC sequestration[7]. Soil carbon bank and carbon reserves can be said to be the result of break-even after microbial assimilation and decomposition. Forest ecosystem generally by affecting the formation of soil organic matter, microbial growth metabolism, nutrient element mineralization and circulation to regulate the change of soil carbon reservoir [17], and replanting soil microorganisms in regulating soil carbon storage research is lack, therefore, clarify the "mixed mode-soil microorganisms-soil organic carbon" coupling relationship, to deep understanding of the driving mechanism of carbon storage and scientific accounting of forest soil carbon sink / source is of great significance.
Pinus massoniana is the most widely distributed and largest resource of artificial afforestation species in Guizhou province, China. Its also the main object of adjusting the structure of tree species[15,18]; Although the pine Masson forest has strong carbon sequestration potential, it suffers from a large degree of erosion by diseases and insect pests due to the single species and simple stand structure, resulting in low ecological stability and weak ecological function, and failing to give full play to its comprehensive benefits in the ecosystem. In the process of the transformation of pine Masson plantation, it was found that the mixed planting with local broad-leaved species in an appropriate proportion can promote the degradation of lignin in litters, thus improving soil quality and increasing soil carbon sequestration[8].
However, there is still a lack of in-depth research on whether and how to affect soil microbial and organic carbon content and regulate soil carbon sequestration after mixed modification of Masson Pine artificial pure forest, and whether soil microbial and organic carbon components respond to mixed modification in different mixed modes and soil depth. In view of this, four mixed transformation modes of pine Masson were selected in this study (P. massoniana+Liriodendron chinense, MS; P. massoniana+Phoebe zhennan, MN; P. massoniana+Cinnamomum camphora, MX; P. massoniana+Idesia polycarpa, MS), using Masson Pine pure forest (M0) as the control, investigated the effects of needle and broad mixed patterns on microbial composition and organic carbon components and their regulatory mechanisms, with a view to providing scientific basis for mixed transformation and sustainable management of pine Masson pure forest. To maximize their carbon sequestration potential and ecosystem services.
2. Materials and Methods
2.1. Overview of the Study Area
The research site is located in the state-owned forest farm of Dushan County, Guizhou Province, China (Figure 1). Dushan County is located in the southeast of Qiannan Buyi and Miao Autonomous Prefecture of Guizhou Province, and is located in the southernmost part of Guizhou Province. The average altitude of the county is 850-1100 m, which belongs to the subtropical warm monsoon climate, with four distinct seasons, no cold winter, no hot summer summer, the average annual temperature of 15℃, the annual precipitation of 1430 mm, and the frost-free period of 297 days. The state-owned forest farm in Dushan County covers an area of about 18,588 hm2, of which: forest land 15,839.14 hm2, accounting for 85.21% of the total area, non-forest land 2748.86 hm2, accounting for 14.79% of the total area. The forest area is 13,564.32 hm2, the forest coverage rate is 72.96%, and the total forest stock is 865465.48 m3, which is the largest state-owned forest farm in Guizhou. The exposed rocks in the forest farm are mainly sandy shale and carbonate rock, and the soil is mainly silica-aluminous and ferral-aluminous yellow soil. The soil thickness is generally above the middle layer, the fertility is medium, and most of it is acidic or slightly acidic. The plantation trees are mainly Pinus massoniana, Pinus elliottii, Cinnamomum camphora and liriodendron chinensis.
2.2. Plot Setup and Sampling
Soil samples were collected from 4 different modes (MS, MN, MX, MS) and unmodified P Masson-pure forests (M0), and 3 plots with an area of 0.0667 hm2 were set for each mixed mode. All plots were ensured to have the same soil parent rock, site conditions, stand age and growth, and the mixing year was the same. The mixing ratio was 1:1, and the spacing of each sample was more than 500 m.
The soil section was excavated by five-point sampling method, with each profile 1.2~ 1.5 m long and 0.8~ 1.0 m wide. Soil samples were collected from bottom to top according to the soil depth of 0~20 cm, 20~40 cm and 40~60 cm, and the soil samples of the same soil layer were evenly mixed. 500 g of soil samples were taken by the method of quartering. Among them, 100 g is stored in a 4℃ freezer for DNA and bioinformatics, microbial carbon determination, and 400 g is stored at room temperature for physicochemical properties and carbon component determination analysis.
2.3. Determination and Analysis of Soil Physical and Chemical Properties
After the collected soil was naturally air-dried, 200 g of soil sample was taken. After grinding, the soil was screened with a 0.1mm mesh, and then used to determine the soil water content, pH, carbon, nitrogen, phosphorus and other contents. Soil pH was measured by potential generation. Soil bulk density (BD) was measured by ring knife (200 cm3) weighing method. The organic carbon content was determined by concentrated H2SO4, K2Cr2O7 - external heating method. The total nitrogen content was determined by semi-micro nitrogen determination method. The content of total phosphorus was determined by molybdenum-antimony resistance colorimetric method[19].
2.4. Assay and Analysis of Soil Organic Carbon Components
Readily oxidized organic carbon (ROC) was determined by potassium permanganate oxidation method, granular organic carbon (POC) was determined by wet screen method and potassium dichromate external heating method, soluble organic carbon (DOC) was determined by distilled water extraction method, and microbial biomass carbon (MBC) was determined by chloroform fumigation method.
The formula for calculating soil carbon storage is as follows:
where, Cs are soil carbon reserves(t·hm−2); SOC indicated soil organic carbon content(g·kg−1);BD is the soil density(g·cm−3);Dis the thickness of soil layer (cm)。
2.5. DNA and Illumina Sequencing
Extract the total DNA from 5 modes with 30 samples using the Magnetic Soil And Stool DNA Kit from Tiangen Biotech Co (It is worth noting that to ensure the purity of the total DNA extracted, a 1% agarose gel electrophoresis test was conducted to detect the concentration and purity of the extracted genes, ensuring support for subsequent research). The bacterial community PCR was specifically amplified in the "V4 variable region" using universal primers 515F (5’-GTGCCAGCMGCCGCGGTAA-3’) and 806R (5’-GGACTACHVGGGTWTCTAAT-3’), while the fungal community was amplified using ITS5-1737F(GGAAGTAAAAGTCGTAACAAGG and ITS2-2043R (GCTGCGTTCTTCATCGATGC). The PCR reaction system and detailed amplification process were followed as described in[20]. The purity of the PCR testing and recovery were performed using the Universal DNA Kit from Tiangen Biotech Co. Purity was tested by electrophoresis of 2% agarose gel electrophoresis before recovery. The 16S rRNA and ITS genes that met the purity requirements were indexed using the library kit, and then the library quality was evaluated using the Tiangen Biotech Co Bioanalyzer system. Qualified libraries were sent for sequencing on the Illumina platform[21].
The raw data after sequencing is processed on the Bioincloud platform (https://www.bioincloud.tech) with quality control and treatment, the specific process is as follows: (1) Based on the Qiime2 dada2 plug-in, the quality control (filtered), denoising (correcting the sequencing errors), merging, and de-chimeric of the 30 samples' full raw sequences are performed to form the ASV table[22]. (2) Species classification is performed on the ASV table data using sklearn algorithms, and the specific plug-in is used to compare the ASV sequences with the NCBI (https://www.ncbi.nlm.nih.gov/) database, with a similarity of 99%, ultimately obtaining the species classification information table[23]. (3) The species needed for the study are selected for analysis and processing. After the above quality control and de-chimeric treatment, a total of 1491546 fungal ASVs and bacterial ASVs were obtained.
2.6. Data Analysis and Processing
Data statistics and analysis were conducted using WPS 11.1.0 and SPSS 26.0. The significance of soil physical and chemical factors and carbon components in different mixed modes was tested by Duncan multiple comparison and One-Way ANOVA's least significant difference (LSD) method (P=0.05), and the correlation between soil carbon components was analyzed by Pearson. Bacterial and fungal diversity indices and graphs were plotted in Origin 2022. Microbial basic statistics were preliminarily analyzed and drawn on the cloud platform of Bioincloud platform (https://doi.org/10.1002/imt2.175), and then R software was used to beautify the chart. The redundancy analysis method (RDA) of the R software package "vegan" was applied to reveal potential associations between microbial communities and relevant environmental factors. Based on the relative abundance of major microbial species in the sample, the Speelman rank correlation coefficient was calculated using Co-occurrence analysis to understand the association between species.
3. Results
3.1. Analysis of Soil Carbon Change and Correlation between Carbon Components and Organic Carbon Storage in Different Modes
The results indicated that soil carbon sequestration was influenced by different mixing modes (Figure 2). The SOC content in all modes exhibited a decreasing trend with increasing soil depth. In the 0-60 cm soil layer, the SOC content in MN mode was relatively higher, and the surface SOC content was significantly greater than that in M0 (P<0.05). With the exception of ME, the SOC content in the other three mixed modes was slightly lower than that in M0 mode, but the difference was not statistically significant (P<0.05). Across all models, the highest carbon lability activity occurred in the surface layer (0-20cm), with M0 exhibiting the highest carbon lability activity; however, there were no significant differences observed with respect to soil depth and mixed models (P<0.05). Amongst the 5 models, EOC, POC, DOC and MBC were all enriched in the surface layer (0-20 cm) of soil. The highest EOC and POC levels were found in M0 mode; however, except for MS and MX, these differences were not significant (P<0.05). DOC and MBC displayed a decreasing trend along with increasing soil depth. The content of 4 mixed modes at the surface layer was significantly higher than that of M0; nevertheless, this difference was not significant.
EOC, POC, DOC and MBC were positively correlated with SOC (Figure 3), in which EOC and POC were significantly positively correlated (P <0.01) and POC impacted more on SOC storage content than EOC. In addition, the correlation between DOC and SOC (R2=0.015) was closer than the correlation between MBC and SOC (R2=0.002).
3.2. Microbial Community Composition
In all mixed modes, Basidiomycota (45.88-68.18%), Ascomycota (22.12-39.89%), Mortierellomycota (2.58-8.72%), Mucoromycota (0.27-5.44%), Chytridiomyc ota (0.01 ~ 6.19%) is the dominant phylum in the fungal community, and the total abundance of MN, ME and M0 is high (Figure 4). Basidiomycota had the highest abundance in MX and M0 models, MS had the lowest abundance, and Ascomycota had the highest abundance in ME and MN models. In terms of total fungal species abundance and Alpha diversity index (Figure 5 Fungal), except for MS, the Alpha diversity index of the other three model species was higher than M0, and chao1 was significantly lower than ME, with no significant difference in shannon. Acidobacteria (6.94 ~ 26.52%), Actinobacteria (4.48 ~ 7.88%), Firmicutes (3.21 ~ 8.72%) and Proteobacteria (29.76 ~ 47.62%) dominate the bacterial community. Proteobacteria has the highest abundance in M0 mode, while Acidobacteria has the opposite abundance. In terms of total bacterial community abundance and Alpha diversity index (Figure 5 Bacteria), M0 has the highest species diversity, followed by MX; in addition, the M0 model of chao1 index is significantly different from the mixed models (P < 0.05), and the shannon index M0 is significantly different from the MS and MN models (P < 0.05). Based on the Bray-Curtis distance, soil microbial community abundance was ranked, and the analysis results showed that there were significant differences in microbial community composition in various mixed modes (Figure 6).
3.3. Correlation Analysis of Soil Carbon Components and Microbial Communities
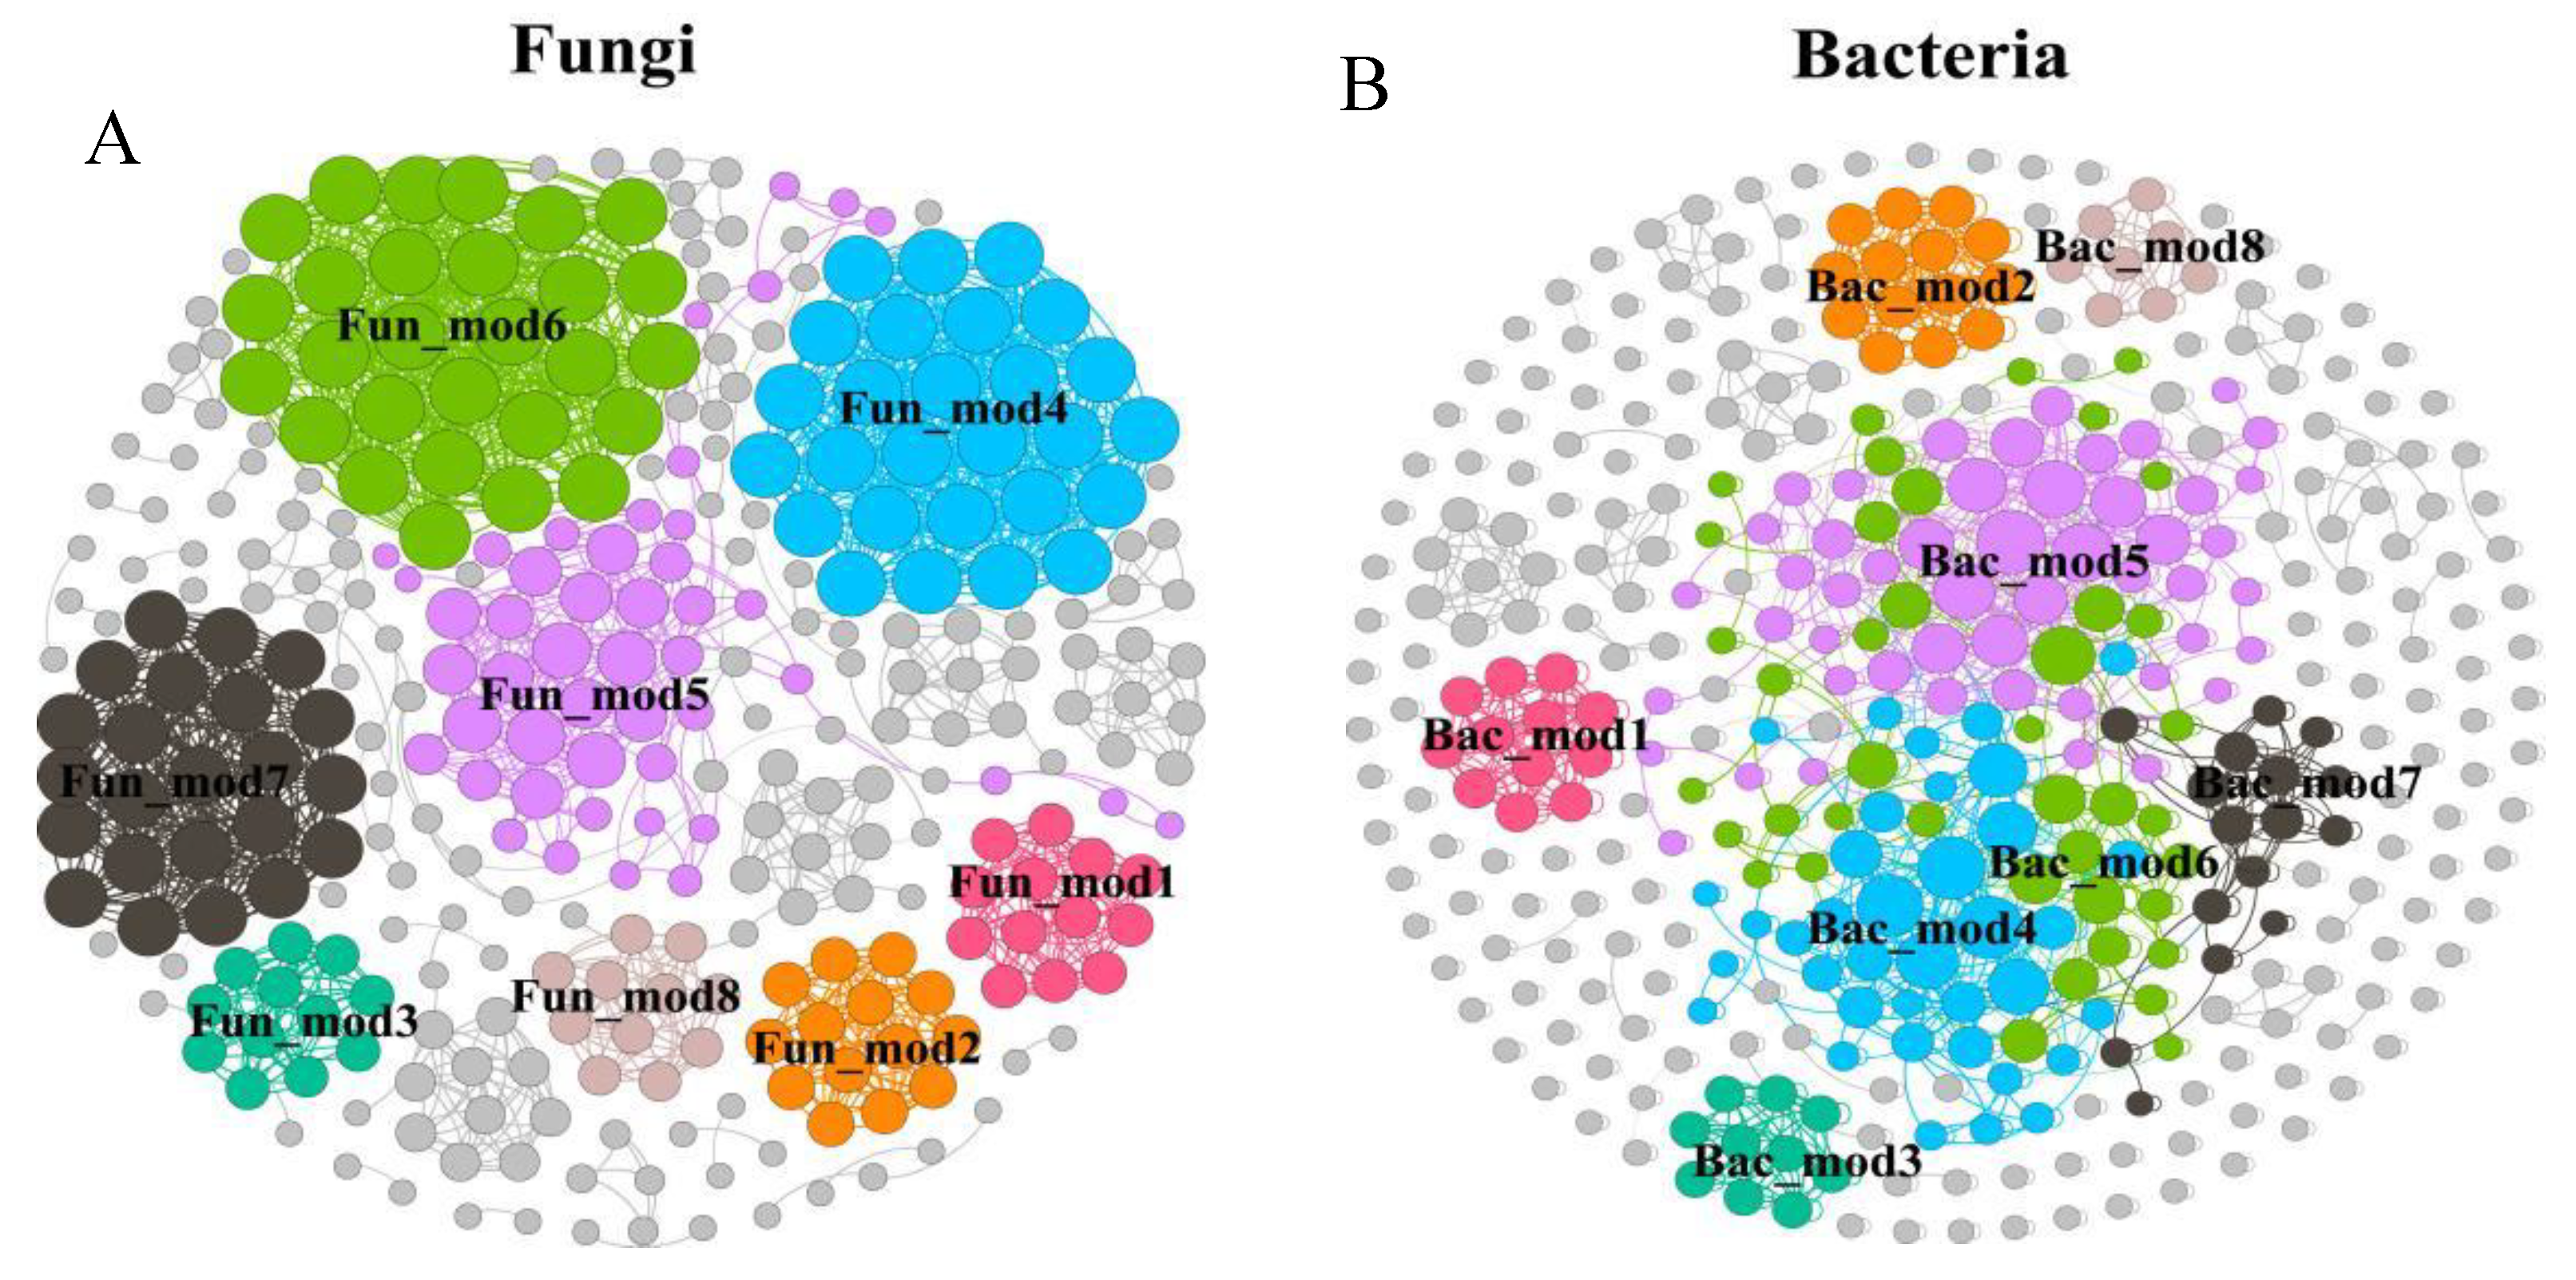
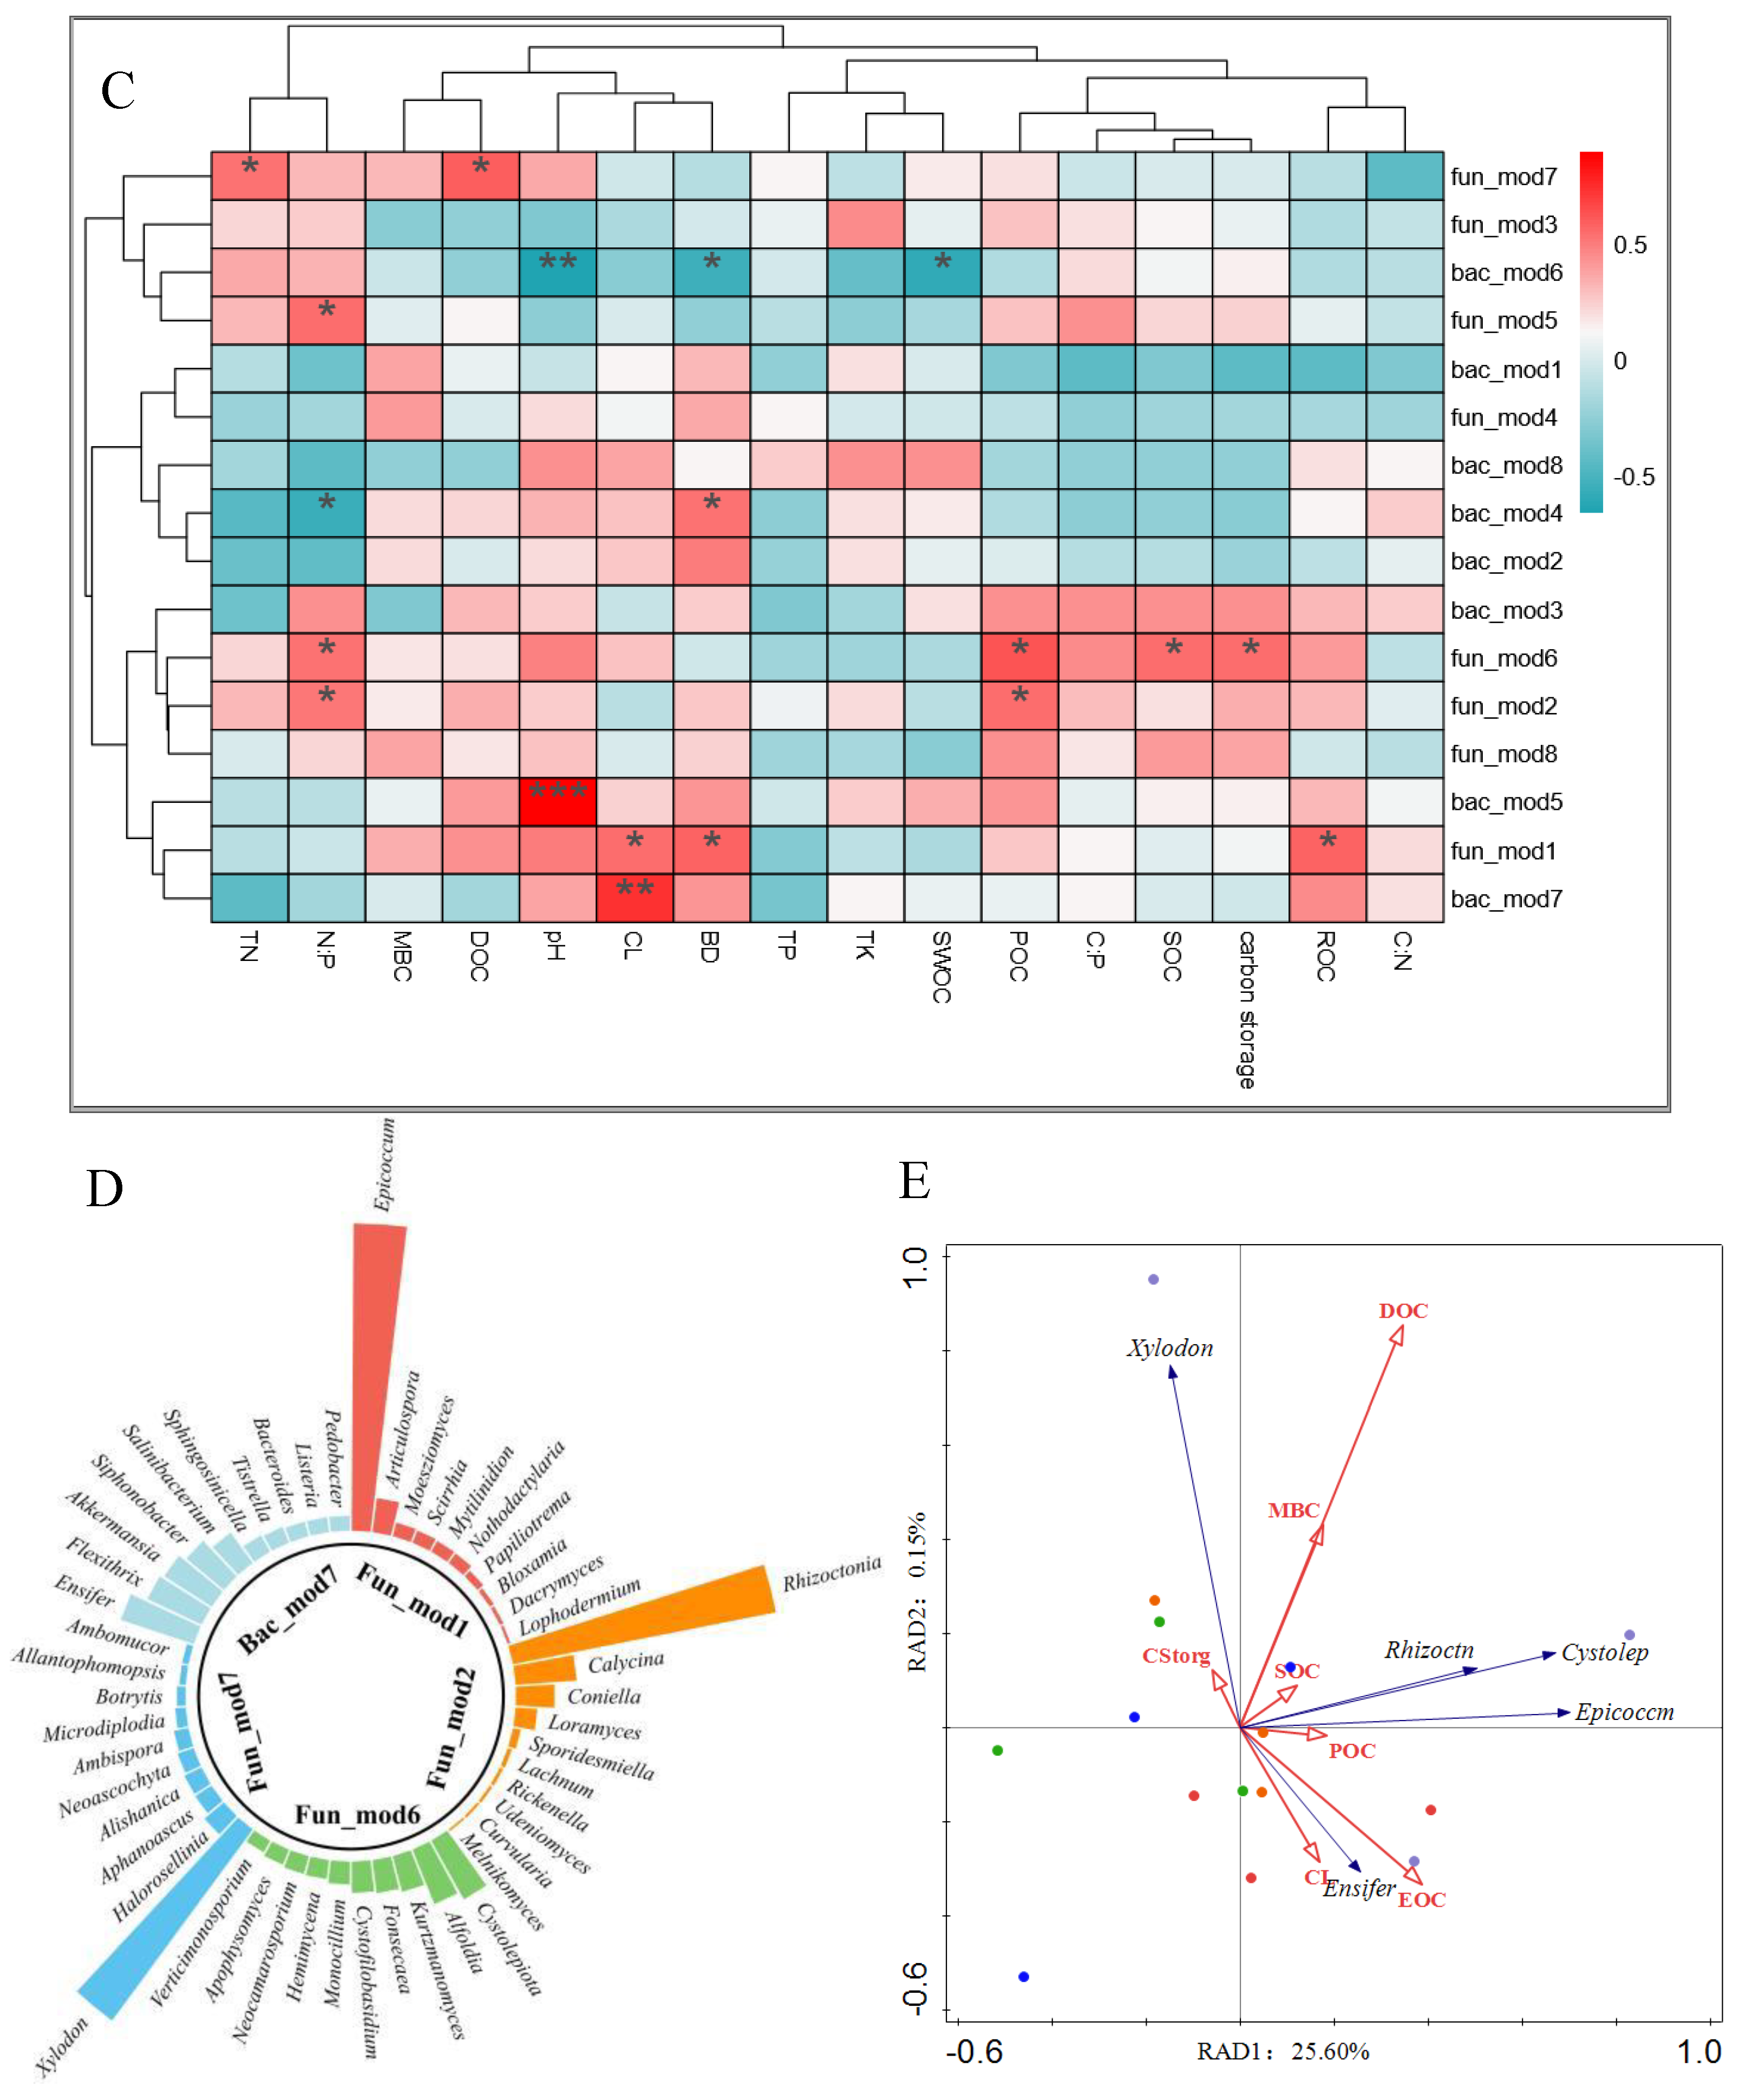
By clustering and statistical comparative analysis of the soil microbial community structure in all experimental groups, The fungal sequences were classified into 581 genera in 26 phyla and bacteria into 21 phyla 422 genera. In order to better demonstrate the relationship between the main dominant groups of microorganisms and soil carbon components, this study used the Gephi to construct the species interaction network. The network analysis results showed that fungi and bacteria both had 8 dominant modules (Figure 7A,B). Fun_mod 6 is positively correlated with SOC storage and POC, Fun_mod 1 is positively correlated with ROC and Carbon Lability, and Fun_mod 7 is positively correlated with DOC. Fun_mod 2 was positively correlated with POC (P < 0.05). The relative abundance of Bac_mod 7 was significantly positively correlated with CL (P < 0.01) (Figure 7C). Therefore, Fun_mod 1,2,6,7 and Bac_mod 7 could be considered as the main interpretation modules of soil carbon pool. The dominant bacterial population of Fun_mod 1 was Epicoccum (74.07%), the dominant bacterial population of Fun_mod 2 was Rhizoctonia (64.74%), and the dominant bacterial population of Fun_mod 6 was Cystolepiota (Figure 7D). Fun_mod 7 dominant bacteria group was Xylodon, accounting for 57.30% abundance. Bac_mod 7 dominant bacteria group was Ensifer, accounting for 18.55% abundance. Taking the above dominant genus Asvs as the response variable, soil organic carbon group was divided into explanatory variables for RDA analysis (Figure 7E). The results showed that the first and second main axes accounted for 25.75% of the variation of dominant modules. Epicoccum, Rhizoctonia and Cystolepiota were positively correlated with DOC, MBC and SOC, Ensifer was positively correlated with POC, EOC and CL, and Xylodon was positively correlated with carbon storage, but the correlation was not significant (P < 0.05).
4. Discussion
4.1. Soil Carbon Composition And Reserve Change under Mixed Modification Mode
The organic carbon in soil primarily originates from the decomposition of litter, substances released by plant roots, and debris produced by root activities. These substances are most concentrated in the surface layer [24]. The study results indicate that the soil organic carbon content decreases gradually with increasing soil depth across different stand types, demonstrating distinct vertical distribution characteristics. This suggests that tree species composition mainly influences soil organic carbon in the surface layer[25-26], as the distribution of deep soil roots diminishes with soil depth and slows down the migration of organic matter formed by decomposing surface litter and plant roots[27]. Furthermore, significant differences exist in soil organic carbon content among different stand types, with MN > M0 > ME > MS > MX. This difference is attributed to varying growth characteristics and nutrient storage abilities among stand types, leading to differences in balanced control of nutrient input and output by vegetation, resulting in variations in soil carbon accumulation and release rates[28]. Additionally, carbon lability exhibits superior performance in the M0 model but inferior performance in the MX model. This indicates that among several models, P Masson artificial pure forest has the least stable soil carbon pool while mixed modified stands are more effective at retaining organic matter within the soil[29]. The change trend of soil carbon component also varies under different mixed transformation modes of P Masson plantation and is similar to SOC. These differences are related to quantity, quality, and decomposition rate of litter from various vegetation types[27,30]. Particulate organic carbon primarily stems from plant and animal residue decomposition as well as forest community litter layers. Linear fitting results demonstrate a significant positive correlation between POC and SOC during mixed transformation of artificial pure forests indicating that plant decomposition remains a major contributor to soil organic carbon content [31].
4.2. Soil Microbial Community Composition Interacts with Soil Carbon
The results in 3.1 clearly showed that soil C components of all models were mainly enriched in the surface layer (0-20 cm), and the carbon lability activity was highest in the surface layer. Yu (2022) also showed that soil carbon in forest ecosystems was mainly in the surface layer[32]. Therefore, the microbial part is represented by the surface layer (0~20 cm). In this study, there was no significant difference in the composition of soil fungal communities among different mixed modes, but the dominant fungal groups were Basidiomycota, Ascomycota and Mortierellomycota. This is consistent with the results of studies on the dominant microbial communities in most forest ecosystems [33-34]. Ascomycota and Basidiomycota were used as indexes of land use efficiency for accumulation and storage of soil organic carbon[33], In this study, the abundance of Basidiomycota and Ascomycota showed a mixed pattern higher than that of Masson pine pure forest. These results indicate that soil carbon is more easily accumulated and stored in MN, ME and M0 models under the control of microorganisms, which is consistent with the above conclusions on the change of carbon content. Different from fungi, the composition of soil bacterial community in different mixing modes in this study was significantly different, which was consistent with the results of Liu (2023), indicating that the abundance and uniformity of bacteria had a more positive impact on soil carbon storage[18]. Acidobacteria, Actinobacteria and Proteobacteria are the dominant bacterial communities. Consistent with previous studies, Firmicutes are the most common bacterial communities in soil[35]. Firmicutes is a kind of eutrophic microorganism. They prefer nutrient-rich soil environment and regulate the degradation process of refractory lignin in soil[29]. During the study, it was found that the mixed mode except MX increased the relative abundance of Firmicutes, while the M0 mode decreased the relative abundance. Moreover, correlation studies showed that the abundance of Firmicutes was significantly positively correlated with soil TN, indicating that changes in the relative abundance of Firmicutes were related to changes in soil nutrients, especially soil nitrogen content.
In the visualization construction of microbial networks, species with similar traits can be divided into a functional module to explore the relationship between functional gene modules and soil ecological functions, which is more conducive to understanding the relationship between complex microbial communities and soil environmental changes[36]. The results of network visualization analysis in this study showed that Fun_mod 6 was positively correlated with SOC storage, Fun_mod 1 was positively correlated with Carbon Lability , and the relative abundance of Bac_mod 7 was significantly positively correlated with CL (P < 0.01). Therefore, Fun_mod 1,6 and Bac_mod 7 can be considered as the microbial functional modules that play a decisive role in the process of soil carbon pool change.
Ensifer is a root nodal endophyte that has attracted much attention from microecological researchers in recent years. Unlike rhizobium, this non-symbiotic bacteria does not form root nodules in the root nodules, but produces plant hormones that affect the development of roots, thus promoting the absorption of carbon and nitrogen and other nutrients in the soil by plants[37-38]. Ensifer was the dominant bacterial group in Bac_mod 7, and the correlation results between the relative abundance of Bac_mod 7 and the mixing pattern and soil environmental factors showed (Figure 5C and Figure 5E). The increase of Bac_mod 7 abundance after the conversion of artificial pure forest into mixed forest may lead to the increase of EOC and POC contents in soil carbon pool through the change of microbial physiological characteristics (Figure 5C and Figure 5E). In this study, POC was the carbon component with the greatest correlation with SOC. Witzgall also showed that soil carbon was mainly stored in the POC bank derived from the decomposition of soil surface plants[39], indicating that when the coniferous pure forest was created into a mixed forest with needle and broad, Soil microorganisms affect soil carbon storage and stability mainly by regulating the conversion of surface plants (carbon sources) into POC forms. This study clarified the complex relationship between mixed patterns, soil microorganisms and soil carbon components, which is of great value to guide the improvement of forest carbon sink efficiency through tree species structure adjustment in Guizhou province in the future.
5. Conclusions
(1)Different modes and soil depth had no significant effects on soil organic carbon, but had different effects on soil bacterial and fungal microbial community composition. Bacterial community was more sensitive to vegetation change environment, and fungal community structure is more resistant to soil environmental changes.
(2)In the microbial network, Fun_mod 1,6 and Bac_mod 7 were the microbial functional modules that played a decisive role in the process of soil carbon pool change, and the diversity and composition of bacterial community had more positive effects on soil organic carbon than that of fungal community. The correlation analysis results showed that POC in soil had the strongest correlation with SOC content, indicating that soil microorganisms affected the storage and stability of soil carbon mainly by regulating the conversion of surface plants (carbon sources) into POC.
In conclusion, in this study, soil microorganisms had a certain positive effect on soil organic carbon sequestration, but the effect was not significant. It was found that the mixed pattern of needle and width could enhance the stability of soil organic carbon more effectively than that of coniferous pure forest, and the stability was higher with long years of mixed transformation than with short years[4]. In this study, it may be because the short-term transformation benefits are not obvious, or because soil microorganisms mainly interact with soil carbon and nitrogen invertase, and regulate the storage of carbon and nitrogen nutrients in soil by influencing the invertase activity[40]. Therefore, in the next step of this study, it is necessary to continuously monitor the changes of soil carbon and microorganisms after the mixed transformation and conduct in-depth research with soil enzyme activity as the medium.
Date availability
The transcriptome data for ME, M0, MX, MN and MS reported in this paper are available at the NCBlShort Read Archive (SRA) under accession number : PRJNA1103968.
Confict of interest
The authors declare they have no known fnancial interests or personal relationships that infuenced the work in this paper.
Author Contributions
CM wrote the manuscript and performed some of the assays. YCJ participated in sample collection and field investigation, and revised the manuscript. HS and CJ did the data visualization processing. LJ and YGH examined some of the soil physicochemical properties. DFJ secured funding and designed the study and revised the manuscript. All authors have read and approved the fnal version of the manuscript.
Acknowledgments
The authors are grateful to the demonstration site for free tree species structure adjustment of the state-owned forest farm in Dushan County, Guizhou Province and the Key Laboratory of National Forestry and Grassland Administration of Southwest Karst Mountain Biodiversity Conservation for technical support.
References
- Li, S.; Xu, Z.; Yu, Z.; Fu, Y.; Su, X.; Zou, B.; Wang, S.; Huang, Z.; Wan, X. Litter decomposition and nutrient release are faster under secondary forests than under Chinese fir plantations with forest development. Sci. Rep. 2023, 13, 16805. [Google Scholar] [CrossRef] [PubMed]
- Davidson, E.A.; Janssens, I.A. Temperature sensitivity of soil carbon decomposition and feedbacks to climate change. Nature 2006, 440, 165–173. [Google Scholar] [CrossRef]
- Parton, W.J.; Schimel, D.S.; Cole, C.V.; Ojima, D.S. Analysis of Factors Controlling Soil Organic Matter Levels in Great Plains Grasslands. Soil Sci. Soc. Am. J. 1987, 51, 1173–1179. [Google Scholar] [CrossRef]
- Li, Y.; Li, Y.; Chang, S.X.; Liang, X.; Qin, H.; Chen, J.; Xu, Q. Linking soil fungal community structure and function to soil organic carbon chemical composition in intensively managed subtropical bamboo forests. Soil Biol. Biochem. 2017, 107, 19–31. [Google Scholar] [CrossRef]
- Zhao, S.; Ta, N.; Li, Z.; Yang, Y.; Zhang, X.; Liu, D.; Zhang, A.; Wang, X. Varying pyrolysis temperature impacts application effects of biochar on soil labile organic carbon and humic fractions. Appl. Soil Ecol. 2018, 123, 484–493. [Google Scholar] [CrossRef]
- Wani, O.A.; Kumar, S.S.; Hussain, N.; Wani, A.I.A.; Babu, S.; ALAM, P.; Rashid, M.; Popescu, S.M.; Mansoor, S. Multi-scale processes influencing global carbon storage and land-carbon-climate nexus: A critical review. Pedosphere 2023, 33, 250–267. [Google Scholar] [CrossRef]
- Liu, C.L.C.; Kuchma, O.; Krutovsky, K.V. Mixed-species versus monocultures in plantation forestry: Development, benefits, ecosystem services and perspectives for the future. Glob. Ecol. Conserv. 2018, 15, e00419. [Google Scholar] [CrossRef]
- Qin, Z.-K.; Liu, R.-H.; He, P.; Wang, C.; Nie, Y.-X.; Shen, W.-J. Effects of mixed broadleaved tree species with pure Pinus massoniana plantation on soil microbial necromass carbon and organic carbon fractions. The Journal of Applied Ecology. 2024, 35, 141–152. [Google Scholar] [CrossRef]
- Farooq, T.; Shakoor, A.; Wu, X.; Li, Y.; Rashid, M.; Zhang, X.; Gilani, M.; Kumar, U.; Chen, X.; Yan, W. Perspectives of plantation forests in the sustainable forest development of China. iForest - Biogeosciences For. 2021, 14, 166–174. [Google Scholar] [CrossRef]
- Hadden, D.; Grelle, A. Changing temperature response of respiration turns boreal forest from carbon sink into carbon source. Agric. For. Meteorol. 2016, 223, 30–38. [Google Scholar] [CrossRef]
- Cremer, M.; Kern, N.V.; Prietzel, J. Soil organic carbon and nitrogen stocks under pure and mixed stands of European beech, Douglas fir and Norway spruce. For. Ecol. Manag. 2016, 367, 30–40. [Google Scholar] [CrossRef]
- Guo, J.; Feng, H.; McNie, P.; Liu, Q.; Xu, X.; Pan, C.; Yan, K.; Feng, L.; Goitom, E.A.; Yu, Y. Species mixing improves soil properties and enzymatic activities in Chinese fir plantations: A meta-analysis. CATENA 2023, 220, 106723. [Google Scholar] [CrossRef]
- Bai, Y.; Wei, H.; Ming, A.; Shu, W.; Shen, W. Tree species mixing begets admixture of soil microbial communities: Variations along bulk soil, rhizosphere soil and root tissue. Geoderma 2023, 438, 116638. [Google Scholar] [CrossRef]
- Liu, S.; Dai, L.; Wen, Y.; Wang, H. A review on forest ecosystem management towards ecosystem services: Status, challenges, and future perspectives. Acta Ecologica Sinica. 2015, 35, 1–9. [Google Scholar]
- Zhou, Z. China Pinus massoniana. Forestry Press. 2001, pp53–60, Beijing, China.
- Mason, A.; Salomon, M.; Lowe, A.; Cavagnaro, T. Microbial solutions to soil carbon sequestration. J. Clean. Prod. 2023, 417, 137993. [Google Scholar] [CrossRef]
- Wang, W.; Chen, D.; Zhang, Q.; Sun, X.; Zhang, S. Effects of mixed coniferous and broad-leaved litter on bacterial and fungal nitrogen metabolism pathway during litter decomposition. Plant Soil 2020, 451, 307–323. [Google Scholar] [CrossRef]
- Liu, R.; Yao, Y.; Li, Q.; Cai, Z.; Wei, D.; Wang, X.; Zhang, S. Rhizosphere soil microbes benefit carbon and nitrogen sinks under long-term afforestation on the Tibetan Plateau. CATENA 2023, 220, 106705. [Google Scholar] [CrossRef]
- Pan, J.; Guo, Q.; Li, H.; Luo, S.; Zhang, Y.; Yao, S.; Fan, X.; Sun, X.; Qi, Y. Dynamics of soil nutrients, microbial community structure, enzymatic activity, and their relationships along a chronosequence of Pinus massoniana plantations. Forests. 2024, 12, 376. [Google Scholar] [CrossRef]
- Xie, Y.; Zhang, L.; Wang, J.; Chen, M.; Liu, J.; Xiao, S.; Tian, X.; Wu, T. Spatial Heterogeneity of Soil Bacterial Community Structure and Enzyme Activity along an Altitude Gradient in the Fanjingshan Area, Northeastern Guizhou Province, China. Life 2022, 12, 1862. [Google Scholar] [CrossRef]
- Khatri-Chhetri; Thompson, K. ; Quideau, S.; Boyce, M.; Chang, S.; Bork, E.; Carlyle, C. Adaptive multi-paddock grazing increases mineral associated soil carbon in Northern grasslands. Agriculture. Ecosystems & Environment. 2024, 369, 109000. [Google Scholar]
- Callahan, B.; McMurdie, P.; Rosen, M.; Han, A.; Johnson, A. Holmes SP DADA2: High-resolution sample inference from Illumina amplicon data. Nature methods. 2016, 13, 581–583. [Google Scholar] [CrossRef]
- Bokulich, N.A.; Kaehler, B.D.; Rideout, J.R.; Dillon, M.; Bolyen, E.; Knight, R.; Huttley, G.A.; Gregory Caporaso, J. Optimizing taxonomic classification of marker-gene amplicon sequences with QIIME 2’s q2-feature-classifier plugin. Microbiome 2018, 6, 90. [Google Scholar] [CrossRef]
- Haiyan, W.; Jiangqi, W.; Guang, L.; Lijuan, Y. Changes in soil carbon fractions and enzyme activities under different vegetation types of the northern Loess Plateau. Ecology and evolution. 2020, 10, 12211–12223. [Google Scholar]
- Wang, B.; Zhang, P.; Zhang, Q. Relationship between soil total organic carbon and physicochemical propertiesin Larix gmelinii forests at differentages. N AT. Sci Ed. 2021, 49, 36–45. [Google Scholar]
- Ye, Y.; Juan, L.; Liang, Y. Soil microbial community and physicochemical properties together drive soil organic carbon in Cunninghamia lanceolata plantations of different stand ages. PeerJ. 2022, 10, e13873. [Google Scholar]
- Ansari, M.; Choudhury, B.; Mandal, S.; Jat, S.; Meitei, C. Converting primary forests to cultivated lands: Long-term effects on the vertical distribution of soil carbon and biological activity in the foothills of Eastern Himalaya. Journal of Environmental Management. 2022, 301, 113886. [Google Scholar] [CrossRef]
- Gao, F.; Cui, X.; Sang, Y.; Song, J. Changes in soil organic carbon and total nitrogen as affected by primary forest conversion. Forest Ecology and Management. 2020, 463, 118013. [Google Scholar] [CrossRef]
- Zhang, M.; Bai, X.; Wang, Y.; Li, Y.; Cui, Y.; Hu, S. Soil microbial trait-based strategies drive the storage and stability of the soil carbon pool in Robinia pseudoacacia plantations. Catena. 2023, 222, 106894. [Google Scholar] [CrossRef]
- Maokui, L.; Peter, M.; Homyak. ; Jinsheng, X.; Josep, P.; Michael, G.; Xiaoling, X.; Jordi Sardans.; Weisheng, L.; Minhuang, W.; Guangshui, C; Yusheng Y. Litter quality controls tradeoffs in soil carbon decomposition and replenishment in a subtropical forest. Journal of Ecology. 2023, 111, 2181–2193. [Google Scholar]
- Lavallee, J.; Soong, J.; Cotrufo, M. ; Conceptualizing soil organic matter into particulate and mineral-associated forms to address global change in the 21st century. Global change biology. 2020, 26, 261–273. [Google Scholar] [CrossRef]
- Yu, H.; Wei, X.; Tan, W. High nitrogen enrichment increases the allocation of new organic carbon to deep soil layers. Geoderma. 2022, 406, 115515. [Google Scholar] [CrossRef]
- Manici, L.; Caputo, F.; Fornasier, F.; Paletto, A.; Ceotto, E.; De, M. Ascomycota and Basidiomycota fungal phyla as indicators of land use efficiency for soil organic carbon accrual with woody plantations. Ecological Indicators. 2024, 160, 111796. [Google Scholar] [CrossRef]
- Zhu, K.; Wang, Q.; Zhang, Y.; Zarif, N.; Ma, S.; Xu, L. Variation in soil bacterial and fungal community composition at different successional stages of a broad-leaved Korean pine forest in the Lesser Hinggan Mountains. Forests. 2022, 13, 625. [Google Scholar] [CrossRef]
- Chang, F.; Jia, F.; Lv, R.; Li, Y.; Wang, Y.; Jia, Q.; Zhen, L. ; Soil bacterial communities reflect changes in soil properties during the tillage years of newly created farmland on the Loess Plateau. Applied Soil Ecology. 2021, 161, 103853. [Google Scholar] [CrossRef]
- Luo, J.; Guo, X.; Tao, Q.; Li, J.; Liu, Y.; Du, Y.; Liu, Y; Liang, Y. ; Li, T. Succession of the composition and co-occurrence networks of rhizosphere microbiota is linked to Cd/Zn hyperaccumulation. Soil Biology and Biochemistry. 2021, 153, 1–12. [Google Scholar] [CrossRef]
- Matiru, V.; Dakora, F. Potential use of rhizobial bacteria as promoters of plant growth for increased yield in landraces of African cereal crops. African Journal of Biotechnology. 2004, 3, 1–7. [Google Scholar]
- Pu, Q.; Tan, Z.; Peng, G.; Li, Y.; Liu, L.; Zhang, H. Advances in rhizobia taxonomy. Microbiol. China. 2016, 43, 619–633. [Google Scholar]
- Witzgall, K.; Vidal, A.; Schubert, D.; Höschen, C.; Schweizer, S.; Buegger, F.; Pouteau, V.; ChenuMueller, C. Particulate organic matter as a functional soil component for persistent soil organic carbon. Nature communications. 2021, 12, 1–10. [Google Scholar] [CrossRef] [PubMed]
- Zhang, H.; Zeng, Q.; An, S.; Dong, Y.; Darboux, F. Changes in soil carbon fractions and enzyme activities under different vegetation types of the northern Loess Plateau. Ecology and evolution. 2016, 10, 12211–12223. [Google Scholar]
Figure 1.
Location of the test site of the state-owned forest farm in Dushan County.
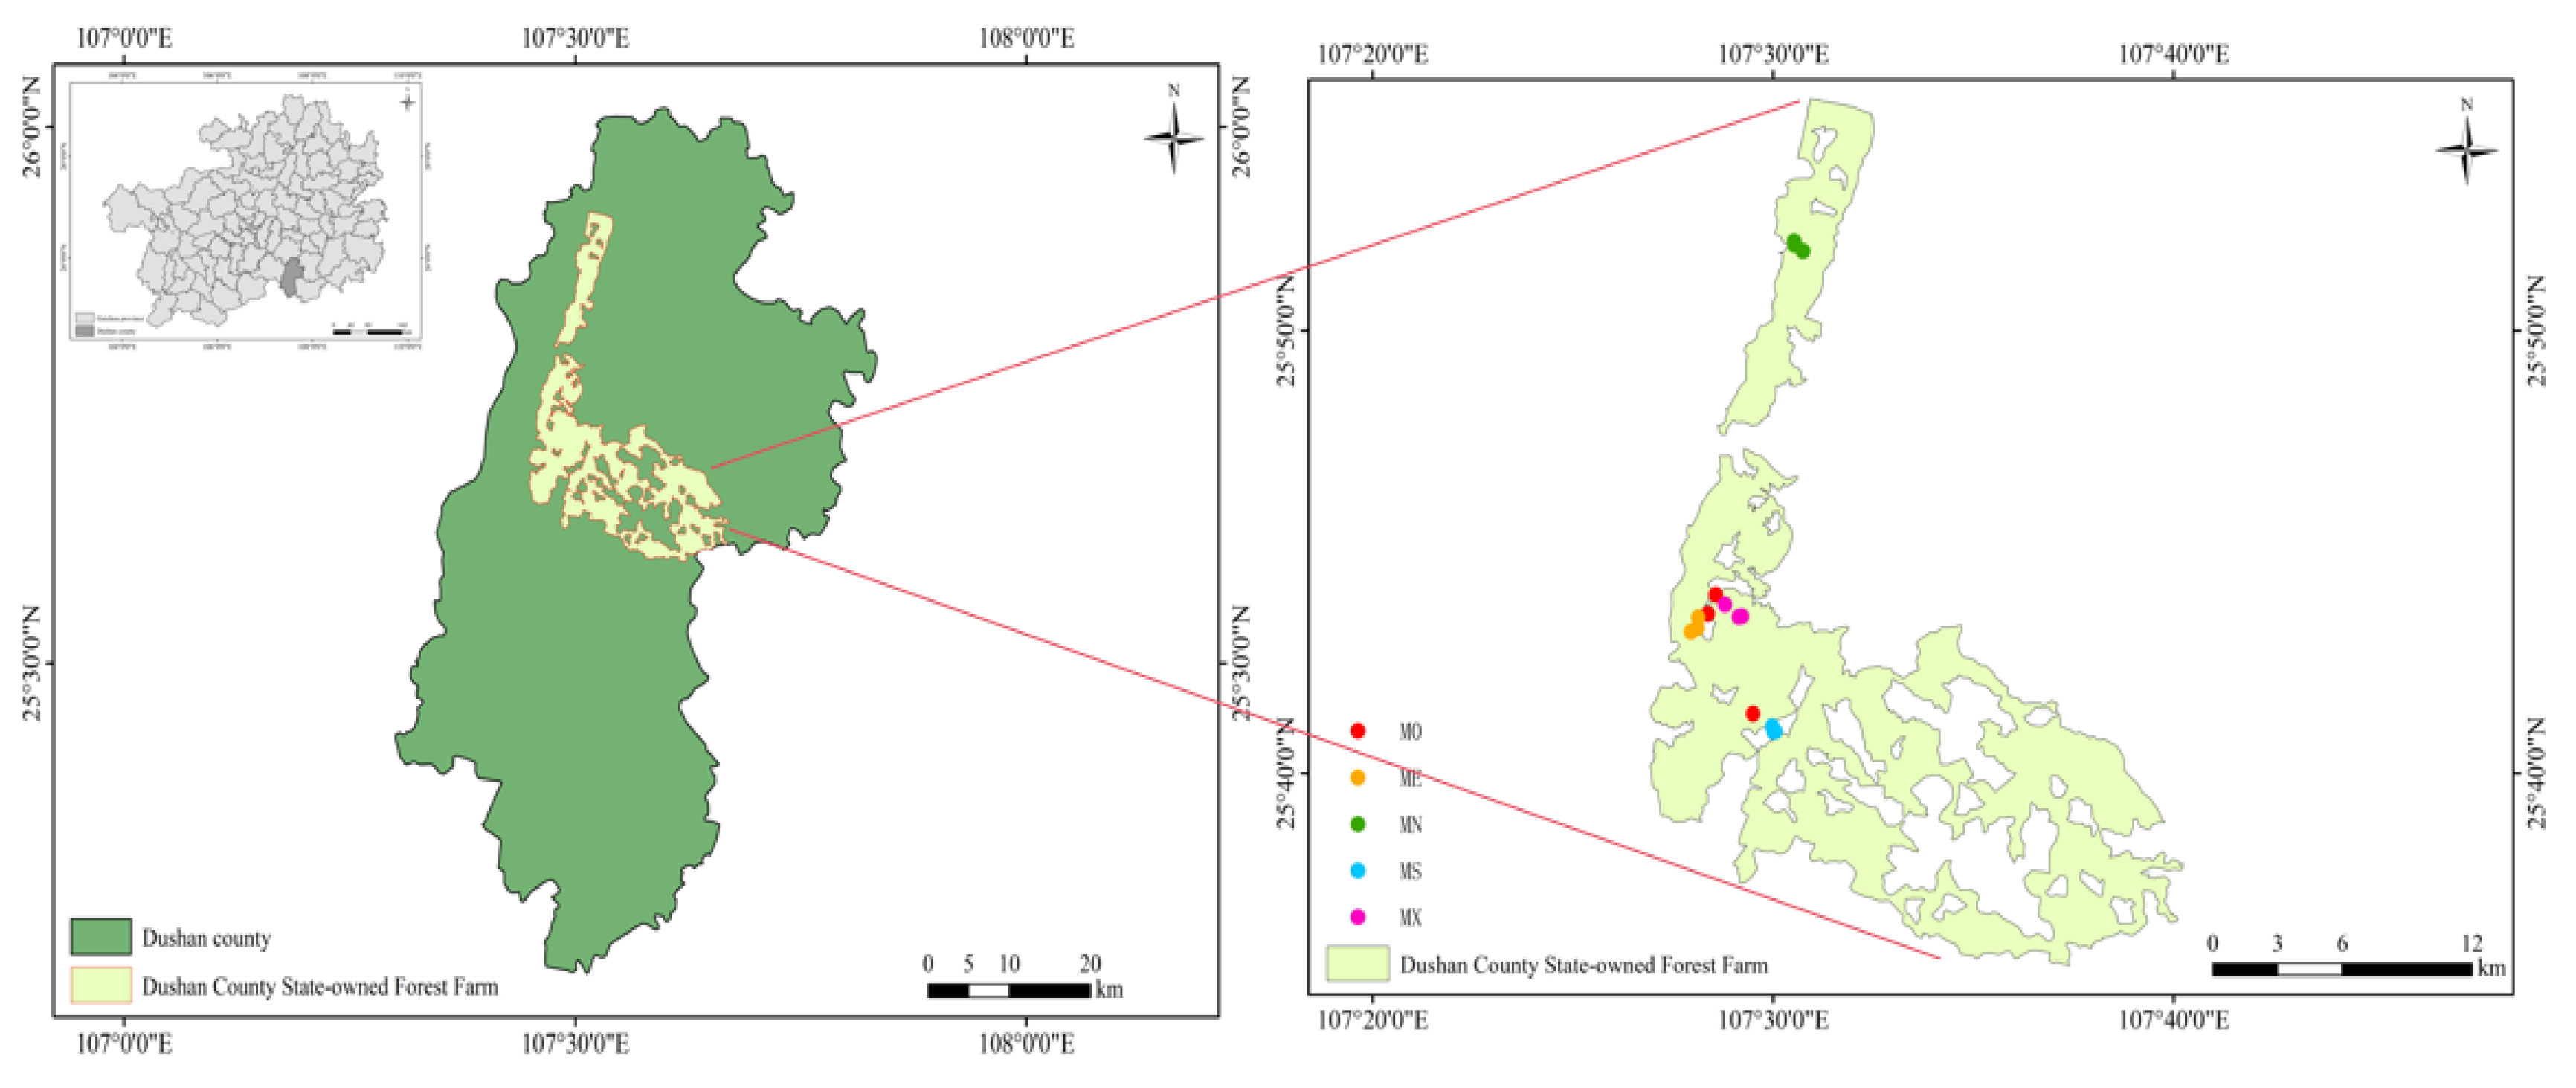
Figure 2.
Soil carbon component content in different mixing modes(A, B, C indicate significant differences in different mixed planting patterns within the same soil layer, while a,b,c indicate significant differences in different soil layers within the same forest stand(SOC: Soil organic carbon; POC: Particulate organic carbon; MBC: Microbial biomass C; EOC: readily oxidizable organic carbo; DOC: Dissolved organic C; TN: Total nitrogen; CL: Carbon lability. Similarly hereinafter).
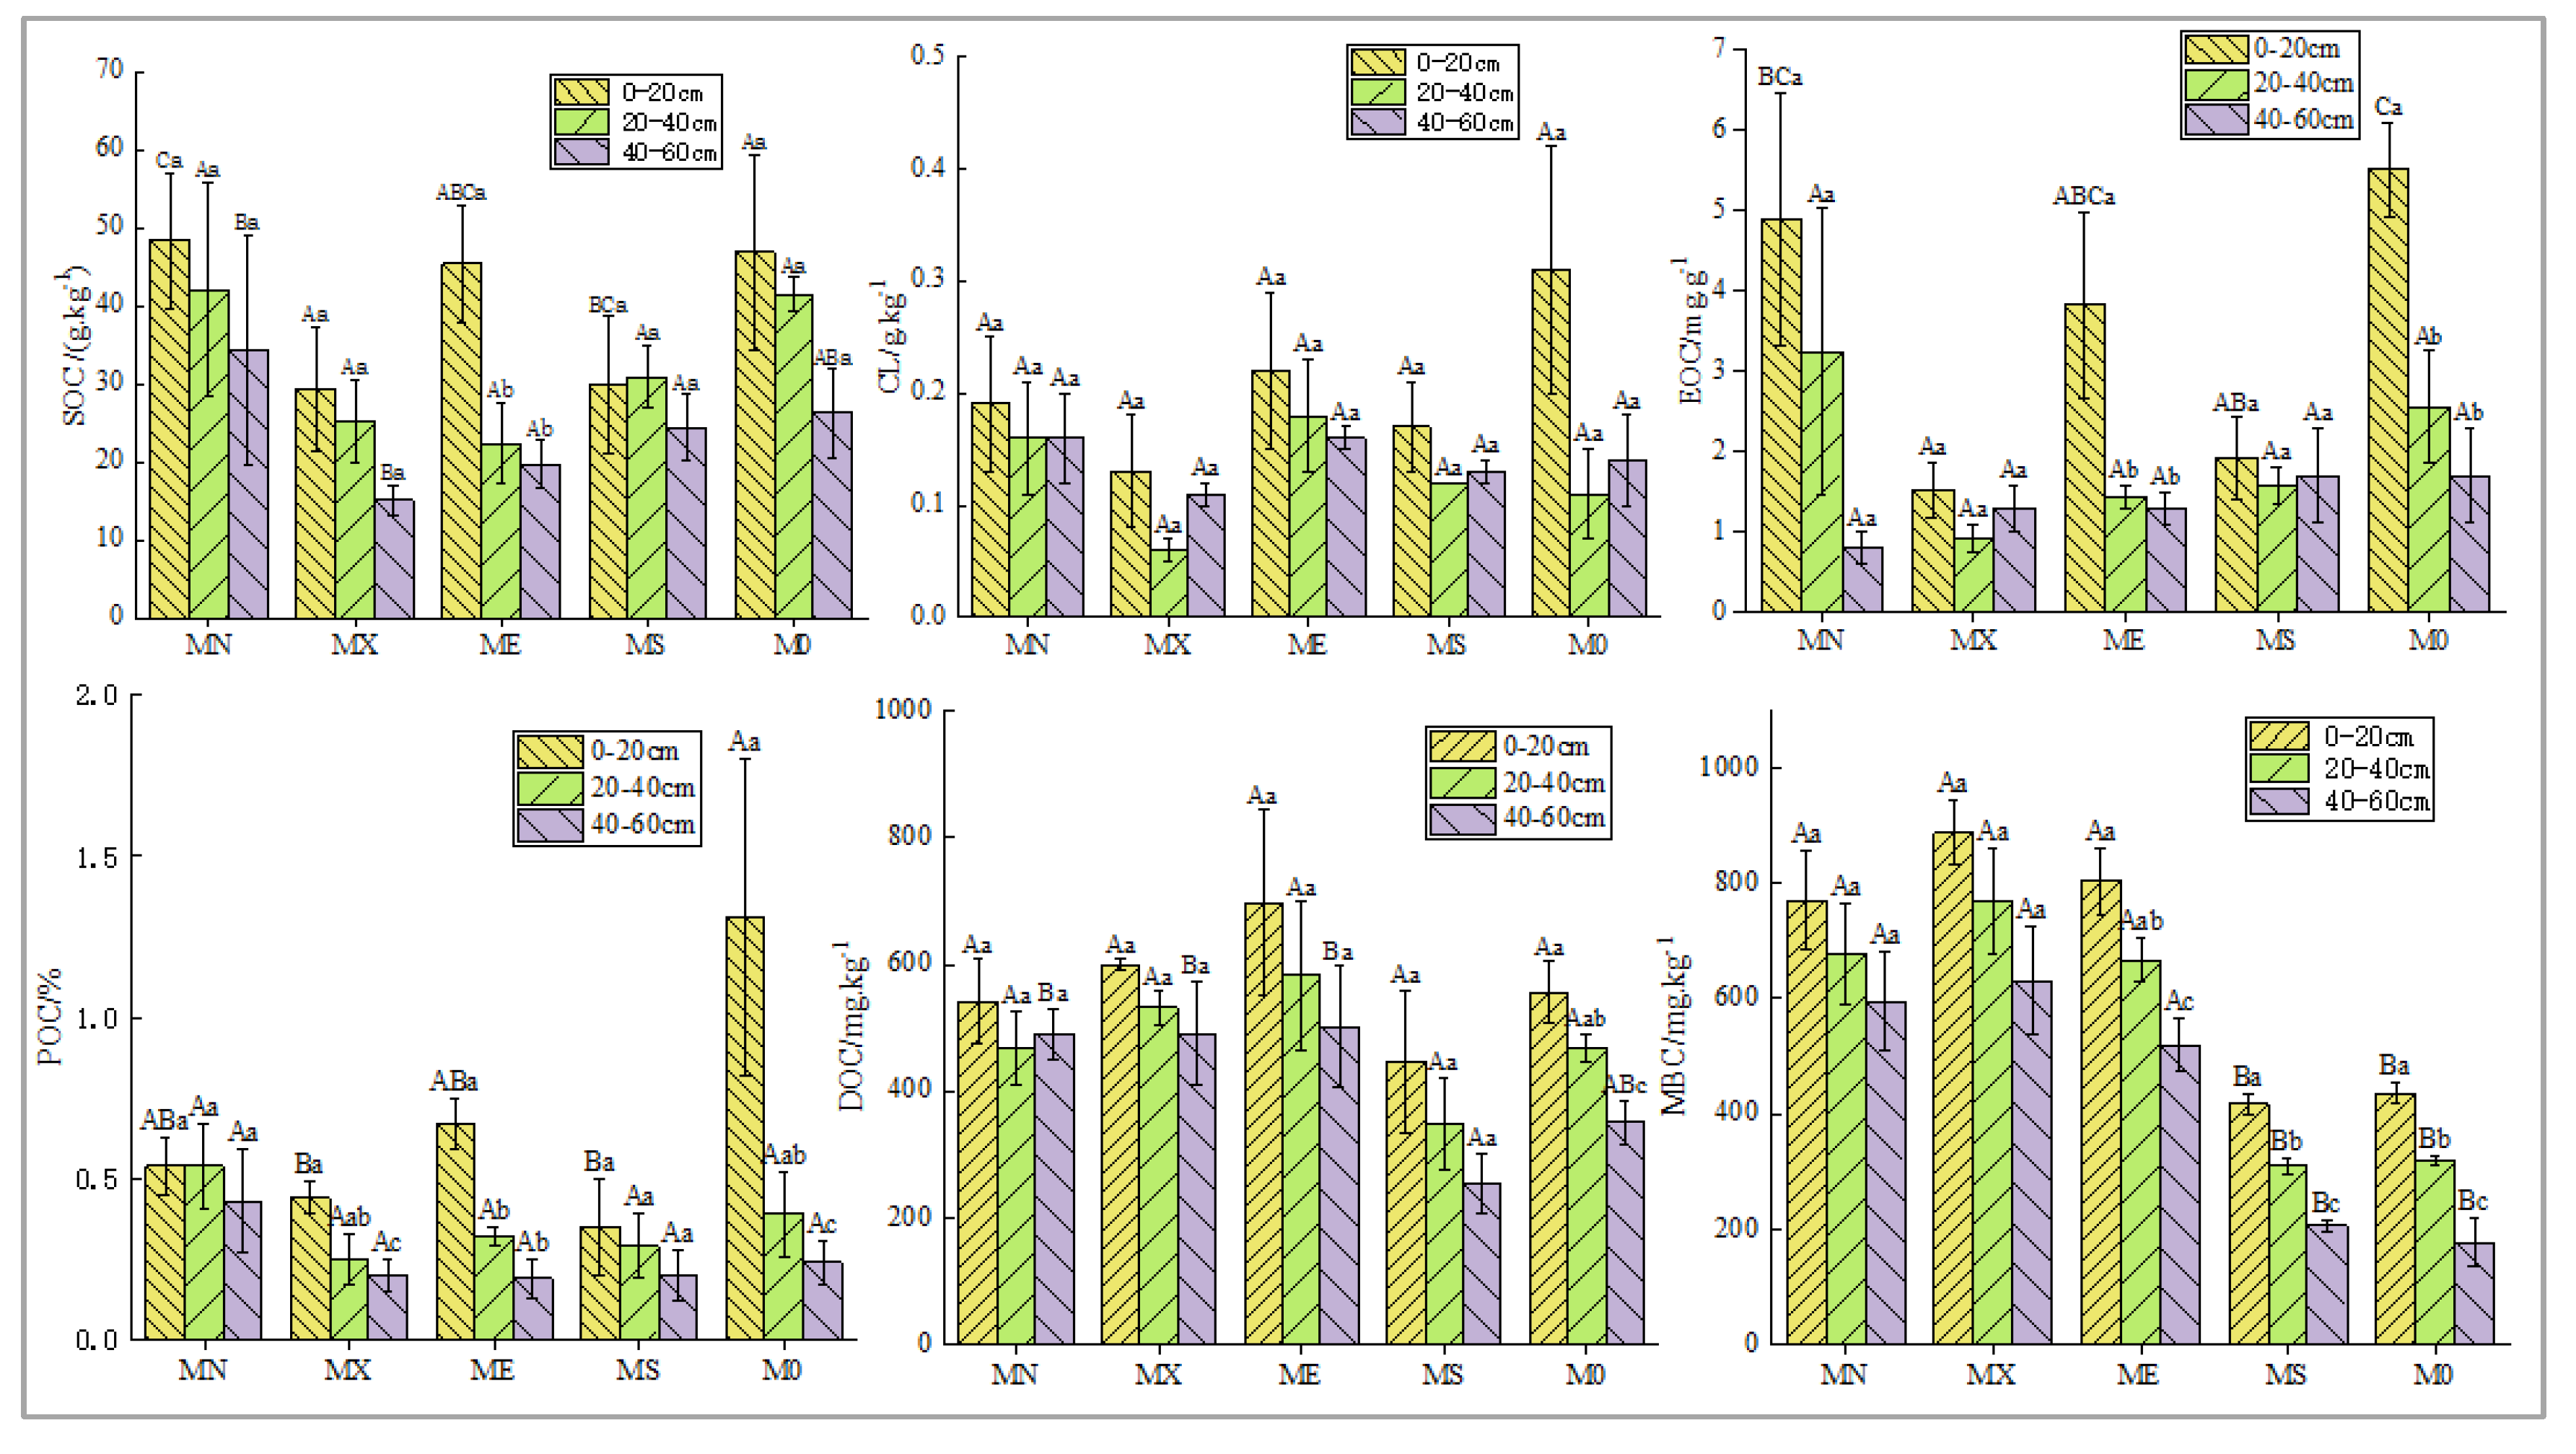
Figure 3.
Correlation between soil carbon components and SOC in different mixing modes.
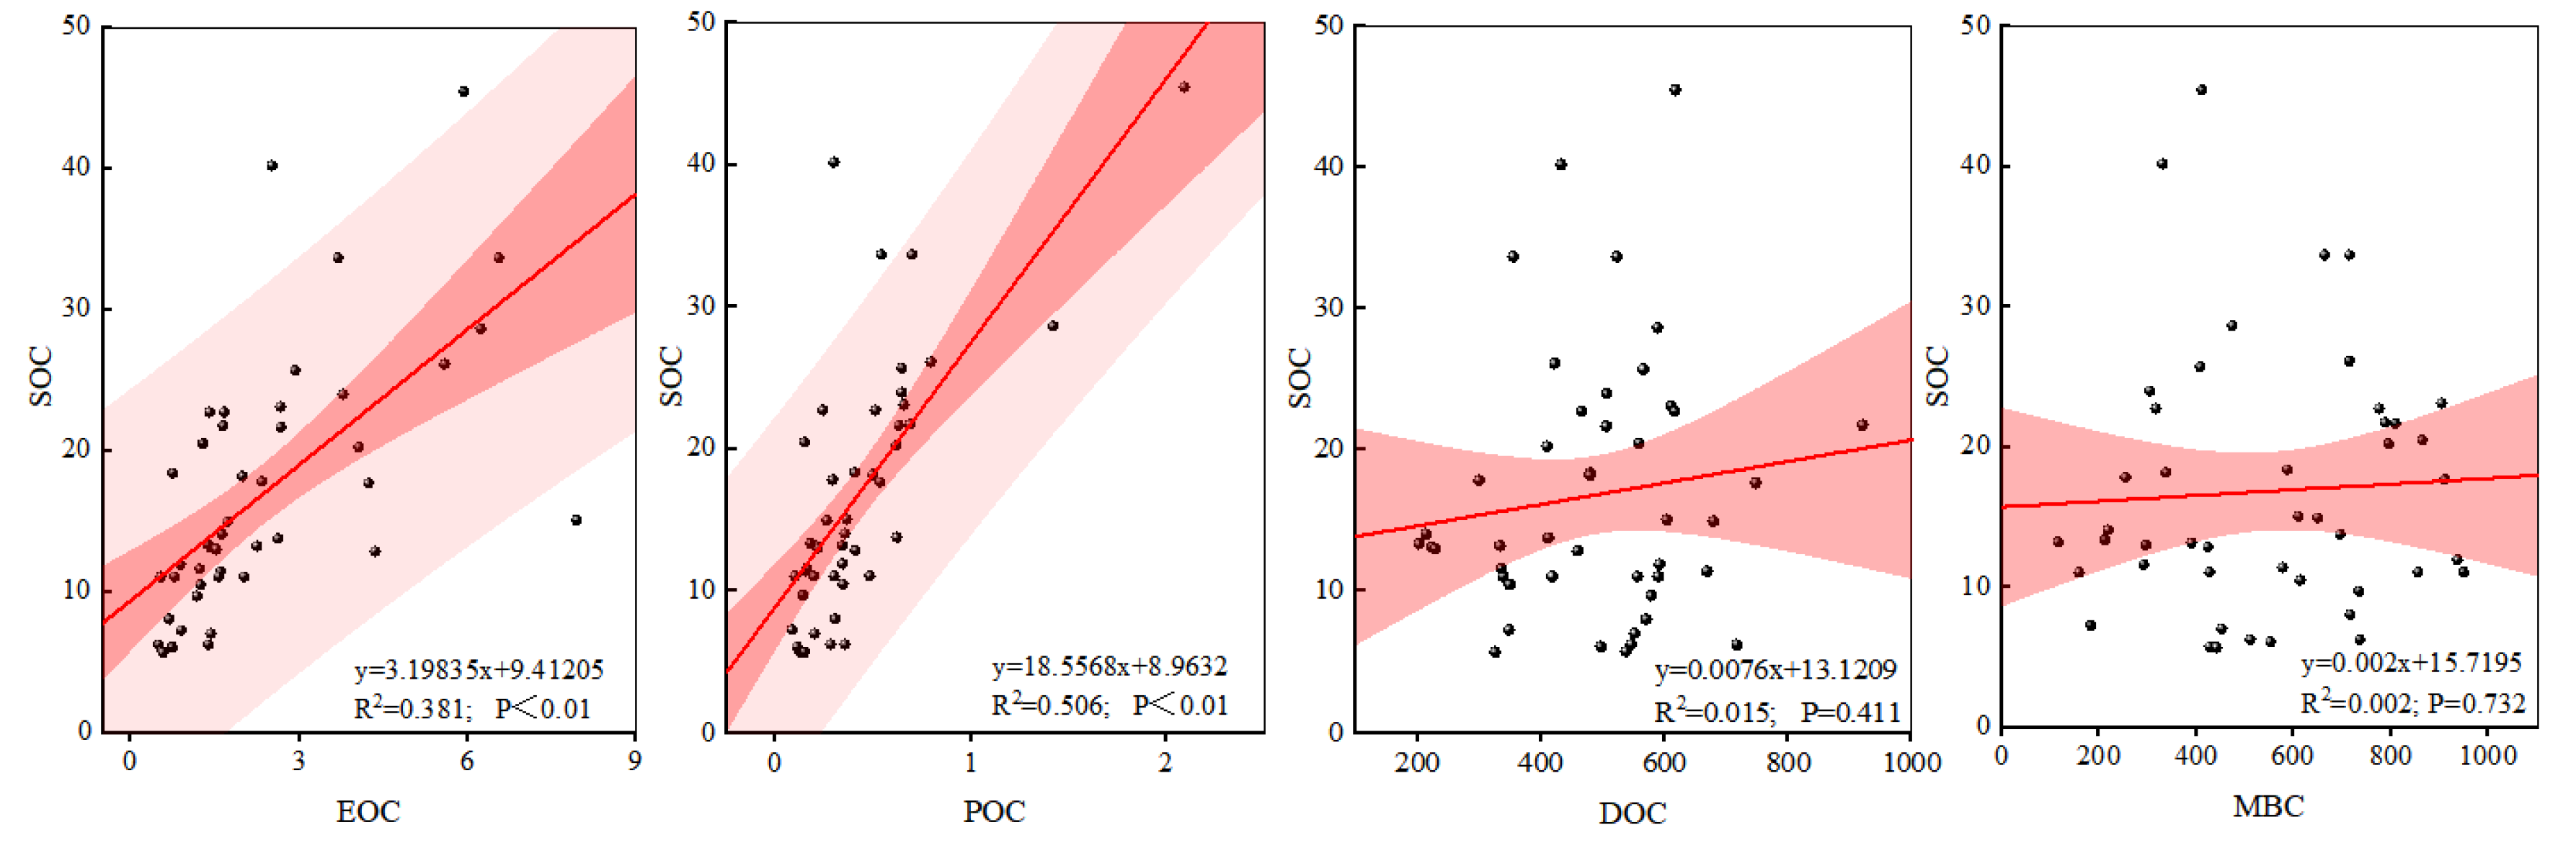
Figure 4.
Circos Plot of soil fungal and bacterial communities in different mixed patterns; A Relative abundance of phylum levels of fungal communities and B that of bacterial communities.
Figure 4.
Circos Plot of soil fungal and bacterial communities in different mixed patterns; A Relative abundance of phylum levels of fungal communities and B that of bacterial communities.
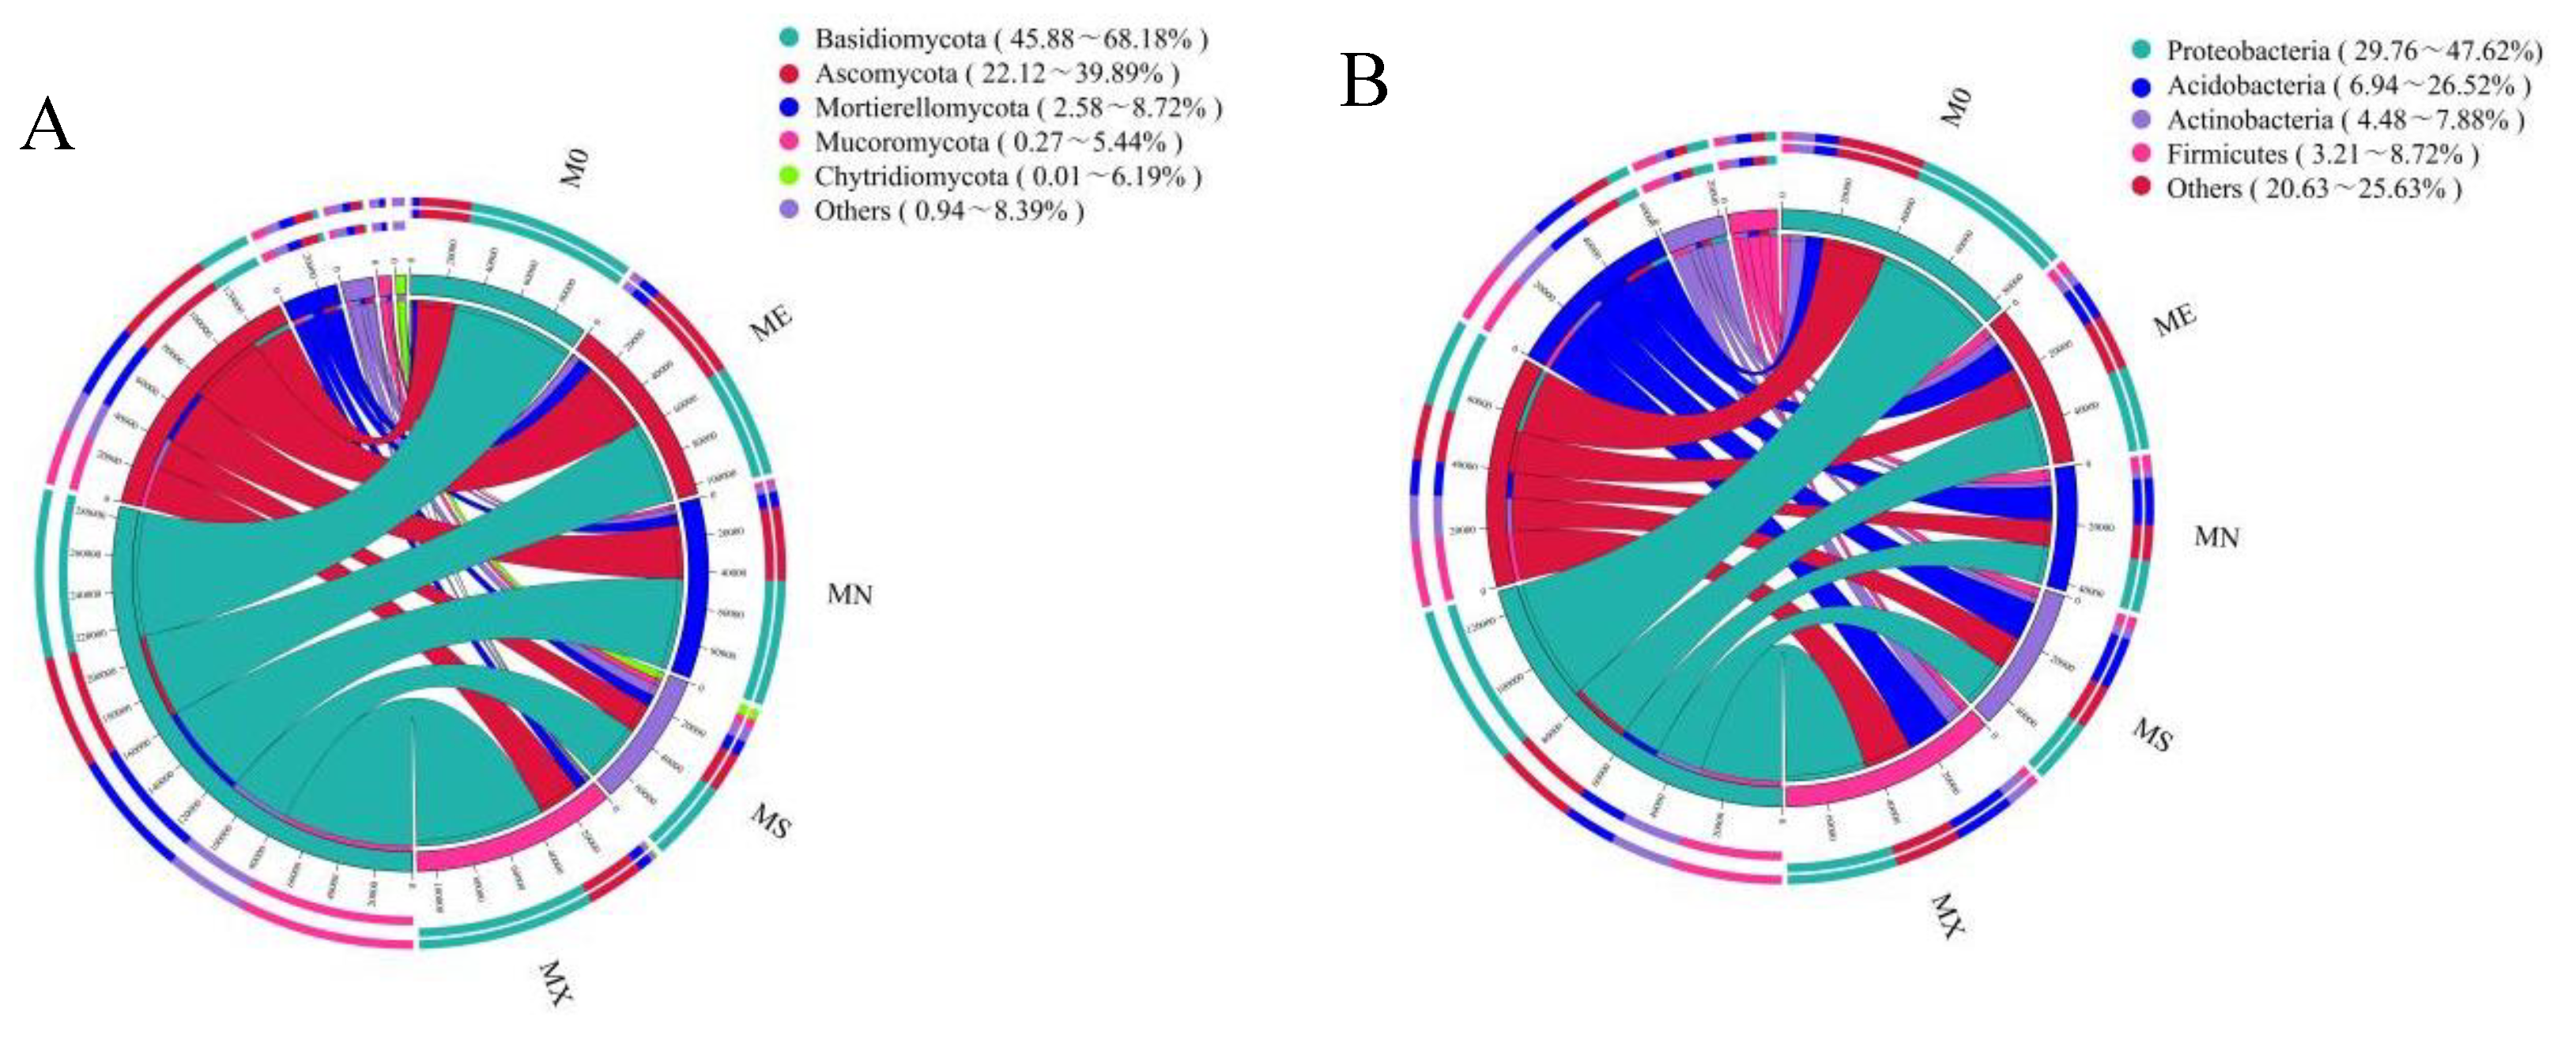
Figure 5.
Box plots of Alpha diversity index in soil fungal and bacterial communities.
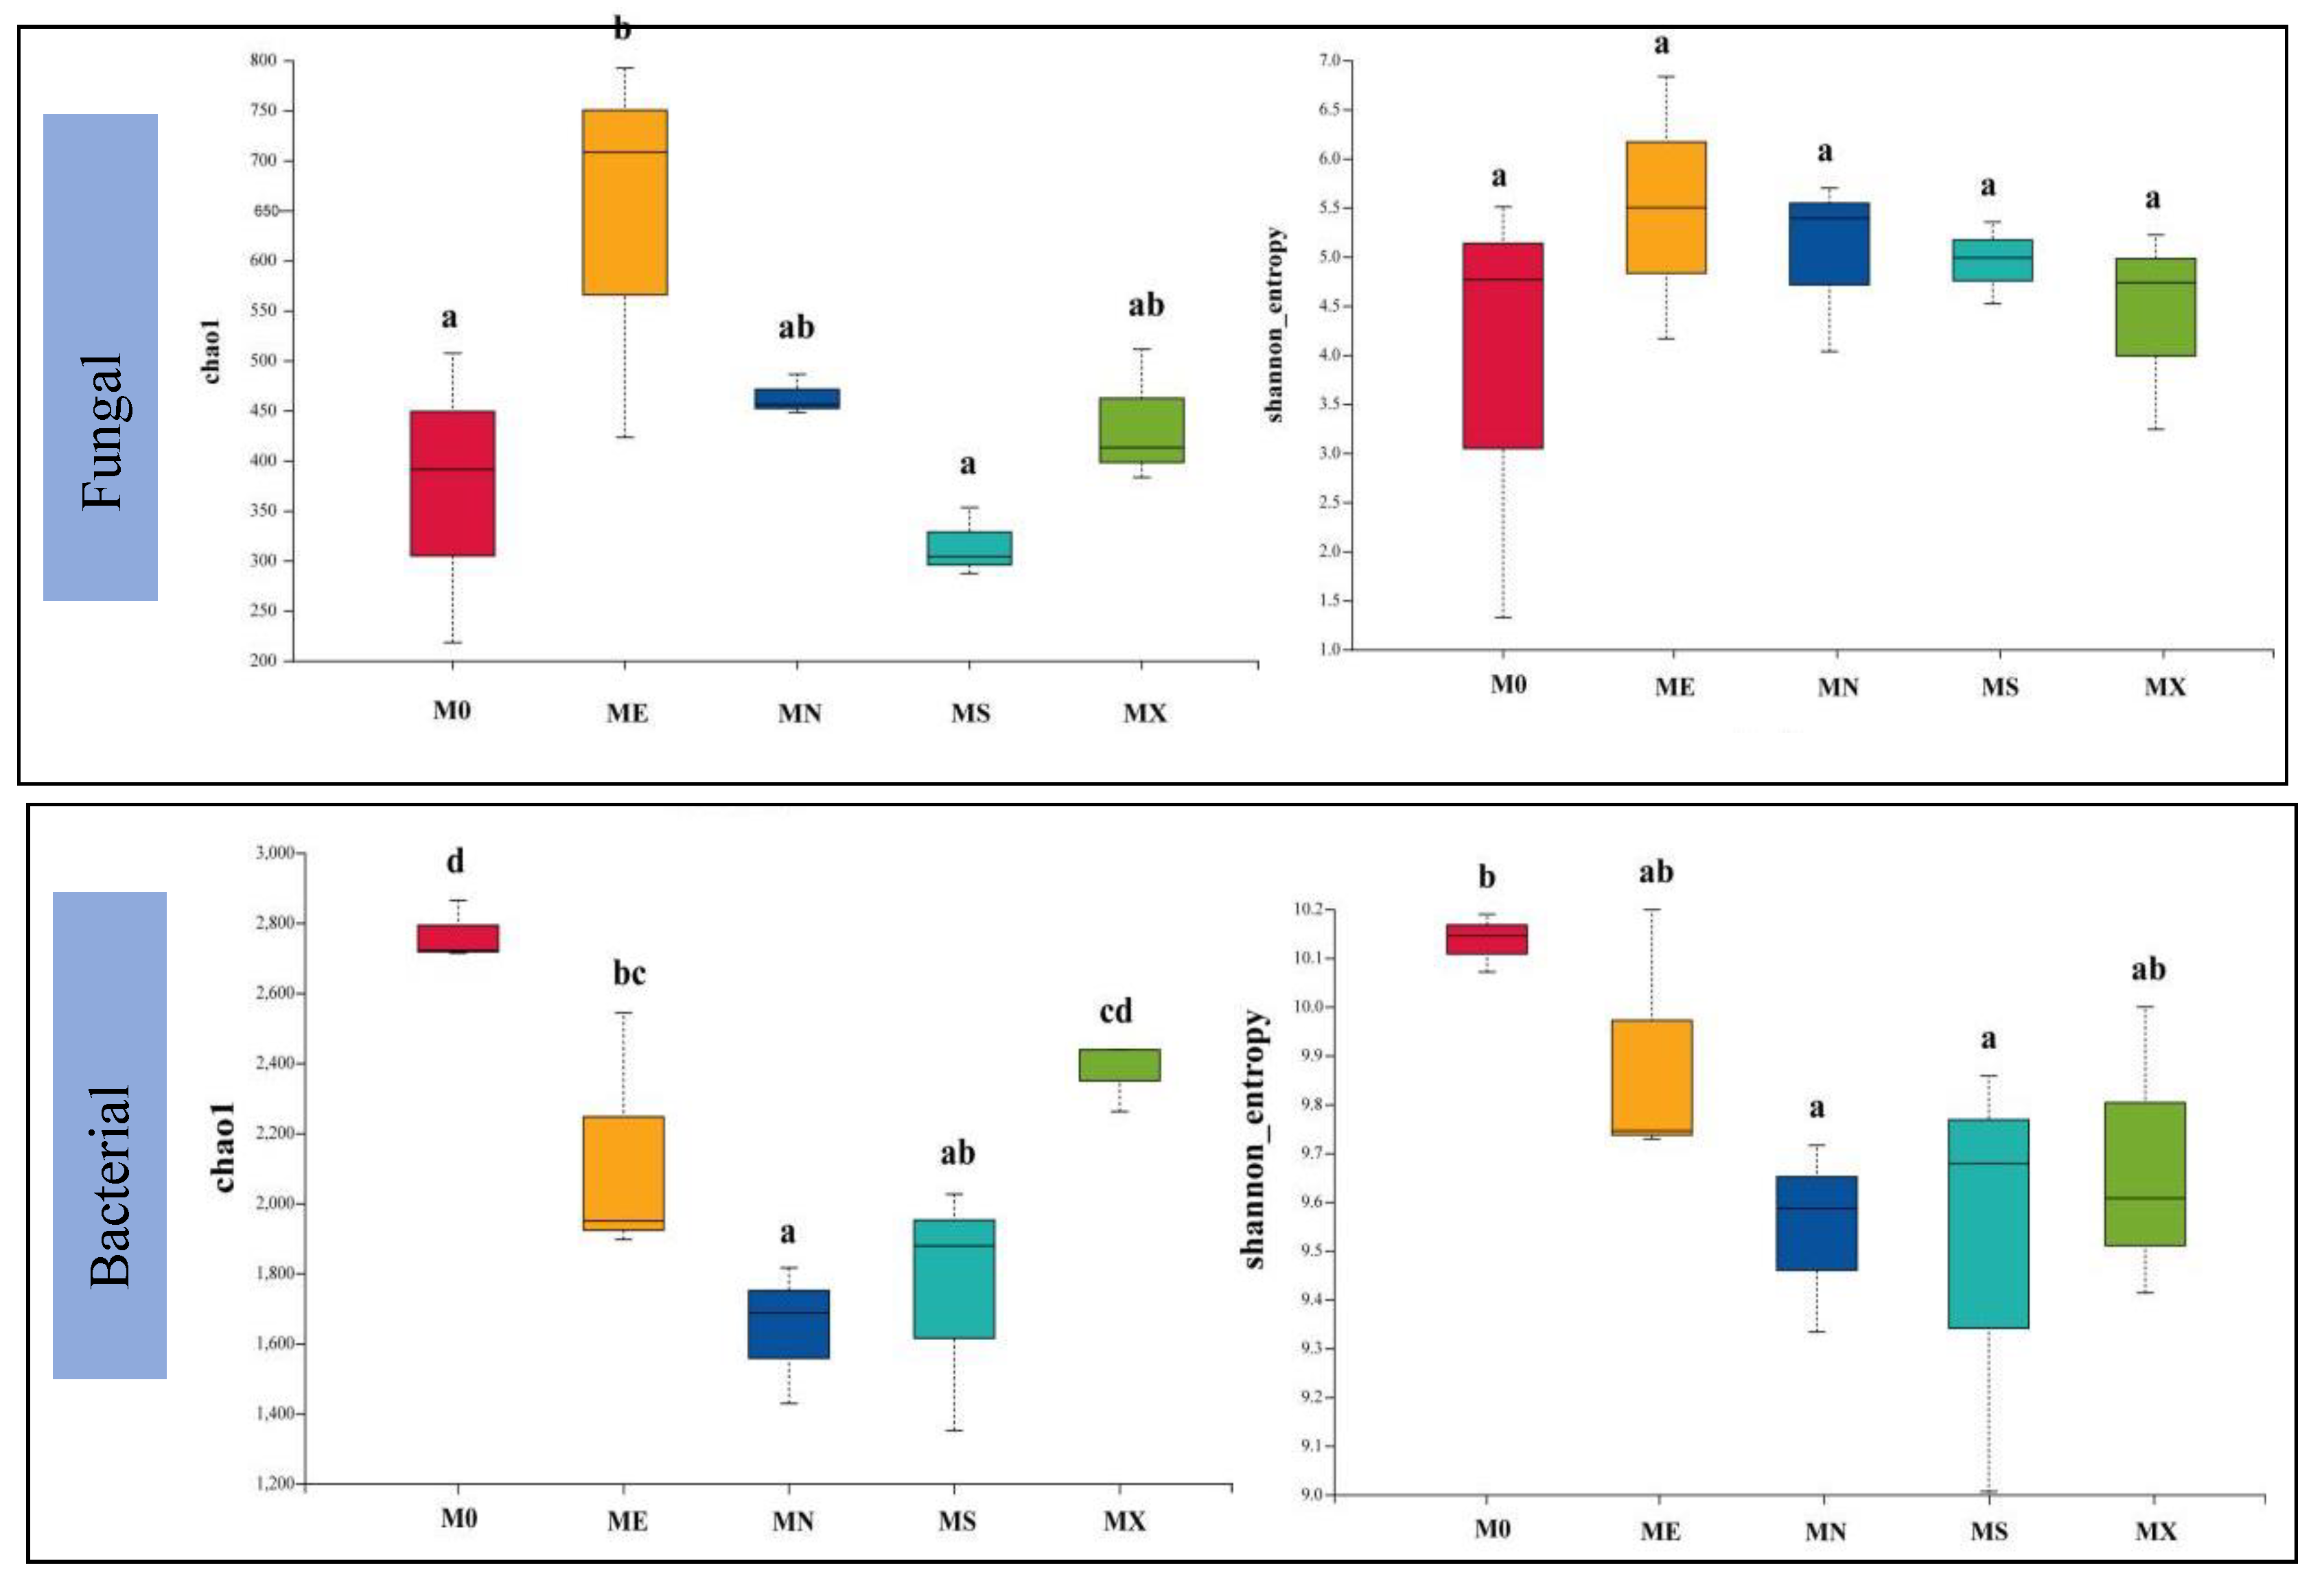
Figure 6.
A 3D plot of soil fungal and bacterial communities based on Bray-Curtis distances.
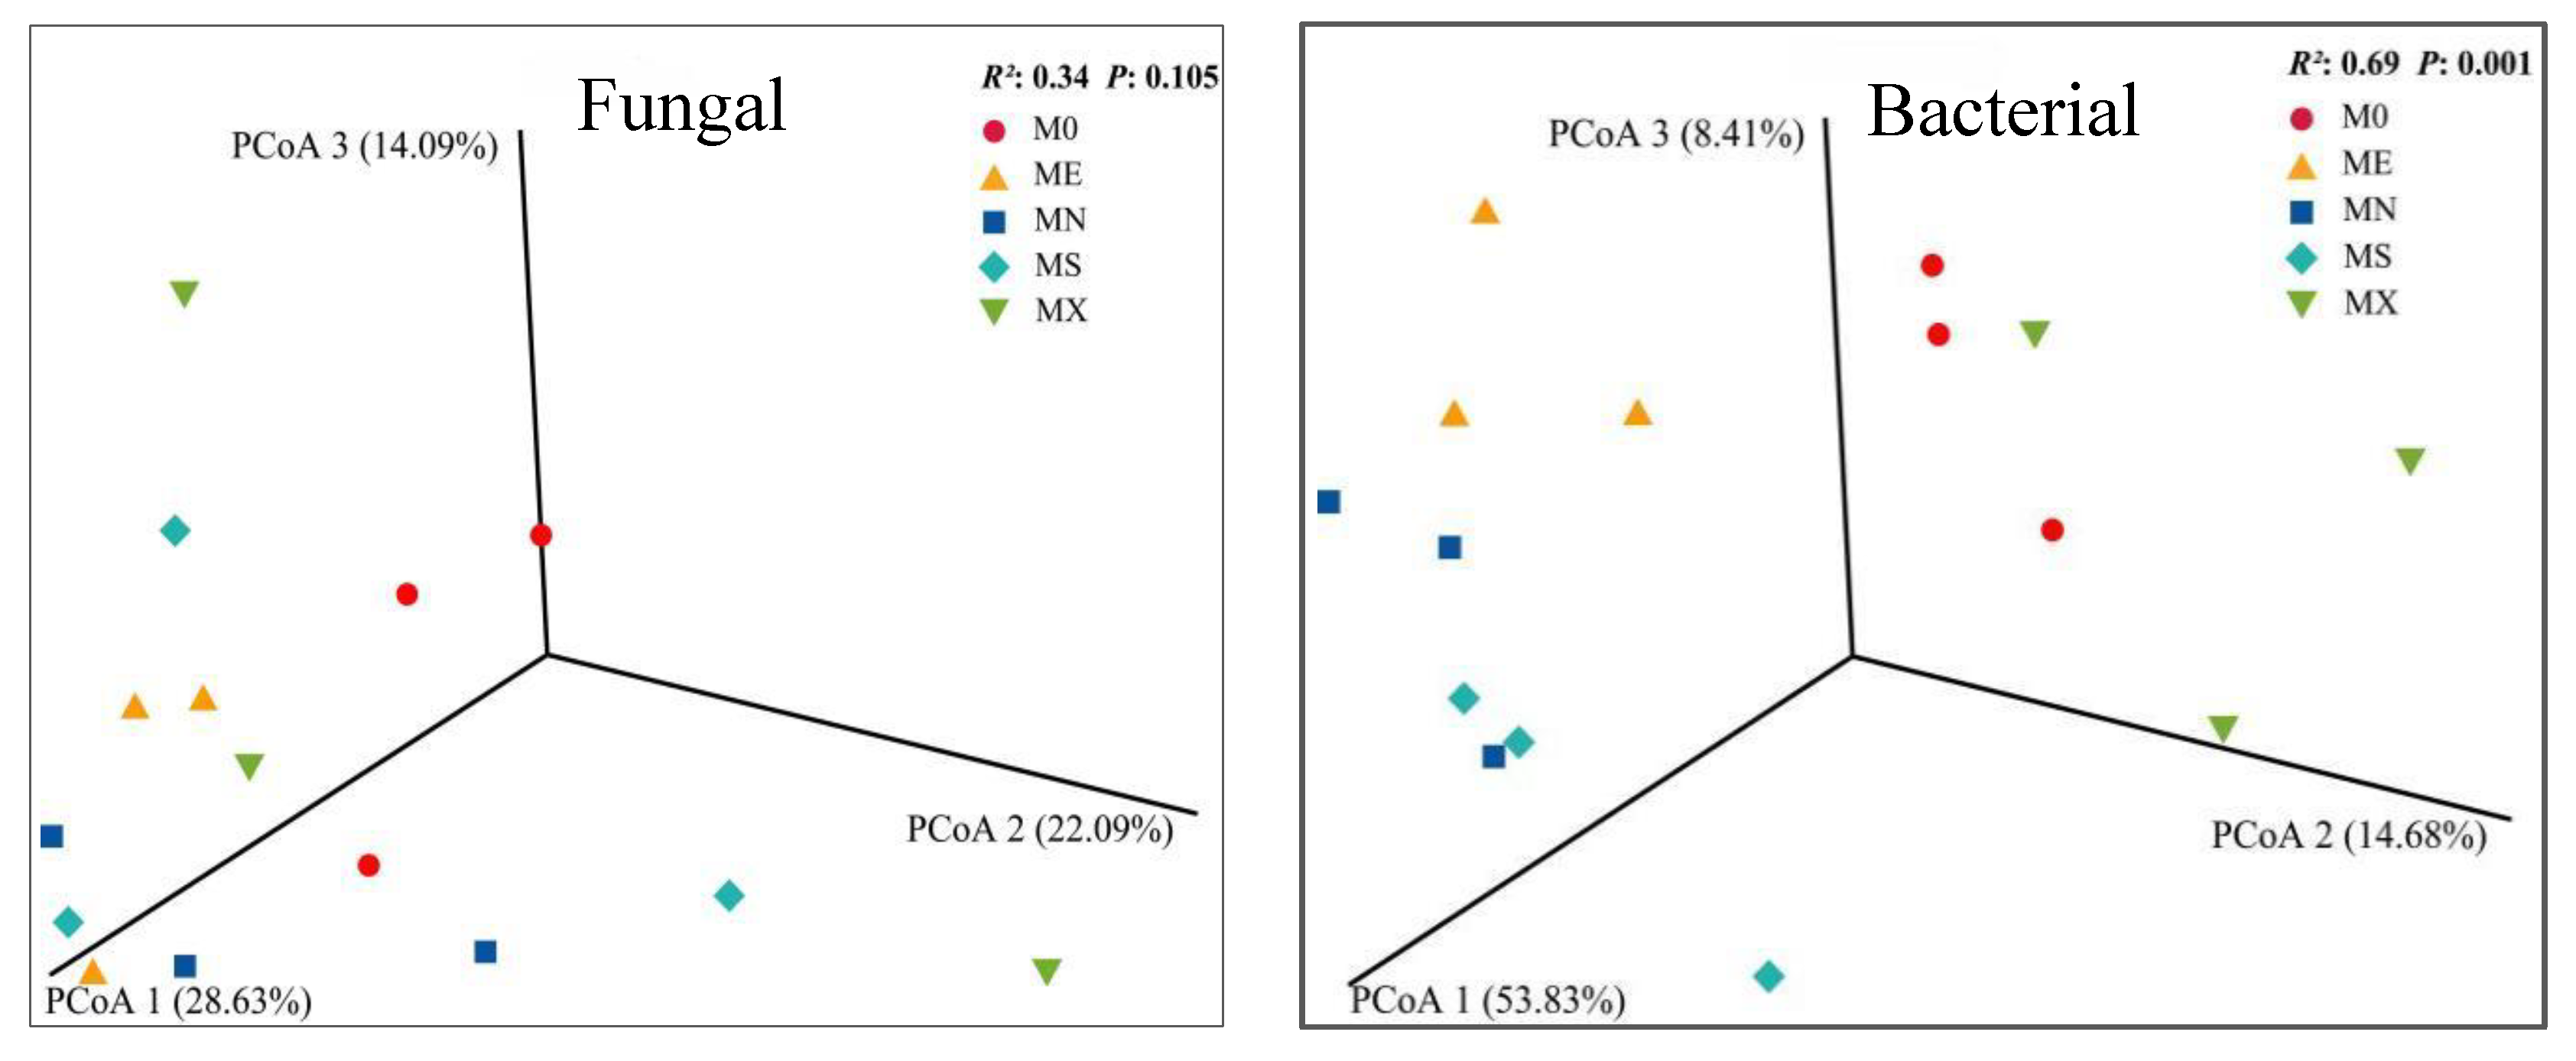
Figure 7.
Main explanatory modules of fungal and bacterial communities of soil SOC components. A, B Collinear network plot of main functional groups of soil microbial community; C, D modules of main microbial communities and physicochemical properties of soil and SOC components heatmap (Note: The X axis is the environmental factor and the Y axis is the species. * P <0.05,** P < 0.01,*** P < 0.001), Percentage of predominant genera in the top 10 consortia abundance for each module; E, F. RDA analysis of microbial communities and soil carbon components.
Disclaimer/Publisher’s Note: The statements, opinions and data contained in all publications are solely those of the individual author(s) and contributor(s) and not of MDPI and/or the editor(s). MDPI and/or the editor(s) disclaim responsibility for any injury to people or property resulting from any ideas, methods, instructions or products referred to in the content. |
© 2024 by the authors. Licensee MDPI, Basel, Switzerland. This article is an open access article distributed under the terms and conditions of the Creative Commons Attribution (CC BY) license (http://creativecommons.org/licenses/by/4.0/).
Copyright: This open access article is published under a Creative Commons CC BY 4.0 license, which permit the free download, distribution, and reuse, provided that the author and preprint are cited in any reuse.


