Submitted:
07 May 2024
Posted:
10 May 2024
You are already at the latest version
Abstract
In this study, nanostructured cerium-doped TiO2 (Ce-TiO2) films with the addition of different amounts of cerium (0.00, 0.08, 0.40, 0.80, 2.40, and 4.10 wt. %) were deposited on a borosilicate glass substrate, by flow coating sol-gel process. After flow coating, deposited films were dried at the temperature of 100 °C for 1 h, followed by calcination at the temperature of 450 °C for 2 h. For the characterization of sol-gel TiO2 films, the following analytic techniques were used: X-ray diffraction (XRD), thermal gravimetry (TG), differential thermal analysis (DTA), and differential scanning calorimetry (DSC). Sol-gel derived Ce-TiO2 films were used for photocatalytic degrada-tion of the ciprofloxacin (CIP). The influence of the amount of Ce in TiO2 films, the duration of the photocatalytic decomposition, and the irradiation type (UV-A and simulated solar light) on the CIP degradation were monitored. Kinetics parameters (reaction kinetics constants and the half-life) of the CIP degradation, as well as photocatalytic degradation efficiency, were determined. The best photocatalytic activity was achieved by the TiO2 film doped with 0.08 wt.% Ce, under both UV-A, and solar irradiation.
Keywords:
Ce-TiO2
; ciprofloxacin
; photocatalysis
; characterization
1. Introduction
Wastewater released into the environment can have an extremely harmful effect on the nature and well-being of living creatures. Research showed that the most significant amount of pharmaceuticals released into the environment came from wastewater treatment plants [1,2]. The primary sources of pollution are thus sewage collected from households, hospitals, etc. The result of wastewater discharge into the environment is the pollution of soil, surface, underground waters (rivers, lakes, seas) and drinking water [3,4]. In order to reduce or, at best, eliminate pollutants, numerous water and air purification techniques are being developed, such as chemical precipitation, filtration, electrodeposition, adsorption, membrane systems, etc. [5,6,7]. These conventional water treatment processes are no longer efficient enough for the degradation of complex substances such as pharmaceuticals, their metabolites, or transformation products [1,3]. Advanced oxidation processes (AOPs), especially heterogeneous photocatalysis, have shown their promising ability for degradation through the generation of hydroxyl radicals (OH˙). These are able to react with the pollutants they come into contact with, serving as powerful oxidizing agents [8,9].
Numerous studies have confirmed that some photocatalysts, such as TiO2, Fe2O3, WO3, ZnO, CeO2, CdS, ZnS, MoO3, ZrO2, and SnO2, can be activated by light due to the favorable size of the energy gap, electronic structure with a free conduction band and a filled valence band, and thus break down toxic organic substances in water and air [5,10]. Photocatalysts can completely decompose harmful organic substances into simple compounds such as water, carbon dioxide, and corresponding mineral acids [6,11].
TiO2 is recognized as an excellent photocatalyst, but due to its relatively high band gap energy of 3.2 eV for the anatase phase and 3.03 eV for the rutile phase, it can only be used when irradiated with UV radiation λ < 387 nm, which makes up only 3-5% of the total naturally occurring solar radiation [6,8,10,11,12]. In order to extend the photocatalytic activity of TiO2 into the visible range of electromagnetic radiation, it is often doped with non-metals (N, S, C, H) [13,14], noble metals (Ag, Au, Pt) [15], transition metals (Ce, Fe) [16], modified with metal semiconductors, co-doped with metals and non-metals, etc. [8,10,16,17,18].
The sol-gel method for the preparation of nanostructured cerium-doped titania has shown promising results in shifting the photocatalytic activity of TiO2 into the visible range of irradiation [8,12,19,20,21,22]. By increasing the concentration of cerium in TiO2, the band gap of TiO2 narrows. Consequently, TiO2 begins to absorb visible light, shifting its absorption edge from UV to the visible spectrum up to 450 nm. This phenomenon is attributed to potential charge transfer between Ce 4f levels. The presence of cerium 4f levels is critical in suppressing the recombination of electron-hole pairs, thereby enhancing certain processes. However, excessive doping with cerium may introduce an abundance of recombination centres, thus diminishing the photodegradation capability of the material [8,12,23].
Methods that produce the photocatalyst in powder form are less often used because they require the removal of the photocatalyst from water by filtration and other separation processes, which adds another step during the processing and consumes time and resources. Today, the process of photocatalyst immobilization on various substrates has been increasingly used to avoid the complex removal step [7,24].
The aim of this research is to prepare nanoseized sol-gel cerium doped titania ceramic films (Ce-TiO2), with the addition of different amounts of Ce, for later use in photocatalytic oxidation experiments. The sol-gel flow coating method was used for the deposition of Ce-TiO2 films on a borosilicate glass substrate. Ciprofloxacin, one of the most widely used antibiotics in the world, was used as a model pollutant, and its photocatalytic degradation was monitored by UV–Vis measurements.
2. Materials and Methods
2.1. Preparation of Ce-TiO2 Films
Nanostructured Ce-TiO2 films were deposited on a borosilicate glass substrate by the sol-gel process using the flow coating method. Borosilicate glass plates with dimensions of 30 × 50 × 2 mm were used as substrates. The substrates were carefully cleaned prior to the process of deposition using the procedure already described in [25].
TiO2 sols (colloidal solutions) with different amounts of cerium (Ce) were prepared by mixing the following analytical grade reagents: titanium(IV) isopropoxide (TIP, Ti(OCH(CH3)2)4, 98%, Sigma–Aldrich, St. Louis, MO, USA) as the precursor, cerium(III) nitrate hexahydrate (CeN3O9·6H2O, 99.5%, Thermo Fisher Scientific, Waltham, MA, US) as the precursor, i-propyl alcohol (PrOH, C3H7OH, 99.9%, Gram-Mol, Zagreb, Croatia) as the solvent, acetylacetone (AcAc. CH3(CO)CH2COCH3, 99%+, VWR International, Radnor, PA, USA) as the chelating agent and nitric acid (HN, HNO3, 65%, Carlo Erba Reagents, Val-de-Reuil, France) as the catalyst. The molar ratio of these reactants in all colloidal solutions was TIP:PrOH:AcAc:HN = 1:35:0.63:0.015 [26,27].
Six sols (colloidal solutions) were prepared:
- TiO2 sol without the addition of cerium (0.00 wt.% of cerium)
- TiO2 sol with addition 0.08 wt.% of cerium
- TiO2 sol with addition 0.40 wt.% of cerium
- TiO2 sol with addition 0.80 wt.% of cerium
- TiO2 sol with addition 2.40 wt.% of cerium
- TiO2 sol with addition 4.10 wt.% of cerium.
Colloidal solutions were stirred vigorously for 2 h, and after that sonicated for 30 min. The prepared sols were deposited on borosilicate glass samples using a flow coating method. The samples were dried at 100 °C for 1 hr and heat-treated at 450 °C for 2 hrs at a heating rate of 3 °C min–1. The deposition process using the flow coating method was repeated three times for each colloidal solution. The flow chart for the preparation of Ce-TiO2 films using the sol-gel flow coating method is presented in Figure 1.
2.2. Characterization of Sol-Gel Ce-TiO2 Films
After the deposition of the sol-gel Ce-TiO2 films onto a glass substrate, the remaining amounts of colloidal solutions were dried at 60 °C for 24 h in order to produce dried gels. Some amount of the dried gels was used for the analysis by means of thermal gravimetry (TG) and differential scanning calorimetry (DSC). The remaining amount of the dried gels was calcined at a temperature of 450 °C for 2 h and prepared in the form of a powder. These synthesized powders were analyzed in terms of phase compositions as well as parameters and volume of unit cells of Ce-TiO2 samples by means of X-ray diffraction (XRD) using a D8 Advance Eco diffractometer ( Bruker, Billerica, USA) with CuKα radiation (l = 1.54055 A˚ ) at 40 kV and 25 mA. The thermal characterization of the two samples (TiO2 without the addition of cerium and TiO2 with the addition of 0.08 wt.% of cerium was carried out by means of simultaneous differential thermal and thermogravimetric analysis STA 409 (Netzsch , Selb, Germany).
2.3. Adsorption, Photolytic and Photocatalytic Experiments
For experiments (dark adsorption, photolysis, and photocatalysis), analytical grade ciprofloxacin (CIP, 98%, Acros Organics, Waltham, MA, USA) was used as the model organic micropollutant (OMP). Deionized water of ultrapure quality (electrical conductivity of 0.055 µS∙cm–1 at 25 °C) was used throughout the experiments. The solution of CIP (5 mg·L−1) was prepared by dissolving the appropriate amount of solid in ultrapure quality water. The photocatalytic activity of Ce-TiO2 films with 0.00, 0.08, 0.40, 0.80, 2.40 and 4.10 wt. % of Ce was evaluated through the degradation of CIP using the following radiation sources: UV-A lamp, model UVAHAND LED (Dr. Hönle AG, UV-Technologie, Gilching, Germany) (peak on 365 nm, 70 W) and solar light simulator (SLS) model SOL500 (Dr. Hönle AG, UV-Technologie, Gilching, Germany (430 W).
The photocatalytic activity of pure TiO2 and Ce-TiO2 films with different amounts of cerium was evaluated in a borosilicate glass reactor with a diameter of 95 mm, height of 55 mm, and volume of 250 mL with constant stirring of the investigated solution using a magnetic stirrer at 300 rpm. For the photocatalytic test, in each experiment, 4 glass plates with the photocatalytic film were put on the bottom of the reactor with 100 mL of the CIP solution (5 mg·L−1) as the model OMP and irradiated from above with lamps 20 cm away from the reactor. After that, the lamp was turned on and the suspension was irradiated for 2 hours. Samples were taken from the reactor at intervals (0, 10, 20, 30, 45, 60, 90, 105, and 120 min), filtered using a 0.45 µm mixed cellulose ester membrane filter, and directly analyzed by means of UV-Vis spectrophotometer (HEWLETT PACKARD, Model HP 8430, Palo Alto, CA, USA) at 273 nm (maximum absorption peak of CIP). Before irradiation, the solution was stirred for 15 minutes in the dark to ensure adsorption-desorption equilibrium, determined previously by the adsorption test. Also, the photolytic activity of the CIP solution was tested. Photolytic testing was carried out using the same process, but without adding the prepared photocatalyst films to the reactor.
Pseudo-first-order kinetic models were used to investigate the kinetics of photocatalytic degradation of CIP using the prepared Ce-TiO2 films. The linear form of the pseudo-first-order kinetic model is described by the following equation [28]:
where k (min−1) is the rate constant of the pseudo-first-order reaction of the photocatalytic decomposition of CIP, At is the absorbance of the CIP after irradiation at time, t (min) during the photocatalytic process, and A0 is the initial absorbance of the CIP.
The photocatalytic degradation efficiency (η, %) of the degradation of CIP by prepared photocatalysts was calculated according to the following equation [29]:
where A0 is the initial absorbance of the CIP, and At is the absorbance of the CIP at time t (min) during the photocatalytic process.
3. Results
3.1. Characterization of Photocatalysts
The thermal analysis was carried out in order to determine the mass loss of samples of nanostructured TiO2 powders and to monitor exothermic and endothermic reactions depending on the temperature. The analysis was carried out on two samples, TiO2 powder without the addition of Ce and with the addition of 0.08 wt.% Ce. A comparison of DSC/TG curves is shown in Figure 2. Changes were observed in the temperature interval from room temperature to 1000 °C. During the heating of both samples, there was an increase in their mass loss, which is characteristic for the thermal decomposition of amorphous gels.
Two mass losses can be observed from the curves for both samples. In the area of lower temperatures, mass loss occurs due to the release of solvent and chemisorbed water, while around medium temperatures, decomposition and combustion of hydroxyl groups (OH˙) and organic phases present in the samples occur. The total mass loss of the TiO2 sample without the addition of Ce is slightly higher than the mass loss of the TiO2 sample with the addition of 0.08 wt.% Ce. When samples are heated, processes occur that are accompanied by the release (exothermic reactions) or the receipt of heat (endothermic reactions), i.e., a decrease or increase in the temperature of the samples in relation to the reference material, which is recorded as minima and maxima on the DSC curves. Both samples (TiO2 and 0.08 wt. % Ce-TiO2) have an endothermic minimum and exothermic maximum. The endothermic minimum is attributed to the desorption and release of substances from the gel, such as adsorbed water and alcohol. The exothermic maximums are attributed to the desorption of hydroxyl groups and other organic phases and the crystallization of the anatase phase of titanium dioxide. In the case of the 0.08 wt.% Ce-TiO2 sample, a more complex course of thermal evolution with more pronounced multi-stage effects is visible, which is in accordance with the more complex composition of the precursor. In the case of the doped sample (0.08 wt.% Ce-TiO2), anatase crystallization is shifted towards higher temperatures. In conclusion, the samples basically do not differ in the early stage of solvent loss, but undoped samples went through more abrupt multistage exothermic events around 300°C. The composition probably allowed more significant auto-combustion behaviour during heating. Importantly, above 450°C the mass loss remains fairly constant (slightly less for the undoped sample), meaning the volatiles were removed. Only above 800°C the carbon remains are burned off resulting is additional slight mass loss.
XRD results point to crystallization of TiO2 predominatelly in anatase structure, however thtaces of rutile structure have been observed (Figure 3). Results of the XRD analysis of TiO2 samples with different amounts (wt.%) of Ce (0.00, 0.08, 0.40, 0.80, 2.40, and 4.10) are presented in Figure 3. Obtained results showed that 0.08 wt.%, Ce is easily incorporated into the TiO2 lattice. With further increase of Ce amount, the rutile phase is absent, and Ce incorporation into the TiO2 lattice significantly reduces. The crystallite size decreases linearly with increasing Ce content from 45.8 nm (pure TiO2) to 11.2 nm (TiO2 with 4.1 wt.% of Ce). In the samples with 2.40 wt.% Ce-TiO2 and 4.10 wt.% Ce-TiO2, there are barely any traces of the cerium oxide phase.
The amount of incorporated Ce in the TiO2 unit cell depends on the difference in the crystal radius of Ce4+ and Ti4+. From the values of the parameters and the volume of the unit cell (Figure 4), it can be seen that smaller amounts of cerium (up to 0.08 wt.%) can be easily incorporated into the unit cell of anatase while doping with Ce in amounts greater than 0.08 wt. % again leads to a decrease in parameter values and volume, which is a consequence of the difficulty of incorporating Ce4+ ions into the anatase unit cell. The radius of Ce4+ ions (0.092 nm) is much larger than the radius of Ti4+ ions (0.065 nm), so it is to be expected that a minimal amount of Ce4+ can be incorporated into the TiO2 lattice and that an increase in the amount of Ce will result in the crystallization of additional separated phases of cerium oxide [24]. This behavior of the system is in accordance with the qualitative diffraction analysis.
3.2. Photocatalytic Properties of TiO2 and Ce-TiO2 Films
The photoactivity of the TiO2 films with the different amounts (wt.%) Ce (0.00, 0.08, 0.40, 0.80, 2.40, and 4.10) was evaluated through the degradation of CIP aqueous solution (5 mg·L−1) under the UVA light (Figure 5A) and solar light simulator (Figure 5B). Figure 5 shows the kinetics of photolytic and photocatalytic degradation of CIP, i.e., the dependence of the change in the relative absorbance value (A/A0) versus time (t, min). Before the photocatalytic test, dark adsorption (D. A.) was performed (Figure 5A and 5B). The initial pH of the CIP solution was in the range of 6.3 – 6.5; after the experiments (adsorption, photolysis, and photocatalysis), the pH values were kept the same. Dark adsorption of ciprofloxacin on TiO2 and Ce-TiO2 films was negligible. The best photocatalytic properties were achieved by TiO2 film doped with 0.08 wt. % of Ce by UV-A (365 nm) and solar light simulator radiation. For all Ce-TO2 films, better photocatalytic properties were achieved by solar light simulator radiation compared to UV-A (365 nm) radiation.
The photolytic and photocatalytic data are described using the pseudo-first-order model. The pseudo-first-order rate constant k from Eq. (1) is evaluated through the linear regression of -ln (A/A0) versus t (Figure 6). The pseudo-first-order model describes a process in which the degradation rate is mainly affected by changes in pollutant concentration [30].
The kinetic constant for the pseudo-first-order is obtained from the slope of the plot of -ln (A/A0) versus the irradiation time (Figure 6).
Calculated values of the pseudo-first-order (k, min–1), the half-life (t1/2, min), and the removal efficiencies of Ce-TiO2 films are listed in Table 1. The pseudo-first-order model shows that under the UV and solar light, the correlation coefficient (R2) in all cases has a value above 0.98, indicating that the pseudo-first model describes both experimental degradation processes (photocatalytic and photolytic) well. A comparisons of the obtained values of pseudo-first-order (k, min–1) and removal efficiencies (η, %) for all experimental conditions are presented in Figure 7A and 7B, respectively. From the photocatalytic tests, it can be seen that the TiO2 film with the least addition of Ce (0.08 wt.%) has the highest photocatalytic efficiency and the highest CIP degradation rate constant for both radiation sources (Figure 7 and Table 1). By comparing the photocatalytic activity of the same films with both radiation sources, it can be observed that a higher photocatalytic efficiency and a higher degradation rate constant were achieved by applying solar light simulator radiation.
Martins et al. prepared Au/TiO2 nanocomposite (Au loading ranging from 0.025 to 0.5 wt.%) for photocatalytic degradation of CIP (5mg·L−1) under UV and simulated visible light. Reaction rate constants varied from 0.047 to 0.131 min−1 for different Au loading over 30 minutes of UV irradiation, while apparent reaction rates over 180 minutes of visible light irradiation varied from 0.073 to 0.242 min−1 for different Au loading [31].
To overcome the separation process of photocatalyst, Hassani et al. employed the immobilization of TiO2 onto montmorillonite for the degradation of 20 mg·L−1 ciprofloxacin. In contrast to suspended TiO2, which degraded only 57% (with a rate constant of 0.0063 min−1), the immobilized TiO2 exhibited accelerated degradation (0.0069 min−1) and achieved up to 62% degradation within 2 hours [32].
Malakootian et al. also immobilized TiO2 nanoparticles on a glass plate for photocatalytic degradation of CIP (5mg·L−1) under UV light. The reaction rate constant was 0.0193 min−1, and removal efficiency was around 60% after 60 minutes of irradiation [33].
Different light sources as well as metal and non-metal doping of TiO2 were widely investigated by numerous scientists for the degradation of ciprofloxacin. Their results are summarized by Imam et al. [34].
4. Conclusions
This paper presents the results of the photolytic and photodegradation process of a diazo CIP aqueous solution in the presence of Ce-TiO2 films under UV-A (365 nm) and solar light simulator radiation. Six sol-gel TiO2 films with different amounts of Ce (0.00, 0.08, 0.40, 0.80, 2.40, and 4.10 wt.%) were deposited on a glass substrate by a flow coating method.
The crystallite size, as well as phase composition are changed by changing the amount of Ce in TiO2 samples.
These results indicate that the photocatalytic properties of sol-gel TiO2 films depend on the amount of added Ce.
The mechanisms of photocatalytic oxidation of the CIP by sol-gel TiO2 films were described by a pseudo-first-order kinetic model. The obtained values of the determination coefficient R2 (all values were above 0.98) indicate that the pseudo-first-order rate is suitable for describing the photodegradation process of CIP photocatalytic degradation with sol-gel Ce-TiO2 films as the photocatalyst.
It was found that sol-gel TiO2 film with the least addition of Ce (0.08 wt.%) has the highest photocatalytic efficiency and the highest CIP degradation rate constant for both radiation sources. Comparing the photocatalytic activity of the same films with both radiation sources, it can be concluded that applying solar light simulator radiation achieved a higher photocatalytic efficiency and a higher degradation rate constant. This could be used for further use of natural solar radiation in real wastewater treatment plants for degradation of OMPs.
Author Contributions
Conceptualization, L.Ć., D.Lj. and D.B.; methodology, L.Ć., D.Lj. and D.B.; software, L.Ć., D.Lj., V.M., D.B. and I.G.; validation, , L.Ć., D.Lj., V.M., D.B. and I.G.; formal analysis, D.B., V.M. and I.G.; investigation, D.B.; resources, L.Ć., D.Lj. and V.M.; data curation, L.Ć., D.Lj., V.M., D.B. and I.G.; writing—original draft preparation, L.Ć., D.B., D.Lj. and I.G.; writing—review and editing, , L.Ć., D.Lj., V.M., D.B. and I.G.; visualization, , L.Ć., D.Lj., V.M., D.B. and I.G.; supervision, D.Lj. and L.Ć.; project administration, L.Ć., and D.Lj.; funding acquisition, L.Ć., and D.Lj. All authors have read and agreed to the published version of the manuscript.
Funding
This work was funded by the Croatian Science Foundation under the project [IP-2016-06-6000]: Monolithic and Composite Advanced Ceramics for Wear and Corrosion Protection (WECOR).
Data Availability Statement
The data presented in this study are available upon reasonable request from the corresponding author.
Conflicts of Interest
The authors declare no conflict of interest.
References
- Čizmić, M.; Ljubas, D.; Rožman, M.; Ašperger, D.; Ćurković, L. , Babić, S. Photocatalytic Degradation of Azithromycin by Nanostructured TiO2 Film: Kinetics, Degradation Products, and Toxicity. Materials 2019, 12, 873. [Google Scholar] [CrossRef]
- Ljubas, D.; Čizmić, M.; Vrbat, K.; Stipaničev, D.; Repec, S.; Ćurković, L.; et al. Albendazole Degradation Possibilities by UV-Based Advanced Oxidation Processes. Int. J. Photoenergy. 2018, 6, 6181747. [Google Scholar] [CrossRef]
- Santos, L.H.M.L.M.; Araújo, A.N.; Fachini, A.; Pena, A.; Delerue-Matos, C.; Montenegro, M.C.B.S.M. Ecotoxicological aspects related to the presence of pharmaceuticals in the aquatic environment. J. Hazard. Mater. 2010, 175, 45–95. [Google Scholar] [CrossRef]
- Babić, S.; Zrnčić, M.; Ljubas, D.; Ćurković, L.; Škorić, I. Photolytic and thin TiO2 film assisted photocatalytic degradation of sulfamethazine in aqueous solution. Environ. Sci. Pollut. Res. 2015, 22, 11372–11386. [Google Scholar] [CrossRef]
- Etacheri, V.; Di Valentin, C.; Schneider, J.; Bahnemann, D.; Pillai, S.C. Visible-light activation of TiO2 photocatalysts: Advances in theory and experiments. J. Photoch. Photobio. C 2015, 25, 1–29. [Google Scholar] [CrossRef]
- Teh, C.M.; Mohamed, A.R. Roles of titanium dioxide and ion-doped titanium dioxide on photocatalytic degradation of organic pollutants (phenolic compounds and dyes) in aqueous solutions: A review. J. Alloy. Compd. 2011, 509, 1648–1660. [Google Scholar] [CrossRef]
- Čizmić, M.; Ljubas, D.; Ćurković, L.; Škorić, I.; Babić, S. Kinetics and degradation pathways of photolytic and photocatalytic oxidation of the anthelmintic drug praziquantel. J. Hazard. Mater. 2017, 323, 500–512. [Google Scholar] [CrossRef]
- Cerrato, E.; Gaggero, E.; Calza, P.; Paganini, M.C. The role of Cerium, Europium and Erbium doped TiO2 photocatalysts in water treatment: A mini-review. Chem. Eng. J. 2022, 10, 100268. [Google Scholar] [CrossRef]
- Shan, A.Y.; Ghazi, T.I.M.; Rashid, S.A. Immobilisation of titanium dioxide onto supporting materials in heterogeneous photocatalysis: A review. Appl. Catal. A-Gen. 2010, 389, 1–8. [Google Scholar] [CrossRef]
- Umar, K.; Aris, A.; Ahmad, H.; Parveen, T.; Jaafar, J.; Majid, Z.A.; et al. Synthesis of visible light active doped TiO2 for the degradation of organic pollutants—methylene blue and glyphosate. J. Anal. Sci. Technol. 2016, 7, 29. [Google Scholar] [CrossRef]
- Lan, Y.; Lu, Y.; Ren, Z. Mini review on photocatalysis of titanium dioxide nanoparticles and their solar applications. Nano Energy. 2013, 2, 1031–1045. [Google Scholar] [CrossRef]
- Marami, M.B.; Farahmandjou, M. Water-Based Sol–Gel Synthesis of Ce-Doped TiO2 Nanoparticles. J. Electron. Mater. 2019, 48, 4740–4747. [Google Scholar] [CrossRef]
- Li, G.; Zou, B.; Feng, S.; Shi, H.; Liao, K.; Wang, Y.; et al. Synthesis of N-Doped TiO2 with good photocatalytic property. Phys. B: Condens. Matter. 2020, 588, 412184. [Google Scholar] [CrossRef]
- Yan, J.; Zhao, J.; Hao, L.; Hu, Y.; Liu, T.; Guan, S.; et al. Low-temperature S-doping on N-doped TiO2 films and remarkable enhancement on visible-light performance. Mater. Res. Bull. 2019, 120, 110594. [Google Scholar] [CrossRef]
- Mahmoudian-Boroujerd, L.; Karimi-Jashni, A.; Hosseini, S.N.; Paryan, M. Optimization of rDNA degradation in recombinant Hepatitis B vaccine production plant wastewater using visible light excited Ag-doped TiO2 nanophotocatalyst. Process Saf. Environ. Prot. 2019, 122, 328–338. [Google Scholar] [CrossRef]
- Kayani, Z.N.; Maria; Riaz, S. ; Naseem, S. Magnetic and antibacterial studies of sol-gel dip coated Ce doped TiO2 thin films: Influence of Ce contents. Ceram. Int. 2020, 46, 381–390. [Google Scholar] [CrossRef]
- Contreras-García, M.E.; García-Benjume, M.L.; Macías-Andrés, V.I.; Barajas-Ledesma, E.; Medina-Flores, A.; Espitia-Cabrera, M.I. Synergic effect of the TiO2-CeO2 nanoconjugate system on the band-gap for visible light photocatalysis. Mater. Sci. Eng.: B. 2014, 183, 78–85. [Google Scholar] [CrossRef]
- Abdullah, H.; Khan, M.R.; Pudukudy, M.; Yaakob, Z.; Ismail, N.A. CeO2-TiO2 as a visible light active catalyst for the photoreduction of CO2 to methanol. J. Rare Earths. 2015, 33, 1155–1161. [Google Scholar] [CrossRef]
- Sun, P.; Liu, L.; Cui, S.C. , Liu, J.G. Synthesis, Characterization of Ce-doped TiO2 Nanotubes with High Visible Light Photocatalytic Activity. Catal. Lett. 2014, 144, 2107–2113. [Google Scholar] [CrossRef]
- Choudhury, B.; Borah, B.; Choudhury, A. Extending Photocatalytic Activity of TiO2 Nanoparticles to Visible Region of Illumination by Doping of Cerium. Photochem. Photobiol. 2012, 88, 257–264. [Google Scholar] [CrossRef] [PubMed]
- Chen, F.; Ho, P.; Ran, R.; Chen, W.; Si, Z.; Wu, X.; et al. Synergistic effect of CeO2 modified TiO2 photocatalyst on the enhancement of visible light photocatalytic performance. J. Alloy. Compd. 2017, 714, 560–566. [Google Scholar] [CrossRef]
- Shaari, N.; Tan, S.H.; Mohamed, A.R. Synthesis and characterization of CNT/Ce-TiO2 nanocomposite for phenol degradation. J. Rare Earths 2012, 30, 651–658. [Google Scholar] [CrossRef]
- Lee, J.Y.; Choi, J.H. Sonochemical Synthesis of Ce-doped TiO2 Nanostructure: A Visible-Light-Driven Photocatalyst for Degradation of Toluene and O-Xylene. Materials 2019, 12, 1265. [Google Scholar] [CrossRef] [PubMed]
- Cao, X.P.; Li, D.; Jing, W.H.; Xing, W.H.; Fan, Y.Q. Synthesis of visible-light responsive C, N and Ce co-doped TiO2 mesoporous membranes via weak alkaline sol–gel process. J. Mater. Chem. 2012, 22, 15309–15315. [Google Scholar] [CrossRef]
- Šegota, S.; Ćurković, L.; Ljubas, D.; Svetlicic, V.; Houra, I.; Tomasic, N. Synthesis, characterization and photocatalytic properties of Sol-gel TiO2 films. Ceram. Int. 2011, 37, 1153–1160. [Google Scholar] [CrossRef]
- Ćurković, L.; Ljubas, D.; Šegota, S.; Bačić, I. Photocatalytic degradation of Lissamine Green B dye by using nanostructured sol–gel TiO2 films. J. Alloy. Compd. 2014, 604, 309–316. [Google Scholar] [CrossRef]
- Švagelj, Z.; Mandić, V.; Ćurković, L.; Biošić, M.; Žmak, I.; Gaborardi, M. Titania-Coated Alumina Foam Photocatalyst for Memantine Degradation Derived by Replica Method and Sol-Gel Reaction. Materials 2020, 13, 227. [Google Scholar] [CrossRef]
- Sanchez Tobon, C.; Ljubas, D.; Mandić, V.; Panžić, I.; Matijašić, G.; Ćurković, L. Microwave-Assisted Synthesis of N/TiO2 Nanoparticles for Photocatalysis under Different Irradiation Spectra. Nanomaterials 2022, 12, 1473. [Google Scholar] [CrossRef]
- Gabelica, I.; Ćurković, L.; Mandić, V.; Panžić, I.; Ljubas, D.; Zadro, K. Rapid Microwave-Assisted Synthesis of Fe3O4/SiO2/TiO2 Core-2-Layer-Shell Nanocomposite for Photocatalytic Degradation of Ciprofloxacin. Catalysts 2021, 11, 1136. [Google Scholar] [CrossRef]
- Ngo, H.S.; Nguyen, T.L.; Tran, N.T.; Le, H.C. Experimental Study on Kinetics and Mechanism of Ciprofloxacin Degradation in Aqueous Phase Using Ag-TiO2/rGO/Halloysite Photocatalyst. Catalysts 2023, 13, 225. [Google Scholar] [CrossRef]
- Martins, P.; Kappert, S.; Nga Le, H.; Sebastian, V.; Kühn, K.; Alves, M.; et al. Enhanced Photocatalytic Activity of Au/TiO2 Nanoparticles against Ciprofloxacin. Catalysts 2020, 10, 234. [Google Scholar] [CrossRef]
- Hassani, A.; Khataee, A.; Karaca, S.; Fathinia, M. Heterogeneous photocatalytic ozonation of ciprofloxacin using synthesized titanium dioxide nanoparticles on a montmorillonite support: parametric studies, mechanistic analysis and intermediates identification. RSC Adv. 2016, 6, 87569–87583. [Google Scholar] [CrossRef]
- Malakootian, M.; Nasiri, A.; Amiri Gharaghani, M. Photocatalytic degradation of ciprofloxacin antibiotic by TiO2 nanoparticles immobilized on a glass plate. Chem. Eng. Commun. 2020, 207, 56–72. [Google Scholar] [CrossRef]
- Shehu Imam, S.; Adnan, R.; Mohd Kaus, N.H. Photocatalytic degradation of ciprofloxacin in aqueous media: a short review. Toxicol. Environ. Chem. 2018, 100, 518–539. [Google Scholar] [CrossRef]
Figure 1.
Flow chart for the preparation of Ce-TiO2 films by sol-gel flow coating method.
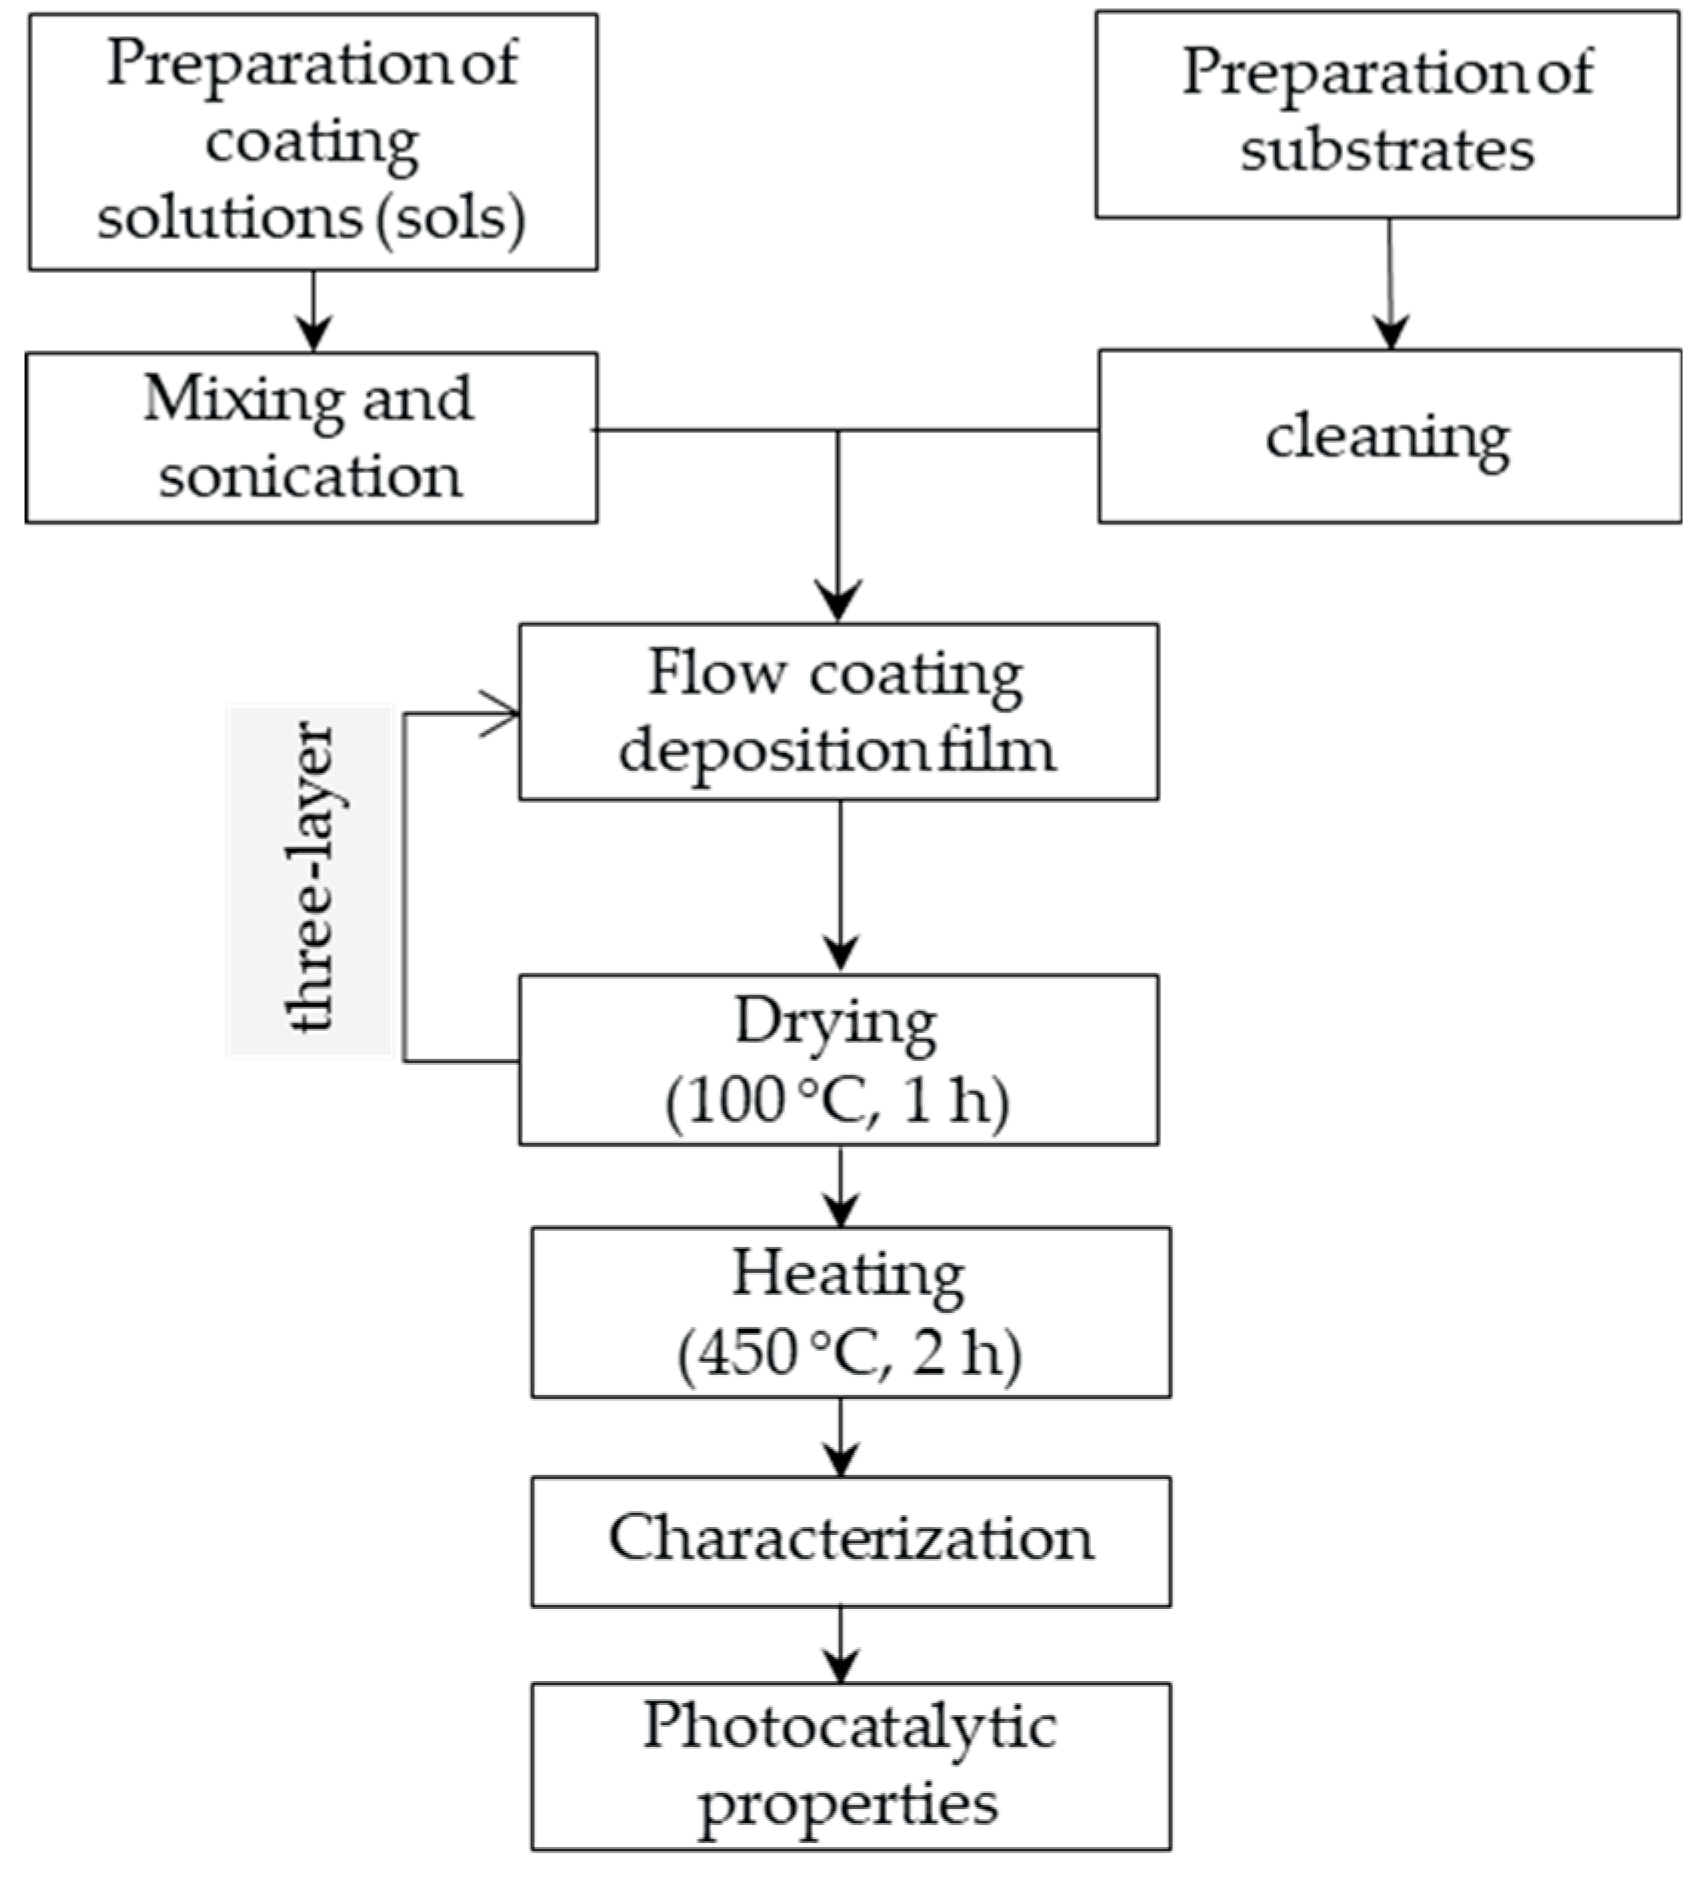
Figure 2.
DSC/TG curves for TiO2 without addition Ce (purple line) and TiO2 with addition of 0.08 wt.% Ce (blue line).
Figure 2.
DSC/TG curves for TiO2 without addition Ce (purple line) and TiO2 with addition of 0.08 wt.% Ce (blue line).
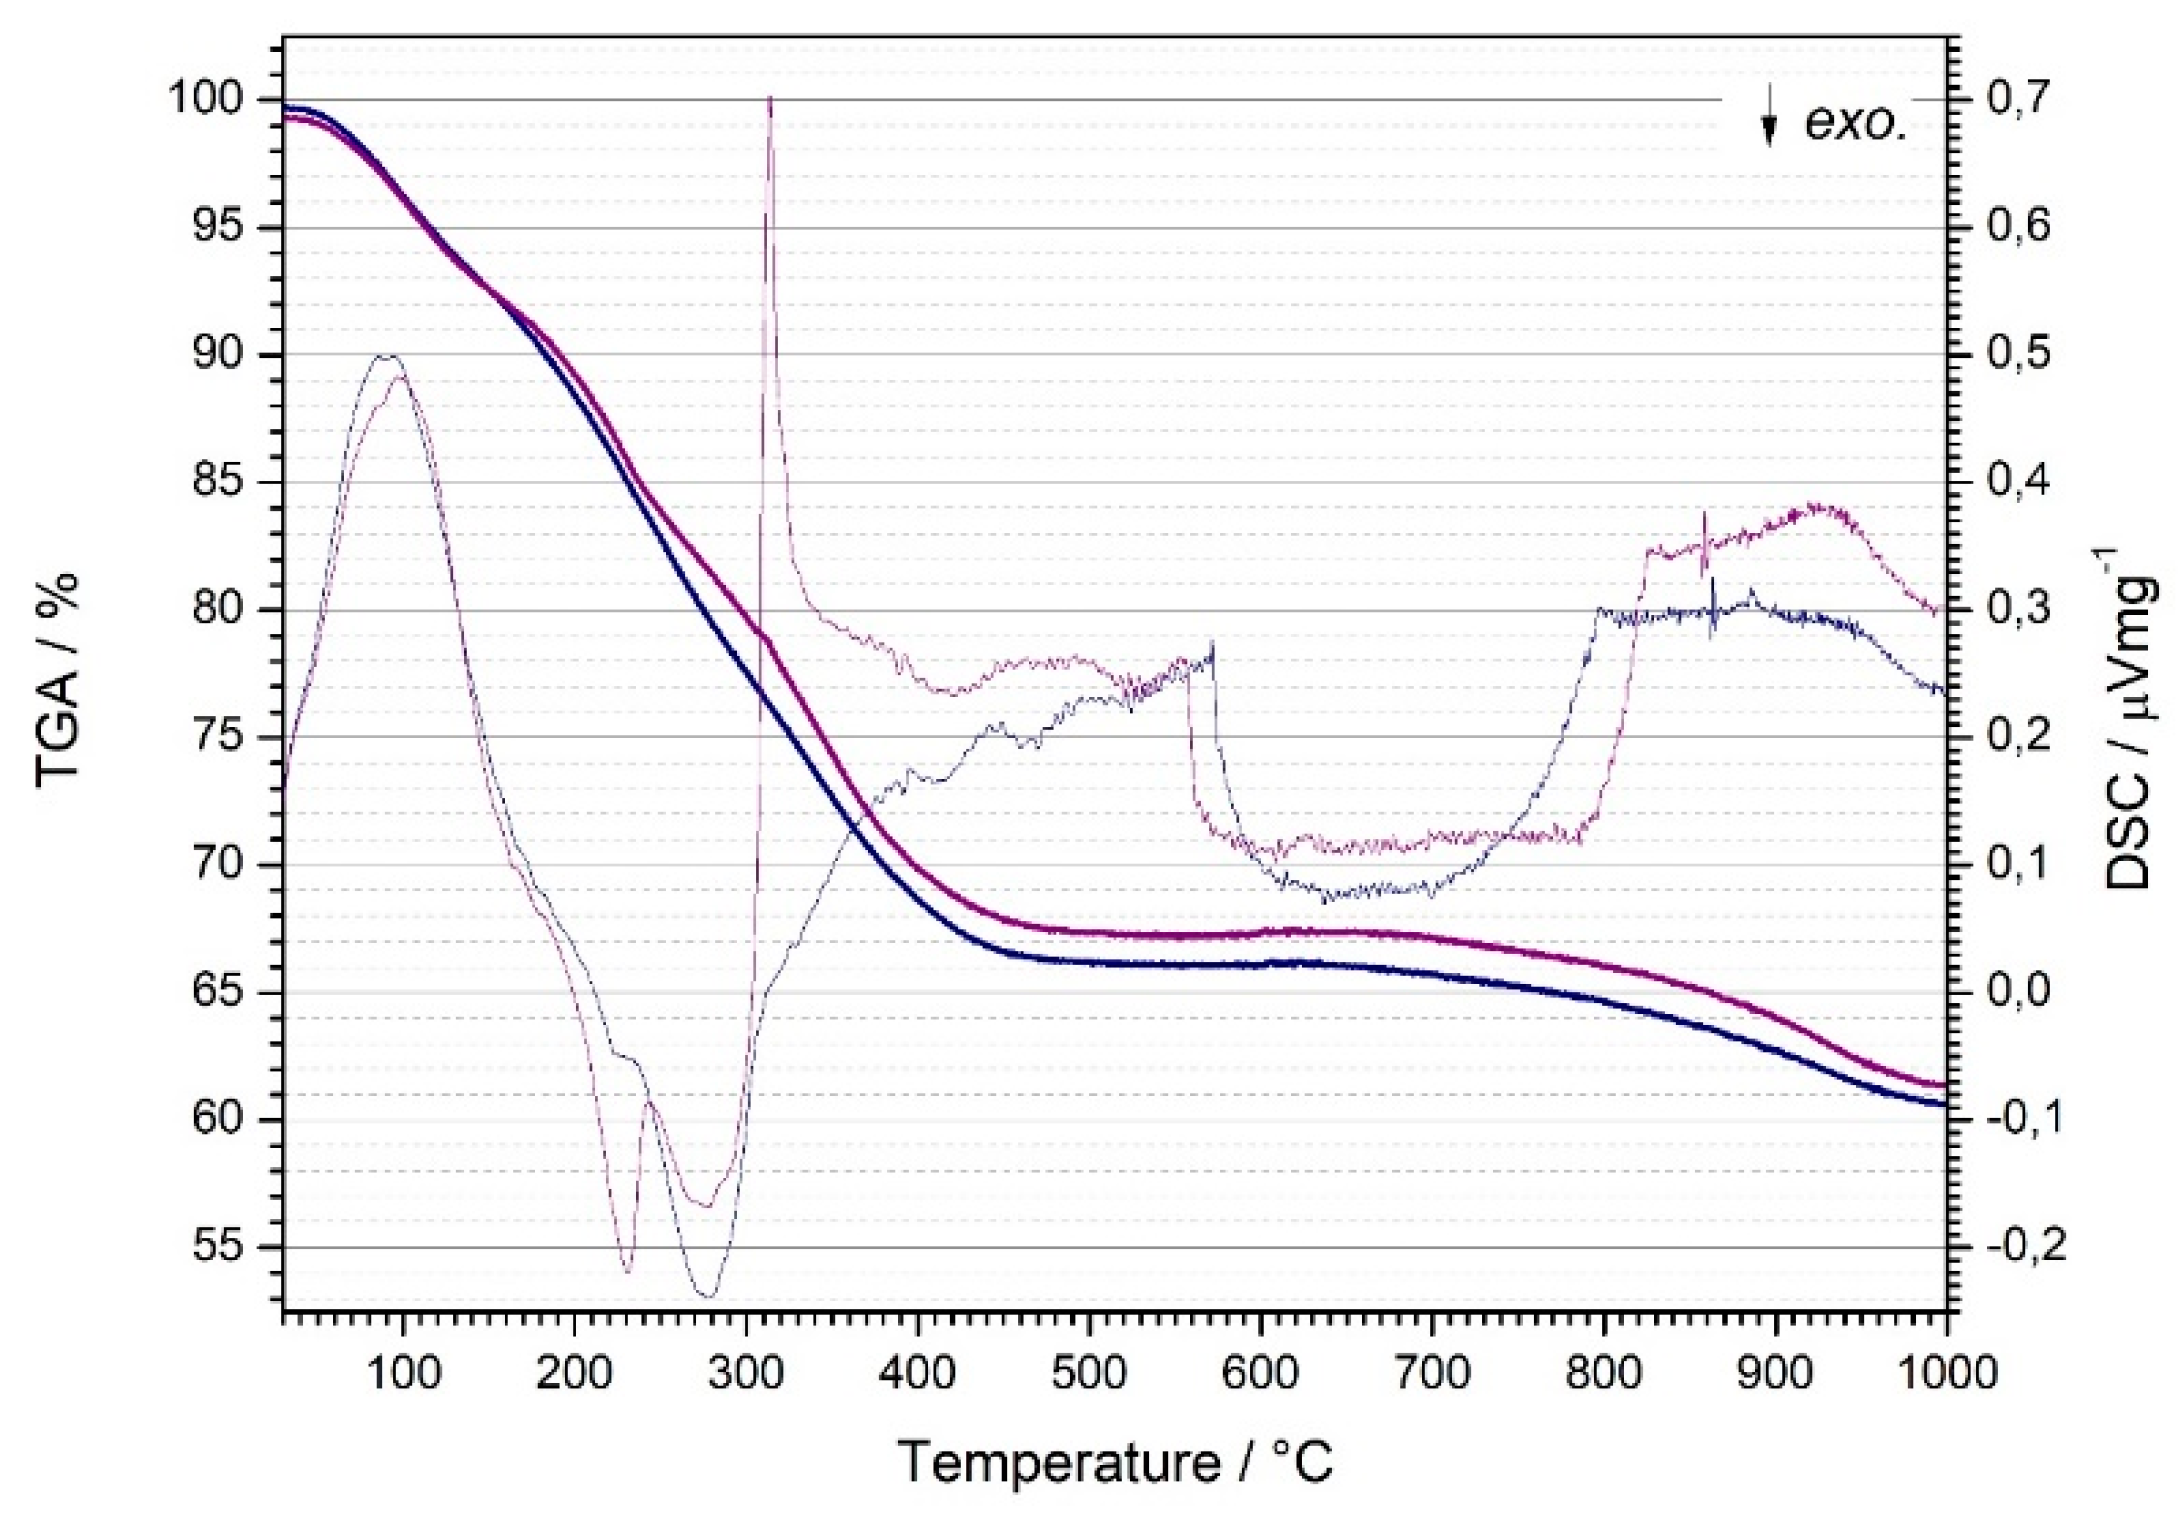
Figure 3.
X-ray diffraction patterns and crystallite size TiO2 samples with different amounts (wt. %) of Ce: 0.00, 0.08, 0.40, 0.80, 2.40, and 4.10.
Figure 3.
X-ray diffraction patterns and crystallite size TiO2 samples with different amounts (wt. %) of Ce: 0.00, 0.08, 0.40, 0.80, 2.40, and 4.10.
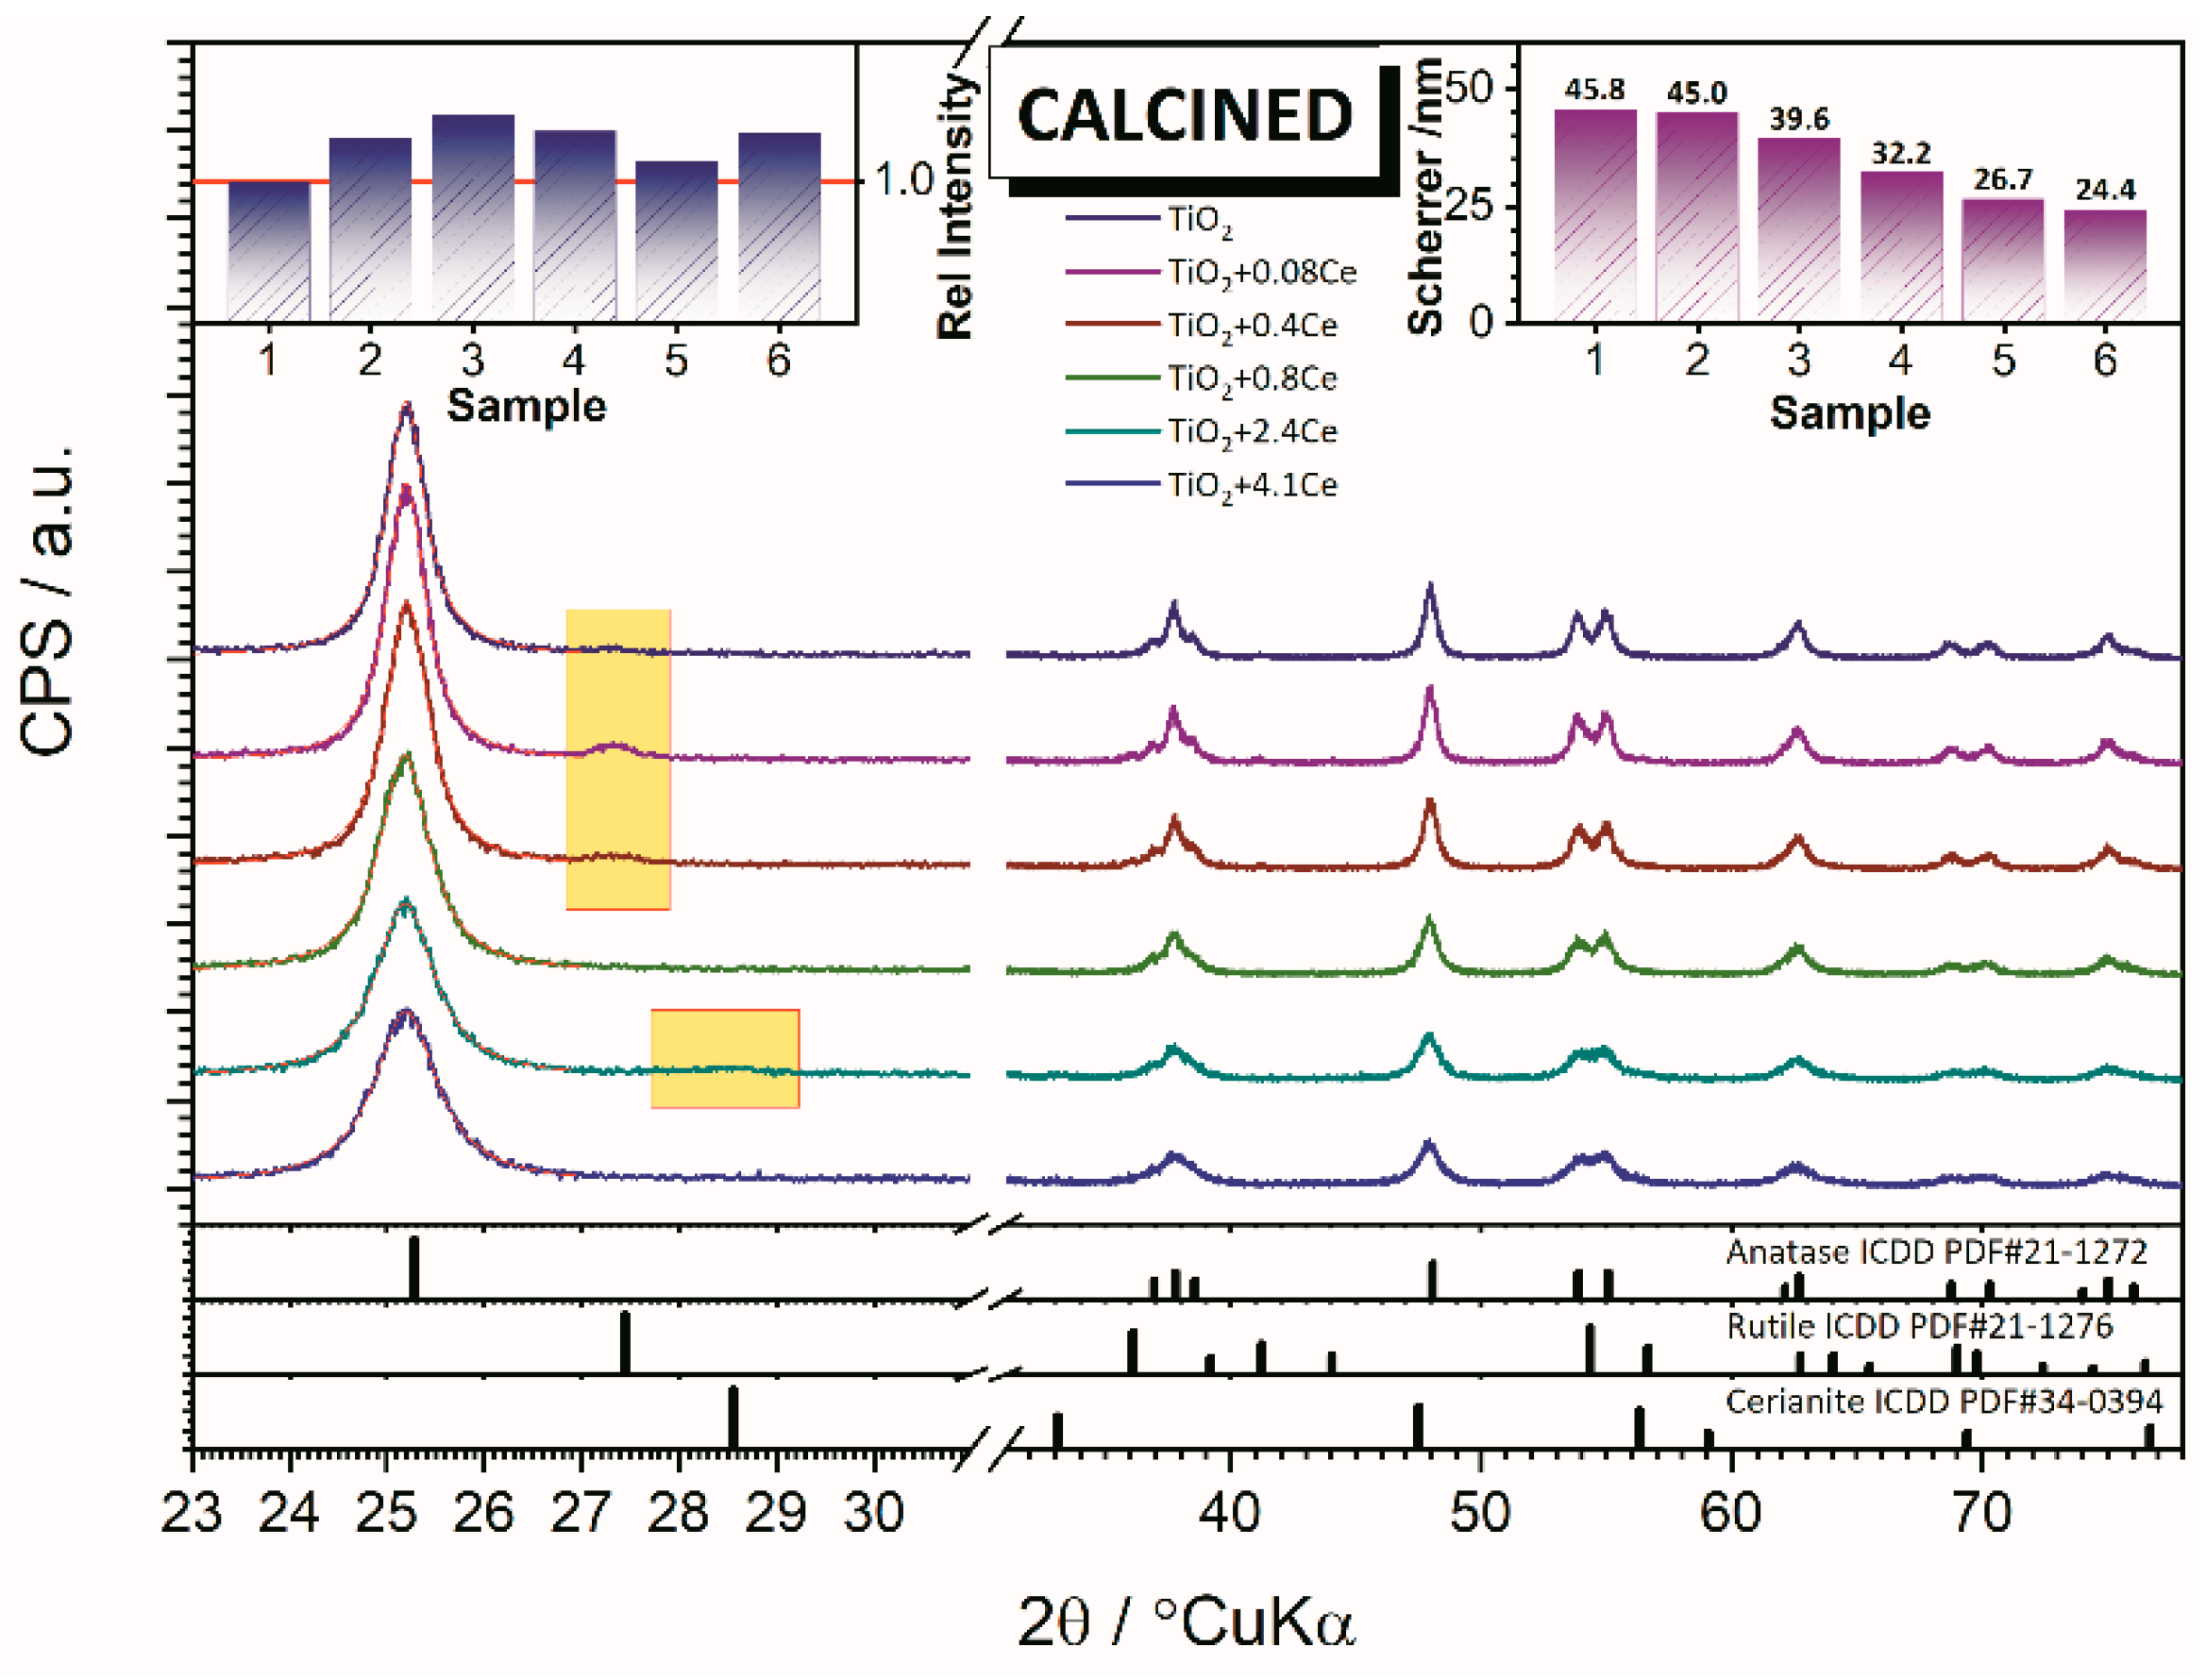
Figure 4.
Parameters and volume of unit cells of TiO2 samples with different amounts (wt. %) of Ce: 0.00, 0.08, 0.40, 0.80, 2.40, and 4.10.
Figure 4.
Parameters and volume of unit cells of TiO2 samples with different amounts (wt. %) of Ce: 0.00, 0.08, 0.40, 0.80, 2.40, and 4.10.
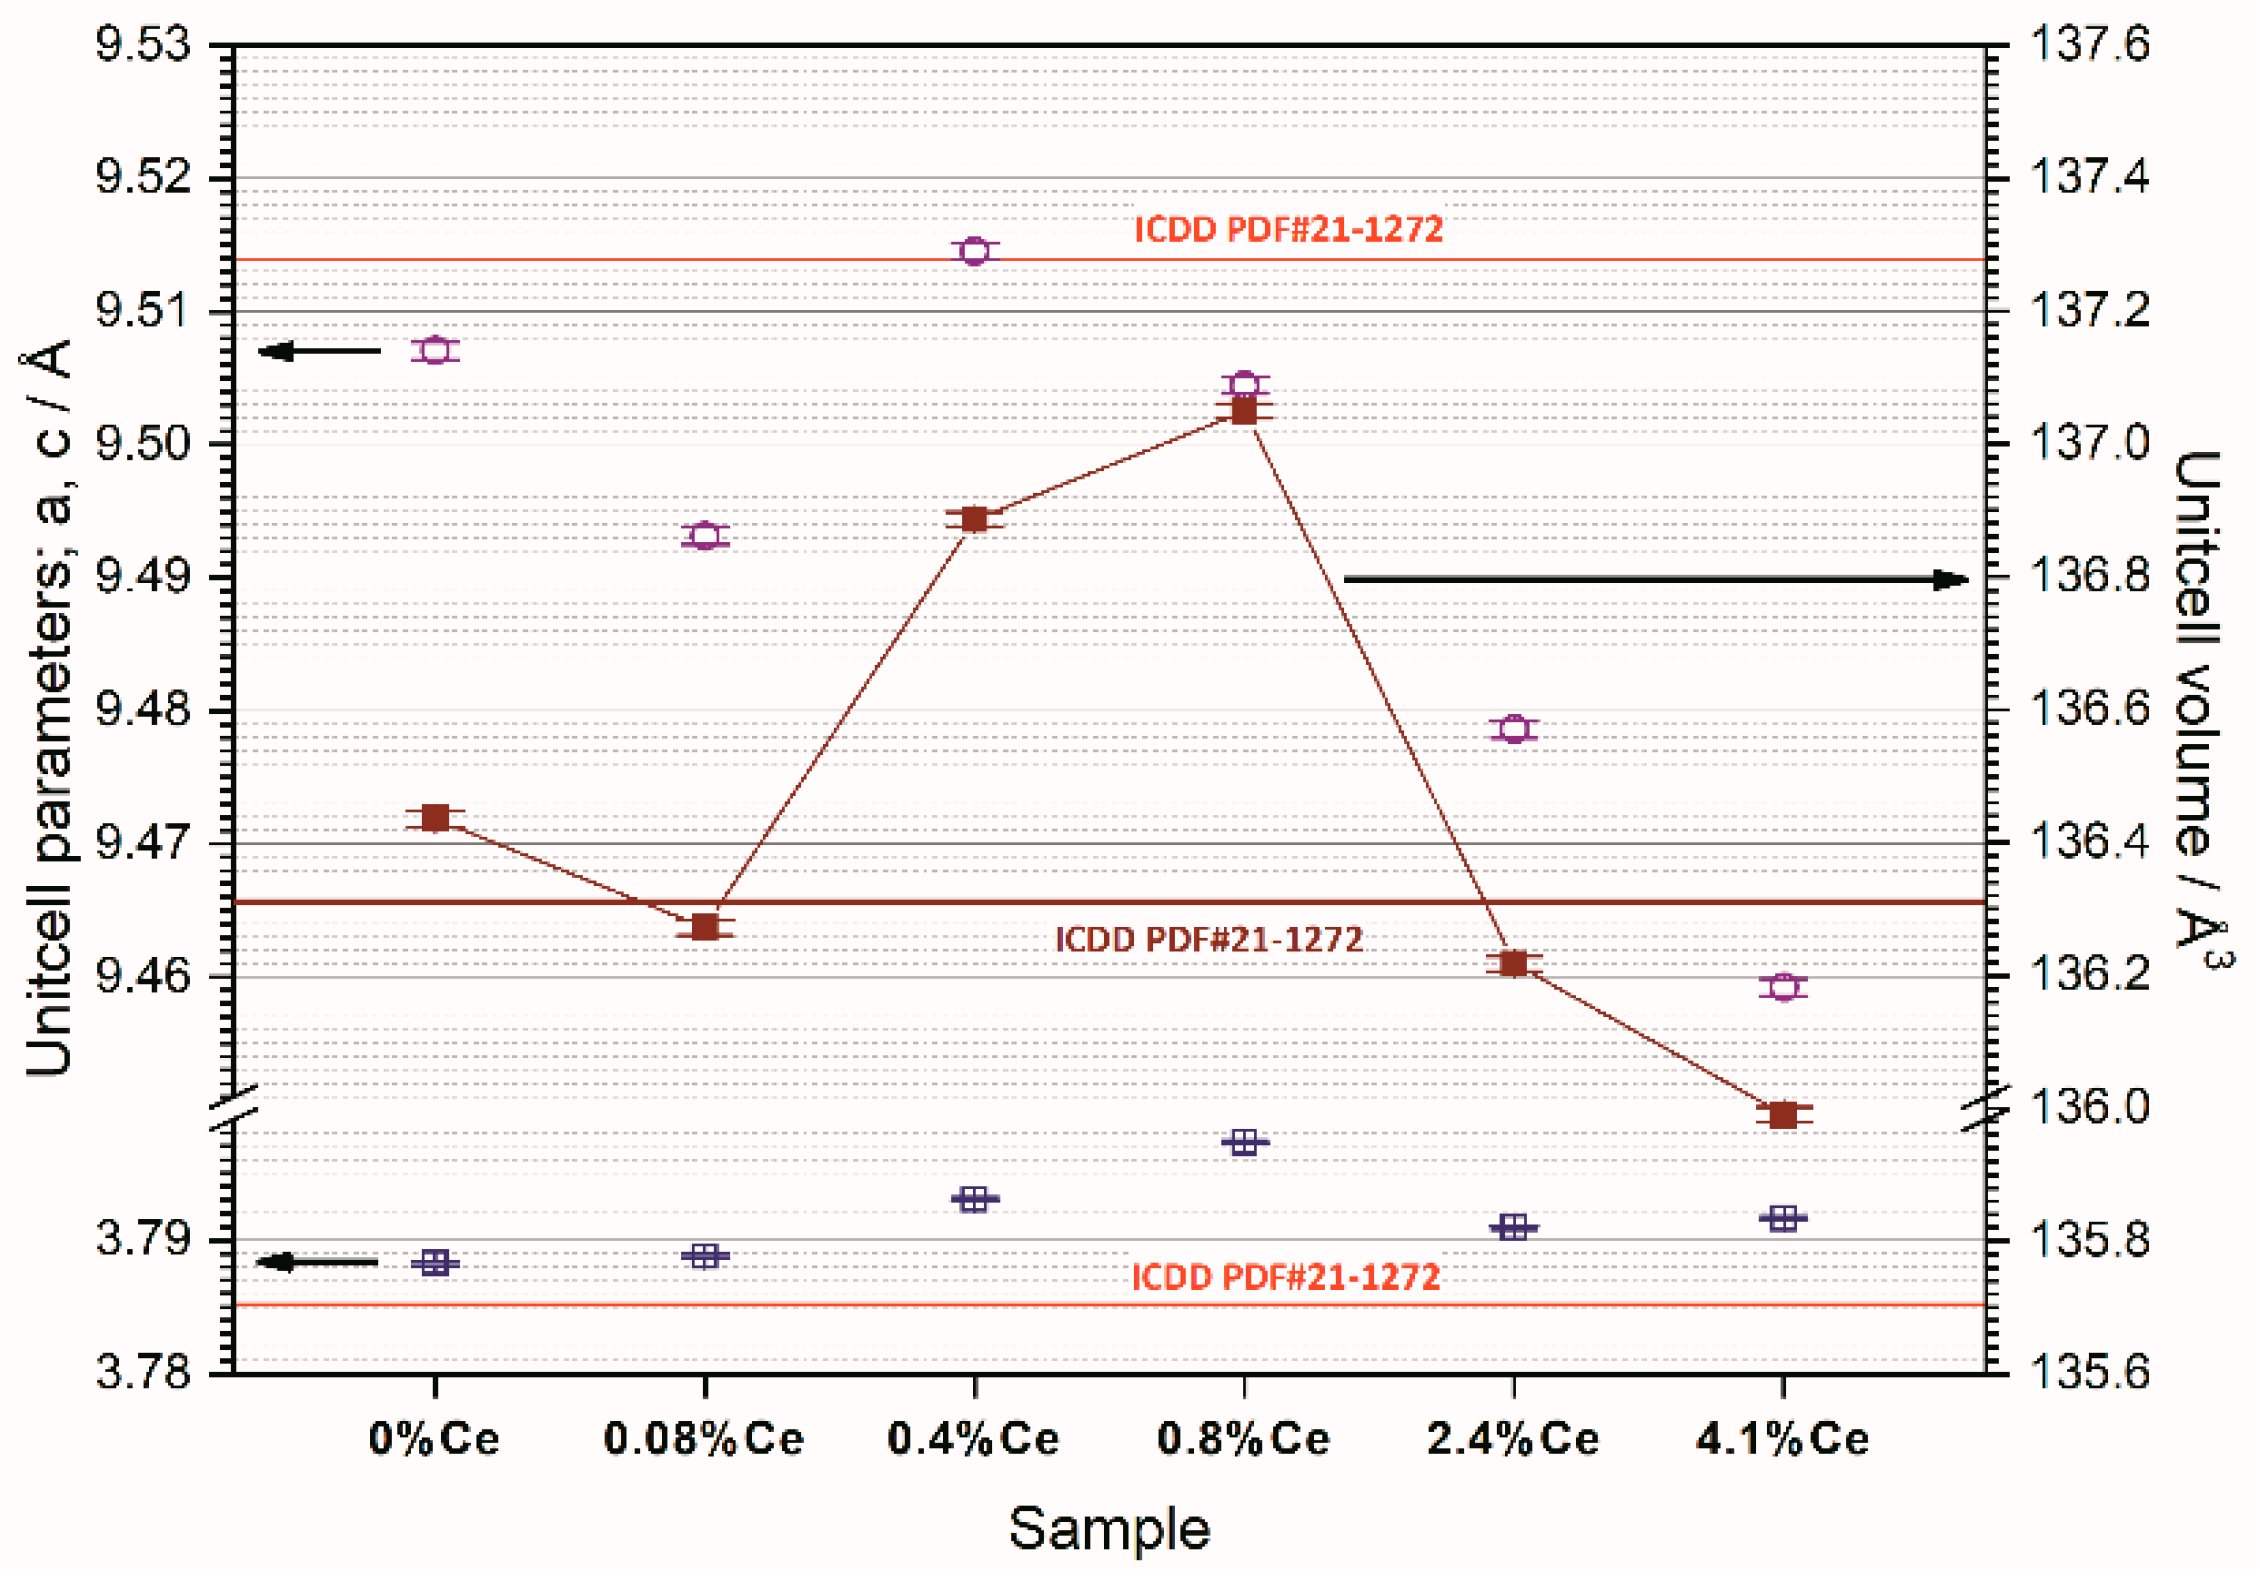
Figure 5.
Photolytic and photocatalytic degradation of CIP under (A) UV-A (365 nm) and (B) solar light simulator radiation by sol-gel Ce-TiO2 films as a function of irradiation time, γ0 (CIP) = 5 mg·L−1.
Figure 5.
Photolytic and photocatalytic degradation of CIP under (A) UV-A (365 nm) and (B) solar light simulator radiation by sol-gel Ce-TiO2 films as a function of irradiation time, γ0 (CIP) = 5 mg·L−1.
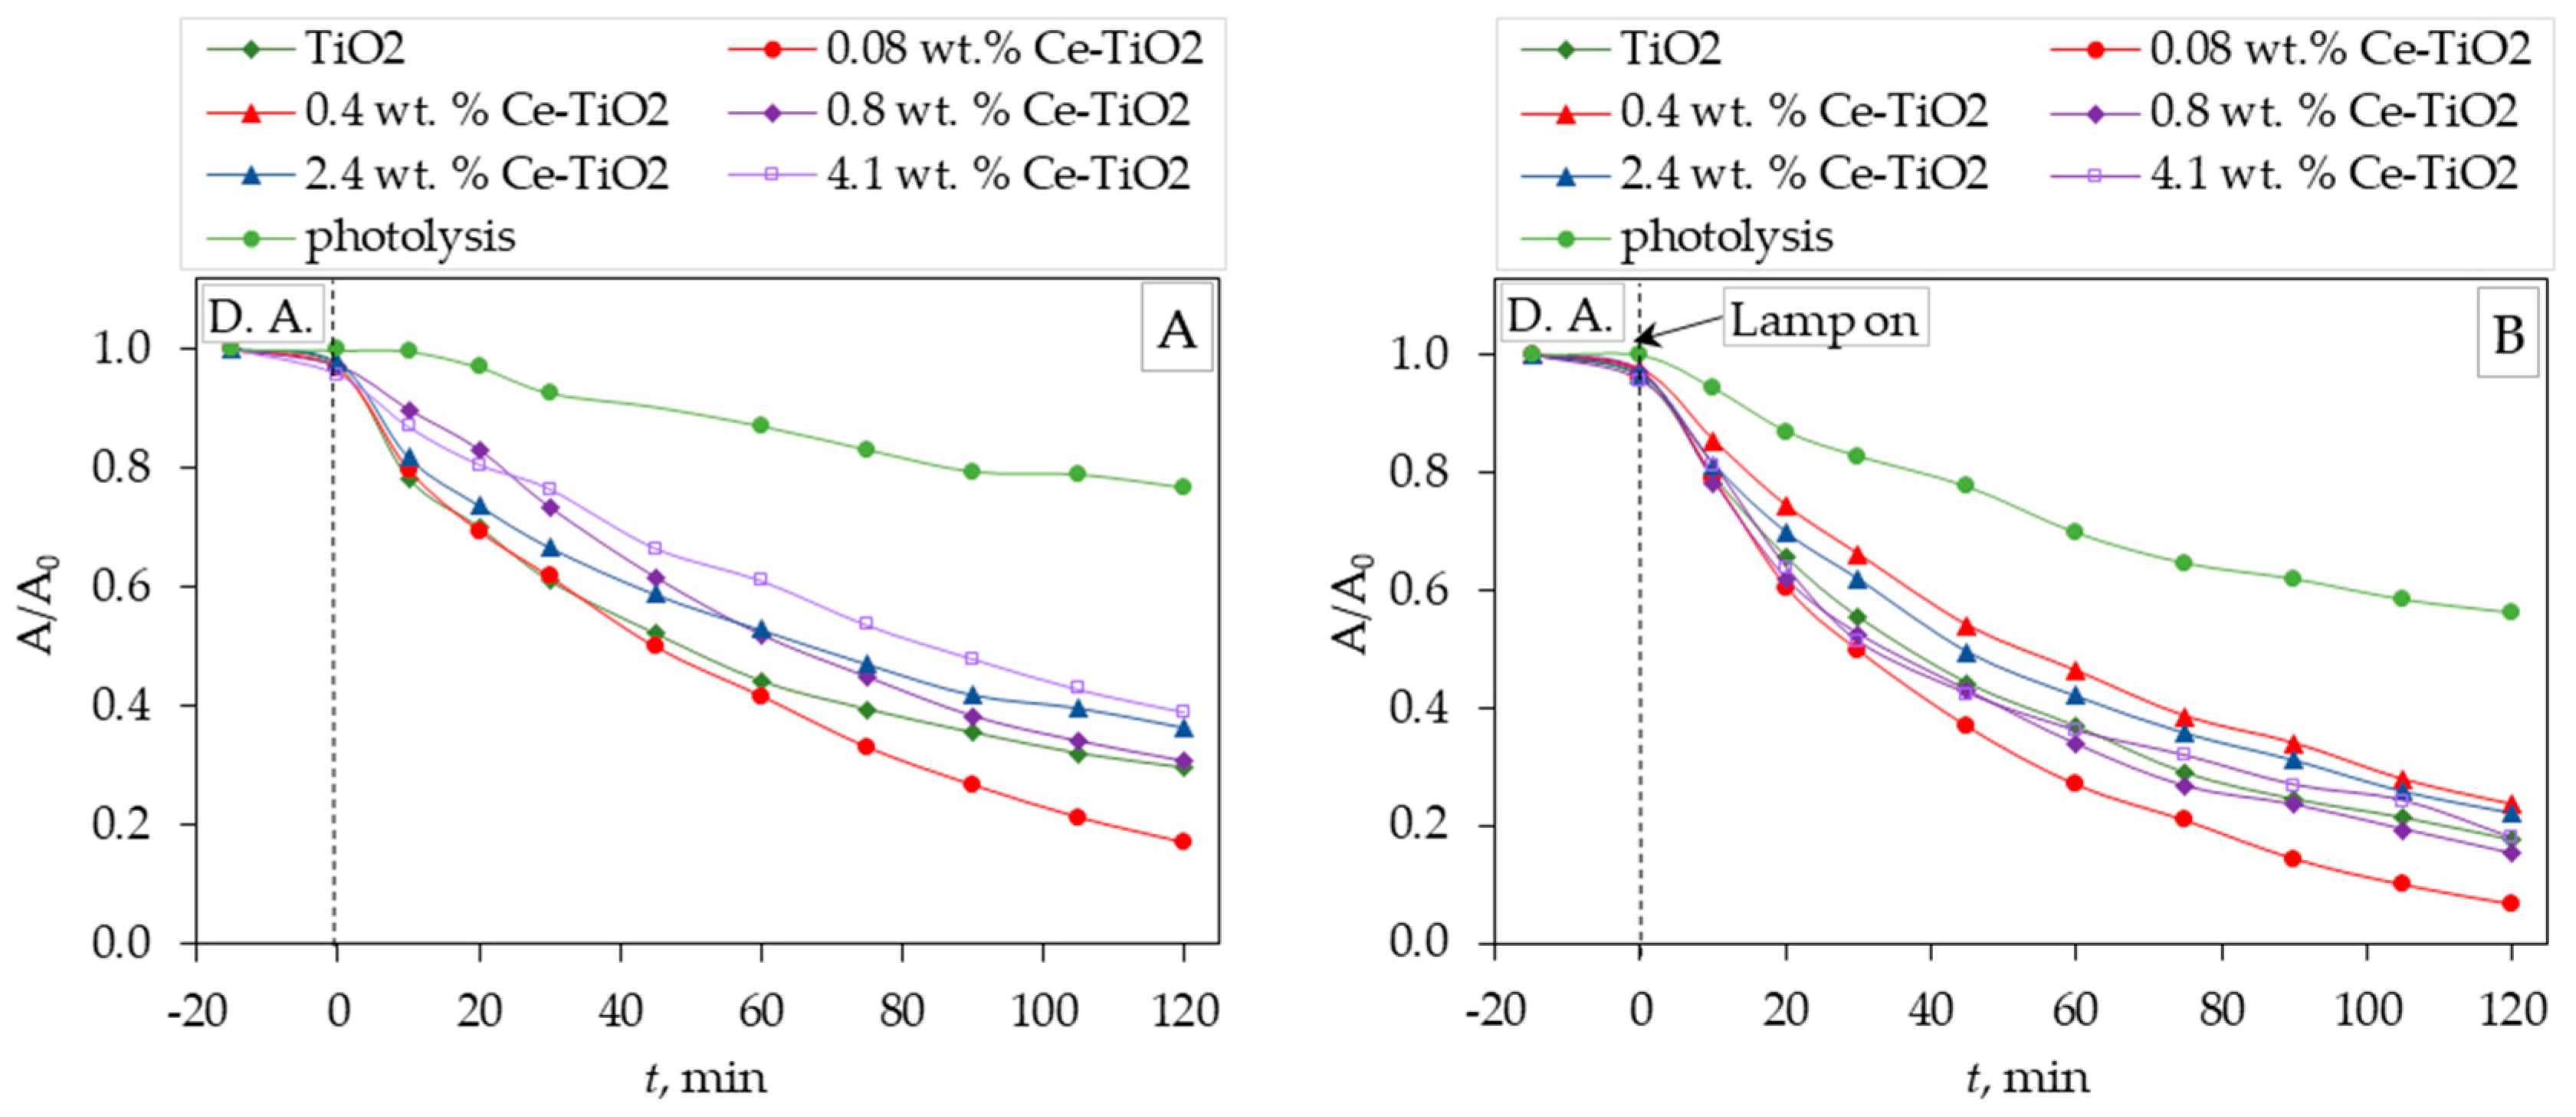
Figure 6.
Linear transform of −ln (A/A0) versus t of photolytic and photocatalytic degradation of CIP under (A) UV-A (365 nm) and (B) solar light simulator radiation by sol-gel Ce-TiO2 films, γ0 (CIP) = 5 mg·L−1.
Figure 6.
Linear transform of −ln (A/A0) versus t of photolytic and photocatalytic degradation of CIP under (A) UV-A (365 nm) and (B) solar light simulator radiation by sol-gel Ce-TiO2 films, γ0 (CIP) = 5 mg·L−1.
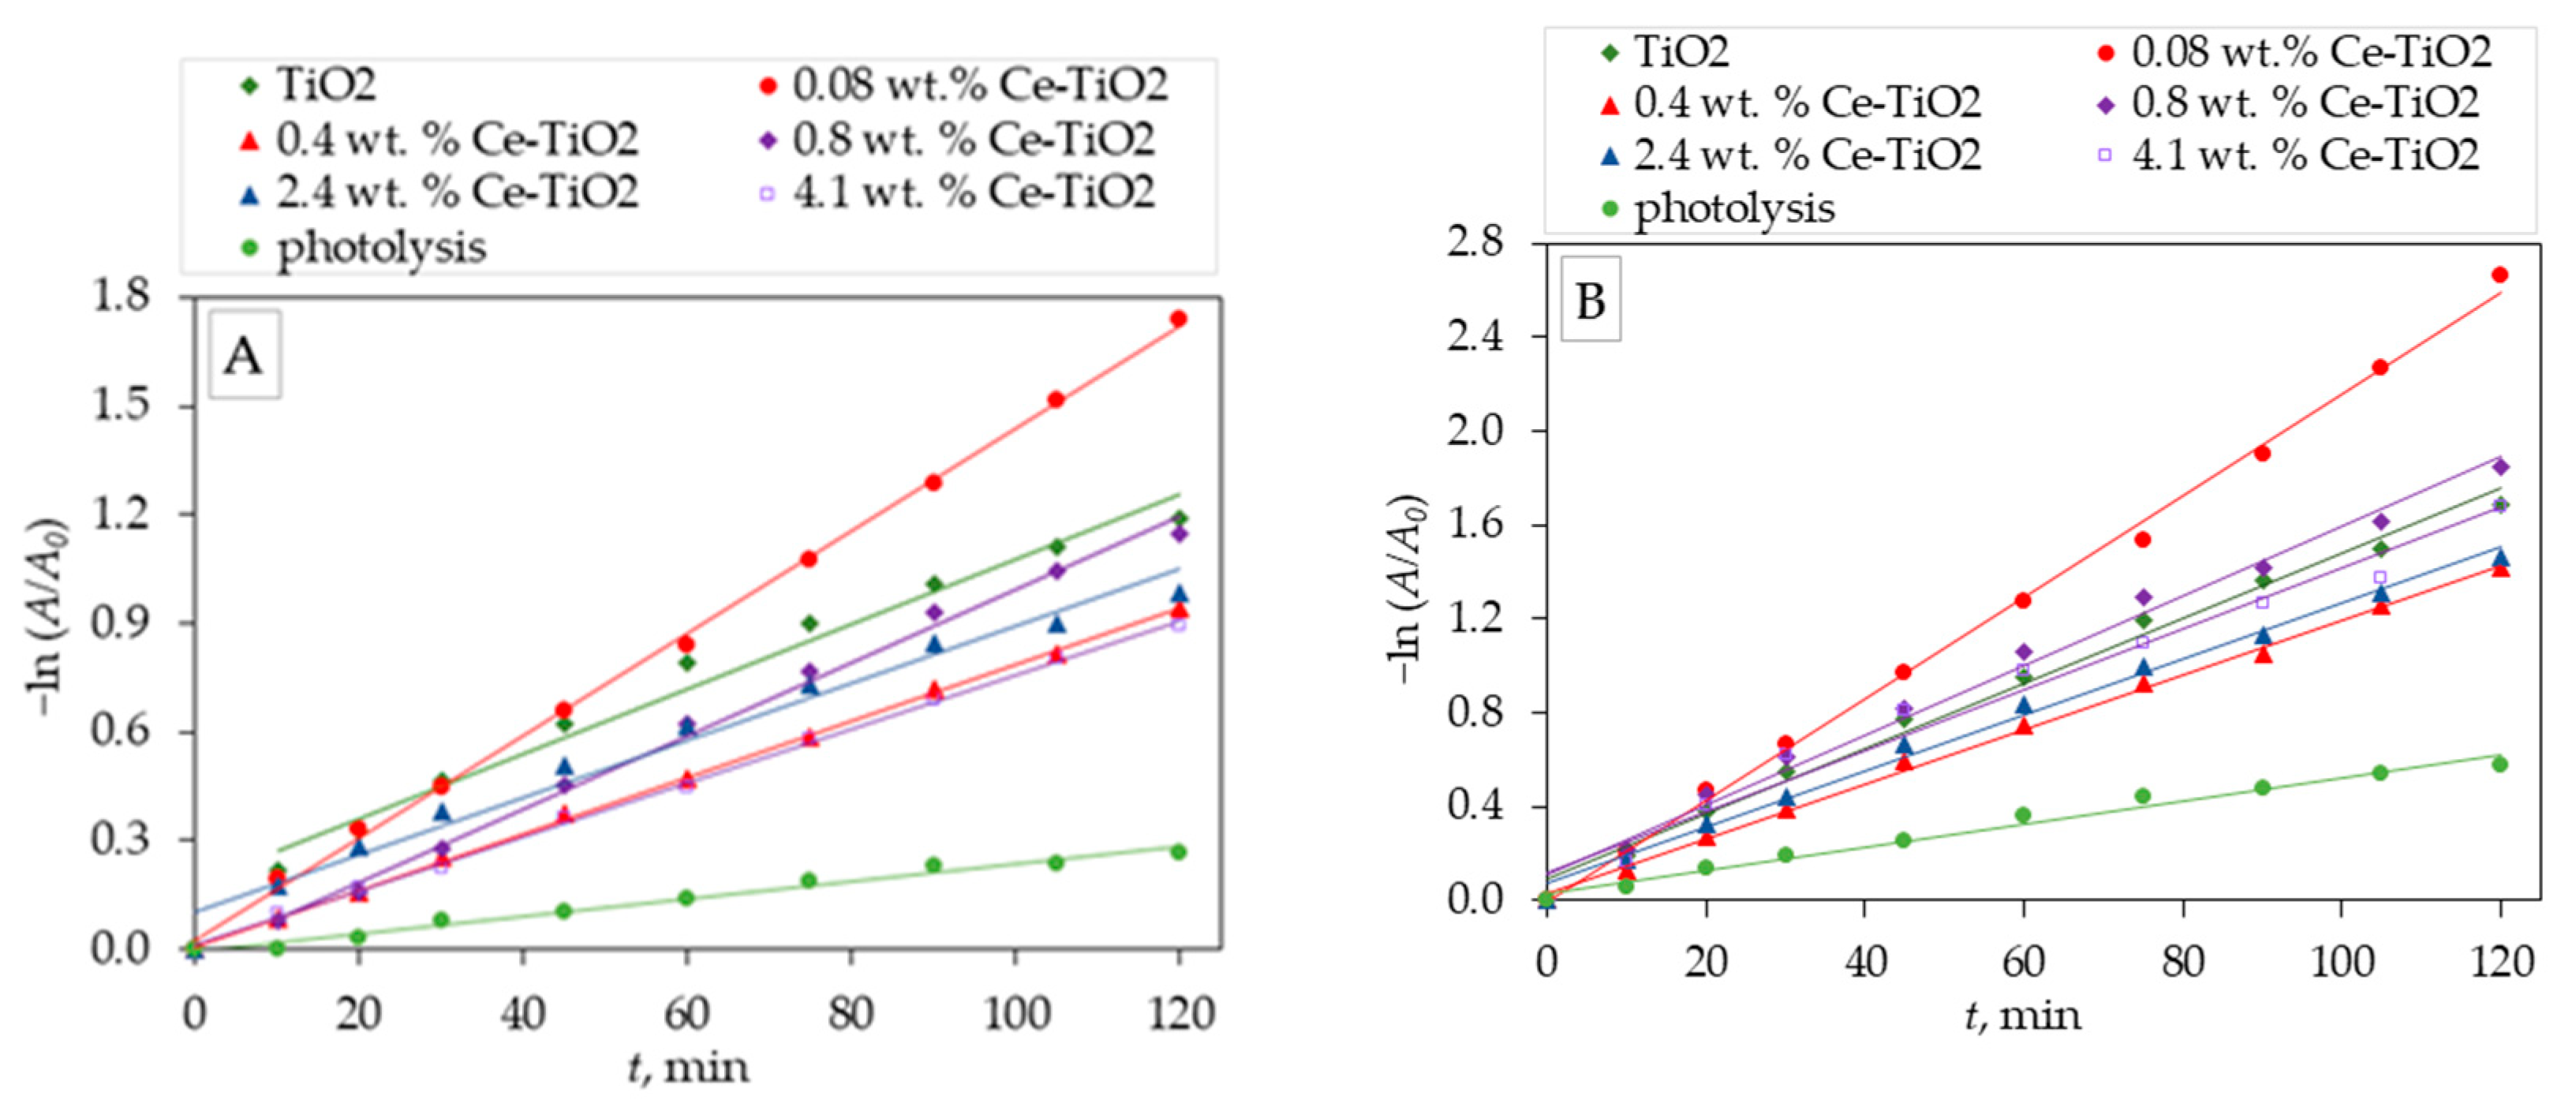
Figure 7.
Comparison of the values of (A) pseudo-first-order kinetic constants and (B) degradation efficiency of photolytic and photocatalytic degradation of CIP under UV-A (365 nm) and solar light simulator radiation by sol-gel Ce-TiO2 films, γ0 (CIP) = 5 mg·L−1.
Figure 7.
Comparison of the values of (A) pseudo-first-order kinetic constants and (B) degradation efficiency of photolytic and photocatalytic degradation of CIP under UV-A (365 nm) and solar light simulator radiation by sol-gel Ce-TiO2 films, γ0 (CIP) = 5 mg·L−1.
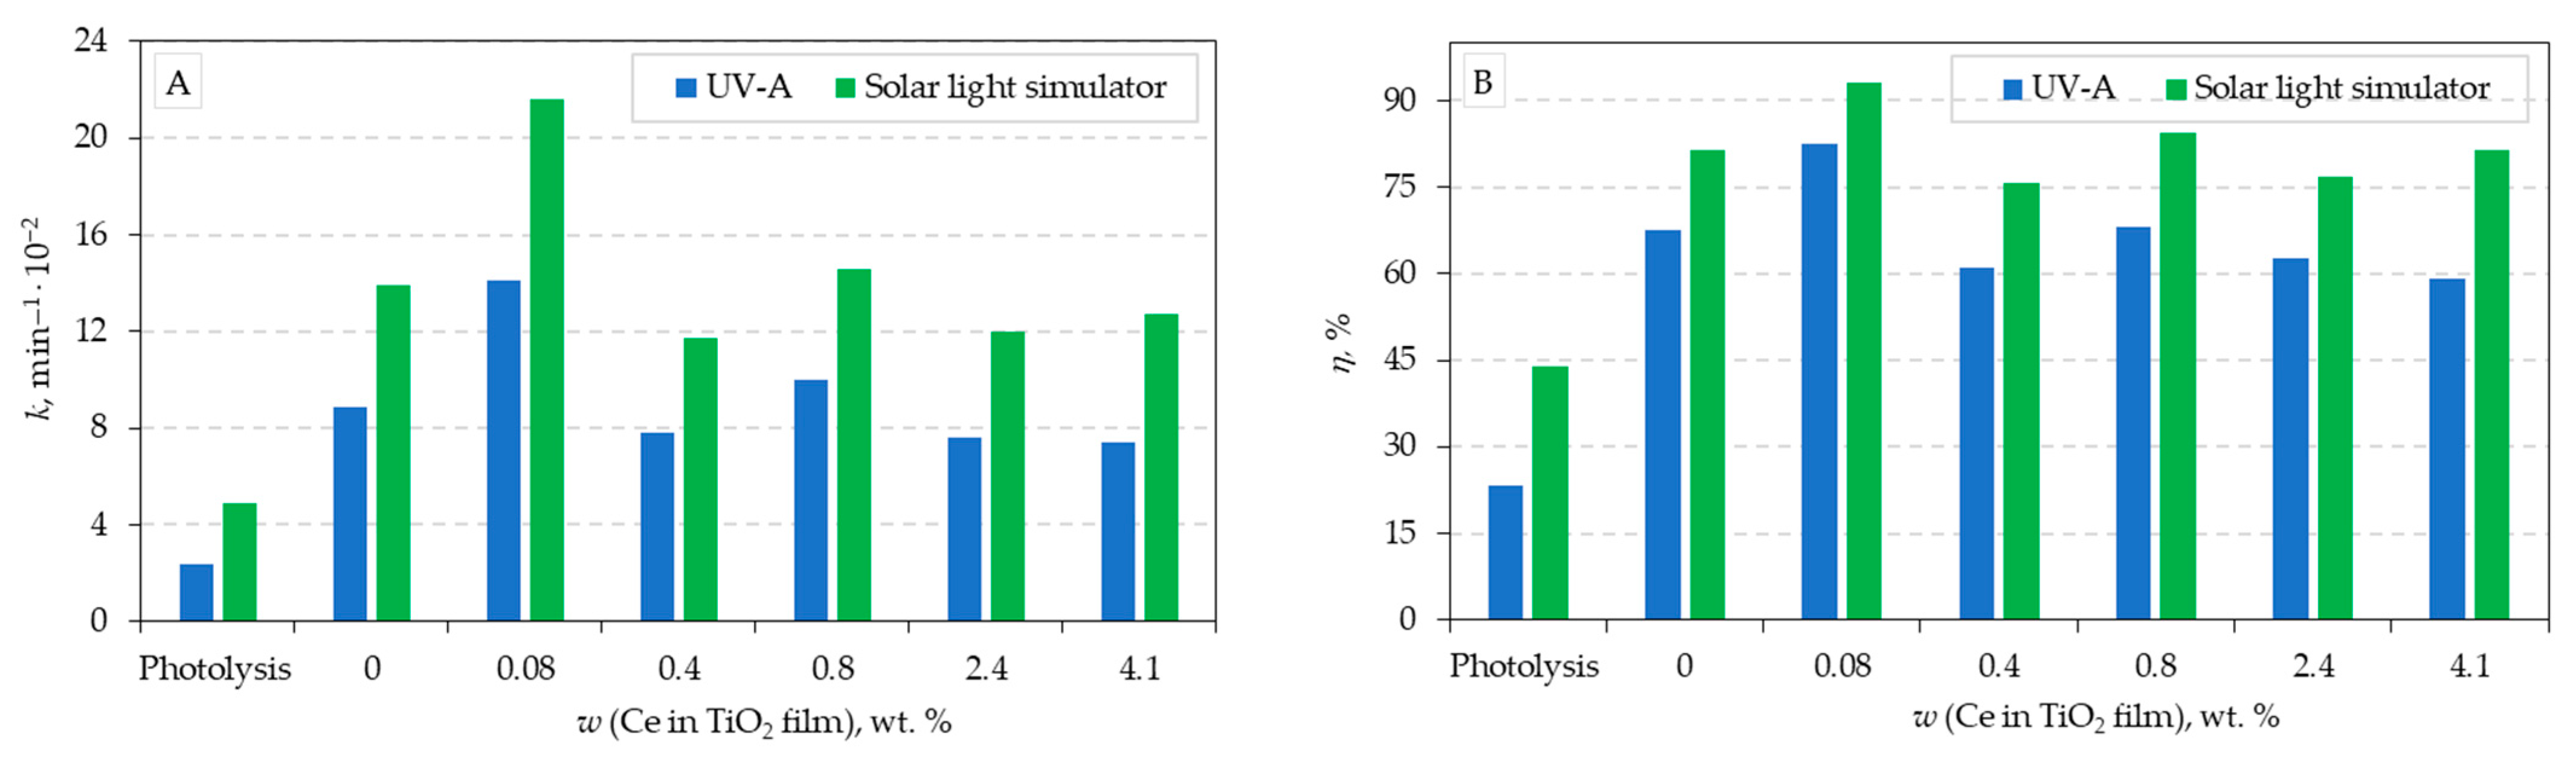

Table 1.
The values of pseudo-first-order reaction rate constants (k, min−1) and half-life times (t1/2, min), along with the corresponding correlation coefficients (R2) and removal efficiency of photocatalytic degradation of ciprofloxacin (γ0 = 5 mg L−1) by TiO2 films with different amounts of Ce, under UV-A and SOLAR radiation, at a temperature of 25 °C.
| Film | UV-A | Solar light simulator | ||||||
|---|---|---|---|---|---|---|---|---|
| k×10−3, min−1 | t1/2, min | R2 | h, % | k×10−3, min−1 | t1/2, min | R2 | h, % | |
| Photolysis (without film) | 2.4 | 288.81 | 0.9840 | 23.35 | 4.9 | 141.46 | 0.9835 | 43.88 |
| 0 wt.% Ce-TiO2 | 8.9 | 77.88 | 0.9815 | 67.53 | 13.9 | 49.87 | 0.9907 | 81.54 |
| 0.08 wt.% Ce-TiO2 | 14.1 | 49.16 | 0.9989 | 82.38 | 21.6 | 32.09 | 0.9977 | 93.04 |
| 0.40 wt.% Ce-TiO2 | 7.8 | 88.87 | 0.9991 | 61.03 | 11.7 | 59.24 | 0.9980 | 75.79 |
| 0.80 wt.% Ce-TiO2 | 10.0 | 68.63 | 0.9945 | 68.22 | 14.6 | 47.48 | 0.9934 | 84.28 |
| 2.40 wt.% Ce-TiO2 | 7.6 | 91.20 | 0.9863 | 62.58 | 12.0 | 57.76 | 0.9938 | 76.92 |
| 4.10 wt.% Ce-TiO2 | 7.4 | 93.67 | 0.9990 | 59.12 | 12.7 | 54.58 | 0.9810 | 81.32 |
Disclaimer/Publisher’s Note: The statements, opinions and data contained in all publications are solely those of the individual author(s) and contributor(s) and not of MDPI and/or the editor(s). MDPI and/or the editor(s) disclaim responsibility for any injury to people or property resulting from any ideas, methods, instructions or products referred to in the content. |
© 2024 by the authors. Licensee MDPI, Basel, Switzerland. This article is an open access article distributed under the terms and conditions of the Creative Commons Attribution (CC BY) license (http://creativecommons.org/licenses/by/4.0/).
Copyright: This open access article is published under a Creative Commons CC BY 4.0 license, which permit the free download, distribution, and reuse, provided that the author and preprint are cited in any reuse.


