Submitted:
08 May 2024
Posted:
10 May 2024
You are already at the latest version
Abstract
Oxidative neurodegeneration causes various neuronal diseases including Alzheimer's disease, Parkinson's disease, and Huntington's disease. This study aimed to demonstrate the protective effect of leaf extracts of Allium senescens on 6-hydroxydopamine (6-OHDA)-stressed SH-SY5Y cells, known as an optimal cell for neurotoxic research. Levels of apoptotic markers were evaluated using quantitative polymerase chain reaction (qPCR) and flow cytometry. The localization of apoptotic cells in vivo was analyzed using whole-mount immunochemistry and the terminal deoxynucleo-tidyl transferase dUTP nick end labeling assay. Additionally, reactive oxygen species (ROS) pro-duction was estimated using flow cytometry. 6-OHDA induced ROS production in neuroblast cells and in vivo, but treatment with the extract protected against the 6-OHDA-induced increase in ROS levels. Under oxidative stress, the extract performs three protective functions: decreases ROS production, prevents mitochondrial apoptosis, and protects the central and ventral nervous systems. These results also suggest that the extract can be useful for the development of functional foods for the prevention of neural damage due to oxidative stress.
Keywords:
Allium senescens
; neurodegeneration
; apoptosis
; 6-OHDA
; oxidative stress
1. Introduction
Neurodegenerative disorders are caused by the dysfunction of nigral dopaminergic neurons [1]. Neurodegenerative disorders is caused by various factors including age, family history, smoking, and exposure to specific chemicals such as 1-methyl-4-phenyl tetrahydropyridine (MPTP), annonacin, and antagonistic compounds to β2-adrenoreceptor [2,3,4,5,6]. Chronic neurodegenerative pathologies in central nervous system (CNS) show common features including oxidated inflammation, denatured protein, synaptic dysfunctions and defective autophagia [6,7]. In the neurodegenerative disorders, various antioxidants in phytoextracts are effective on preventing of the disorders without side effects [8]. Additionally, activation of various compounds, including levodopa, dopamine agonists, safinamide, and monoamine oxidase B (MAO-B) inhibitors have been used to treat the disorders [6].
SH-SY5Y cells, neuroblastoma cell are used widely in various neuronal studies for metabolism, neurotoxicity, neuroprotection and differentiation. Among the those, this cell line is the most applied for neurodegenerative disorders [8,9,10]. For modeling of neurodegenerative disorders in in vitro, the cell line exposed to 6-Hydroxydopamine (6-OHDA) in many studies [11,12].
6-OHDA, a neurotoxin, is known to induce neurodegenerative disorders besides PD [9]. Although 6-OHDA does not induce all neurodegenerative disorders, 6-OHDA exposure models in neurons presented various pathologic features, including neurodegeneration, inflammation, and apoptosis due to oxidative stress [9]. 6-OHDA enters dopaminergic and noradrenergic neurons and inhibits the reuptake of their neurotransmitters [10]. During neuronal destruction, reactive oxygen species (ROS), such as superoxide, accumulate in neurons [10].
Under intrinsic cellular stresses, such as DNA damage, hypoxia, UV, and exposure to chemicals, mitochondria in neurons release cytochrome c through assembled Bax proteins, and the released cytochromes and activated caspase 9 enhance cellular apoptosis [11]. When 6-OHDA triggers the production of ROS, monoamine oxidase (MAO) A and B are expressed in neurons, and MAOB produces ROS by the degradation of dopamine in neurons [12]. To protect against stress, cells express several proteins, including members of the Bcl-2 family [13], cytokine response modifier A (crmA) [14], and inhibitors of apoptosis proteins (IAPs) [15]. The Bcl-2 family of 20 proteins is involved in the regulation of cellular apoptosis. The Bcl-2 proteins (A1, Bcl-2, Bcl-w, Bcl-xL, Bcl-B, and Mcl-1) inhibit apoptotic proteins, including Bax, Bak, and Bok [16]. Caspase-3 (Cas3) interacts with caspase-8 and -9, which play a central role in apoptosis, and Cas3 activates the production of Aβ peptide from the cleavage of amyloid-beta 4A precursor protein associated with Alzheimer’s disease [17].
Allium senescens is a perennial aromatic herb distributed in northern Europe and Asia, especially the Ulleung Island in Korea [18]. A. senescens is effective in refreshing blood and controlling cholesterol levels in the blood [19], to activate detoxification and restore functions in the liver [20].
The genus Artemia of anostracan crustaceans is also known as brine shrimp [21,22]. There are four distinct developmental stages of brine shrimp: cyst, emergence, nauplius, and adult [21,22]. This animal’s plankton provides a useful model for neurological research because of its short developmental stages [21,22]. The central nervous system (CNS) and ventral system are actively developed during the nauplius stages of brine shrimp [21,22].
The goal of this research was to explore the potentiality of preventive function of the hydrolytic extract of A. senescens against oxidative neurodegeneration and to prove the usefulness of the extract as a functional food.
2. Materials and Methods
- A. senescens extract
After drying and grinding (35 mesh), the leaves of A. senescens (Ulleung, Korea) were extracted twice with hydration for 90 min. The filtered extract was concentrated (R-3000, BuCHI Labortechnik AG, Germany) at 60 ℃and lyophilized using a freeze dryer (FD8505, Ilshin Lab Co., Korea). The extract was supported by EVERBIO (Chungcheongbuk-do, Korea).
- Cell culture
SH-SY5Y cells (Korea Cell Bank, Seoul, Korea) were cultured in Dulbecco's modified Eagle's medium (DMEM) supplemented with 10% heat-inactivated fetal bovine serum (FBS), 100 µg/mL penicillin, and 100 µg/mL streptomycin at 37 °C and 5% CO2. To establish treatment dosages, SH-SY5Y cells were exposed to 40, 80, 100, 200, 300, and 400 µM 6-OHDA (162957, Sigma-Aldrich, St. Louis, Missouri, USA) and 50, 100, 500, 1000, and 2000 µg/mL of the extracts for 12 h. SH-SY5Y cells were exposed to 6-OHDA for 1 h after treatment with the extract (500 µg/mL).
- Animal plankton culture.
The cysts (1 g) of brine shrimp (Artemia franciscana) were cultured in 3 L of artificial seawater (pH 8.2, 28 °C) with air supply for 2 days. After sorting early Nauplii using a submarine assay [22], treatment dosages of 6-OHDA and the extract were established. For whole-mount immunohistochemistry and the terminal deoxynucleotidyl transferase dUTP nick end labeling (TUNEL) assay, nauplii were exposed to 6-OHDA for 30 min after treatment with the extract for 30 min.
- Cell viability test
To evaluate viability, neuroblast cells were stained with Annexin V-conjugated propidium iodide (PI) (Invitrogen, Carlsbad, CA, USA) and counted using a flow cytometer (FACScalibur, BD science, San Jose, CA, USA) and FlowJo 10.6.1 (BD Biosciences).
- Quantitative PCR
Total RNA was extracted from cells using the RiboEx reagent (GeneAll, Seoul, Korea). The RNA was then reverse-transcribed into cDNA using a Maxime RT PreMix (iNtRON, Seongnam, Korea), and quantitative PCR was performed with primers (Table 1) with the following cycling parameters: 1 min at 95 °C, followed by 35 cycles of 35 s at 59 °C and 35 cycles of 1 min at 72 °C. The expression levels of the target genes in the samples were normalized to those of the housekeeping gene GAPDH, and the relative quantities of the target genes were determined with respect to those of the control.
- Flow cytometry
All cellular samples were fixed with 2% paraformaldehyde for 4 h and treated with 0.02% Tween 20 for 5 min. After blocking using an Fc blocking solution (BD Bioscience), samples were incubated with fluorescein isothiocyanate (FITC)-anti-MAOB (Biocompare, Inc., CA, USA) and Alexa Fluor 680-anti-Cas3 (Santa Cruz Biotechnology, Inc., TX, USA) for 2 days. The treated samples were washed using phosphate-buffered saline and analyzed using a flow cytometer (BD FACScalibur) and FlowJo 10.7.0 (BD Bioscience).
- Mitochondrial apoptosis
After exposure to the three substances for 3 days, EC cells were stained with JC-1 Mitochondrial Membrane Potential Assay Kit (Invitrogen, MA, USA), and mitochondrial activity was estimated using a flow cytometer (BD FACScalibur) and FlowJo 10.6.1 (BD Biosciences).
- Cellular ROS detection
All cultured cells exposed to 6-OHDA and the extract were stained with DCFDA - Cellular ROS Assay Kit (Abcam) for 30 min and were measured using a flow cytometer (BD FACScalibur) and FlowJo 10.7.0 (BD Bioscience).
- TUNEL assay
All nauplius samples were stained with a TUNEL assay kit (Thermo Fisher Scientific, Waltham, MA, USA), and the fluorescence intensity and counting of stained colonies were estimated using a fluorescence microscope (Eclipse Ts-2, Nikon, Shinagawa, Japan) and the imaging software NIS-elements V5.11 (Nikon).
- Whole-mount immunohistochemistry.
All nauplius samples were treated with 4% paraformaldehyde for 4 h and treated with 0.02% Tween 20 for 15 min. The treated samples were stained with Alexa Fluor 680-anti-Cas3 (Santa Cruz Biotechnology, Inc., TX, USA) for 4 days [21,22]. The fluorescence intensity of the stained nauplii was evaluated and imaged using a fluorescence microscope (Eclipse Ts-2, Nikon, Shinagawa, Japan) and imaging software, NIS-elements V5.11 (Nikon). All cultured cells were pretreated 10% BSA(Sigma) for 4 hours to be specificity of antibodies.
- Statistical analysis
All experiments were analyzed by one-way analysis of variance (ANOVA) with the post hoc test (Scheffe’s method) using Prism 7 (GraphPad, San Diego, CA, USA) software.
3. Results
This study explored the protective functions of A. senescens extract against 6-OHDA stress in neuroblast cells.
3.1 . Prevention for Oxidative Apoptosis by A. Senescens Extract
The extract was not cytotoxic to the neuroblast cells (Figure 1a). Although at concentrations above 60 μM 6-OHDA, the viability of neuroblast cells was decreased dramatically (Figure 1b), the viability was maintained at 500 μg/mL of the extract even though it was exposed to above 80 μM 6-OHDA (Figure 1c, d).
Unlike 6-OHDA enhanced apoptosis of neuroblast cells without the extract, the extract attenuated apoptosis of neuroblast cells in addition to 6-OHDA (Figure 1c). Notably, although apoptosis was approximately 0.26 times under 100 μM 6-OHDA treatment, the extract enhanced the viability by approximately 0.91 times (Figure 1d). Without the extract, the mitochondrial activity was attenuated by approximately 30% under 6-OHDA treatment (Figure 2a, c, d), and the activity was maintained in neuroblast cells treated with both the extract and 6-OHDA (Figure 2b, c, d).
3.2 . Protection of Mitochondrial Activity by A. senescens Extract
Although 6-OHDA enhanced ROS production in neuroblast cells, treatment with the extract attenuated this enhancement by a factor of approximately 2 under all concentrations of 6-OHDA (Figure 3). An increase in ROS derived from 6-OHDA enhanced the upregulation of MOB in neuroblast cells (Figure 4a). Although exposure to 6-OHDA, the extract suppressed the upregulation of MAOB (Figure 4a) and at 80 and 100 μM 6-OHDA, MAOB exposed to the extract were suppressed approximately three times lower than those without the extract (Figure 4a). In agreement with these results, the levels of Cas3 were 1.8 times lower in cells treated with the extract (Figure 4b).
3.3. Modulation of Expression of Apoptotic Makers by A. senescens Extract
The extract inhibited the expression of apoptotic markers in neuroblast cells. Although 6-OHDA induced the down regulation of anti-apoptotic markers including AKT, P50, P52 and BCL2, the extract effectively prevented the down regulation (Figure 5). Additionally, apoptotic markers such as Bax and CytC were dramatically increased under 100 μM 6-OHDA treatment (Figure 5). Contrary to these results, the extract upregulated all anti-apoptotic markers and suppressed the upregulation of apoptotic markers (Figure 5).
3.4 . Protective Effects of A. senescens Extract against Oxidative Stress in Brine Shrimp
In vivo, 6-OHDA induced neuronal cell apoptosis during the development of brine shrimp (Figure 6). Following exposure to 6-OHDA, neurons of the CNS and segmental neurons in the VNS in nauplii were stained intensely with PI (red) and apo-BruU (green) (Figure 6). The fluorescence intensity was approximately 3.7 times higher than that of the control (Figure 6). Although all concentration were effective against 6-OHDA, Especially, 800 μg/mL of the extract strongly prevented neuronal apoptosis in the CNS and VNS, and notably, the extract was dramatically effective in the CNS of nauplii (Figure 6). In segmental neurons in the thoracic region, apoptosis was attenuated in nauplii treated with 800 μg/mL of the extract (Figure 6). Whole-mount immunohistochemistry showed that 100 μM 6-OHDA induced mitochondrial apoptosis in the CNS and cellular colonies of the thoracic and abdominal regions (Figure 7). The apoptotic rate in the 6-OHDA-exposed cells was 2.3 times higher than that of the control, whereas the apoptotic rate in cells treated with 800 μg/mL extract was 11.5 times lower than that of the 6-OHDA-exposed CNS (Figure 7). Furthermore, the count and fluorescence intensity of ganglia in the thorax and abdomen were increased under 6-OHDA treatment (Figure 6). Interestingly, despite exposure to 6-OHDA, the number of cell colonies were dramatically decreased in the groups treated with the extract (Figure 7).
Images for TUNEL assay in the CNS and VNS of brine shrimp exposed to 6-hydroxydopamine (6-OHDA). Histograms showing fluorescence intensity of cells in the CNS. CNS, central nervous system; T, thoracic ganglia region; A, abdominal ganglia region; ns, not significant; TUNEL, terminal deoxynucleotidyl transferase dUTP nick end labeling; VNS, ventral nervous system. (*P < 0.05, ** P < 0.01).
Images for whole-mount immunohistochemistry with APC-labeled anti-caspase-3 in the CNS and VC of brine shrimp under 6-hydroxydopamine (6-OHDA) treatment. Histograms showing the staining intensity of cells. CNS, central nervous system; T, thorax; A, abdomen; ns, not significant; VC, ventral cells, Ext; Allium senescens extract, 6-OHDA; 6-hydroxydopamine (*P < 0.05, ** P <0.01).
4. Discussion
his study documented the protective function of A. senescence extract against modeled cells for oxidative neurodegeneration and an invertebrate animal, brine shrimp. Based on the results of cell viability analysis (Figure 1), the extract was not cytotoxic to neuronal cells. Non-cytotoxic phytoextracts are useful in the application of functional foods. Interestingly, this study demonstrated three protective functions against 6-OHDA induced oxidative stress.
First, the extract prevented mitochondrial apoptosis by decreasing ROS levels in neuroblast cells. Although 6-OHDA inhibited mitochondrial activity, the extract maintained its activity in addition to decreasing ROS under 6-OHDA treatment. Moreover, the extract downregulated MAOB and Cas3 in the neuroblast cells. Under ROS accumulation, the CNS triggers neurodegeneration and accelerates aging [23]. ROS are toxic to various molecules, including proteins, lipids, carbohydrates, and DNA [24]. Furthermore, accumulated ROS causes neurodegenerative disorders [25]. These results documented the potential functions of the extract in the prevention of oxidative neurodegeneration.
Second, the extract was found to drive the expression of apoptotic and anti-apoptotic genes. The extract activated the upregulation of anti-apoptotic genes, but not of apoptotic genes. As shown in Figure 5, all concentrations of 6-OHDA decreased the apoptotic markers. However, the extract dramatically increased the levels of the apoptotic markers despite exposure to 6-OHDA. In particular, the protective effect of extract for neurodegeneration increased dependently on 6-OHDA concentrations (Figure 5). Increased ROS levels trigger the upregulation of apoptotic genes in the mitochondria [26]. In neurons, NF-κB affects neuronal survival and apoptosis under mitochondrial dysfunction [27]. Furthermore, with increased ROS levels, activation of NF-κβ without upregulation of BCL-2 promoted the activation of the apoptotic signaling pathway [27]. The activation of these two molecules indicates that the extract protects neuronal cells from apoptosis induced by 6-OHDA. Increased ROS levels inhibits the upregulation of AKT and BCL-2 genes, but not of Bax, which activates the upregulation of CytC and Cas3 [28]. Although 100 μM 6-OHDA significantly downregulated AKT gene expression and upregulated Bax and CytC genes, the extract dramatically modulated AKT, Bax, and CytC gene expression to promote the survival of neuroblast cells following exposure to 6-OHDA (Figure 5). These results suggest that the extract is effective in preventing mitochondrial apoptosis in neuroblast cells.
Third, the extract protected the CNS and VNS against oxidative apoptosis in vivo. In the developing brine shrimp (Figure 6), the extract prevented apoptosis of cells of the CNS and VNS and VC under 6-OHDA treatment. Without the extract, 6-OHDA treatment accelerated the apoptosis of CNS and VNS and VC in brine shrimp. Interestingly, 6-OHDA intensely induced apoptosis of protocerebrum, particularly mushroom bodies (MB) in the CNS of nauplii, but the protective function of the extract against oxidative stress was dramatically effective in nauplii (Figure 6 and 7). Brine shrimp is used in toxicological assays for chemicals, water pollution, and natural products [29]. Additionally, the neuronal development of brine shrimp is activated in the early nauplius [21]. Neuronal cells in the early nauplius show a sensitive response to toxic chemicals [21,29]. PD is caused by the degeneration of dopaminergic neurons in a specific area, called the substantia nigra. Corresponding with this specific area, in insects, functions of the MB include the reception and processing of sensory signals from olfactory, visual, mechanosensory systems, establishment of memory for behavior, and motor control [30]. In brine shrimp, MBs are localized at the protocerebrum and are synthesized dopamine transporters [21]. At an extract concentration of 800 μg/mL, although the protective effect was not intense in segmental neurons, protection of the CNS was dramatically effective in early nauplii (Figure 6). These results suggest that the extract is more effective in the CNS than in the VNS, in vivo. Compared with cells treated with 6-OHDA alone, those treated with the extract showed dramatically reduced mitochondrial apoptosis in the CNS and VC, in vivo (Figure 7). These protective effects of the extract in vivo provide conclusive evidence for its potential for the prevention of oxidative neurodegeneration, in addition to the results from neuroblast cells.
5. . Conclusions
This study explored the effects of A. senescens extract on the prevention of PD. Under oxidative stress, the extract performs three protective functions: decreases ROS production, prevents mitochondrial apoptosis, and protects the CNS, VNS and VC. A. senescence extract is an excellent candidate for the functional food material for the prevention of PD, in addition to maintaining brain health.
Supplementary Materials
The following supporting information can be downloaded at the website of this paper posted on Preprints.org, Figure S1: viability result.
Author Contributions
Conceptualization and methodology, Yoonjin Park, Taegun Park, Mihae Yun and Seunggwan Lee; writing—original draft preparation, Boyong Kim; writing—review and editing, Boyong Kim; supervision, Boyong Kim. All authors have read and agreed to the published version of the manuscript.
Funding
This research received no external funding.
Institutional Review Board Statement
Not applicable. This study did not involve humans or vertebral animals.
Informed Consent Statement
Not applicable.
Acknowledgments
This study was supported by EVERBIO.
Conflicts of Interest
The authors declare no conflict of interest.
References
- Sadan, O.; Bahat-Stromza, M.; Barhum, Y.; Levy, Y.S.; Pisnevsky, A.; Peretz, H.; Ilan, A.B.; Bulvik, S.; Shemesh, N.; Krepel, D.; et al. Protective effects of neurotrophic factor-secreting cells in a 6-OHDA rat model of Parkinson disease. Stem Cells Dev 2009, 18, 1179–1190. [Google Scholar] [CrossRef] [PubMed]
- Lee, A.; Gilbert, R.M. Epidemiology of Parkinson Disease. Neurol Clin 2016, 34, 955–965. [Google Scholar] [CrossRef] [PubMed]
- Pope-Coleman, A.; Schneider, J.S. Effects of Chronic GM1 Ganglioside Treatment on Cognitieve and Motor Deficits in a Slowly Progressing Model of Parkinsonism in Non-Human Primates. Restor Neurol Neurosci 1998, 12, 255–266. [Google Scholar] [PubMed]
- Hoglinger, G.U.; Michel, P.P.; Champy, P.; Feger, J.; Hirsch, E.C.; Ruberg, M.; Lannuzel, A. Experimental evidence for a toxic etiology of tropical parkinsonism. Mov Disord 2005, 20, 118–119. [Google Scholar] [CrossRef] [PubMed]
- Mittal, S.; Bjornevik, K.; Im, D.S.; Flierl, A.; Dong, X.; Locascio, J.J.; Abo, K.M.; Long, E.; Jin, M.; Xu, B.; et al. beta2-Adrenoreceptor is a regulator of the alpha-synuclein gene driving risk of Parkinson's disease. Science 2017, 357, 891–898. [Google Scholar] [CrossRef]
- Balestrino, R.; Schapira, A.H.V. Parkinson disease. Eur J Neurol 2020, 27, 27–42. [Google Scholar] [CrossRef]
- Houldsworth, A. Role of oxidative stress in neurodegenerative disorders: A review of reactive oxygen species and prevention by antioxidants. Brain Communications 2024, fcad356. [Google Scholar] [CrossRef] [PubMed]
- Kiran, N.S.; Yashaswini, C.; Lowkesh, G.; Range, K.; Madhu, R. Phytochemicals and Herbal Medicines: Potential Drug Candidates for Obsessive-Compulsive Disorder Treatment. In Nutrition and Obsessive-Compulsive Disorder; CRC Press: 2024; pp. 189–200.
- Hernandez-Baltazar, D.; Zavala-Flores, L.M.; Villanueva-Olivo, A. The 6-hydroxydopamine model and parkinsonian pathophysiology: Novel findings in an older model. Neurologia 2017, 32, 533–539. [Google Scholar] [CrossRef] [PubMed]
- Breese, G.R.; Knapp, D.J.; Criswell, H.E.; Moy, S.S.; Papadeas, S.T.; Blake, B.L. The neonate-6-hydroxydopamine-lesioned rat: a model for clinical neuroscience and neurobiological principles. Brain Res Brain Res Rev 2005, 48, 57–73. [Google Scholar] [CrossRef]
- Bellance, N.; Lestienne, P.; Rossignol, R. Mitochondria: from bioenergetics to the metabolic regulation of carcinogenesis. Front Biosci (Landmark Ed) 2009, 14, 4015–4034. [Google Scholar] [CrossRef]
- Maggiorani, D.; Manzella, N.; Edmondson, D.E.; Mattevi, A.; Parini, A.; Binda, C.; Mialet-Perez, J. Monoamine Oxidases, Oxidative Stress, and Altered Mitochondrial Dynamics in Cardiac Ageing. Oxid Med Cell Longev 2017, 2017, 3017947. [Google Scholar] [CrossRef] [PubMed]
- Mayer, B.; Oberbauer, R. Mitochondrial regulation of apoptosis. News Physiol Sci 2003, 18, 89–94. [Google Scholar] [CrossRef] [PubMed]
- Dobo, J.; Swanson, R.; Salvesen, G.S.; Olson, S.T.; Gettins, P.G. Cytokine response modifier a inhibition of initiator caspases results in covalent complex formation and dissociation of the caspase tetramer. J Biol Chem 2006, 281, 38781–38790. [Google Scholar] [CrossRef] [PubMed]
- Vamos, M.; Welsh, K.; Finlay, D.; Lee, P.S.; Mace, P.D.; Snipas, S.J.; Gonzalez, M.L.; Ganji, S.R.; Ardecky, R.J.; Riedl, S.J.; et al. Expedient synthesis of highly potent antagonists of inhibitor of apoptosis proteins (IAPs) with unique selectivity for ML-IAP. ACS Chem Biol 2013, 8, 725–732. [Google Scholar] [CrossRef] [PubMed]
- Kvansakul, M.; Caria, S.; Hinds, M.G. The Bcl-2 Family in Host-Virus Interactions. Viruses 2017, 9. [Google Scholar] [CrossRef] [PubMed]
- Gervais, F.G.; Xu, D.; Robertson, G.S.; Vaillancourt, J.P.; Zhu, Y.; Huang, J.; LeBlanc, A.; Smith, D.; Rigby, M.; Shearman, M.S.; et al. Involvement of caspases in proteolytic cleavage of Alzheimer's amyloid-beta precursor protein and amyloidogenic A beta peptide formation. Cell 1999, 97, 395–406. [Google Scholar] [CrossRef] [PubMed]
- Ong, H.G.; Chung, J.-M.; Jeong, H.-R.; Kim, Y.-D.; Choi, K.; Shin, C.-H.; Lee, Y.-M. Ethnobotany of the wild edible plants gathered in Ulleung Island, South Korea. Genetic Resources and Crop Evolution 2016, 63, 409–427. [Google Scholar] [CrossRef]
- Pârvu, M.; Pârvu, A.E.; Vlase, L.; Rosca-Casian, O.; Pârvu, O.; Puscas, M. Allicin and alliin content and antifungal activity of Allium senescens L. ssp. montanum (FW Schmidt) Holub ethanol extract. J. Med. Plants Res 2011, 5, 6544–6549. [Google Scholar]
- Shin, G.-M.; Koppula, S.; Chae, Y.-J.; Kim, H.-S.; Lee, J.-D.; Kim, M.-K.; Song, M. Anti-hepatofibrosis effect of Allium senescens in activated hepatic stellate cells and thioacetamide-induced fibrosis rat model. Pharmaceutical biology 2018, 56, 632–642. [Google Scholar] [CrossRef]
- Kim, B.Y.; Shin, G.H.; Lee, I.S.; Kim, S.W.; Kim, H.S.; Kim, J.K.; Lee, S.G. Localization patterns of dopamine active transporter synthesizing cells during development of brine shrimp. Archives of insect biochemistry and physiology 2017, 94, e21378. [Google Scholar] [CrossRef]
- Kim, B.Y.; Song, H.Y.; Kim, M.Y.; Lee, B.H.; Kim, K.J.; Jo, K.J.; Kim, S.W.; Lee, S.G.; Lee, B.H. Distinctive localization of Group 3 late embryogenesis abundant synthesizing cells during brine shrimp development. Archives of insect biochemistry and physiology 2015, 89, 169–180. [Google Scholar] [CrossRef] [PubMed]
- Stefanatos, R.; Sanz, A. The role of mitochondrial ROS in the aging brain. FEBS letters 2018, 592, 743–758. [Google Scholar] [CrossRef] [PubMed]
- Datta, K.; Sinha, S.; Chattopadhyay, P. Reactive oxygen species in health and disease. National Medical Journal of India 2000, 13, 304–310. [Google Scholar]
- Umeno, A.; Biju, V.; Yoshida, Y. In vivo ROS production and use of oxidative stress-derived biomarkers to detect the onset of diseases such as Alzheimer’s disease, Parkinson’s disease, and diabetes. Free radical research 2017, 51, 413–427. [Google Scholar] [CrossRef]
- Giorgio, M.; Migliaccio, E.; Orsini, F.; Paolucci, D.; Moroni, M.; Contursi, C.; Pelliccia, G.; Luzi, L.; Minucci, S.; Marcaccio, M. Electron transfer between cytochrome c and p66Shc generates reactive oxygen species that trigger mitochondrial apoptosis. Cell 2005, 122, 221–233. [Google Scholar] [CrossRef] [PubMed]
- Jha, N.K.; Jha, S.K.; Kar, R.; Nand, P.; Swati, K.; Goswami, V.K. Nuclear factor-kappa β as a therapeutic target for Alzheimer's disease. Journal of neurochemistry 2019, 150, 113–137. [Google Scholar] [CrossRef] [PubMed]
- Zhou, Y.-d.; Hou, J.-g.; Yang, G.; Jiang, S.; Chen, C.; Wang, Z.; Liu, Y.-y.; Ren, S.; Li, W. Icariin ameliorates cisplatin-induced cytotoxicity in human embryonic kidney 293 cells by suppressing ROS-mediated PI3K/Akt pathway. Biomedicine & Pharmacotherapy 2019, 109, 2309–2317. [Google Scholar]
- Zhang, Q.; Guo, S.; Hu, G. Toxic effects of two commercial polybrominated diphenyl ethers on Artemia larvae at three developmental stages. Crustaceana 2021, 94, 177–187. [Google Scholar] [CrossRef]
- Gronenberg, W.; López-Riquelme, G. Multisensory convergence in the mushroom bodies of ants and bees. Acta Biologica Hungarica 2004, 55, 31–37. [Google Scholar] [CrossRef]
Figure 1.
Cellular viability and apoptosis of Allium senescens extract and 6-OHDA in neuroblast cells. (a, b) Cellular viability of neuroblast cells treated with the extract and 6-OHDA (P < 0.05). (c) Apoptosis of neuroblast cells treated with the extract (500); 500 μg/mL and the indicated concentrations of 6-OHDA. (d) Histograms showing the relative fold changes in the number of live cells under treatment with the extract and 6-OHDA based on the panel C. ns; not significant, EX; Allium senescens extract 500 μg/mL, 6-OHDA; 6-hydroxydopamine. (** P <0.01, *** P <0.001). .
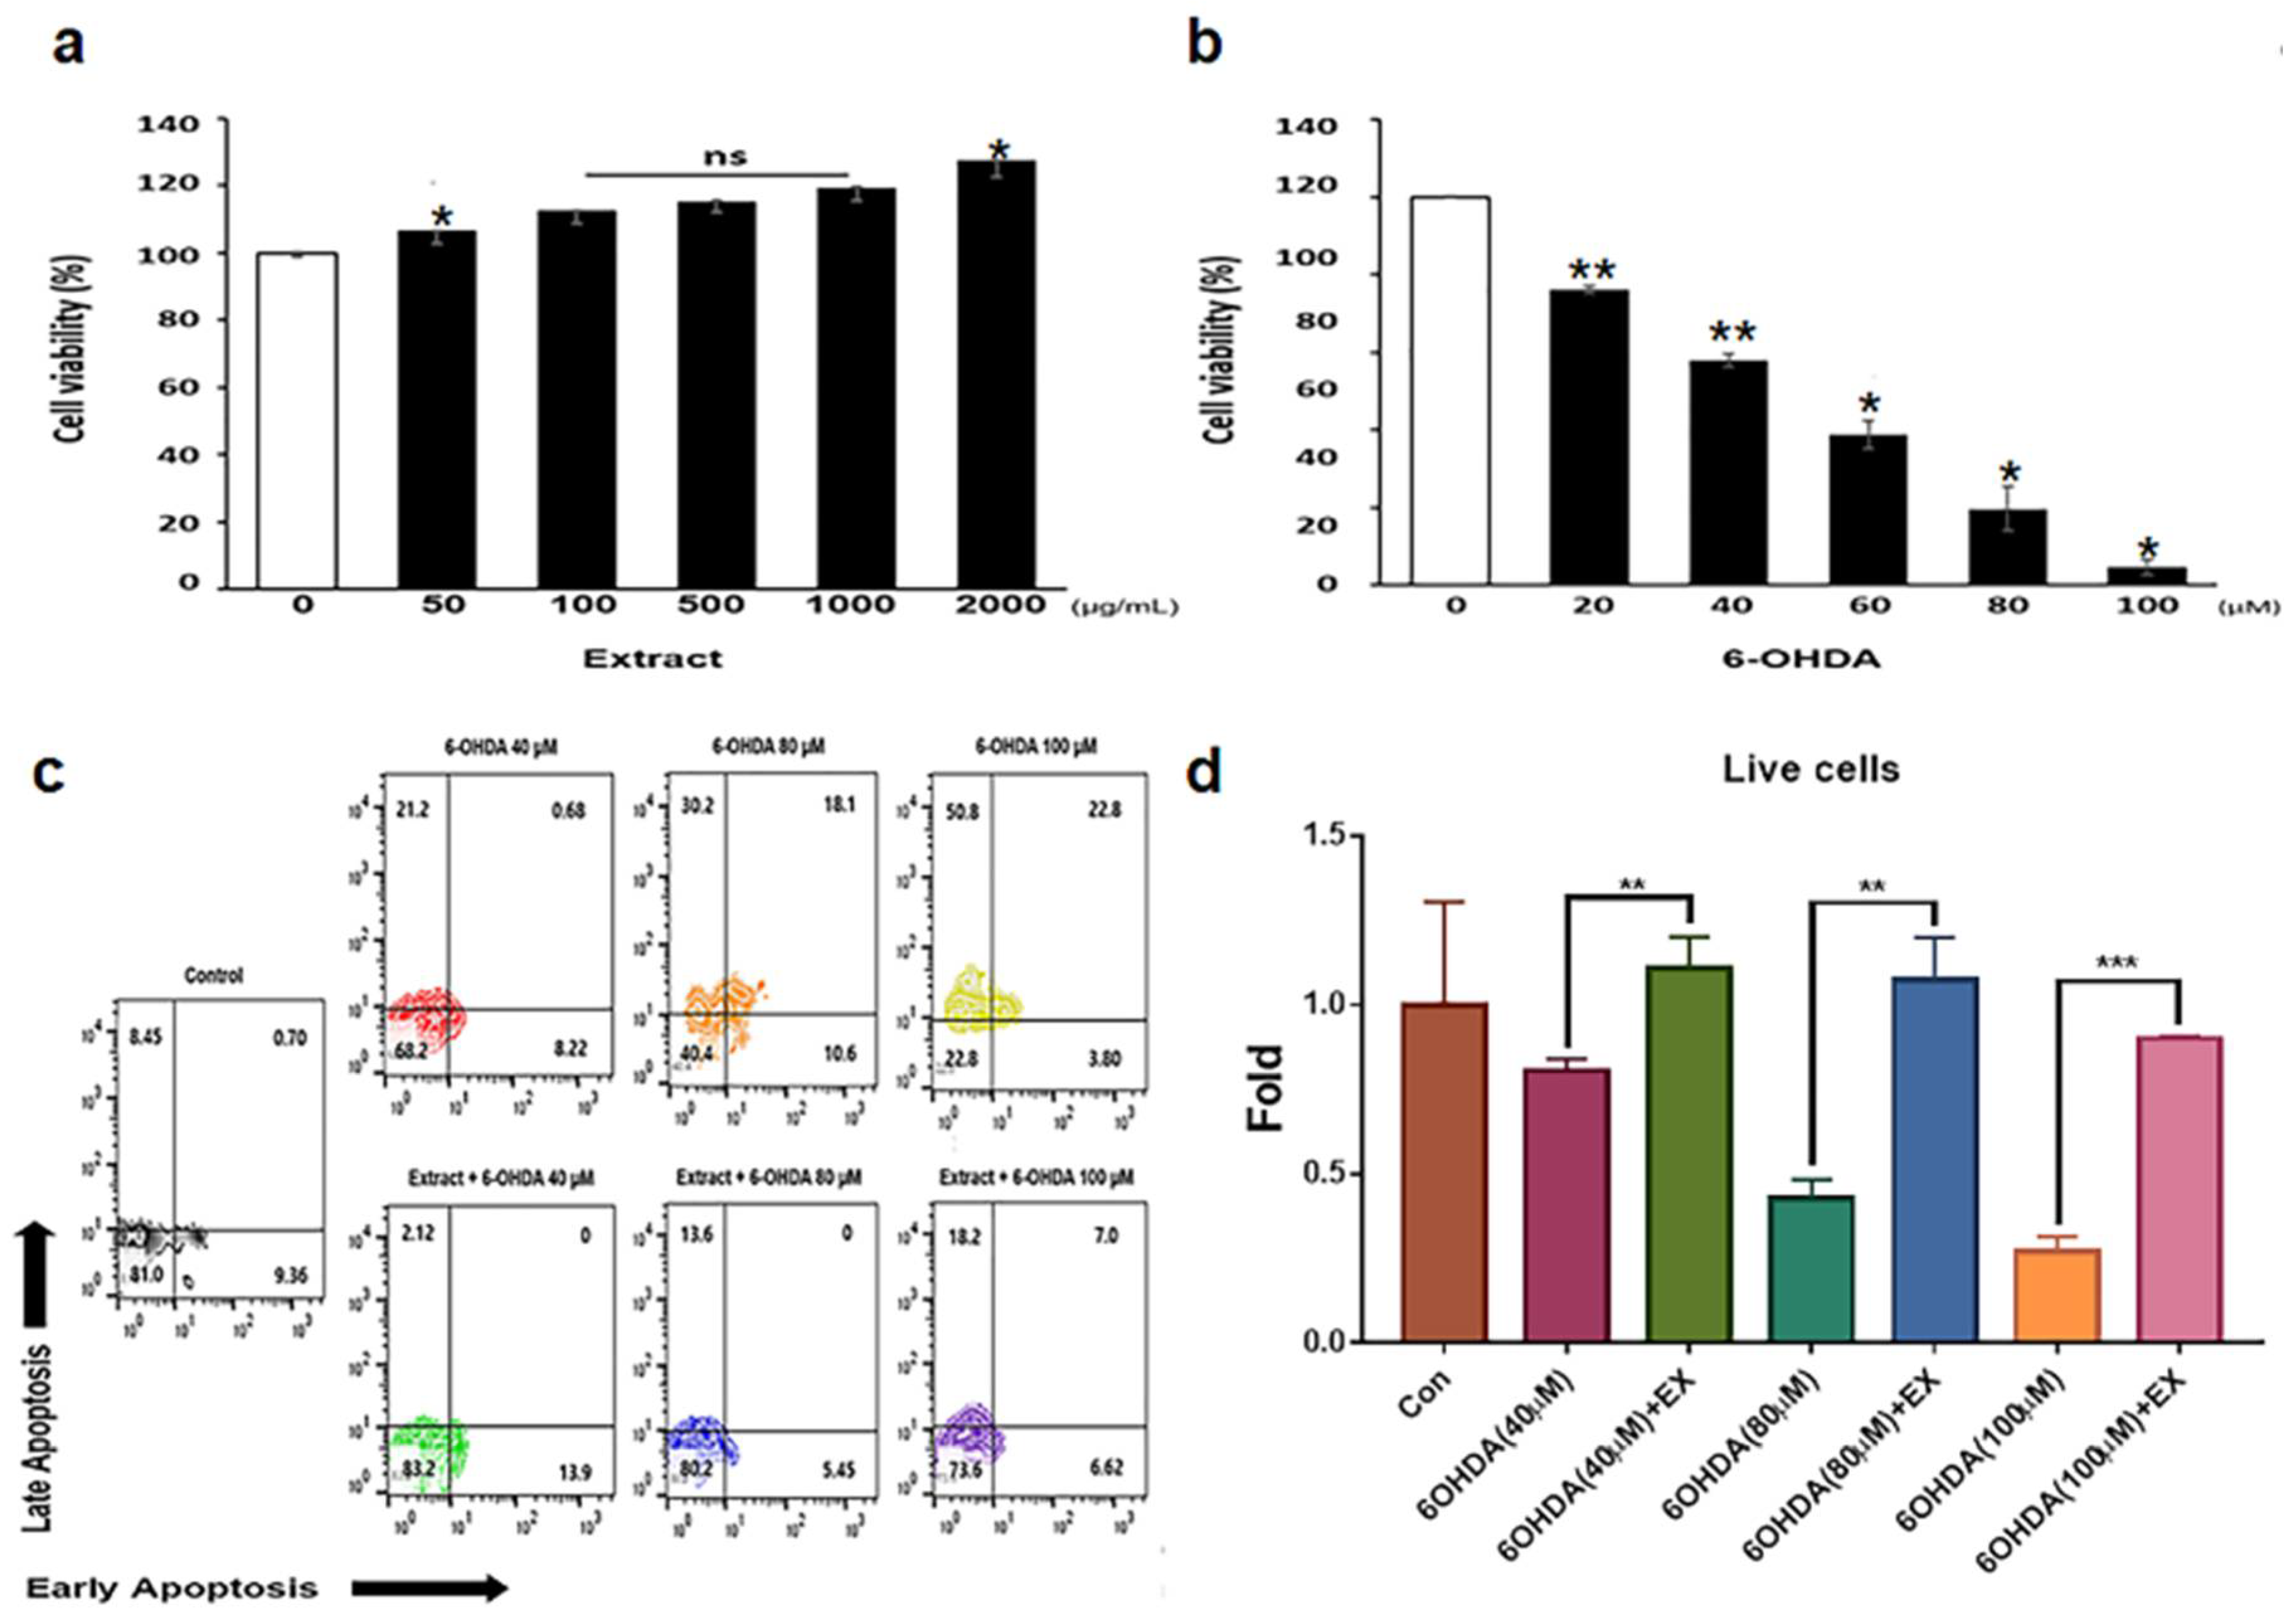
Figure 2.
Protective effect of the extract for mitochondrial apoptosis of neuroblast cells. (a, b) Estimation of mitochondrial membrane potential using fluorescence microscopy. Red and green colors indicate live and dead cells, respectively. (c, d) Flow cytometric counts of inactive cells and histograms (d) showing the counts of inactivated cells based on the panel C. EX; Allium senescens extract 500 μg/mL, 6-OHDA; 6-hydroxydopamine. (** P <0.01, *** P <0.001). (White bars = 20 μm) (** P <0.01). .
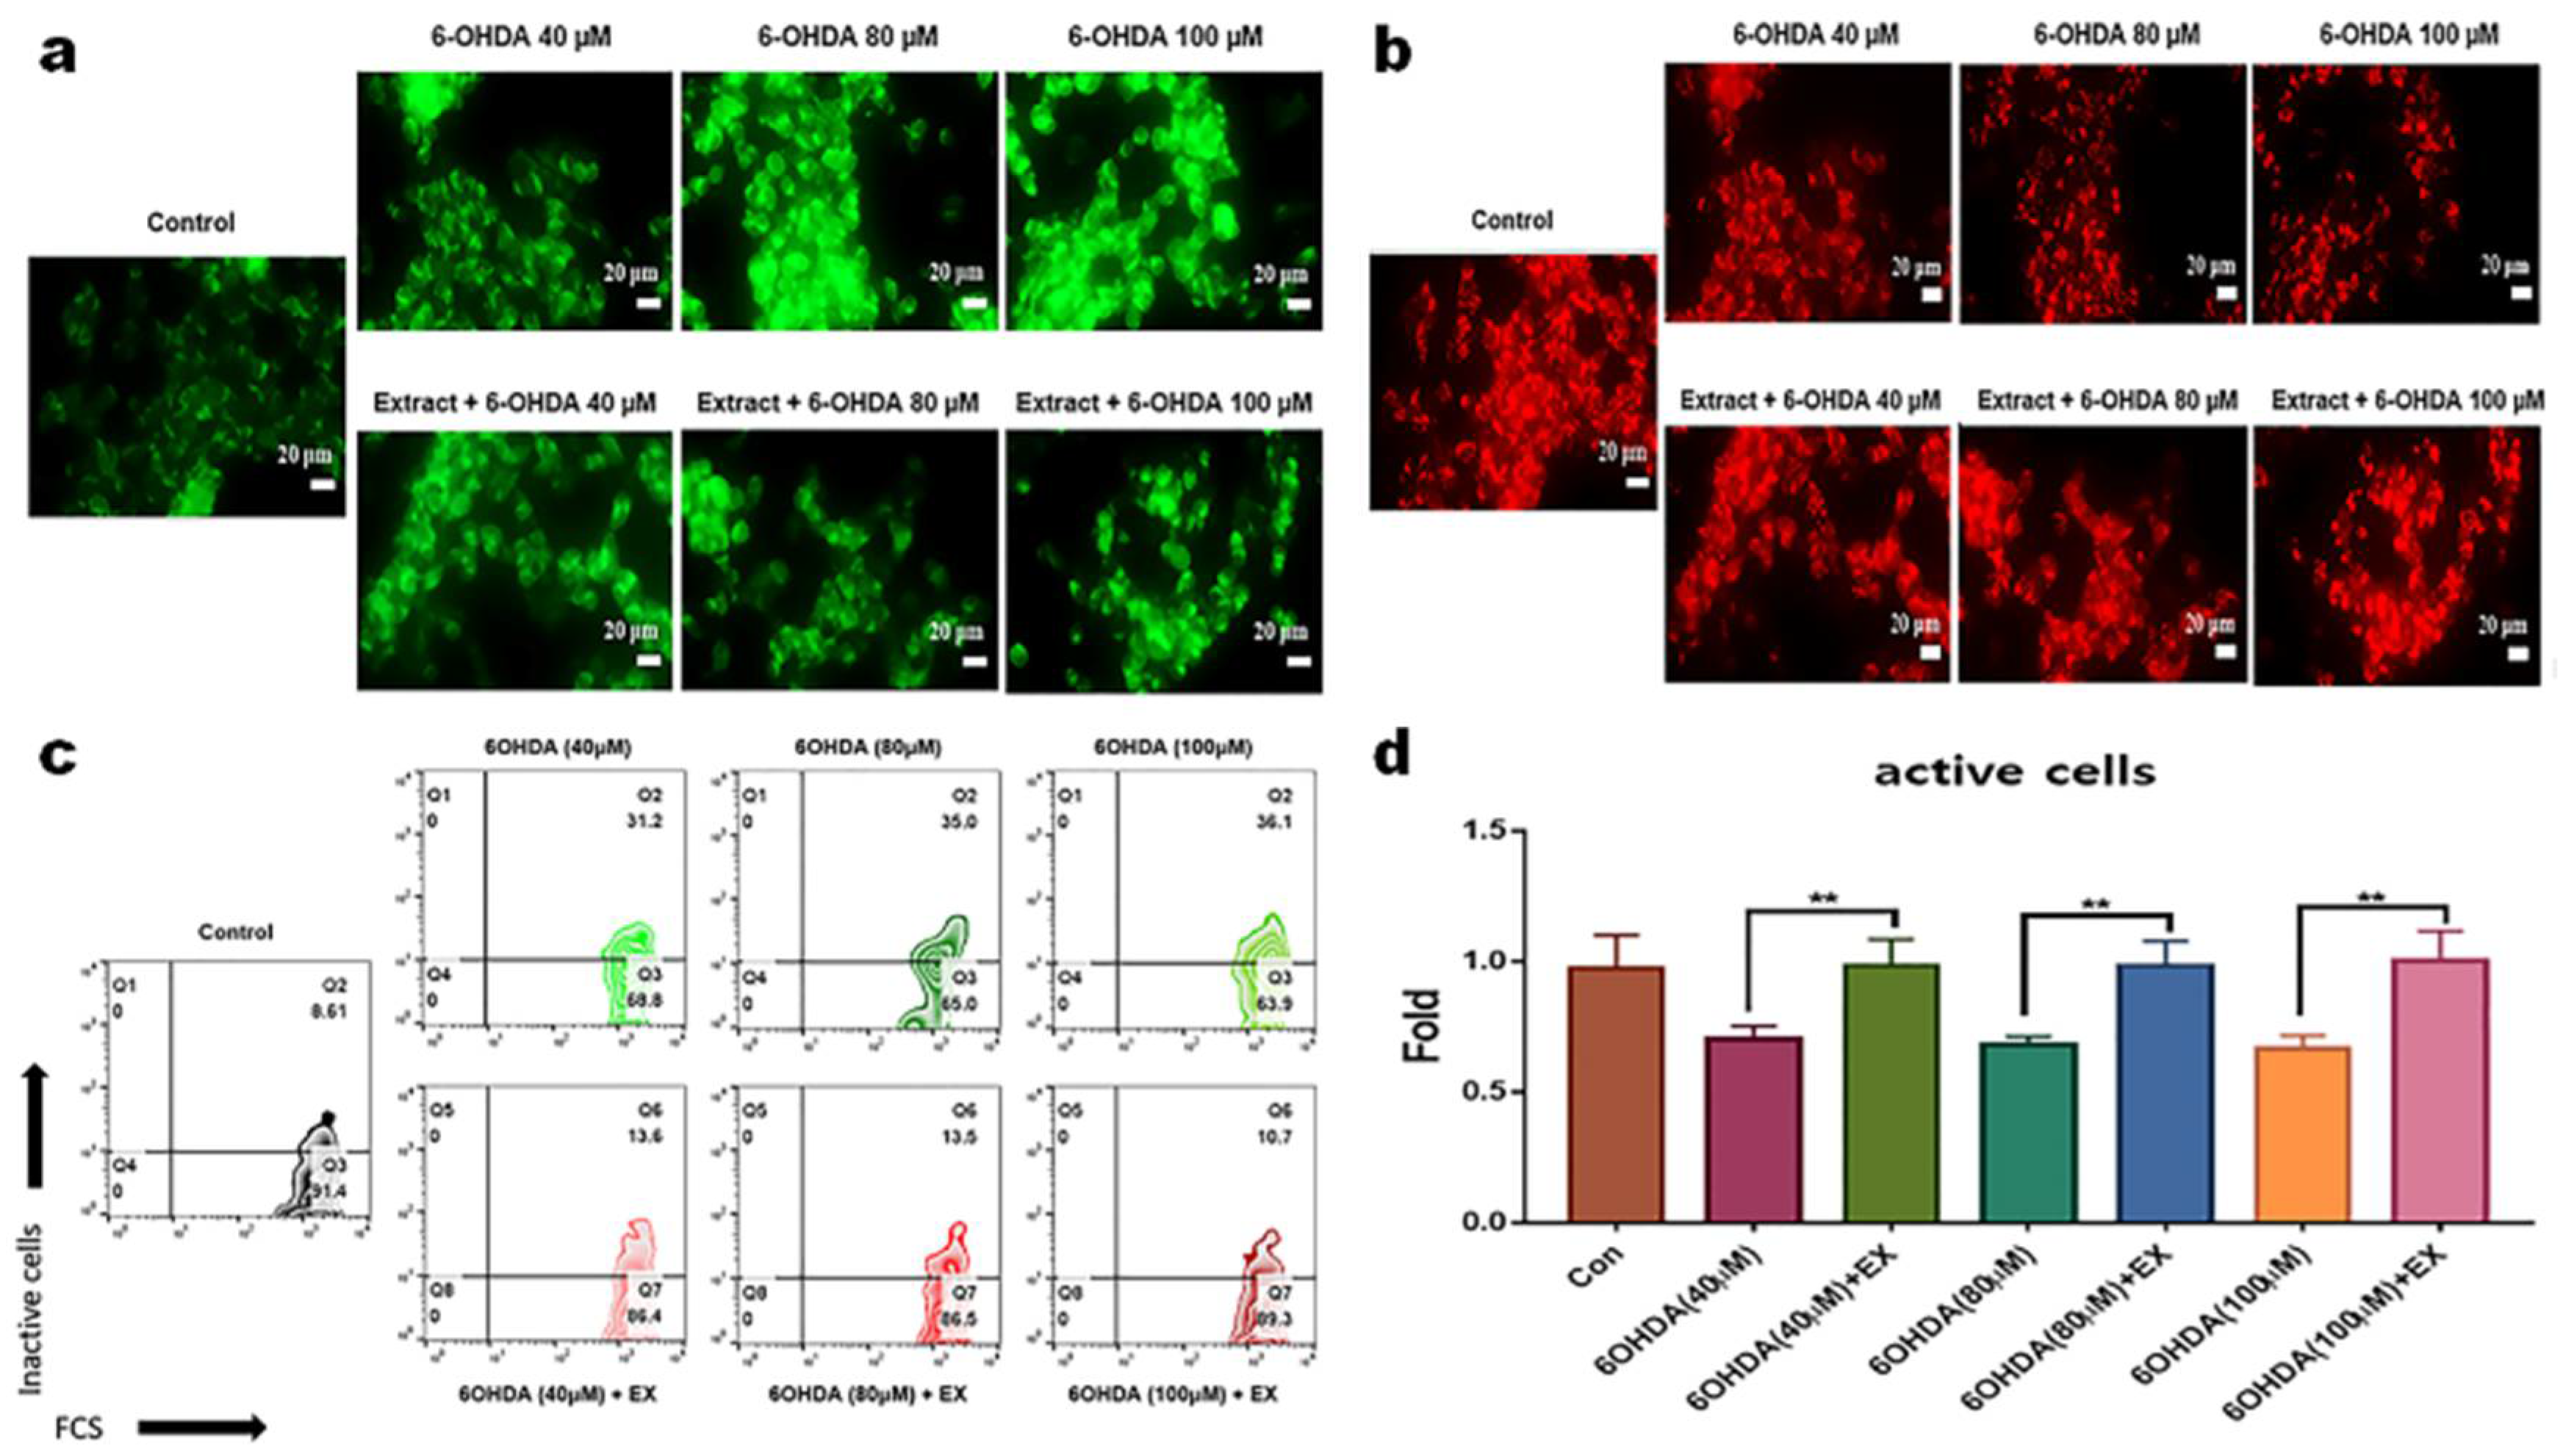
Figure 3.
Evaluation of ROS production in neuroblast cells treated with the extract . (a) ROS production under various conditions. (b) Relative fold changes for ROS production in cells exposed to various concentrations of 6-OHDA and treated with the extract. Con; control, EX; Allium senescens extract 500 μg/mL, 6-OHDA; 6-hydroxydopamine, ns; not significant. (*P < 0.05, ** P <0.01, *** P <0.001). .
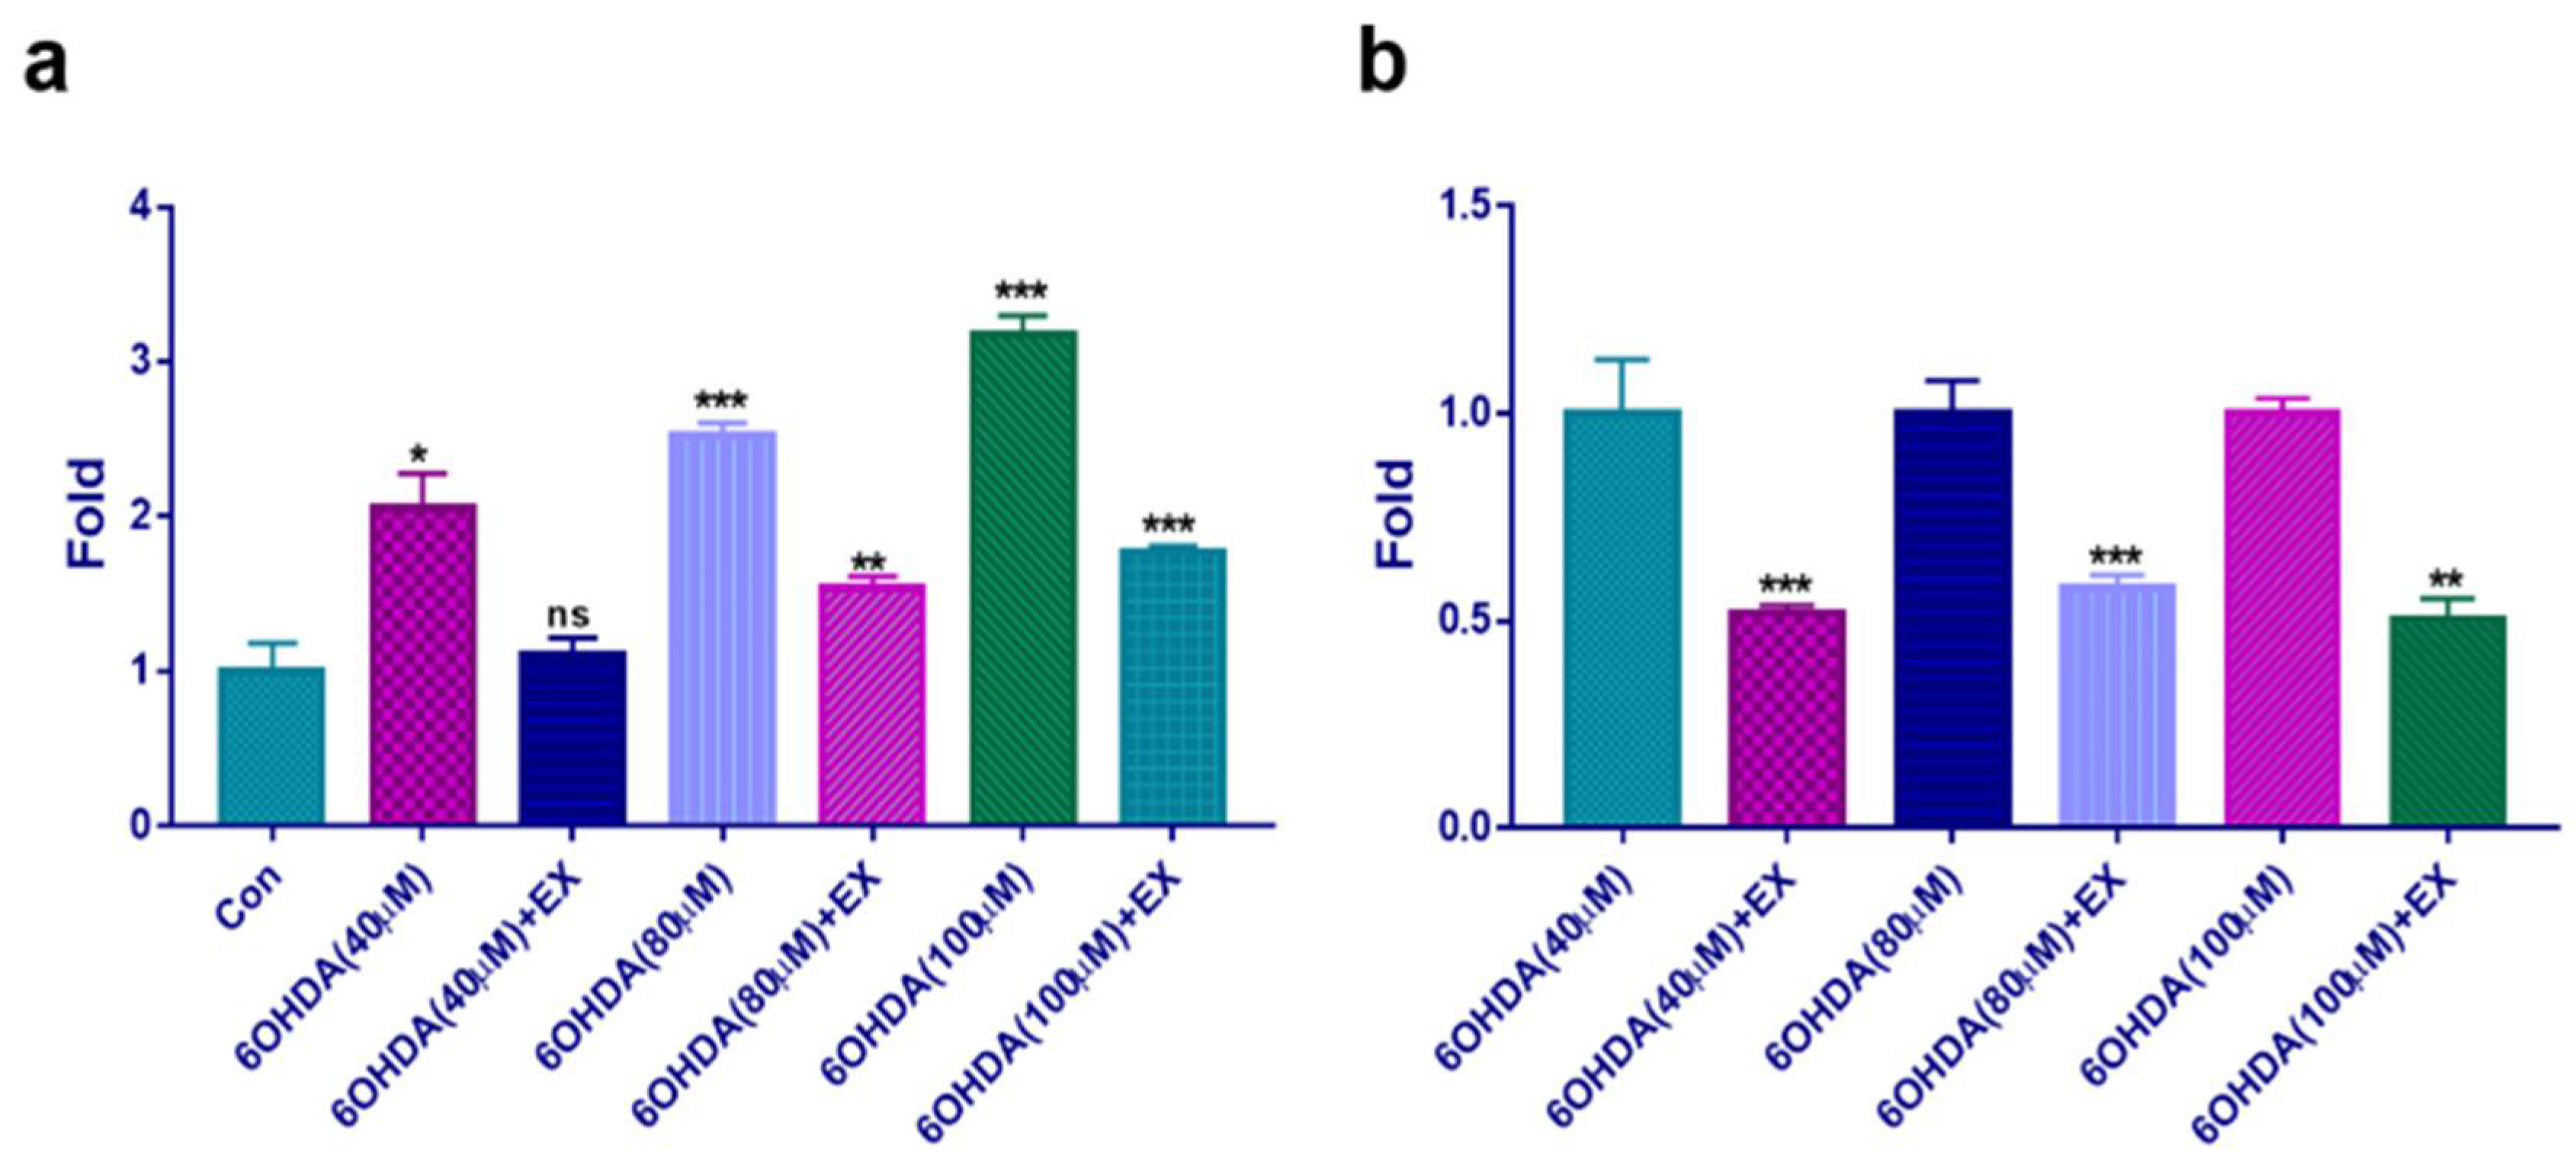
Figure 4.
Expression of the markers for mitochondrial apoptosis in neuroblast cells treated with the extract. (a, b) After gating for population of live cells, the results for the markers of mitochondrial apoptosis were evaluated using flow cytometry. Histograms showing relative fold changes in cell counts. EX; Allium senescens extract 500 μg/mL, 6-OHDA; 6-hydroxydopamine (*P < 0.05, ** P <0.01, *** P <0.001). .
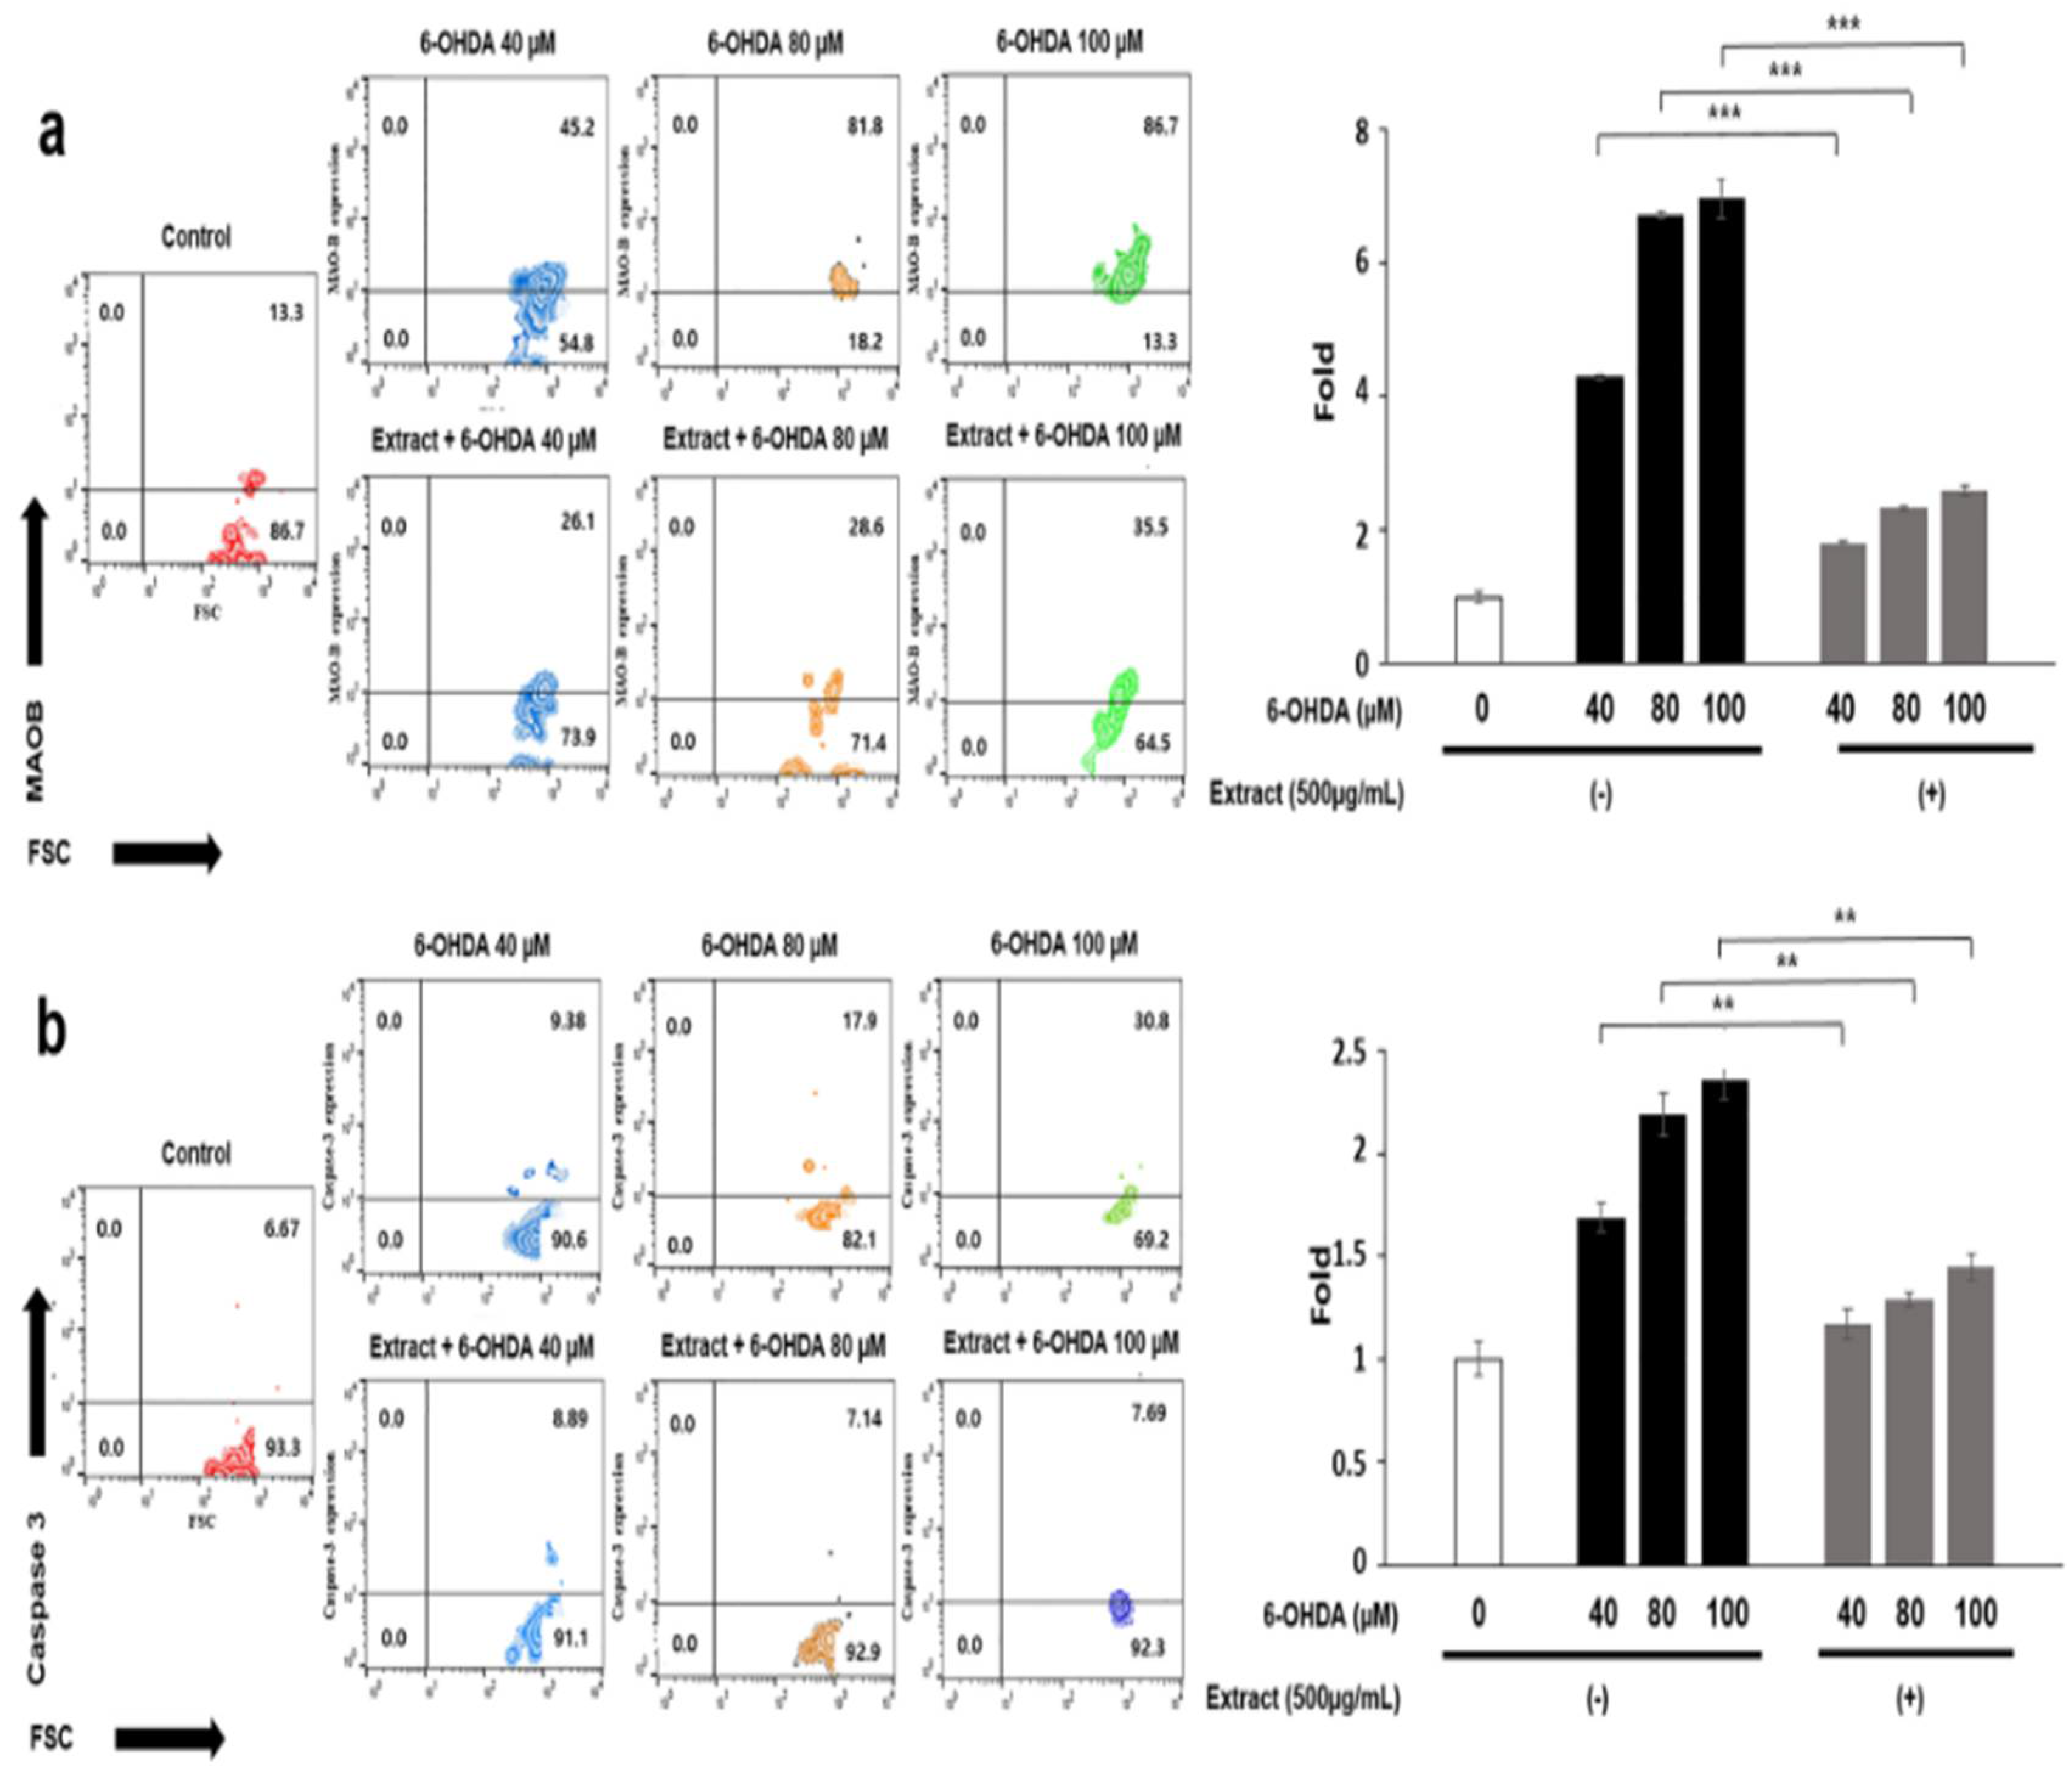
Figure 5.
The mRNA levels for apoptotic markers in neuroblast cells treated with the extract Evaluation of levels of the antiapoptotic markers (AKT, P50, P52, BCL-2) and apoptotic markers (Bax and CytC). Histograms showing relative fold changes in the signal intensity of the amplified DNA products. EX; Allium senescens extract 500 μg/mL, 6-OHDA; 6-hydroxydopamine, ns; not significant, EX+40, 80, 100; 6-OHDA treatment after exposure to the extract. (*P < 0.05, ** P <0.01, *** P <0.001). .
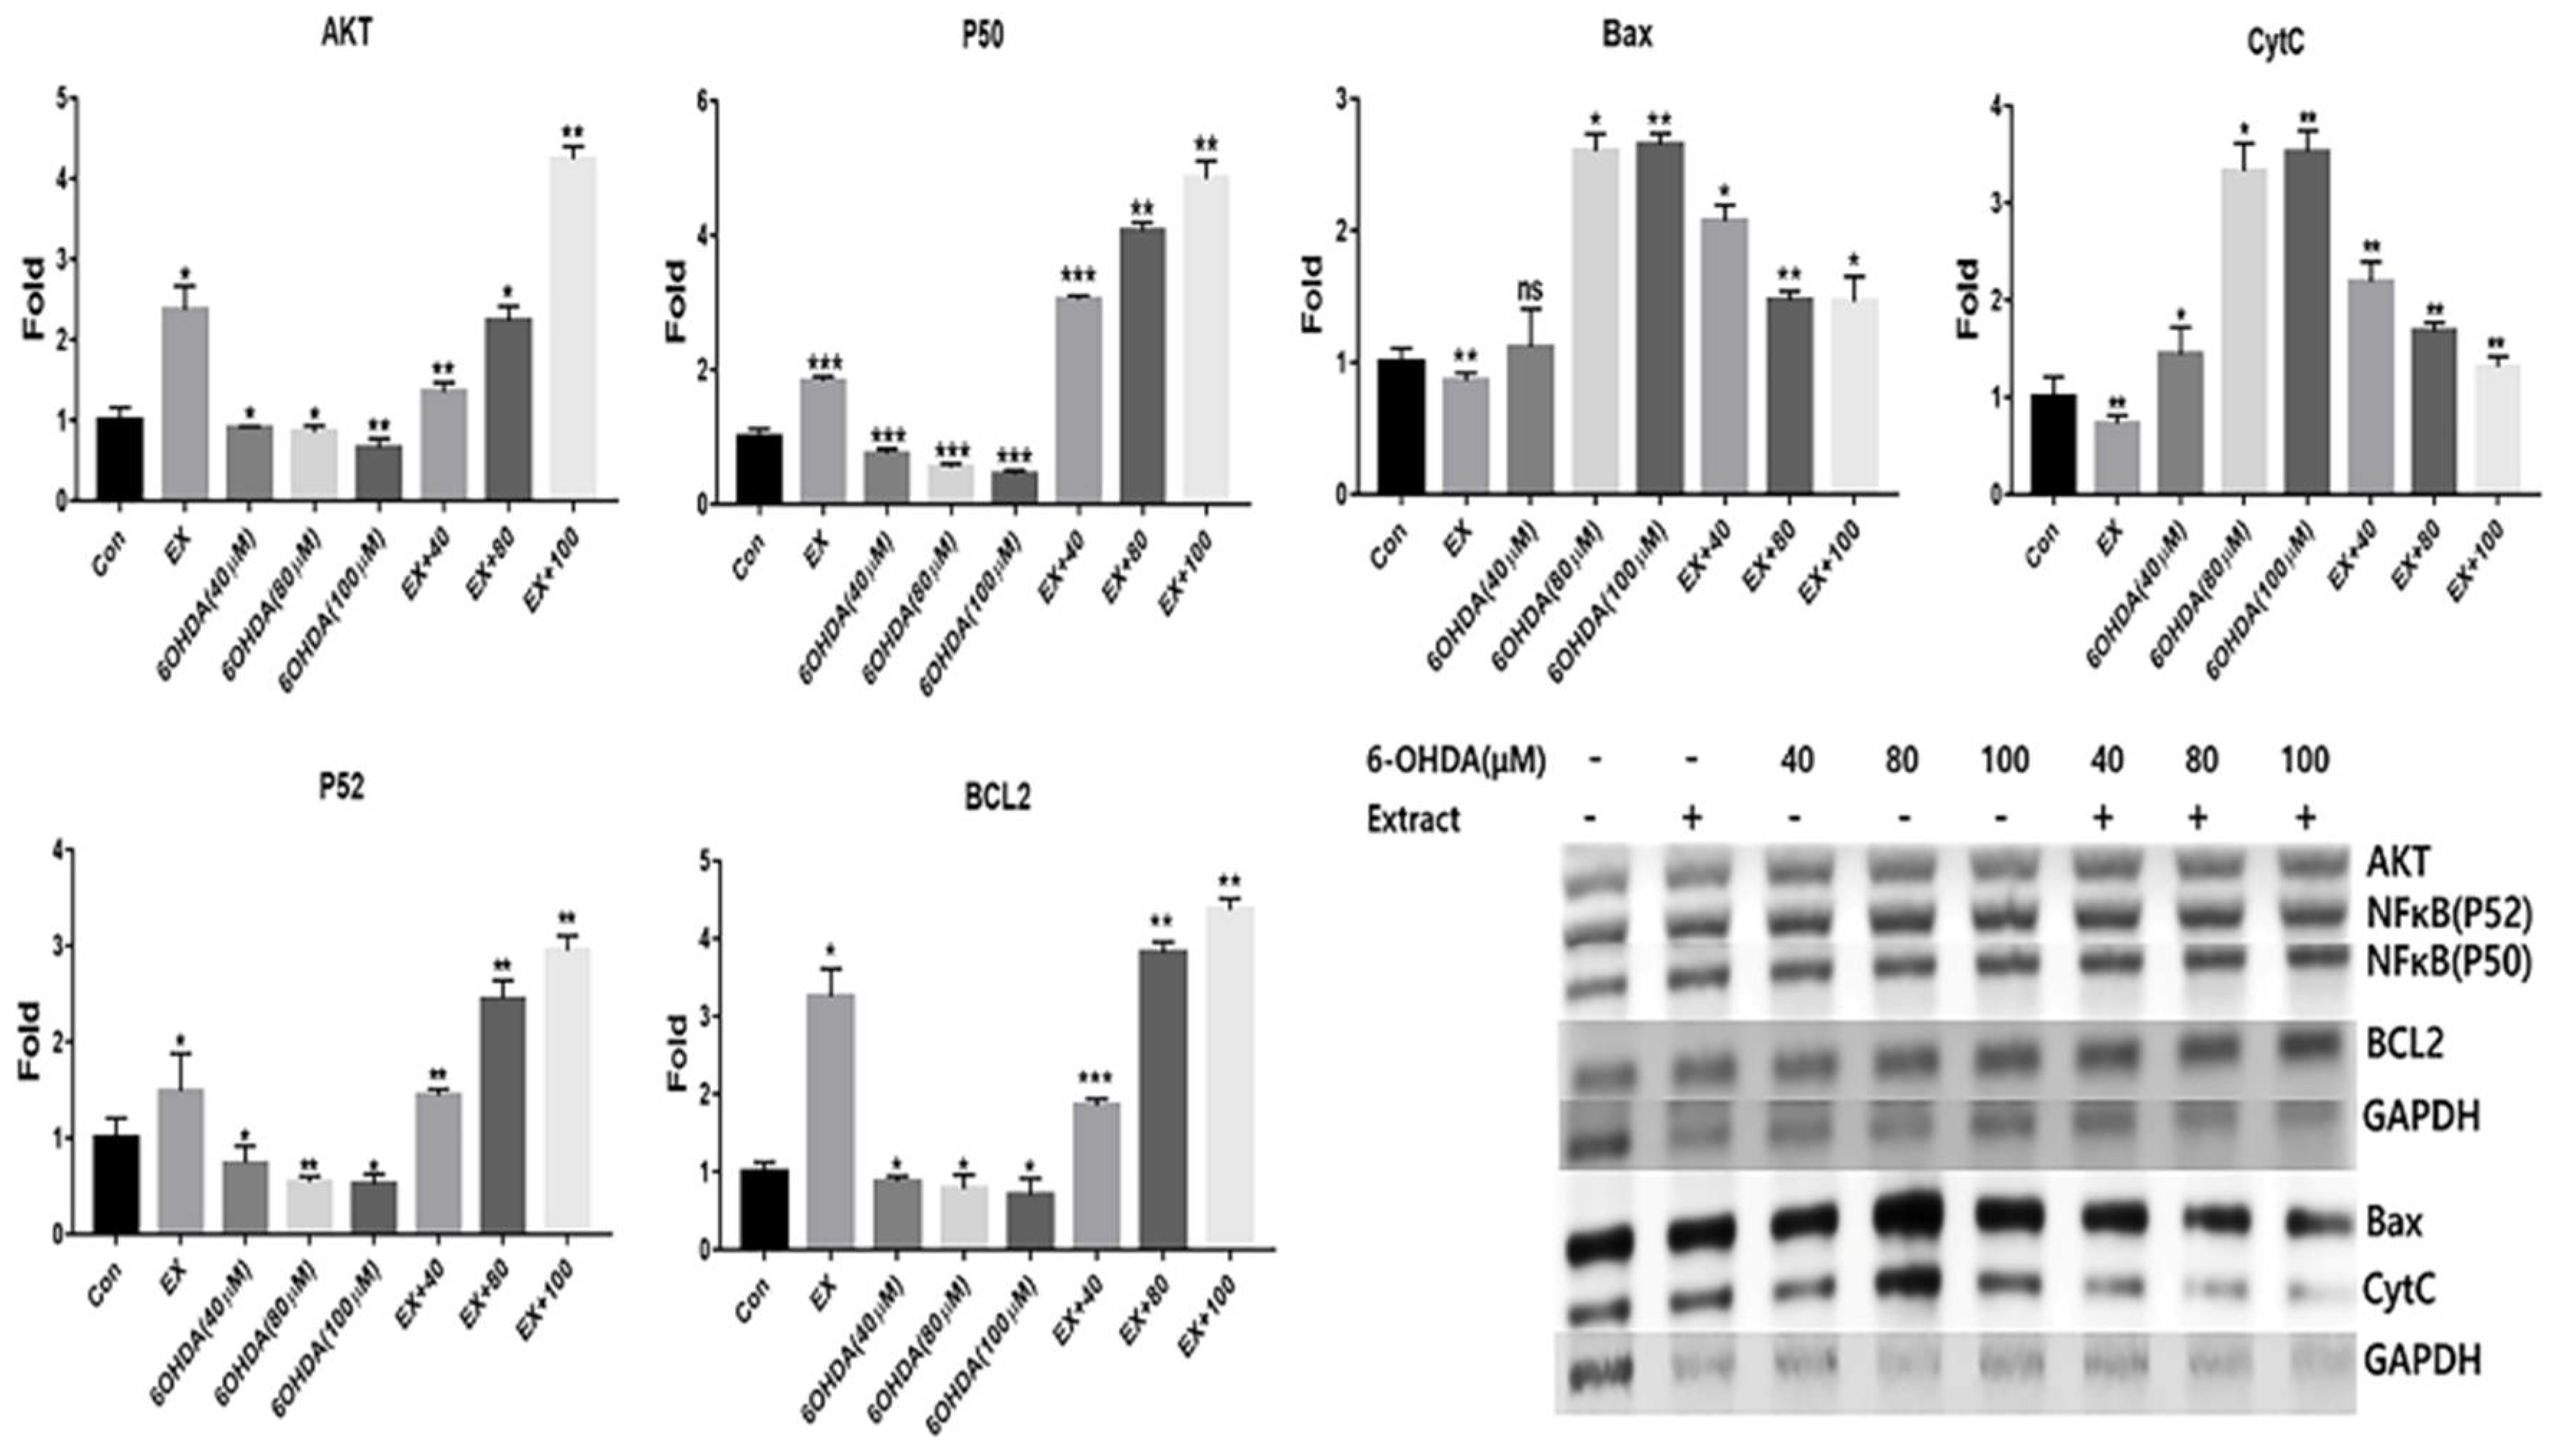
Figure 6.
Effects of the extract on oxidative stress in the CNS and VNS of brine shrimp.
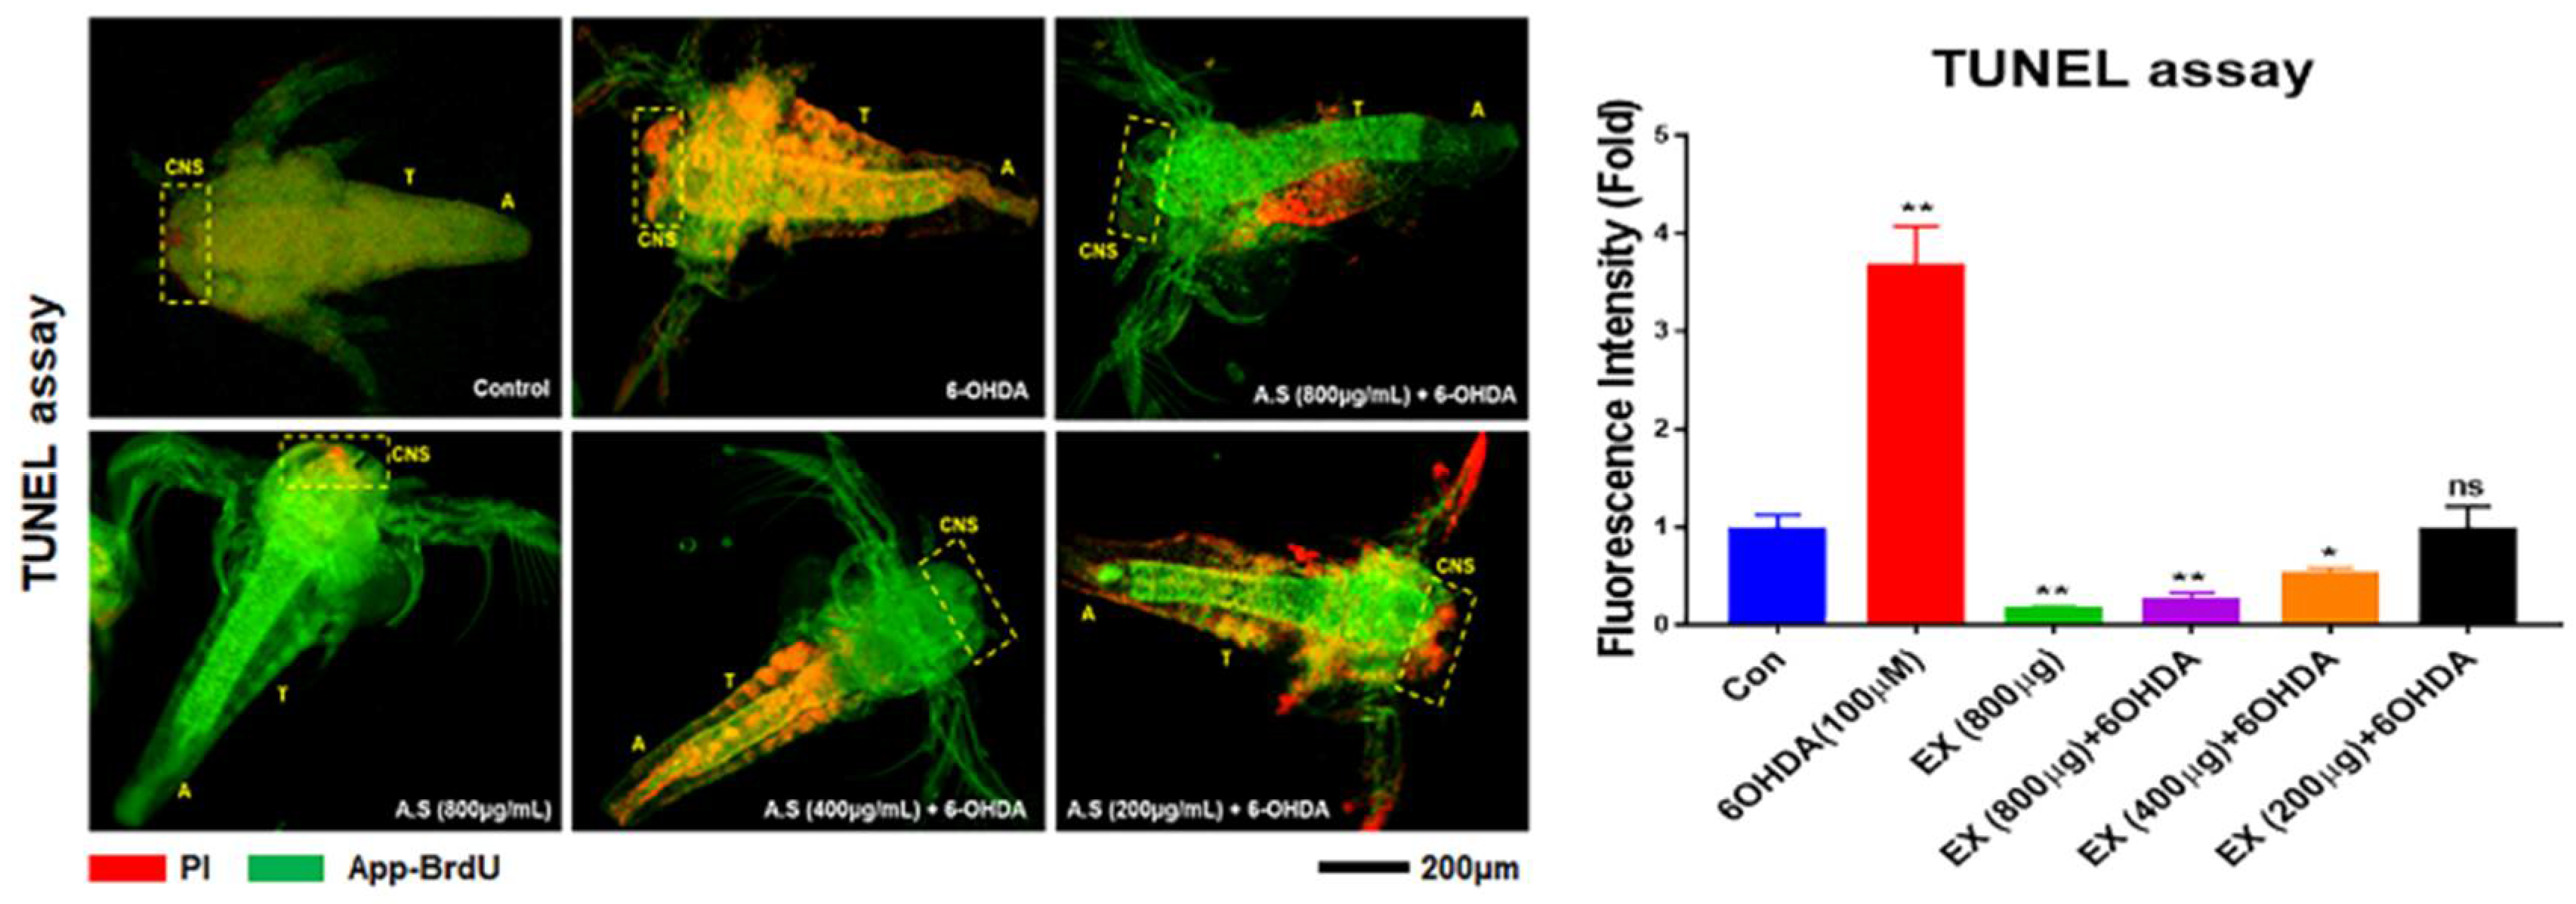
Figure 7.
Effects of the extract on mitochondrial apoptosis in the CNS and VC of brine shrimp.


Table 1.
The list of primers for qRT-PCR.
| Gene | F/R* | Seq (5’ → 3’) |
|---|---|---|
| AKT | F | GGCTGCCAAGTGTCAAATCC |
| R | AGTGCTCCCCCACTTACTTG | |
| NFκB-P50 | F | CGGAGCCCTCTTTCACAGTT |
| R | TTCAGCTTAGGAGCGAAGGC | |
| NFκB-P52 | F | AGGTGCTGTAGCGGGATTTC |
| R | AGAGGCACTGTATAGGGCAG | |
| Bcl2 | F | CTGCTGACATGCTTGGAAAA |
| R | ATTGGGCTACCCCAGCAATG | |
| BAX | F | AGCGCTCCCCCACTTACTTG |
| R | GACAGGGACATCAGTCGCTT | |
| Cyt | F | ATGAATGACCACTCTAGCCA |
| R | ATAGAAACAGCCAGGACCGC | |
| GAPDH | F | GTGGTCTCCTCTGACTTCAACA |
| R | CTCTTCCTCTTGTGCTCTTGCT |
Disclaimer/Publisher’s Note: The statements, opinions and data contained in all publications are solely those of the individual author(s) and contributor(s) and not of MDPI and/or the editor(s). MDPI and/or the editor(s) disclaim responsibility for any injury to people or property resulting from any ideas, methods, instructions or products referred to in the content. |
© 2024 by the authors. Licensee MDPI, Basel, Switzerland. This article is an open access article distributed under the terms and conditions of the Creative Commons Attribution (CC BY) license (http://creativecommons.org/licenses/by/4.0/).
Copyright: This open access article is published under a Creative Commons CC BY 4.0 license, which permit the free download, distribution, and reuse, provided that the author and preprint are cited in any reuse.


