Submitted:
06 May 2024
Posted:
09 May 2024
You are already at the latest version
Abstract
Pancreatic ductal adenocarcinoma (PDAC) is the fifth leading cause of cancer-related death in and presents the lowest 5-year survival rate for any form of cancer in the US. Only 20% of PDAC patients are suitable for surgical resection and adjuvant chemotherapy which remains the only curative treatment. Chemotherapeutic and genetherapy treatments are associated with adverse effects and lack specificity/efficacy. In this study we assess the oncolytic potential of immuno-oncolytic tanapoxvirus (TPV) recombinants expressing mouse monocyte chemoattractant protein (mMCP-1 or mCCL2), and mouse interleukin (mIL)-2, in human pancreatic BxPc-3 cells, using immunocompromised and CD-3+ T-cell reconstituted mice. Intratumoral treatment with TPV/∆66R/mCCL2 and TPV/∆66R/mIL-2 resulted in regression of BxPc-3 xenograft volume as compared to control in immunocompromised mice; mCCL-2 expressing TPV OV resulted in significant difference from control at p
Keywords:
pancreatic cancer
; tanapoxvirus
; oncolytic virus
; TPV
Introduction
Pancreatic Cancer: Overview, Pathology, Diagnosis and Treatment
Pancreatic cancer has one of the poorest prognoses of all common cancers, with under a 10% five-year survival rate [1]. Pancreatic ductal adenocarcinoma (PDAC) is the most common form of pancreatic cancer, accounting for about 90% of all cases of pancreatic cancer [2,3,4]. By 2030, PDAC is expected to become the second leading cause of cancer-related deaths in the United States [5,6]. The primary reason for low survival rate is a lack of direct or indirect diagnostic biomarkers for the disease which leads to late-stage diagnosis often preventing curative surgical resection [2,3]. Since complete resection is currently the only potential cure for PDAC, early detection is critical in the pursuit of increasing the median survival length of PDAC patients.
PDACs evolve through noninvasive precursor lesions, most typically pancreatic intraepithelial neoplasias, acquiring clonally selected genetic and epigenetic alterations and also evolve from intraductal papillary mucinous neoplasms or mucinous cystic neoplasms [7]. Genetic risk factors, or non-modifiable risk factors, are associated with causation in 5–10% of new cases of PDAC [8,9]. Lifestyle-related risk factors, or modifiable risk factors, which include smoking, obesity, alcohol abuse, and diabetes have also been linked to PDAC [10,11,12].
The most frequent genetic abnormalities in invasive PDAC were determined to be mutational activation of the KRAS oncogene, inactivation of tumor-suppressor genes CDKN2A, TP53, SMAD4, and BRCA2, widespread chromosomal losses, gene amplifications, and telomere shortening [13,14,15]. KRAS mutations and telomere shortening are the earliest known genetic abnormalities recorded, even in low-grade pancreatic intraepithelial neoplasia [15,16]. Telomere shortening corelates with chromosomal instability, whereas inactivation of TP53, SMAD4, and BRCA2 occurs in advanced pancreatic intraepithelial neoplasia and invasive carcinomas [17,18]. Epigenetic modifications have also been associated with PDAC [19,20,21,22,23,24,25,26,27,28,29].
Staging of PDAC is facilitated via diagnostic imaging using computed tomography (CT), magnetic resonance imaging (MRI), endoscopic ultrasonography and/or [18F]-fluorodeoxyglucose (FDG) Positron Emission Tomography / Computed Tomography (PET/CT). Due to the complexity of the PDC tumor microenvironment, up to 20% of patients are staged incorrectly upon primary diagnosis [30,31].
Contemporaneous treatment is surgical resection with adjuvant chemotherapy, though this is limited to only ~15% of patients. Since its adoption as common practice, surgical resection has demonstrated marked improvement in patient survival in combination therapy with gemcitabine and capecitabine [31,32,33]. The mFOLFIRINOX treatment regimen is an aggressive approach and which can increase the likelihood of resectability. However, the toxicity of the mFOLFIRINOX regimen limits its applicability to those patients considered to be able to withstand the greater potential for adverse side-effects [34]. The majority of PDAC cases, 80-90%, are comprised of patients presenting with locally advanced, non-resectable tumors and systemically disseminated metastases [35,36]. In locally advanced and metastatic PDAC, systemic chemotherapeutic regimens, such as nucleoside analogues, including gemcitabine and capecitabine, or the pyrimidine analogue 5-FU as monotherapies or in combination the mFOLFIRINOX, are employed as the standard of care to extend the life of the patient; reoccurrence is found in approximately 75% of patients within the first two years of treatment [32,33,37,38].
Several additional characteristics of PDAC present challenges for most therapeutic approaches, such as: composition of the tumor microenvironment presenting as dense fibrotic stroma and stellate cells that prevent or inhibit access of intended therapeutic agents to proliferating cells and expression of immunosuppressive factors [39]. PDAC tumors also do not appear to express neoantigens, thus immune system response to the tumor is limited [7]. As a result of these characteristics, treatment strategies involving use of OVs present unique challenges for therapeutic efficacy. To overcome the specific challenges associated with the microenvironment, Vitamin D and hyaluronidase, in conjunction with therapeutic agents, are currently being investigated for the potential to increase direct exposure and facilitate enhanced therapeutic efficacy [40,41].
Overview and Application of Oncolytic Viruses
The term “oncolytic and immuno-oncolytic virus” (OV) originated following the discovery and potential use of differing naturally occurring or genetically modified viruses as therapeutic agents in the treatment of various forms of cancer. Typically, these are non-pathogenic viral strains that demonstrate differing modes of selectivity for replication in cancer cells over noncancerous cells [42,43,44,45]. As standard practice for development of novel therapeutics, OVs have been assessed and have demonstrated efficacy in regression of differing forms of cancer in preclinical models [46]. The mechanism of action (MOA) of OVs differ widely, such as direct malignant cell lysis, expression of cytotoxic or immunomodulatory genes and inherent susceptibility of differing forms of cancer to viral replication [43,46,47]. The approach of genetically modifying wild-type (wt) virus to express immunomodulatory genes resulting in stimulation or suppression of the patient’s immune system results in an immunogenically “hot” environment around the tumor, which promotes regression of the malignant cell population [40,48,49].
There are a growing number of ongoing pre-clinical and clinical research programs assessing the potential of various OV platforms as a potential treatment of PDAC. Such programs are comprised of various families of viruses including, but not limited to, adenovirus (AV), herpes simplex virus (HSV), parvovirus (PV), reovirus (RV), vaccinia virus (VV) and protoparvovirus (PV) [50,51,52,53,54,55,56,57,58,59,60,61,62,63,64,65,66,67].
Overview and Application of Tanapox Oncolytic Virus
While the OV platforms of AV, HSV, PV and RV provide promising potential, the family of poxviruses present an inherent advantage given cancerous cells demonstrate greater vulnerability to poxviruses due to ineffective anti-viral, innate immune response pathways, unlike non-cancerous cells which respond acutely to poxvirus infection and impede viral replication [68]. Tanapoxvirus (TPV) is a DNA virus classified in the family Poxviridae and is a member of genus Yatapoxvirus. TPV is a potentially suitable OV candidate as pre-existing exposure and immunity in the general human population is limited since TPV exposure is restricted to equatorial Africa, lack of cross-reactivity with other poxviruses and mild illness with limited human-to-human transmission [69,70,71,72]. Furthermore, the large genome of TPV is a comprised of approximately 145 kb providing numerous transgenic modification sites to result in cell selectivity and immune modulation intended to enhance the oncolytic activity of TPV [73,74,75,76,77,78,79,80,81].
Several TPVs have been engineered with specific genetic modifications of wt TPV to generate recombinants with the intent to investigate this virus as an OV with enhanced research applications and oncolethality. Such genetic modifications include TPV thymidine kinase (TK) 66R, 2L (a high-affinity inhibitor of human tumor necrosis factor (TNF)) and TPV-15L (a functional mimic of the neuregulin (NRG) which acts through ErbB family of tyrosine kinase receptors) gene knockouts and monocyte chemoattractant protein (mMCP-1; also known as mCCL2), mouse interleukin (mIL)-2, enhanced green fluorescent protein (eGFP) and monomeric red fluorescent protein (mCherry) gene knock-ins [74,75,76]. A number of these TPV recombinants have also been assessed for preclinical therapeutic efficacy against various forms of cancer including human colorectal cancer, melanoma and triple negative breast cancer (TNBC) xenografts in nude mice [82,83,84].
Herein we describe our assessment of the oncolytic potential of three TPV recombinants, TPV/eGFP, TPV/∆66R/m-CCL-2/mCherry and TPV/∆66R/m-IL-2/mCherry, against human pancreatic cancer xenografts in an immunodeficient, athymic nude mouse model and immunocompetent, athymic nude mouse model following adoptive transfer of CD3+ T-cells. TPV/eGFP was used a “wt” control virus and TPV/∆66R/m-CCL-2/mCherry and TPV/∆66R/m-IL-2/mCherry were selected specifically to assess mCCL-2 and mIL-2 immunomodulatory activity in combination with TPV oncolytic activity against pancreatic cancer due to known biological activity of mCCL-2 and mIL-2 [85,86,87,88,89,90,91,92,93,94].
The athymic nude murine model has been the predominant preclinical model used by investigators in our laboratory [82,83,84,95]. The athymic mouse model is an immunodeficient preclinical model due to lack of peripheral T lymphocytes and functional adoptiveimmune system, although immature CD3+ T cells have been reported [84]. Yet the athymic nude moues has an intact and functional innate immune system with active macrophages, NK cells, granulocytes, B cells, dendritic cells. This model also has a compensatory increase in population of anti-tumor macrophages and NK cells with macrophages being the predominant mononuclear cell type [96,97]. Thus, the athymic nude mouse model was determined be to an appropriate and acceptable preclinical model to assess the oncolytic potential of TPV recombinants expressing mCCL-2 and mIL-2 in this study. In this study we also assessed the oncolytic potential of the TPV recombinants in cohorts of immunocompromised athymic nude mice which received adoptive transfer of CD3+ T cells following isolation and purification from immunocompetent BALB-c donor animals. Recipient animal strain was selected to be BALB/c (CanN.Cg-Foxn1nu/Crl) aythymic nude mice as this strain is genetically identical to normal BALB/c mice at the immunological compatibility level. This approach allowed direct assessment and comparison of results of the TPV recombinants’ efficacy between mirrored cohorts of animals with either an immunocompromised or immune reconstituted immune system.
Our results demonstrate TPV recombinants expressing mCCL-2 and mIL-2 were more effective in regression of BxPc-2 pancreatic tumor volume and tumor proliferation rate as compared to TPV/eGFP control recombinant, with the mCCL-2 recombinant reaching statistical significance compared to vehicle treated control animals in immunocompromised athymic nude mice. Results in all cohorts of immune reconstituted mice receiving adoptive CD3+ T cell transfer were indicative of immune system rejection of the BxPc-3 xenografts.
Results
Replication Kinetics of TPV in Human Pancreatic Cancer Cells
Replication competency was confirmed for all TPV recombinants in BxPC-3 pancreatic cancer cells. Similarly, reporter gene expression was confirmed for all TPV recombinants via phase contrast and fluorescent microscopy demonstrating eGFP or mCherry protein expression in association with viral plaque formation consistent with TPV infected cells.
Replication efficiency of each TPV recombinant in BxPC-3 human PDAC cells was assessed via viral plaque assay and results demonstrated replication efficiency for all recombinants was comparable to published data for each TPV recombinant cultured in Owl Monkey Kidney (OMK) cells which serve as primary cell line for TPV production as previously reported [82,83,84,95].
Treatment if BxPc-3 Xenografts with Tanapoxvirus Recombinants In Vivo
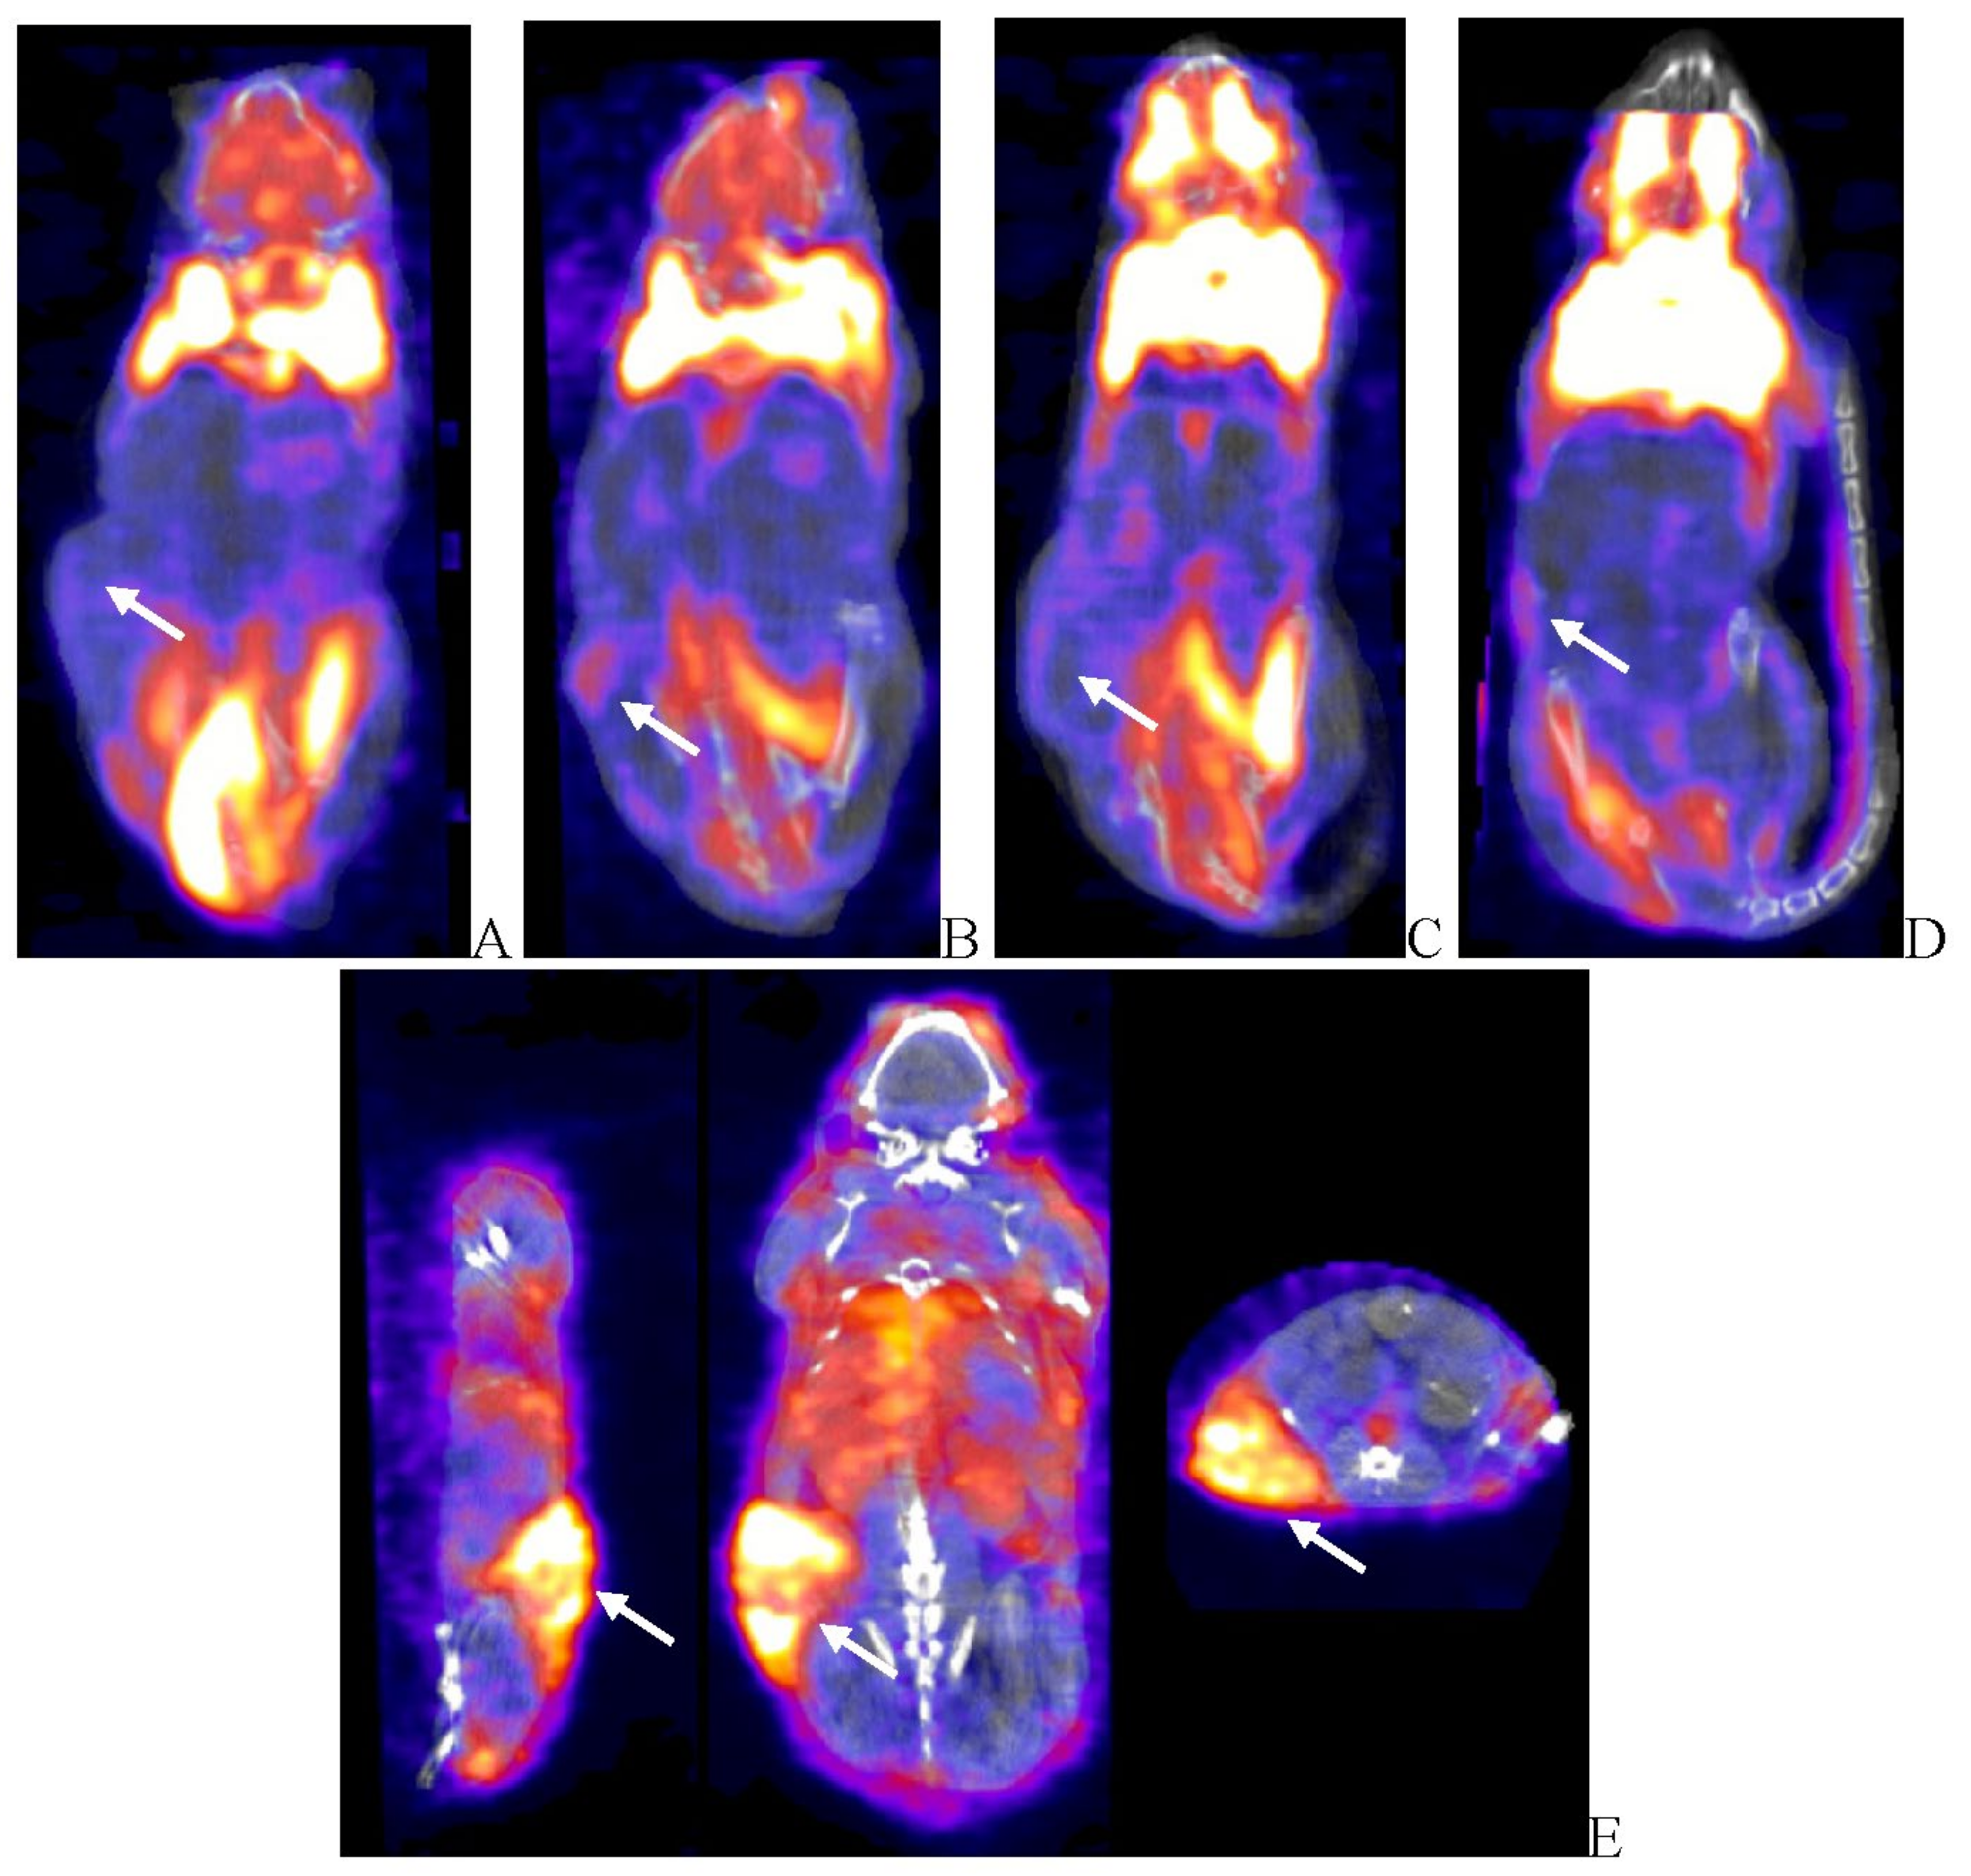
Tumor volume was measured through the course of the study on 3-day intervals; tumors in many subjects were noted to be tangibly multi-compartmental when physically palpated for tumor measurement. Multi-compartmental composition of tumor masses was also demonstrated through PET/CT imaging (Figure 6E and Figure 11A). Results of tumor volume over time for each study cohort are shown in Figure 3 and Figure 4. When assessed in the immunocompromised BALB-c nude mice model, each TPV recombinant demonstrated regression of BxPc-3 human PDAC cells as compared to immunocompromised, vehicle treated control subjects. While TPV/eGFP and TPV/∆66R/m-IL-2/mCherry demonstrated a trend of regressed tumor volume over the course of the study, both recombinants failed to reach statistical significance (Figure 3A,B). However, TPV/∆66R/m-CCL-2/mCherry virotherapy achieved statistical significance (p<0.05) at approximately 30 days post treatment; see Figure 3 C. When assessed in the CD-3+ T-cell-mediated immune reconstituted, BALB-c nude mice, each TPV recombinant demonstrated relatively equivalent regression of BxPc-3 tumor volume as compared to immune reconstituted, vehicle treated control subjects (Figure 2.). TPV/∆66R/m-IL-2/mCherry and TPV/∆66R/m-CCL-2/mCherry virotherapy in immune reconstituted animals demonstrated similar trends over the course of the study with results from both recombinants showing less overall regression of tumor volume as compared to control (Figure 2 B and C). TPV/∆66R/m-CCL-2/mCherry reached statistically greater, p<0.05, mean tumor volume as compared control at approximately 30 days post virotherapy (Figure 2A,C). However, TPV/eGFP recombinant treated subjects demonstrated relatively consistent tumor growth regression effect as compared to control through the course of the study; see Figure 4 A. CD-3+ T-cell-mediated immune reconstituted control mice demonstrated statistically significant, p<0.01, regressed tumor volume as compared to control immunocompromised mice at approximately 27 days post vehicle treatment (Figure 3).
Figure 1.
Immunocompromised Group Mean Tumor Volume BxPc-3 human PDAC cells were inoculated subcutaneously (SC) in the right flank region of immunocompromised, female, BALB-c Nude Mice. Each subject received a single inoculation of 5 x 10⁶ cells / subject. Total volume measurement was conducted every three days ((length) x (width) x (height) x (Π/6)). When tumors reached approximately 200 mm3, approximately 27-days post-inoculation, animals were randomly assigned to study treatment groups based on tumor volume to achieve equivalent average group tumor volume in as much as possible. Each subject was treated with a single, intratumoral administration of 100 µL PBS formulation vehicle or 100X virus stock of each applicable recombinant virus to result in a virus mass dose of 5 x 10⁶ plaque forming units (pfu) per animal. Vehicle control average tumor volume is shown in each plot as “X” plot line (blue) and used as comparator for each TPV recombinant experimental group- TPV/eGFP (A), TPV/∆66R/m-IL-2/mCherry (B) and TPV/∆66R/m-CCL-2/mCherry (C). Bars show standard error of the mean (±1 SEM) and where applicable an asterisk (*) indicate statistically significant regression of TPV/∆66R/m-CCL-2/mCherry recombinant from vehicle control (P<0.05).
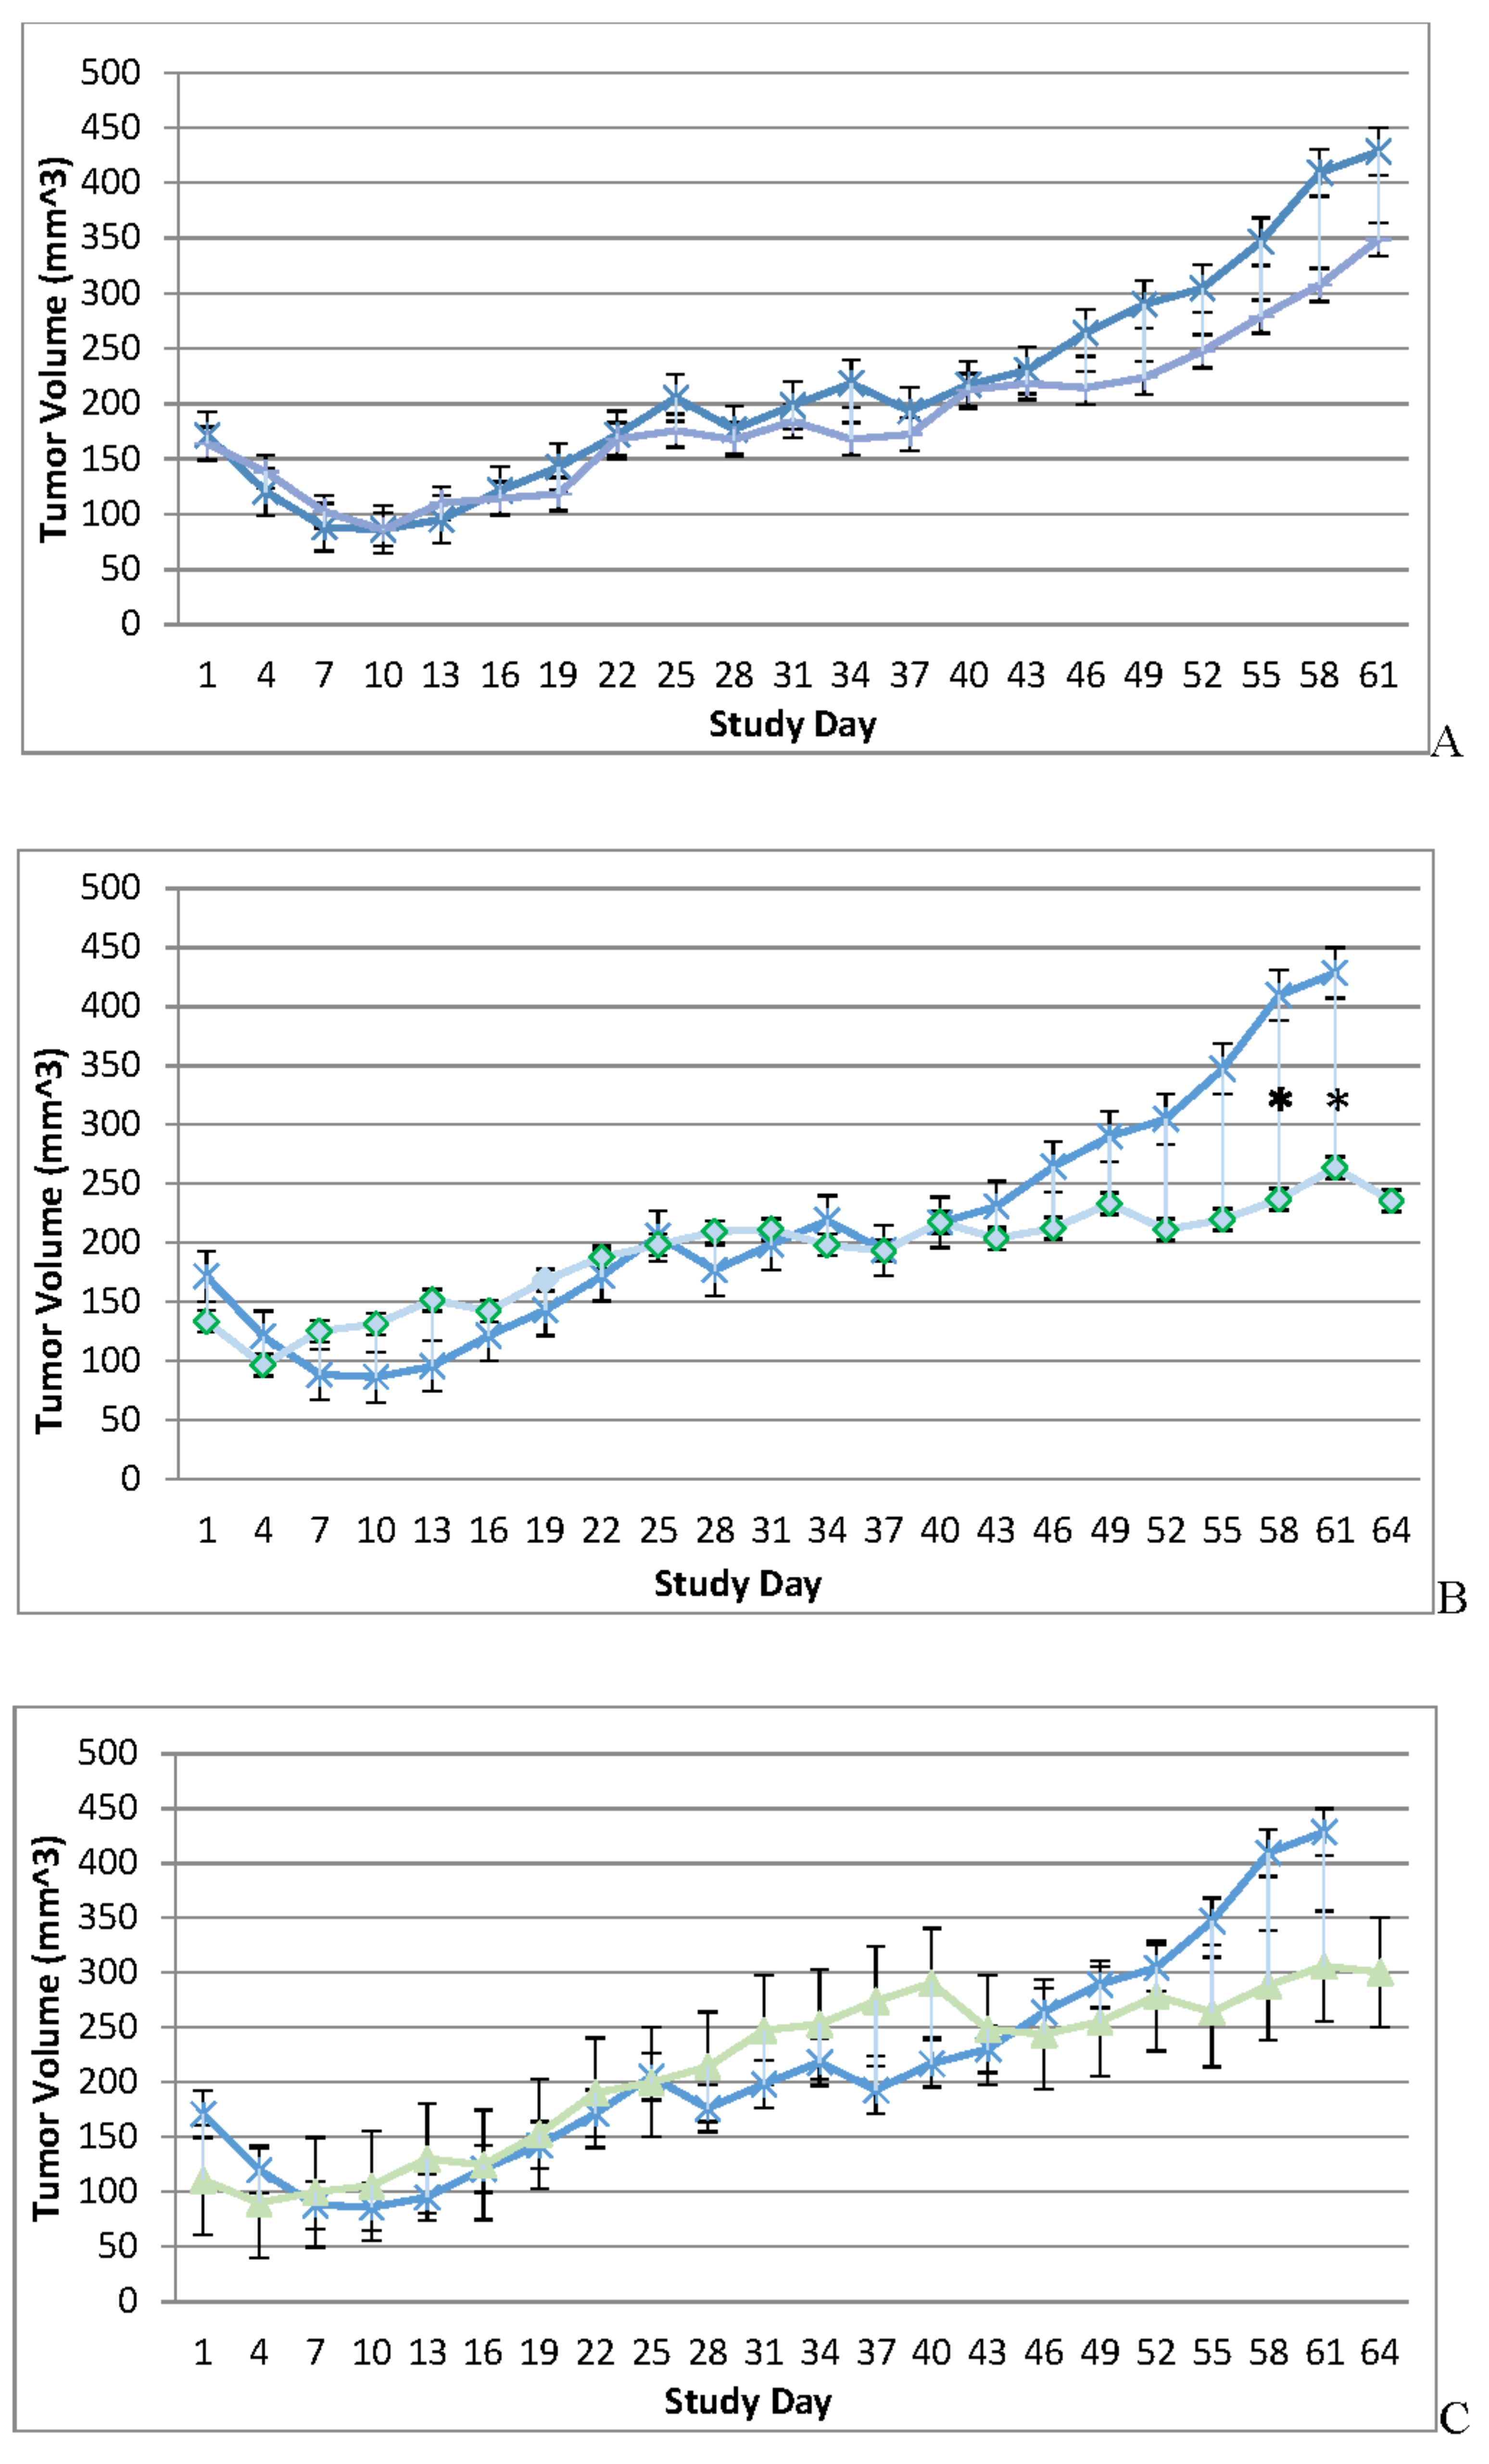
Figure 2.
Immune Reconstituted Group Mean Tumor Volume BxPc-3 human PDAC cells were inoculated subcutaneously (SC) in the right flank region of immune reconstituted, female, BALB-c Nude Mice. Each subject received a single inoculation of 5 x 10⁶ cells / subject. Total volume measurement was conducted every three days ((length) x (width) x (height) x (Π/6)). When tumors reached approximately 200 mm3, approximately 27-days post-inoculation, animals were randomly assigned to study treatment groups based on tumor volume to achieve equivalent average group tumor volume in as much as possible. Each subject was treated with a single, intratumoral administration of 100 µL PBS formulation vehicle or 100X virus stock of each applicable recombinant virus to result in a virus mass dose of 5 x 10⁶ plaque forming units (pfu) per animal. Four days post vehicle control or virotherapy, each subject received CD-3+ T-cell adoptive cell transfer (5 x 10⁶ cells/subject) via tail vein administration. Vehicle control average tumor volume is shown in each plot filled, green circle and plot line (green) and used as comparator for each TPV recombinant experimental group- TPV/eGFP (A), TPV/∆66R/m-IL-2/mCherry (B) and TPV/∆66R/m-CCL-2/mCherry (C). Bars show standard error of the mean (±1 SEM) and where applicable an asterisk (*) indicate statistically significant greater mean group tumor volume of TPV/∆66R/m-CCL-2/mCherry recombinant from vehicle control (P<0.05).
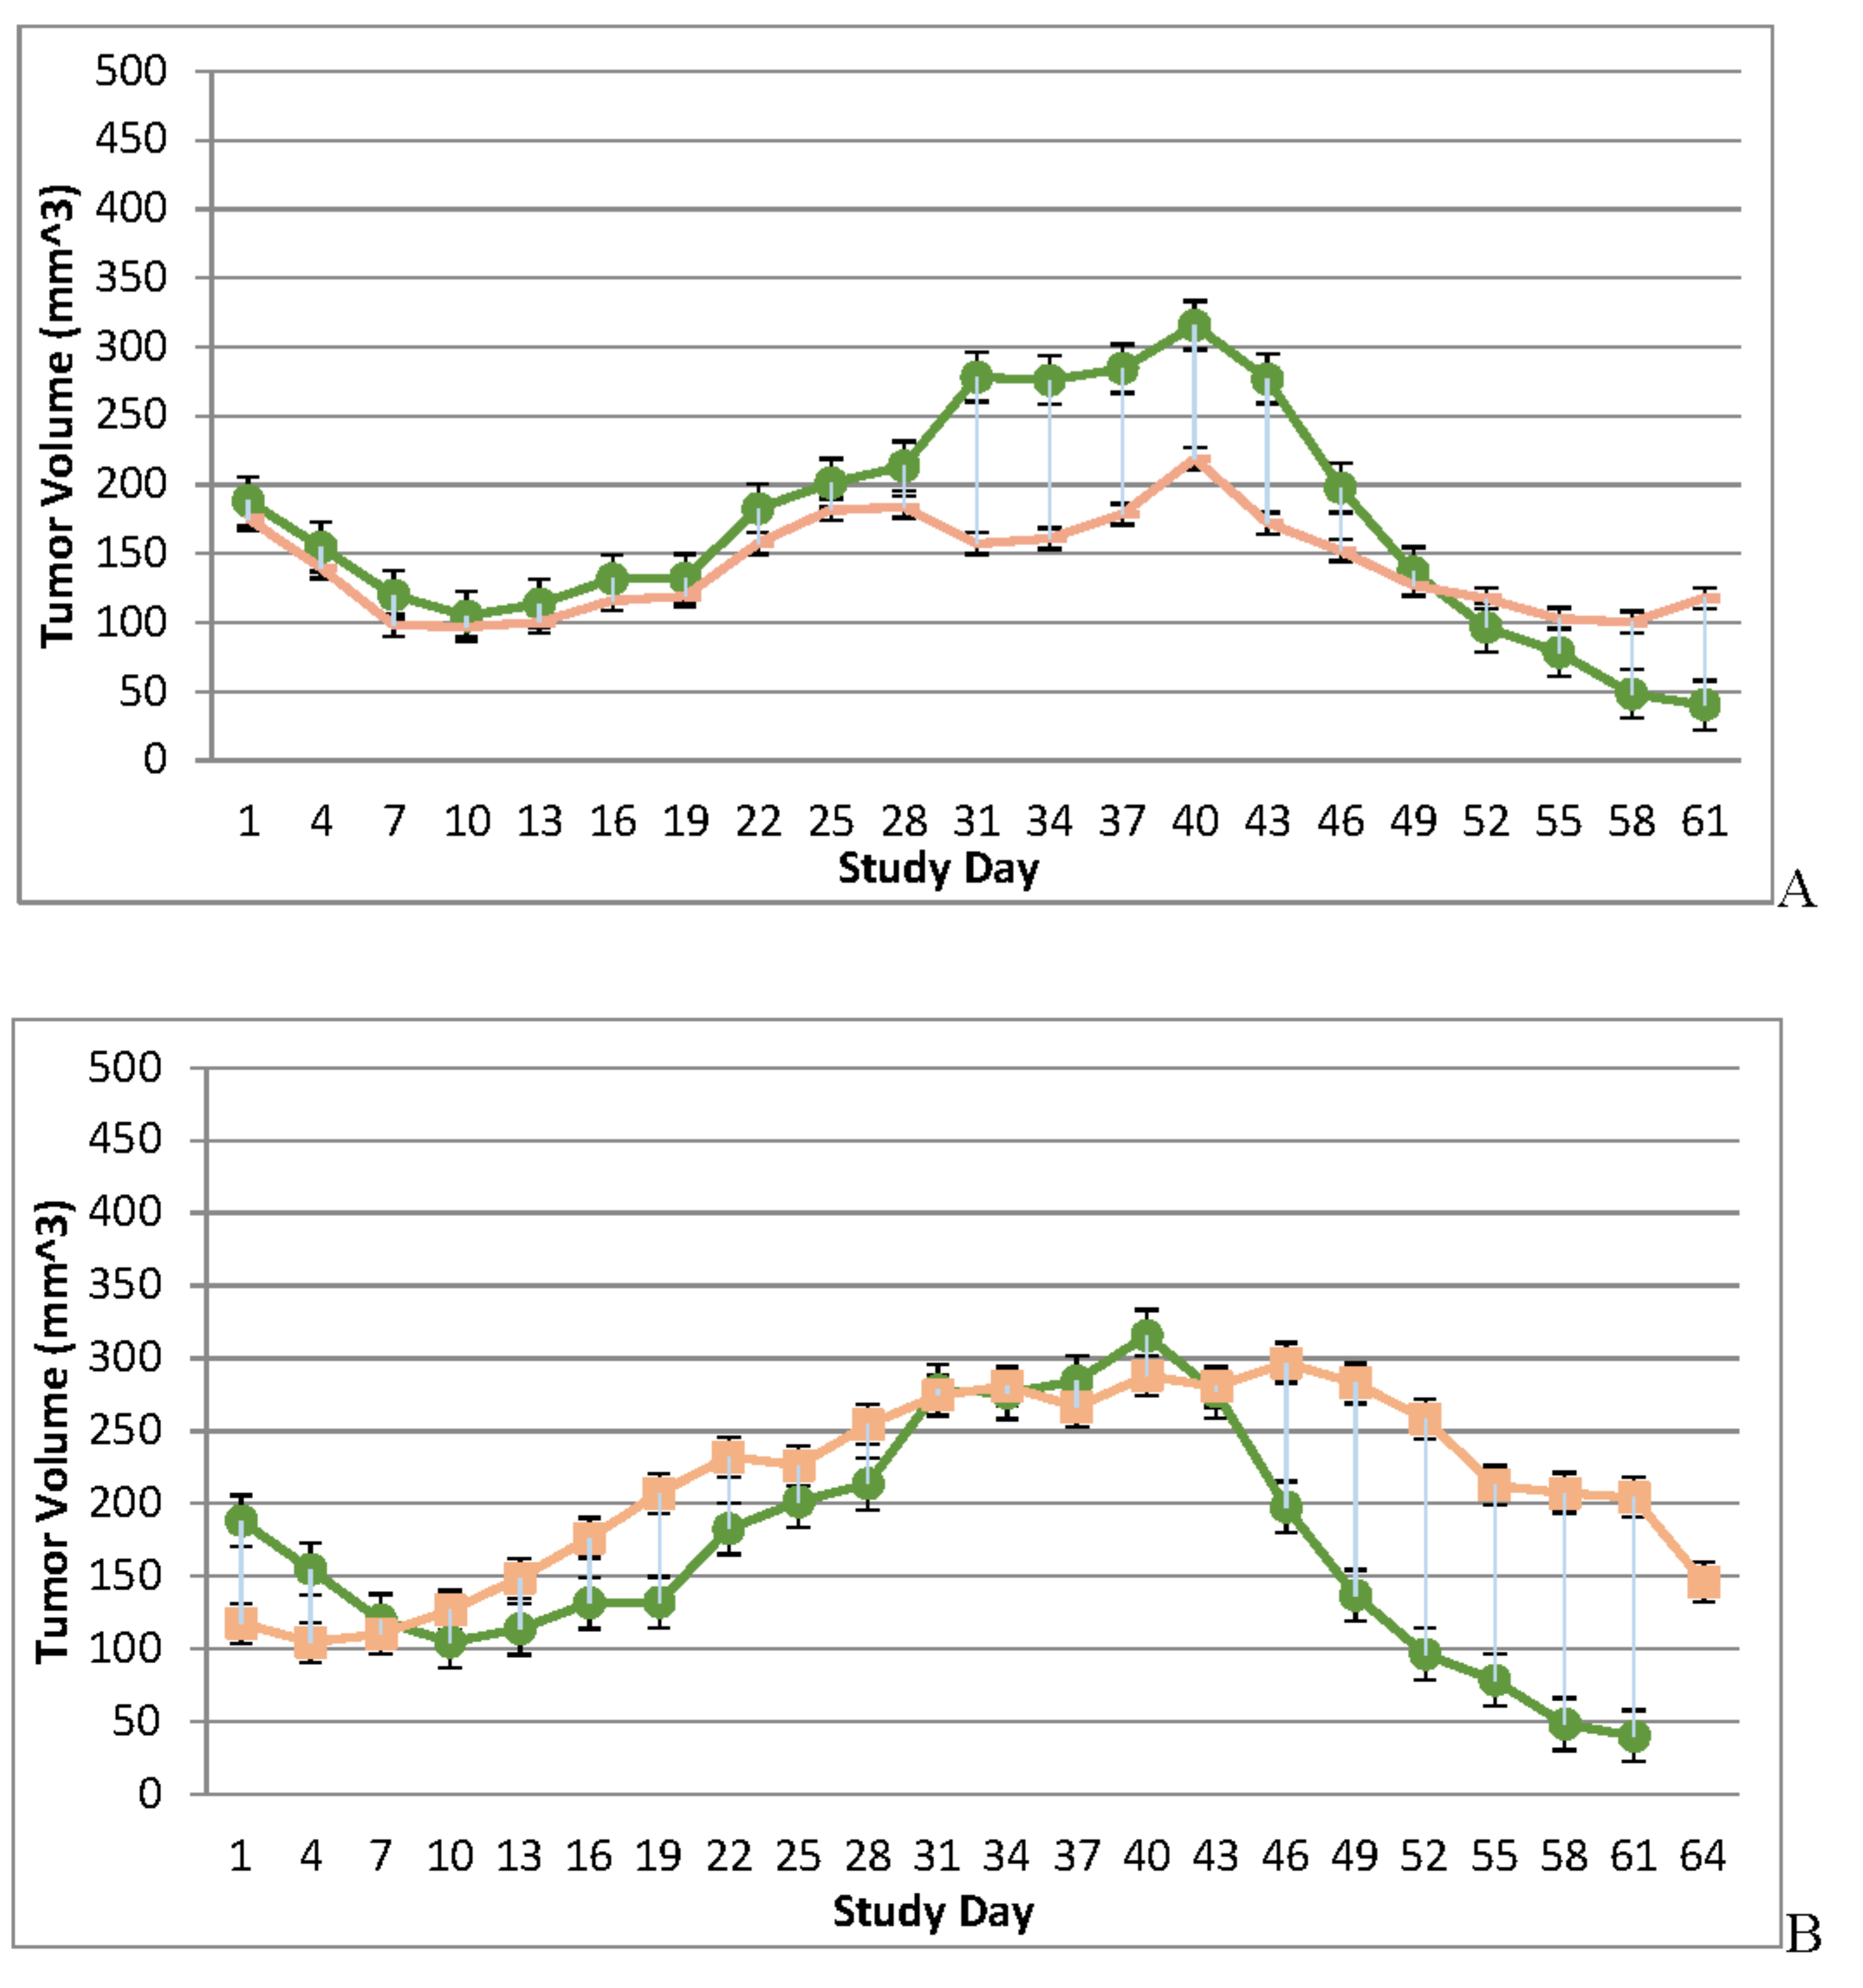
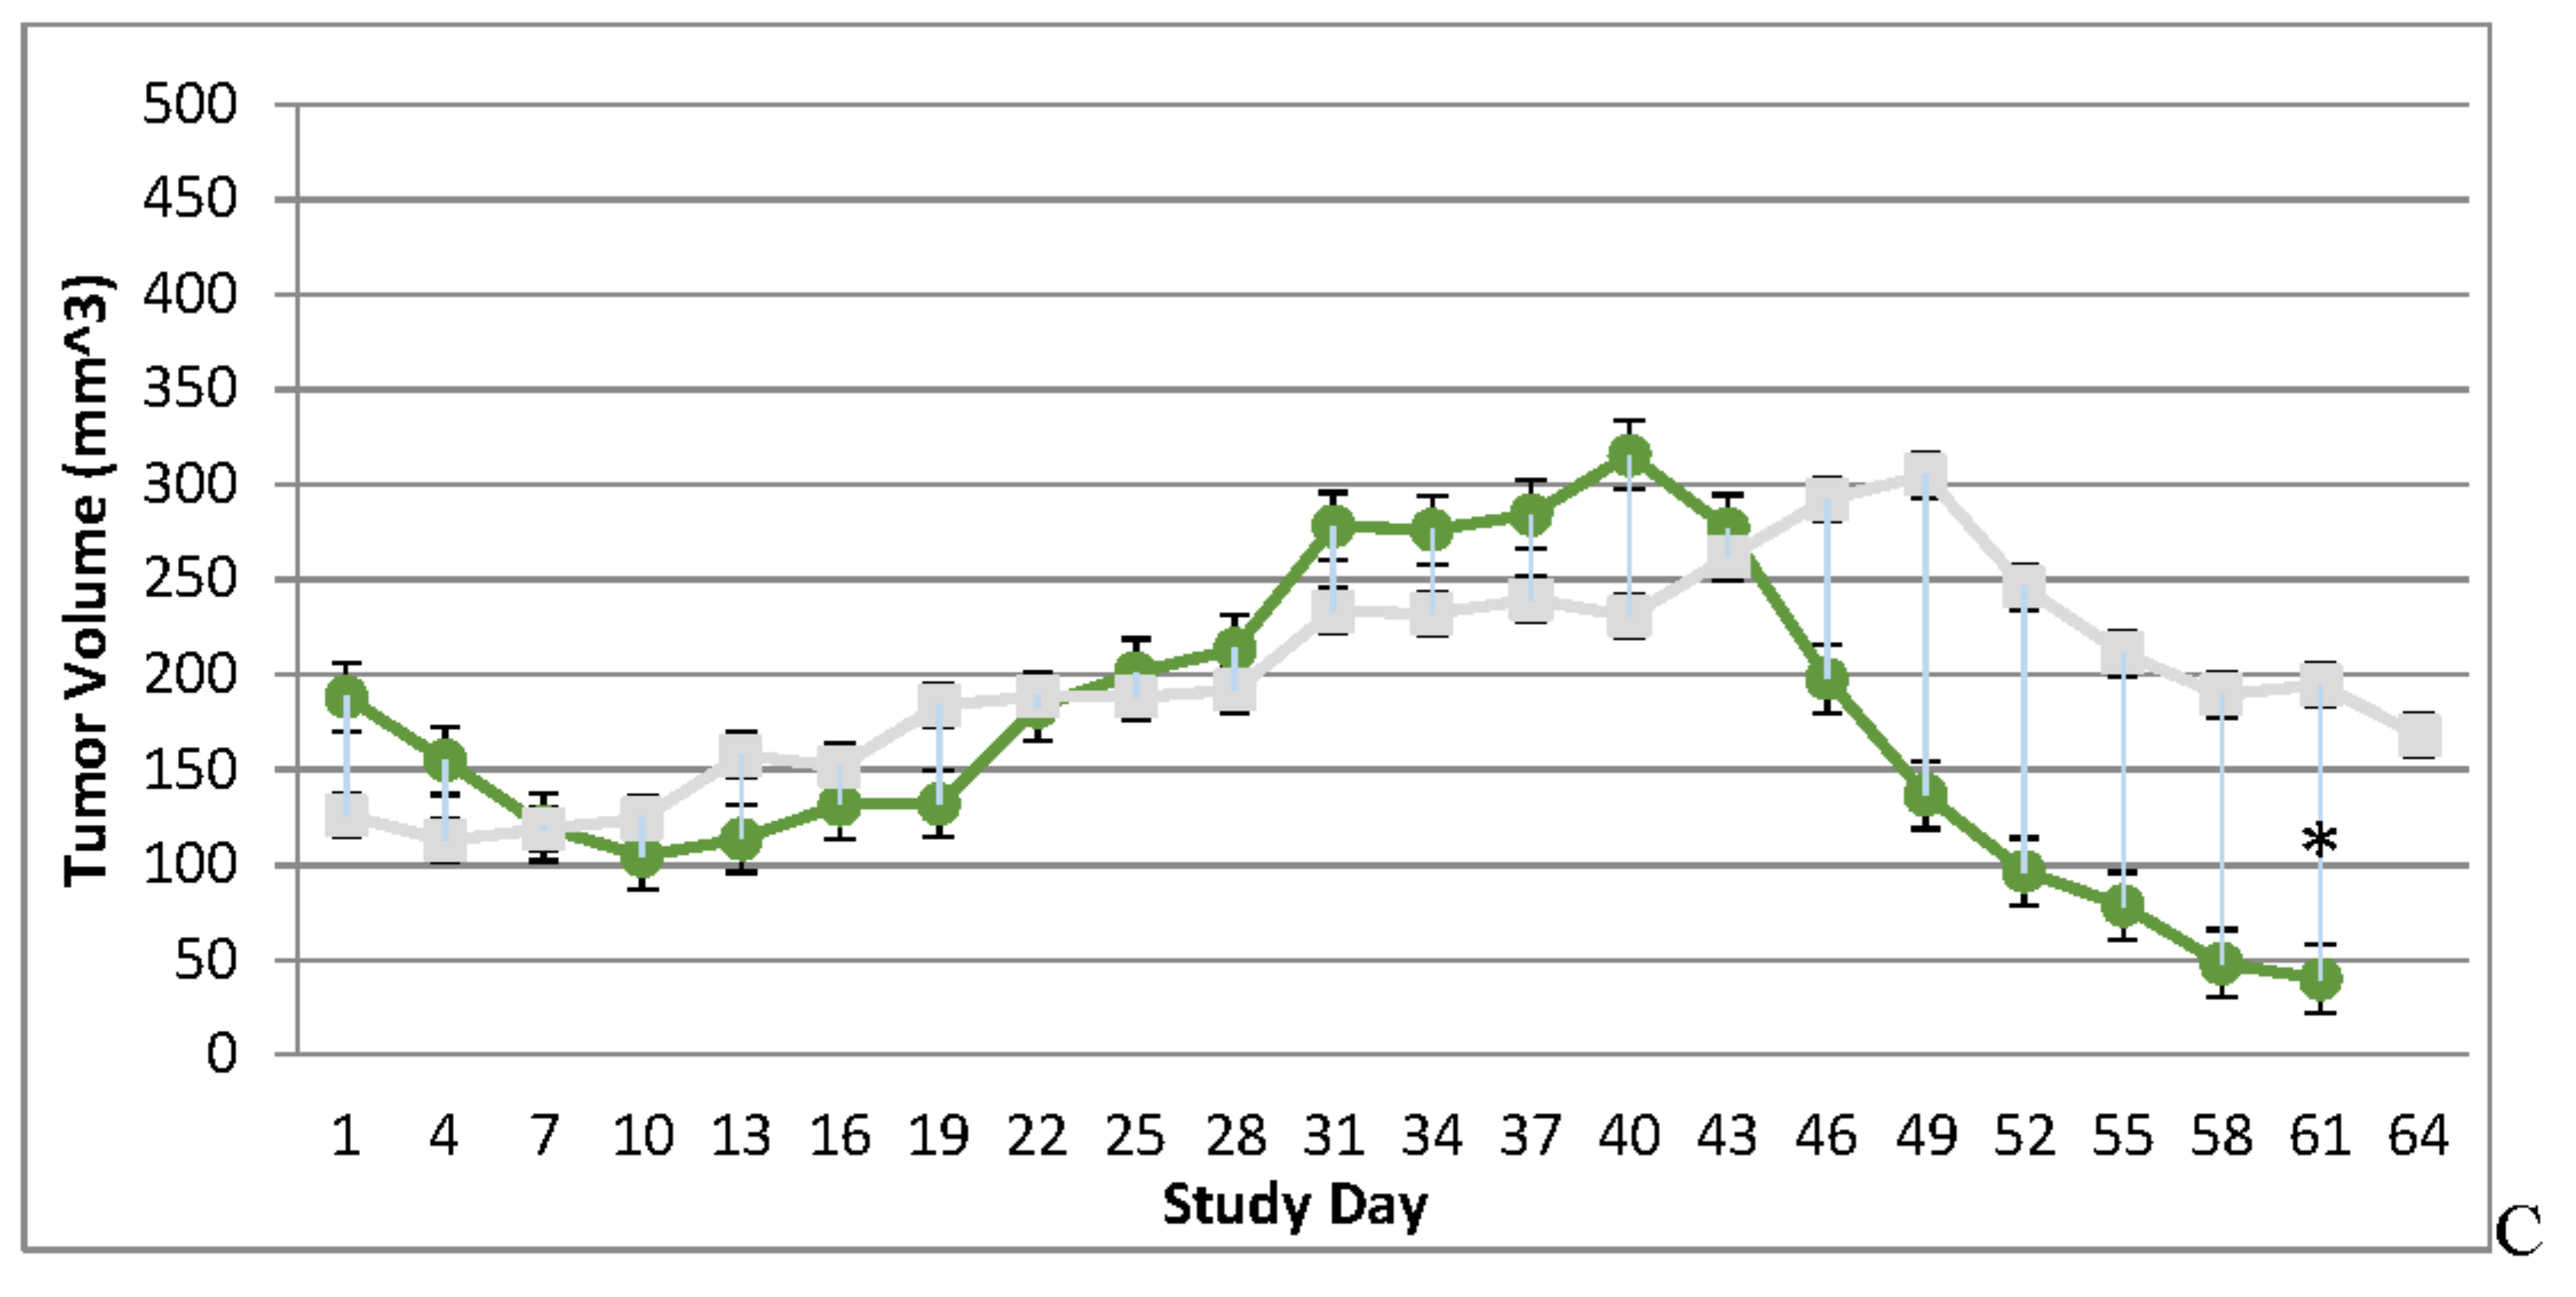
Figure 3.
Immunocompromised and Immune Reconstituted Vehicle Control Group Mean Tumor Volume BxPc-3 human PDAC cells were inoculated subcutaneously (SC) in the right flank region of immunocompromised and immune reconstituted, female, BALB-c Nude Mice. Each subject received a single inoculation of 5 x 10⁶ cells / subject. Total volume measurement was conducted every three days ((length) x (width) x (height) x (Π/6)). When tumors reached approximately 200 mm3, approximately 27-days post-inoculation, animals were randomly assigned to study treatment groups based on tumor volume to achieve equivalent average group tumor volume in as much as possible. Each subject was treated with a single, intratumoral administration of 100 µL PBS formulation vehicle. Four days post vehicle control, each immune reconstituted subject received CD-3+ T-cell adoptive cell transfer (5 x 10⁶ cells/subject) via tail vein administration. Immunocompromised vehicle control average tumor volume is shown in the plot as “X” plot line (blue) and immune reconstituted, vehicle control average tumor volume is displayed as filled, green circles and plot line (green). Bars show standard error of the mean (±1 SEM) and where applicable an asterisk (*) indicate statistically significant difference in mean group tumor volume between the vehicle treated control groups (P<0.01).
Figure 4.
Immunocompromised Group Mean Tumor [18F]-FDG PET/CT Derived Standardized Uptake Value (SUV) and Total Lesion Glycolysis (TLG) BxPc-3 human PDAC cells were inoculated subcutaneously (SC) in the right flank region of immunocompetent, female, BALB-c Nude Mice. Each subject received a single inoculation of 5 x 10⁶ cells / subject. Each subject was treated with a single, intratumoral administration of 100 µL PBS formulation vehicle or 100X virus stock of each applicable recombinant virus to result in a virus mass dose of 5 x 10⁶ plaque forming units (pfu) per animal when tumors reached approximately 200 mm3. Baseline, prior to virotherapy, [18F]-FDG PET/CT images (200 µCi/subject) were acquired 3-weeks post BxPc-3 cell inoculation and post-virotherapy images were collected at 7–8-weeks post inoculation. Bars show standard error of the mean (±1 SEM), SUV results for each respective group are shown in plot A and TLG results are show in plot B; inter- and intragroup statistical comparisons resulted in lack of statistical significance for all comparisons. .
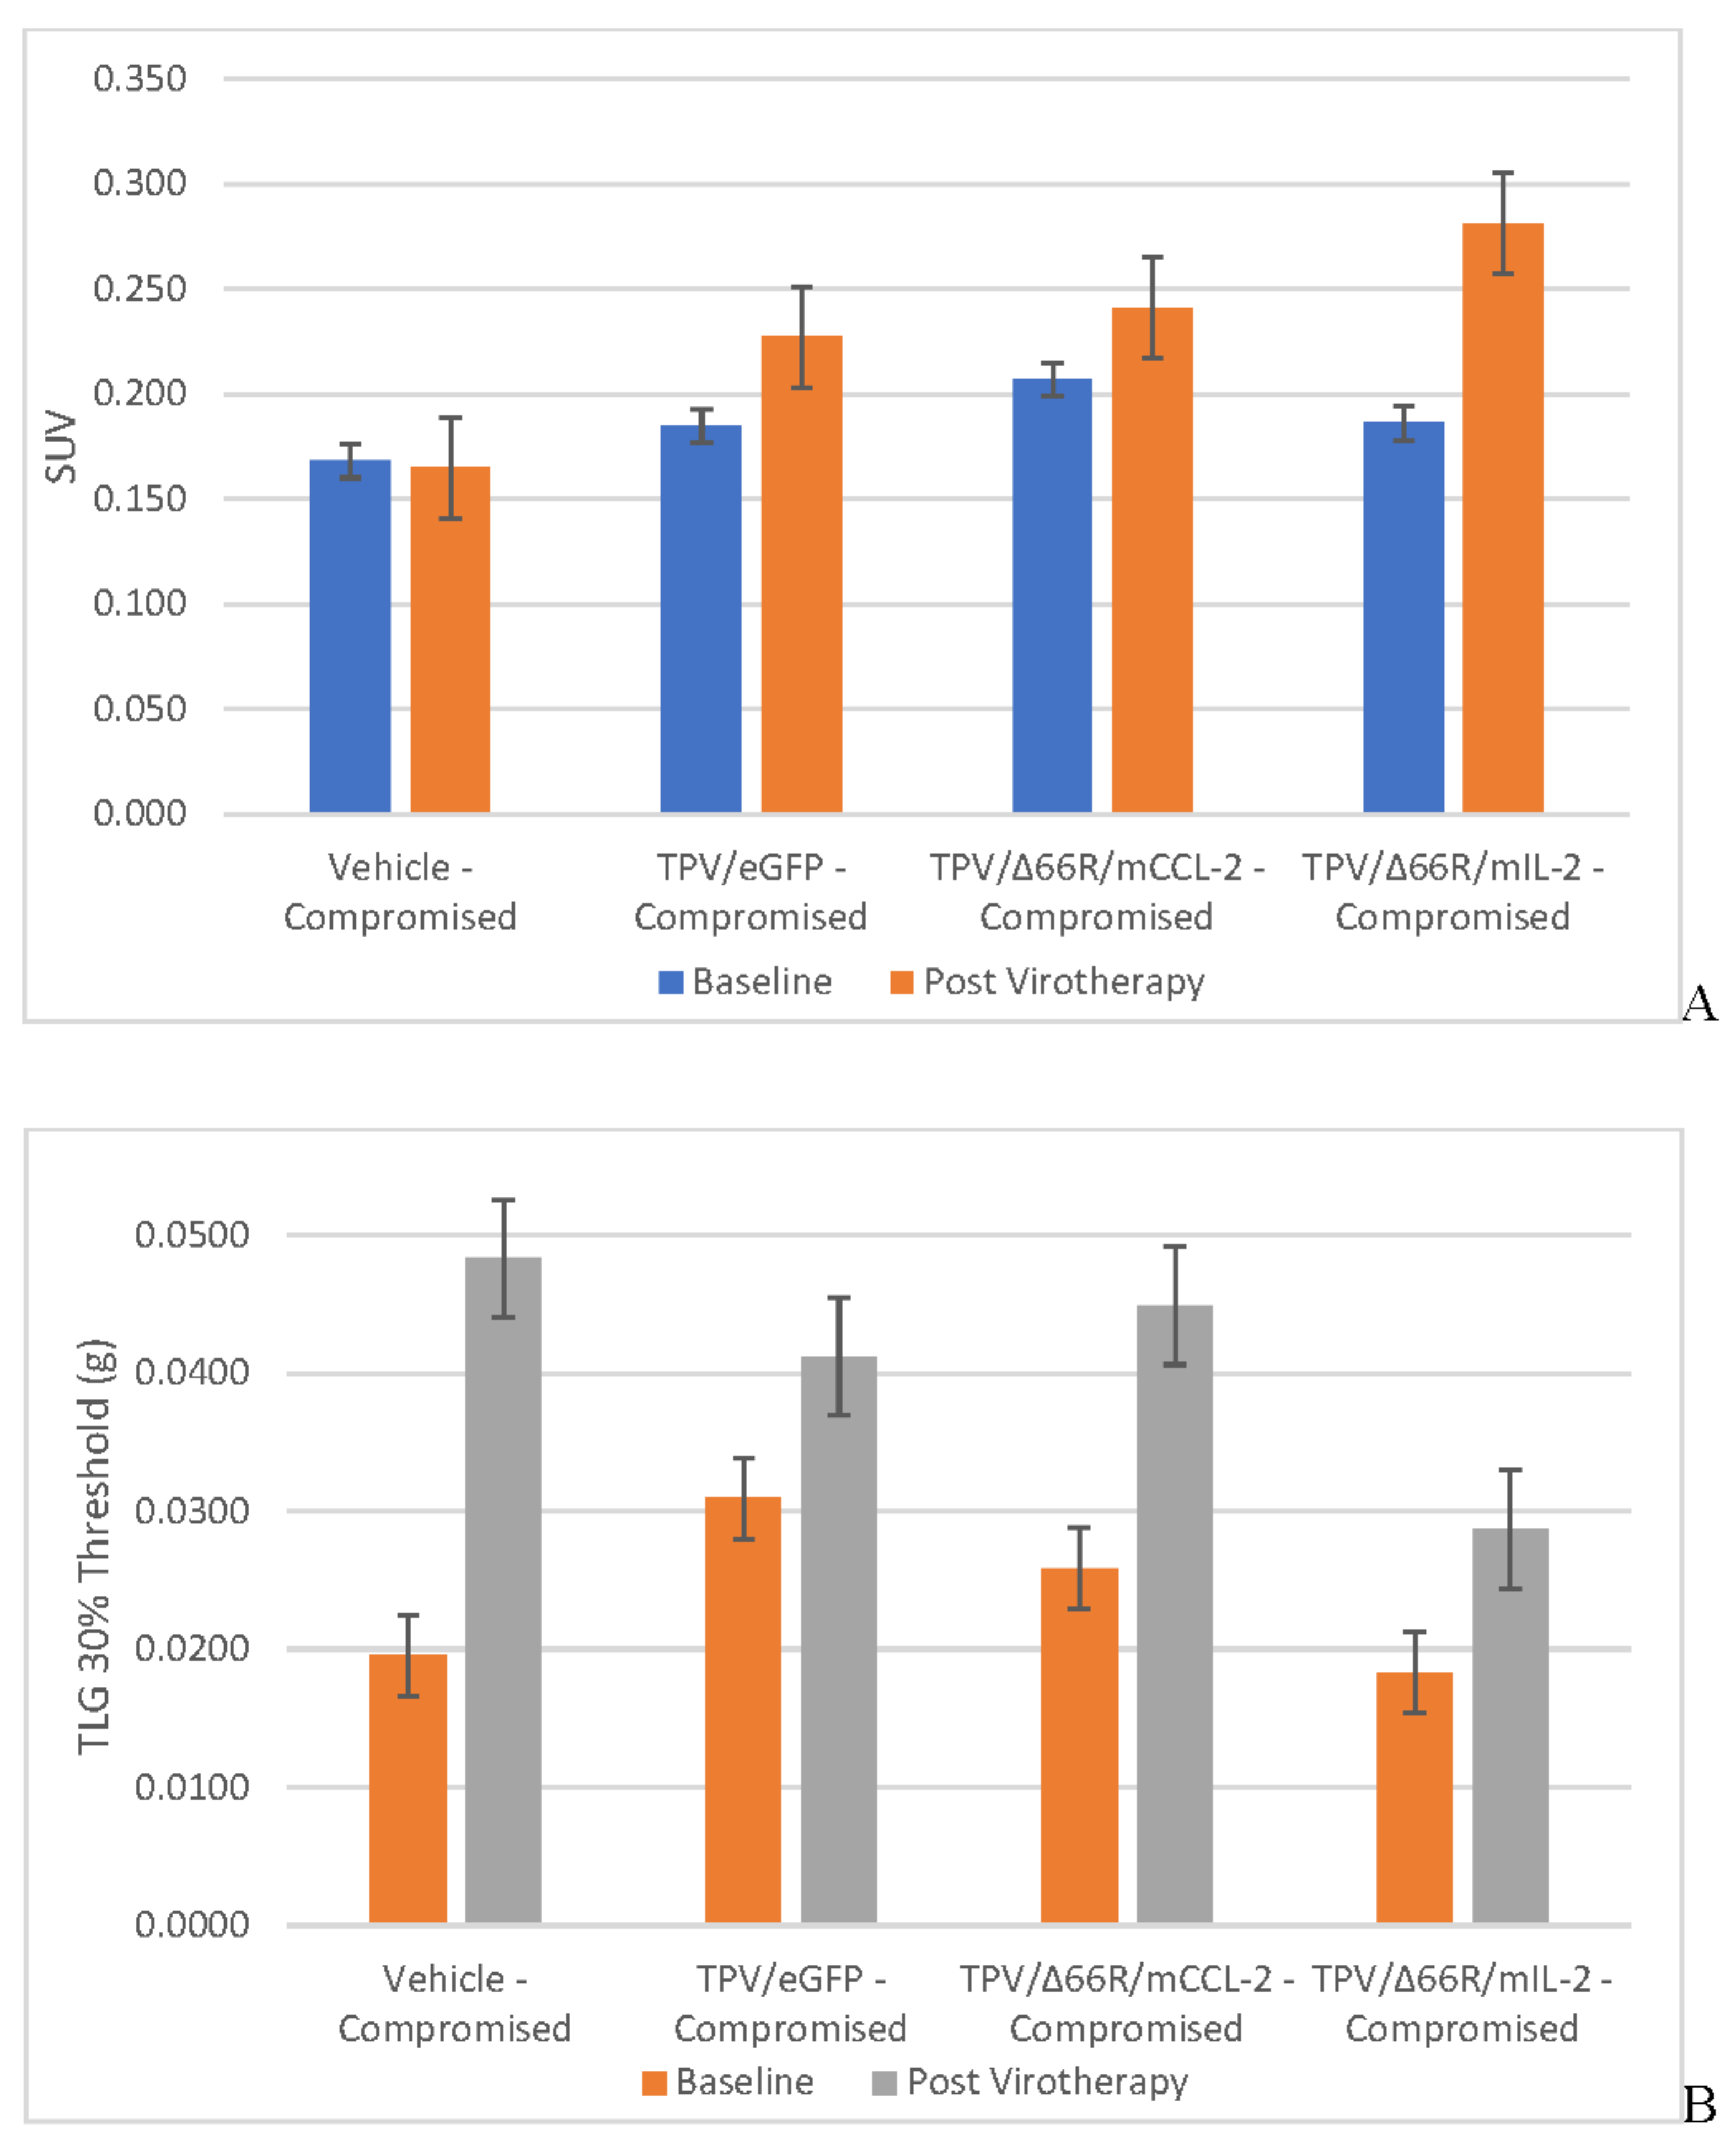
Figure 5.
Immune Reconstituted Group Mean Tumor [18F]-FDG PET/CT Derived Standardized Uptake Value (SUV) and Total Lesion Glycolysis (TLG) BxPc-3 human PDAC cells were inoculated subcutaneously (SC) in the right flank region of immunocompromised or immune reconstituted, female, BALB-c Nude Mice. Each subject received a single inoculation of 5 x 10⁶ cells / subject. Each subject was treated with a single, intratumoral administration of 100 µL PBS formulation vehicle or 100X virus stock of each applicable recombinant virus to result in a virus mass dose of 5 x 10⁶ plaque forming units (pfu) per animal when tumors reached approximately 200 mm3. Baseline, prior to virotherapy, [18F]-FDG PET/CT images (200 µCi/subject) were acquired 3-weeks post BxPc-3 cell inoculation and post-virotherapy images were collected at 7–8-weeks post inoculation. Bars show standard error of the mean (±1 SEM), SUV results for each respective group are shown in plot A and TLG results are show in plot B; inter- and intragroup statistical comparisons resulted in lack of statistical significance for all comparisons.
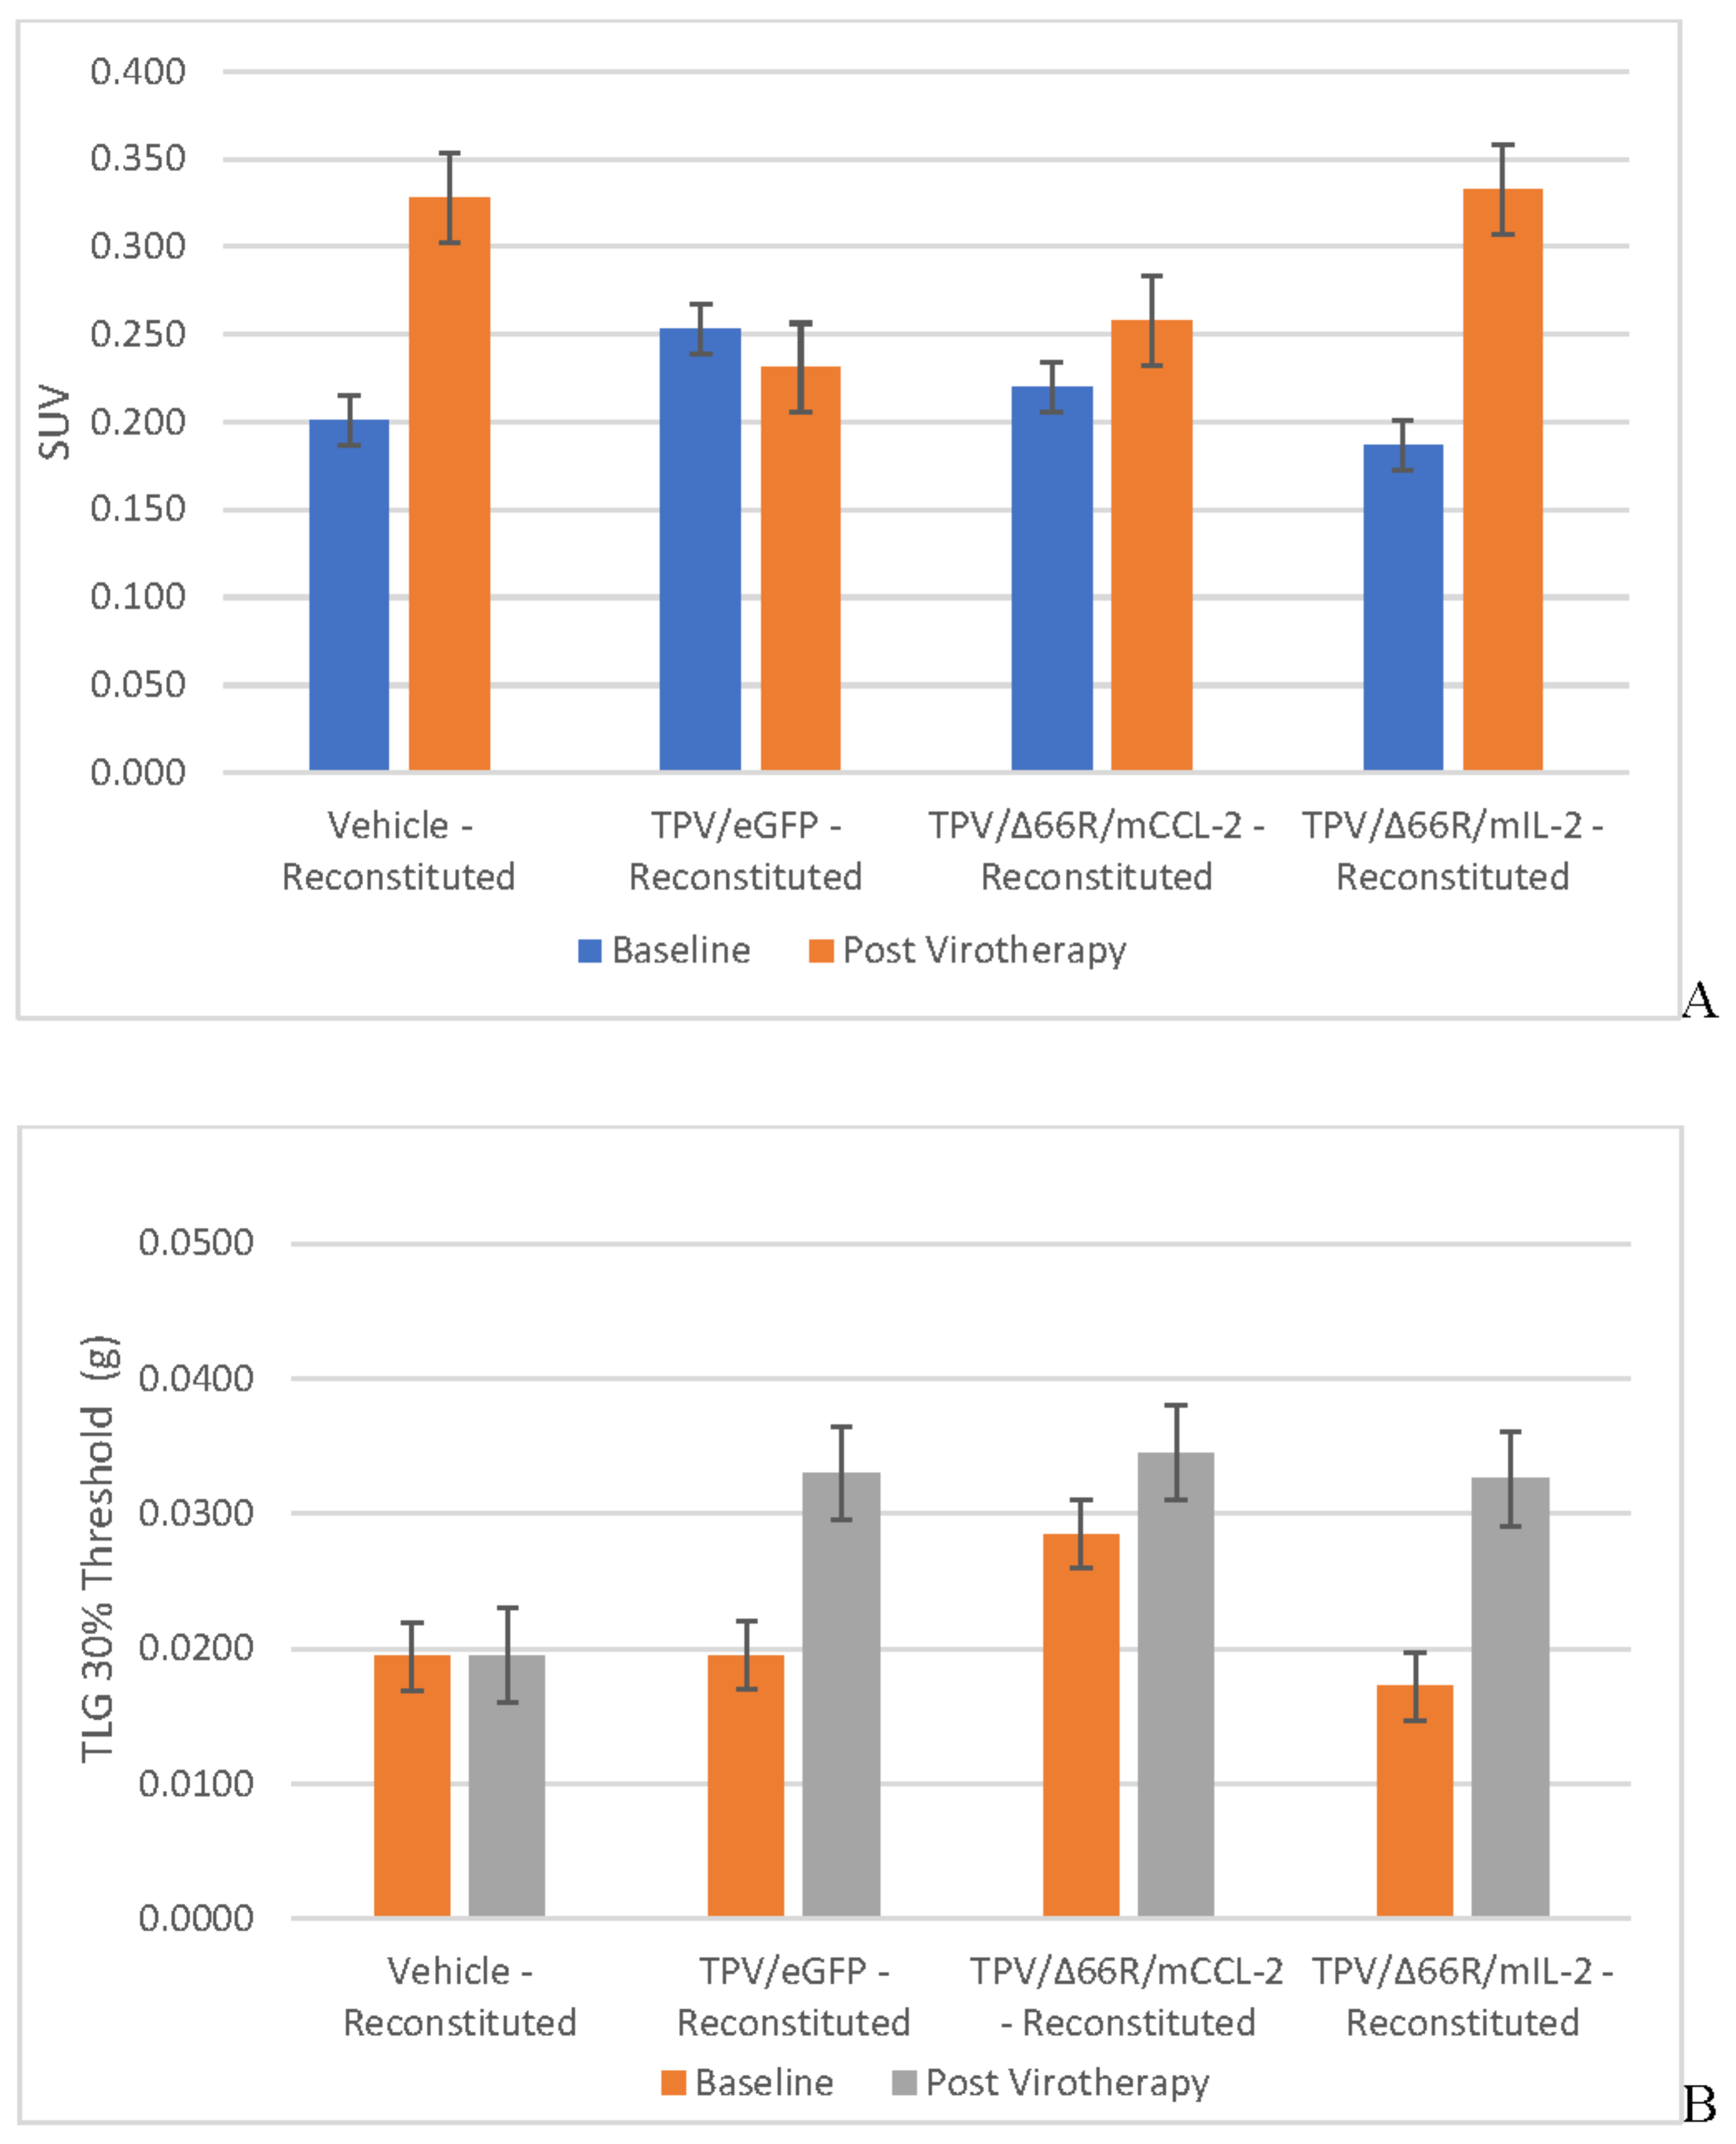
Figure 6.
Post-virotherapy [18F]-FDG PET/CT PET/CT Images of BxPc-3 PDAC Human Tumor Xenografts in Immunocompromised and Immune Reconstituted BALB-c Nude Mice BxPc-3 human PDAC cells (5 x 10⁶ cells / subject) were inoculated subcutaneously (SC) in the right flank region of immunocompromised or immune reconstituted, female, BALB-c Nude Mice. Each subject was treated with a single, intratumoral administration of 100 µL PBS formulation vehicle or 100X virus stock of each applicable recombinant virus to result in a virus mass dose of 5 x 10⁶ plaque forming units (pfu) per animal when tumors reached approximately 200 mm3. [18F]-FDG PET/CT images (200 µCi/subject) were acquired 7–8-weeks post tumor cell inoculation. Select, representative PET/CT images as follows: immunocompromised vehicle control (A), immune reconstituted vehicle control (B), TPV/eGFP immunocompromised (C) and TPV/eGFP immune reconstituted (D). Panel E (TPV/eGFP immunocompromised subject in sagittal, AP and transverse planes from left to right) demonstrates the multi-compartmental composition of tumor mass observed in many study subjects; white arrows indicate tumor location.
Tumor Metabolic Activity Assessment via [18F]-FDG PET/CT Imaging
BxPc-3 human PDAC tumor xenograft intratumoral metabolic activity in immunocompromised and CD-3+ T-cell-mediated immune reconstituted mice was assessed via in vivo [18F]-FDG PET/CT and images analyzed to quantify total radioactivity within the region of the tumor as described herein; data reported as standardized uptake value (SUV) and total lesion glycolysis (TLG) with 30% thresholding. Immunocompromised and immune reconstituted group results are presented in Table 1 and Figure 4 A (SUV) and B (TLG) and Figure 5A (SUV) and Figure 5B (TLG) respectively. Our results fail to demonstrate statistical difference within and between each group in both the immunocompromised and immune reconstituted subjects assessed. Furthermore, total radioactivity within the region of the tumor, whether analyzed to determine SUV or TLG, for many treatment conditions does not correlate with final, group-mean tumor volume, particularly with respect to Week 7–8 final, group-mean tumor volume results. Select, representative, post-virotherapy [18F]-FDG PET/CT images are shown in Figure 6 for vehicle treated and TPV-eGFP treated immunocompromised and immune reconstituted mice.
Tumor Cell Proliferation Assessment via [18F]-FLT PET/CT IMAGING
BxPc-3 human PDAC tumor xenograft intratumoral proliferation activity was also assessed in both models via in vivo PET/CT, although using [18F]-FLT as the radioligand and images analyzed to quantify total radioactivity within the region of the tumor as described herein; data reported as SUV and total lesion proliferation (TLP) with 30% thresholding. Immunocompromised and immune reconstituted group results are presented in Table 2 and demonstrated in Figure 7 A (SUV) and B (TLP) and Figure 8 A (SUV) and B (TLP) respectively. [18F]-FLT SUV results fail to demonstrate statistical difference within and between each Study Group in both the immunocompromised and immune reconstituted mice and consistent with [18F]-FDG SUV results, total radioactivity within the region of the tumor does not correlate with Week 7–8 tumor volume data. As seen with [18F]-FDG SUV results, [18F]-FLT TLP vehicle-treated, intra- and intergroup comparisons for all TPV variant treated immunocompromised and immune reconstituted study groups fail to achieve statistically significant differences. However, a trend is seen when comparing baseline to post-virotherapy [18F]-FLT TLP results in the immunocompromised and immune reconstituted study groups which also correlates to final, total tumor volume. [18F]-FLT TLP vehicle-treated, immunocompromised mice results demonstrate a statistically significant difference, p<0.05, between baseline and post-virotherapy. Likewise, post-treatment vehicle treated and TPV/∆66R/mCCL-2 treated immune reconstituted study groups demonstrate a statistically significant difference, p<0.05, when compared to post-virotherapy immune reconstituted study subjects. Select, representative, post-virotherapy [18F]-FLT PET/CT images are shown in Figure 9 for vehicle treated and TPV-eGFP treated immunocompromised and immune reconstituted mice.
In Vivo Tumor TPV Transgene Expression Assessment via SPECT/CT Imaging
TPV-variant transgene expression was assessed in BxPc-3 human PDAC tumor xenografts in immunocompromised and immune reconstituted BALB-c nude mice via [125I]-anti-eGFP and [125I]-anti-mCherry antibody in vivo SPECT/CT imaging as described herein. Post-virotherapy images were analyzed to quantify percent injected dose per gram tissue (%ID/g) of total administered radioactivity per subject within the region of the tumor; group means were calculated and plotted against tumor volume. Immunocompromised and immune reconstituted group results are presented in Table 3 and demonstrated in Figure 10 A and B respectively.
Results demonstrate relatively consistent %ID/g values across all immunocompromised groups, including vehicle treated control group, and do not demonstrate tumor-volume dependency; mean %ID/g ± SEM for all immunocompromised study groups = 2.42 ± 0.46. Likewise, results for immune reconstituted are also relatively consistent, again including vehicle treated control group, and also do not demonstrate tumor-volume dependency, although the mean is slightly lower than that for immunocompromised subjects; mean %ID/g ± SEM for all immune reconstituted study groups = 1.48 ± 0.18. Select, representative SPECT/CT images are shown in Figure 13 for vehicle treated and TPV-eGFP treated immunocompromised and immune reconstituted subjects. A common subjective finding through review of PET/CT and SPECT/CT images is the association of all imaging agents with the superficial aspects of many of the tumor masses. This observation demonstrates lack of consistent penetration of the imaging agents into the core of many tumors (Figure 6A,C, Figure 99A and Figure 11A).
Ex VivotTumor TPV Transgene Expression Assessment via Quantitative Whole-Body Autoradiography (QWBA)
Following completion of SPECT/CT imaging, each subject receiving [125I]-anti-GFP or [125I]-anti-mCherry was further assessed for intratumoral and potential systemic expression of oncolytic virus transgene expression through application of quantitative whole-body autoradiography (QWBA). Images were analyzed to quantify nanogram antibody per gram tissue (ng-Ab/g) per animal within the region of the tumor as described herein. Immunocompromised and immune reconstituted group results are presented in Table 4 and demonstrated in Figure 12 A and B respectively. Results demonstrate treatment-independent, tumor-volume dependent results in immunocompromised and immune reconstituted study groups. Select, representative QWBA images are shown in Figure 13 for vehicle treated and TPV-eGFP treated immunocompromised and immune reconstituted subjects.
Biomarker Analysis and Pathology
To assess T-cell biomarker levels in vivo, baseline and post-virotherapy blood samples were collected and analyzed as a multiplex panel for the following biomarkers: MCP-1, IL-2, IL-4, Il-6, IL-10, INF-γ and TNF-α. Baseline sample results were unremarkable, all samples collected from each study group for each biomarker were below limit of quantitation (BLQ) of the multiplex assay, except for IL-10 (maximum level = 13.8 pg/mL), IL-6 (maximum level = 30.1 pg/mL) and MCP-1 (maximum level = 48.1 pg/mL). Post-virotherapy sample assay results for all immunocompromised study groups were also BLQ for all biomarkers assayed, except for the following: Vehicle (IL-6 = 19.1 pg/mL); TPV/eGFP (IL-10 = 10.9 pg/mL, IL-6 = 16.2 pg/mL, TNF-α = 530.1 pg/mL and MCP-1 = 451.9 pg/mL); TPV/∆66R/mCCL-2 (IL-6 = 478.8 pg/mL); and TPV/∆66R/mIL-2 (INF-γ = 25.1 pg/mL and IL-6 = 18.2 pg/mL). Post-virotherapy sample assay results for immune reconstituted study groups are summarized as follows: Vehicle (IL-6 = 1951 pg/mL); TPV/eGFP (IL-10 = 108.8 pg/mL, IL-6 = 60.8 pg/mL, TNF-α = 13.1 pg/mL and MCP-1 = 60.3 pg/mL); TPV/∆66R/mCCL-2 (IL-10 = 12.5 pg/mL, IL-6 = 37.4 pg/mL); and TPV/∆66R/mIL-2 (IL-10 = 23.8 pg/mL). Results for immunocompromised study groups fail to demonstrate trends when either compared between baseline to post-virotherapy samples or when compared between study groups. Likewise, results for immune reconstituted study groups also fail to demonstrate a clear trend when either compared between baseline to post-virotherapy samples or when compared between study groups. Adoptive CD-3+ T-cell transfer does not appear to have resulted in T-cell-dependent increase in biomarker levels at the timepoint sampled in our study (Week 7–8).
Pathology
Microscopic examination of fixed H&E-stained paraffin sections was performed on tissues samples of the xenograft tumor and immediately adjacent tissue from a cohort of n= 5 subjects from all immunocompromised and immune reconstituted study groups. Tissues from all study groups were also assessed via standard IHC staining techniques for the following biomarkers: CD-3, CD-4, CD-8, CD-68 and Caspase-3; all tissues were examined by a board-certified veterinary pathologist. A five-step grading system was utilized to define gradable lesions for comparison between dose groups.
Macroscopic observations demonstrate a mass or nodule occurred at the transplant sight of all animals in the immunocompromised and immune reconstituted groups. These correlated with adenocarcinoma or transplant necrosis noted microscopically. There were no other meaningful macroscopic findings. The other macroscopic findings noted in study subjects were of low incidence and had no treatment-related microscopic correlate.
Microscopic results for immunocompromised and immune reconstituted groups are presented in summary results Table 5 and Table 6 respectively, and key microscopic results are presented in the text immediately below. Select, representative histopathology and immunohistochemistry photomicrographs are presented in Figure 14.
All immunocompromised, vehicle control subjects had tumor transplants (adenocarcinomas) in the subcutaneous tissue. The cells in these tumors were markedly caspase positive. Immune reconstituted vehicle control subjects, 2 of 5, demonstrated minimal staining of small numbers of tumor cells remaining in the tumor transplant. The remaining subjects in the immune reconstituted, vehicle control group were caspase negative as tumor cells were not present, although an increase in CD-3, CD-4, and CD-68 staining was observed in tumor transplant area. This staining was principally in the inflammation that surrounded the replaced the tumor cells. Thus, increased T-cells (CD-3 and CD-4 positive cells) and macrophages (CD-68 positive cells) occurred in immune reconstituted mice. All immunocompromised, TPV/eGFP subjects had tumor transplants (adenocarcinomas) in the subcutaneous tissue. Immune reconstituted, TPV/eGFP subjects, 2 of 6, had adenocarcinomas and 4 of 6 mice had caspase positivity that ranged from minimal in two subjects with only minor residual tumor cells to moderate and marked in 2 other mice with much less tumor impact. Increased CD-3, CD-4, and CD-68 staining occurred in tumor transplant area around the regions of tumor necrosis in immune reconstituted, TPV/eGFP subjects when compared to immunocompromised, TPV/eGFP treated mice. This staining was principally in the inflammation that surrounded the replaced the tumor cells. Thus, increased T-cells (CD-3 and CD-4 positive cells) and macrophages (CD-68 positive cells) occurred in immune reconstituted mice. All immunocompromised, TPV/∆66R/mCCL-2 mice had tumor transplants (adenocarcinomas) in the subcutaneous tissue. For immune reconstituted, TPV/∆66R/mCCL-2 subjects, all lacked an identifiable tumor and were caspase negative reflecting the absence of tumor cells in the tumor transplant area. CD-3, CD-4 and CD-68 staining was comparable for most immunocompromised, TPV/∆66R/mCCL-2 and immune reconstituted, TPV/∆66R/mCCL-2 subjects with no clear distinction of staining between these groups. Chronic-active inflammation was of increased severity in immune reconstituted, TPV/∆66R/mCCL-2 mice (marked) compared to mild chronic-active inflammation in immunocompromised, TPV/∆66R/mCCL-2 subjects. Tumor necrosis was complete (severe) in all immune reconstituted, TPV/∆66R/mCCL-2 mice. Partial necrosis (minimal to moderate) occurred in most immunocompromised, TPV/∆66R/mCCL-2 subjects and generally only involved portion of the tumor. All immunocompromised, TPV/∆66R/mIL-2 subjects had tumor transplants (adenocarcinomas) in the subcutaneous tissue.
Immune reconstituted, TPV/∆66R/mIL-2 mice, 5 of 6, had no identified tumor and were caspase negative reflecting the absence of tumor cells in the tumor transplant area. A single immune reconstituted, TPV/∆66R/mIL-2 mouse had tumor transplant (adenocarcinoma) at the transplant site which indicates the subject did not respond to adoptive CD-3+ T-cell transfer, did not respond to virotherapy or either the T-cell or TPV/∆66R/mIL-2 virotherapy administrations were potentially partial or missed administrations. Increased CD-3, and CD-4 staining occurred in tumor transplant area around the regions of tumor necrosis immunocompromised, TPV/∆66R/mIL-2 mice when compared to immune reconstituted, TPV/∆66R/mIL-2 mice. This staining was principally in the inflammation that surrounded the replaced the tumor cells. CD-68 staining was slightly more pronounced for mice of immune reconstituted, TPV/∆66R/mIL-2 mice compared to immunocompromised, TPV/∆66R/mIL-2 mice. Thus, increased T-cells (CD-3 and CD-4 positive cells) and macrophages (CD-68 positive cells) occurred in immune reconstituted, TPV/∆66R/mIL-2 mice. Chronic-active inflammation was of increased severity in immune reconstituted, TPV/∆66R/mIL-2 mice (marked) compared to minimal to moderate chronic-active inflammation in immunocompromised, TPV/∆66R/mIL-2 mice. Necrosis was complete (severe) in all animals of immune reconstituted, TPV/∆66R/mIL-2 mice that had a response to treatment. Partial necrosis (minimal to moderate) occurred in most immunocompromised, TPV/∆66R/mIL-2 mice and generally only involved portion of the tumor. Chronic active inflammation was comparable across the TPV virotherapeutics in immunocompromised mice and was greater than immunocompromised, vehicle controls. Thus, TPV virotherapy treated groups demonstrated an increase in chronic active inflammation and necrosis relative to immunocompromised, vehicle control subjects.
Discussion
In this study we evaluated the immuno-oncolytic potential of various TPV variants against BxPc-3 human PDAC xenografts in immunocompromised and CD-3+ T-cell-mediated immune reconstituted BALB-c Nude mice through application of a rigorous in vitro, in vivo and ex vivo experimental approach. Our in vitro results clearly demonstrate that TPV/eGFP, TPV/∆66R/mCCL-2 and TPV/∆66R/mIL-2 can replicate efficiently, infect, cause morphological changes consistent with TPV-dependent cytopathic effect, cause cell lysis and express viral transgene expression in BxPc-3 PDAC cells. TPV/eGFP replication efficiency was shown to be relatively equivalent in BxPc-3 cells as compared to owl monkey kidney cells traditionally used for in vitro TPV culture [82,83,84,95].
Our in vivo results in immunocompromised mice demonstrate TPV recombinants expressing mCCL-2 and mIL-2 were more effective in regression of BxPc-3 PDAC tumor volume as compared to TPV/eGFP and vehicle control. TPV/∆66R/mCCL-2 group-mean, final tumor volume was 193.1 mm3 less than the group-mean final tumor volume of the vehicle control group and achieved statistical significance, p<0.05, in immunocompromised athymic nude mice. As observed with TPV/∆66R/mCCL-2, TPV/∆66R/mIL-2 demonstrated a similar trend with respect to regression of tumor volume compared to TPV/eGFP and vehicle treated controls (final tumor volume difference of 128.2 mm3 between the mIL-2 treated and vehicle control groups) yet failed to reach a statistical difference through the course of the study.
The role of CCL-2 in progression of pancreatic cancer has been of high interest for investigators given its potent induction of monocyte migration to tumor site and production of CCL-2 correlates with macrophage presence in transplanted, in vivo tumors [108,109,110]. CCL-2 also demonstrates chemoattractant properties for several other immune cells such as NK cells, mast cells, monocytes and T lymphocytes [86,87,88]. Investigators have also reported CCL-2 may be an important negative regulator of pancreatic cancer progression [91]. IL-2 has also been shown to share similar immunomodulatory properties to those reported for CCL-2. IL-2 promotes immune response through activation, differentiation and maturation of T-cells, as well as immune response mediated through activation of macrophages and NK cells [92,93]. Our histopathology and immunohistochemistry results from immunocompromised, TPV/∆66R/mCCL-2, TPV/∆66R/mIL-2 are also consistent with reported immunomodulatory properties of CCL-2 and IL-2. All TPV virotherapy treated immunocompromised groups demonstrated an increase in chronic active inflammation and necrosis relative to immunocompromised, vehicle control subjects. For all TPV recombinants, inflammatory biomarkers and immune cell infiltrates in and around the tumor sites were found to be greater than that of immunocompromised, vehicle control subjects. TPV/∆66R/mCCL-2 treatment was shown to result in the greatest difference as compared to control, followed by TPV/∆66R/mIL-2 and finally TPV/eGFP. Evidence of in vivo TPV variant(s) replication and transgene expression was clearly demonstrated through immunohistochemistry assessment of tumor tissues where intact tumor was present at termination of study. Our results further support the potential role of CCL-2 and IL-2 in negative regulation of pancreatic tumor progression through stimulation of innate immune response given the regression of tumor volume within TPV/∆66R/mIL-2 treated and statically significant regression of tumor volume in TPV/∆66R/mCCL-2 treated subjects compared to vehicle control, immunocompromised subjects. TPV/eGFP treated subjects demonstrated a marginal regression of tumor volume compared to vehicle controls, again supporting the role CCL-2 and IL-2 in negative regulation of BxPC-3 human PDAC xenografts in our immunocompromised test system.
All treatment groups, including vehicle control, of the immune reconstituted mice demonstrated regression of tumor volume as compared to immunocompetent, vehicle control animals. Nearly all immune reconstituted mice had complete or near complete necrosis of the tumor mass. The necrosis of the tumor in these immune reconstituted mice was surrounded by a border of chronic inactive or chronic active inflammation. Inflammation was characterized in general as an accumulation of mixed inflammatory cells including neutrophils, small mononuclear cells, large mononuclear cells (macrophages) and fibrosis surrounding a central core of necrotic debris. The tumor transplant cells were distinctly caspase positive in subjects where tumor necrosis was incomplete. Our results demonstrate all TPV virotherapy treated immune reconstituted mice failed to demonstrate a beneficial treatment effect as compared to vehicle treated, immune reconstituted control mice. TPV/eGFP treated, immune reconstituted group results trended most similarly to immune reconstituted, vehicle treated control group results. While TPV/∆66R/mCCL-2 and TPV/∆66R/mIL-2 treated, immune reconstituted group results demonstrate regression of tumor volume, the rate of regression and overall efficacy of both variants were found to be less effective compared to TPV/eGFP and vehicle control groups. Given our in vivo tumor assessment results when considered in totality with ex vivo histopathology and immunohistochemistry results, we hypothesize the results observed in immune reconstituted mice, independent of treatment, are indicative of host, innate immune system rejection of the human PDAC xenograft employed in our study. Our results demonstrate the temporal relationship between CD-3+ T-cell transfer to start of tumor volume regression, rapid rate of tumor volume regression and pathology results, collectively support host immune-mediated rejection of the xenograft as our results are consistent with host immune system-mediated transplant rejection as reported by many investigators [111,112,113,114,115]. Results demonstrating TPV/eGFP treatment was most similar to vehicle treated, immune reconstituted animals as compared to the CCL-2 and IL-2 variants, with the thymidine kinase (TPV gene 66R) knockout, is likely a result of maintained TPV/eGFP variant thymidine kinase gene activity. Furthermore, we hypothesize the lessened rate of tumor regression observed for CCL-2 and IL-2 variants was also likely a result of immune system competition between clearance of foreign xenograft cells and TPV variants due to CCL-2- and IL-2-mediated immune cell recruitment and activation in combination with slower viral growth kinetics for the CCL-2 and IL-2 variants due to lack of thymidine kinase activity. Further refinement of CD-3+ T-cell transfer as a means of providing an immune reconstituted research model is clearly needed given the results we describe herein. Potential modifications include reduction of total number of transferred T-cells per subject, requirement for greater tumor volume at time of T-cell transfer and extended temporal relationship between time of oncolytic virotherapy and time of T-cell transfer.
In vivo imaging results with [18F]-FDG, SUV and TLG, and SPECT/CT imaging results with [125I]-anti-GFP and [125I]-anti-mCherry antibodies and ex vivo QWBA results were unremarkable/confounding and do not logically align with tumor volume and histopathology, specifically when evaluating Week 7–8 data sets. This lack of alignment is exemplified when one compares results of [18F]-FDG PET/CT images data generated from immunocompromised, vehicle control subjects to immunocompromised, TPV/eGFP, TPV/∆66R/mCCL-2 and TPV/∆66R/mIL-2 treated subjects. Final, group-mean tumor volume for immunocompromised, vehicle control subjects was greater than final, group-mean tumor volume for all immunocompromised, TPV variant treated subjects, yet quantitative [18F]-FDG results were shown to be greater for all TPV-variant treated subjects as compared to vehicle control. SPECT/CT imaging results also do not align with tumor volume and/or applied treatments. This is most clearly demonstrated through assessment of the vehicle treated control groups in both immunocompromised and immune reconstituted models as compared to any respective TPV virotherapeutic group in both models. Given we employed a [125I]-radiolabeled, monoclonal antibody targeting GFP or mCherry, one would expect radioactivity levels in and around the tumor site in all control animals to be at or equivalent to blood pool given the lack of viral transgene expression and target antigen availability; our results show similar levels of total radioactivity at the tumor sites for both the immunocompromised and immune reconstituted vehicle-treated control study groups when compared to all TPV variant treated study groups. We hypothesize this phenomenon is likely attributable to the complex microenvironment associated with PDAC tumor sites which results in significant challenge when employing in vivo imaging approaches to assess contemporaneous tumor characteristics as previously reported [31,116,117,118]. Following primary analysis of [18F]-FDG and [18F]-FLT PET/CT data, the challenges as described immediately above were noted and the data further assessed to determine total lesion glycolysis (TLG) for [18F]-FDG data and total lesion proliferation (TLP) for [18F]-FLT data. TLG assessment for [18F]-FDG data yielded similar, confounding results which do not align with the other end points and datasets generated through the course of our study. However, [18F]-FLT TLP results do trend logically with tumor volume and histopathology data. While [18F]-FLT TLP data do not reach statistical significance for any study group, the trends observed demonstrate group, mean [18F]-FLT TLP signal intensity levels correlate well with final, group mean tumor volumes and histopathology results. [18F]-FLT TLP results demonstrate the TPV mCCL-2 recombinant OV to have been the most effective of the TPV recombinants assessed in this study. Briefly, [18F]-FLT PET results of the TPV mCCL-2 recombinant treated group demonstrate consistently lower signal within the region of the tumor as compared TPV/eGFP and vehicle control which trends with final, group mean, tumor volume for each TPV variant respectively in the immunocompromised mouse model.
While this method of assessing [18F]-FLT data has not been previously reported to the best of our knowledge, we propose this approach, while further assessment is clearly needed, may be a viable approach in the assessment of pancreatic cancer tumor staging and diagnosis via in vivo PET/CT imaging.
In conclusion, our results demonstrate TPV recombinants TPV/∆66R/mIL-2 and TPV/∆66R/mCCL-2 were more effective in regression of BxPc-3 pancreatic tumor volume and tumor proliferation rate as compared to TPV/eGFP control recombinant, with the mCCL-2 recombinant reaching statistical significance compared, p<0.05, to vehicle treated control animals in an immunocompromised athymic nude murine model. PET/CT Imaging results using [18F]-FLT targeting cells with active proliferation and histopathologic analysis also support the TPV mCCL-2 recombinant to have been the most effective of the TPV recombinants assessed in this study. Results generated via [18F]-FLT PET demonstrate consistently lower signal within the region of the tumor as compared to vehicle controls and histology results demonstrate increased CD3 and CD4 staining occurred in TPV mCCL-2 recombinant relative to other virus variants and vehicle control. Enhanced immuno-oncolytic virus efficacy of TPV/∆66R/mIL-2 and TPV/∆66R/mCCL-2 may be attributable to CCL-2- and IL-2-mediated negative regulation of pancreatic tumor progression through stimulation of the innate immune response. TPV appears to be a potentially viable immuno-oncolytic virus which can infect, replicate, induce cytopathic effect leading to direct cell lysis and regression of BxPc-3 human PDAC xenografts in vivo through induction of anti-tumor innate immune response.
Methods and Materials
Cells, Viruses and Reagents
Human pancreatic ductal adenocarcinoma BxPc-3 cells were purchased from American Type Culture Collection (ATCC, Rockville, MD, USA; ATCC CRL-1687TM). BxPc-3 cells were cultured in traditional cell incubator maintained at 37 °C and supplemented with 5% CO2 using vented-top tissue culture flasks. Cells were maintained in growth media consisting of RPMI 1640 supplemented with 2mM L-glutamine, 10% Fetal Bovine Serum (FBS). Cells were allowed to reach approximately 85-90% confluence. When BxPc-3 cells reached 85–90% confluence, each flask was treated with dissociation reagent and held at 37 °C for approximately 5 min. Cells were split 1:3 in fresh tissue culture flasks. Sufficient cell population was maintained as needed to provide approximately 5 x 10⁶ cells / subject for xenograft inoculation. Wild type (wt) TPV was originally received as a gift from Dr. Joseph Esposito (Centers for Disease Control, Atlanta, GA, USA) and was used to generate the TPV recombinants used in this study. Generation of the recombinants and confirmation of expression of each transgene by Western Blot and/or ELISA analysis and TK gene expression confirmation by PCR has been previously described [82,84,95].
Viral Replication Assessment via Phase Contrast and Florescent Microscopy
BxPc-3 cells were cultured in growth media, allowed to reach 85–90% confluence. Once desired confluence was achieved, cells were infected with 1-2 µL of 100X TPV/eGFP, TPV/∆66R/m-CCL-2/mCherry or TPV/∆66R/m-IL-2/mCherry and maintained for 5–7 days post-infection in maintenance media to assess viral plaque formation via phase contrast microscopy and immunofluorescence microscopy. Maintenance media consisted of lower total concentration of FBS (2%) with all other supplements being identical to growth media as previously described. Phase contrast, white-light microscopy images were acquired to determine viral plaque formation as confirmation of viral replication; uninfected BxPc-3 cells served as controls. BxPc-3 Cells cultured in glass bottom dishes, planned for immunofluorescent imaging were infected with each applicable TPV variant as described above; uninfected cells served as control. Following visual confirmation of viral plaque formation via phase contrast, white-light imaging at 5–7 days post infection, each tissue culture dish was washed with phosphate buffered saline (PBS), stained with 4′,6-diamindino-2-phenylindole (DAPI) stain and PBS maintained over the cell monolayer to maintain cell integrity to facilitate immunofluorescent imaging. Assessment of viral reporter gene expression was performed via immunofluorescence microscopy using excitation lasers applicable for DAPI, eGFP and mCherry. Immunofluorescent images were collected on a confocal microscope with camera using NIS Elements software.
Viral Plaque Assay
TPV recombinants TPV/eGFP, TPV/∆66R/m-CCL-2/mCherry and TPV/∆66R/m-IL-2/mCherry replication competency was assessed via BxPc-3 cells via viral plaque assay as previously described [98]. Briefly, BxPc-3 cells monolayers grown in 6-well plates were infected with 200.0 μL/well of serial ten-fold dilutions of each 100X TPV recombinant, with each dilution being plated in duplicate. Following adsorption period of approximately 1 h, overlay medium was added to each well and the plates were then incubated at under appropriate conditions for 5–7 days. Following 5–7-day incubation, overlay medium was carefully aspirated and cell monolayers were stained with 1% crystal violet and fixed with formaldehyde. Plates were then rinsed with distilled water and allowed to dry. Plaques were counted to determine plaque forming units (pfu; reported units pfu/mL) by the following formula: [pfu = ((number of plaques in well-A + plaques in well-B) / 2) x dilution factor for each duplicate of wells], then [number pfu (200.0 μL)] x 5 = 1.0 mL pfu.
Animal Model
Female BALB-c Nude Mice (CAnN.Cg-Foxn1nu/Crl) and BALB-c mice, approximately 4 or 6 weeks old upon receipt and initiation of 10–16-day acclimation period, were received from Charles River Laboratories, Raleigh, North Carolina. All study-specific activities were conducted under an approved protocol by the Charles River Laboratories (CRL) Institutional Animal Care and Use Committee (CRL IACUC Protocol No. 999-872). All animals were given a detailed clinical observation examination prior to selection for study.
In Vivo Study Design Summary
Our study incorporated numerous endpoints to thoroughly assess oncolytic efficacy and potential mechanism(s) of action of TPV recombinants in response to BxPc-3 human PDAC tumor xenografts in immunocompromised and immune reconstituted BALB-c (CAnN.Cg-Foxn1nu/Crl) nude mice. Table 7 provides a succinct summary of the study design employed and primary endpoints for each treatment group of animals assigned to study; Figure 15 displays temporal relationship of key study activities employed through the course of the study or all Study Groups using tumor volume data for immunocompromised, control subjects treated with applicable vehicle only.
BxPc-3 Human PDAC Xenografts and Virotherapy
BxPc-3 cells were cultured as previously described herein. For each cohort of animals, a sufficient number of BxPc-3 cells were maintained and prepared for subcutaneous (SC) tumor xenografts by inoculation in a final formulation of 50:50 sterile PBS and Matrigel. Inoculations were performed as unilateral inoculations in the right flank region of each animal. Cell concentration and viability were assessed pre- and post-inoculation using trypan blue staining and analyzed via automated cell counter. Cell viability acceptance criteria was established as ≥ 85% and cell concentration criteria was 5 x 10⁶ cells / animal in a total volume of 100 µL. Within three days of inoculation, total volume analysis of all inoculation sites/tumors was initiated and continued through the course of the study with digital caliper measurements being conducted every three days. Measurements were conducted in dimensions of length, width and height to determine total volume for each tumor and reported as cubic millimeters units (mm3). Once tumors reached approximately 200 mm3, animals were randomly assigned to study treatment groups based on tumor volume to achieve equivalent mean group tumor volume in as much as possible. Following animal assignment to control groups, animals were treated with a single, intratumoral administration of 100 µL PBS formulation vehicle. Animals assigned to virotherapy groups were treated with a single, intratumoral administration of 100X virus stock of each applicable recombinant virus diluted to a final volume of 100 µL with PBS formulation vehicle to deliver a viral mass dose of 5 x 10⁶ pfu per animal.
CD3+ T-Cell Isolation and Adoptive Transfer
Cohorts of immunocompromised BALB-c nude mice received adoptive transfer of isolated Cluster of Differentiation 3 (CD-3) positive T-cells from donor, immunocompetent BALB-c mice to assess oncolytic activity of TPV recombinants employed in this study in an immune reconstituted murine model. CD-3+ T-cells were isolated and injected into the tail vein of all animals assigned to immune reconstituted cohorts 4-days post virotherapy per the following method. Briefly, intact spleens from BALB-c donor mice were collected, processed to separate splenocyte phenotypes and CD-3+ T-cells were isolated by CD-3 affinity column isolation. Isolation of CD-3+ T-cells was confirmed by FLOW cytometry. Immune reconstituted study animals received adoptive T-cell transfer at a ratio of approximately 1:3 donors:recipients respectively. Cell concentration was adjusted for intended cell number of 5 x 10⁶ cells/subject via IV injection in a total volume of 200 μL/subject.
[18F]-FDG and [18F]-FLT PET Imaging Agents
[18F]-fluorodeoxyglucose ([18F]-FDG) was procured through a commercial vendor and used, neat, as received from vendor to assess metabolic activity at the site of each tumor in each subject.
A novel radiolabeling method was established for production of [18F]-fluoro-3′-deoxy-3-L: -fluorothymidine ([18F]-FLT) based on an adaptation of method as previously described [99]. [18F]-FLT was produced via automated synthesis module as needed to support PET imaging to assess tumor-site proliferation.
[125I]-anti GFP Antibody and [125I]-Anti-mCherry Antibody SPECT Imaging Agents
Antibodies, Ig-G, targeting Green Fluorescent Protein (GFP) and monomeric red fluorescent protein (mCherry) were procured through commercial vendor to enable in vivo SPECT/CT imaging of oncolytic virus reporter gene expression following [125I]- Sodium Iodine ([125I]-NaI) radio iodination, radiolabeling of each applicable antibody to generate [125I]-anti-GFP and [125I]-anti-mCherry antibodies.
Following establishment of an acceptable radiolabeling method to produce [125I]-anti-GFP and [125I]-anti-mCherry antibodies of sufficient yield and radiochemical purity to enable SPECT/CT imaging, the stability of the each labeled antibody was assessed and confirmed to be acceptable at 1-, 24- and 48-h post radiolabeling.
Post-radiolabeling bioactivity of each antibody was also assessed by ELISA method to confirm antigenic affinity for GFP and mCherry was not reduced / negated through radio iodination, radiolabeling of the antibodies. To enable ELISA assay, nonradioactive forms of each antibody were produced through substitution of nonradioactive isotope 127I for radioactive isotope 125I and applying the same radio iodination method to produce radioactive 125I forms of anti-GFP and anti-mCherry antibodies. ELISA method was performed as follows: briefly, 96-well plates were coated with 50 µL/well of 4 µg/mL recombinant GFP or 4 µg/mL recombinant mCherry proteins. Plates were applicably washed and then blocked with 150 µL per well of 3% BSA in 1X PBS. [127I]-anti-GFP and non-modified GFP, [127I]-anti-mCherry and non-modified mCherry and Mouse IgG negative control antibodies were serially diluted to concentrations of 10,000–0.419 ng/mL in 1% BSA, 0.05% Tween 20 in 1X PBS. Coated and blocked plates were washed, then incubated with 50 µL of each antibody dilution in duplicate wells. Following antibody sample incubation, plates were washed and incubated Goat anti-Mouse IgG–SulfoTag detection antibody in all wells. Following detection antibody incubation, plates were read and signal remained in direct correlation to antibody concentration and curves for 127I-labeled and unlabeled anti-GFP and anti-mCherry antibodies were parallel through linear range, indicating the 127I-labeled forms of each antibody maintained antigen-binding capability suitable for intended application as SPECT/CT imaging agents.
PET/CT Imaging
Study subjects were randomly selected to equivalently balance average tumor volume across two cohorts of n = 3–4 subjects per group at 3- and 7-weeks post BxPc-3 tumor cell inoculation for in vivo [18F]-FDG or [18F]-FLT PET/CT imaging. Subjects were scanned using a multi-bed apparatus supporting n=4 subjects/scan. Subjects were maintained under isoflurane anesthesia through the course of each scan. Subjects assigned to [18F]-FDG scanning cohorts were appropriately fasted, with free access to drinking water, prior to scanning to reduce image artifact related to systemic metabolic activity in tissues surrounding the tumor site and blood samples were collected for glucose monitoring. [18F]-FDG and [18F]-FLT was administered via tail vein at a total radioactive dose level of approximately 200 uCi/subject; PET scanning was initiated at approximately 40-min post administration of the applicable imaging agent. CT images were acquired following each PET acquisition. CT-based attenuation, deadtime, randoms and scatter corrections were applied to all data. Image data were analyzed using VivoQuant software. Fixed volume regions-of-interest (ROIs) were used to quantify total radioactivity in tumor and heart for each animal at each time point; results were reported as Standardized Uptake Value (SUV ((decay-corrected activity of tissue volume)/(injected activity/body mass)) for each ROI. ROIs for primary analysis included tumor and heart; heart was used as surrogate to determine systemic activity; heart was used as surrogate to determine systemic activity. Due to previously reported inherent challenges associated with various in vivo imaging modalities, such as CT, MRI, PET, SPECT, etc., and data analysis with imaging related to PDAC and other forms of cancer with complex tumor microenvironments, [18F]-FDG PET data were also analyzed to determine Total Lesion Glycolysis (TLG) via the analysis methodology as previously reported [100,101,102,103], with thresholding value of 30%. An adaptation of TLG analysis was also applied to [18F]-FLT PET data sets, again with 30% thresholding value and reported herein as Total Lesion Proliferation (TLP). Our adaptation of TLG to determine TLP consisted of substitution of [18F]-FDG metabolic tumor volume, which is a measure of tumor volume with high metabolic activity, with the [18F]-FLT-derived tumor volume demonstrating high proliferative activity, we considered this as “proliferating tumor volume”.
SPECT/CT Imaging
Study subjects were randomly selected to equivalently balance average tumor volume within a single cohort of n = 3 subjects per group at 7–8-weeks post BxPc-3 tumor cell inoculation for in vivo [125I]-anti-GFP or [125I]-anti-mCherry SPECT/CT imaging. Subjects were scanned using a multi-bed apparatus supporting n=3 subjects/scan. Subjects were maintained under isoflurane anesthesia through the course of each scan. [125I]-anti-GFP or [125I]-anti-mCherry was administered via tail vein at a total radioactive dose level of approximately 200 uCi/subject; SPECT scanning was initiated at approximately 48-h post administration of the applicable imaging agent. CT images were acquired immediately following completion of SPECT imaging. Image data were analyzed using VivoQuant software. Fixed volume regions-of-interest (ROIs) were used to quantify total radioactivity in tumor and heart, for each animal at each time point; results were reported as Standardized Uptake Value (SUV); heart was used as surrogate to determine systemic activity.
Quantitative Whole-Body Autoradiography (QWBA)
Following completion of SPECT/CT imaging, each subject receiving [125I]-anti-GFP or [125I]-anti-mCherry was further assessed for intratumoral and potential systemic expression of oncolytic virus transgene expression through application of quantitative whole-body autoradiography (QWBA) via standard techniques. At least four quality control standards were placed into each frozen block of carboxy methyl cellulose (CMC) prior to sectioning and were used for section thickness quality control. Sections, approximately 30 µm thick, were taken from the sagittal plane and captured on adhesive tape. Appropriate sections selected at various levels of interest in the block were collected to encompass the required tissues and biological fluids, where possible. The sections were exposed to phosphor imaging screens for approximately 48-h prior to digital scanning.
Quantification, relative to the calibration standards, was performed by image densitometry using MCIDTM image analysis software. A standard curve was constructed, and a lower limit of quantification (LLOQ) was applied to the data. The LLOQ was determined to be 0.25–0.36 ng equivalents by using the radioactive concentration of the lowest calibration standard used to generate a calibration curve divided by the specific activity of the dose formulation (µCi/µg). Artifacts were excluded, as necessary, from analysis during image processing.
CD-3+ T-cell Biomarker Assay
To assess T-cell biomarker levels in vivo, baseline blood samples were collected from a random cohort of n=4 subjects in each control and treatment group during Week 2 and post-treatment blood samples were collected prior to in vivo imaging during Week 7–8. Samples were analyzed via multiplex panel for the following biomarkers and results reported as picogram per milliliter (pg/mL): MCP-1, IL-2, IL-4, Il-6, IL-10, INF-γ and TNF-α.
Tissue Processing and Histopathological Assessment
Following final PET/CT or SPECT/CT each subject was euthanized in compliance with Institutional Animal Care and Use Committee guidelines. Following euthanasia, each subject was examined carefully for external abnormalities including palpable masses. The skin was reflected from a ventral midline incision, and any subcutaneous masses were identified and correlated with antemortem findings where applicable. Care was taken not to disrupt the tumor tissue associated with the primary xenograft implantation site and immediate adjacent tissue. Samples of the xenograft tumor (entire tumor including capsule), skin adjacent to tumor, brain, heart, kidney, liver, spleen, lung and skeletal muscle will be collected/processed for hematoxylin and eosin (H&E) staining. Samples of the xenograft tumor (entire tumor including capsule) and skin adjacent to tumor were also collected and processed for immunohistochemistry (IHC) staining. Target tissues assigned to H&E processing were assessed by a Board-certified Veterinary Pathologist for, but not limited to, the following: overall size of the tumor section, nature and form of neoplastic cells, mitotic index, presence of dead or degrading cells, presence and character of inflammatory cells, invasion of inflammatory cells into the main body of the xenograft tissue and fibrosis. Target tissues assigned for IHC staining were processed and stained according to established methods for the following biomarkers, with appropriate reagents as applicable for murine species: CD-3, CD-4, CD-8, CD-68 and Caspase-3. Each immunohistochemical staining run contained proper positive and negative controls and the controls were evaluated to ensure run validity and adequate inter-run consistency.
Statistical Analysis
For statistical analysis of body weight (g), QWBA (µCi/g tumor tissue) and SPECT/CT (SUV) datasets, an Analysis of Variance (ANOVA) with adjustment for multiple comparisons was performed. For endpoints and/or parameters (within each collection interval) where all groups with sample sizes of three or greater are included, the system was tested for the normality of the residuals and homogeneity of variances to see whether the data was approximately normal or whether a log transformation or rank transformation would be used. Leven’s test [104] was used to assess homogeneity of group variances and Shapiro-Wilk’s [105] test was used to test the normality of the residuals. A one-way analysis of variance using the appropriate transformed data was used to test each endpoint for the effects of treatment [106]. Results of these pair-wise comparisons were analyzed at the 0.05 and 0.01 significance levels after adjustment for multiple comparisons using the methods of Edwards and Berry [107]. All tests were two-tailed tests unless otherwise indicated.
For statistical analysis of tumor volume, cytokines, and PET/CT datasets, a Repeated Measures Analysis of Covariance (RMANCOVA) was performed. A repeated measures analysis of covariance (mixed model) was conducted for tumor volumes collected from measurement period 15 onwards; see Figure 15 for temporal relationship of measurement periods relative to study activities. For each endpoint, the model was tested for the effects of treatment, time, and the interaction of treatment and time [106]. Tumor volume data collected at termination of in-life for each subject was used as a covariant. Results of all pair-wise comparisons were analyzed at the 0.05 and 0.01 significance levels after adjustment for multiple comparisons using the methods of Edwards and Berry [107]. All endpoints were analyzed using two-tailed tests unless indicated otherwise.
Author Contributions
S.D.H., with support from K.E., conceived and designed the study. S.D.H., performed in vitro assays and provided direct oversight and study management for all in vivo and ex vivo study activities. S.D.H., and K.E., were responsible for interpretation of results and manuscript preparation.
Acknowledgments
This study was co-funded by Western Michigan University under National Institutes of Health (NIH) grant 1R15CA156262-01 to K.E., and Charles River Laboratories (CRL; CRL Study Number: 999-872). The authors are grateful to Drs. John Spitzbergen and Christine Byrd for their suggestions and editorial comments. The authors are also grateful to Charles River technical and scientific staff for direct study support and execution, as well as members of the Laboratory of Virology, Department of Biological Sciences, Western Michigan University, Michael L. Monaco, Tiantian Zheng and Yogesh R. Suryawanshi supporting production and isolation of virus(es).
Conflicts of Interest
K.E., declares no conflict of interest; S.D.H., is an employee of CRL and may own stock/options in the company.
References
- Bray, F.; Ferlay, J.; Soerjomataram, I.; Siegel, R.L.; Torre, L.A.; Jemal, A. Global Cancer Statistics 2018: GLOBOCAN Estimates of Incidence and Mortality Worldwide for 36 Cancers in 185 Countries. CA: A Cancer Journal for Clinicians 2018. [Google Scholar] [CrossRef]
- Previdi, M.C.; Carotenuto, P.; Zito, D.; Pandolfo, R.; Braconi, C. Noncoding RNAs as Novel Biomarkers in Pancreatic Cancer: What Do We Know? Future Oncology 2017. [CrossRef] [PubMed]
- Haeberle, L.; Esposito, I. Pathology of Pancreatic Cancer. Translational Gastroenterology and Hepatology 2019. [CrossRef] [PubMed]
- Ryan, D.P.; Hong, T.S.; Bardeesy, N. Pancreatic Adenocarcinoma. New England Journal of Medicine 2014. [CrossRef] [PubMed]
- Rahib, L.; Smith, B.D.; Aizenberg, R.; Rosenzweig, A.B.; Fleshman, J.M.; Matrisian, L.M. Projecting Cancer Incidence and Deaths to 2030: The Unexpected Burden of Thyroid, Liver, and Pancreas Cancers in the United States. Cancer Research 2014. [CrossRef] [PubMed]
- Rouanet, M.; Lebrin, M.; Gross, F.; Bournet, B.; Cordelier, P.; Buscail, L. Gene Therapy for Pancreatic Cancer: Specificity, Issues and Hopes. International Journal of Molecular Sciences 2017. [CrossRef] [PubMed]
- Vincent, A.; Herman, J.; Schulick, R.; Hruban, R.H.; Goggins, M. Pancreatic Cancer. In Proceedings of the The Lancet; 2011.
- Hruban, R.H.; Canto, M.I.; Goggins, M.; Schulick, R.; Klein, A.P. Update on Familial Pancreatic Cancer. Advances in Surgery 2010. [CrossRef] [PubMed]
- McGuigan, A.; Kelly, P.; Turkington, R.C.; Jones, C.; Coleman, H.G.; McCain, R.S. Pancreatic Cancer: A Review of Clinical Diagnosis, Epidemiology, Treatment and Outcomes. World Journal of Gastroenterology 2018. [CrossRef] [PubMed]
- Zhou, B.; Xu, J.W.; Cheng, Y.G.; Gao, J.Y.; Hu, S.Y.; Wang, L.; Zhan, H.X. Early Detection of Pancreatic Cancer: Where Are We Now and Where Are We Going? International Journal of Cancer 2017. [CrossRef] [PubMed]
- Islami, F.; Goding Sauer, A.; Miller, K.D.; Siegel, R.L.; Fedewa, S.A.; Jacobs, E.J.; McCullough, M.L.; Patel, A.v.; Ma, J.; Soerjomataram, I.; et al. Proportion and Number of Cancer Cases and Deaths Attributable to Potentially Modifiable Risk Factors in the United States. CA: A Cancer Journal for Clinicians 2018. [Google Scholar] [CrossRef] [PubMed]
- Chang, H.-H.; Eibl, G. Obesity-Induced Adipose Tissue Inflammation as a Strong Promotional Factor for Pancreatic Ductal Adenocarcinoma. Cells 2019. [Google Scholar] [CrossRef] [PubMed]
- Jones, S.; Zhang, X.; Parsons, D.W.; Lin, J.C.H.; Leary, R.J.; Angenendt, P.; Mankoo, P.; Carter, H.; Kamiyama, H.; Jimeno, A.; et al. Core Signaling Pathways in Human Pancreatic Cancers Revealed by Global Genomic Analyses. Science 2008. [Google Scholar] [CrossRef] [PubMed]
- Rozenblum, E.; Schutte, M.; Goggins, M.; Hahn, S.A.; Panzer, S.; Zahurak, M.; Goodman, S.N.; Sohn, T.A.; Hruban, R.H.; Yeo, C.J.; et al. Tumor-Suppressive Pathways in Pancreatic Carcinoma. Cancer Research 1997. [Google Scholar]
- van Heek, N.T.; Meeker, A.K.; Kern, S.E.; Yeo, C.J.; Lillemoe, K.D.; Cameron, J.L.; Offerhaus, G.J.A.; Hicks, J.L.; Wilentz, R.E.; Goggins, M.G.; et al. Telomere Shortening Is Nearly Universal in Pancreatic Intraepithelial Neoplasia. American Journal of Pathology 2002. [Google Scholar] [CrossRef] [PubMed]
- Hong, S.M.; Heaphy, C.M.; Shi, C.; Eo, S.H.; Cho, H.; Meeker, A.K.; Eshleman, J.R.; Hruban, R.H.; Goggins, M. Telomeres Are Shortened in Acinar-to-Ductal Metaplasia Lesions Associated with Pancreatic Intraepithelial Neoplasia but Not in Isolated Acinar-to-Ductal Metaplasias. Modern Pathology 2011. [Google Scholar] [CrossRef] [PubMed]
- Hruban, R.H.; Goggins, M.; Parsons, J.; Kern, S.E. Progression Model for Pancreatic Cancer. Clinical Cancer Research 2000.
- Carter, H.; Samayoa, J.; Hruban, R.H.; Karchin, R. Prioritization of Driver Mutations in Pancreatic Cancer Using Cancer-Specific High-Throughput Annotation of Somatic Mutations (CHASM). Cancer Biology and Therapy 2010. [Google Scholar] [CrossRef]
- Omura, N.; Goggins, M. Epigenetics and Epigenetic Alterations in Pancreatic Cancer. International Journal of Clinical and Experimental Pathology 2009.
- M., S.; R.H., H.; J., G.; R., M.; W., H.; S.K., R.; C.A., M.; S.A., H.; I., S.-W.; W., S.; et al. Abrogation of the Rb/P16 Tumor-Suppressive Pathway in Virtually All Pancreatic Carcinomas. Cancer Research 1997.
- Matsubayashi, H.; Canto, M.; Sato, N.; Klein, A.; Abe, T.; Yamashita, K.; Yeo, C.J.; Kalloo, A.; Hruban, R.; Goggins, M. DNA Methylation Alterations in the Pancreatic Juice of Patients with Suspected Pancreatic Disease. Cancer Research 2006. [Google Scholar] [CrossRef] [PubMed]
- Sato, N.; Matsubayashi, H.; Abe, T.; Fukushima, N.; Goggins, M. Epigenetic Down-Regulation of CDKN1C/P57KIP2 in Pancreatic Ductal Neoplasms Identified by Gene Expression Profiling. Clinical Cancer Research 2005. [Google Scholar] [CrossRef] [PubMed]
- Sato, N.; Fukushima, N.; Hruban, R.H.; Goggins, M. CpG Island Methylation Profile of Pancreatic Intraepithelial Neoplasia. Modern Pathology 2008. [Google Scholar] [CrossRef] [PubMed]
- Sato, N.; Fukushima, N.; Maitra, A.; Matsubayashi, H.; Yeo, C.J.; Cameron, J.L.; Hruban, R.H.; Goggins, M. Discovery of Novel Targets for Aberrant Methylation in Pancreatic Carcinoma Using High-Throughput Microarrays. Cancer Research 2003. [Google Scholar]
- Sato, N.; Fukushima, N.; Chang, R.; Matsubayashi, H.; Goggins, M. Differential and Epigenetic Gene Expression Profiling Identifies Frequent Disruption of the RELN Pathway in Pancreatic Cancers. Gastroenterology 2006. [Google Scholar] [CrossRef] [PubMed]
- Sato, N.; Fukushima, N.; Maehara, N.; Matsubayashi, H.; Koopmann, J.; Su, G.H.; Hruban, R.H.; Goggins, M. SPARC/Osteonectin Is a Frequent Target for Aberrant Methylation in Pancreatic Adenocarcinoma and a Mediator of Tumor-Stromal Interactions. Oncogene 2003. [Google Scholar] [CrossRef] [PubMed]
- Sato, N.; Maitra, A.; Fukushima, N.; van Heek, N.T.; Matsubayashi, H.; Iacobuzio-Donahue, C.A.; Rosty, C.; Goggins, M. Frequent Hypomethylation of Multiple Genes Overexpressed in Pancreatic Ductal Adenocarcinoma. Cancer Research 2003. [Google Scholar]
- Parsi, M.A.; Li, A.; Li, C.P.; Goggins, M. DNA Methylation Alterations In Endoscopic Retrograde Cholangiopancreatography Brush Samples of Patients With Suspected Pancreaticobiliary Disease. Clinical Gastroenterology and Hepatology 2008. [Google Scholar] [CrossRef] [PubMed]
- Vincent, A.; Ducourouble, M.; van Seuningen, I. Epigenetic Regulation of the Human Mucin Gene MUC4 in Epithelial Cancer Cell Lines Involves Both DNA Methylation and Histone Modifications Mediated by DNA Methyltransferases and Histone Deacetylases. The FASEB Journal 2008. [Google Scholar] [CrossRef] [PubMed]
- Scheufele, F.; Hartmann, D.; Friess, H. Treatment of Pancreatic Cancer—Neoadjuvant Treatment in Borderline Resectable/Locally Advanced Pancreatic Cancer. Translational Gastroenterology and Hepatology 2019. [CrossRef] [PubMed]
- Wang, X.Y.; Yang, F.; Jin, C.; Fu, D.L. Utility of PET/CT in Diagnosis, Staging, Assessment of Resectability and Metabolic Response of Pancreatic Cancer. World Journal of Gastroenterology 2014, 20. [Google Scholar] [CrossRef] [PubMed]
- Konstantinidis, I.T.; Warshaw, A.L.; Allen, J.N.; Blaszkowsky, L.S.; del Castillo, C.F.; Deshpande, V.; Hong, T.S.; Kwak, E.L.; Lauwers, G.Y.; Ryan, D.P.; et al. Borderline Resectable Pancreatic Cancer: Need for Standardization and Methods for Optimal Clinical Trial Design. Ann Surg Oncol 2015. [Google Scholar] [CrossRef] [PubMed]
- Springfeld, C.; Jäger, D.; Büchler, M.W.; Strobel, O.; Hackert, T.; Palmer, D.H.; Neoptolemos, J.P. Chemotherapy for Pancreatic Cancer. Presse Medicale 2019. [CrossRef]
- Klaiber, U.; Hackert, T.; Neoptolemos, J.P. Adjuvant Treatment for Pancreatic Cancer. Translational Gastroenterology and Hepatology 2019. [CrossRef] [PubMed]
- Gupta, R.; Amanam, I.; Chung, V. Current and Future Therapies for Advanced Pancreatic Cancer. Journal of Surgical Oncology 2017. [CrossRef] [PubMed]
- Gillen, S.; Schuster, T.; Büschenfelde, C.M.; Friess, H.; Kleeff, J. Preoperative/Neoadjuvant Therapy in Pancreatic Cancer: A Systematic Review and Meta-Analysis of Response and Resection Percentages. PLoS Medicine 2010. [Google Scholar] [CrossRef] [PubMed]
- Werner, J.; Combs, S.E.; Springfeld, C.; Hartwig, W.; Hackert, T.; Büchler, M.W. Advanced-Stage Pancreatic Cancer: Therapy Options. Nature Reviews Clinical Oncology 2013. [CrossRef] [PubMed]
- Conroy, T.; Desseigne, F.; Ychou, M.; Bouché, O.; Guimbaud, R.; Bécouarn, Y.; Adenis, A.; Raoul, J.L.; Gourgou-Bourgade, S.; de La Fouchardière, C.; et al. FOLFIRINOX versus Gemcitabine for Metastatic Pancreatic Cancer. New England Journal of Medicine 2011. [Google Scholar] [CrossRef] [PubMed]
- von Hoff, D.D.; Ervin, T.; Arena, F.P.; Chiorean, E.G.; Infante, J.; Moore, M.; Seay, T.; Tjulandin, S.A.; Ma, W.W.; Saleh, M.N.; et al. Increased Survival in Pancreatic Cancer with Nab-Paclitaxel plus Gemcitabine. New England Journal of Medicine 2013. [Google Scholar] [CrossRef] [PubMed]
- Falasca, M.; Kim, M.; Casari, I. Pancreatic Cancer: Current Research and Future Directions. Biochimica et Biophysica Acta—Reviews on Cancer 2016. [Google Scholar] [CrossRef] [PubMed]
- Rahal, A.; Musher, B. Oncolytic Viral Therapy for Pancreatic Cancer. Journal of Surgical Oncology 2017. [CrossRef] [PubMed]
- LaRocca, C.J.; Warner, S.G. A New Role for Vitamin D: The Enhancement of Oncolytic Viral Therapy in Pancreatic Cancer. Biomedicines 2018. [CrossRef] [PubMed]
- Russell, S.J.; Peng, K.W.; Bell, J.C. Oncolytic Virotherapy. Nature Biotechnology 2012. [CrossRef]
- Vähä-Koskela, M.J.V.; Heikkilä, J.E.; Hinkkanen, A.E. Oncolytic Viruses in Cancer Therapy. Cancer Letters 2007. [CrossRef] [PubMed]
- Bell, J.; McFadden, G. Viruses for Tumor Therapy. Cell Host and Microbe 2014. [CrossRef] [PubMed]
- Lichty, B.D.; Breitbach, C.J.; Stojdl, D.F.; Bell, J.C. Going Viral with Cancer Immunotherapy. Nature Reviews Cancer 2014. [CrossRef] [PubMed]
- Kaufman, H.L.; Kohlhapp, F.J.; Zloza, A. Oncolytic Viruses: A New Class of Immunotherapy Drugs. Nature Reviews Drug Discovery 2015.
- Eissa, I.R.; Naoe, Y.; Bustos-Villalobos, I.; Ichinose, T.; Tanaka, M.; Zhiwen, W.; Mukoyama, N.; Morimoto, T.; Miyajima, N.; Hitoki, H.; et al. Genomic Signature of the Natural Oncolytic Herpes Simplex Virus HF10 and Its Therapeutic Role in Preclinical and Clinical Trials. Frontiers in Oncology 2017. [CrossRef] [PubMed]
- Bretscher, C.; Marchini, A. H-1 Parvovirus as a Cancer-Killing Agent: Past, Present, and Future. Viruses 2019. [CrossRef] [PubMed]
- Clemens, M.J. Targets and Mechanisms for the Regulation of Translation in Malignant Transformation. Oncogene 2004. [CrossRef] [PubMed]
- Liang, M. Oncorine, the World First Oncolytic Virus Medicine and Its Update in China. Current Cancer Drug Targets 2018. [Google Scholar] [CrossRef] [PubMed]
- Yokoda, R.T.; Nagalo, B.M.; Borad, M.J. Oncolytic Adenoviruses in Gastrointestinal Cancers. Biomedicines 2018. [CrossRef] [PubMed]
- Freytag, S.O.; Barton, K.N.; Brown, S.L.; Narra, V.; Zhang, Y.; Tyson, D.; Nall, C.; Lu, M.; Ajlouni, M.; Movsas, B.; et al. Replication-Competent Adenovirus-Mediated Suicide Gene Therapy with Radiation in a Preclinical Model of Pancreatic Cancer. Molecular Therapy 2007. [Google Scholar] [CrossRef] [PubMed]
- Eissa, I.R.; Bustos-Villalobos, I.; Ichinose, T.; Matsumura, S.; Naoe, Y.; Miyajima, N.; Morimoto, D.; Mukoyama, N.; Zhiwen, W.; Tanaka, M.; et al. The Current Status and Future Prospects of Oncolytic Viruses in Clinical Trials against Melanoma, Glioma, Pancreatic, and Breast Cancers. Cancers 2018. [CrossRef] [PubMed]
- Yokoda, R.; Nagalo, B.M.; Arora, M.; Egan, J.B.; Bogenberger, J.M.; DeLeon, T.T.; Zhou, Y.; Ahn, D.H.; Borad, M.J. Oncolytic Virotherapy in Upper Gastrointestinal Tract Cancers. Oncolytic Virotherapy 2018. [Google Scholar] [CrossRef] [PubMed]
- Andtbacka, R.H.I.; Kaufman, H.L.; Collichio, F.; Amatruda, T.; Senzer, N.; Chesney, J.; Delman, K.A.; Spitler, L.E.; Puzanov, I.; Agarwala, S.S.; et al. Talimogene Laherparepvec Improves Durable Response Rate in Patients with Advanced Melanoma. Journal of Clinical Oncology 2015. [Google Scholar] [CrossRef] [PubMed]
- Chang, K.J.; Senzer, N.N.; Binmoeller, K.; Goldsweig, H.; Coffin, R. Phase I Dose-Escalation Study of Talimogene Laherparepvec (T-VEC) for Advanced Pancreatic Cancer (Ca). Journal of Clinical Oncology 2012. [Google Scholar] [CrossRef]
- Gayral, M.; Lulka, H.; Hanoun, N.; Biollay, C.; Sèlves, J.; Vignolle-Vidoni, A.; Berthommé, H.; Trempat, P.; Epstein, A.L.; Buscail, L.; et al. Targeted Oncolytic Herpes Simplex Virus Type 1 Eradicates Experimental Pancreatic Tumors. Human Gene Therapy 2015. [Google Scholar] [CrossRef] [PubMed]
- TOOLAN, H.W. A Virus Associated with Transplantable Human Tumors. Bulletin of the New York Academy of Medicine 1961. [Google Scholar]
- Toolan, H.W.; Ledinko, N. Inhibition by H-1 Virus of the Incidence of Tumors Produced by Adenovirus 12 in Hamsters. Virology 1968. [Google Scholar] [CrossRef] [PubMed]
- Bryant, K.L.; Mancias, J.D.; Kimmelman, A.C.; Der, C.J. KRAS: Feeding Pancreatic Cancer Proliferation. Trends in Biochemical Sciences 2014. [CrossRef] [PubMed]
- Noonan, A.M.; Farren, M.R.; Geyer, S.M.; Huang, Y.; Tahiri, S.; Ahn, D.; Mikhail, S.; Ciombor, K.K.; Pant, S.; Aparo, S.; et al. Randomized Phase 2 Trial of the Oncolytic Virus Pelareorep (Reolysin) in Upfront Treatment of Metastatic Pancreatic Adenocarcinoma. Molecular Therapy 2016. [Google Scholar] [CrossRef] [PubMed]
- Ahn, D.H.; Bekaii-Saab, T. The Continued Promise and Many Disappointments of Oncolytic Virotherapy in Gastrointestinal Malignancies. Biomedicines 2017. [CrossRef] [PubMed]
- Smith, G.L.; Moss, B. Infectious Poxvirus Vectors Have Capacity for at Least 25 000 Base Pairs of Foreign DNA. Gene 1983. [Google Scholar] [CrossRef] [PubMed]
- Yu, Y.A.; Galanis, C.; Woo, Y.; Chen, N.; Zhang, Q.; Fong, Y.; Szalay, A.A. Regression of Human Pancreatic Tumor Xenografts in Mice after a Single Systemic Injection of Recombinant Vaccinia Virus GLV-1h68. Molecular Cancer Therapeutics 2009. [Google Scholar] [CrossRef] [PubMed]
- Dai, M.H.; Liu, S.L.; Chen, N.G.; Zhang, T.P.; You, L.; Q. Zhang, F.; Chou, T.C.; Szalay, A.A.; Fong, Y.; Zhao, Y.P. Oncolytic Vaccinia Virus in Combination with Radiation Shows Synergistic Antitumor Efficacy in Pancreatic Cancer. Cancer Letters 2014. [CrossRef] [PubMed]
- al Yaghchi, C.; Zhang, Z.; Alusi, G.; Lemoine, N.R.; Wang, Y. Vaccinia Virus, a Promising New Therapeutic Agent for Pancreatic Cancer. Immunotherapy 2015. [CrossRef] [PubMed]
- Downs-Canner, S.; Guo, Z.S.; Ravindranathan, R.; Breitbach, C.J.; O’Malley, M.E.; Jones, H.L.; Moon, A.; McCart, J.A.; Shuai, Y.; Zeh, H.J.; et al. Phase 1 Study of Intravenous Oncolytic Poxvirus (VvDD) in Patients with Advanced Solid Cancers. Molecular Therapy 2016. [Google Scholar] [CrossRef] [PubMed]
- Chan, W.M.; McFadden, G. Oncolytic Poxviruses. Annual Review of Virology 2014. [Google Scholar] [CrossRef] [PubMed]
- Monroe, B.P.; Nakazawa, Y.J.; Reynolds, M.G.; Carroll, D.S. Estimating the Geographic Distribution of Human Tanapox and Potential Reservoirs Using Ecological Niche Modeling. International Journal of Health Geographics 2014. [Google Scholar] [CrossRef]
- Downie, A.W.; Taylor-Robinson, C.H.; Caunt, A.E.; Nelson, G.S.; Manson-Bahr, P.E.C.; Matthews, T.C.H. Tanapox: A New Disease Caused by a Pox Virus. British Medical Journal 1971. [Google Scholar] [CrossRef]
- Downie, A.W.; Taylor-Robinson, C.H.; Caunt, A.E.; Nelson, G.S.; Manson-Bahr, P.E.C.; Matthews, T.C.H. Tanapox: A New Disease Caused by a Pox Virus. British Medical Journal 1971, 1. [Google Scholar] [CrossRef] [PubMed]
- Brunetti, C.R.; Amano, H.; Ueda, Y.; Qin, J.; Miyamura, T.; Suzuki, T.; Li, X.; Barrett, J.W.; McFadden, G. Complete Genomic Sequence and Comparative Analysis Ofthe Tumorigenic Poxvirus Yaba Monkey TumorVirus. Journal of Virology 2003, 77. [Google Scholar] [CrossRef] [PubMed]
- Lee, H.J.; Essani, K.; Smith, G.L. The Genome Sequence of Yaba-like Disease Virus, a Yatapoxvirus. Virology 2001, 281. [Google Scholar] [CrossRef] [PubMed]
- Broët, P.; Romain, S.; Daver, A.; Ricolleau, G.; Quillien, V.; Rallet, A.; Asselain, B.; Martin, P.M.; Spyratos, F. Thymidine Kinase as a Proliferative Marker: Clinical Relevance in 1,692 Primary Breast Cancer Patients. Journal of Clinical Oncology 2001, 19. [Google Scholar] [CrossRef] [PubMed]
- Alegre, M.M.; Robison, R.A.; O’Neill, K.L. Thymidine Kinase 1 Upregulation Is an Early Event in Breast Tumor Formation. Journal of Oncology 2012. [Google Scholar] [CrossRef] [PubMed]
- Park, B.H.; Hwang, T.; Liu, T.C.; Sze, D.Y.; Kim, J.S.; Kwon, H.C.; Oh, S.Y.; Han, S.Y.; Yoon, J.H.; Hong, S.H.; et al. Use of a Targeted Oncolytic Poxvirus, JX-594, in Patients with Refractory Primary or Metastatic Liver Cancer: A Phase I Trial. The Lancet Oncology 2008, 9. [Google Scholar] [CrossRef] [PubMed]
- Hengstschläger, M.; Knöfler, M.; Müllner, E.W.; Ogris, E.; Wintersberger, E.; Wawra, E. Different Regulation of Thymidine Kinase during the Cell Cycle of Normal versus DNA Tumor Virus-Transformed Cells. Journal of Biological Chemistry 1994, 269. [Google Scholar] [CrossRef]
- Martuza, R.L.; Malick, A.; Markert, J.M.; Ruffner, K.L.; Coen, D.M. Experimental Therapy of Human Glioma by Means of a Genetically Engineered Virus Mutant. Science 1991, 252. [Google Scholar] [CrossRef] [PubMed]
- Kaur, B.; Cripe, T.; Chiocca, E. “Buy One Get One Free”: Armed Viruses for the Treatment of Cancer Cells and Their Microenvironment. Current Gene Therapy 2009, 9. [Google Scholar] [CrossRef] [PubMed]
- Cattaneo, R.; Miest, T.; Shashkova, E.v.; Barry, M.A. Reprogrammed Viruses as Cancer Therapeutics: Targeted, Armed and Shielded. Nature Reviews Microbiology 2008, 6. [Google Scholar] [CrossRef] [PubMed]
- Conrad, S.J.; El-Aswad, M.; Kurban, E.; Jeng, D.; Tripp, B.C.; Nutting, C.; Eversole, R.; Mackenzie, C.; Essani, K. Oncolytic Tanapoxvirus Expressing FliC Causes Regression of Human Colorectal Cancer Xenografts in Nude Mice. Journal of Experimental and Clinical Cancer Research 2015, 34. [Google Scholar] [CrossRef] [PubMed]
- Zhang, T.; Suryawanshi, Y.R.; Kordish, D.H.; Woyczesczyk, H.M.; Jeng, D.; Essani, K. Tanapoxvirus Lacking a Neuregulin-like Gene Regresses Human Melanoma Tumors in Nude Mice. Virus Genes 2017, 53. [Google Scholar] [CrossRef] [PubMed]
- Suryawanashi, Y.R.; Zhang, T.; Woyczesczyk, H.M.; Christie, J.; Byers, E.; Kohler, S.; Eversole, R.; Mackenzie, C.; Essani, K. T-Independent Response Mediated by Oncolytic Tanapoxvirus Recombinants Expressing Interleukin-2 and Monocyte Chemoattractant Protein-1 Suppresses Human Triple Negative Breast Tumors. Medical Oncology 2017, 34. [Google Scholar] [CrossRef] [PubMed]
- Conti, I.; Rollins, B.J. CCL2 (Monocyte Chemoattractant Protein-1) and Cancer. Seminars in Cancer Biology 2004, 14. [Google Scholar] [CrossRef] [PubMed]
- Xu, L.L.; Warren, M.K.; Rose, W.L.; Gong, W.; Wang, J.M. Human Recombinant Monocyte Chemotactic Protein and Other C-c Chemokines Bind and Induce Directional Migration of Dendritic Cells in Vitro. Journal of Leukocyte Biology 1996, 60. [Google Scholar] [CrossRef] [PubMed]
- Collington, S.J.; Hallgren, J.; Pease, J.E.; Jones, T.G.; Rollins, B.J.; Westwick, J.; Austen, K.F.; Williams, T.J.; Gurish, M.F.; Weller, C.L. The Role of the CCL2/CCR2 Axis in Mouse Mast Cell Migration In Vitro and In Vivo. The Journal of Immunology 2010, 184. [Google Scholar] [CrossRef] [PubMed]
- Carr, M.W.; Roth, S.J.; Luther, E.; Rose, S.S.; Springer, T.A. Monocyte Chemoattractant Protein 1 Acts as a T-Lymphocyte Chemoattractant. Proceedings of the National Academy of Sciences of the United States of America 1994, 91. [Google Scholar] [CrossRef] [PubMed]
- Lim, S.Y.; Yuzhalin, A.E.; Gordon-Weeks, A.N.; Muschel, R.J. Targeting the CCL2-CCR2 Signaling Axis in Cancer Metastasis. Oncotarget 2016, 7. [Google Scholar] [CrossRef] [PubMed]
- Parker, J.N.; Meleth, S.; Hughes, K.B.; Gillespie, G.Y.; Whitley, R.J.; Markert, J.M. Enhanced Inhibition of Syngeneic Murine Tumors by Combinatorial Therapy with Genetically Engineered HSV-1 Expressing CCL2 and IL-12. Cancer Gene Therapy 2005, 12. [Google Scholar] [CrossRef] [PubMed]
- Monti, P.; Leone, B.E.; Marchesi, F.; Balzano, G.; Zerbi, A.; Scaltrini, F.; Pasquali, C.; Calori, G.; Pessi, F.; Sperti, C.; et al. The CC Chemokine MCP-1/CCL2 in Pancreatic Cancer Progression: Regulation of Expression and Potential Mechanisms of Antimalignant Activity. Cancer Research 2003, 63. [Google Scholar]
- Henney, C.S.; Kuribayashi, K.; Kern, D.E.; Gillis, S. Interleukin-2 Augments Natural Killer Cell Activity. Nature 1981, 291. [Google Scholar] [CrossRef] [PubMed]
- Liao, W.; Lin, J.X.; Leonard, W.J. IL-2 Family Cytokines: New Insights into the Complex Roles of IL-2 as a Broad Regulator of T Helper Cell Differentiation. Current Opinion in Immunology 2011, 23. [Google Scholar] [CrossRef] [PubMed]
- Vacchelli, E.; Aranda, F.; Obrist, F.; Eggermont, A.; Galon, J.; Cremer, I.; Zitvogel, L.; Kroemer, G.; Galluzzi, L. Trial Watch: Immunostimulatory Cytokines in Cancer Therapy. OncoImmunology 2014, 3. [Google Scholar] [CrossRef] [PubMed]
- Zhang, T.; Suryawanshi, Y.R.; Szymczyna, B.R.; Essani, K. Neutralization of Matrix Metalloproteinase-9 Potentially Enhances Oncolytic Efficacy of Tanapox Virus for Melanoma Therapy. Medical Oncology 2017, 34. [Google Scholar] [CrossRef]
- Cheers, C.; Waller, R. Activated Macrophages in Congenitally Athymic “nude” Mice and in Lethally Irradiated Mice. Journal of immunology (Baltimore, Md. : 1950) 1975, 115. [Google Scholar] [CrossRef]
- Richmond, A.; Yingjun, S. Mouse Xenograft Models vs GEM Models for Human Cancer Therapeutics. DMM Disease Models and Mechanisms 2008, 1. [Google Scholar] [CrossRef] [PubMed]
- Essani, K.; Dugre, R.; Dales, S. Biogenesis of Vaccinia: Involvement of Spicules of the Envelope during Virion Assembly Examined by Means of Conditional Lethal Mutants and Serology. Virology 1982, 118. [Google Scholar] [CrossRef] [PubMed]
- Martin, S.J.; Eisenbarth, J.A.; Wagner-Utermann, U.; Mier, W.; Henze, M.; Pritzkow, H.; Haberkorn, U.; Eisenhut, M. A New Precursor for the Radiosynthesis of [18F]FLT. Nuclear Medicine and Biology 2002, 29. [Google Scholar] [CrossRef] [PubMed]
- Orlhac, F.; Soussan, M.; Maisonobe, J.A.; Garcia, C.A.; Vanderlinden, B.; Buvat, I. Tumor Texture Analysis in 18F-FDG PET: Relationships between Texture Parameters, Histogram Indices, Standardized Uptake Values, Metabolic Volumes, and Total Lesion Glycolysis. Journal of Nuclear Medicine 2014, 55. [Google Scholar] [CrossRef] [PubMed]
- Reynolds, J.C.; Maass-Moreno, R.; Thomas, A.; Ling, A.; Padiernos, E.B.; Steinberg, S.M.; Hassan, R. 18F-FDG PET Assessment of Malignant Pleural Mesothelioma: Total Lesion Volume and Total Lesion Glycolysis—the Central Role of Volume. Journal of Nuclear Medicine 2020, 61. [Google Scholar] [CrossRef]
- Lee, E.J.; Chang, S.H.; Lee, T.Y.; Yoon, S.Y.; Cheon, Y.K.; Shim, C.S.; So, Y.; Chung, H.W. oo Prognostic Value of FDG-PET/CT Total Lesion Glycolysis for Patients with Resectable Distal Bile Duct Adenocarcinoma. Anticancer research 2015, 35. [Google Scholar]
- Im, H.J.; Bradshaw, T.; Solaiyappan, M.; Cho, S.Y. Current Methods to Define Metabolic Tumor Volume in Positron Emission Tomography: Which One Is Better? Nuclear Medicine and Molecular Imaging 2018, 52. [Google Scholar] [CrossRef] [PubMed]
- Draper, N.R. Analysis of Messy Data Volume 1: Designed Experiments, Second Edition by George A. Milliken, Dallas E. Johnson. International Statistical Review 2009, 77. [Google Scholar] [CrossRef]
- Royston, P. Approximating the Shapiro-Wilk W-Test for Non-Normality. Statistics and Computing 1992, 2. [Google Scholar] [CrossRef]
- Ziegel, E.R.; Littell, R.; Milliken, G.; Stroup, W.; Wolfinger, R. SAS® System for Mixed Models. Technometrics 1997, 39. [Google Scholar] [CrossRef]
- Edwards, D.; Berry, J.J. The Efficiency of Simulation-Based Multiple Comparisons. Biometrics 1987, 43. [Google Scholar] [CrossRef]
- Shimada, M.; Andoh, A.; Araki, Y.; Fujiyama, Y.; Bamba, T. Ligation of the Fas Antigen Stimulates Chemokine Secretion in Pancreatic Cancer Cell Line PANC-1. Journal of Gastroenterology and Hepatology (Australia) 2001, 16. [Google Scholar] [CrossRef] [PubMed]
- J., I.; P., S.; S.M., C.; T., V.-K.; H., L.; T., H.; S., B.; I., C.; V., D.; R.K., J. Metformin Reduces Desmoplasia in Pancreatic Cancer by Reprogramming Stellate Cells and Tumor-Associated Macrophages. PLoS ONE 2015, 10.
- Xie, K. Interleukin-8 and Human Cancer Biology. Cytokine and Growth Factor Reviews 2001, 12. [Google Scholar] [CrossRef]
- Solez, K.; Battaglia, D.; Fahmy, H.; Trpkov, K. Pathology of Kidney Transplant Rejection. Current opinion in nephrology and hypertension 1993, 2. [Google Scholar] [CrossRef] [PubMed]
- Stojicevic, A.; Jovanovic, M.; Matkovic, M.; Nestorovic, E.; Stanojevic, N.; Dozic, B.; Glumac, S. Heart Transplant Rejection Pathology. Vojnosanitetski pregled 2021. [Google Scholar] [CrossRef]
- Hafez, G.R.; Gilbert-Barness, E.F. Pathology of Transplant Rejection and Immunosuppressive Therapy: Part I--Graft-vs.-Host Disease and Organ Rejection. Advances in pediatrics 1990, 37. [Google Scholar] [CrossRef]
- Xiu, M.; Liu, Z.; Tang, J. Screening and Identification of Key Regulatory Connections and Immune Cell Infiltration Characteristics for Lung Transplant Rejection Using Mucosal Biopsies. International Immunopharmacology 2020, 87. [Google Scholar] [CrossRef] [PubMed]
- López Panqueva, R. del P. Liver Biopsies in Transplant Pathology: Histopathological Diagnosis and Clinicopathological Correlation in the Early Post-Transplant Period. Revista Colombiana de Gastroenterologia 2016, 31. [Google Scholar] [CrossRef]
- von Hoff, D.D.; Ervin, T.; Arena, F.P.; Chiorean, E.G.; Infante, J.; Moore, M.; Seay, T.; Tjulandin, S.A.; Ma, W.W.; Saleh, M.N.; et al. Increased Survival in Pancreatic Cancer with Nab-Paclitaxel plus Gemcitabine. New England Journal of Medicine 2013, 369. [Google Scholar] [CrossRef] [PubMed]
- Falasca, M.; Kim, M.; Casari, I. Pancreatic Cancer: Current Research and Future Directions. Biochimica et Biophysica Acta—Reviews on Cancer 2016, 1865. [Google Scholar] [CrossRef] [PubMed]
- Rahal, A.; Musher, B. Oncolytic Viral Therapy for Pancreatic Cancer. Journal of Surgical Oncology 2017, 116. [Google Scholar] [CrossRef] [PubMed]
Figure 7.
Immunocompromised Group Mean Tumor [18F]-FLT PET/CT Derived Standardized Uptake Value (SUV) and Total Lesion Proliferation (TLP) BxPc-3 human PDAC cells were inoculated subcutaneously (SC) in the right flank region of immunocompetent, female, BALB-c Nude Mice. Each subject received a single inoculation of 5 x 10⁶ cells / subject. Each subject was treated with a single, intratumoral administration of 100 µL PBS formulation vehicle or 100X virus stock of each applicable recombinant virus to result in a virus mass dose of 5 x 10⁶ plaque forming units (pfu) per animal when tumors reached approximately 200 mm3. Baseline, prior to virotherapy, [18F]-FLT PET/CT images (200 µCi/subject) were acquired 3-weeks post BxPc-3 cell inoculation and post-virotherapy images were collected at 7–8-weeks post inoculation. Bars show standard error of the mean (±1 SEM), SUV results for each respective group are shown in plot A and TLP results are show in panel B. SUV and TLP inter- and intragroup statistical comparisons resulted in lack of statistical significance for all comparisons, except for immunocompromised, vehicle treated subject baseline to post-virotherapy results (P<0.05, indicated by asterisk (*)).
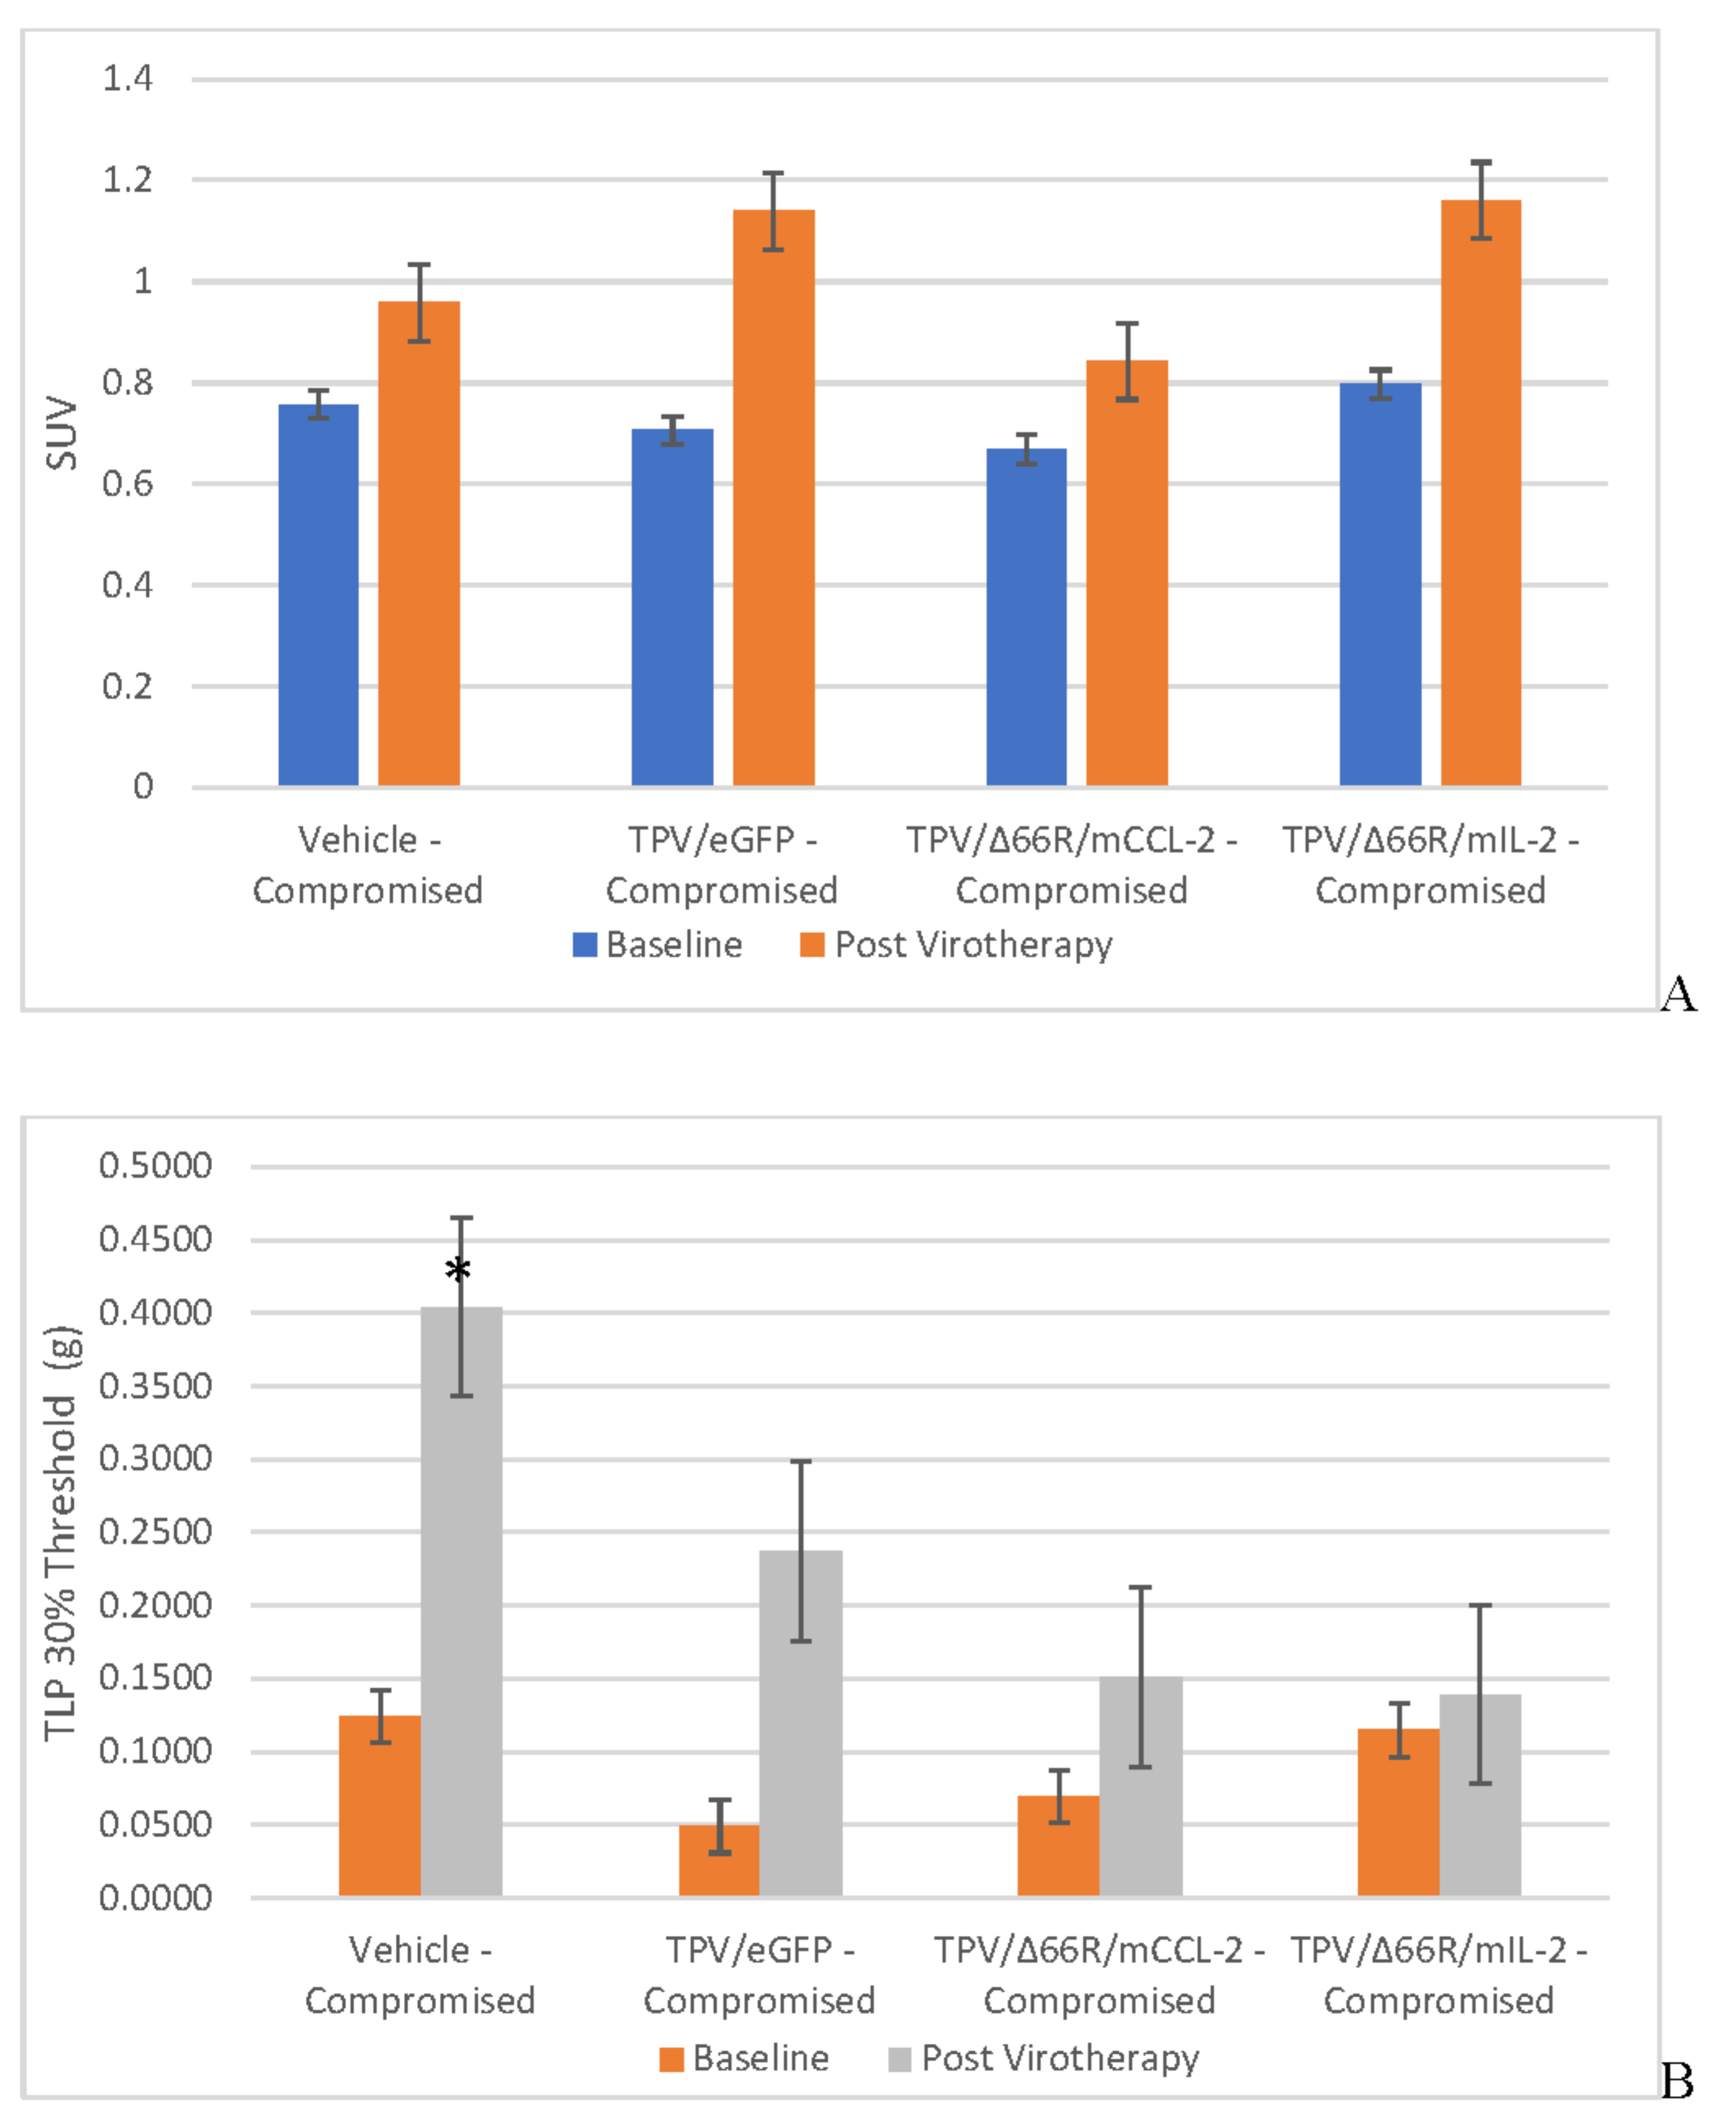
Figure 8.
Immune Reconstituted Group Mean Tumor [18F]-FLT PET/CT Derived Standardized Uptake Value (SUV) and Total Lesion Proliferation (TLP) BxPc-3 human PDAC cells were inoculated subcutaneously (SC) in the right flank region of immune reconstituted, female, BALB-c Nude Mice. Each subject received a single inoculation of 5 x 10⁶ cells / subject. Each subject was treated with a single, intratumoral administration of 100 µL PBS formulation vehicle or 100X virus stock of each applicable recombinant virus to result in a virus mass dose of 5 x 10⁶ plaque forming units (pfu) per animal when tumors reached approximately 200 mm3. Baseline, prior to virotherapy, [18F]-FLT PET/CT images (200 µCi/subject) were acquired 3-weeks post BxPc-3 cell inoculation and post-virotherapy images were collected at 7–8-weeks post inoculation. Bars show standard error of the mean (±1 SEM); SUV results for each respective group are shown in plot A and TLP results are show in plot B. SUV inter- and intragroup statistical comparisons resulted in lack of statistical significance for all comparisons. TLP inter- and intragroup statistical comparisons resulted in lack of statistical significance for all comparisons within immune reconstituted subjects; TLP results for post-virotherapy vehicle and TPV/∆66R/mCCL-2 treated subjects were statistically different (p<0.05, indicated by asterisk (*)) from immunocompromised vehicle treated control subjects.
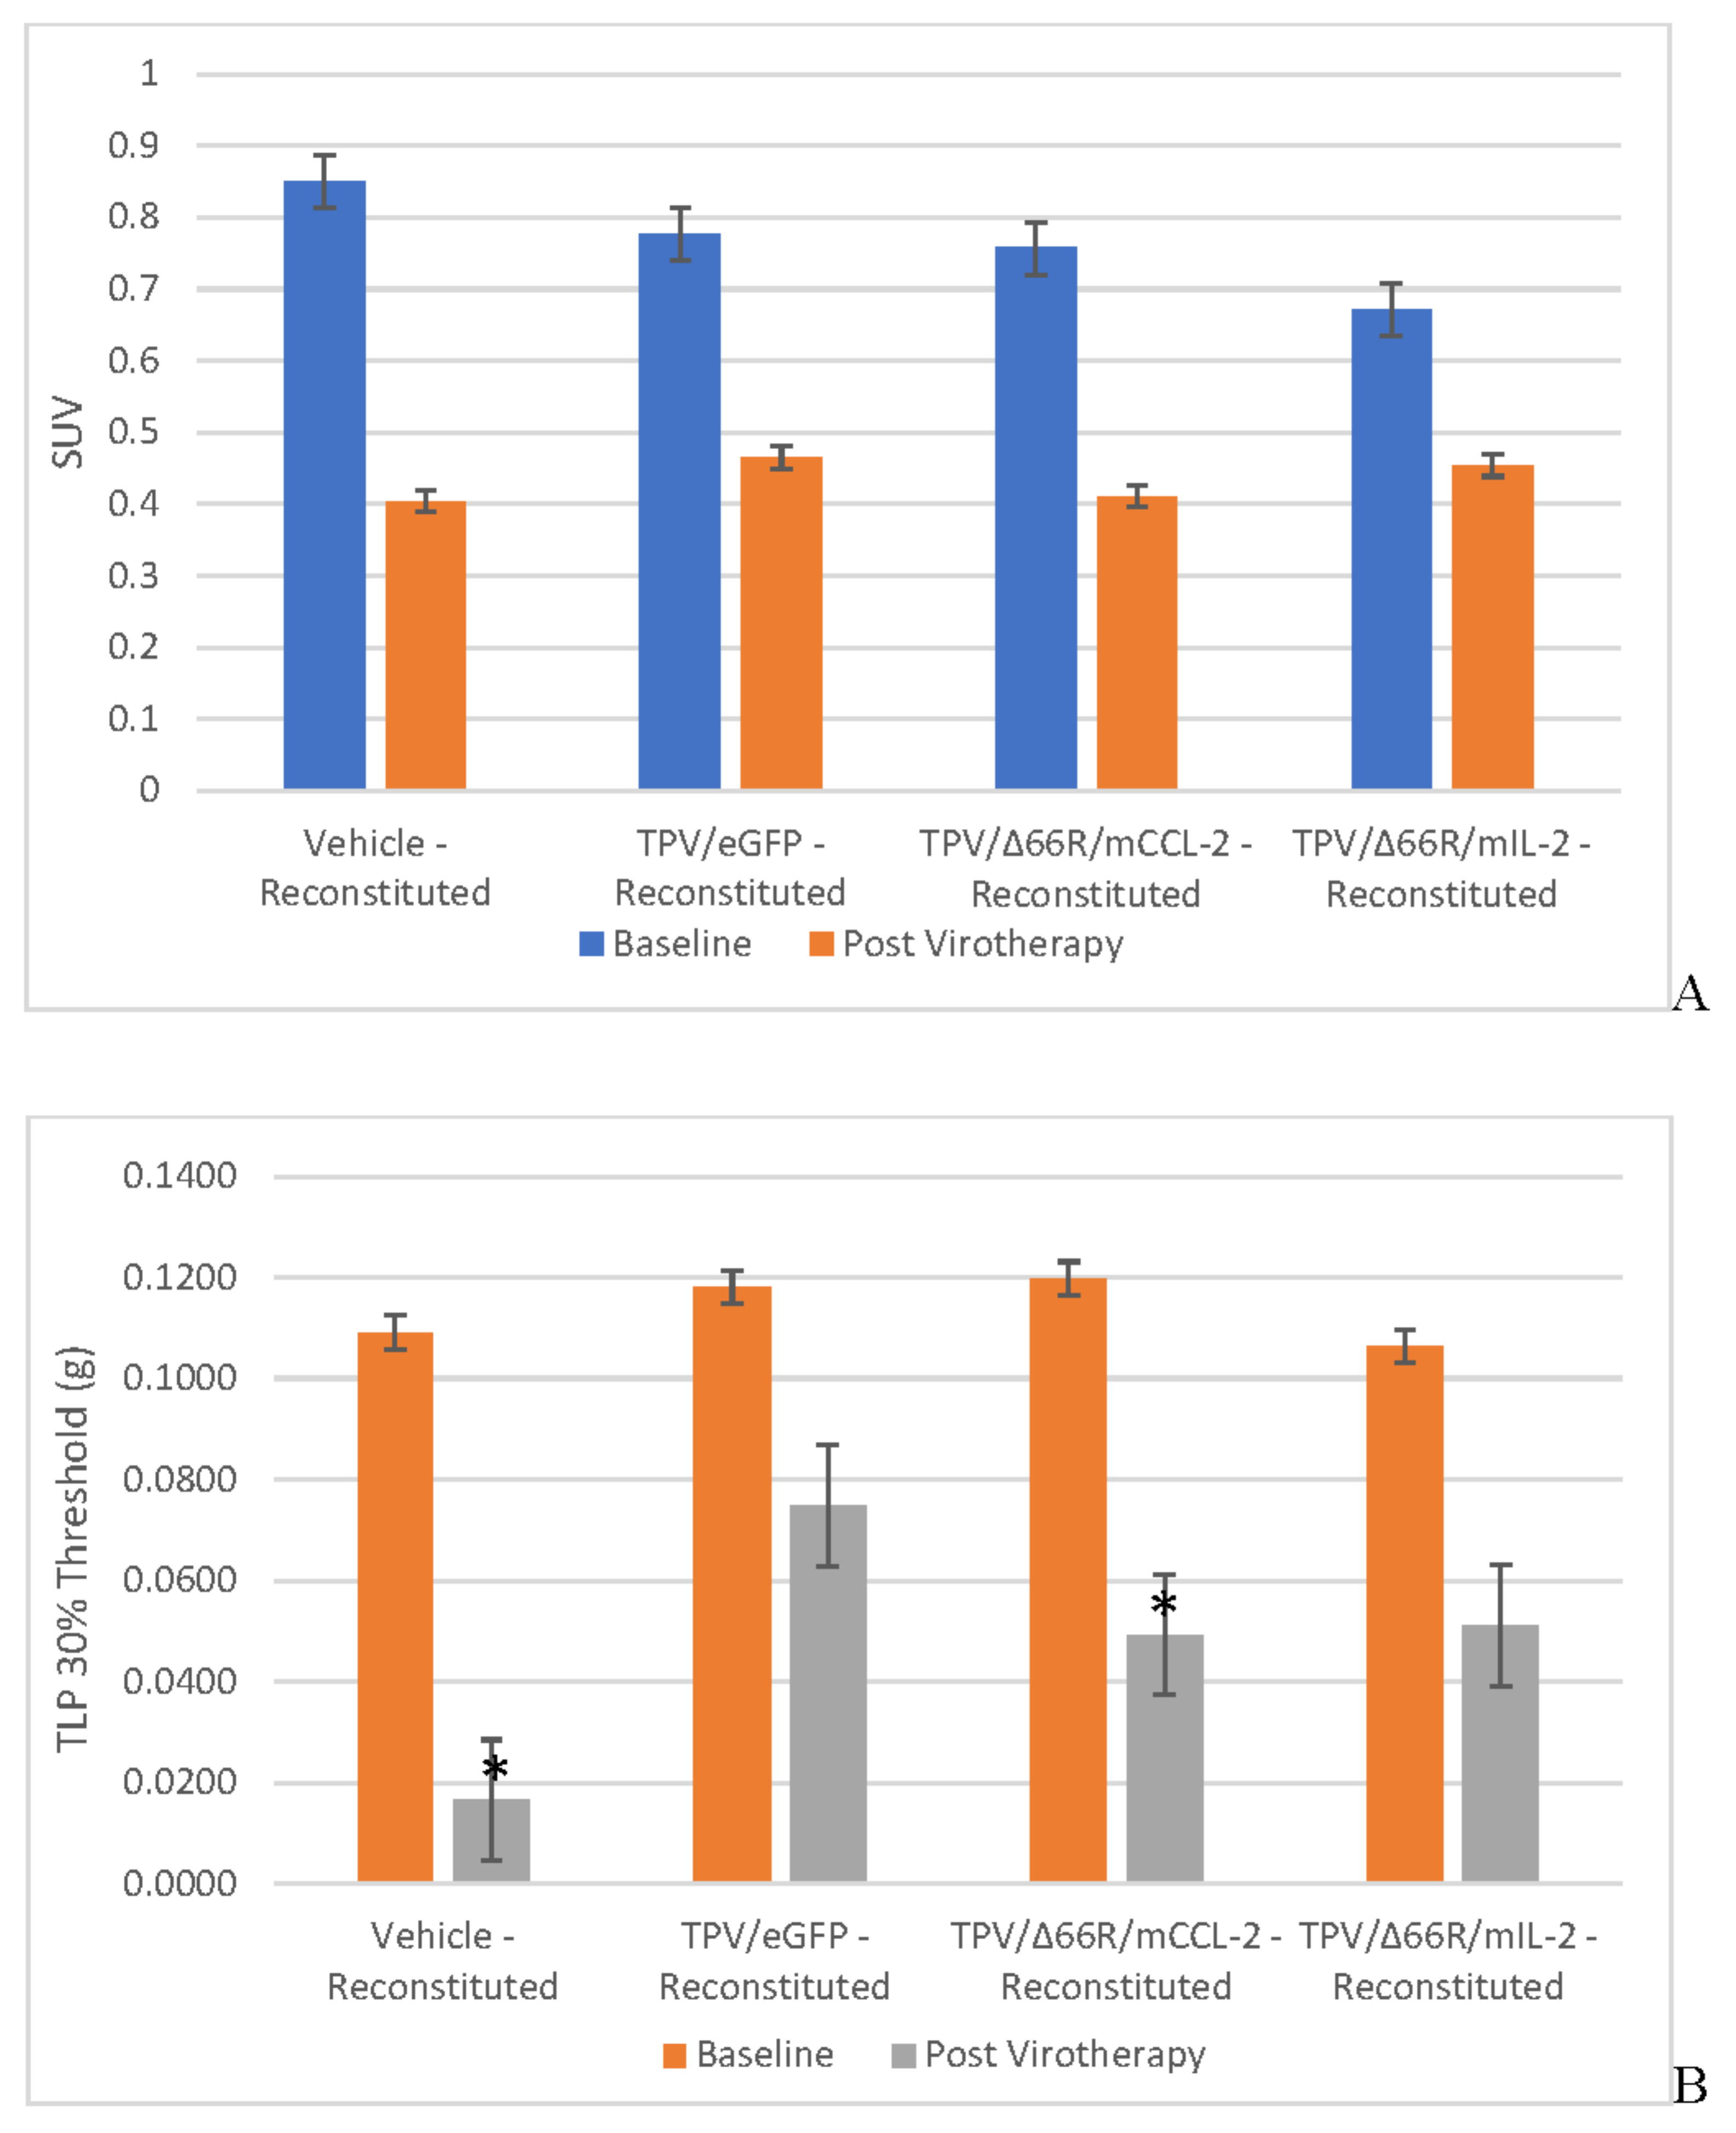
Figure 9.
Post-virotherapy [18F]-FLT PET/CT PET/CT Images of BxPc-3 PDAC Human Tumor Xenografts in Immunocompromised and Immune Reconstituted BALB-c Nude Mice BxPc-3 human PDAC cells (5 x 10⁶ cells / subject) were inoculated subcutaneously (SC) in the right flank region of immunocompetent, female, BALB-c Nude Mice. Each subject was treated with a single, intratumoral administration of 100 µL PBS formulation vehicle or 100X virus stock of each applicable recombinant virus to result in a virus mass dose of 5 x 10⁶ plaque forming units (pfu) per animal when tumors reached approximately 200 mm3. [18F]-FLT PET/CT images (200 µCi/subject) were acquired 7–8-weeks post tumor cell inoculation. Select, representative PET/CT images as follows: immunocompromised vehicle control (A), immune reconstituted vehicle control (B), TPV/eGFP immunocompromised (C) and TPV/eGFP immune reconstituted; white arrows indicate tumor location.
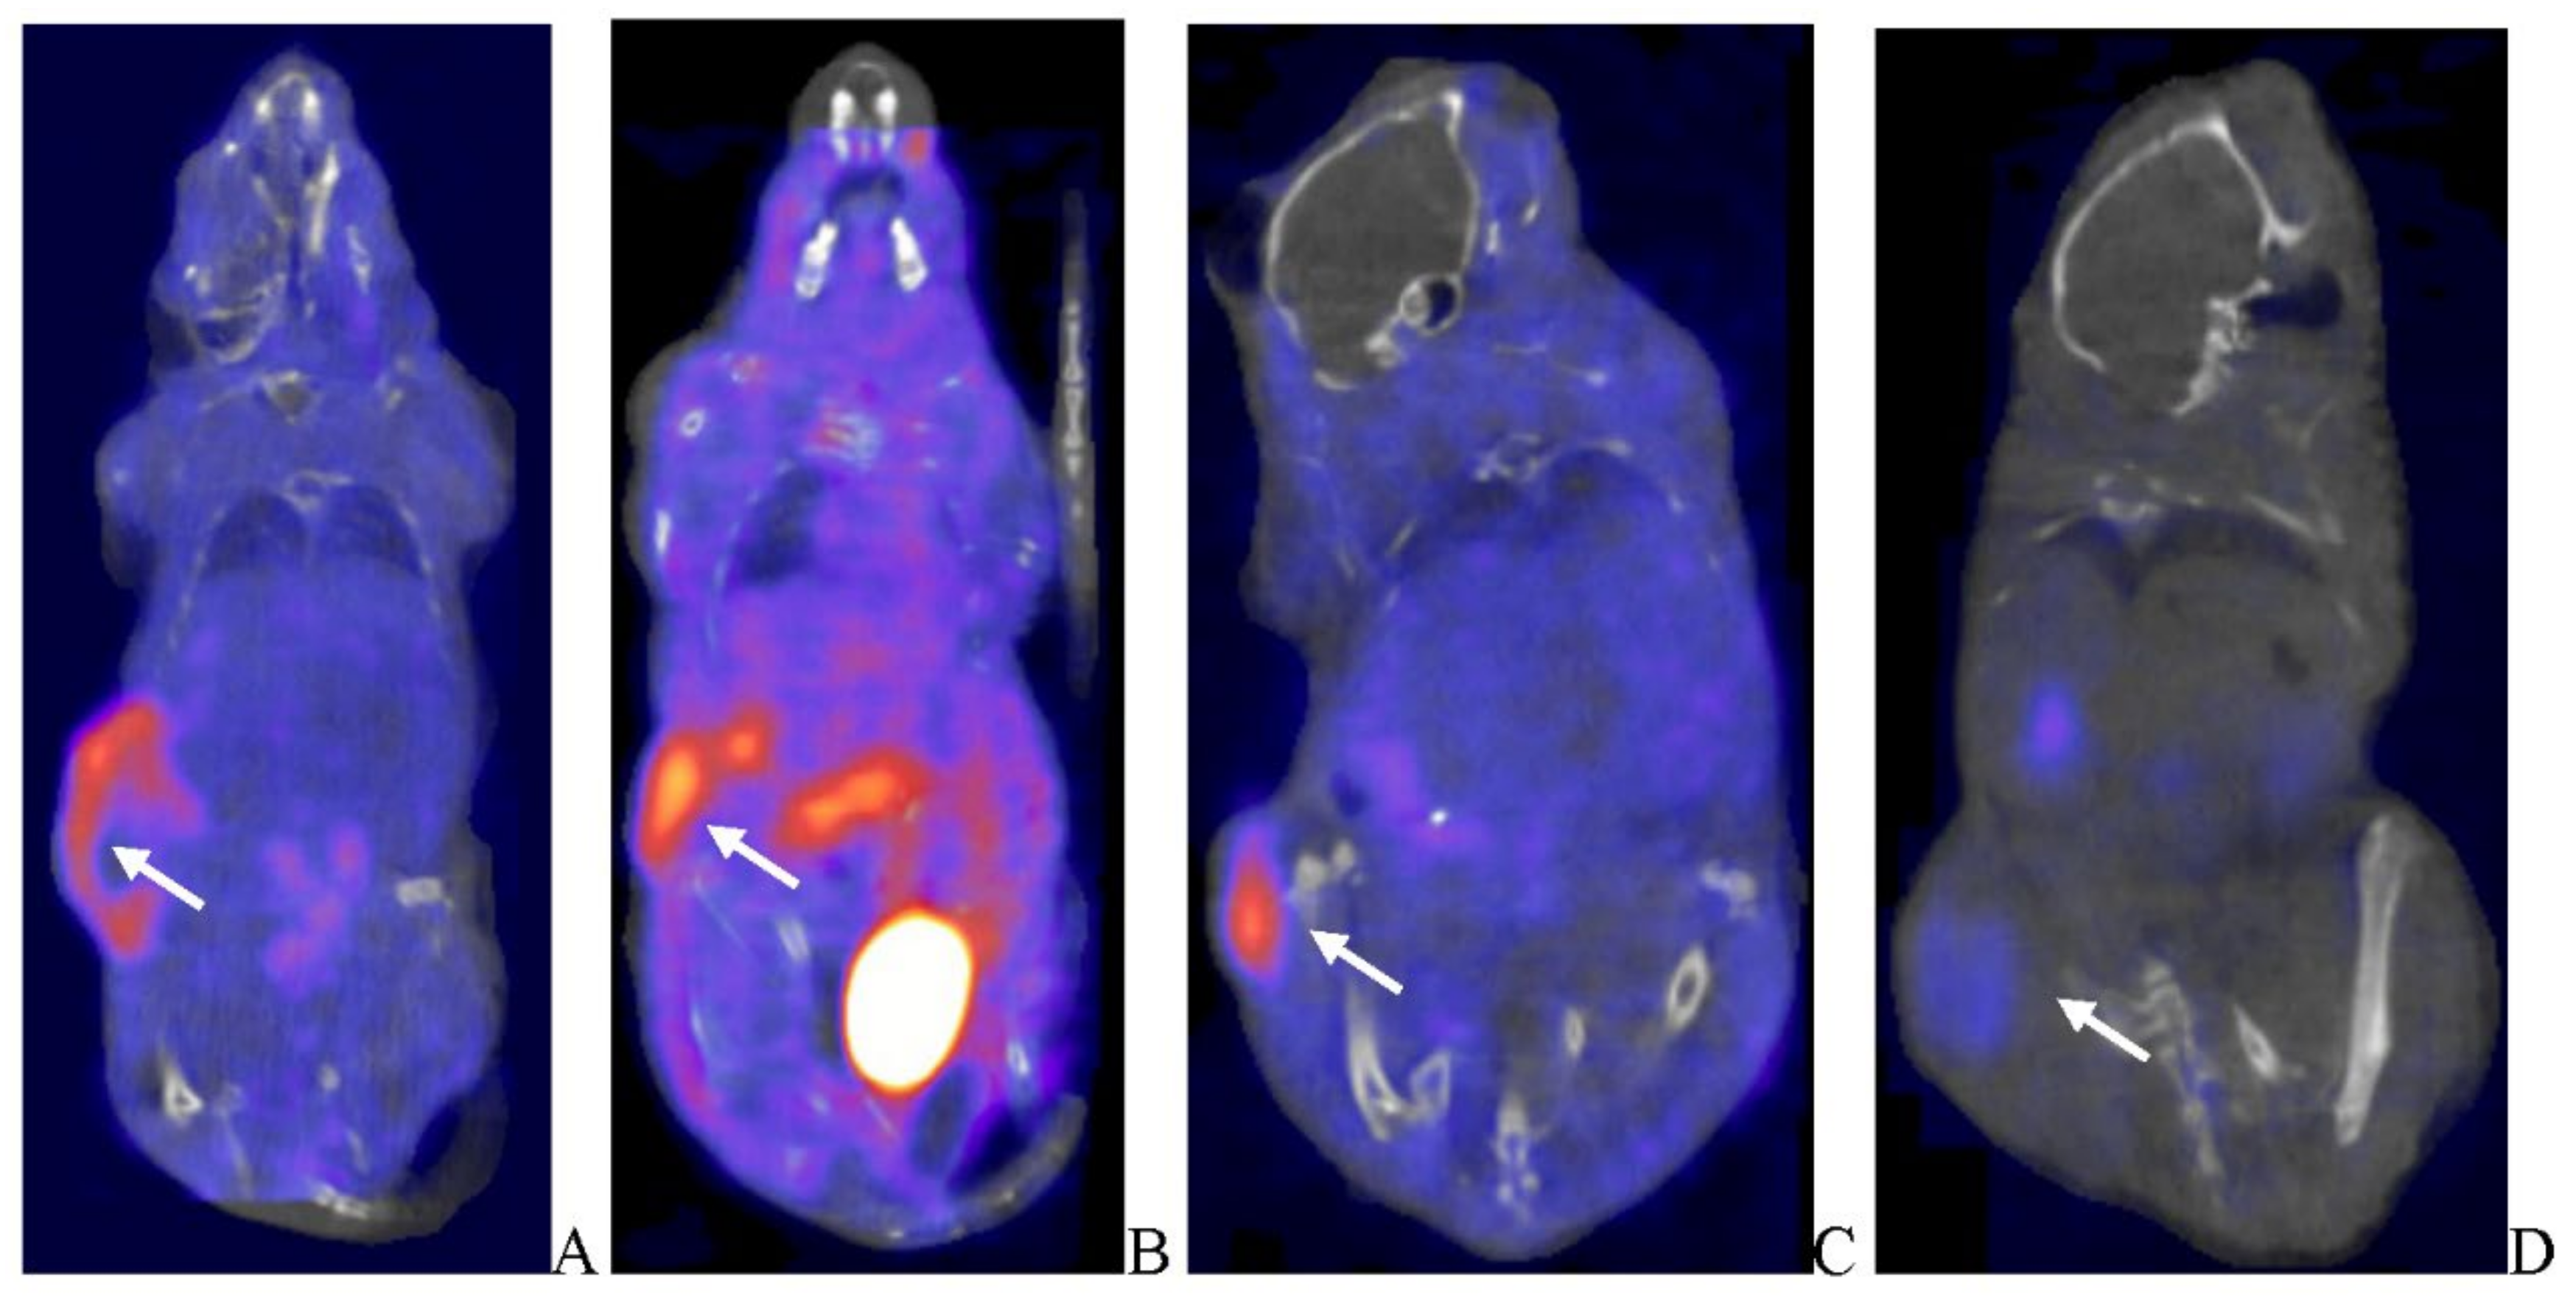
Figure 10.
Immunocompromised and Immune Reconstituted Group Mean Tumor Volume and [125I]-anti-eGFP or [125I]-anti-mCherry Antibody SPECT/CT Percent Injected Dose per Gram Tissue BxPc-3 human PDAC cells were inoculated subcutaneously (SC) in the right flank region of immunocompetent, female, BALB-c Nude Mice. Each subject received a single inoculation of 5 x 10⁶ cells / subject. Each subject was treated with a single, intratumoral administration of 100 µL PBS formulation vehicle or 100X virus stock of each applicable recombinant virus to result in a virus mass dose of 5 x 10⁶ plaque forming units (pfu) per animal when tumors reached approximately 200 mm3. SPECT/CT images were acquired during Week 7–8, 48-h post imaging agent administration (200 µCi/subject). Bars show standard error of the mean (±1 SEM). Immunocompromised (A) and immune reconstituted (B), intergroup statistical comparisons resulted in lack of statistical significance for all comparisons and do not demonstrate tumor-volume dependency.
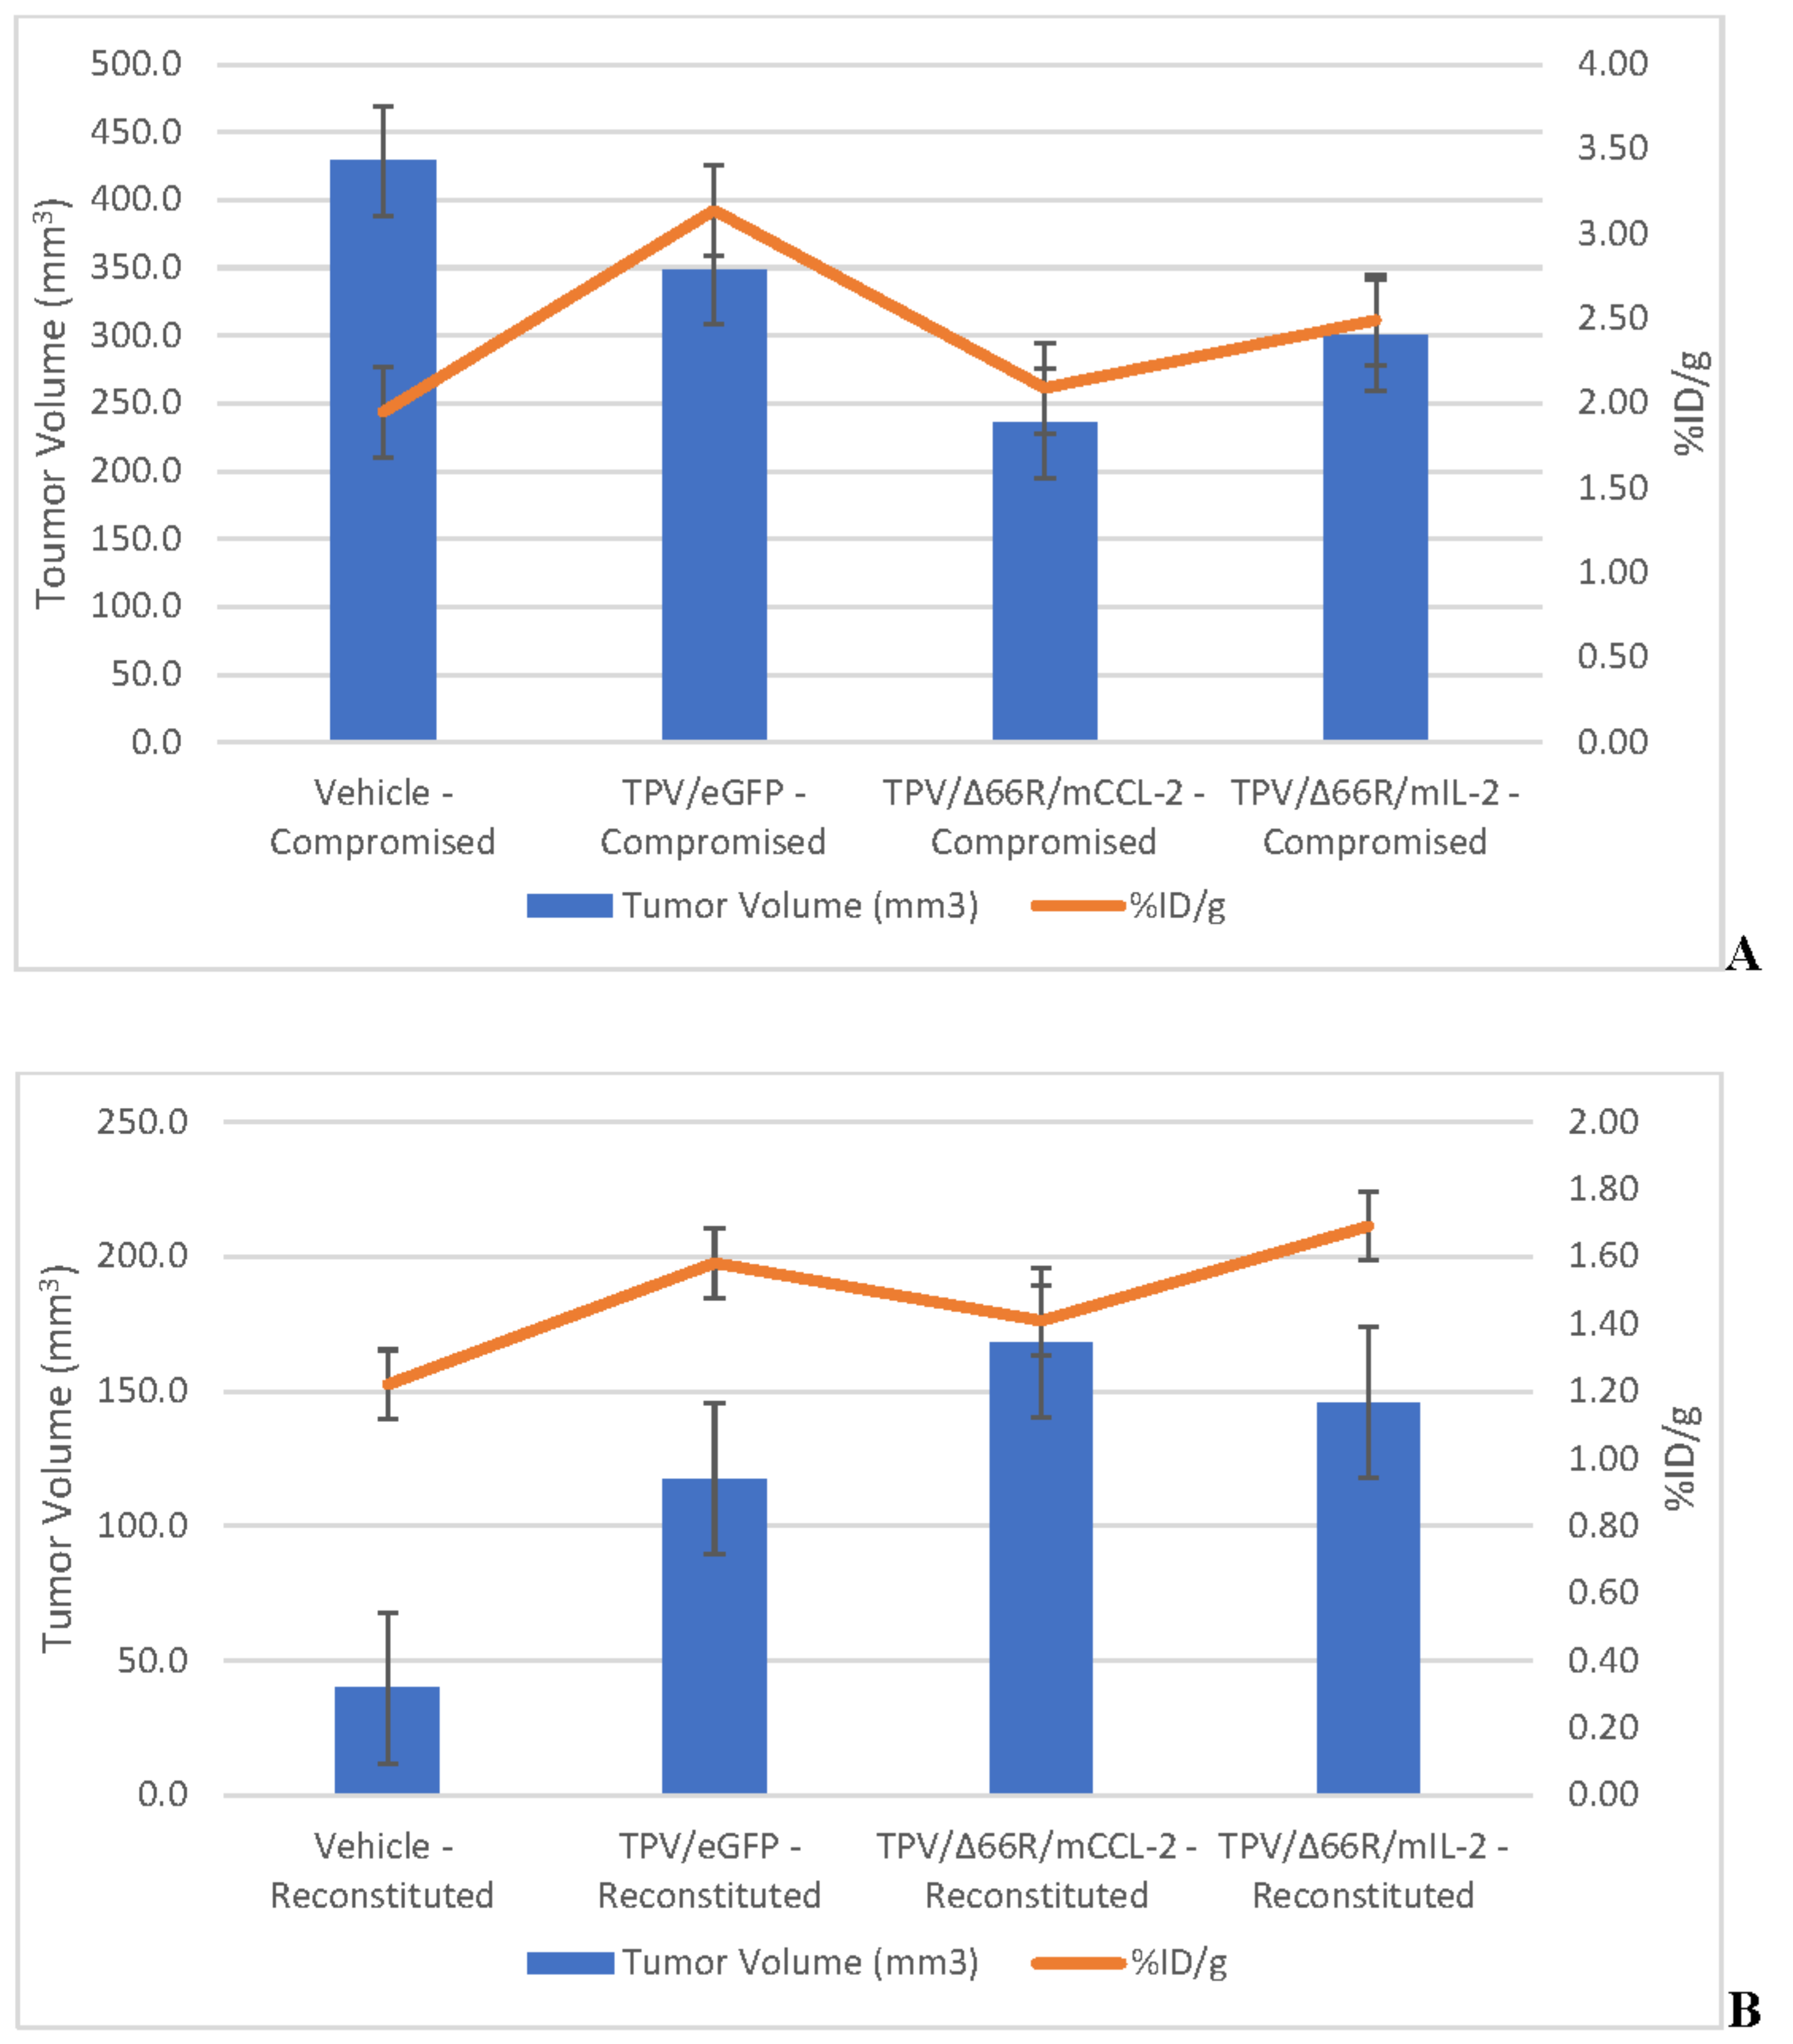
Figure 11.
[125I]-anti-eGFP or [125I]-anti-mCherry Antibody SPECT/CT Images of BxPc-3 PDAC Human Tumor Xenografts in Immunocompromised and Immune Reconstituted BALB-c Nude Mice BxPc-3 human PDAC cells (5 x 10⁶ cells / subject) were inoculated subcutaneously (SC) in the right flank region of immunocompetent, female, BALB-c Nude Mice. Each subject was treated with a single, intratumoral administration of 100 µL PBS formulation vehicle or 100X virus stock of each applicable recombinant virus to result in a virus mass dose of 5 x 10⁶ plaque forming units (pfu) per animal when tumors reached approximately 200 mm3. SPECT/CT images were acquired during Week 7–8, 48-h post imaging agent administration (200 µCi/subject). Select, representative SPECT/CT images as follows: immunocompromised vehicle control (A), immune reconstituted vehicle control (B), TPV/eGFP immunocompromised (C) and TPV/eGFP immune reconstituted; white arrows indicate tumor location.
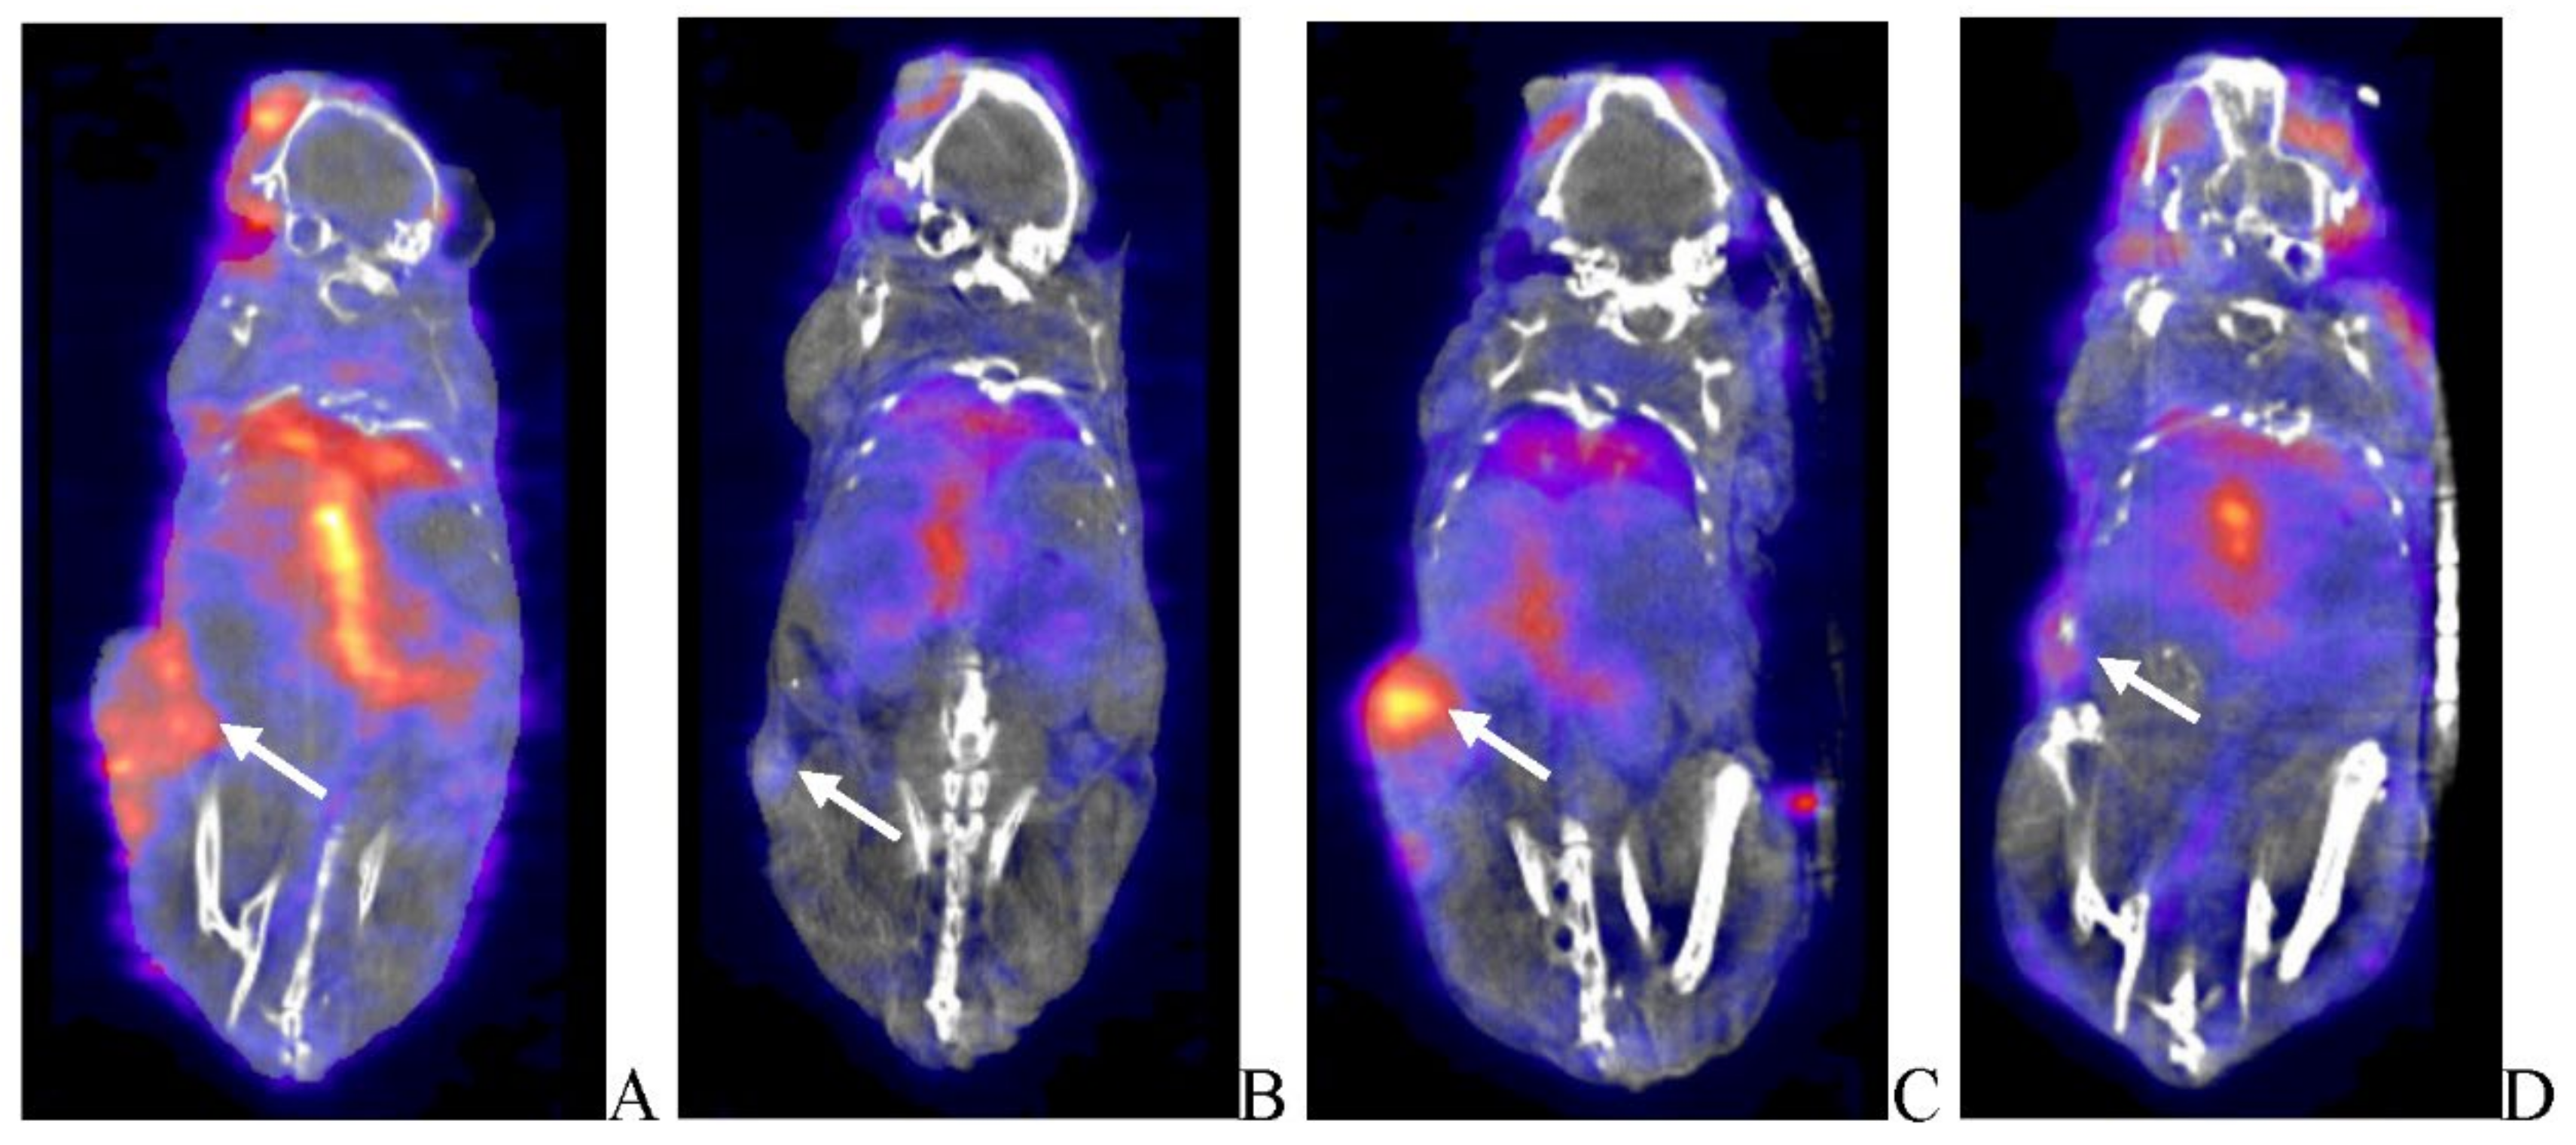
Figure 13.
[125I]-anti-eGFP or [125I]-anti-mCherry Antibody Quantitative Whole Body Autoradiography Images of BxPc-3 PDAC Human Tumor Xenografts in Immunocompromised and Immune Reconstituted BALB-c Nude Mice BxPc-3 human PDAC cells (5 x 10⁶ cells / subject) were inoculated subcutaneously (SC) in the right flank region of immunocompromised or immune reconstituted, female, BALB-c Nude Mice. Each subject was treated with a single, intratumoral administration of 100 µL PBS formulation vehicle or 100X virus stock of each applicable recombinant virus to result in a virus mass dose of 5 x 10⁶ plaque forming units (pfu) per animal when tumors reached approximately 200 mm3. Autoradioluminograms were generated from subjects processed for whole-body autoradiography immediately following completion of SEPCT/CT during Weeks 7–8, at 48-h post imaging agent administration (200 µCi/subject). Select, representative QWBA images as follows: immunocompromised vehicle control (A), immune reconstituted vehicle control (B), TPV/eGFP immunocompromised (C) and TPV/eGFP immune reconstituted; black arrows indicate tumor location.

Figure 14.
Histopathology and Immunohistochemistry Photomicrographs Images of BxPc-3 PDAC Human Tumor Xenografts in Immunocompromised and Immune Reconstituted BALB-c Nude Mice Select, representative photomicrographs images as follows: (A) H&E stained, immunocompromised vehicle control with healthy adenocarcinoma; (B) H&E stained, immune reconstituted vehicle control adenocarcinoma with areas of necrosis and inflammatory cell infiltrates (black arrow); (C) H&E stained, immunocompromised, TPV/eGFP adenocarcinoma with areas of necrosis and inflammatory cell infiltrates (black arrow); (D) H&E stained, immunocompromised, TPV/∆66R/mIL-2 adenocarcinoma with areas of necrosis and inflammatory cell infiltrates (black arrow); (E) H&E stained, immunocompromised, TPV/∆66R/mCCL-2 adenocarcinoma with areas of necrosis and inflammatory cell infiltrates (black arrow); (F) caspase stained, immunocompromised, TPV/∆66R/mCCL-2 adenocarcinoma with areas of positive staining (black arrow); (G) CD-3 stained, immunocompromised, TPV/∆66R/mCCL-2 adenocarcinoma with areas of positive staining (black arrow); (H) CD-4 stained, immunocompromised, TPV/∆66R/mIL-2 adenocarcinoma with areas of positive staining (black arrow);(I) CD-68 stained, immunocompromised, TPV/∆66R/mCCL-2 adenocarcinoma with areas of positive staining (black arrow); (J) GFP stained, immunocompromised, TPV/eGFP adenocarcinoma with areas of positive staining demonstrating viral replication and transgene expression (black arrow); (K) mCherry stained, immunocompromised, TPV/∆66R/mCCL-2 adenocarcinoma with areas of positive staining demonstrating viral replication and transgene expression (black arrow); and (L) mCherry stained, immunocompromised, TPV/∆66R/mIL-2 adenocarcinoma with areas of positive staining demonstrating viral replication and transgene expression. All bars = 200 µm, except for image E bar = 400 µm.
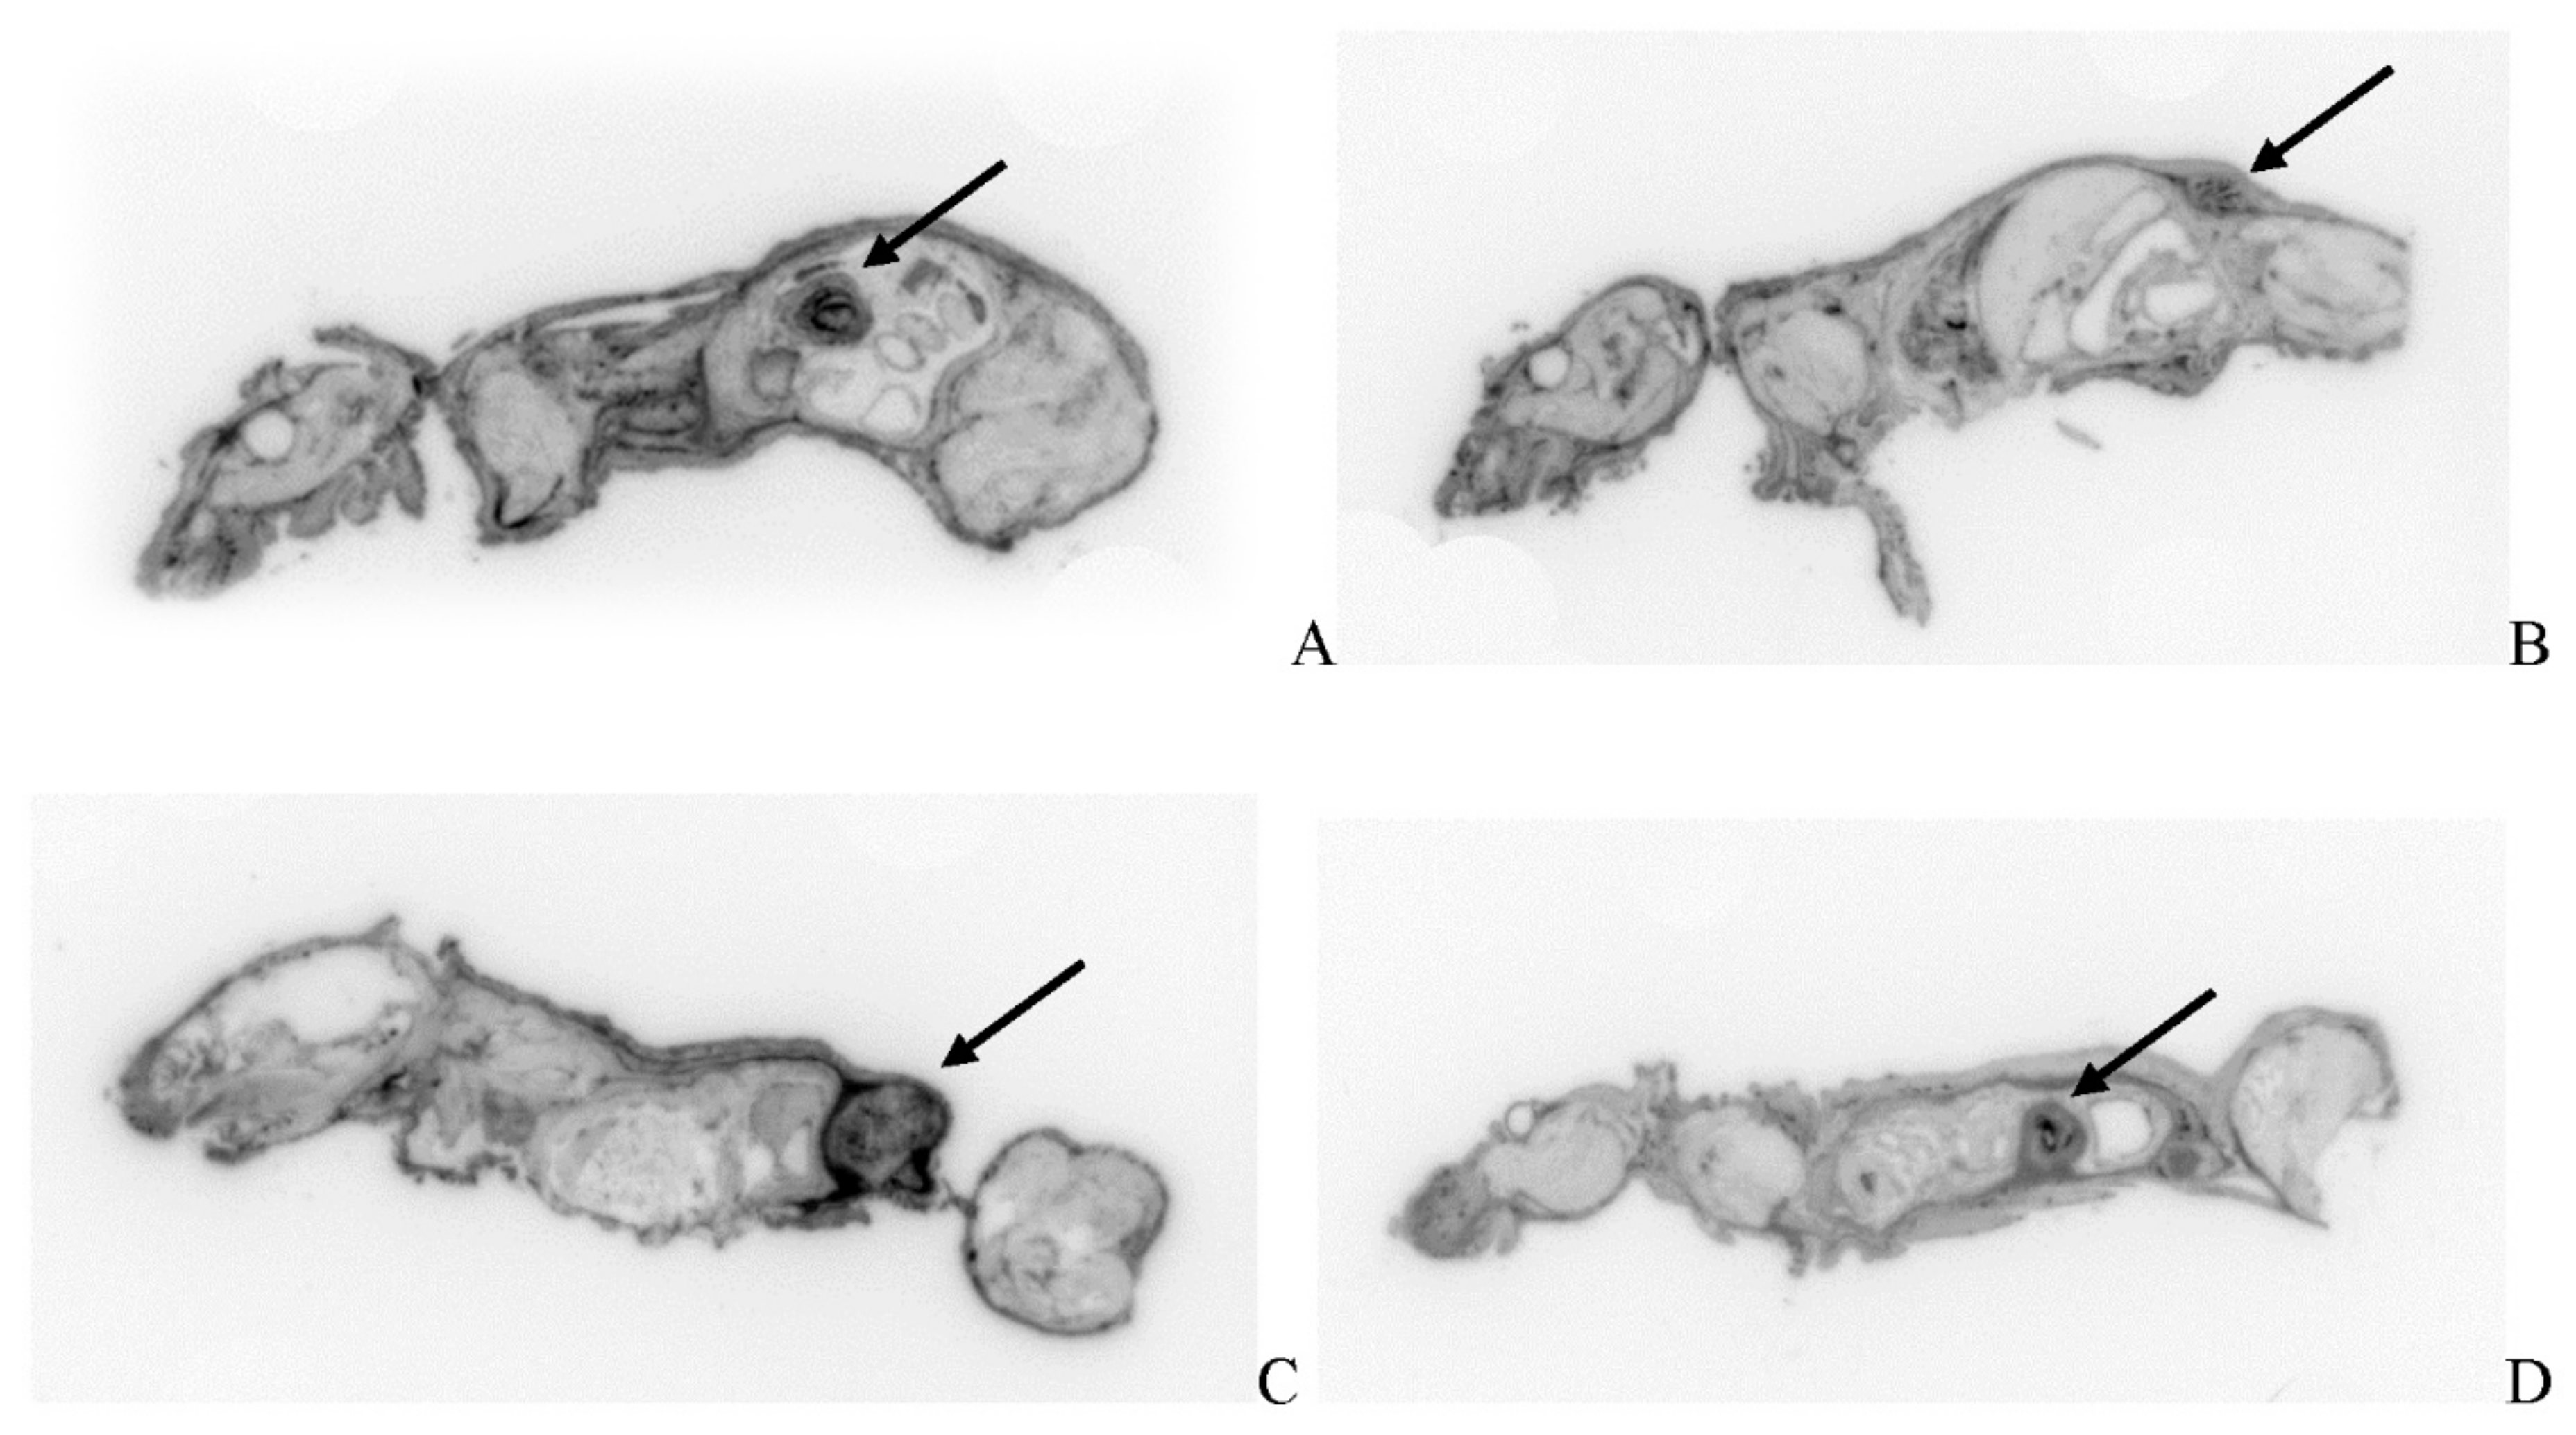
Figure 15.
Key Study Events Human pancreatic cancer cell (BxPc-3) growth curve in immunocompromised BALB-c (CAnN.Cg-Foxn1nu/Crl) nude mice treated with phosphate buffered saline (PBS), 100 µL, via intratumoral administration. Graph demonstrates temporal relationship of key study activities through the in-life phase of each applicable study cohort; for those study cohorts receiving virotherapy, each applicable TPV recombinant was administered at the time of the vehicle treatment displayed here for the control group. Measurements were performed every three days post tumor cell inoculation. Key: 1′P/CT = primary PET/CT acquisition; ITA = intratumoral treatment administration (vehicle or TPV recombinant); AT = adoptive T-cell transfer when applicable; 2′P/CT = secondary PET/CT acquisition; SIA = SPECT imaging agent administration; S/CT = SPECT/CT acquisition; T = termination of in-life phase.
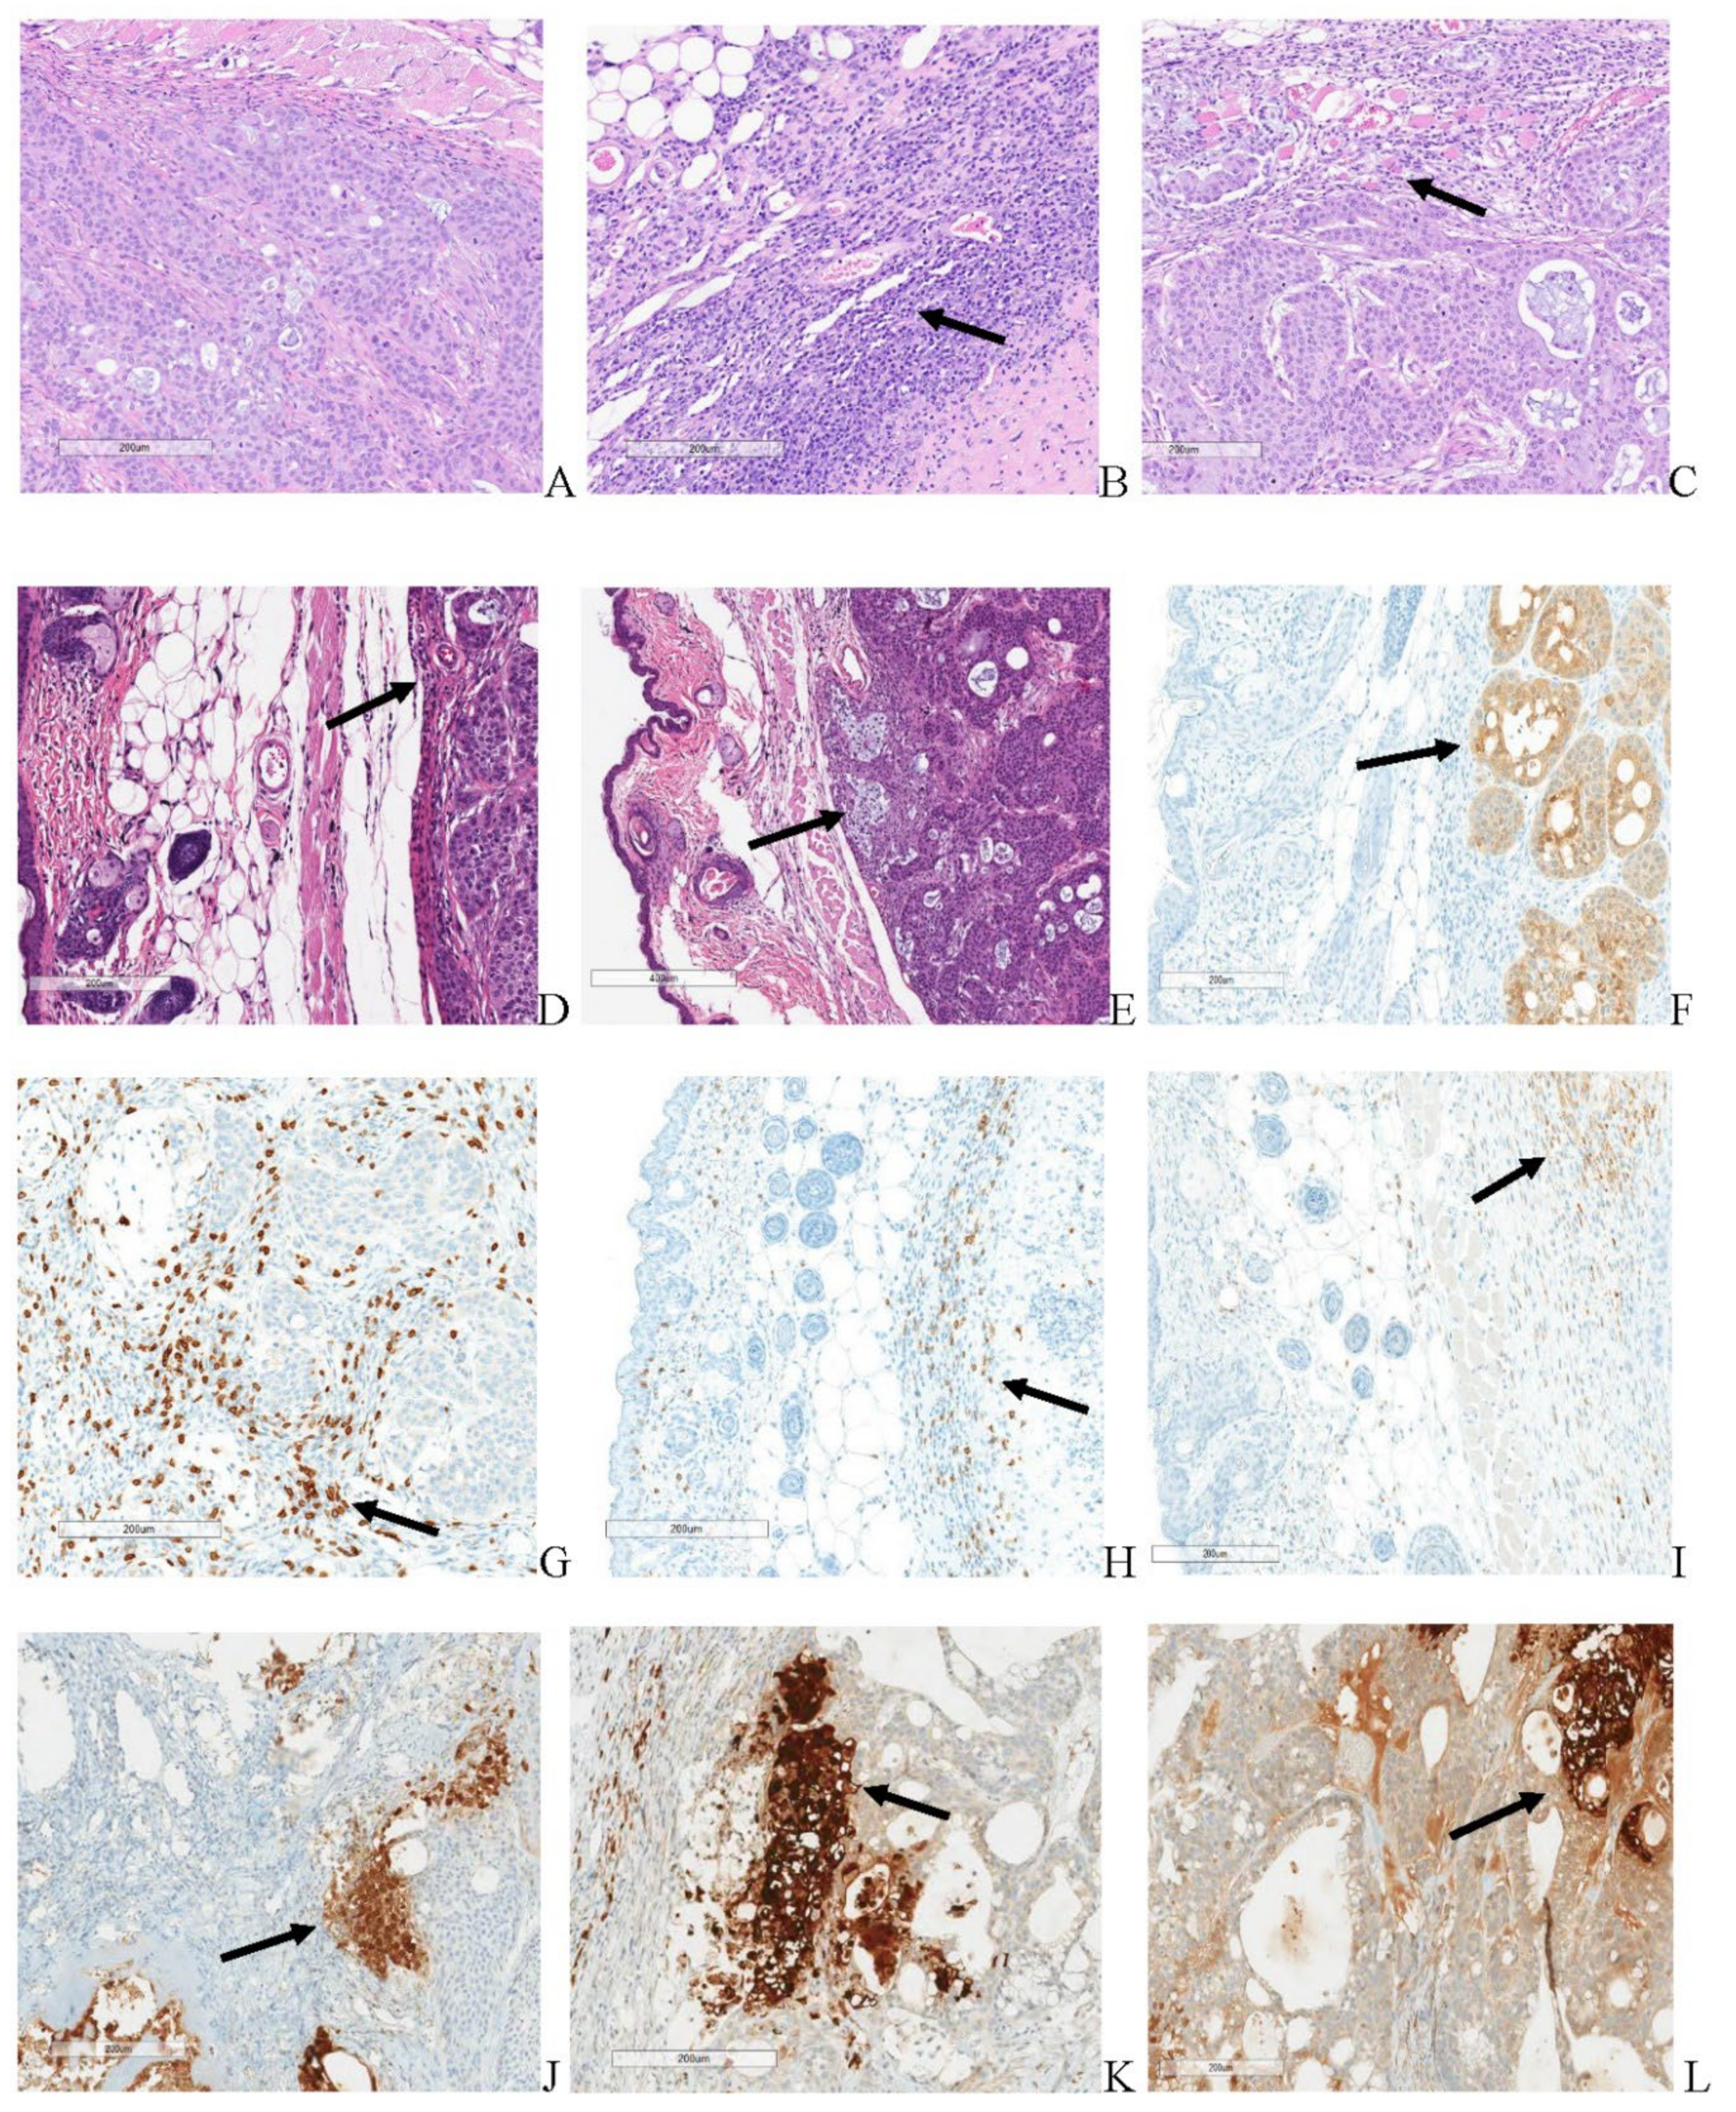

Table 1.
[18F]-FDG PET/CT Tumor Region Metabolic Activity Post-virotherapy Assessment Summary.
| Immune System Status | Oncolytic Virotherapy | Mean Tumor Volume (mm3) | SUV | TLG |
|---|---|---|---|---|
| Immunocompromised | NA–Control | 428.62 | 0.165 | 0.048 |
| Immunocompromised | TPV/eGFP | 348.68 | 0.227 | 0.041 |
| Immunocompromised | TPV/∆66R/m-IL-2/mCherry | 300.44 | 0.281 | 0.029 |
| Immunocompromised | TPV/∆66R/m-CCL-2/mCherry | 235.50 | 0.241 | 0.045 |
| Immune Reconstituted | NA–Control | 39.99 | 0.328 | 0.195 |
| Immune Reconstituted | TPV/eGFP | 117.62 | 0.231 | 0.033 |
| Immune Reconstituted | TPV/∆66R/m-IL-2/mCherry | 145.87 | 0.333 | 0.033 |
| Immune Reconstituted | TPV/∆66R/m-CCL-2/mCherry | 168.06 | 0.258 | 0.035 |
Table 2.
[18F]-FLT PET/CT Tumor Region Proliferation Activity Post-virotherapy Assessment Summary.
| Immune System Status | Oncolytic Virotherapy | Mean Tumor Volume (mm3) | SUV | TLP |
|---|---|---|---|---|
| Immunocompromised | NA–Control | 428.62 | 0.959 | 0.404 |
| Immunocompromised | TPV/eGFP | 348.68 | 1.14 | 0.237 |
| Immunocompromised | TPV/∆66R/m-IL-2/mCherry | 300.44 | 1.16 | 0.139 |
| Immunocompromised | TPV/∆66R/m-CCL-2/mCherry | 235.50 | 0.843 | 0.151 |
| Immune Reconstituted | NA–Control | 39.99 | 0.404 | 0.017 |
| Immune Reconstituted | TPV/eGFP | 117.62 | 0.465 | 0.745 |
| Immune Reconstituted | TPV/∆66R/m-IL-2/mCherry | 145.87 | 0.454 | 0.051 |
| Immune Reconstituted | TPV/∆66R/m-CCL-2/mCherry | 168.06 | 0.411 | 0.049 |
Table 3.
SPECT/CT Tumor Region TPV Transgene Expression Post-virotherapy Assessment Summary.
| Immune System Status | Oncolytic Virotherapy | Mean Tumor Volume (mm3) | Percent Injected Dose / Gram Tissue |
|---|---|---|---|
| Immunocompromised | NA–Control | 428.62 | 1.95 |
| Immunocompromised | TPV/eGFP | 348.68 | 3.14 |
| Immunocompromised | TPV/∆66R/m-IL-2/mCherry | 300.44 | 2.49 |
| Immunocompromised | TPV/∆66R/m-CCL-2/mCherry | 235.50 | 2.09 |
| Immune Reconstituted | NA–Control | 39.99 | 1.22 |
| Immune Reconstituted | TPV/eGFP | 117.62 | 1.58 |
| Immune Reconstituted | TPV/∆66R/m-IL-2/mCherry | 145.87 | 1.69 |
| Immune Reconstituted | TPV/∆66R/m-CCL-2/mCherry | 168.06 | 1.41 |
Table 4.
[125I]-anti-eGFP and [125I]-anti-mCherry Antibody QWBA Tumor Region TPV Transgene Expression Post-virotherapy Assessment Summary.
Table 4.
[125I]-anti-eGFP and [125I]-anti-mCherry Antibody QWBA Tumor Region TPV Transgene Expression Post-virotherapy Assessment Summary.
| Immune System Status | Oncolytic Virotherapy | Mean Tumor Volume (mm3) | Nanogram Antibody / Gram Myocardium | Nanogram Antibody / Gram Tumor |
|---|---|---|---|---|
| Immunocompromised | NA–Control | 428.62 | 110 | 441 |
| Immunocompromised | TPV/eGFP | 348.68 | 158 | 528 |
| Immunocompromised | TPV/∆66R/m-IL-2/mCherry | 300.44 | 38 | 156 |
| Immunocompromised | TPV/∆66R/m-CCL-2/mCherry | 235.50 | 36 | 138 |
| Immune Reconstituted | NA–Control | 39.99 | 88 | 325 |
| Immune Reconstituted | TPV/eGFP | 117.62 | 82 | 281 |
| Immune Reconstituted | TPV/∆66R/m-IL-2/mCherry | 145.87 | 50 | 149 |
| Immune Reconstituted | TPV/∆66R/m-CCL-2/mCherry | 168.06 | 48 | 81 |
Table 5.
Immunocompromised Vehicle, TPV/eGFP, TPV/∆66R/mCCL-2 and TPV/∆66R/mIL-2 Treatment Histopathological Summary.
Table 5.
Immunocompromised Vehicle, TPV/eGFP, TPV/∆66R/mCCL-2 and TPV/∆66R/mIL-2 Treatment Histopathological Summary.
| Treatment | Vehicle | TPV/eGFP | TPV/∆66R/mCCL-2 | TPV/∆66R/mIL-2 |
|---|---|---|---|---|
| No. animals per group | 6 | 6 | 6 | 6 |
|
Tumor transplant (Number Examined) |
(6) | (6) | (6) | (6) |
| Adenocarcinoma; malignant, primary | ||||
| Present | 6 | 6 | 6 | 6 |
| Caspase positive | ||||
| Moderate | - | - | 1 | - |
| Marked | 6 | 6 | 5 | 6 |
| CD3 positive | ||||
| Minimal | 2 | 2 | - | 2 |
| Mild | 4 | 4 | 1 | 3 |
| Moderate | - | - | 4 | 1 |
| Marked | - | - | 1 | - |
| CD4 positive | ||||
| Minimal | 4 | 5 | - | 5 |
| Mild | 2 | - | 4 | 1 |
| Moderate | - | - | 2 | - |
| CD68 positive | ||||
| Minimal | - | - | - | 1 |
| Mild | 4 | 5 | 1 | 4 |
| Moderate | 2 | 1 | 5 | 1 |
| CD8 positive | ||||
| Minimal | 2 | 3 | 1 | 1 |
Table 6.
Immune Reconstituted Vehicle, TPV/eGFP, TPV/∆66R/mCCL-2 and TPV/∆66R/mIL-2 Treatment Histopathological Summary.
Table 6.
Immune Reconstituted Vehicle, TPV/eGFP, TPV/∆66R/mCCL-2 and TPV/∆66R/mIL-2 Treatment Histopathological Summary.
| Treatment | Vehicle | TPV/eGFP | TPV/∆66R/mCCL-2 | TPV/∆66R/mIL-2 |
|---|---|---|---|---|
| No. animals per group | 6 | 6 | 6 | 6 |
|
Tumor transplant (Number Examined) |
(5) | (6) | (6) | (6) |
| Adenocarcinoma; malignant, primary | ||||
| Present | - | 2 | - | 1 |
| Caspase positive | ||||
| Minimal | 2 | 2 | - | - |
| Moderate | - | 1 | - | - |
| Marked | - | 1 | - | 1 |
| CD3 positive | ||||
| Mild | 1 | 1 | - | - |
| Moderate | 3 | 3 | 1 | 2 |
| Marked | 1 | 2 | 5 | 4 |
| CD4 positive | ||||
| Minimal | - | 1 | - | - |
| Mild | - | 2 | 1 | 4 |
| Moderate | 4 | 3 | 4 | 2 |
| Marked | 1 | - | 1 | - |
| CD68 positive | ||||
| Minimal | - | - | 1 | - |
| Mild | - | - | 1 | 1 |
| Moderate | - | 5 | 4 | 4 |
| Marked | 5 | 1 | - | - |
| CD8 positive | ||||
| Minimal | 1 | - | - | 1 |
Table 7.
Study Design Summary.
| Group | Animal Number | Immune System Status | Treatment Condition | BxPc-3 Mass Dose / Animal | PET/CT Imaging Agent | SPECT/CT Imaging Agent | Primary Endpoints |
|---|---|---|---|---|---|---|---|
| 1 | 18 | D | NA | 5 x 10⁶ cells | NA | Tumor Volume | |
| 2 | 9 | D | Vehicle | [18F]-FDG & [18F]-FLT | [125I] α-GFP | Tumor Volume, PET, SPECT, QWBA and Histology | |
| 3 | 9 | C | Vehicle | [18F]-FDG & [18F]-FLT | [125I] α-GFP | ||
| 4 | 9 | D | TPV/eGFP | [18F]-FDG & [18F]-FLT | [125I] α-GFP | ||
| 5 | 9 | C | TPV/eGFP | [18F]-FDG & [18F]-FLT | [125I] α-GFP | ||
| 6 | 9 | D | TPV/∆66R/mCCL-2 | [18F]-FDG & [18F]-FLT | [125I] α-mCherry | ||
| 7 | 9 | C | TPV/∆66R/mCCL-2 | [18F]-FDG & [18F]-FLT | [125I] α-mCherry | ||
| 8 | 9 | D | TPV/∆66R/mIL-2 | [18F]-FDG & [18F]-FLT | [125I] α-mCherry | ||
| 9 | 9 | C | TPV/∆66R/mIL-2 | [18F]-FDG & [18F]-FLT | [125I] α-mCherry | ||
NOTE: Group 1 animals received BxPc-3 cell inoculation only; these subjects were assessed via in-life observations and direct tumor measurements for a minimum of 28 days following inoculation to establish cell/tumor growth rate. Animals in Groups 2–9 were split into two cohorts of n = 4–5 subjects to be imaged via PET Imaging with either [18F] FDG or [18F] FLT prior to and following virotherapy at approximately 21- and 60-days respectively. SPECT/CT imaging was conducted on n=3 study subjects assigned to Groups 2-9 at approximately 63-days post virotherapy. QWBA imaging was conducted on the cohort of n=3 study subjects from Groups 2-9 selected for SPECT/CT imaging following completion SPECT/CT imaging. Key: µCi–microcurie; D- immunodeficient; C- immune reconstituted; PET–Positron Emission Tomography; CT–Computed Tomography; SPECT–Single Photon Emission Tomography; [125I] α—iodine 125 radiolabeled antibody targeting either eGFP or mCherry; [18F]-FDG–[18F]-fluorodeoxyglucose; and [18F]-FLT–[18F]-fluoro-3′-deoxy-3′-L:flouorothymidine.
Disclaimer/Publisher’s Note: The statements, opinions and data contained in all publications are solely those of the individual author(s) and contributor(s) and not of MDPI and/or the editor(s). MDPI and/or the editor(s) disclaim responsibility for any injury to people or property resulting from any ideas, methods, instructions or products referred to in the content. |
© 2024 by the authors. Licensee MDPI, Basel, Switzerland. This article is an open access article distributed under the terms and conditions of the Creative Commons Attribution (CC BY) license (http://creativecommons.org/licenses/by/4.0/).
Copyright: This open access article is published under a Creative Commons CC BY 4.0 license, which permit the free download, distribution, and reuse, provided that the author and preprint are cited in any reuse.


