Submitted:
07 May 2024
Posted:
08 May 2024
You are already at the latest version
Abstract
The precise regulation of hinge moment and pitch angle driven by the pitch regulated mechanism is crucial for modulating thrust requirements and ensuring stable attitude control in Martian coaxial rotorcraft. Nonetheless, the aerodynamic hinge moment in rotorcraft presents time-dependent dynamic properties, posing significant challenges for accurate measurement and assessment for such characteristics. In this study, we delve into the detailed aerodynamic hinge moment characteristics associated with the pitch regulated mechanism of Mars rotorcraft under a spectrum of control strategies. A robust computational fluid dynamics model has been developed to simulate rotor’s aerodynamic loads, accompanied by a quantitative hinge moment characterization that takes into account the effects of varying rotor speeds and pitch angles. Our investigation has yielded a thorough understanding of the interplay between aerodynamic load behavior and rotor surface pressure distributions, leading to the creation of an empirical mapping model for hinge moments. To validate our findings, we engineered a specialized test apparatus capable of measuring the hinge moments of the pitch regulated mechanism, facilitating empirical assessments under replicated atmospheric conditions of both Earth and Mars. The result indicates aerodynamic hinge moments depend non-linearly on rotational speed, peaking at a 0° pitch angle and showing minimal sensitivity to pitch under 0°. Above 0°, hinge moments decrease, reaching a minimum at 15° before rising again. Simulation and experimental comparisons demonstrate that under Earth conditions, the aerodynamic performance and hinge moment errors are within 8.54% and 24.90%, respectively. For Mars conditions, errors remain below 11.62%, proving the CFD model’s reliability. This supports its application in the design and optimization of Mars rotorcraft systems, enhancing their flight control through accurate prediction of aerodynamic hinge moments across various pitch angles and speeds.
Keywords:
aerodynamic hinge moment
; pitch angle
; pitch regulated mechanism
; blade pressure
; flow field characteristics
; Mars rotorcraft
1. Introduction
As a driving force for civilization development and social progress, deep space exploration has become the hottest scientific activity of the 21st century[1]. Mars, due to its highest similarity with Earth, has become the current hotspot of exploration and breakthrough point for deep space exploration technology [2]. The National Aeronautics and Space Administration (NASA) has set four scientific goals for Mars exploration [3]: (1) Determine whether there is life on Mars; (2) Understand the processes and history of Martian climate; (3) Understand the origin and evolution of Mars as a geological system; (4) Prepare for human exploration.
Currently, the types of Mars spacecraft being developed mainly include five categories: scientific balloons [4], fixed-wing aircraft [5,6], gliders [7], rotorcraft [8,9,10], and flapping-wing aircraft [11]. Compared with other types of spacecraft, rotorcraft have the characteristics of strong maneuverability, wide environmental adaptability, and vertical takeoff and landing capabilities [12,13]. Especially, coaxial counter-rotating rotorcraft with variable-pitch rotors are more suitable for Mars exploration due to their compact structure, good aerodynamic performance, and flight stability [14,15,16]. The variable-pitch mechanism, as the core component of the steering system, has the function of navigation, control, and guidance[17]. In the flight control of rotorcraft, adjusting the pitch angle by precisely controlling the hinge moment generated by the variable-pitch mechanism [18] is crucial for achieving attitude stability.
Therefore, the aerodynamic hinge moment is an important parameter in the design of variable-pitch mechanisms. It generates bending moments on the pull rods of the rotor variable-pitch mechanism and forms axial forces on the pull rods of the swashplate through the variable-pitch pull rods. This force acts on the swashplate, causing it to bear corresponding forces and moments. These forces are then transmitted to the fuselage and the respective variable-pitch mechanisms through components connected to the swashplate [19]. Aerodynamic hinge moments can often be obtained through methods such as wind tunnel tests and theoretical calculations [20,21,22,23]. However, due to the significant variability of aerodynamic hinge moments in rotorcraft, this increases the difficulty of measurement and research.
In terms of the aerodynamic hinge moment of the tail control mechanism of fixed-wing aircraft, relatively comprehensive research has been conducted. R. Rose et al. conducted wind tunnel experiments and actual flight tests on the aerodynamic hinge moments of the main wing and aileron of the Fairey Delta 2 aircraft, providing reference methods for wind tunnel tests of hinge moments [24]. Erin M. H. et al. proposed a conceptual aircraft hinge moment measurement system (CAHMMS) and validated it by integrating CAHMMS with the test wing for wind tunnel testing, providing a new approach for the systematic measurement of aerodynamic hinge moments [25]. M. Grismer et al. used Mach number, flap deflection angle, etc., as test variable conditions, obtained surface pressure of the wing and flap hinge moments through wind tunnel experiments, and studied the influencing factors of hinge moments [26,27]. Wu et al. conducted research on the calculation method of three-dimensional aileron hinge moments, using a staggered docking grid to numerically simulate the three-dimensional configuration flow field, verifying the reliability of numerical simulation methods for simulating complex flow fields and the effectiveness of aileron hinge moment calculation [28]. Huang Zongbo et al. studied the effect of rudder deflection angle on hinge moments, and the results showed that the hinge moments of the rudder increased with the increase of rudder deflection angle, but the range of rudder deflection angle in the text was relatively small, which did not explain some special conditions [29]. G.Q. Zhang et al. studied the effect of wing angle of attack on aileron hinge moments, and the results showed that under small clearances, hinge moments decreased gradually with the increase of angle of attack [30].
There is relatively less research on the hinge moments of rotorcraft. Unlike the aerodynamic hinge moments of fixed-wing aircraft, the influencing factors of rotorcraft aerodynamic hinge moments are no longer deflection angles and clearances, but rather rotor speed and pitch angle. Additionally, the testing of aerodynamic hinge moments is no longer limited to wind tunnel experiments.
Xia[19] studied the aerodynamic hinge moments of helicopters at different advance ratios and found that as the advance ratio increases, the amplitude of variation of the aerodynamic hinge moments gradually increases. The alternating aerodynamic hinge moments are transmitted to the fuselage through the pitch control rods, causing the helicopter to experience severe vibrations. Xu Guanfeng et al. [31] established a calculation model for the aerodynamic hinge moments of coaxial counter-rotating rotor helicopters and found that although the upper rotor interferes with the lower rotor aerodynamically, the hinge moments of the upper and lower rotors are essentially the same. During high-speed forward flight, they exert significant forces on the swashplate. Yuan et al. [32] conducted a computational analysis of the aerodynamic hinge moment characteristics of coaxial rigid rotor helicopters under different pitch axis schemes, showing that the aerodynamic hinge moments can be mitigated to some extent by properly positioning the variable torque axis.
Liu [33] designed a helicopter rotor aerodynamic hinge moment testing system, which achieved the collection and transmission of rotor aerodynamic hinge moments in a non-wind tunnel environment. Xue [34] et al. designed a helicopter rotor dynamic balance test stand, which simplified the load on the rotor pitch control rods. Through force analysis on the swashplate, they derived the control moments of the rotor system.
In summary, the aerodynamic hinge moment of the rotor is directly related to the advance ratio, rotational speed, and installation position of the variable torque axis of the aircraft. However, the current research on the characteristics of rotor aerodynamic hinge moments is still not sufficient. From the influencing factors of aerodynamic hinge moments in fixed-wing aircraft, it can be understood that in fixed-wing aircraft, rotor angle of attack and rudder deflection angle directly affect the aerodynamic hinge moment. However, the current research on the influence of pitch angle variation on rotor aerodynamic hinge moments is still insufficient.
This article focuses on the aerodynamic hinge moment of rotorcraft. Firstly, a robust computational fluid dynamics (CFD) model of rotor aerodynamic hinge moment was established. Numerical calculations were performed on the rotor systems under different rotor speeds and pitch angles. The aerodynamic hinge moment results were obtained for different ranges of rotor speeds and wide pitch angles, and the variation patterns of aerodynamic hinge moments with rotor speed and pitch angle were analyzed. Furthermore, the influence of rotor blade pressure and flow field distribution characteristics on the aerodynamic hinge moment properties was further studied, exploring the formation mechanism of aerodynamic hinge moments. Finally, aerodynamic hinge moment testing experiments were conducted to verify the effectiveness of the research content of this article.
2. Materials and Methods
The collective pitch mechanism of the rotor system, shown in Figure 1a, controls the blade pitch angle of the rotor through the swashplate and rotor control rods, thereby regulating the aerodynamics of the rotor [35].
As illustrated in Figure 1b, the rotor system consists of two rotor blades rotating clockwise in the plane of rotation. Consequently, the pitch angle changes sequentially, allowing for the approximate calculation of the cyclic pitch angle αs and total pitch angle of the rotor [36].
Calculated by Formula (1):
2.1. Numerical Method and Governing Equations
CFD (Computational Fluid Dynamics) is a simulation technique based on numerical computation used to simulate airflow and aerodynamic forces on the surface of rotors [37]. Common analysis methods include the two-dimensional momentum source method [38]], the rotating reference frame method [37], and the sliding mesh method [38,39]. The two-dimensional momentum source method is not suitable for studying the unsteady motion of rotor blades and complex aerodynamic effects. The sliding mesh method requires significant computational resources, including high CPU speed and large memory capacity. In contrast, the rotating reference frame method has the advantages of reducing the complexity of computational fluid dynamics equations and improving numerical stability. Therefore, this article adopts the rotating reference frame method for simulation analysis.
The rotating reference frame method divides the entire flow domain of the rotor into two regions: the stationary domain and the rotating domain. The stationary domain mainly includes grids for the background portion, while the rotating domain mainly includes grids for the rotor. The governing equations for the rotating reference frame method can be expressed as:
In the equation, represents the fluid density,represents the absolute velocity,represents the relative velocity, represents the velocity in the translating coordinate system, represents the velocity in the rotating coordinate system, represents the unit tensor, represents the relative specific internal energy, represents the relative total enthalpy, and represents the heat source.
The SST (Shear Stress Transport) model combines the advantages of the model in far-field calculations and the model in near-wall calculations, while also considering the transport of turbulent shear stress. It can accurately predict flow under adverse pressure gradients. Therefore, this study employs the SST model to simulate the flow field around the rotor. The SST model consists of the turbulent kinetic energy equation and the turbulent dissipation rate equation, which are formulated as follows:
Where represents turbulent kinetic energy, is the average velocity vector of the fluid, denotes the generation term of turbulent kinetic energy, stands for turbulent dissipation rate, represents dynamic viscosity, is turbulent viscosity, is the model constant for turbulent kinetic energy, is the model constant for turbulent dissipation rate, and is the dissipation model constant for turbulent dissipation rate.
2.2. Grid Partitioning and Irrelevance Analysis
In the paper, the clf5605 airfoil is used as the baseline airfoil [40]. According to the efficient rotor design approach, the chord length distribution and angle distribution of the designed blades are shown in Figure 2.
The final parameterization of the rotor blade and the three-dimensional shape of the rotor system are depicted in Figure 3.
The geometric configuration of the computational domain and its boundaries is illustrated in Figure 4.
The computational domain adopts a cylindrical shape, with a diameter and height 20 times that of the rotor radius, to minimize the influence of boundaries on the simulation results. The simulation model is divided into a rotating domain and a stationary domain. The rotating domain contains the rotor, which rotates as a whole around the axis of rotation. The rest constitutes the stationary domain, where the upper surface of the cylinder serves as the pressure inlet boundary, the lower surface as the pressure outlet boundary, and the cylindrical surface as the symmetry boundary. The rotor is set as a non-slip wall. The interaction surface between the stationary and rotating domains is set as an internal boundary. The environmental pressure is set to standard atmospheric pressure of 101325 Pa, and the temperature is set to 288 K. Additionally, the computational domain is discretized into grids. To obtain more accurate results, the grid is refined in the rotor region, as shown in Figure 5.
To reduce the influence of grid quantity on computational errors, grid independence analysis was conducted. The same method and model were used to perform numerical simulations under the conditions of 0° pitch angle and 1000 r/min rotation speed. Lift and torque of the rotor were extracted, and the results are presented in Table 1.
From Table 1, it can be observed that by setting the number of grid cells in the rotating domain to 5.93 million and varying the number of grid cells in the stationary domain, the maximum difference in lift simulation results does not exceed 3%, and the maximum difference in aerodynamic hinge moment simulation results does not exceed 2%. It can be considered that the calculation results are grid-independent. To save computational resources, the number of grid cells in the stationary domain is selected as 890,000 (with a size of 300mm). Setting the number of grid cells in the stationary domain to 890,000 and varying the number of grid cells in the rotating domain, when the number of grid cells in the rotating domain exceeds 1.995 million, the maximum difference in lift simulation results does not exceed 5%, and the maximum difference in aerodynamic hinge moment simulation results does not exceed 1%. It can be considered that the calculation results are grid-independent. Therefore, the number of grid cells in the rotating domain is chosen as 1.995 million (with a size of 5mm) for the numerical calculation of the rotor.
3. Results
The rotor, during operation, typically adjusts its pitch angle within the range of [-10°, 10°] [41]. To cover the operational pitch angle range of the rotor as comprehensively as possible, the current computational model has a rotor speed variation range of [200, 1000r/min], and a pitch angle range of [-15°, 27°], with calculations performed at intervals of every 3° of pitch angle.
3.1. Aerodynamic Characteristics Analysis
To initiate the comprehensive study of the rotor system, an analysis of the aerodynamic characteristics of the rotor is conducted, investigating the influence of pitch angle and rotational speed on the aerodynamic properties.
Based on the calculation formulas for the rotor's lift coefficient, torque coefficient , and lift-to-drag ratio [9], the results of the rotor's aerodynamic performance are depicted in Figure 6.
From Figure 6a, it can be observed that the lift coefficient of the rotor exhibits a nearly linear positive correlation with the pitch angle within the range of -15° to 15° at the same rotational speed. When the pitch angle exceeds 15°, the lift coefficient curve becomes approximately horizontal, indicating that further increases in the pitch angle have little effect on the lift coefficient. In contrast to the lift coefficient, as shown in Figure 6b, the variation of the drag coefficient with pitch angle follows an approximate quadratic function relationship. The minimum drag coefficient occurs when the pitch angle is between -3° ~ 0°. Analysis of the lift-to-drag ratio in Figure 6c reveals that the maximum lift-to-drag ratio of the rotor occurs at a pitch angle of 3°. Additionally, within the pitch angle range of (0°, 15°), the lift-to-drag ratio exceeds 7, making it suitable as a range for pitch angle adjustment. The influence of rotational speed on these three parameters is not significant.
3.2. Analysis of Aerodynamic Hinge Moment Characteristics
The calculation results of aerodynamic hinge moment for the rotor at different speeds and pitch angles are shown in Figure 7.
From Figure 7a,b, it can be observed that the relationship between the aerodynamic hinge moment and both the blade pitch angle and rotor speed is more complex compared to the relationship between lift and these parameters. In Figure 7a, it can be observed that when the rotor blade pitch angle is 0°, the aerodynamic hinge moment reaches its maximum value. As the pitch angle decreases towards the negative direction, the aerodynamic hinge moment exhibits a decreasing trend. However, when the pitch angle is less than -9°, further decrease in pitch angle no longer significantly affects the aerodynamic hinge moment. Analysis reveals that in the negative pitch angle region, as the rotor tilting phenomenon intensifies, the variation in the aerodynamic hinge moment becomes less pronounced. Within the range of 0° to 15° for the pitch angle, as the pitch angle increases , the aerodynamic hinge moment rapidly decreases. During this phase, the aerodynamic hinge moment is negatively correlated with the pitch angle, reaching its minimum value at a pitch angle of 15°. When the pitch angle exceeds 15°, the aerodynamic hinge moment gradually increases with further increase in the pitch angle, showing a positive correlation.
3.2. Quantitative Representation of Wing Profile Pressure
To further analyze the factors contributing to the formation of rotor aerodynamic hinge moments and explore the characteristics of these moments, a quantified representation model of the moments at the 0.75R spanwise section of the rotor is constructed. The wing profile section at 0.75R is shown in Figure 8.
As shown in Figure 8, the straight line along the axis represents the rotor axis. At a pitch angle of , the pressure exerted on the upper and lower surfaces of the rotor at the position of point on the wing profile is respectively and . The torque generated around the axis per unit area S can be expressed as:
Thus, the torque generated around the axis by the entire cross-section can be obtained as:
Where and represent the blade pressure at point i.
When selecting the pitch angles of -9°, -6°, -3°, 0°, 6°, 12°, 16°, 21°, and 27°, the blade pressure at the 0.75R section of the rotor blade is referenced. The pressure on the upper and lower surfaces of the rotor blade is plotted accordingly. The results are shown in Figure 9.
Analyzing the blade pressure plot of the rotor at a pitch angle of -9°, as shown in Figure 9. These regions, delineated by the line at x=0, points of intersection between the upper and lower surface pressure lines, and the zero-pressure line, can be divided into five parts: Aa, , , , and .(1) Part : The pressure on the upper surface of the rotor blade is greater than 0, indicating a pressure surface, while the pressure on the lower surface is less than 0, indicating a suction surface, this generates a torque around the OZ axis in a counterclockwise direction. (2) Parts and : Both upper and lower surface pressures are negative, indicating a state of suction, but the suction effect on the lower surface is greater than that on the upper surface, because they are located on the positive and negative halves of the x-axis, respectively, part generates a torque that causes the rotor to rotate counterclockwise around the OZ axis, while part also generates a counterclockwise torque around the OZ axis. (3) Part: Both upper and lower surfaces are suction surfaces, but the suction effect on the upper surface is greater than that on the lower surface, because they are located on the positive half of the x-axis, it generates a torque that causes the rotor to rotate counterclockwise around the OZ axis.(4) Part : The upper surface is a suction surface, while the lower surface is a pressure surface, resulting in a torque that causes the rotor to rotate counterclockwise around the OZ axis.
Performing pressure integration over the aforementioned five regions allows us to approximate the torque exerted on the rotor blade at the 0.75R position. Similarly, by analyzing the surface pressure distribution for other pitch angles, and combining them with the torque calculation formula, we can determine the aerodynamic hinge moment of the rotor blade at the 0.75R position for different pitch angles, as shown in Figure 10.
The moments obtained from the force analysis of the upper and lower surfaces of the rotor blade in Figure 10 are consistent with the aerodynamic hinge moments obtained from the aerodynamic simulation of the rotor in Figure 7. This indicates that using the quantitative characterization method to analyze the aerodynamic hinge moments of the rotor blade is feasible.
When comparing Figure 9 again, for the range of pitch angles from -9° to 0°, there is no significant change in the pressure distribution on the upper surface of the rotor blade. However, as the pitch angle transitions from -9° to 0°, the pressure curve on the lower surface of the rotor blade changes from an approximate straight line to a curve that gradually protrudes towards the upper left, leading to a phenomenon where the intersection point of pressures on the upper and lower surfaces gradually shifts towards the leading edge of the rotor blade. When the pitch angle is positive, especially when it exceeds 6° as shown in Figure 9, there is no significant change in the pressure distribution on the lower surface of the rotor blade, while the pressure curve on the upper surface undergoes significant changes in both shape and magnitude with variations in the pitch angle.
Based on the analysis, we found that the influence of rotor speed on the aerodynamic performance and aerodynamic hinge moment of the rotor is relatively straightforward, while the effect of the pitch angle on the aerodynamic performance and aerodynamic hinge moment of the rotor is more complex. To explain the variation mechanism of rotor blade surface pressure and aerodynamic hinge moment, we conducted a flow field analysis at the 0.75R section of the rotor blade for pitch angles of -9°, -6°, -3°, 0°, 6°, 12°, 15°, 21°, and 27°, with a rotor speed of 1000 r/min. We obtained rotor blade surface pressure contour maps and air velocity/vector field contour maps as shown in Figure 11 and Figure 12, respectively.
As shown in Figure 11, when the pitch angle of the rotor blade is negative, the rotor exhibits a nose-down phenomenon. During the rotation of the rotor, a stagnation point high-pressure area forms at the leading edge of the upper surface of the 0.75R airfoil section. At this time, the rotation of the rotor causes the airflow to move in the same direction as the rotation. As the pitch angle gradually changes from -9° to 0°, the area of the high-pressure region at the leading edge of the upper surface of the airfoil gradually decreases, but the pressure change is not significant. Regarding the airflow situation on the upper and lower surfaces of the 0.75R airfoil section, according to Figure 12, airflow separates at the mid-to-aft positions of the upper and lower surfaces of the airfoil section, forming a low-pressure area. The vortex on the upper surface gradually moves towards the leading edge of the rotor, which is related to changes in pitch angle and stagnation point position. Although the vortex at the leading edge of the lower surface of the airfoil section does not change significantly in position, its intensity gradually weakens, resulting in a significant change in the pressure distribution on the lower surface, especially the gradual reduction of the range of the low-pressure area. This phenomenon causes the pressure curve on the lower surface shown in Figure 9 to gradually protrude towards the upper right, and the intersection of pressures on the upper and lower surfaces of the airfoil gradually moves towards the leading edge of the rotor. The gas flow velocity at the trailing edge of the lower surface of the airfoil is relatively slow, forming a high-pressure area. With the weakening of the vortex at the leading edge of the lower surface of the airfoil, the high-pressure area tends to expand.
When the pitch angle is positive, the rotor exhibits a pitching-up phenomenon. When the pitch angle is 6°, as shown in Figure 12, the vortex located at the leading edge of the lower surface of the airfoil section disappears, forming a stagnation point high-pressure area. At the same time, the high-pressure region at the trailing edge of the lower surface further expands. When the pitch angle is 12°, the two high-pressure regions merge, forming a large high-pressure area over the entire lower surface, with the pressure extremum point located on the leading edge of the lower surface. Meanwhile, the low-pressure vortex on the upper surface gradually weakens and moves towards the leading edge of the airfoil section in a weakened state, reaching the leading edge of the airfoil section when the pitch angle reaches 12°. Subsequently, as the pitch angle increases, the vortex gradually strengthens, consistent with the variation trend of pressure distribution on the upper surface of the airfoil shown in Figure 11 when the pitch angle is positive.
4. Experiment and Discussion
This section mainly introduces the design and completion of a series of validation experiments using a test stand. The structure of the test stand is shown in Figure 13, which integrates tension sensors, speed sensors, and torque sensors. It can measure parameters such as motor speed, rotor torque, and Rotor lift. Relevant information can be obtained through data acquisition equipment and monitoring software.
The pitch angle is measured using a horizontal inclinometer, as shown in Figure 14. The measurement method involves using a Weite Intelligent Bluetooth sensor combined with a Dippsi digital pitch gauge. The sensor's measurement accuracy for the X and Y axes is 0.2°, and for the Z axis is 0.5°. To verify the installation of the test stand, the rotor pitch angle is taken as 0°. This means the rotor blades are positioned parallel to the plane of rotation. By doing so, any deviation from the intended setup can be identified and corrected, ensuring the accuracy and reliability of the test results. The rotor rotates around the Z-axis according to Figure 13, completing one full revolution. Every 30 degrees of rotation, the pitch angle is measured and recorded. The results are presented in Table 2.
In this scenario, the 0° pitch angle is chosen as the reference. When the rotor rotates about the Z-axis for one cycle, the measured values represent both the pitch angle readings and the deviation from the ideal values. Analyzing the pitch angles shown in Table 2, it can be observed that during the rotation of the rotor about the Z-axis, a maximum pitch angle of 0.10° occurred at a phase angle of -90.62°, and a minimum pitch angle of -0.09° occurred at a phase angle of 90.50°. This indicates that there is an error angle of approximately 0.10° during the installation of the test bench. However, considering that the error is less than the accuracy of the sensor, it can be considered that the test bench installation meets the requirements.
4.1. Aerodynamic Hinge Moment Test Principle
Currently, there are mainly two methods for testing the aerodynamic hinge moment of rotor blades. One is to install an aerodynamic hinge moment balance on the rotor blades,[42,43] and the other is to mount sensors on the rotor blade pitch links.[33]
The first method enables direct measurement of the rotor blade's aerodynamic hinge torque, with minimal influence from other factors and high accuracy. However, the measurement equipment requires a relatively large installation space, making it suitable for use on large and medium-sized equipment, while it's challenging to employ this measurement method on small aircraft. The second method involves mounting force sensors on the pitch links of the rotor blades. By multiplying the measured tensile or compressive force on the pitch link by the corresponding lever arm length, the aerodynamic hinge torque can be obtained. The advantage of this method is its simplicity in structure and minimal installation space required. However, measuring the aerodynamic hinge torque in this manner involves the transmission of forces through the pitch link structure, introducing some associated errors.
Both methods can measure the aerodynamic hinge torque of rotor blades. However, for small-scale rotorcraft, the rotor itself needs to rotate at a certain speed. Using either of the two methods mentioned, the sensors would rotate with the rotor, potentially leading to significant measurement errors. Additionally, integrating the sensors into the data acquisition system might be challenging. Therefore, neither of these methods is suitable for testing the aerodynamic hinge torque of small helicopters. The torque testing method employed in this paper is an improvement based on the second method, as illustrated in Figure 15.
The aerodynamic hinge moment is transmitted through the blade clamp and the blade clamp pull rod in the form of tension or compression to the Swashplate moving plate, which is then transmitted to the Swashplate fixed plate, and ultimately transferred to the sensor through the operating lever. Because the fixed plate of the Swashplate is stationary relative to the main shaft, while the moving plate of the Swashplate can follow the rotation of the rotor, the force measured by the sensor is the quantity converted by the connecting rod and the Swashplate. Neglecting friction, the relationship between and torque can be expressed as:
Although this testing method may introduce errors during the force transmission process, it eliminates the influence caused by the rotation of the sensor, thereby reducing the complexity of the test. Furthermore, compared to directly measuring the pneumatic hinge torque, testing the force on the operating lever is more practically meaningful. It can provide valuable reference and recommendations for the design of aircraft control systems and the selection of servos.
4.2. Earth/Mars Environment Test Comparison
4.2.1. Earth Environment Test Testing
According to the previous analysis, rotor pitch angles of -3°, 0°, 6°, and 15° are set for lift and moment testing. The rotor speed is set to [0, 1000 r/min]. The experimental data and simulation results obtained are compared and analyzed, as shown in Figure 16.
Based on the comparison between experimental and simulation results, it can be seen that the numerical calculation results of lift are highly consistent with the experimental results, with a maximum error of 7.21% in torque and 8.54% in lift. By comparing experimental data with simulation results, we can conclude that the calculated results are well matched with the experimental data, thus validating the correctness of the numerical calculation model.
4.2.2. Simulated Martian Environment Test Testing
The comparison of environmental conditions between Mars and Earth is shown in Table 3.
Based on Table 3, it is evident that the Martian atmospheric environment is more hostile compared to Earth's, and currently, there is no way to replicate Martian conditions on Earth. Most research institutions typically use vacuum chambers for Mars environment simulation tests [44,45,46] to conduct relevant research. The experiment in this study chose to use a vacuum chamber from the China Academy of Space Technology (CAST), China Aerospace Science and Technology Corporation (CASC), for the Mars environment simulation test of rotorcraft aerodynamic performance. The vacuum chamber and rotorcraft aerodynamic testing are shown in Figure 17.
We conducted lift and torque tests on the rotor in a vacuum environment to verify the reliability of the proposed CFD computational model under simulated Martian conditions. The pitch angles were set to 6° and 12°. Lift generated at low rotor speeds was insignificant and lacked practical relevance. Given that the speed of sound on Mars is approximately 240m/s, with reference to not exceeding 0.8 times the speed of sound, the range of rotor speeds was set between 1600r/min and 3000r/min. The experimental results were then compared with the CFD computational results, as shown in Figure 18.
According to Figure 18, as compared to experimental results, the lift error obtained from CFD simulations is less than 11.62%, and the torque error is less than 8.49%. This indicates that the CFD simulation method used in this study is not only applicable to atmospheric environments but also remains effective under simulated Martian atmospheric conditions.
4.3. Aerodynamic Hinge Moment Testing Analysis
In the experiment, it was observed that when the rotor speed exceeded 1000r/min, there were significant fluctuations in the pressure sensor data collected by the data acquisition equipment. To ensure the accuracy of the collected data, only the aerodynamic hinge moment of the rotor at speeds ranging from 200r/min to 600r/min was analyzed.
By experimentally measuring the tensile and compressive forces on the Swashplate control rod, the aerodynamic hinge moment of the rotor about the hinge axis was numerically computed. Following the calculation process shown in Figure 19, a joint simulation was conducted between FLUENT numerical simulation and multibody dynamics computation. The aerodynamic hinge moment calculated by CFD was applied to the multibody dynamics model to obtain the tensile and compressive forces on the control rod.
The numerical values of partial aerodynamic hinge moment calculated by CFD are shown in Table 4:
The sensor test data obtained through the experimental method as per the procedure outlined in Figure 14, and the tensile and compressive forces calculated through the coupled simulation method illustrated in Figure 19, both represent the aerodynamic hinge moment transmitted as rod forces to the pitch regulated mechanism. A comparison between the tensile and compressive force results obtained from the coupled simulation and the sensor data from the experiment is presented in Figure 20
According to Figure 20, it is evident that the aerodynamic hinge moment, when transmitted, acts on the pitch regulated mechanism in the form of alternating forces, with the alternating frequency related to the hovering rotor speed. As depicted in Figure 20, there is a slight discrepancy between the experimental results and the simulation results Figure 21 illustrates the error graph.
According to the error analysis shown in Figure 21, the maximum error is 23.90%, with most errors remaining within ±15%. This is due to the vibration generated by the airframe during the experiment, which to some extent can lead to larger discrepancies between the experimental and calculated results. However, overall, there is good consistency between the experimental and simulation results, verifying the accuracy of the numerical calculations.
Literature [31] computed the hinge moment of the blades by constructing an unsteady aerodynamic calculation model. The method from this literature was employed to calculate the aerodynamic hinge moment of the rotor in this study at a pitch angle of 0° and a speed of 600r/min. The calculated results were then compared with the experimental results and the numerical calculation results of this study, as shown in Figure 22.
As shown in Figure 22, compared to the method in literature [31], the CFD numerical calculation results of this study exhibit higher accuracy, especially near the peak. This demonstrates that the numerical calculation method used in this study has better accuracy compared to the method described in the literature.
5. Conclusions
This study investigates the effects of main factors such as rotor speed and pitch angle on the aerodynamic hinge moment characteristics of rotorcraft through numerical calculations and experimental testing. The underlying mechanisms of these characteristics are analyzed, leading to the following key conclusions:
- (1)
- The aerodynamic hinge moment gradually increases with the increase in rotor speed, but exhibits a significant nonlinear relationship with the pitch angle: When the pitch angle is 0°, the aerodynamic hinge moment reaches its maximum value; when the pitch angle is 15°, the aerodynamic hinge moment reaches its minimum value; furthermore, pitch angles of 0° and 15° differentiate the variation pattern of the aerodynamic hinge moment into three linear change curves.
- (2)
- The results of quantitative characterization methods indicate that the variation curve of blade pressure with pitch angle is consistent with the trend of aerodynamic hinge moment variation with pitch angle. Additionally, when the rotor exhibits a pitching-down phenomenon, a stagnation point high-pressure zone forms at the leading edge of the upper surface of the airfoil; whereas, when pitching up, a stagnation point high-pressure zone forms at the leading edge of the lower surface of the airfoil.
- (3)
- When the pitch angle gradually changes from -9° to 27°, the vortices on the upper surface of the airfoil gradually move forward towards the leading edge from positions closer to the trailing edge. Their intensity initially weakens and then strengthens. Meanwhile, the vortices on the lower surface of the airfoil remain in place but gradually weaken, disappearing at a pitch angle of 0°, and the front part of the lower surface of the airfoil gradually changes from a low-pressure zone to a high-pressure zone.
- (4)
- Under Earth's conditions, the lift error is less than 8.54%, the torque error is less than 7.21%, and the aerodynamic hinge moment error is controlled within 24.90%. Under Martian conditions, the lift error is not greater than 11.62%, and the torque error is not greater than 8.49%. This confirms that the CFD simulation model is equally effective under Martian and Earth conditions, validating the proposed research method's effectiveness in predicting the aerodynamic hinge moment under different pitch angles and rotor speeds.
This paper delves into the research on aerodynamic hinge moment, analyzing its variation patterns and underlying causes. The correctness of numerical calculations was validated through bench tests. Subsequently, we will continue to optimize the design of the pitch regulated mechanism and develop control strategies for relevant rotor UAVs, especially focusing on variable pitch control strategies for rotor UAVs in Martian environments.
Author Contributions
Conceptualization, Q.M., Y.H., Z.K. and W.W.; methodology, Q.M.; software, Q.M. and M.Z.; validation, Q.M., and Y.H.; formal analysis, Q.M, W.W. and Z.K.; investigation, H.Z. and K.Z.; resources, W.W., Z.Y.; data curation, H.Z. and Y.H.; writing—original draft preparation, Q.M.; writing—review and editing, Y.H., Z.K. and W.W., Q.Y.; visualization, M.Z.; supervision, Q.Y., W.W. and Z.Y.; project administration, W.W., H.Z. and Z.Y.; funding acquisition, W.W., H.Z. and Z.K. All authors have read and agreed to the published version of the manuscript.
Funding
This work has been funded by Beijing Natural Science Foundation granted by 3244036; the National Key Research and Development Program granted by 2020YFC1512500; Shandong Province Postdoctoral Innovation Project granted by SDCX-ZG-202303052; Natural Science Foundation of Chongqing, China, grant number CSTB2022NSCQ-MSX1101.
Data Availability Statement
Data available on reasonable request from the authors.
Acknowledgments
Thank you very much to the China Academy of Space Technology 502 Research Institute for providing the vacuum chamber environment and technical support in this experiment. Besides, we would like to clarify that AI-based language tools were utilized during the preparation of this manuscript, including grammar checking and language polishing. The content of the paper, including all scientific arguments, data interpretations, and conclusions, was produced by the authors without automated AI content generation.
Conflicts of Interest
The authors declare no conflict of interest.
References
- Yang, M.; Zhang, Y.; Ni, Y.; et al. Progress and Prospect in Planetary Exploration of Solar System. Chinese Space Scienceand Technology. 2023, 43, 1–12. [Google Scholar] [CrossRef]
- Yu, D.; Sun, Z.; Meng, L.; et al. The Development Process and Prospects for Mars Exploration. Journal of Deep Space Exploration. 2016, 3, 108–113. [Google Scholar] [CrossRef]
- Mars Science Goals, Objectives,. 2020.
- Hall, J.; Pauken, M.; Kerzhanovich, V.; Walsh, G.; Fairbrother, D.; Shreves, C.; Lachenmeier, T. Flight Test Results for Aerially Deployed Mars Balloons. In AIAA Balloon Systems Conference; American Institute of Aeronautics and Astronautics.
- Braun, R.D.; Wright, H.S.; Croom, M.A.; Levine, J.S.; Spencer, D.A. Design of the ARES Mars Airplane and Mission Architecture. J. Spacecr. Rockets 2006, 43, 1026–1034. [Google Scholar] [CrossRef]
- Verstraete, D.; Palmer, J.L.; Hornung, M. Preliminary Sizing Correlations for Fixed-Wing Unmanned Aerial Vehicle Characteristics. J. Aircr. 2018, 55, 715–726. [Google Scholar] [CrossRef]
- Fujita, K.; Oyama, A.; Kubo, D.; Kanazaki, M.; Nagai, H. Wind Tunnel Test for Videogrammetric Deformation Measurement of UAV for Mars Airplane Balloon Experiment-1 (MABE-1). J. Flow Control Meas. Amp Vis. 2019, 07, 87–100. [Google Scholar] [CrossRef]
- Withrow, S.; Johnson, W.; Young, L.A.; Cummings, H.; Balaram, J.; Tzanetos, T. An Advanced Mars Helicopter Design. In ASCEND 2020; American Institute of Aeronautics and Astronautics.
- Zhu, K.; Quan, Q.; Wang, K.; Tang, D.; Tang, B.; Dong, Y.; Wu, Q.; Deng, Z. Conceptual Design and Aerodynamic Analysis of a Mars Octocopter for Sample Collection. Acta Astronaut. 2023, 207, 10–23. [Google Scholar] [CrossRef]
- Shrestha, R.; Benedict, M.; Hrishikeshavan, V.; Chopra, I. Hover Performance of a Small-Scale Helicopter Rotor for Flying on Mars. J. Aircr. 2016, 53, 1160–1167. [Google Scholar] [CrossRef]
- Bar-Cohen, Y.; Colozza, A.; Badescu, M.; Sherrit, S.; Bao, X. Biomimetic Flying Swarm of Entomopters for Mars Extreme Terrain Science Investigations. 2012, 1679, 4075.
- Patel, A.; Karlsson, S.; Lindqvist, B.; Kanellakis, C.; Agha-Mohammadi, A.-A.; Nikolakopoulos, G. Towards Energy Efficient Autonomous Exploration of Mars Lava Tube with a Martian Coaxial Quadrotor. Adv. Space Res. 2023, 71, 3837–3854. [Google Scholar] [CrossRef]
- Folsom, L.; Ono, M.; Otsu, K.; Park, H. Scalable Information-Theoretic Path Planning for a Rover-Helicopter Team in Uncertain Environments. Int. J. Adv. Robot. Syst. 2021, 18, 1729881421999587. [Google Scholar] [CrossRef]
- Grip, H.F.; Johnson, W.; Malpica, C.; Scharf, D.P.; Mandić, M.; Young, L.; Allan, B.; Mettler, B.; Martin, M.S.; Lam, J. Modeling and Identification of Hover Flight Dynamics for NASA’s Mars Helicopter. J. Guid. Control Dyn. 2020, 43, 179–194. [Google Scholar] [CrossRef]
- Zhao, P.; Gao, X.; Yan, Z.; Li, Y.; Wu, J.; Deng, Z. Investigation of Aerodynamic Performance of Coaxial Rotors for Mars Rotorcraft. In Proceedings of the 2023 IEEE International Conference on Mechatronics and Automation (ICMA); August 2023; pp. 1275–1280.
- Zhao, H.; Ding, Z.; Leng, G.; Li, J. Flight Dynamics Modeling and Analysis for a Mars Helicopter. Chin. J. Aeronaut. 2023. [Google Scholar] [CrossRef]
- Grip, H.F.; Lam, J.; Bayard, D.S.; Conway, D.T.; Singh, G.; Brockers, R.; Delaune, J.H.; Matthies, L.H.; Malpica, C.; Brown, T.L. Flight Control System for NASA’s Mars Helicopter. In Proceedings of the AIAA Scitech 2019 Forum; American Institute of Aeronautics and Astronautics, San Diego, CA, USA, 7 January 2019. [Google Scholar]
- Qu, S. Design and Analysis of the Measuring Structure of Hinge Moment in the Aeroelastic Model. Master, Dalian University of Technology, 2014.
- Xia, F. Hinge Moment and Flutter of Rotor Blade for Heavy-Lift Helicopter. Master, Nanjing University of Aeronautics and Astronautics, 2009.
- Mohamed, A.; Abdelhady, M.; Wood, D.H. Using the Hinge Moment of a Trailing Edge Flap for Controlling Dynamic Stall Loads. Exp. Fluids 2021, 62, 184. [Google Scholar] [CrossRef]
- Cabaleiro de la Hoz, C.; Fioriti, M. New Methodology for Flight Control System Sizing and Hinge Moment Estimation. Proc. Inst. Mech. Eng. Part G J. Aerosp. Eng. 2022, 236, 2375–2390. [Google Scholar] [CrossRef]
- Sebastia, C.; Hornung, M. Numerical Analysis of Aerodynamic Flap Hinge Moment under Unsteady Flow Conditions Considering Laminar-Turbulent Transition. In AIAA AVIATION 2023 Forum; American Institute of Aeronautics and Astronautics.
- Xiang,L. ; Shu, H.; Xu, X. Flow-Through Model Hinge Moment Test Techniques Investigation in Hypersonic Wind Tunnel. Flight Dynamics. 2022, 40, 21–27. [Google Scholar] [CrossRef]
- Rose, R.; Nicholas, O.P.; Vorley, G. Flight Measurements of the Elevator and Aileron Hinge-Moment Derivatives of the Fairey Delta 2 Aircraft up to a Mach Number of 1.6 and Comparisons with Wind-Tunnel Results. 1965.
- Hambrick, E.; Thomason, N. Conceptual Aircraft Hinge Moment Measurement System. Aerosp. Eng. 2010. [Google Scholar]
- Grismer, D.; Grismer, M.; Simon, J.; Tinapple, J. An Experimental Investigation of Factors Influencing Hinge Moments. In Proceedings of the 18th Applied Aerodynamics Conference; American Institute of Aeronautics and Astronautics, Denver, CO, USA, 14 August 2000. [Google Scholar]
- Grismer, M.; Kinsey, D.; Grismer, D. Hinge Moment Predictions Using CFD. In Proceedings of the 18th Applied Aerodynamics Conference; American Institute of Aeronautics and Astronautics, Denver, CO, USA, 14 August 2000. [Google Scholar]
- Wu, Z.; Zhu, Z.; Ding, N. Calculation of Hinge Moment of 3 - D Aileron. Acta Aeronautica et Astronautica Sinica. 2007, 28, 519–526. [Google Scholar]
- Huang, Z.; Wang, X.; Zhang, R. Vestigation of Gap Effect on the Rudder Hinge Moment Characteristics. Journal of Experiments in Fluid Mechanics. 2007, 21, 1–6. [Google Scholar]
- Zhang, G.Q.; Yu, S.C.M.; Chien, A. Investigation of the Three-Dimensional Hinge Moment Characteristics Generated by the ONERA-M6 Wing with an Aileron. Adv. Mech. Eng. 2013, 5, 714168. [Google Scholar] [CrossRef]
- Xu, G.; Cheng, M. Research on Rotor Blade Hinge Moment of a Small-scale Coaxial Helicopter. Journal of Aerospace Power. 2010, 25, 1805–1810. [Google Scholar] [CrossRef]
- Yuan, M.; Sun, P.; Fan, F.; et al. Investigation on Blade Aerodynamic Hinge Moment of Coaxial Rigid Rotor with Different Pith Axes. Aeronautical Science & Technology. 2018, 29, 61–66. [Google Scholar] [CrossRef]
- Liu, F. Moment Acquisition and Transmission Research in the Helicopters'Airscrew Dynamic-Balancing Test Platform. Master, Harbin Engineering University, 2007.
- Xue, L.; Wang, S. Dynamics Analysis and Modeling of Helicopter Rotor Test-Bed. Journal of Beijing University of Aeronautics and Astronautics. 2009, 35, 296–299. [Google Scholar] [CrossRef]
- Lange, C.; Ranjbaran, F.; Angeles, J.; Goritschnig, G. The Kinematics of the Swashplate Mechanism of a VTOL Unmanned Aerial Vehicle. Multibody Syst. Dyn. 1999, 3, 333–365. [Google Scholar] [CrossRef]
- Zhu, K.; Tang, D.; Quan, Q.; Lv, Y.; Shen, W.; Deng, Z. Modeling and Experimental Study on Orientation Dynamics of a Mars Rotorcraft with Swashplate Mechanism. Aerosp. Sci. Technol. 2023, 138, 108311. [Google Scholar] [CrossRef]
- Hayami, K.; Sugawara, H.; Yumino, T.; Tanabe, Y.; Kameda, M. CFD Analysis on the Performance of a Coaxial Rotor with Lift Offset at High Advance Ratios. Aerosp. Sci. Technol. 2023, 135, 108194. [Google Scholar] [CrossRef]
- Singh, P.; Venkatesan, C. Analytical Formulation Of Heave-Yaw Modes For A Coaxial Rotor Micro Aerial Vehicle. In AIAA Guidance, Navigation, and Control Conference; AIAA SciTech Forum; American Institute of Aeronautics and Astronautics, 2014.
- An-Assessment-of-CFD-CSD-Prediction-State-of-the-Art-Using-the-HART-II-International-Workshop-Data.Pdf.
- Koning, W.J.F.; Johnson, W.; Allan, B.G. Generation of Mars Helicopter Rotor Model for Comprehensive Analyses.
- Li, S.; Xiong, J.; Wang, X. New Helicopter Rotor Aerodynamic Characteristics and Layout Analysis. Journal of Nanjing University of Aeronautics & Astronautics. 2020, 52, 318–333. [Google Scholar] [CrossRef]
- Li, Y.; Wu, T.; Yuan, Z.; et al. The Influence Law of Hinge Moment Balance Structural Parameters on Lift Measurement. Journal of Projectiles,Rockets,Missiles and Guidance. 2022, 42, 1–4. [Google Scholar] [CrossRef]
- Xu, Y.; Qiu, J.W. Research on Influence of Contact Stress on the Hinge Moment Balance Measures. Appl. Mech. Mater. 2012, 148–149, 833–836. [Google Scholar] [CrossRef]
- Quan, Q.; Zhao, P.; Chen, S.; Wang, D.; Li, H.; Bai, D.; Deng, Z. Experimental Evaluating Approach to a Suitable Martian Coaxial Rotorcraft Blade. In Proceedings of the 2017 IEEE International Conference on Mechatronics and Automation (ICMA); August 2017; pp. 1958–1963.
- Zhang, W.; Xu, B.; Xiang, C.; Yao, Z.; Zhang, H.; Fan, W.; Zhao, Z.; Hu, Y. Aerodynamic Performance Study of Propellers for Mars Atmospheric Environment. Phys. Fluids 2023, 35, 127124. [Google Scholar] [CrossRef]
- Dull, C.; Wagner, L.; Young, L.; Johnson, W. Hover and Forward Flight Performance Modeling of the Ingenuity Mars Helicopter.; San Jose, CA.
Figure 1.
Basic working principle of rotorcraft.
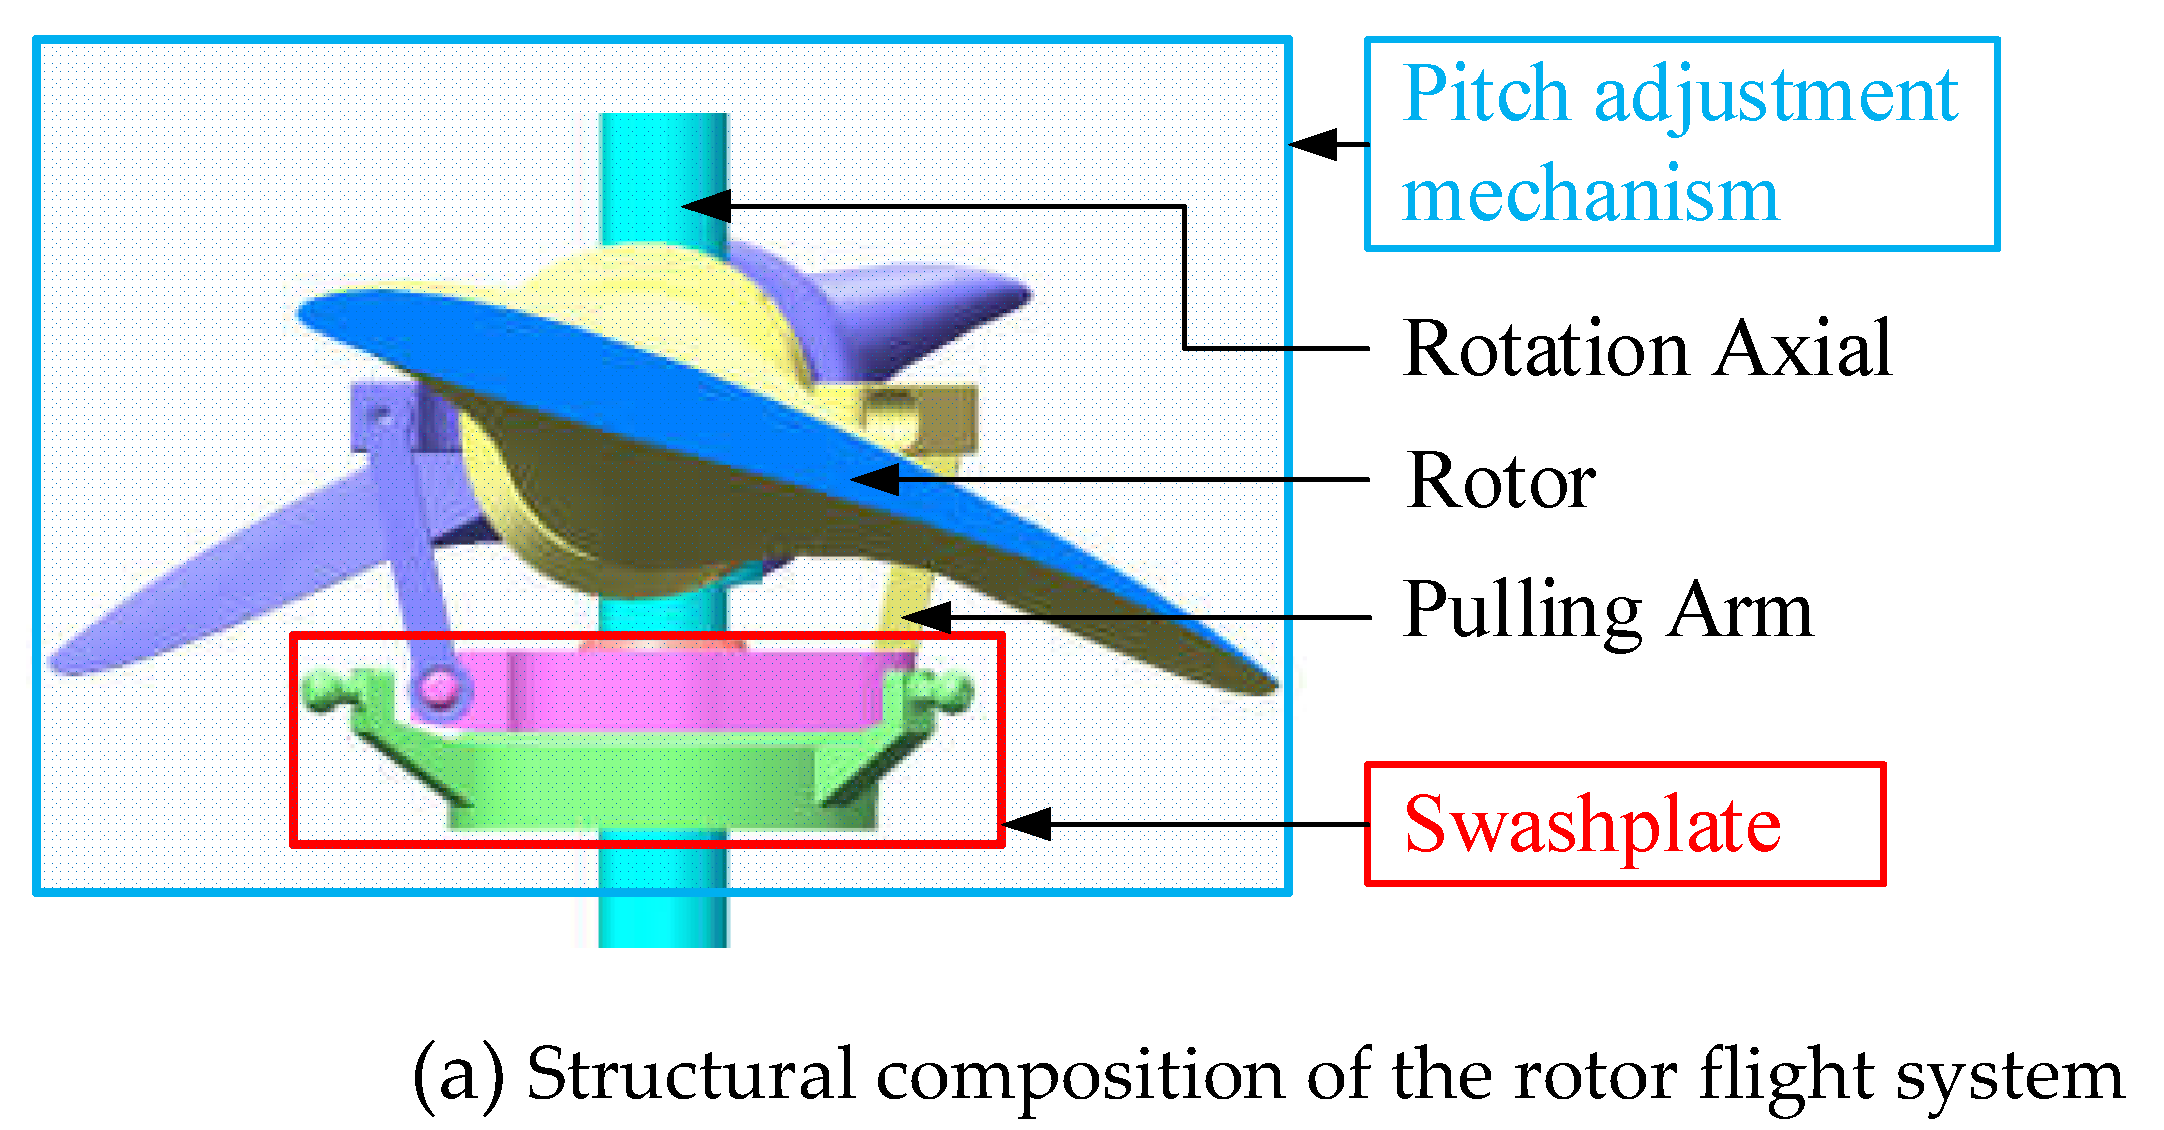
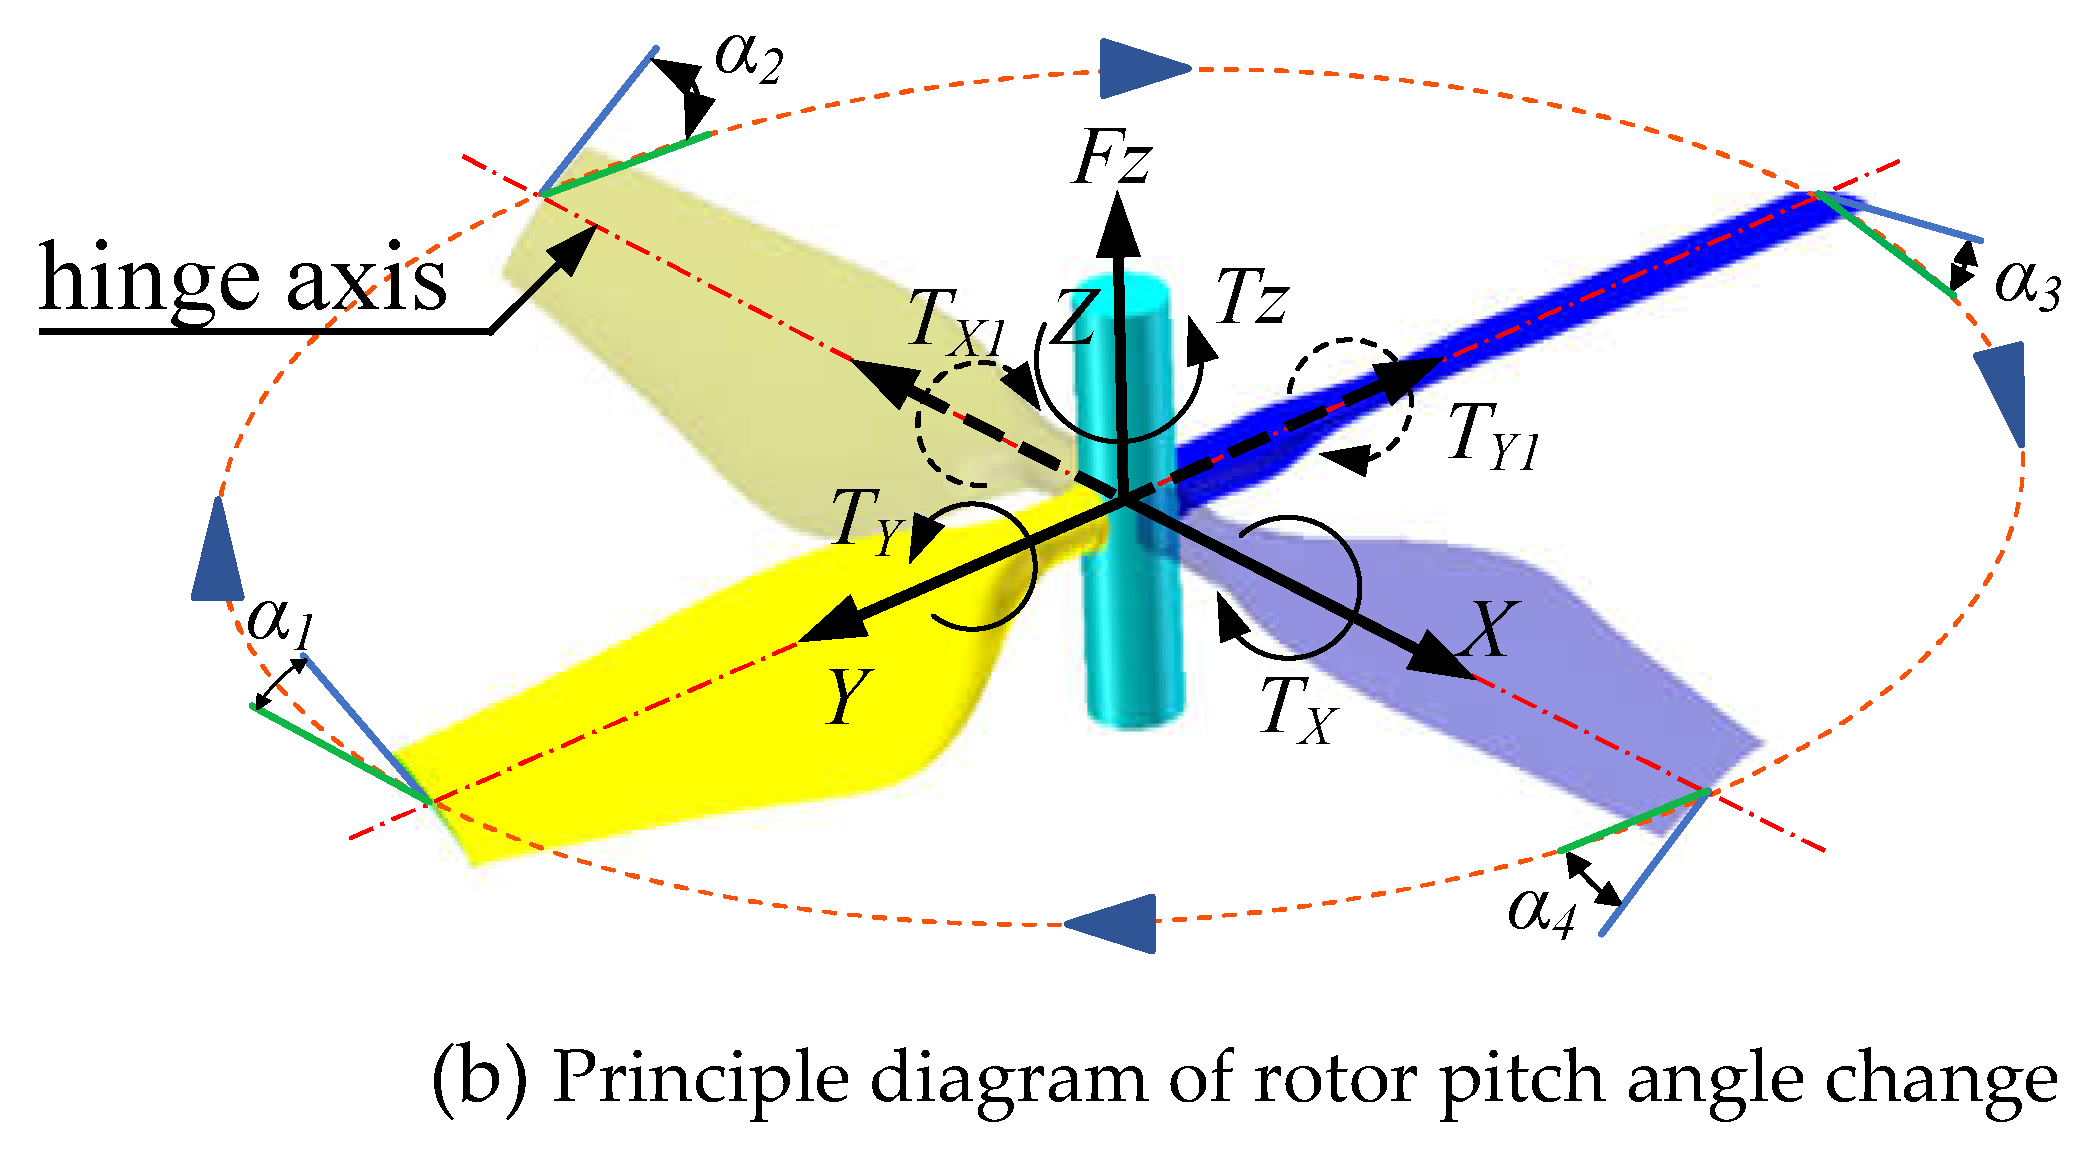
Figure 2.
Determination of rotor blade airfoil.
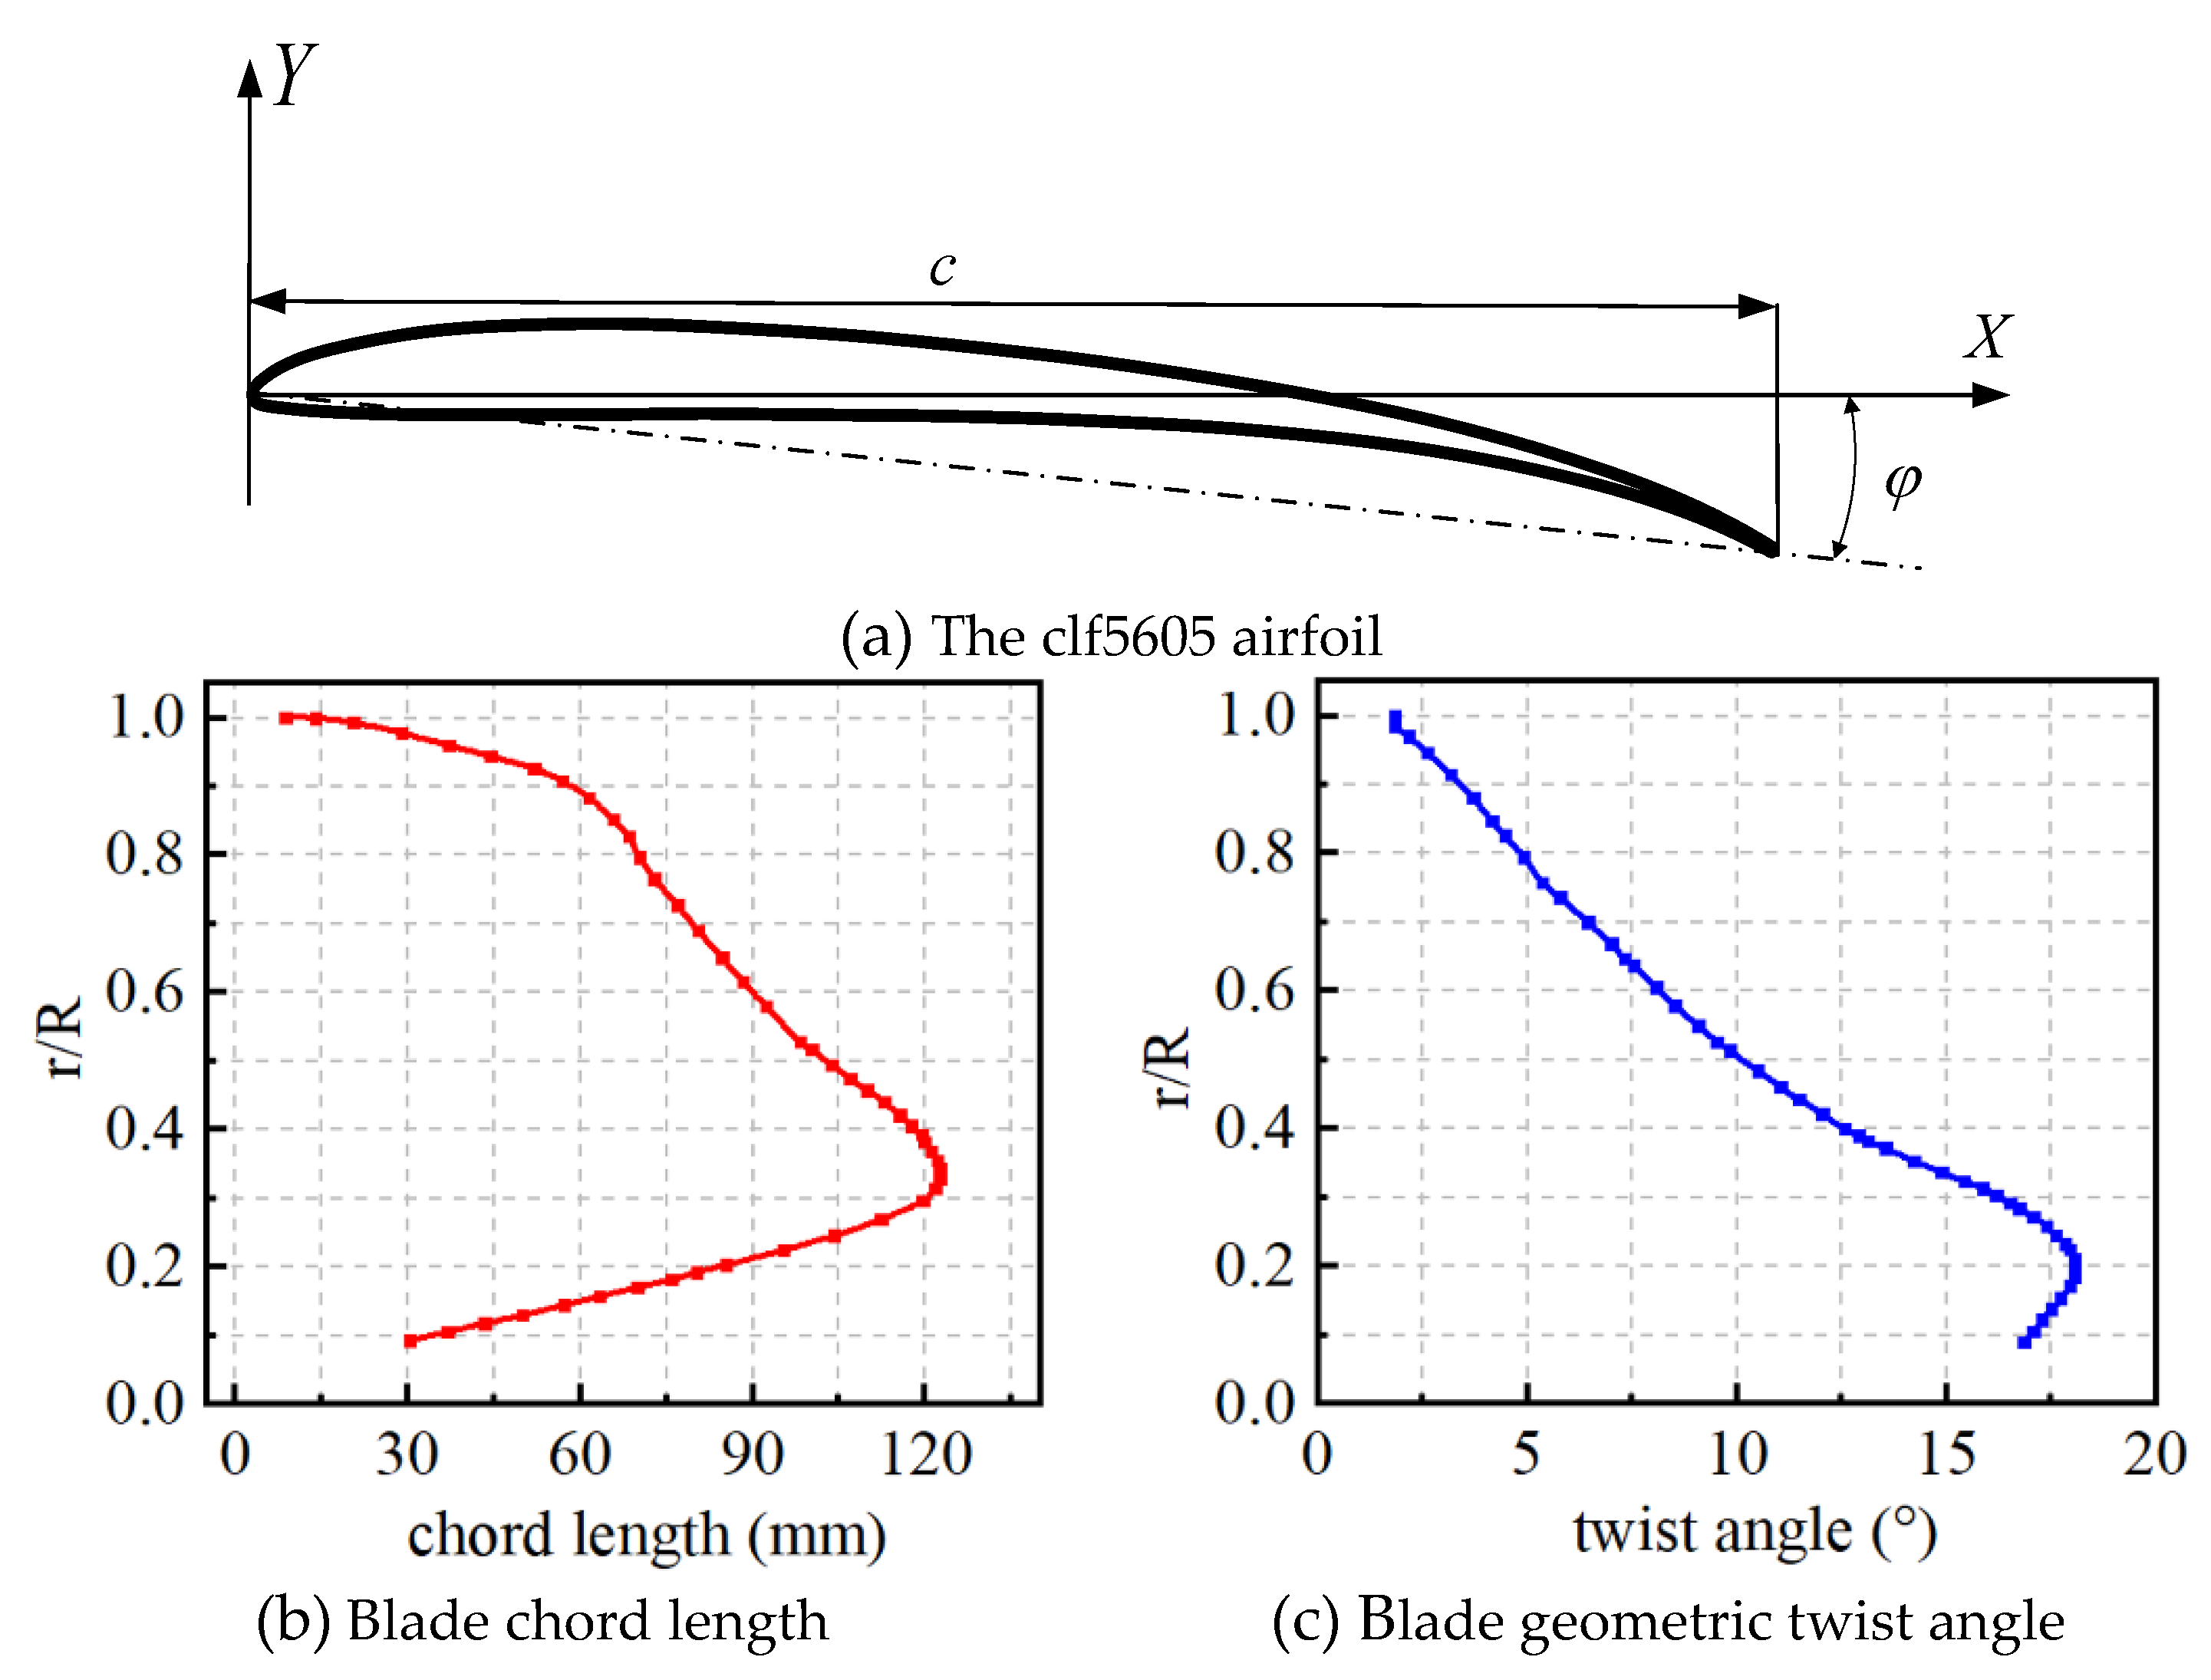
Figure 3.
Rotor blade airfoil parameterization and three-dimensional modeling.
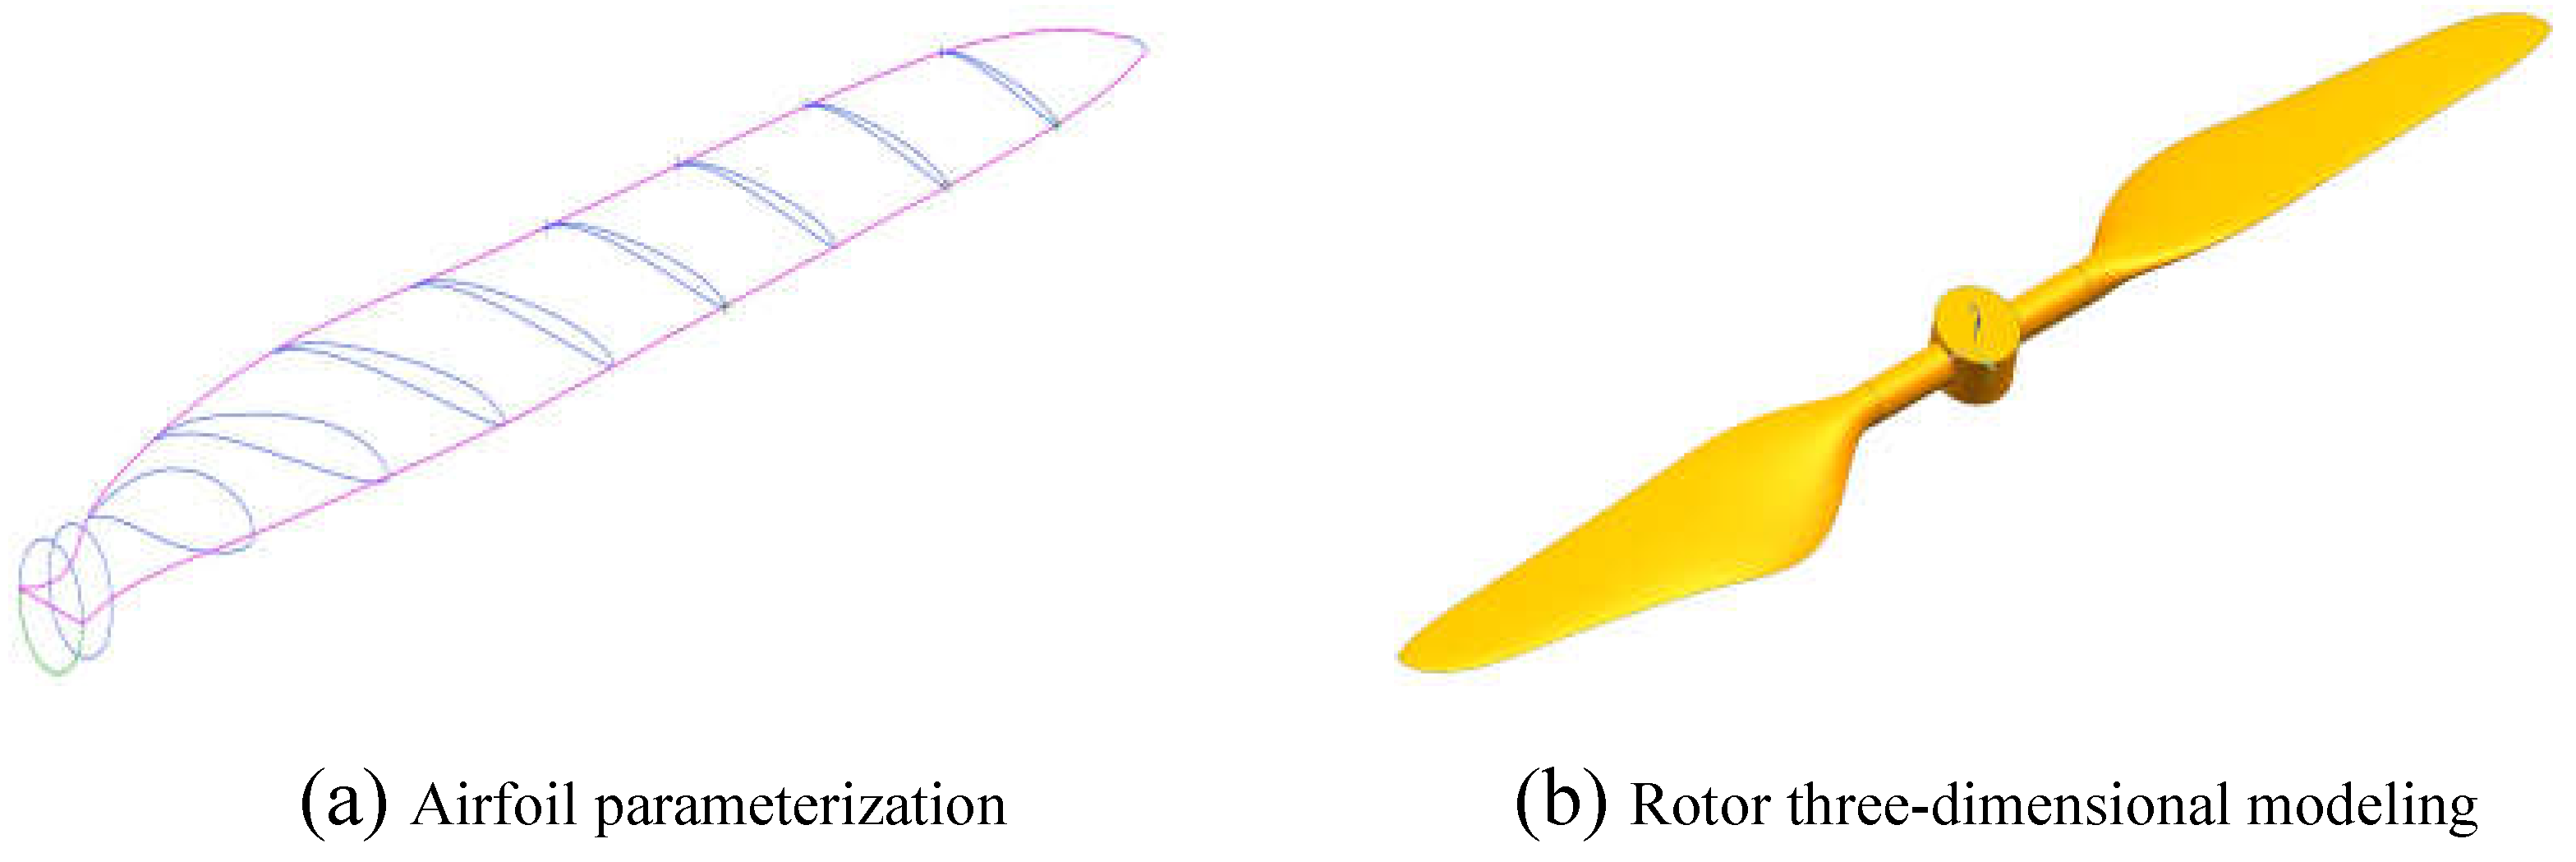
Figure 4.
Configuration of the computational domain.
Figure 5.
Grid division of the computational domain: (a) Stationary domain; (b) Rotating domain; (c) Rotor and local mesh.
Figure 5.
Grid division of the computational domain: (a) Stationary domain; (b) Rotating domain; (c) Rotor and local mesh.
Figure 6.
Relationship between rotor aerodynamic performance and pitch angle: (a) The relationship between lift coefficient and pitch angle; (b) The relationship between torque coefficient and pitch angle; (c) The relationship between lift-to-drag ratio and pitch angle.
Figure 6.
Relationship between rotor aerodynamic performance and pitch angle: (a) The relationship between lift coefficient and pitch angle; (b) The relationship between torque coefficient and pitch angle; (c) The relationship between lift-to-drag ratio and pitch angle.
Figure 7.
Rotor aerodynamic hinge moment calculation analysis (a) The relationship between aerodynamic hinge moment and blade pitch angle; (b) The relationship between aerodynamic hinge moment and rotor speed.
Figure 7.
Rotor aerodynamic hinge moment calculation analysis (a) The relationship between aerodynamic hinge moment and blade pitch angle; (b) The relationship between aerodynamic hinge moment and rotor speed.

Figure 8.
The wing profile at 0.75R.
Figure 9.
Force Distribution on the Wing Profile.
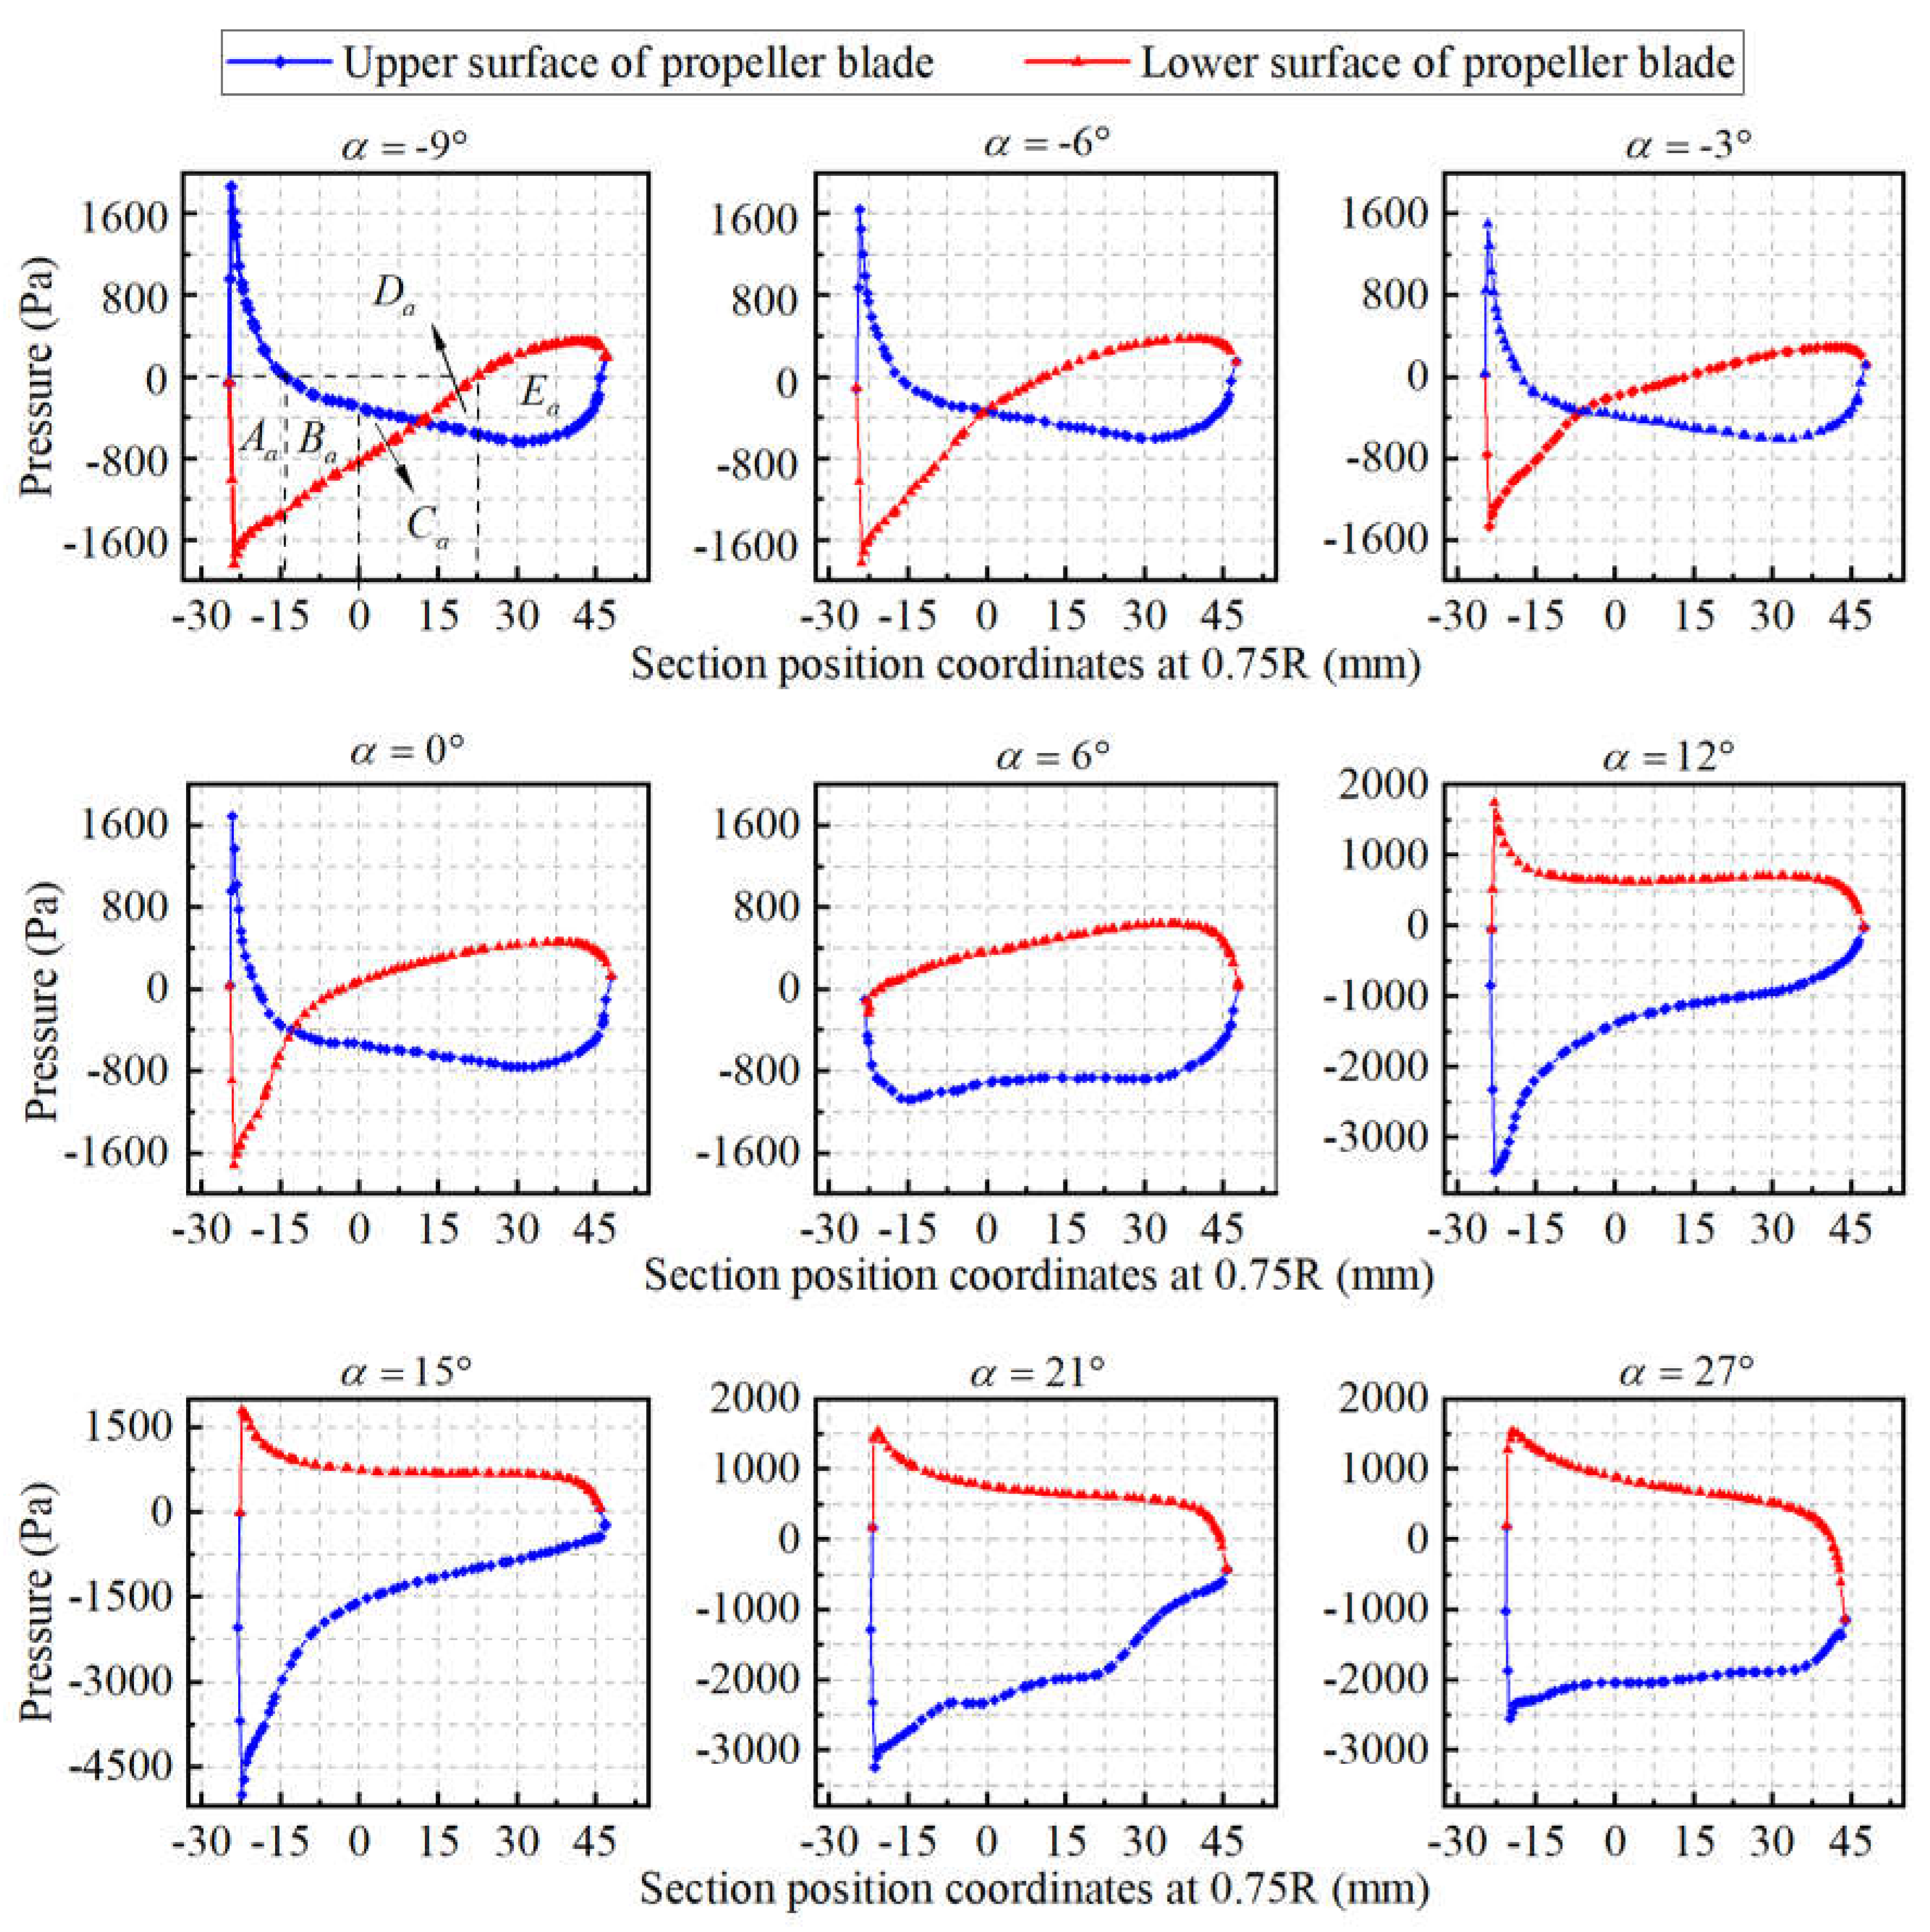
Figure 10.
Rotor Blade Aerodynamic Hinge Moment Analysis at 0.75R.
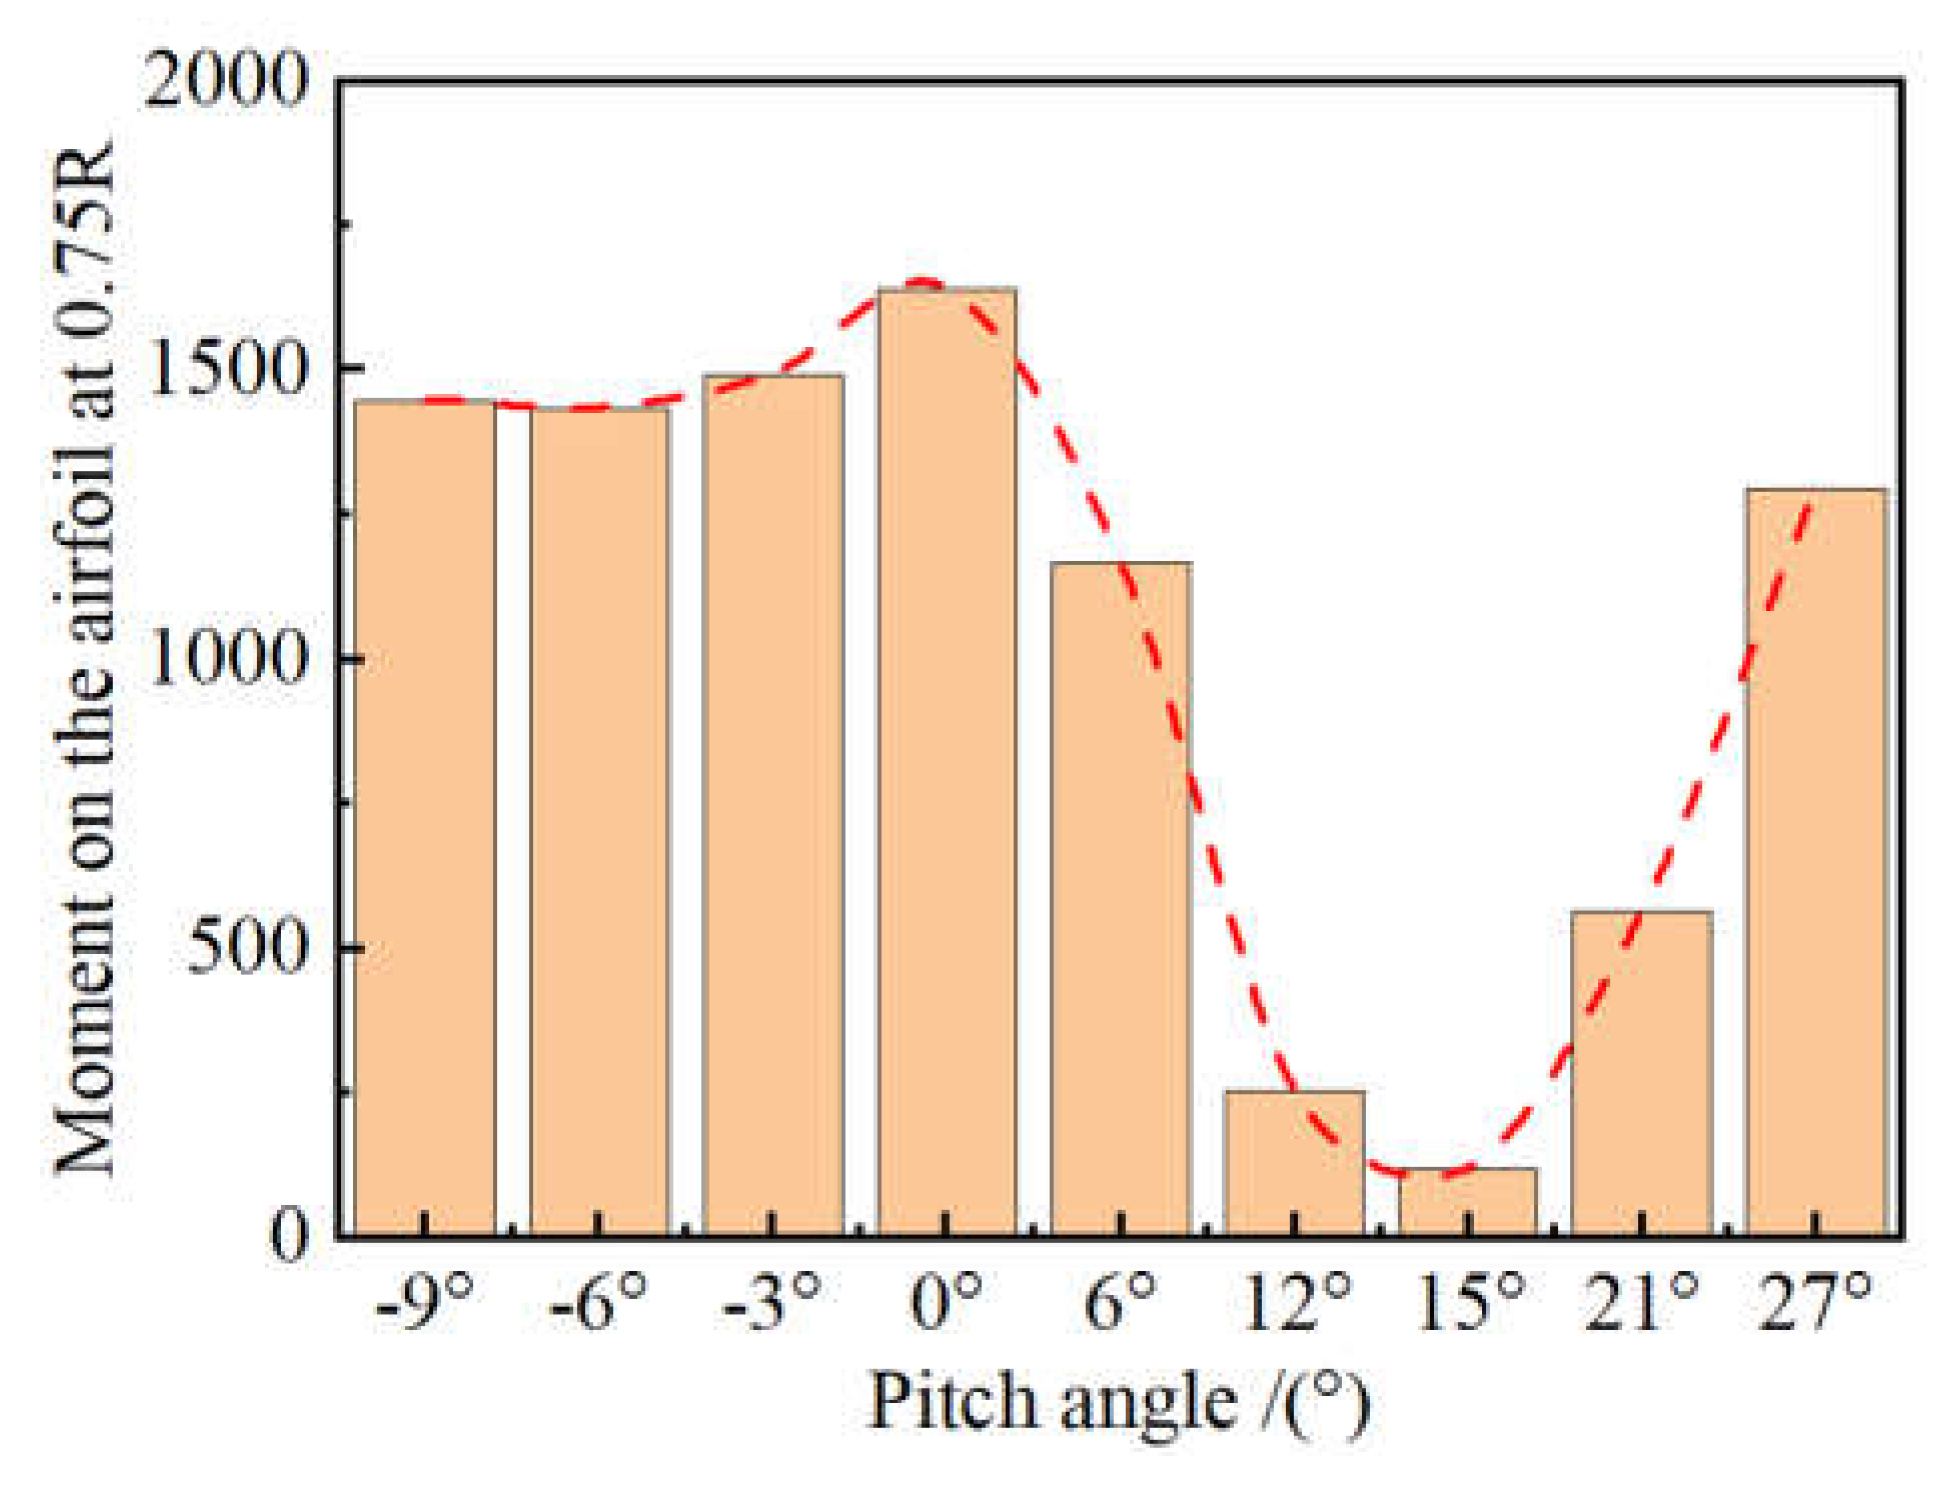
Figure 11.
The pressure distribution maps on the upper and lower surfaces of the wing profile at 0.75R.
Figure 11.
The pressure distribution maps on the upper and lower surfaces of the wing profile at 0.75R.

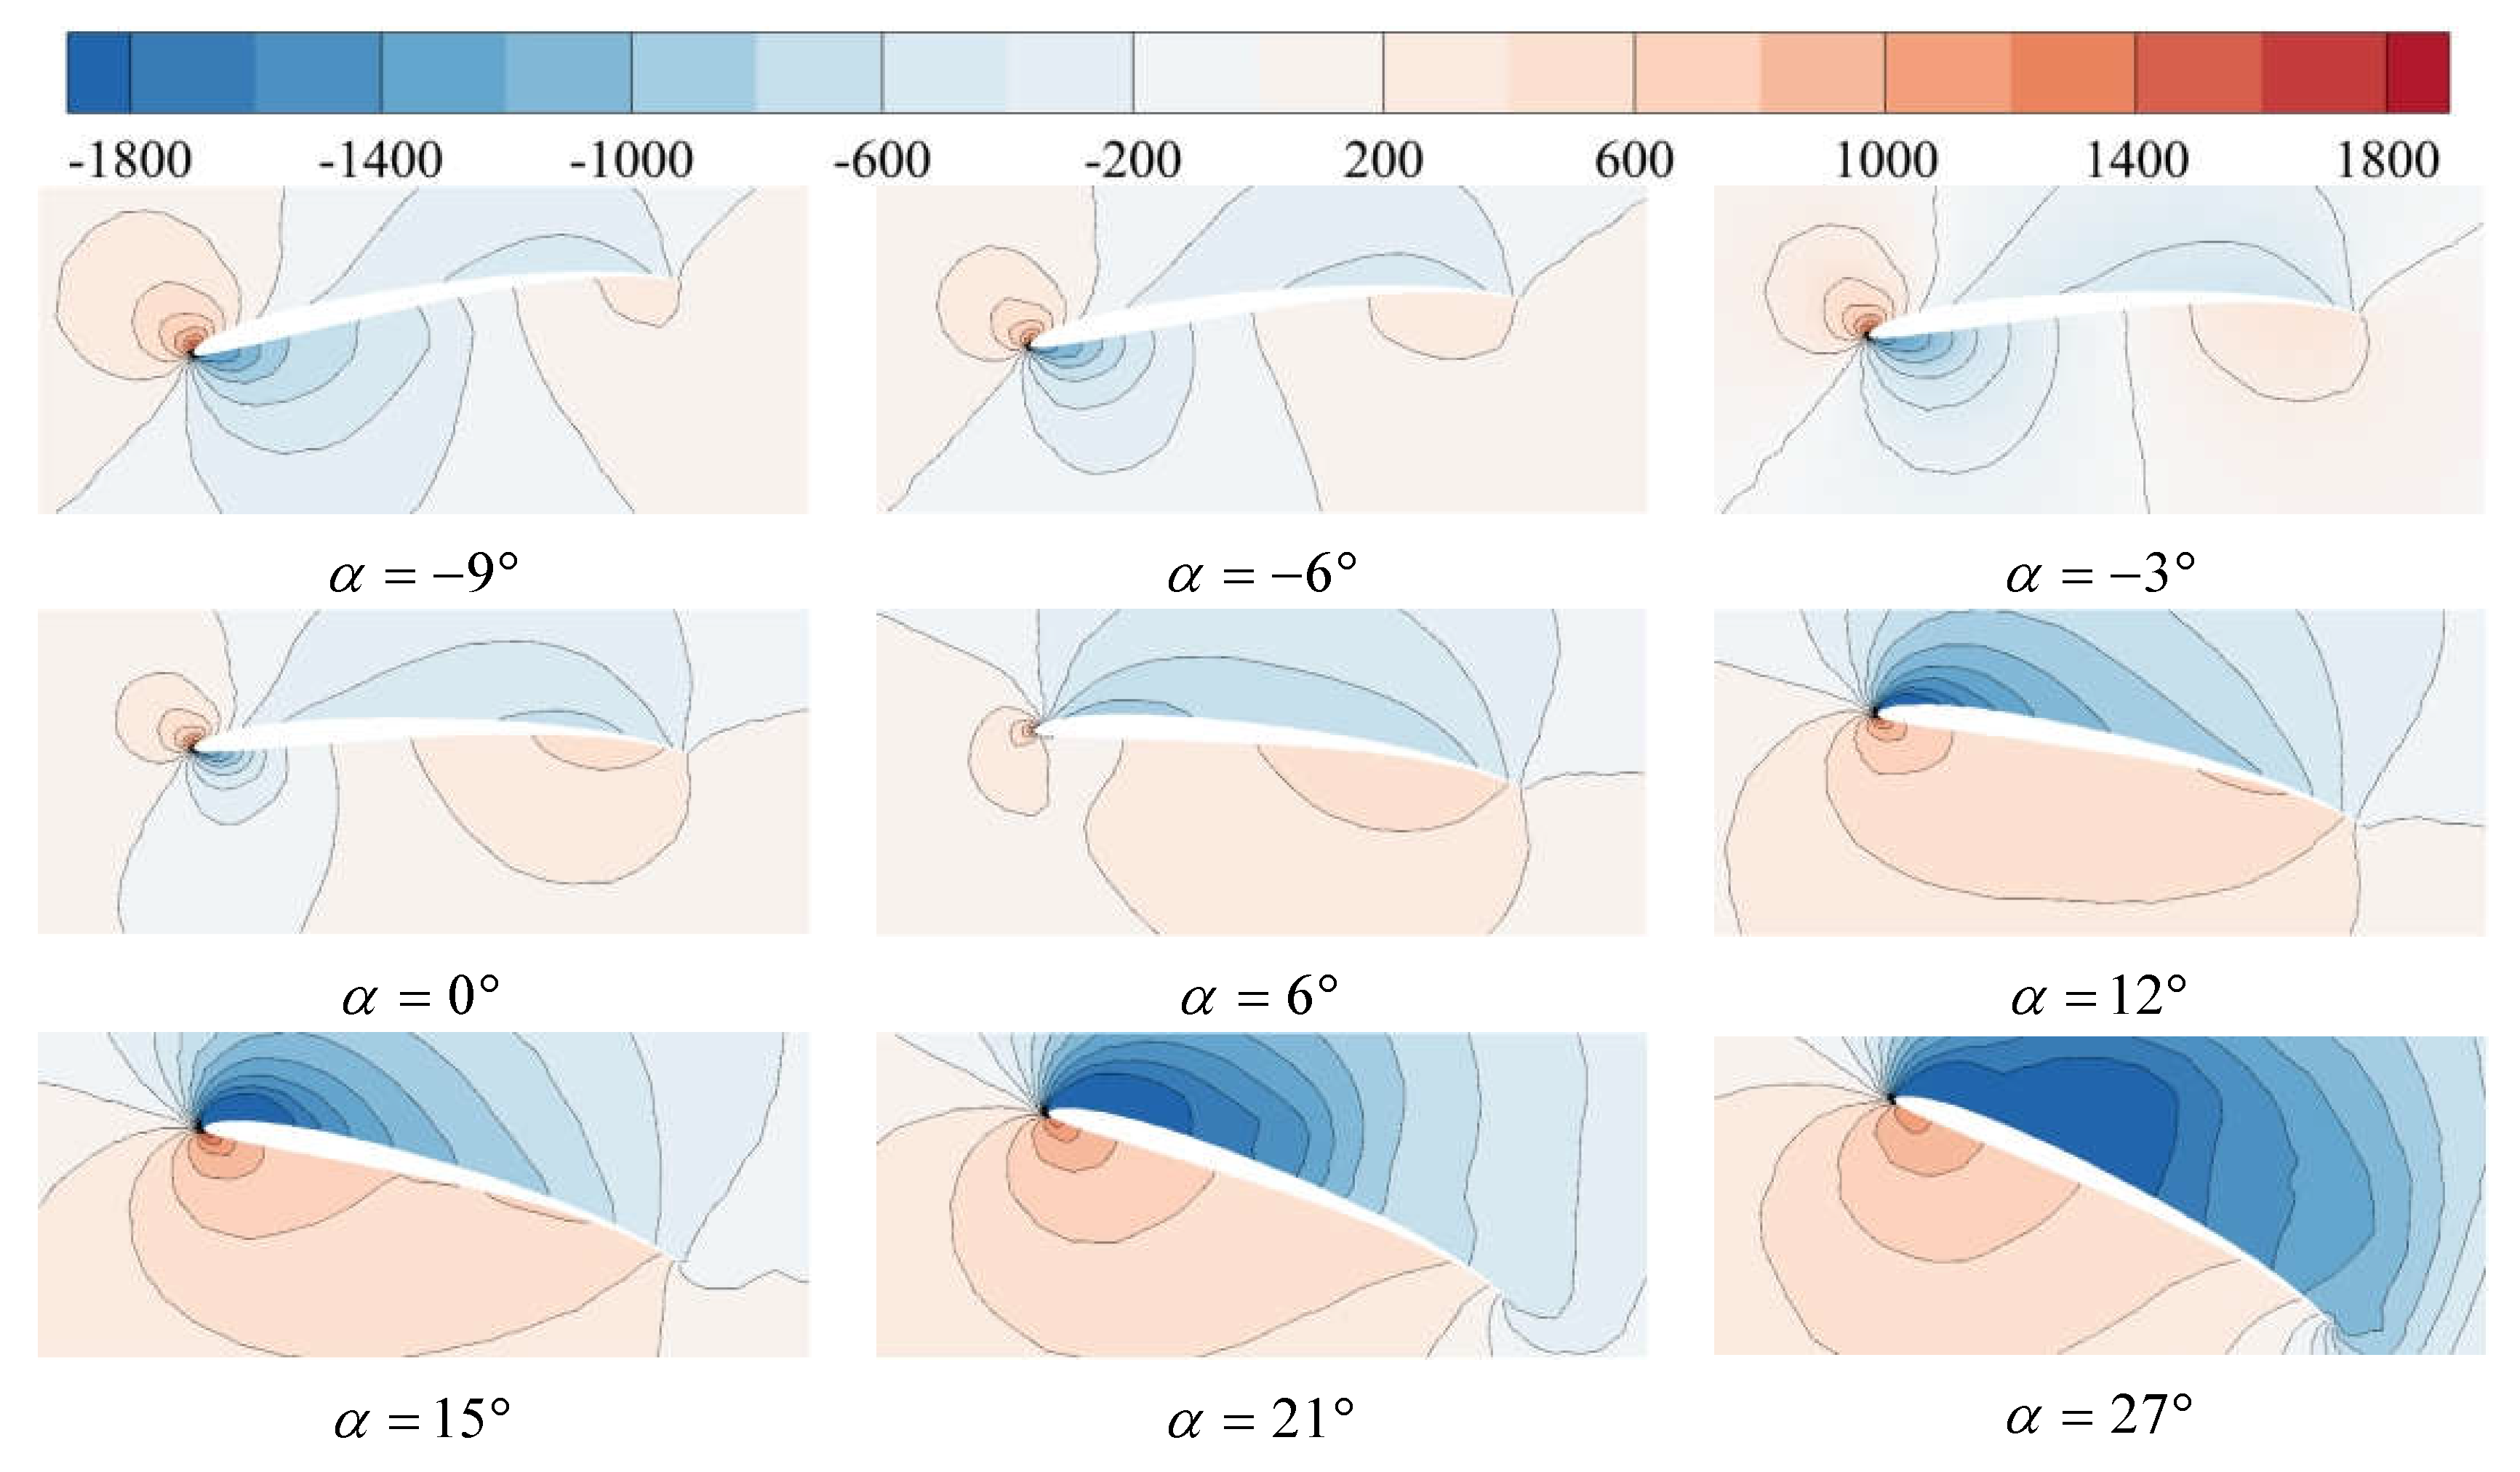
Figure 12.
The airflow velocity maps on the upper and lower surfaces of the wing profile at 0.75R.
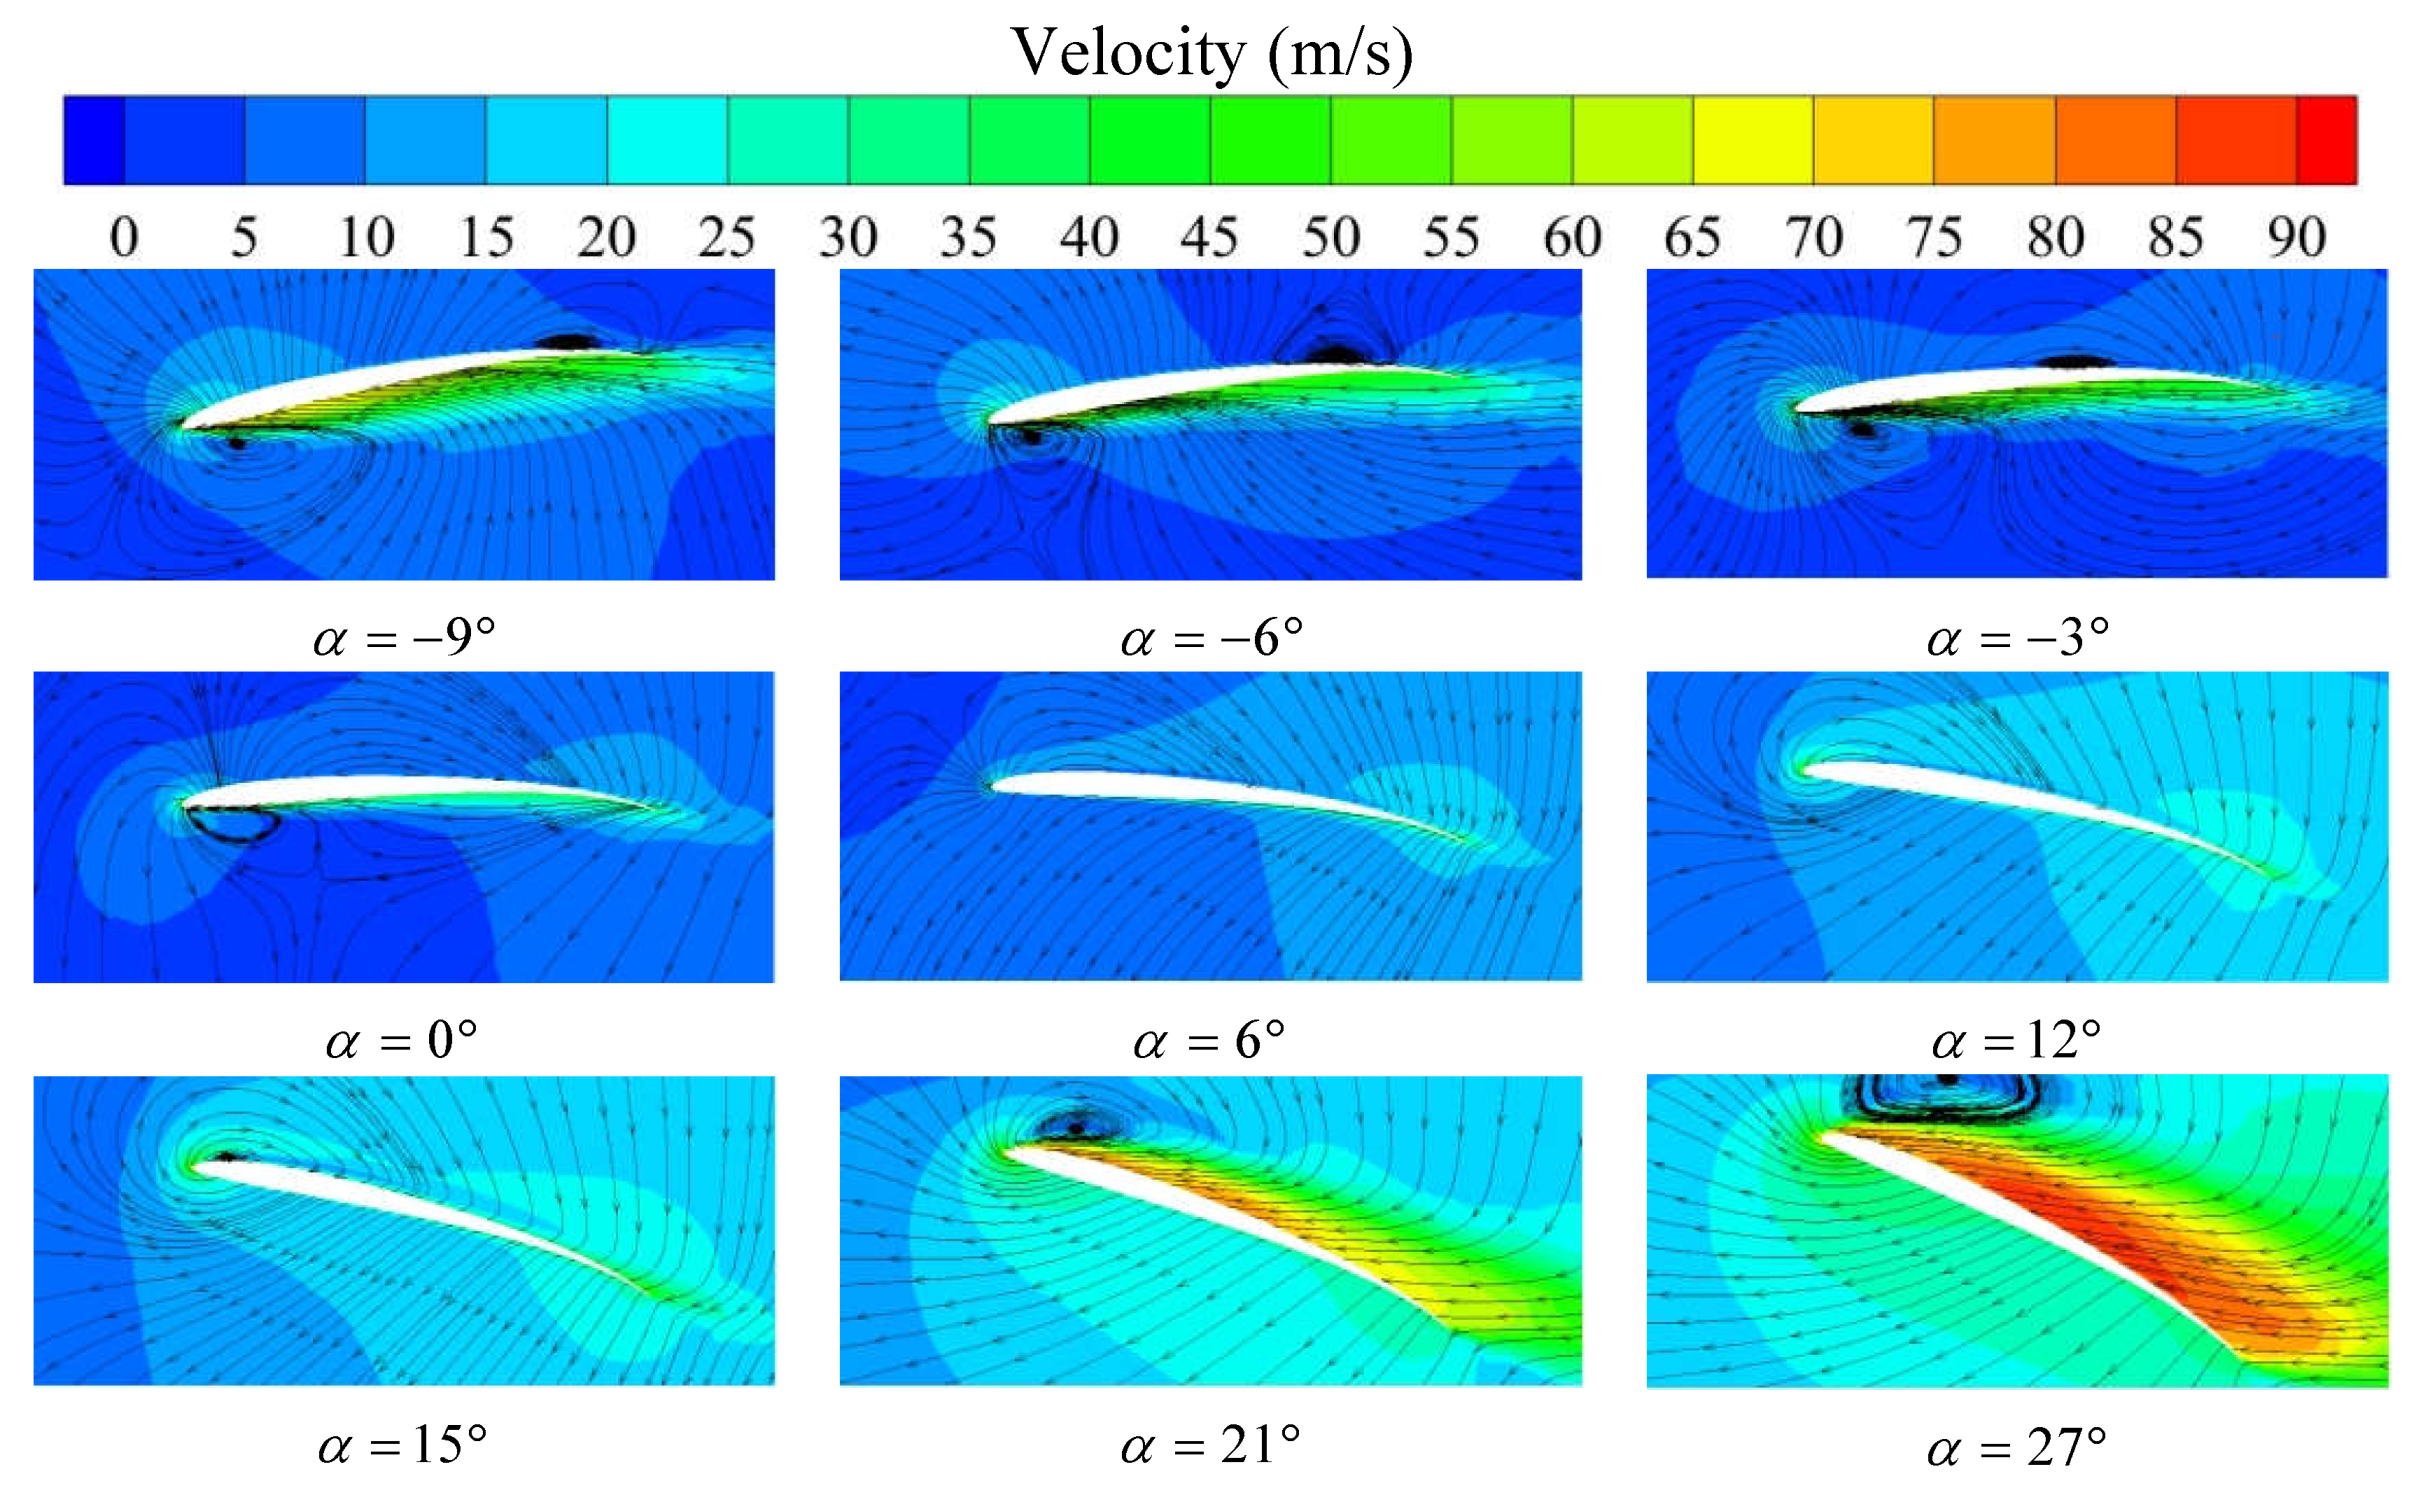
Figure 13.
Test Stand System.
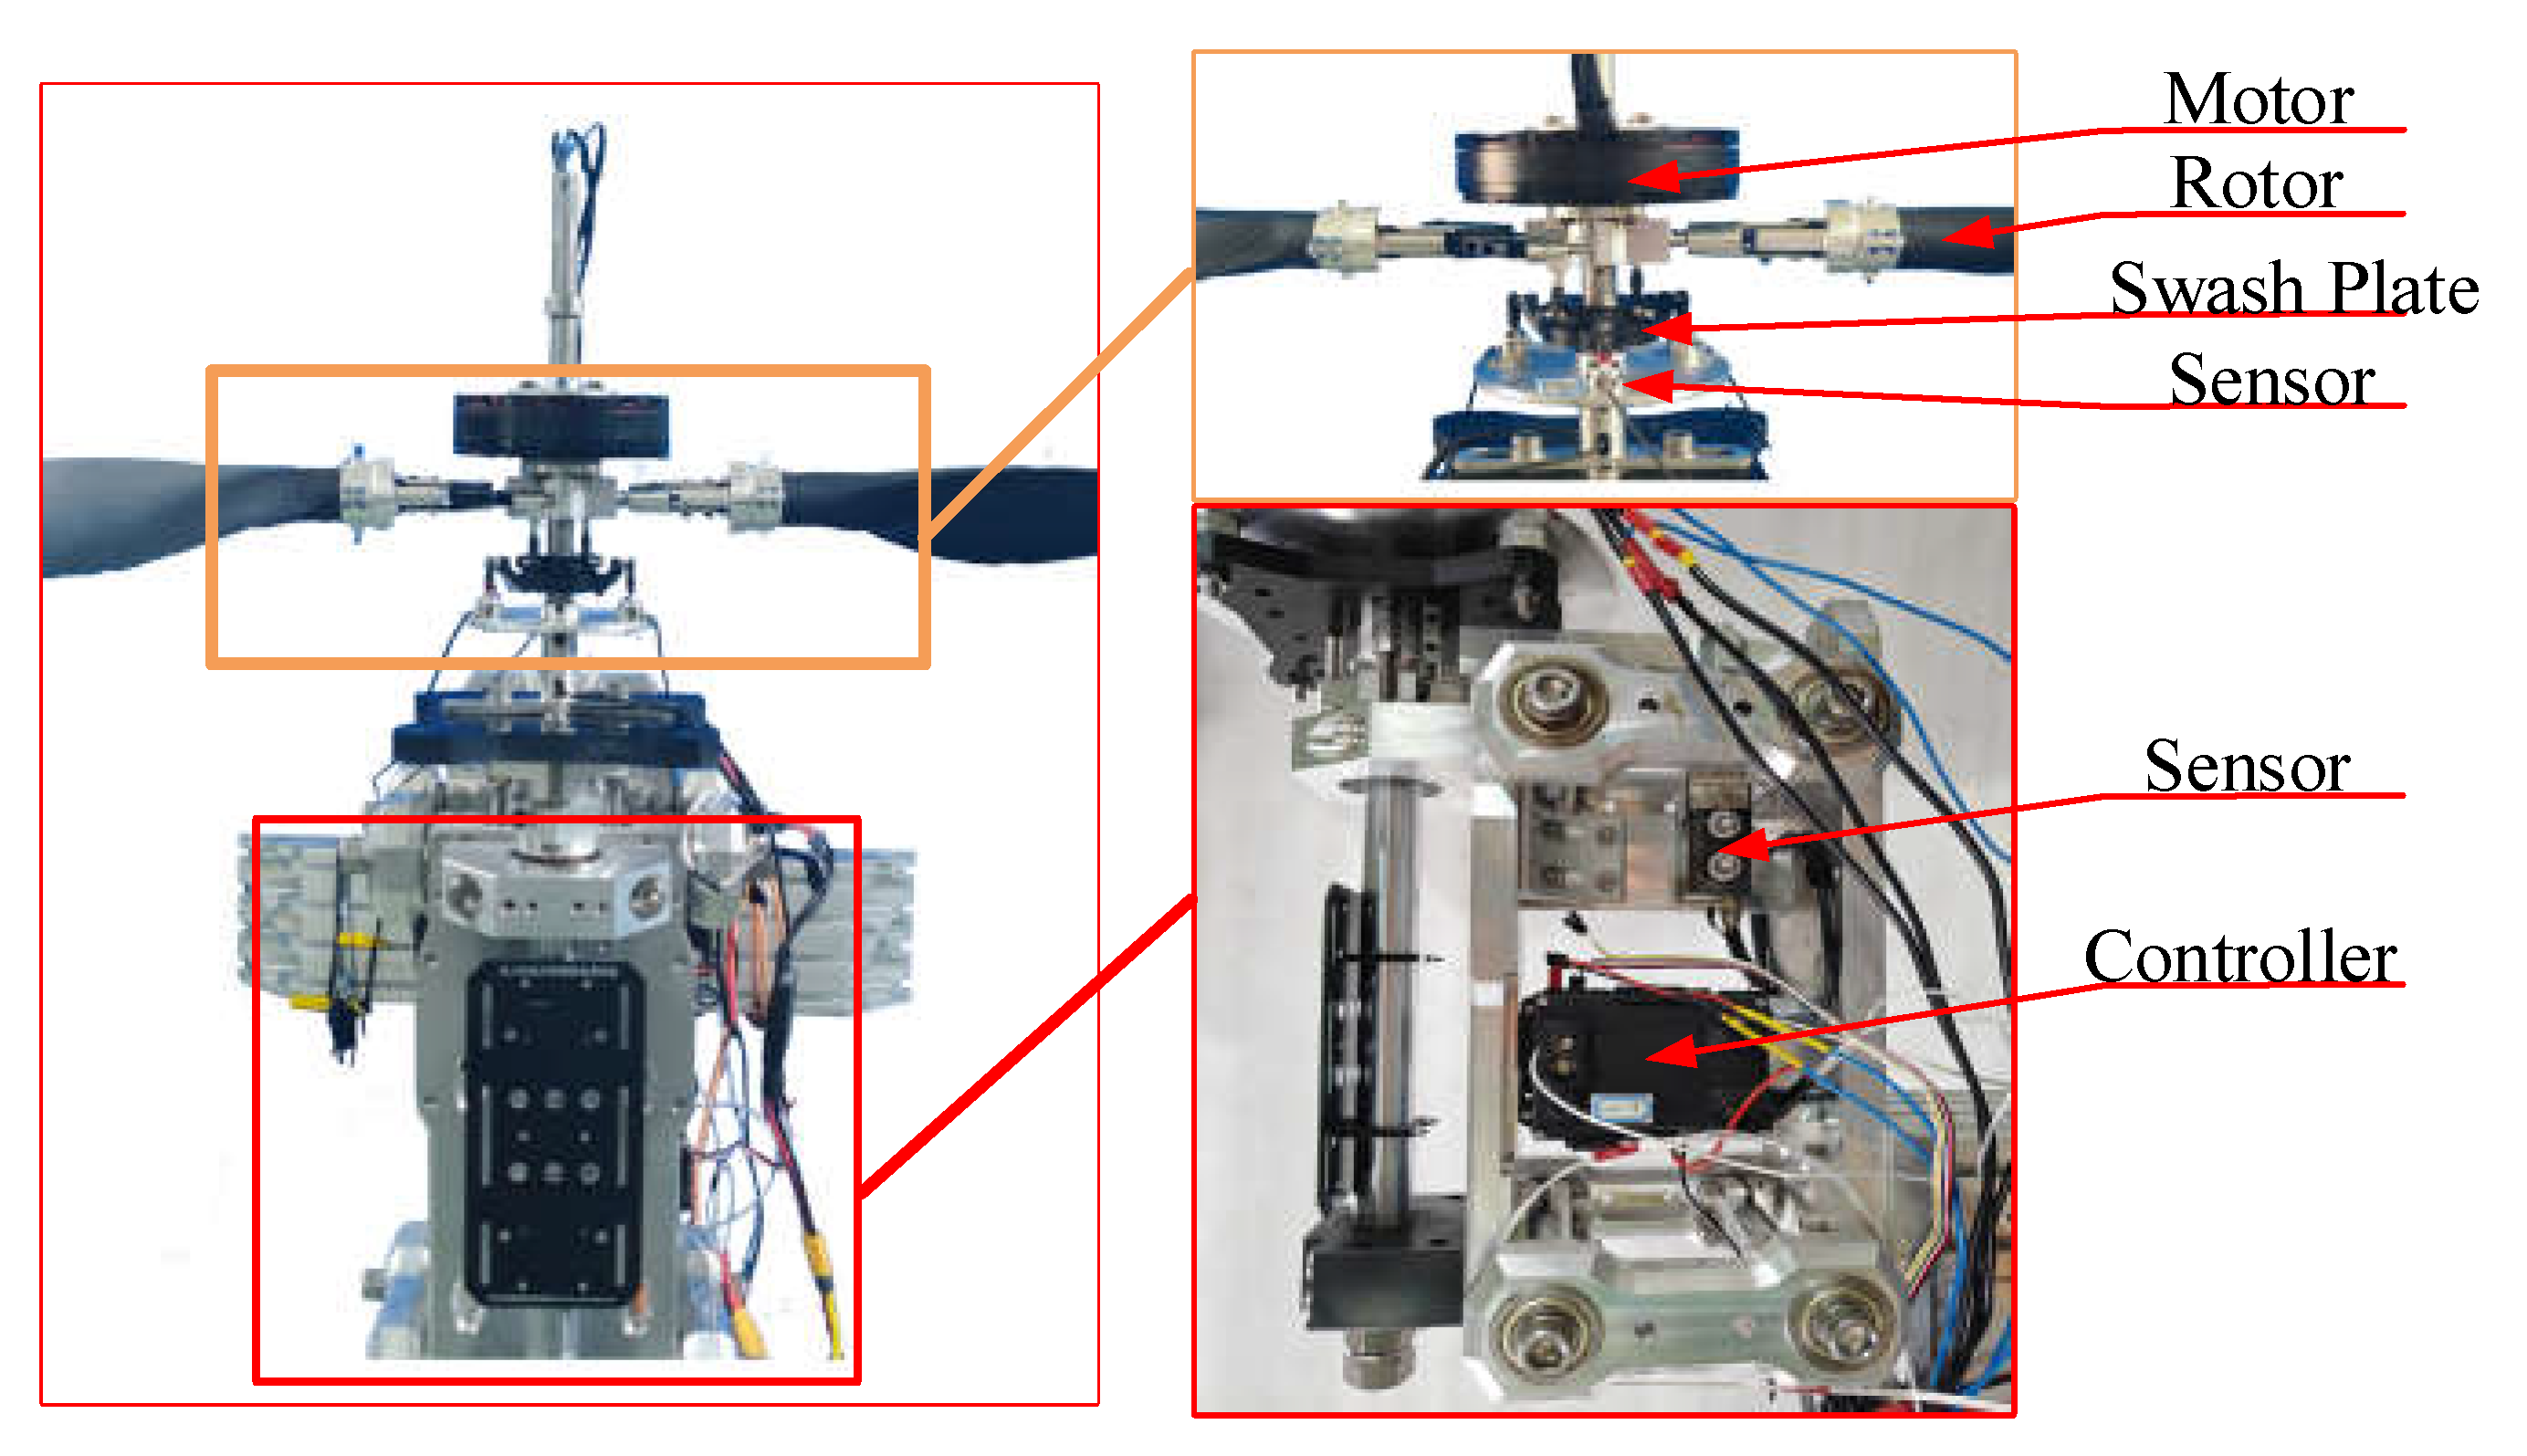
Figure 14.
Pitch angle measurement method.
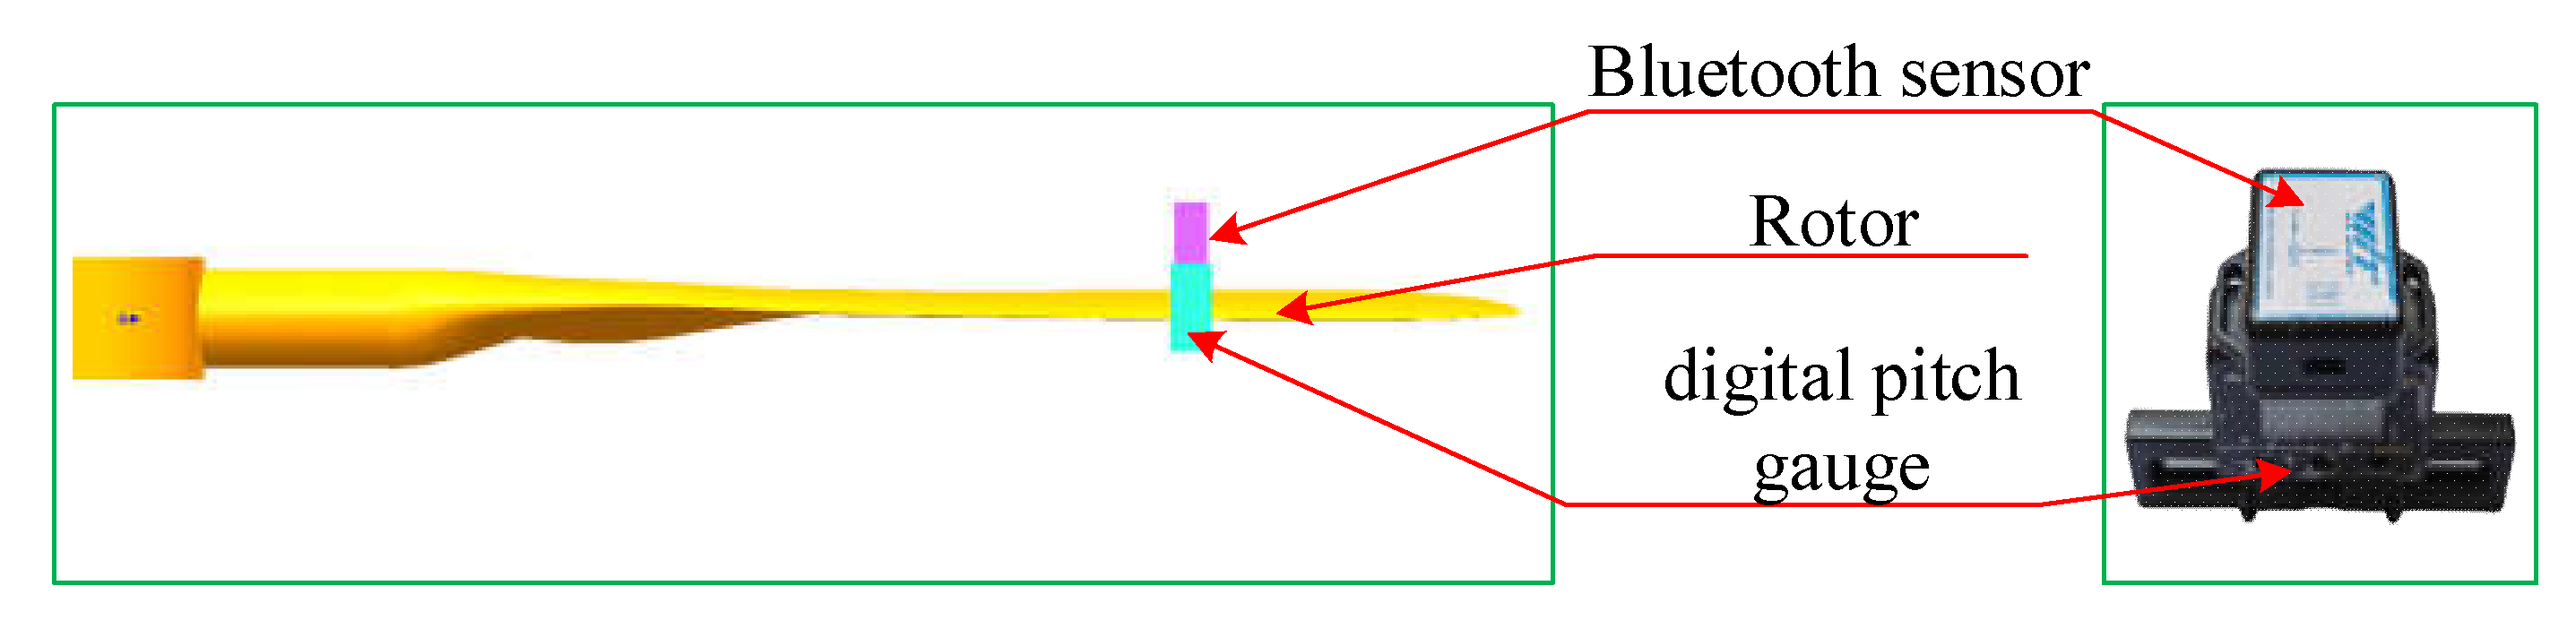
Figure 15.
Principle of Pneumatic Hinge Moment Test.
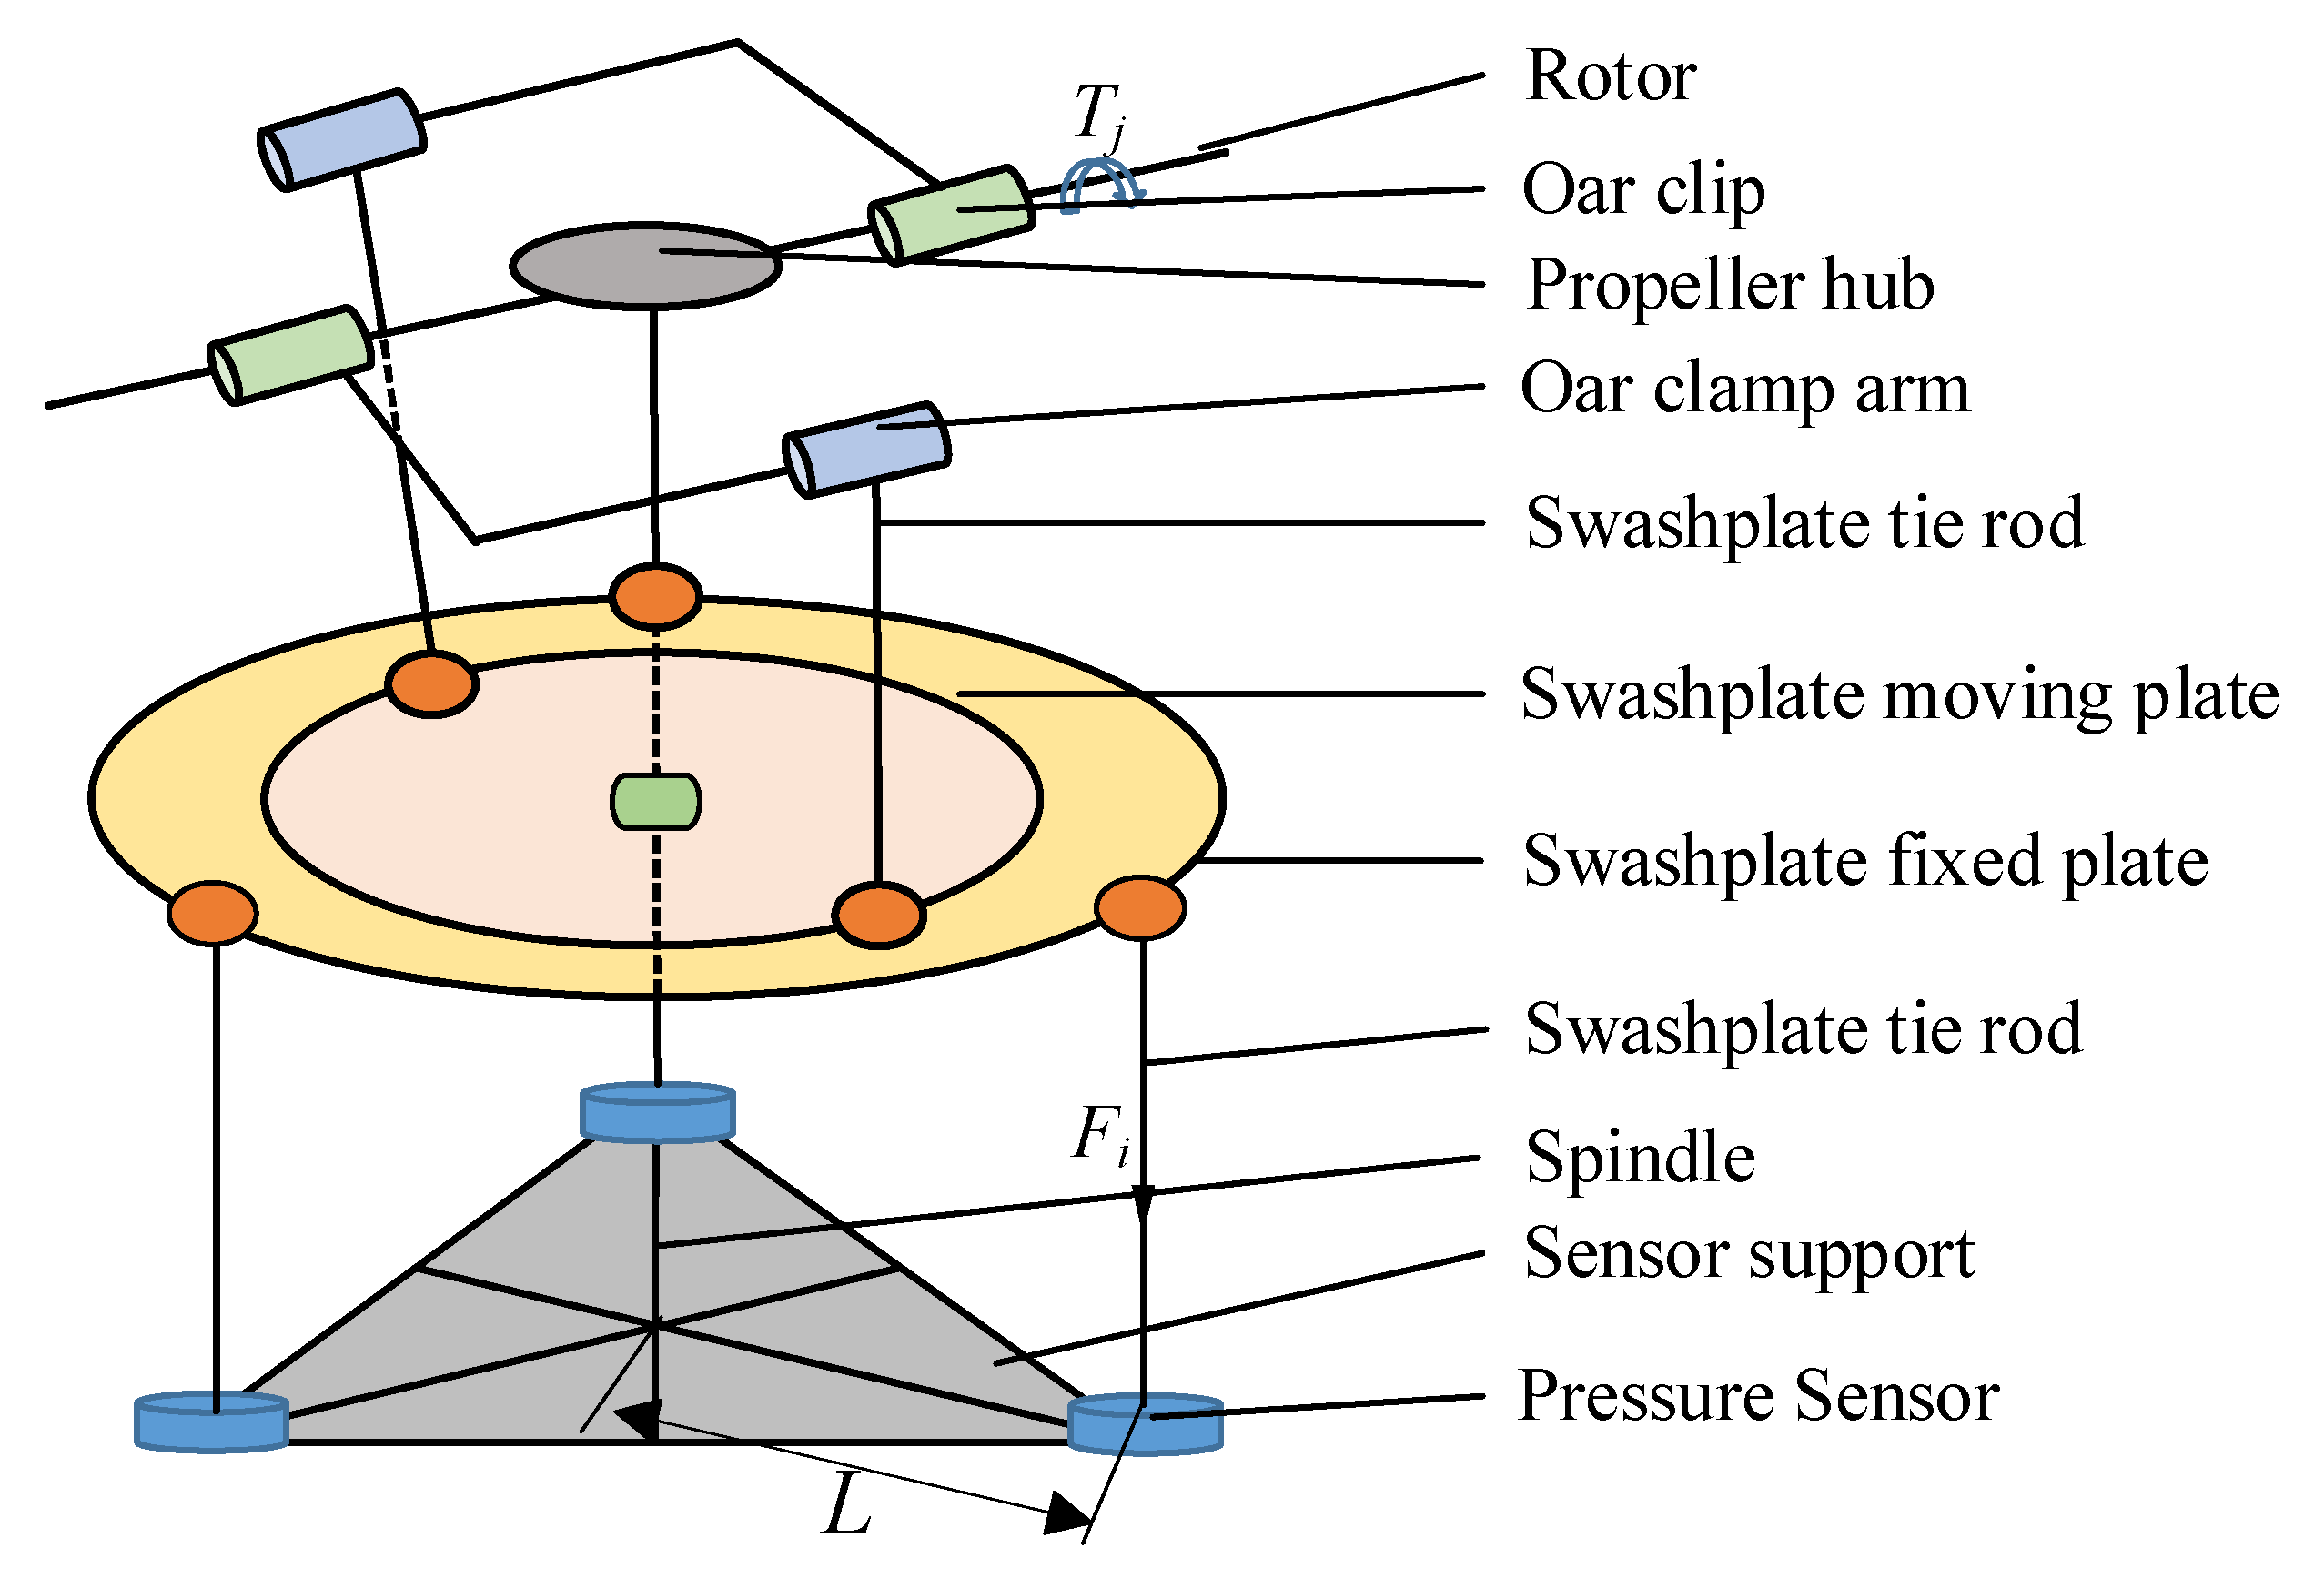
Figure 16.
Earth environment rotor aerodynamic performance analysis.
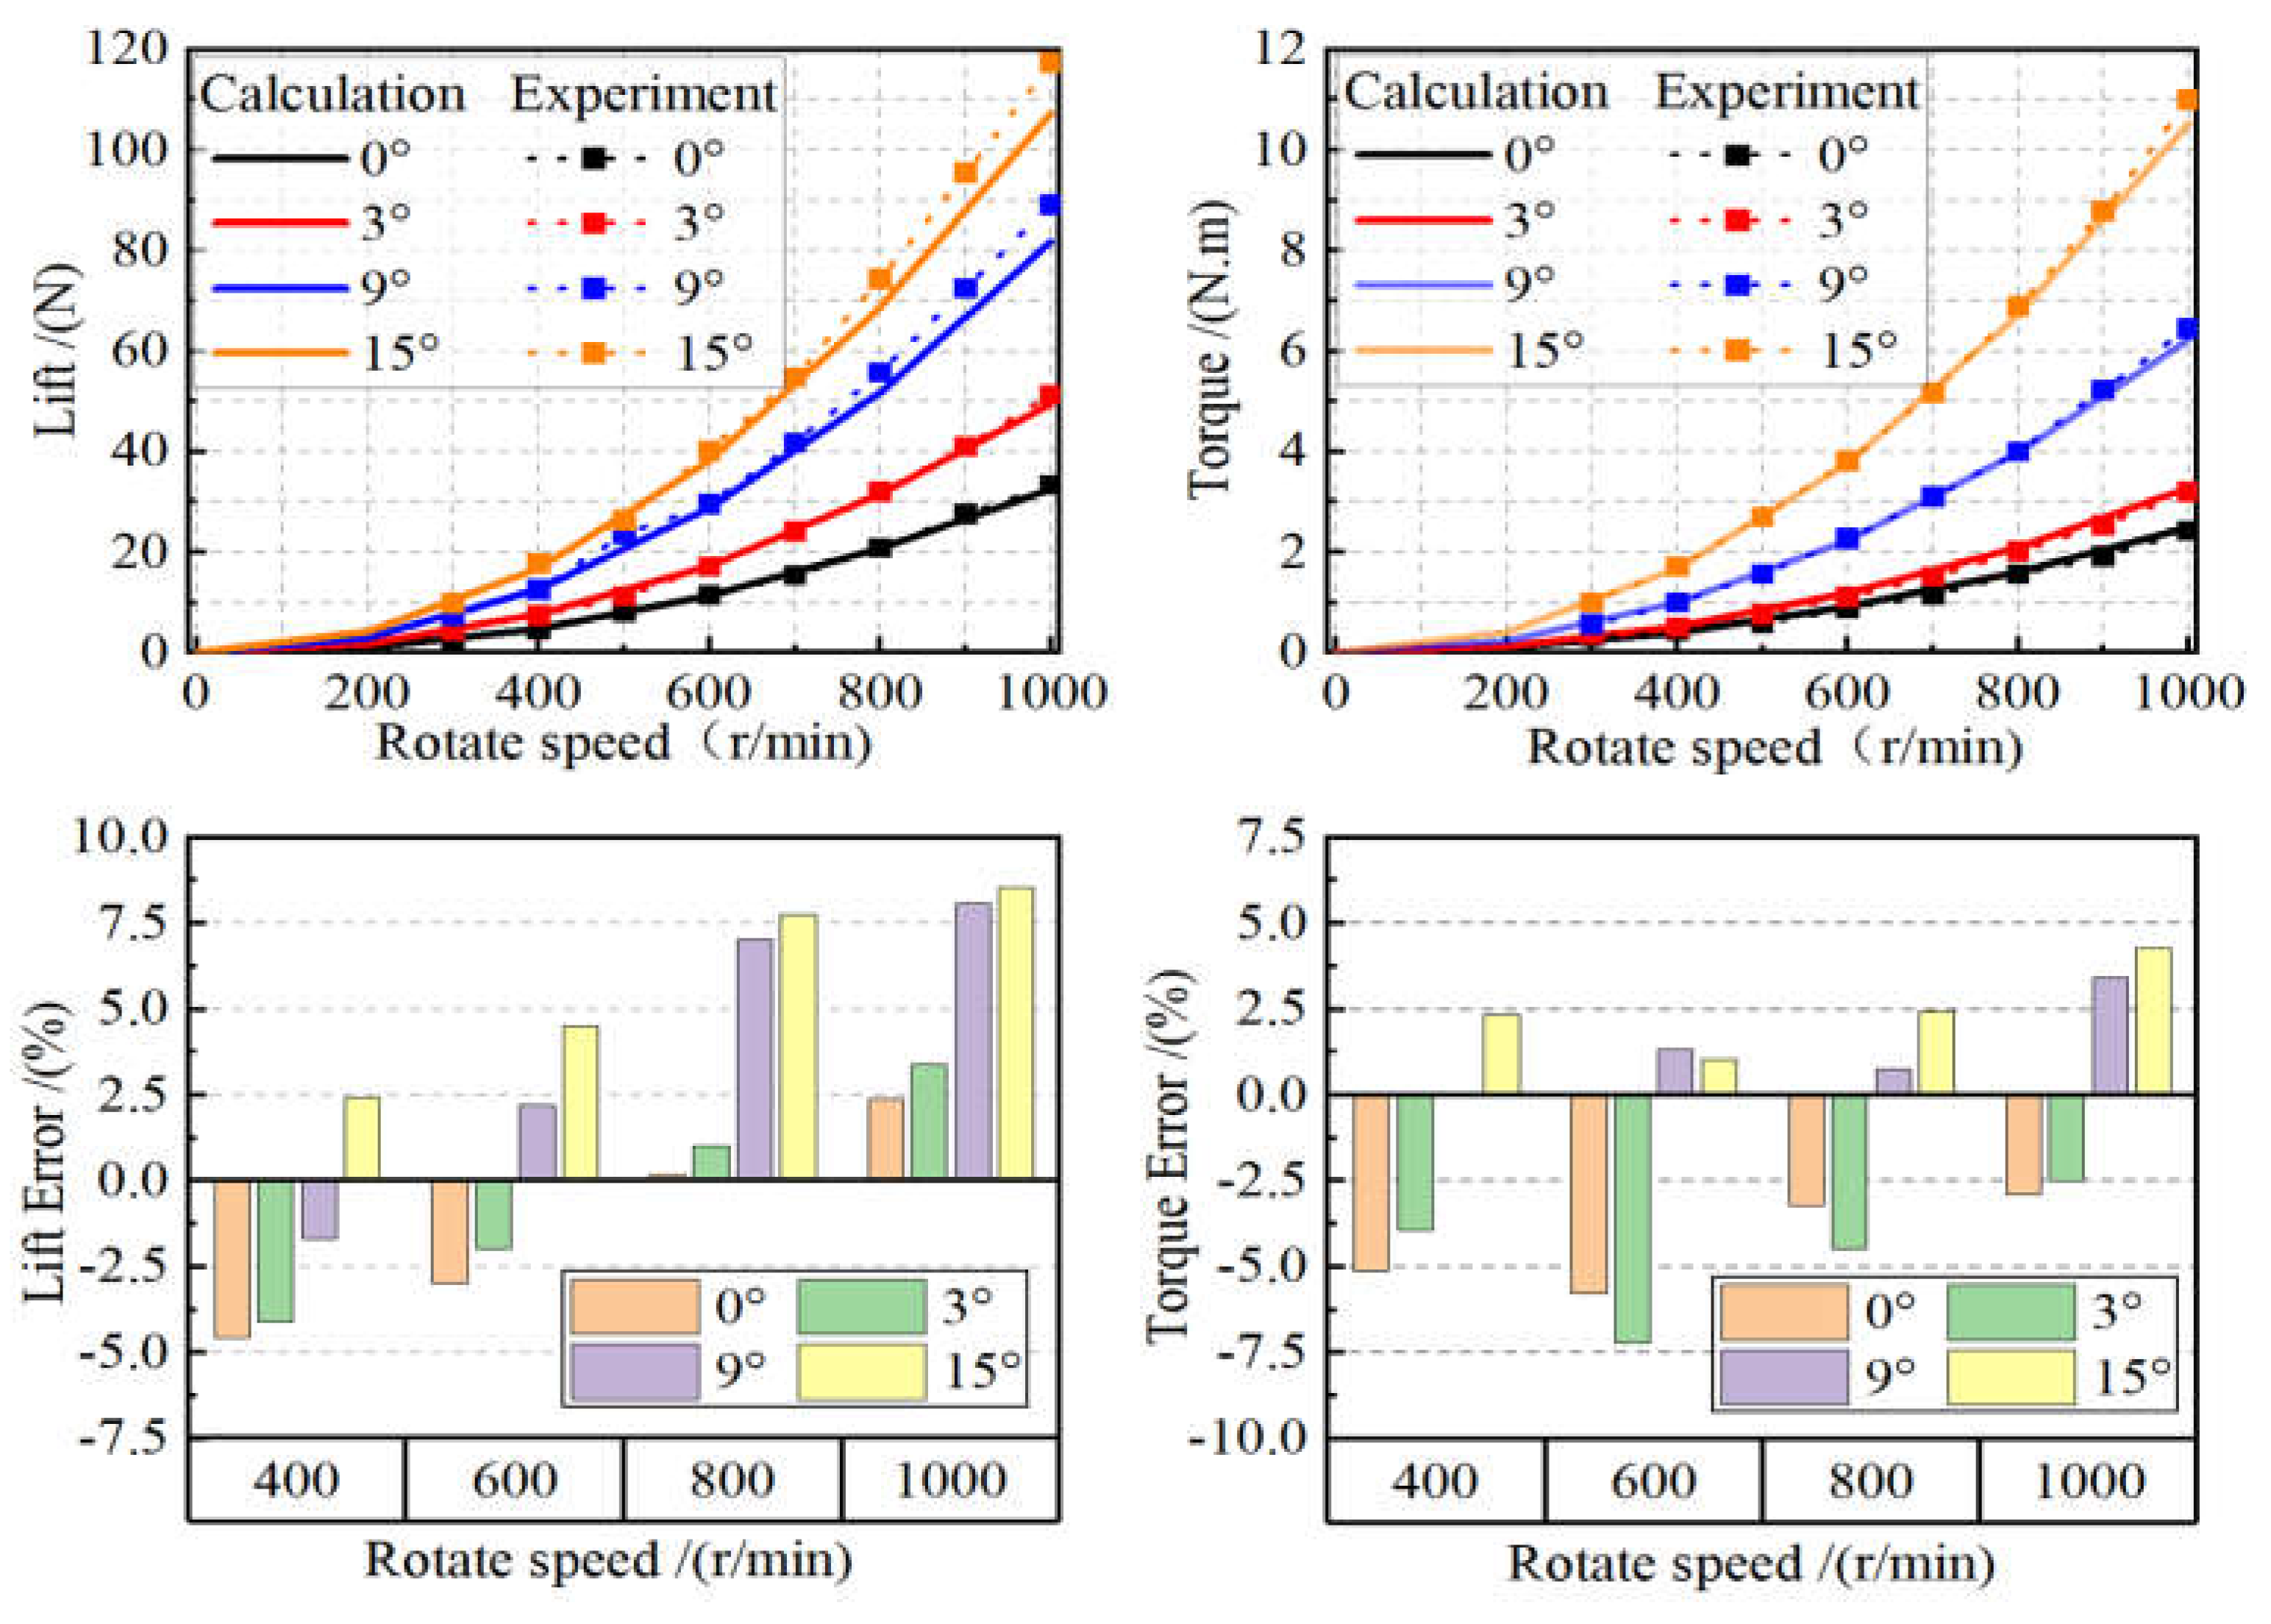
Figure 17.
Rotor aerodynamic performance test experiment simulating the Martian environment.
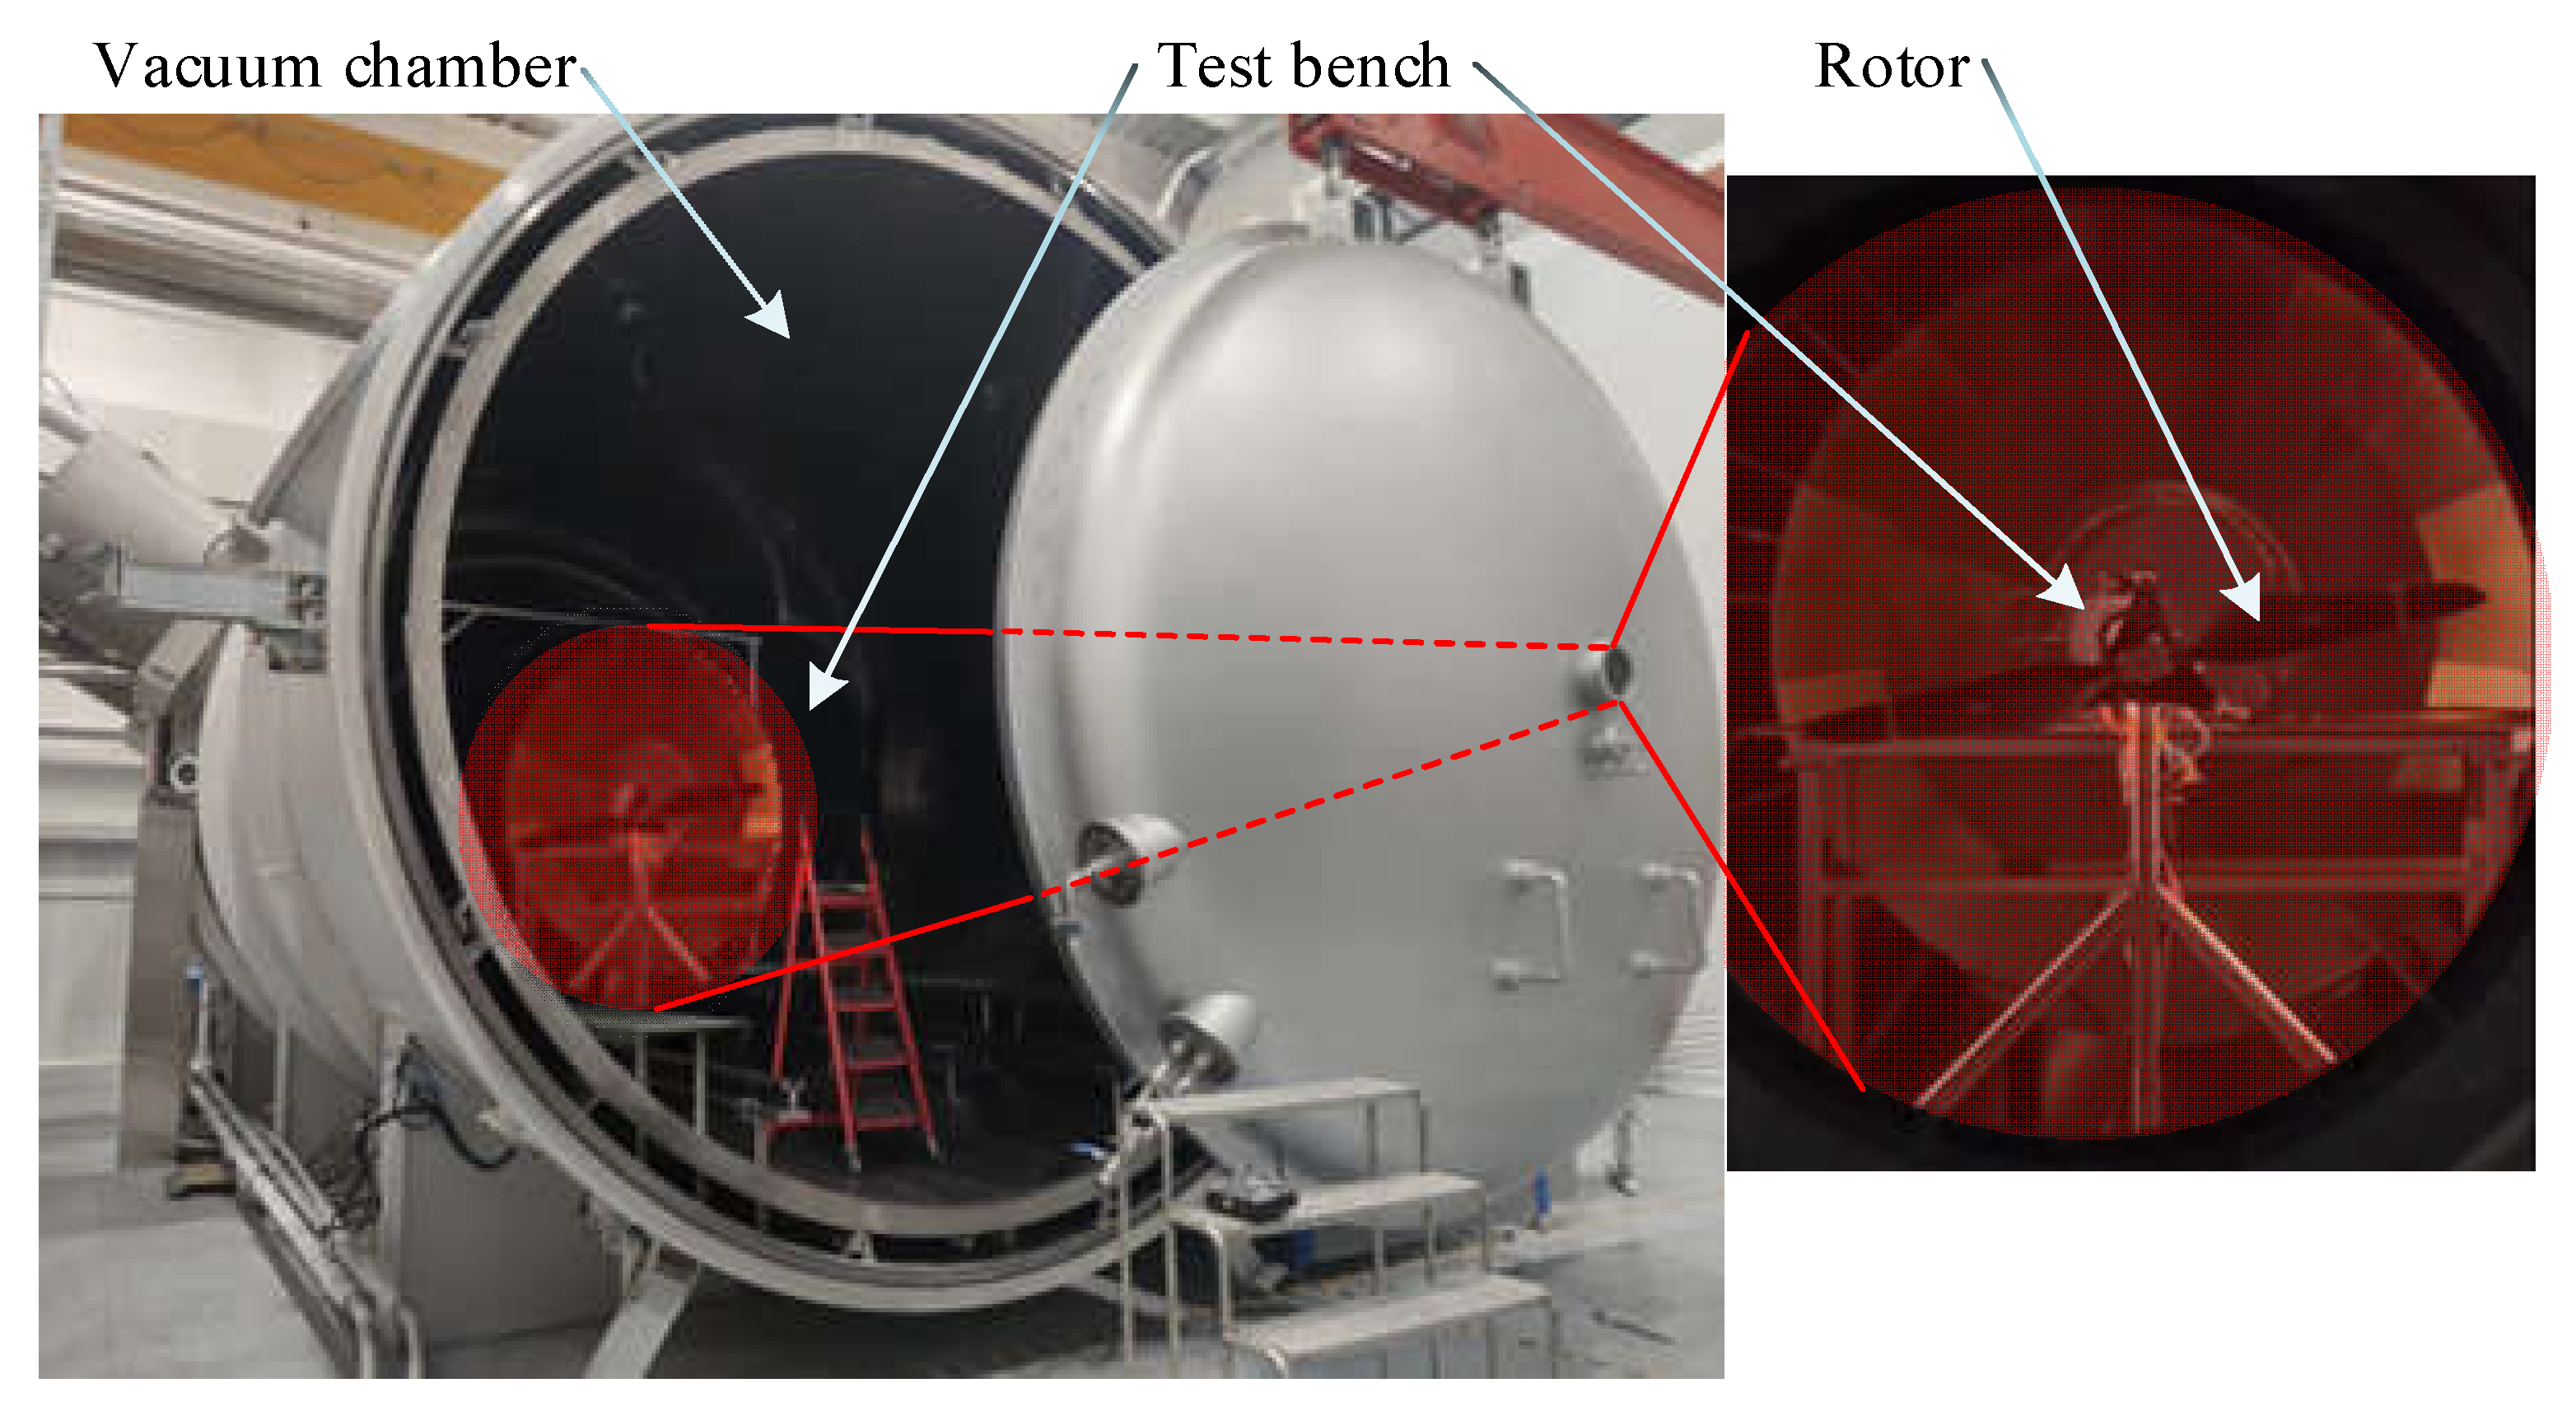
Figure 18.
Analysis of Rotor Aerodynamic Performance Under Simulated Martian Environment.
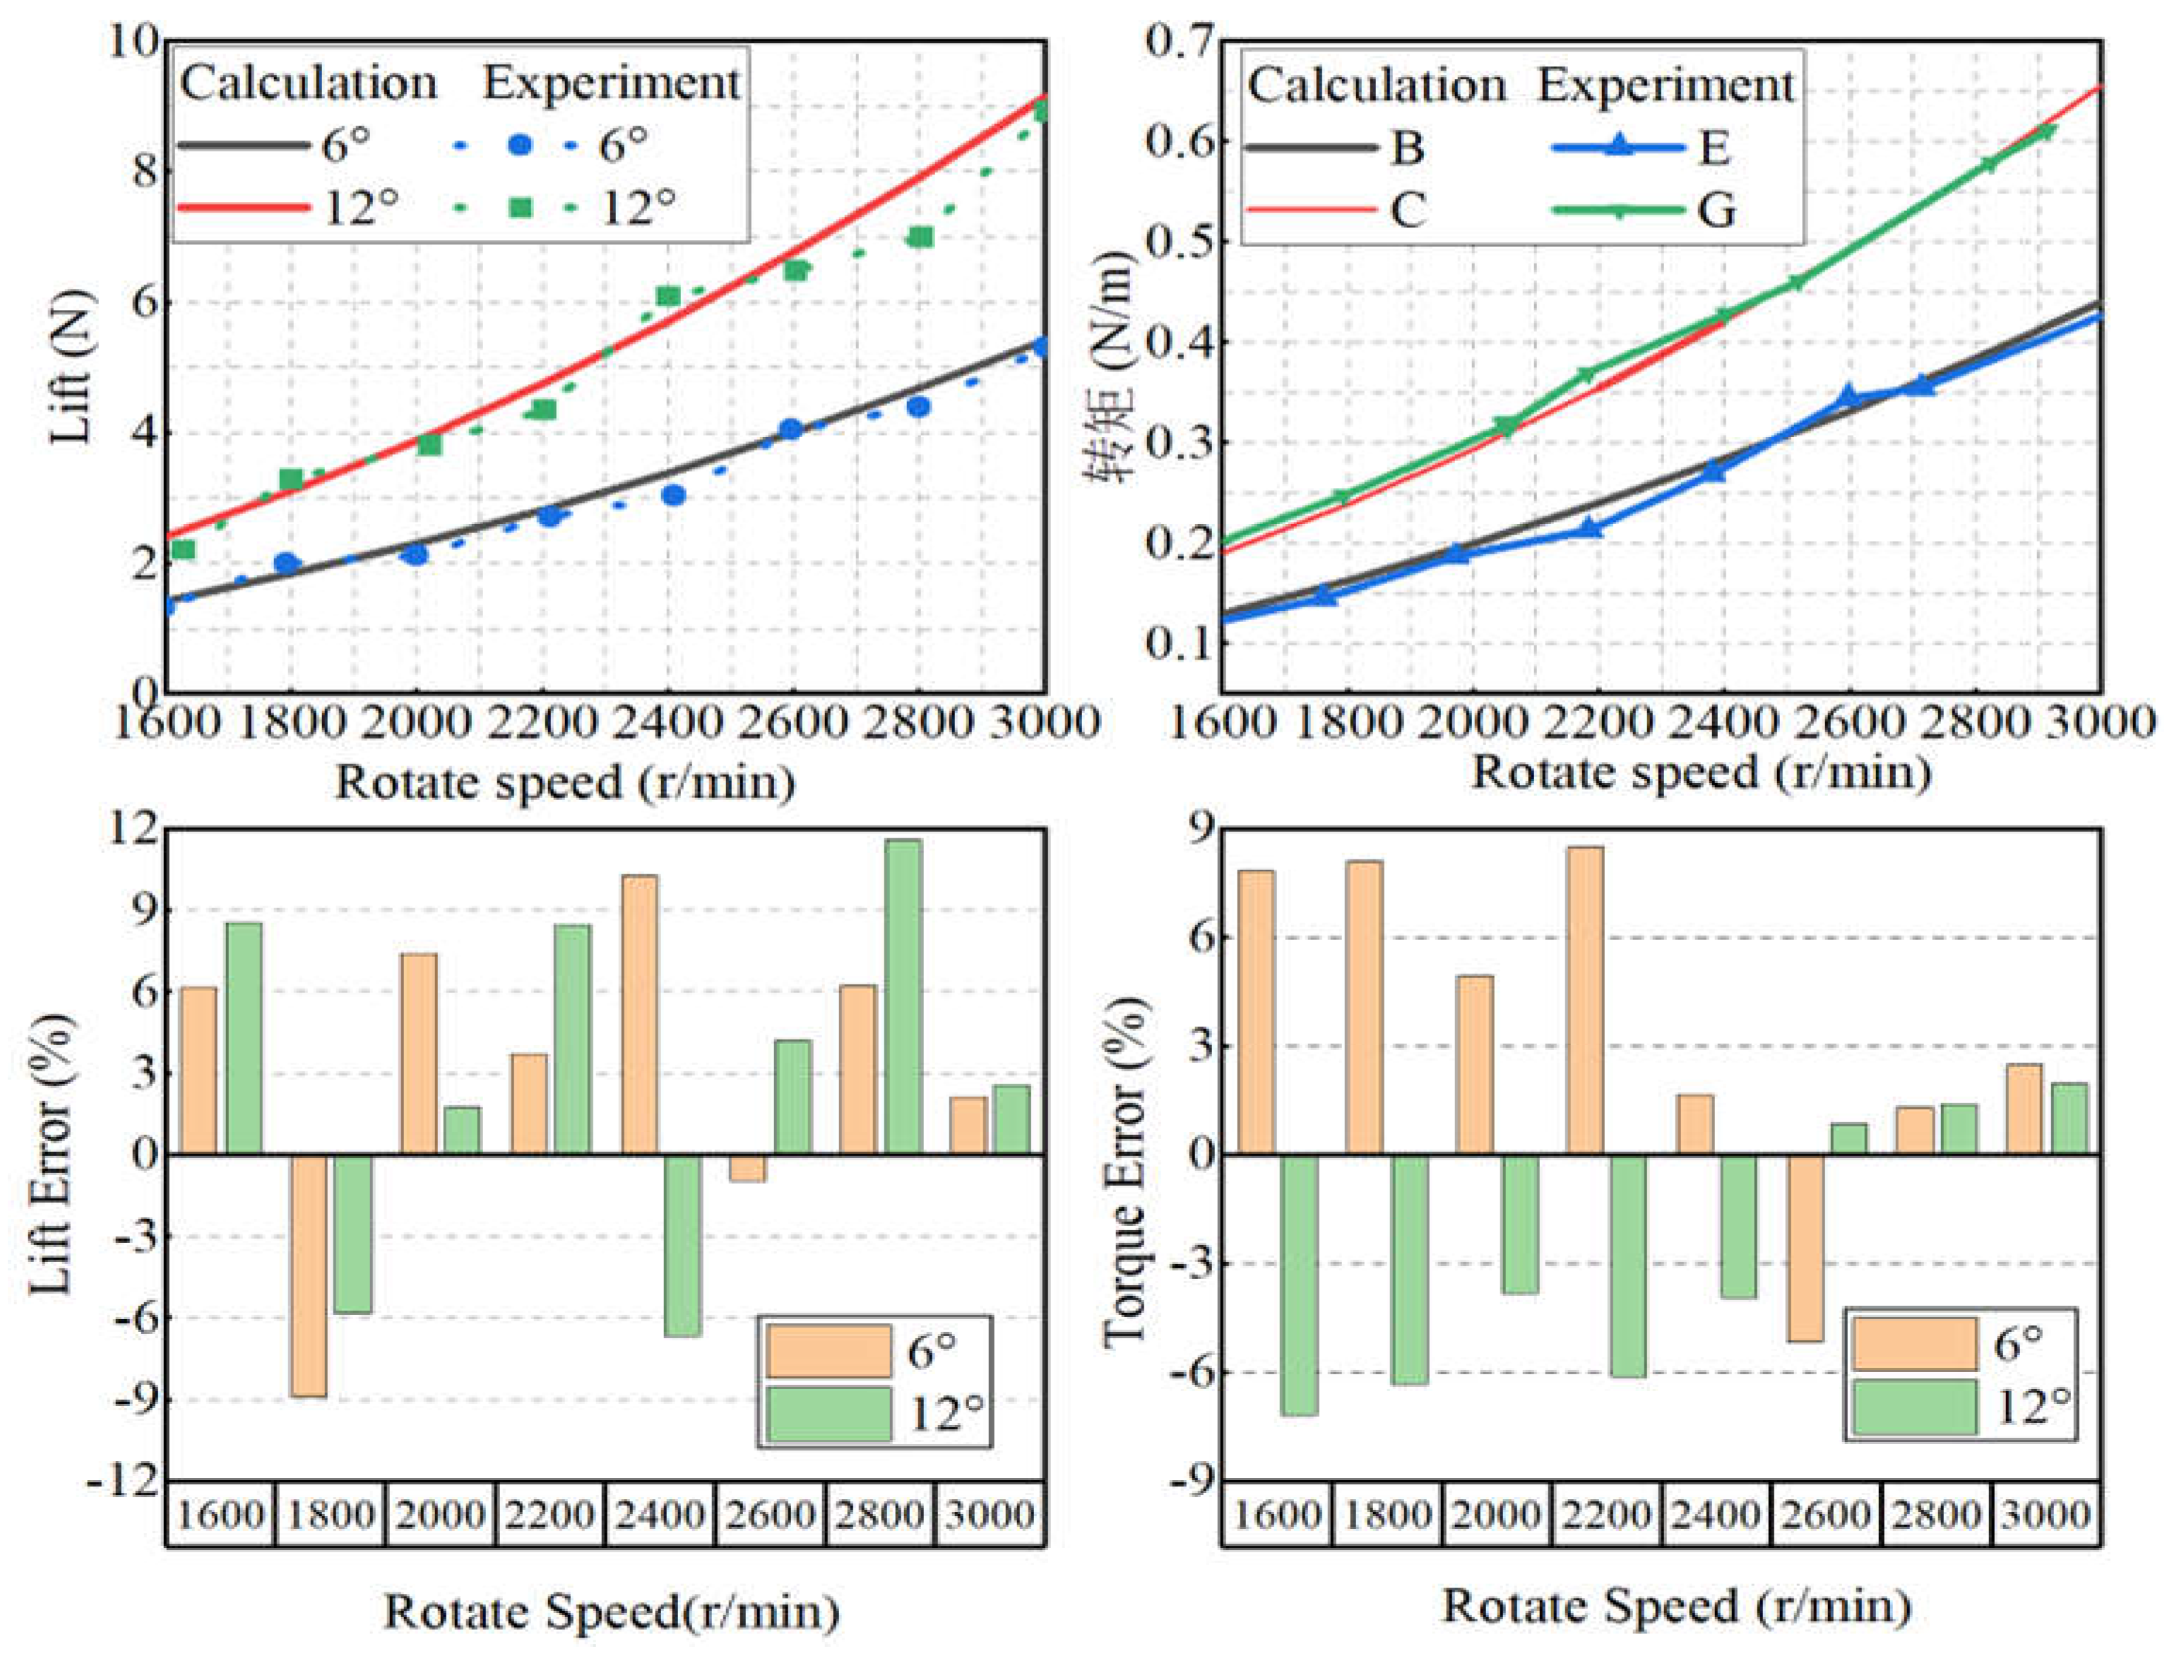
Figure 19.
Process of Coupled Simulation between Fluent and Multibody Dynamics.
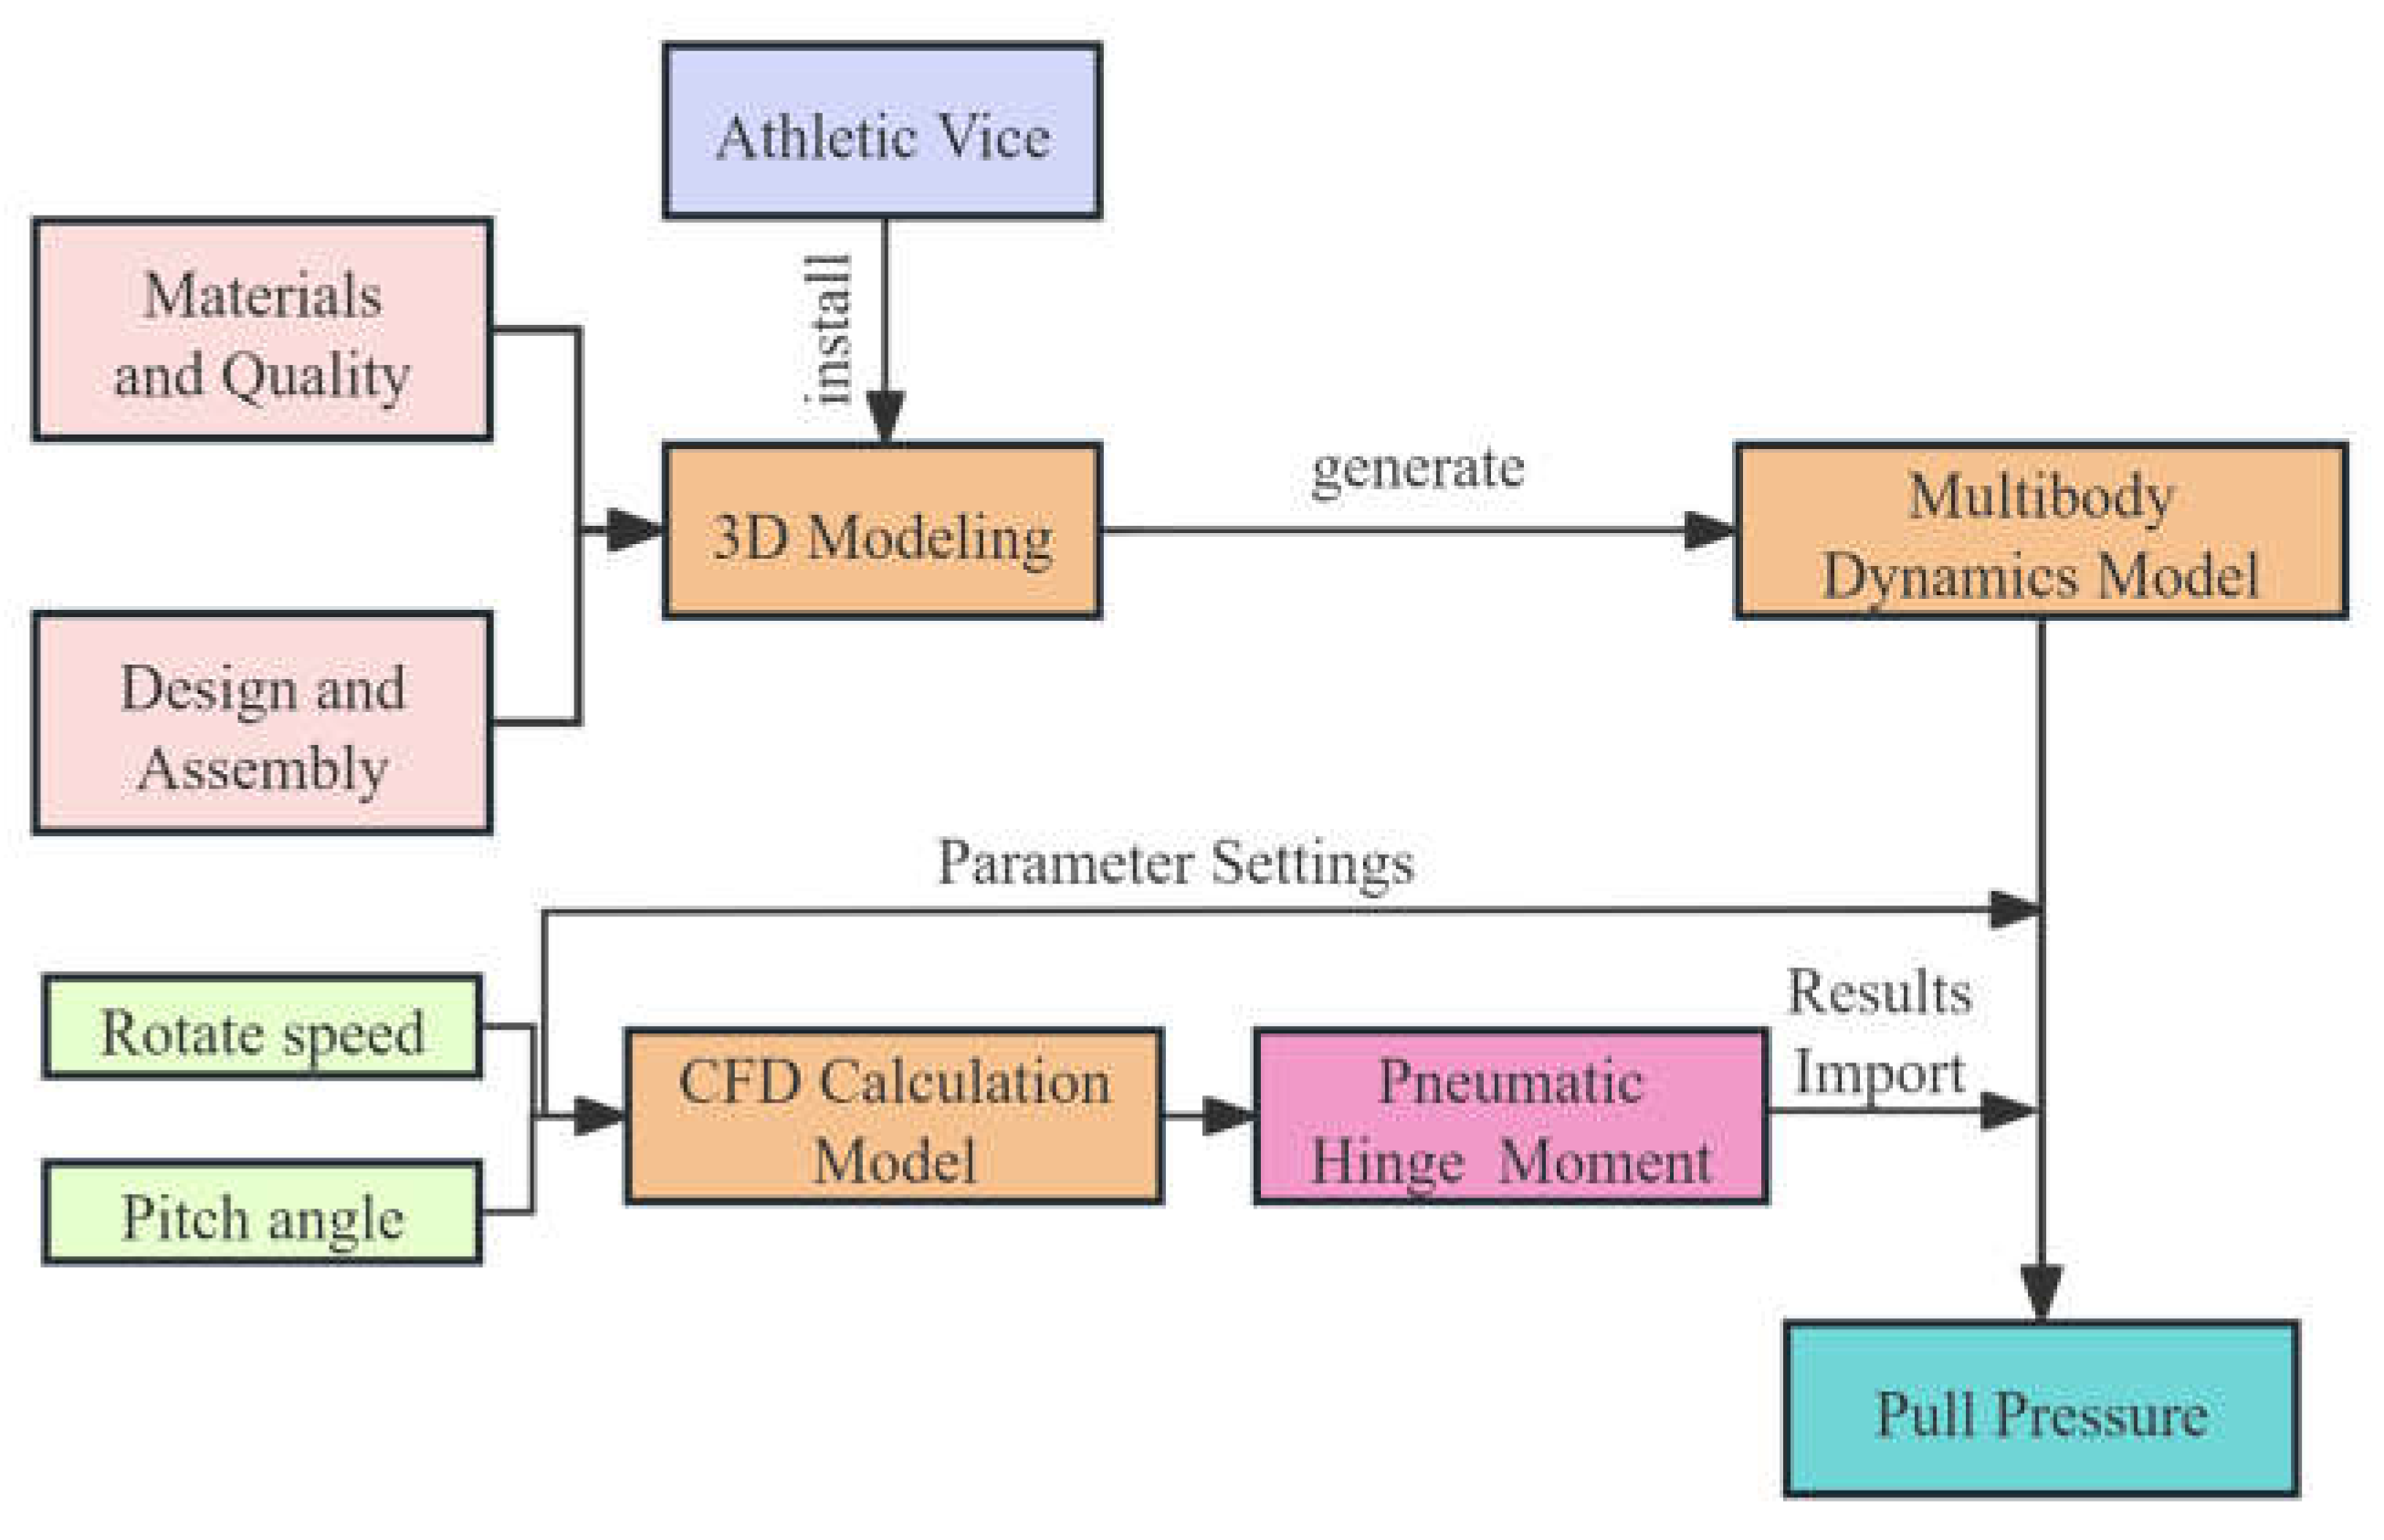
Figure 20.
Comparison and Analysis of Aerodynamic Hinge Moment Test and Simulation.
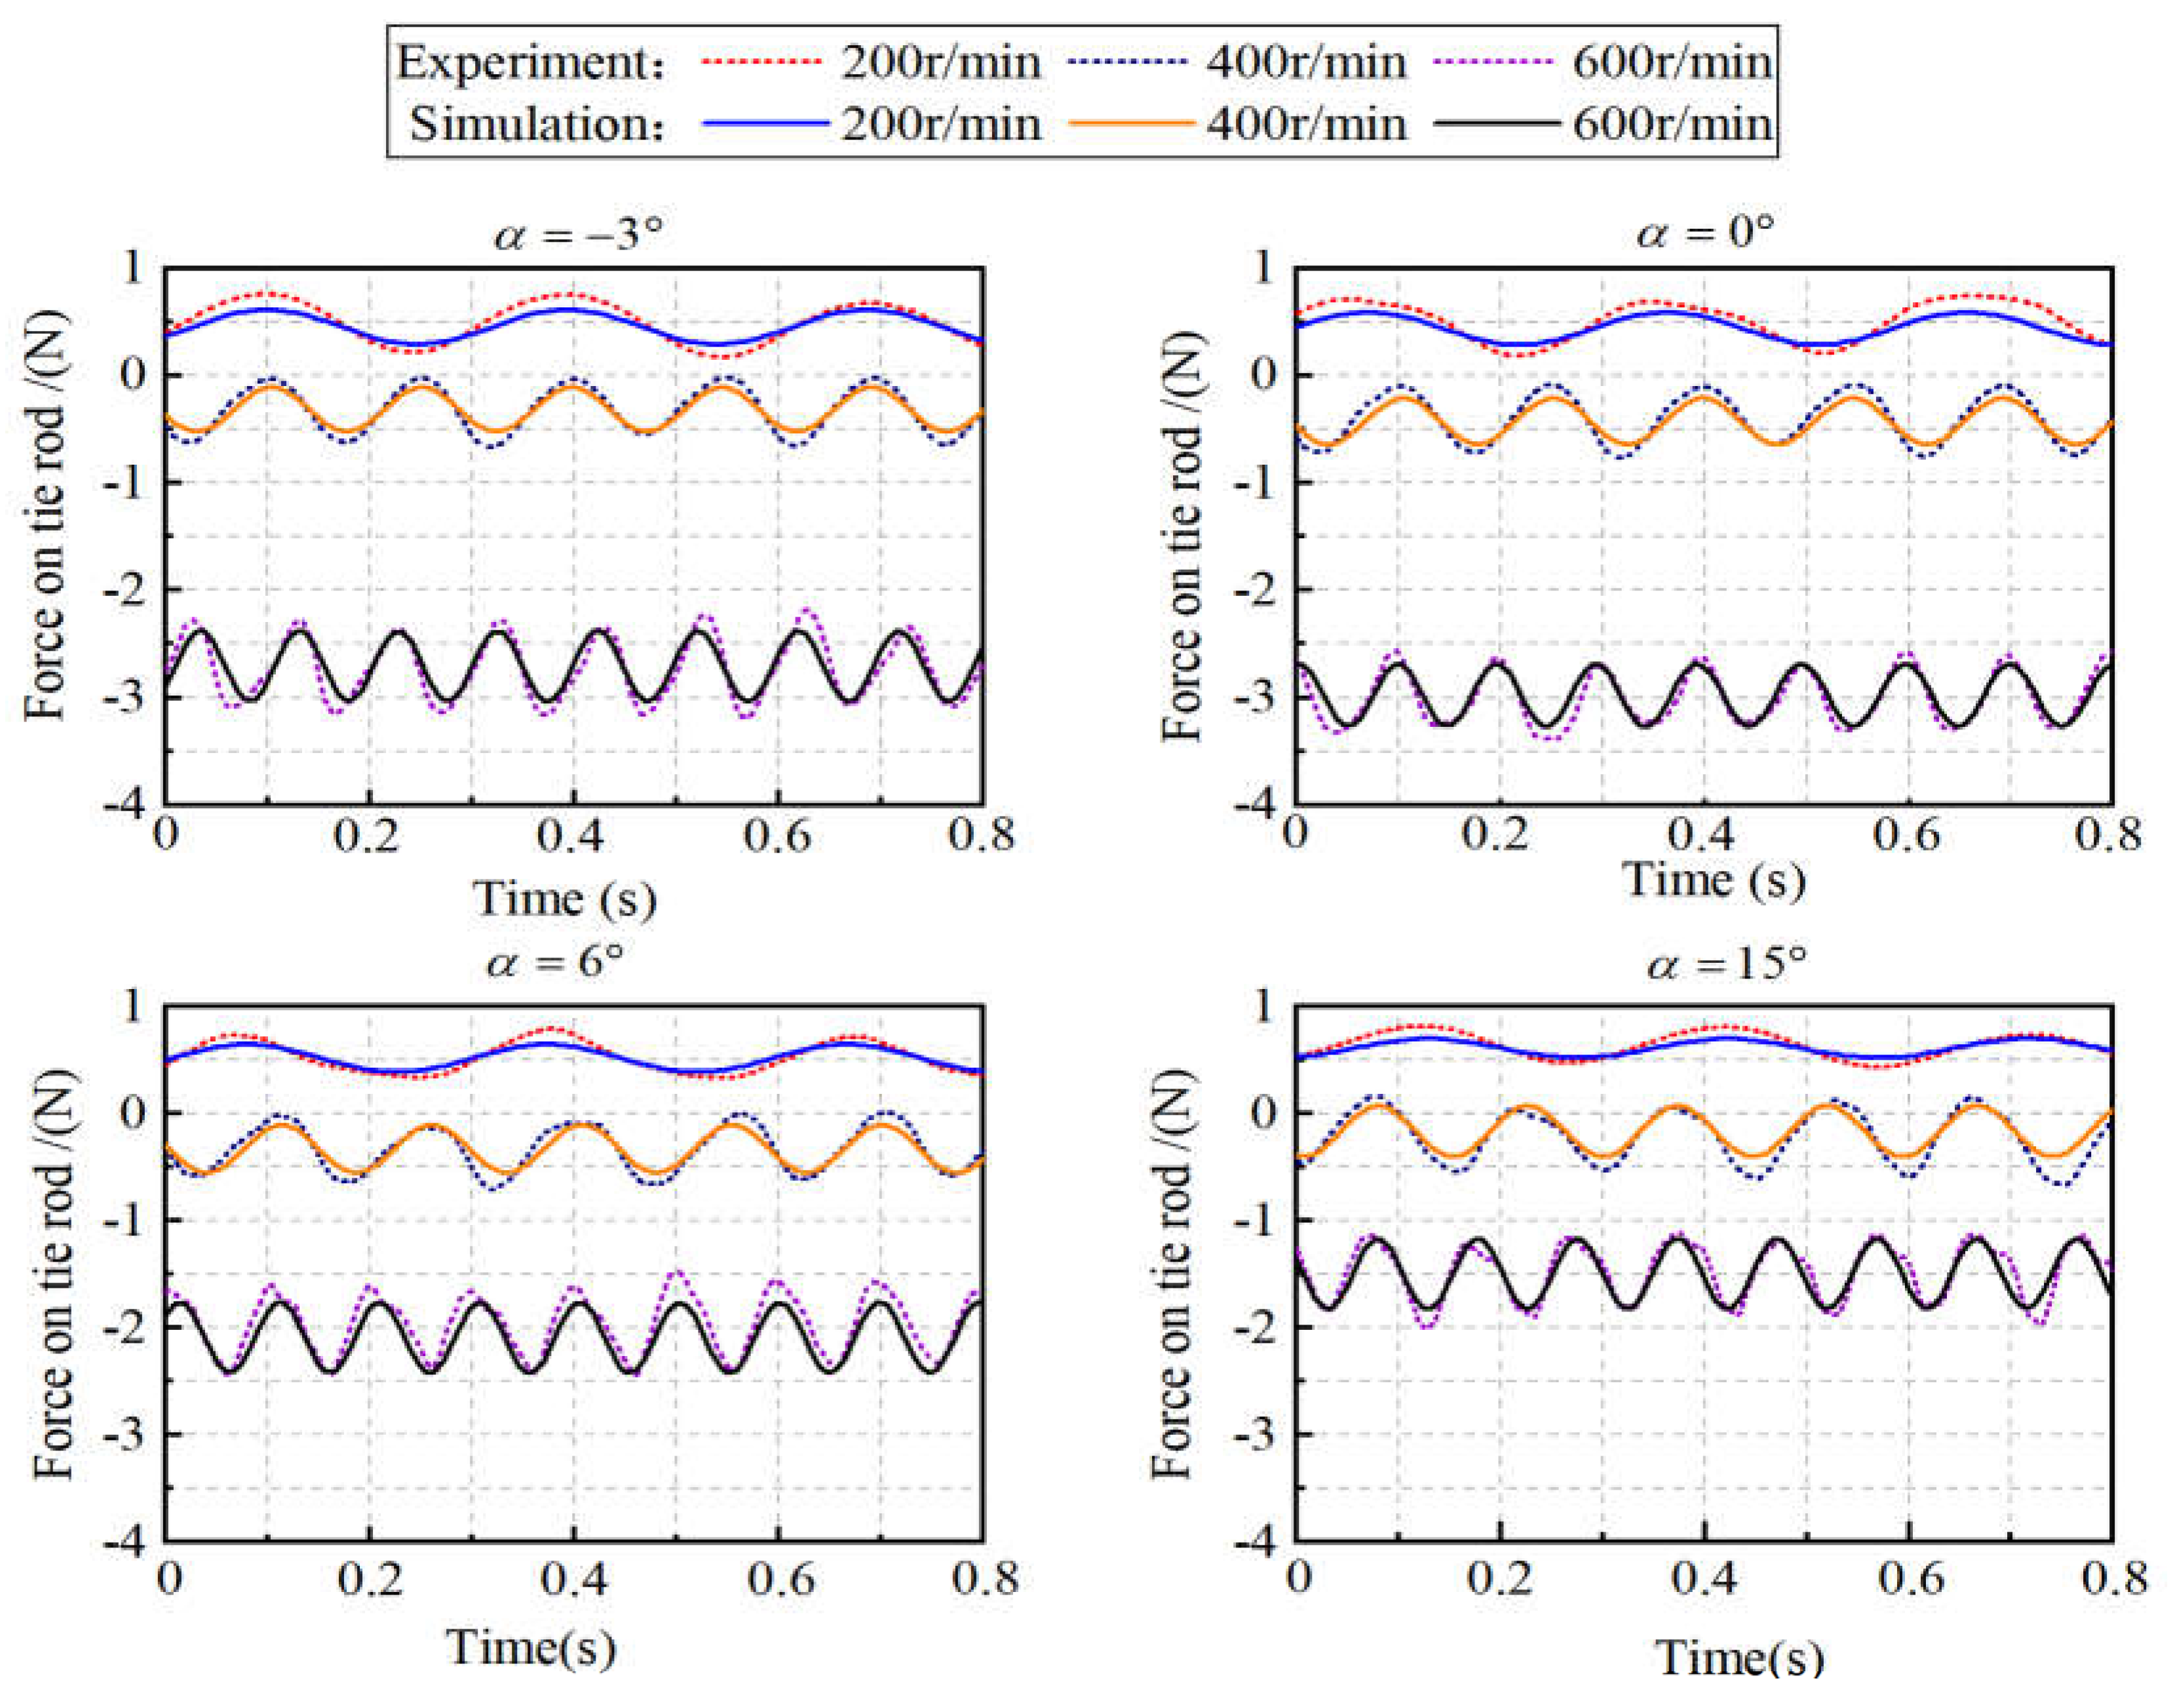
Figure 21.
Error Analysis between Experiment and CFD Numerical Calculation.
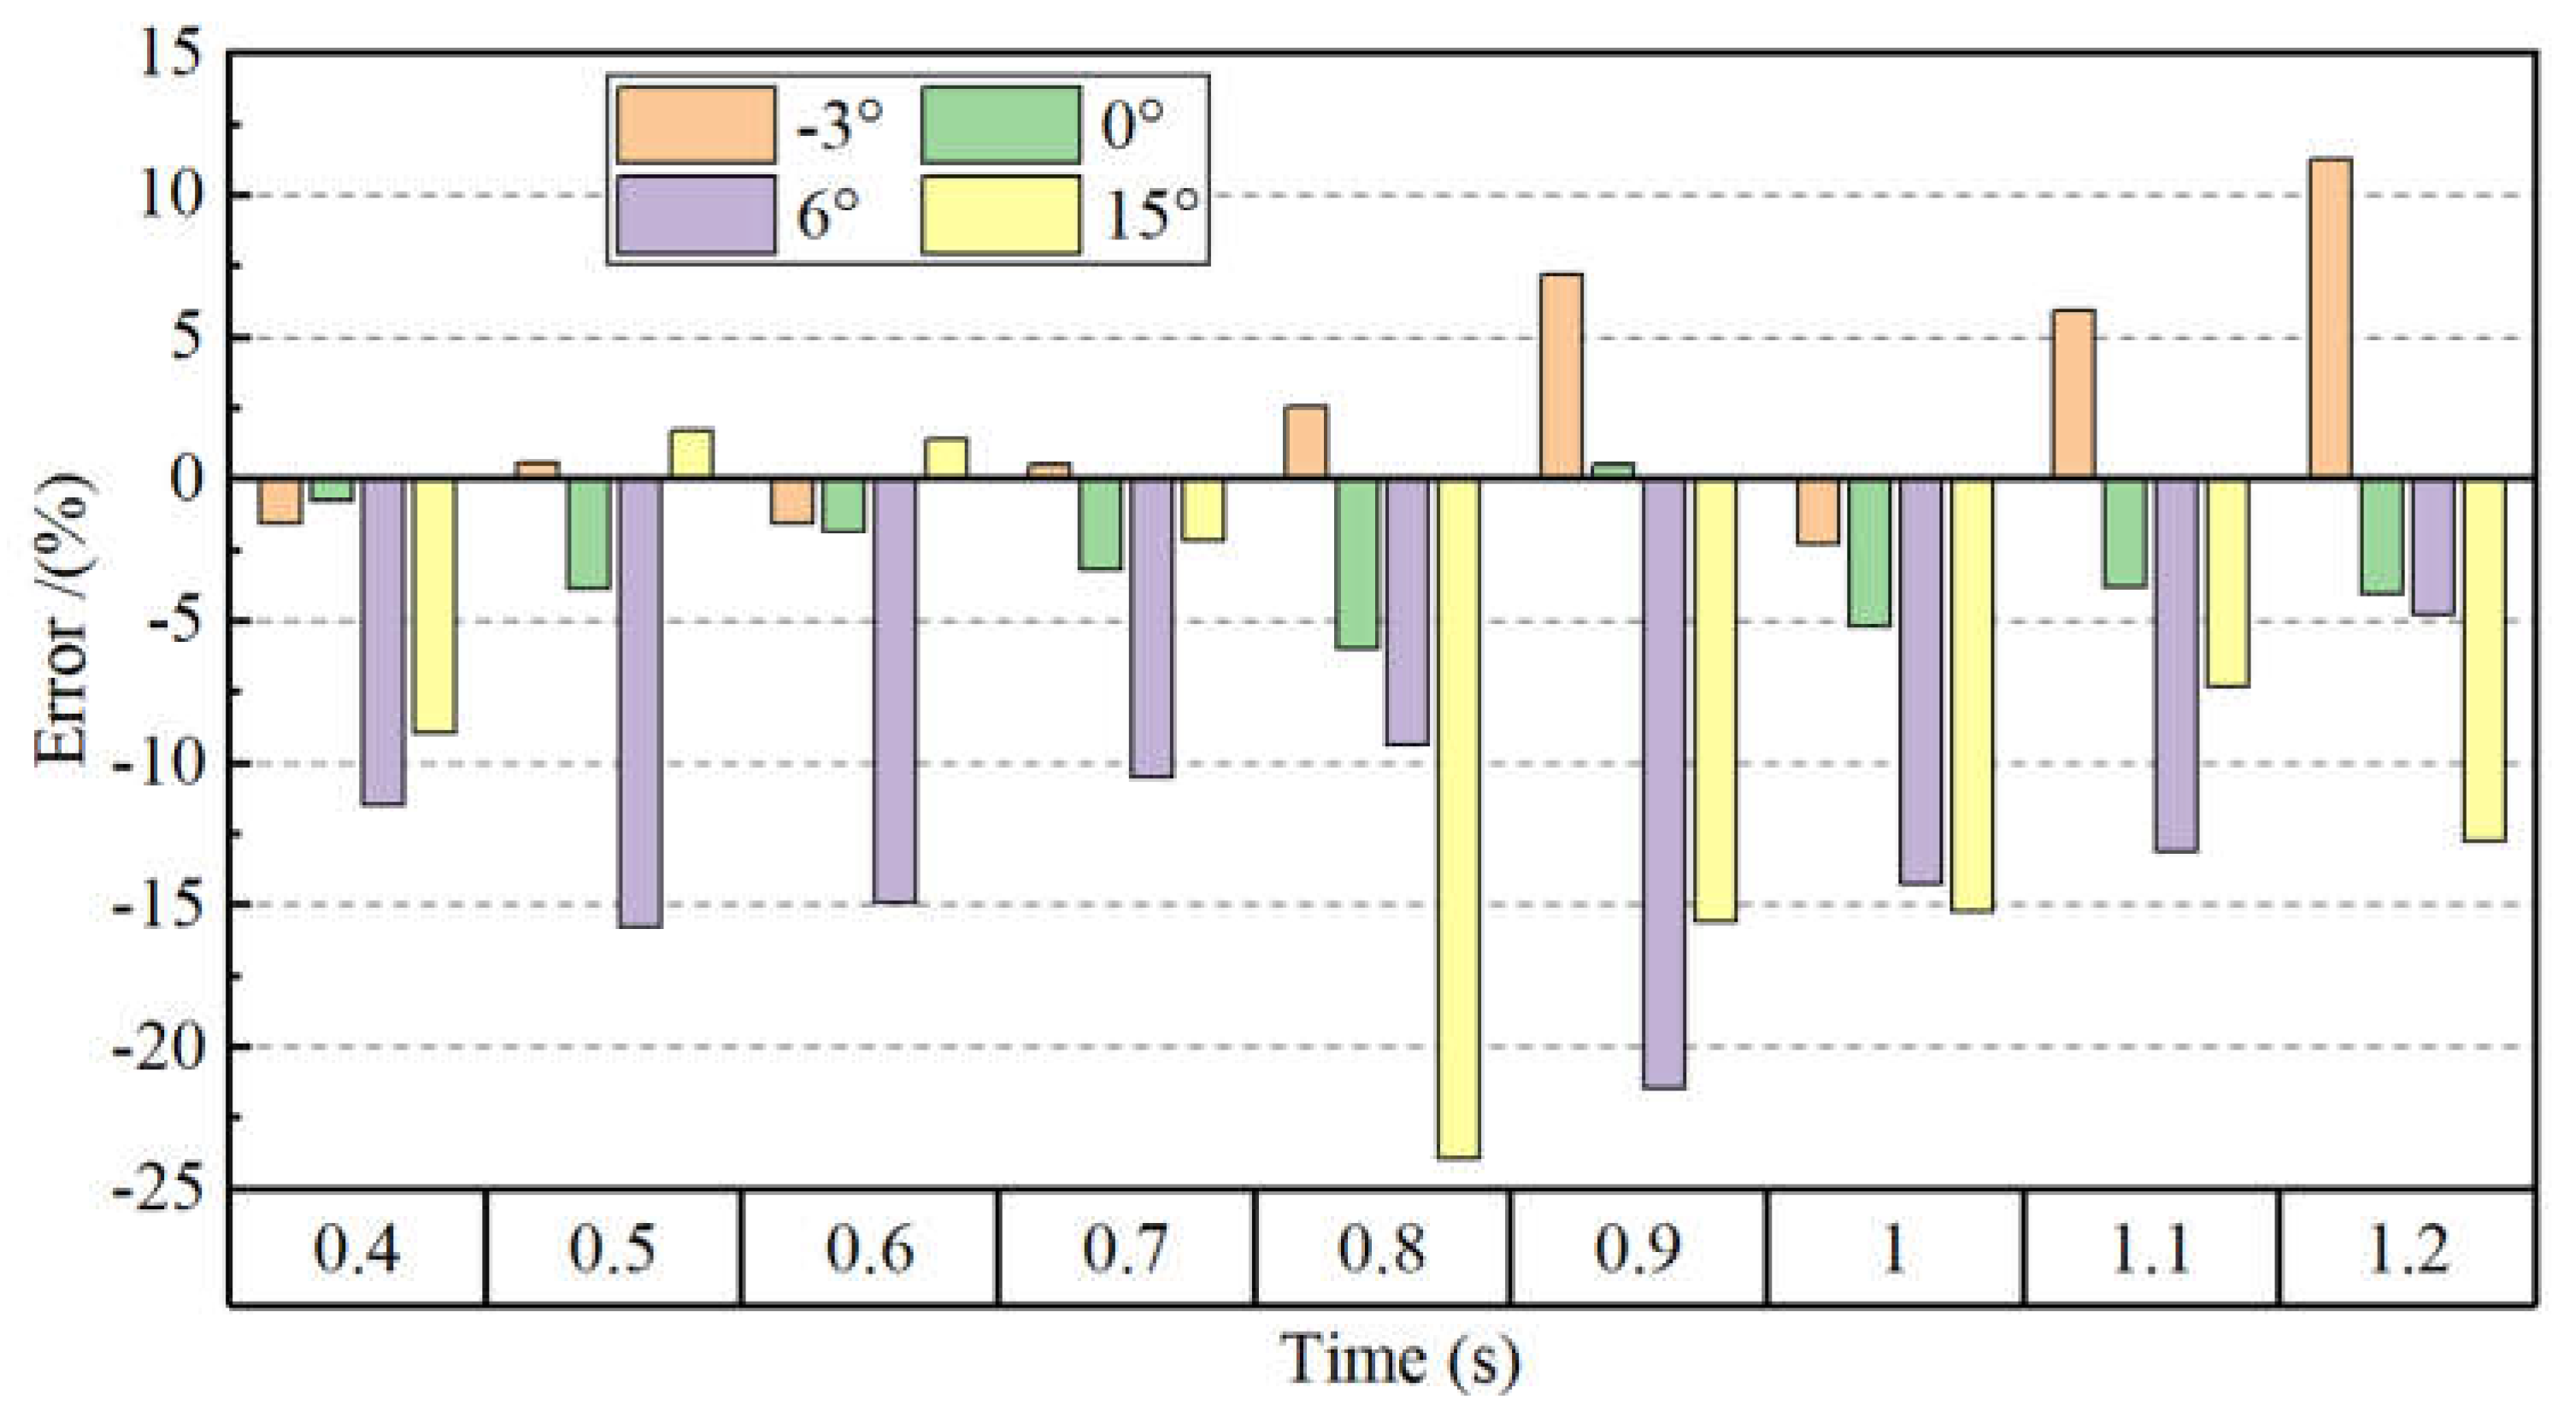
Figure 22.
Comparative analysis of calculation results and literature [31].
Figure 22.
Comparative analysis of calculation results and literature [31].
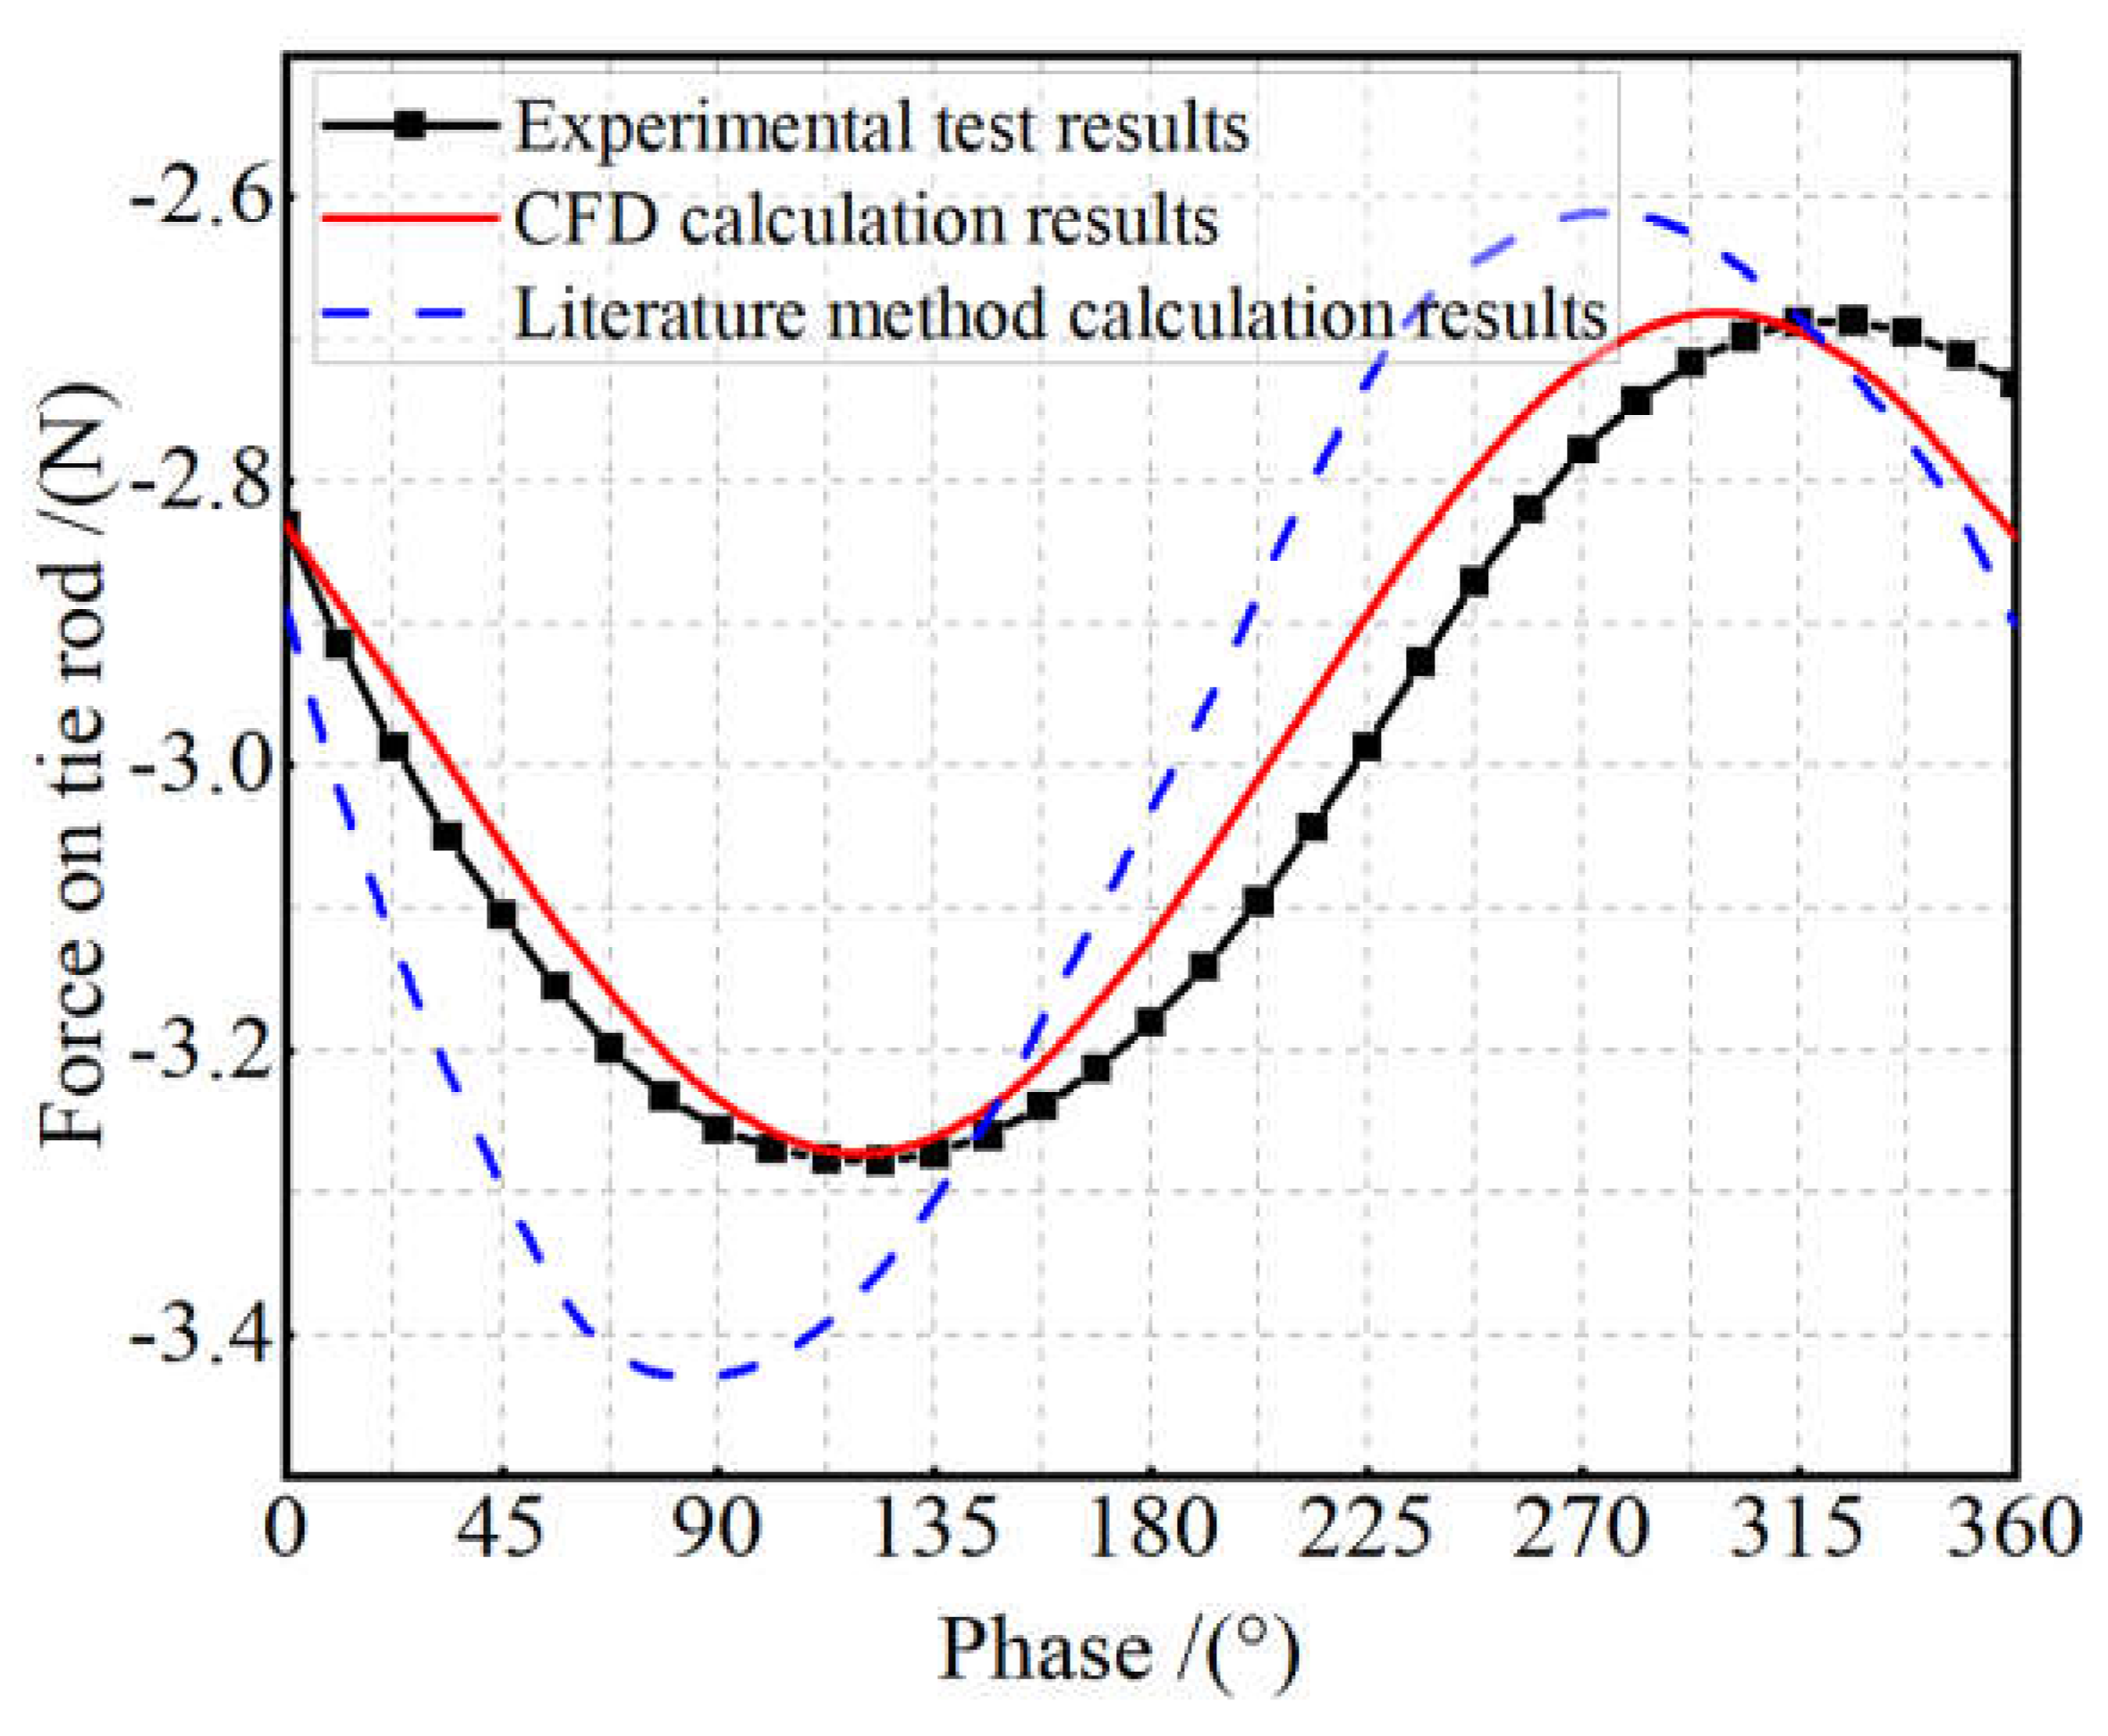

Table 1.
Grid Independence Analysis.
| Grid Quantity (10,000) | Lift (N) | Aerodynamic hinge moment (N.mm) |
Grid Quantity (10,000) | Lift (N) | Aerodynamic hinge moment (N.mm) |
||
|---|---|---|---|---|---|---|---|
| Stationary domain | rotating domain | Stationary domain | rotating domain | ||||
| 391 | 593 | 31.9 | 510.9 | 89 | 593 | 32.3 | 501.3 |
| 245 | 593 | 31.7 | 504.8 | 89 | 271 | 31.9 | 502.8 |
| 170 | 593 | 31.4 | 501.9 | 89 | 199.5 | 31.6 | 502.5 |
| 89 | 593 | 32.3 | 501.3 | 89 | 97.2 | 30.8 | 501.8 |
Table 2.
Pitch angle test situation.
| serial number | Phase / (°) | Pitch angle (error) / (°) |
| 1 | -0.45 | 0.01 |
| 2 | -30.15 | 0.07 |
| 3 | -59.74 | 0.08 |
| 4 | -90.62 | 0.10 |
| 5 | -120.39 | 0.06 |
| 6 | -149.89 | 0.07 |
| 7 | -179.54 | 0.03 |
| 8 | 149.74 | 0.02 |
| 9 | 119.51 | 0.02 |
| 10 | 90.50 | -0.09 |
| 11 | 59.04 | -0.09 |
| 12 | 30.68 | -0.06 |
Table 3.
Comparison of some parameters between Mars and Earth.
| Features | Mars | Earth | Ratio (Mars / Earth) |
| Acceleration of gravity (m/s2) | 3.72 | 9.80 | 38/100 |
| Atmospheric pressure (Pa) | 636 | 101325 | 6.3/100 |
| Sound velocity (m/s) | 240 | 343 | 7/10 |
| Air density (kg/m3) | 0.0118 | 1.17 | 1/100 |
| Mean temperature (°C) | -63 | 15 | |
| viscosity [kg/(m·s)] | 1.289×10⁻⁵ | 1.789×10⁻⁵ | 72.1/100 |
Table 4.
Rotor Aerodynamic Hinge Moment.
| Pitch angle test situation | pitch angle /(°) | Rotor Aerodynamic Hinge Moment / (N.mm) | ||
| 200 r/min | 400 r/min | 600 r/min | ||
| 1 | -3° | 18.26 | 77.20 | 178.27 |
| 2 | 0° | 18.60 | 78.80 | 182.90 |
| 3 | 6° | 13.80 | 58.79 | 136.09 |
| 4 | 15° | 7.48 | 32.27 | 76.51 |
Disclaimer/Publisher’s Note: The statements, opinions and data contained in all publications are solely those of the individual author(s) and contributor(s) and not of MDPI and/or the editor(s). MDPI and/or the editor(s) disclaim responsibility for any injury to people or property resulting from any ideas, methods, instructions or products referred to in the content. |
© 2024 by the authors. Licensee MDPI, Basel, Switzerland. This article is an open access article distributed under the terms and conditions of the Creative Commons Attribution (CC BY) license (http://creativecommons.org/licenses/by/4.0/).
Copyright: This open access article is published under a Creative Commons CC BY 4.0 license, which permit the free download, distribution, and reuse, provided that the author and preprint are cited in any reuse.


