Submitted:
29 April 2024
Posted:
07 May 2024
You are already at the latest version
Abstract
Plant-derived compounds have been historically used for the treatment of various diseases and an important source of several clinically useful anti-cancer agents. The Artemisia annua is known as a medicinal herb that is effective against cancer. Thus, the purpose of this study was to investigate whether ethanol extracts of Artemisia annua could increase an anti-cancer effect against LS174T cells. Our results show that Artemisia annua extracts (AAE) induces apoptosis through the regulation of mitochondria outer membrane potential. We demonstrate that apoptosis is induced by p53-dependent manner when cells were treated with Nutlin-3 (MDM2 inhibitor) and LY294002 (Akt inhibitor). In addition, the apoptotic effect was also observed in the p53-independent manner through pifithrin-α (p53 inhibitor) and celecoxib (COX-2 inhibitor) treatment. As in in vitro, AAE induced apoptotic effects and regulated apoptosis-related proteins in LS174T xenograft model. Taken together, these results suggest that Artemisia annua extracts exerts an anti-cancer effect through p53-independent manner, as well as p53-dependent manner by p53´ translocation in LS174T colon cancer cells.
Keywords:
LS174T
; mitochondrial apoptosis
; Artemisia annua
; p53 translocation
1. Introduction
Cancer is a disease of uncontrolled cell growth or proliferation. Cancer is caused by tobacco, unhealthy diet, inherited genetic mutations, hormones and immune conditions. Colorectal cancer is the third leading cause of death in both men and women [1,2]. Apoptosis, or programmed cell death, is essential for cell mechanism and plays an important role in cancer treatment.
Apoptosis is induced via two main signaling pathways, the extrinsic and intrinsic pathways [3]. The extrinsic pathway, which is called the death receptor pathway, is triggered by ligation of death receptors that are located on the cell membrane. Activation of death receptors induces caspase-3, 6 and 7 that are activated by caspase-8 and 10 [4,5]. The intrinsic pathway, which is called the mitochondrial pathway, is regulated by the Bcl-2 family and mediated through the release of proteins, such as cytochrome c, because of the process of mitochondrial outer membrane permeability (MOMP) [6,7].
The tumor suppressor, p53, contributes to the transcriptional activation of a number of genes, including the pro-apoptotic protein Bax [8]. Bax and Bak undergo extensive conformational changes to form homo- and hetero-oligomeric pores, which leads to the release of cytochrome c from mitochondria into cytosol. The release of cytochrome c enhances caspase activation and induces apoptosis [9,10]. p53 can also translocate into the mitochondria during apoptosis. Localization of p53 in the mitochondria promotes permeabilization of the outer mitochondrial membrane, cytochrome c release and caspase activation [11,12].
Akt, also known as protein kinase B, is a serine/threonine-specific protein kinase that plays a major role in various cellular processes such as cell proliferation, survival/apoptosis, angiogenesis and metabolism [13,14]. Previous studies have shown that activated Akt can adjust the phosphorylation and movement of Murine Double Minute 2 (MDM2) into the nucleus where it binds to p53. MDM2 is a principal mediator of cell proliferation and apoptosis by inhibiting the p53 tumor suppressor [15,16,17]. The inducible isoenzyme cyclooxygenase-2 (COX-2) is important in inflammation, angiogenesis and tumorigenesis [18]. The overexpression of COX-2 has been associated with resistance to apoptosis in many different cell types [19,20]. Some cancer treatments involve surgery, radiotherapy and chemotherapy, but cause problems. These treatments can lead to cytotoxicity, as well as side effects for normal cells, and can cause tolerance to anticancer drugs because of continuous use [21,22]. Artemisia annua L., known as sweet wormwood, belongs to the plant family of Asteraceae and has been used in traditional Chinese herbal medicine to treat malaria and fever. The ethanolic extracts of A. annua is known to have effects on anticancer activity [23,24].
In the present study, we investigated the effects of Artemisia annua extracts (AAE) on apoptosis in LS174T colon cancer cells in vitro and in vivo. Our results indicate that AAE induces apoptosis-mediated p53-independent manner, as well as p53-dependent manner through p53's translocation to mitochondria.
2. Results
2.1. AAE Suppresses Cancer Cell Proliferation on LS174T Colon Cancer Cells
To determine the cytotoxic effects on LS174T and fibroblast cells, the cells were treated with different concentrations of AAE (10-100 μg/ml) and evaluated by a MTT assay. As shown in Figure 1a, no significant toxicity was observed in the fibroblast cells because the cells viability remained above 90 % when compared with the control. We treated LS174T cells with AAE (10-100 μg/ml) for 12-48 h and confirmed that AAE inhibited the proliferation of cells in dose and time-dependent manners (Figure 1b). We also investigated the cytotoxic effects through the LDH release assay. Figure 1c showed that LDH release increased in the culture medium of apoptotic cells in dose and time-dependent manners. Figure 1d shows morphological changes to LS174T cells after AAE treatment for 12-48 h. The phase contrast images reveal that AAE induced cell shrinkage and formation of floating cells in dose-time dependent manners. These results indicated that AAE exerted an anti-proliferative effect on LS174T. In the fibroblast cells, however, AAE had no effect on cellular viability.
2.2. AAE Induces Apoptosis in LS174T Colon Cancer Cells
To determine whether the decrease in cell viability, mediated by AAE, was a result of apoptosis, we performed the Annexin V/PI and Hoechst 33342 staining. As shown in Figure 2a, the apoptotic DNA fragmentation increased in a dose dependent manner when the cells were treated with AAE (40-80 μg/ml). Figure 2b shows that the dots shifted to the late apoptotic/dead cells (UR) when cells were treated with the high concentration of AAE. These experimental results demonstrate that AAE induced apoptosis of LS174T cells.
2.3. AAE Reduces Mitochondrial Membrane Potential and Regulates the Expression of Mitochondria-Mediated Apoptotic Proteins
To examine how AAE induces apoptosis, we analyzed the mitochondrial membrane potential by using a Muse™ MitoPotential Kit. As shown in Figure 3a, the treatment with AAE (40-80 μg/ml) resulted in an increased depolarized/live percentage, showing loss of mitochondrial membrane potential. Generally, the mechanism of mitochondrial membrane potential regulates cytochrome c, which initiates caspase cleavage and activation of caspase-3/7. We demonstrated that AAE-induced caspase-3/7 activation is dose dependent (Figure 3b, c). Western blot analysis shows the expression of PARP, p-MDM2, COX-2, p-Akt, p53 and apoptosis-related proteins such as Bax, Bak, Bcl-2, Bcl- XL, Bim. Our results showed that the expression of cleaved-PARP, p53, Bax, Bak and Bim significantly increased while the expression of PARP, p-MDM2, COX-2, p-Akt, pro-caspase-3, Bcl-2, Bcl- XL decreased when cells were treated with AAE (40-80 μg/ml) (Figure 3d).
2.4. AAE Induces Apoptosis through p53-Dependent Manner
To confirm inhibition of cell proliferation and the induction effect of apoptosis, cells were treated with LY294002 (Akt inhibitor) or Nutlin-3 (MDM2 inhibitor) prior to incubation with AAE. We used the MTT assay to measure the inhibitory effect of tumor cell proliferation when the inhibitor is treated (Figure 4a). The effect of inhibitor treatment was similar to the treatment of AAE alone, and it was confirmed that the cell proliferation effect was larger than when the cells were treated with the inhibitors and the AAE co-treated group. It was also confirmed that the apoptosis was induced by inhibiting p-Akt and p-MDM2 through LDH release assay and Annexin V staining (Figure 4b, c). To examine how AAE induces apoptosis, we analyzed the mitochondrial membrane potential by using a Muse™ MitoPotential Kit and Muse™ Caspase-3/7 Assay Kit. An increase in the depolarized/dead, apoptotic/dead percentage when treated with an inhibitor alone or in combination means a decrease in mitochondrial membrane potential (Figure 4d, e). Figure 4f represents an experiment analyzed through use of the western blot to identify the correlation between several proteins-related apoptosis. Expression of p53, Bax, Bak, and Bim proteins was increased compared to the control when treated with LY94002 and Nutlin-3. These results suggest that AAE induces the apoptosis in a p53-dependent manner.
2.5. AAE Induces the Translocation of p53 to Mitochondria
Figure 5a shows the results of confirming the amount of protein expression in cytosol and mitochondria. When AAE was treated, the translocation of p53 from the cytosol to the mitochondria was induced. The pro-apoptotic proteins were significantly decreased and anti-apoptotic proteins were increased in mitochondrial fractions exposed to AAE treatment compared with the untreated control group. Also, the amount of p53 expression was increased in mitochondria. To investigate translocation of cytochrome c and p53, immunofluorescence was performed (Figure 5b, c). These results indicate that cytochrome c migrates from the mitochondria to the cytosol and p53 translocates from the cytosol to the mitochondria.
2.6. AAE Induces Apoptosis through p53-Independent Manner
To determine if AAE can induce apoptosis in the absence of p53, cells were treated with pifithrin-α (p53 inhibitor) or celecoxib (COX-2 inhibitor) prior to incubation with AAE. We used the MTT assay to measure the inhibitory effect of tumor cell proliferation when the inhibitor is treated (Figure 6a). When treated with pifithrin-α, there was no difference compared to the control, and when treated with celecoxib, we confirmed the inhibitory effect of cell proliferation. In the case of inhibition of p53 and COX-2, LDH release assay and Annexin V/PI staining revealed that apoptosis was induced in the AAE alone treatment group, co-treatment group and celecoxib treatment group (Figure 6b, c). We also used the Muse™ MitoPotential Kit and Muse™ Caspase-3/7 Assay Kit to determine the percentage of the depolarized/dead and apoptotic/dead cells in the AAE alone treatment group, co-treatment group and celecoxib treatment group. These indicated a decline in mitochondrial membrane potential (Figure 6d, e). The celecoxib treatment resulted in a low level of anti-apoptotic protein expression and a high level of pro-apoptotic protein expression. However, the expression of p53 was increased by treatment with the pifithrin-α and AAE co-treated group compared to the control and the pifithrin-α-treated group. In addition, the expression of p53 down-regulation protein was concurrently increased in the pifithrin-α and the pifithrin-α and AAE co-treated group (Figure 6f). All of these results indicate that AAE induces apoptosis through a p53-independent, as well as p53-dependent manner.
2.7. AAE Suppresses the Cell Growth in LS174T Xenograft Tumors
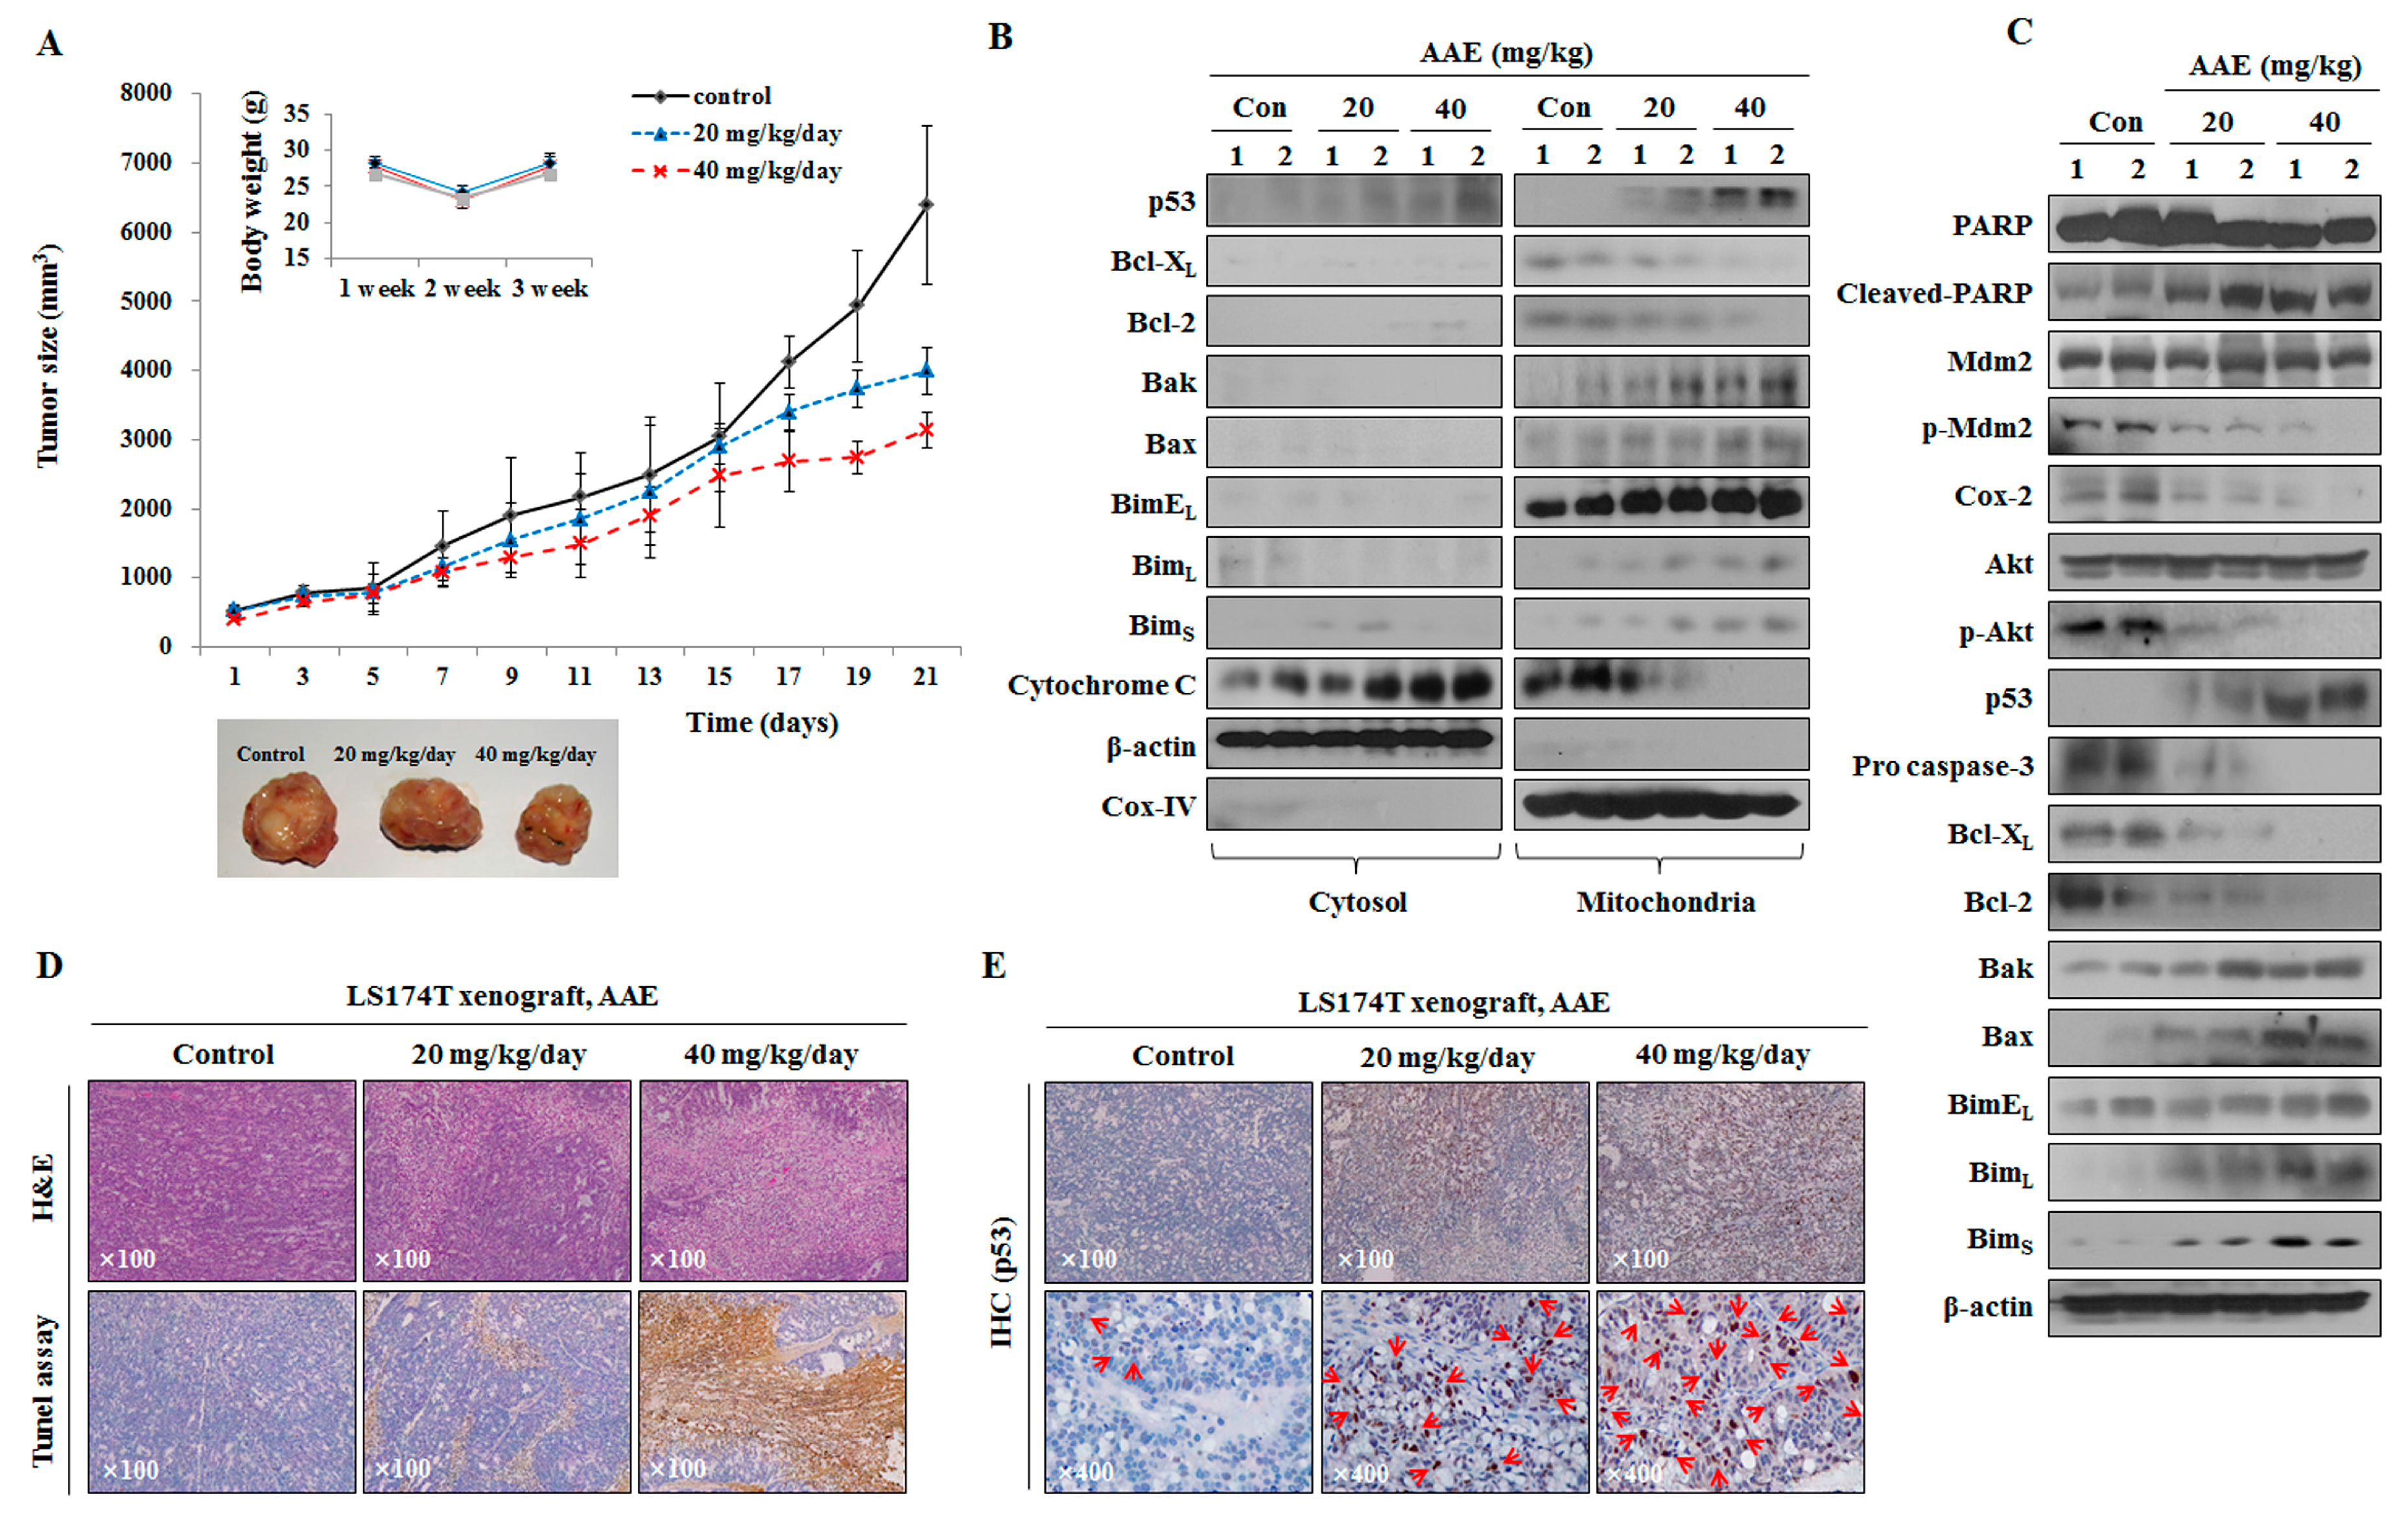
To investigate the effect of AAE treatment in vivo, we established a LS174T xenograft model and examined the effect on tumor growth. Body weight remained unchanged in all groups, however, tumor growth was reduced in the AAE-treated groups compared with control group (Figure 7a). Proteins were extracted from the tumors (Figure 7b, c). We performed a histological analysis with tumor tissue stained with H&E, using the TUNEL assay. The number of TUNEL-positive cells in the tumor tissue of mice was increased cancer tissue and was degraded DNA in the cells as a marker for apoptosis (Figure 7d). In addition, immunohistochemical analysis confirmed that the control group had low levels of p53 and the AAE-treated cells had high levels of p53 (Figure 7e).
3. Discussion
Cancer cells undergo apoptosis, known as programmed cell death, which involves the determined elimination of unnecessary cells. Apoptosis normally takes place during development, as well as aging, and removes damaged cells [25,26]. When apoptosis is induced, it is caused by pro-apoptotic proteins. Pro-apoptotic proteins such as Bax and Bak are translocated to the mitochondria. These proteins can be activated by important mitochondrial changes including alternation in the mitochondrial membrane potential [8,27]. Activated Bax and Bak lead to the formation of pores in the outer mitochondrial membrane [28]. Thus, apoptosis through the mitochondrial pathway plays a critical role in cell death for cancer development and treatment.
As shown in previous studies, various plant extracts have anti-cancer effects and induce apoptotic effects in a variety of cancer cells [29,30,31,32,33]. Artemisia annua L. (AAE) contains phytochemical ingredients that induce cell cycle arrest, as well as apoptotic cell death, in a number of cell types [34,35]. In this study, we focused on the effects of AAE on mitochondria-mediated apoptotic proteins and apoptosis in LS174T colon cancer cells.
Furthermore, LY294002, Nutlin-3, pifithrin-α and celecoxib were employed to assess whether the mechanism of AAE induces via a p53-dependent or p53-independent manner. First, we confirmed that AAE decreased the cell viability in a dose and time-dependent manner. Also, AAE modulates MOMP to induce apoptotic effects through regulation of apoptosis-related proteins and translocation of p53.
Akt is a serine/threonine kinase and the primary mediator of PI3K-initiated signaling. Akt controls a variety of cellular events, such as apoptosis, cell cycle and transcription [36,37]. Akt, which blocks apoptosis, phosphorylates MDM2. The phosphorylated MDM2 inhibits the transcriptional activity of p53 and more importantly, promotes its degradation by proteasome [38,39].
Previous studies have shown that natural extracts inhibit p-Akt/p-MDM2 and induce apoptosis through the mitochondrial pathway [40]. Akt inhibitor LY294002 inhibits phosphorylation at Ser473 of Akt and Nutlin-3, a MDM2 inhibitor, inhibits interaction with p53 [41,42,43]. We found that the inhibition of p-Akt and p-MDM2 induced apoptosis when using LY294002 and Nutlin-3. As with the inhibitor treatment, it was confirmed that the apoptotic effects were induced by inhibiting the expression of p-Akt and p-MDM2 when AAE was treated. By this process, we ascertained that p53, by inhibiting p-MDM2, is transmitted to mitochondria. According to previous studies, Bcl-2 and Bcl- XL bind to BH3 peptides of the pro-apoptotic proteins, like Bax and Bak, and inhibit their function [44,45,46]. However, it has been reported that translocated p53 promotes MOMP by forming a complex with Bcl-xL and Bcl-2 [47].
Our results, therefore, show that AAE can causes p53 translocation and induces apoptosis through the mitochondrial pathway. Another previous study reported that apoptosis may occur, even in the absence of p53, in the treatment of extracts [48,49]. We used pifithrin-α and celecoxib to determine whether AAE induces apoptosis in the p53-independent, as well as in the p53-dependent manner. An inhibitor of p53, pifithrin-α, prevents transcriptional activation and inhibits p53-dependent apoptosis [50,51]. Celecoxib is aselective inhibitor of COX-2 and has potent anti-tumor activity in a variety of tumor types, such as colorectal, breast and lung cancer [52,53,54].
Several studies have shown that the co-treatment group with a pifithrin-α and AAE is increased when compared with the pifithrin-α alone treatment group, indicating that apoptosis can occur even in a p53-independent manner. Moreover, we found that COX-2 inhibition was effective for anti-cancer effects when celecoxib was administered alone or in combination with AAE. AAE also induced apoptosis in a mouse xenograft model, as shown in our in vitro studies. AAE treatment resulted in inhibition of tumor growth, increased expression of apoptosis-related proteins and migration to mitochondria.
In conclusion, the present study indicated that AAE, a natural compound, led to the down-regulation of Akt, leading to the suppression of MDM2/COX-2, the activation of p53 translocation and then to apoptosis through a p53-independent manner.
4. Materials and Methods
4.1. Methods of Extraction
Artemisia annua L. was purchased from a medical herb market (Daejeon, Korea). The plant material was ground using a blender. The obtained powder (100 g) was extracted with 95 % ethanol (200 mL) at room temperature for 3 days and was filtered through filter paper. The filtered solvent was evaporated to dryness with a rotary evaporator to eliminate ethanol. A stock solution of the extract was dissolved in DMSO (Dimethyl sulfoxide; Samchun, Korea; stock solution, 100 mg/mL) and stored at -20 ℃.
4.2. Reagent
3-(4,5-dimethylthiazol-2-yl)-2,5-diphenyltetrazolium bromide (MTT), pifithrin-α (p53 inhibitor), celecoxib (COX-2 inhibitor), Nutlin-3 (p-MDM2 inhibitor) and LY294002 (PI3K/Akt inhibitor) were purchased from Sigma Aldrich (Sigma Aldrich; St. Louis, MO, USA). The Pierce Lactate Dehydrogenase (LDH) Cytotoxicity Assay Kit was purchased from Thermo Fisher Scientific (Waltham, MA, USA). MitoTracker was purchased from Molecular Probes (Eugene, OR, USA). Specific antibodies such as p-Akt (Ser473), (t)Akt, COX-2, procaspase-3, Bcl-2, Bcl-XL, COX-4, Bax, Bak, Bim, PARP and β-actin were obtained from Cell Signaling Technology (Beverly, MA, USA). p53 and cytochrome c were obtained from Santa Cruz Biotechnology, Inc. (Dallas, TX, USA). (t)MDM2 was purchased from Novus Biologicals (Littleton, CO, USA) and p-MDM2 was purchased from Abcam (Cambridge, MA, USA). Muse™ Annexin V and Dead Cell Assay kit (MCH100105), Muse™ MitoPotential Kit (MCH100110), Muse™ Caspase-3/7 Kit (MCH100108) and Muse™ Cell Analyzer (PB4455ENEU) were purchased from Millipore (EMD Millipore Corporation, Darmstadt, Germany).
4.3. Cell Culture
LS174T and fibroblast cells were obtained from the American Type Culture Collection (ATCC; Rockville, MD, USA). LS174T cells were grown in RPMI-1640 medium (Hyclone; Waltham, MA, USA) and fibroblast cells were grown in DMEM medium (Hyclone) containing 10 % fetal bovine serum (Hyclone) and 1 % antibiotics (100 mg/streptomycin, 100 U/ml penicillin) at 37 ℃ in a 5 % CO2 atmosphere.
4.4. Cell Proliferation Assay (MTT Assay)
Cells were seeded at 1×10⁴ cells/ml in a 12-well plate for 24 h and were incubated with various concentrations of AAE (10-100 μg/ml) for 12-48 h. Certain samples were pre-treated with the inhibitors (pifithrin-α, celecoxib, Nutlin-3 and LY294002) for 30 min prior to treatment with AAE (60 μg/ml). Following incubation with the test compounds, the cells were incubated with a 30 μl MTT solution (5 mg/ml) for 30 min. Subsequently, 200 μl of dimethyl sulfoxide (DMSO, Sigma) was added to dissolve the purple formazan crystals. The optical densities of the solutions were quantified at a 595 nm wavelength by using a Microplate reader (BIO-RAD Laboratories, Inc.; Tokyo, Japan).
4.5. LDH Release Assay
Cells were seeded at 1×10⁴ cells/ml in a 12-well plate for 24 h and were incubated with various concentrations of AAE (10-100 μg/ml) for 12-48 h. Certain samples were pre-treated with the inhibitors (pifithrin-α, celecoxib, Nutlin-3 and LY294002) for 30 min prior to treatment with AAE (60 μg/ml). After 24 h, the LDH cytotoxicity assay kit was used according to the protocol and the absorbance was determined by using a microplate reader at 490 and 644 nm wavelengths. These results were calculated as a percentage of released LDH compared to the total LDH activity.
4.6. Morphology Analysis (Observation of Cellular Morphology)
Cells were seeded at 1×10⁵ cells/ml in a 6-well plate for 24 h and were incubated with various concentrations of AAE (40-80 μg/ml) for 12-48 h. The cellular morphology was photographed under a microscope (Carl Zeiss; Thornwood, NY, USA). The photographs were taken at a magnification of × 200.
4.7. Determination of Apoptosis by Annexin V/PI Staining
Cells were seeded at 1×10⁵ cells/ml in a 6-well plate. After a 24 h incubation, cells were treated with various concentrations of AAE (40-80 μg/ml) for 24 h. Certain samples were pre-treated with the inhibitors (pifithrin-α, celecoxib, Nutlin-3 and LY294002) for 30 min prior to treatment with AAE (60 μg/ml). The Muse™ Annexin V & Dead Cell Kit (Merck Millipore Co.) was used according to the protocol and the analysis was analyzed in the Muse™ Cell Analyzer (Merck Millipore Co.).
4.8. Determination of Apoptosis by Hoechst 33342 Staining
Cells were seeded at 1×10⁴ cells/ml in a 12-well plate with cover glasses and incubated for 24 h. Following treatment with various concentrations of AAE (40-80 μg/ml), the cells were stained with 0.7 μM Hoechst 33342 for 30 min and fixed with 3.5 % formaldehyde for 20 min. Then the cells were washed with PBS twice and the coverslips were mounted for fluorescence microscope observation. Subsequently, the cells were observed using a fluorescence microscope (Carl Zeiss).
4.9. Measurement of Mitochondrial Membrane Potential
Cells were seeded at 1×10⁵ cells/ml in a 6-well plate. After a 24 h incubation, cells were treated with various concentrations of AAE (40-80 μg/ml) for 24 h. Certain samples were pre-treated with the inhibitors (pifithrin-α, celecoxib, Nutlin-3 and LY294002) for 30 min prior to treatment with AAE (60 μg/ml). The Muse™ MitoPotential Kit (Merck Millipore Co.) was used according to the protocol and the analysis was analyzed in the Muse™ Cell Analyzer (Merck Millipore Co.).
4.10. Caspase-3/7 Activity Assay
Cells were seeded at 1×10⁵ cells/ml in a 6-well plate. After a 24 h incubation, cells were treated with various concentrations of AAE (40-80 μg/ml) for 24 h. Certain samples were pre-treated with the inhibitors (pifithrin-α, celecoxib, Nutlin-3 and LY294002) for 30 min prior to treatment with AAE (60 μg/ml). The Muse™ Caspase-3/7 Assay Kit (Merck Millipore Co.) was used according to the protocol and analysis was analyzed in the Muse™ Cell Analyzer (Merck Millipore Co.). The activity of caspase-3 was determined using a caspase-3 assay kit (Abcam PLC; Cambridge, UK). Cells were harvested by trypsinization, collected by centrifugation and washed with PBS. Resuspended cells were added to a lysis buffer and mixed with a reaction buffer. After addition of DEVD-p-NA, cells were incubated at 37 ℃ in a 5 % CO2 atmosphere for 2 h. The optical densities of solutions were quantified using a Microplate reader (BIO-RAD Laboratories, Inc.) at a 405 nm wavelength.
4.11. Fractionation of Mitochondria and Cytosol Proteins
Mitochondrial fractions were analyzed by using a Mitochondria/Cytosol Fraction Kit (Abcam, PLC, Cambridge, UK). Cells were seeded at 1×10⁶ cells/ml in a 100 mm plate and incubated for 24 h with AAE (40-80 μg/ml). After a 24 h incubation, cells were harvested by trypsinization, collected by centrifugation and washed with PBS. The washed cellular pellet was homogenized in an ice-cold cytosol extraction buffer using a sonicator and centrifuged at 3,000 rpm for 10 min at 4 ℃. The supernatant liquids were transferred into fresh tubes and centrifuged at 13,000 rpm for 20 min at 4 ℃. The collected supernatant has a cytosolic fraction. The pellets were resuspended with an ice-cold mitochondria extraction buffer.
4.12. Western Blotting
Cells were seeded at 1×10⁵ cells/ml in a 6-well plate. After a 24 h incubation, cells were treated with various concentrations of AAE (40-80 μg/ml) for 6 h. Certain samples were pre-treated with the inhibitors (pifithrin-α, celecoxib, Nutlin-3 and LY294002) for 30 min prior to treatment with AAE (60 μg/ml). After a 6 h, cells were rinsed twice with ice-cold PBS, scraped with a lysis buffer [50 mM Tris-HCl (pH 8.0, 150 mM NaCl, 1 % NP40, 0.5 % sodium deoxycholate, 1 mM PMSF)] and subjected to the western blot analysis. Protein quantification was performed using a Bradford assay and 30 μg of protein were loaded per lane. Primary antibodies reacted overnight at 4 ℃ and secondary antibodies reacted for 90 min at room temperature with gentle agitation.
4.13. Immunofluorescence (IF) Staining
Cells were seeded at 1×10⁴ cells/ml in a 12-well plate with cover glasses and incubated for 24 h. After treatment with the indicated dose for 24 h, cells were stained with MitoTracker for 30 min at 37 ℃ in a 5 % CO2 atmosphere. Cells were fixed with 4 % formaldehyde for 20 min, prior to permeabilization with 0.2 % Triton X-100 and blocking in 2 % bovine serum albumin. Cells were then incubated overnight at 4 ℃ with cytochrome c, p53 primary antibodies. On the second day, cells were washed with PBS and reacted with a secondary antibody for 1 h. The coverslips were mounted for fluorescence microscope observation. Subsequently, the cells were observed using a confocal microscope (Olympus; Tokyo, Japan).
4.14. Xenograft Model
Male 4-week-old Balb/c nu/nu mice were obtained from SLC (Tokyo, Japan) and housed in sterile, filter-topped cages. For tumor induction, LS174T colon cancer cells (2×10⁵ cells/0.1 ml) were subcutaneously injected into the left flank of the mice (n = 5/group). One week after the injection of cells, they were co-treated with 20-40 mg/kg/day for 21 days. The tumor size was measured using calipers at 2 day intervals and the tumor volume was calculated using the modified formula V = 1/2 (length × width)2. The body weight was measured at a set time, once per week. All animal experiments were approved by the Ethics Committee for Animal Experimentation, Hannam University (Daejeon, Korea, HNU 2016-8).
4.15. Immunohistochemistry
The tumor specimens from mice were fixed in 10 % formaldehyde, embedded in paraffin and sectioned into 5 μM thick slices. Consecutive thin cryosections (5 μM) of optimum cutting temperature compound (Sakura Finetek; Torrance, CA, USA) embedded tumor tissues were fixed in acetone at 4 ˚C for 10 min. Following washing in PBS, sections were treated with 3 % H2O2 for 10 min to block endogenous peroxidase activity, and the sections were inhibited with normal rabbit serum. Then, the sections were blocked and washed in PBS and incubated with a specific antibody overnight at 4 ˚C. Negative controls were incubated with the primary normal serum immunoglobulin G (IgG) for the species from which the primary antibody was obtained.
4.16. TUNEL Assay
Levels of apoptosis in distal colon tissue were determined by using the TdT-mediated dUTP nick-end labeling (TUNEL) method. The tumor tissues were fixed in 10% formaldehyde, embedded in paraffin and sectioned into 5 μM thick slices. Tissue sections were processed for the ApopTag Peroxidase In Situ Apoptosis Detection Kit (Vector Laboratories; Burlingame, CA, USA) according to manufacturer’s instructions.
4.17. Statistical Analysis
All the experiments were repeated at least three times and analyzed using t-tests (SPSS 20.0, Chicago, IL, USA). p<0.05 was considered to indicate a statistically significant difference.
Author Contributions
Conceptualization, G.W.N., B.-M.K. and Y.-M.K.; methodology, G.W.N.; software, B.-M.K.; validation, G.W.N. and B.-M.K.; formal analysis, B.-M.K.; investigation, G.W.N.; resources, G.W.N.; data curation, G.W.N.; writing—original draft preparation, G.W.N.; writing—review and editing, G.W.N. and Y.-M.K.; visualization, G.W.N.; supervision, Y.-M.K.; project administration, Y.-M.K. All authors have read and agreed to the published version of the manuscript.
Institutional Review Board Statement
All applicable international, national, and/or institutional guidelines for the care and use of animals were followed. All procedures performed in studies involving animals were in accordance with the ethical standards of the institution or practice at which the studies were conducted. All procedures were performed in accordance with the guidelines for animal experiments and the protocol was approved by the Ethics Committee for Animal Experimentation, Hannam University (Daejeon, Korea, HNU 2016-8).
Conflicts of Interest
The Authors declare that there is no conflict of interest that could be perceived as prejudicing the impartiality of the research reported.
References
- Anand, P.; Kunnumakara, A.B.; Sundaram, C.X.; Harikumar, K.B.; Tharakan, S.T.; Lai, O.S.; Sung, B.; Aggarwal, B.B. Cancer is a preventable disease that requires major lifestyle changes. Pharm. Res. 2008, 25, 2097–2116. [Google Scholar] [CrossRef]
- ACS (2016) Cancer facts & figures 2016, American Cancer Society. 1-66.
- Tsujimoto, Y.; Nakagawa, T.; Shimizu, S. Mitochondrial membrane permeability transition and cell death. Biochim. Biophys. Acta. 2006, 1757, 1297–1300. [Google Scholar] [CrossRef] [PubMed]
- Putcha, G.V.; Harris, C.A.; Moulder, K.L.; Easton, R.M.; Thompson, C.B.; Johnson, E.M. Intrinsic and extrinsic pathway signaling during neuronal apoptosis: lessons from the analysis of mutant mice. J. Cell. Biol. 2002, 157, 441–453. [Google Scholar] [CrossRef] [PubMed]
- Gu, Q.; Wang, J.D.; Xia, H.H.; Lin, M.C.; He, H.; Zou, B.; Tu, S.P.; Yang, Y.; Liu, X.G.; Lam, S.K.; Wong, W.M.; Chan, A.O.; Yuen, M.F.; Kung, H.F.; Wong, B.C. Activation of the caspase-8/Bid and Bax pathways in aspirin-induced apoptosis in gastric cancer. Carcinogenesis. 2005, 26, 541–546. [Google Scholar] [CrossRef] [PubMed]
- Martinou, J.C.; Youle, R.J. Mitochondria in apoptosis: Bcl-2 family members and mitochondrial dynamics. Dev. Cell. 2011, 21, 92–101. [Google Scholar] [CrossRef] [PubMed]
- Shamas-Din, A.; Kale, J.; Leber, B.; Andrews, D.W. Mechanisms of action of Bcl-2 family proteins. Cold Spring Harb. Perspect. Biol. 2013, 5, a008714. [Google Scholar] [CrossRef] [PubMed]
- Kang, M.H.; Reynolds, C.P. Bcl-2 Inhibitors: targeting mitochondrial apoptotic pathways in cancer therapy. Clin. Cancer. Res. 2009, 15, 1126–1132. [Google Scholar] [CrossRef] [PubMed]
- Mikhailov, V.; Mikhailova, M.; Degenhardt, K.; Venkatachalam, M.A.; White, E.; Saikumar, P. Association of Bax and Bak homo-oligomers in mitochondria. J. Biol. Chem. 2002, 278, 5367–5376. [Google Scholar] [CrossRef] [PubMed]
- Chandra, D.; Liu, J.W.; Tang, D.G. Early mitochondrial activation and cytochrome c up-regulation during apoptosis. J. Biol. Chem. 2002, 277, 50842–50854. [Google Scholar] [CrossRef]
- Vaseva, A.V.; Moll, U.M. The mitochondrial p53 pathway. Biochim. Biophys. Acta. 2009, 1787, 414–420. [Google Scholar] [CrossRef]
- Haupt, S.; Berger, M.; Goldberg, Z.; Haupt, Y. Apoptosis – the p53 network. J. Cell. Sci. 2003, 116, 4077–4085. [Google Scholar] [CrossRef] [PubMed]
- Bhaskar, P.T.; Hay, N. The two TORCs and Akt. Dev. Cell. 2003, 12, 487–502. [Google Scholar] [CrossRef] [PubMed]
- Mortenson, M.M.; Galante, J.M.; Shlieman, M.G.; Bold, R.J. AKT: A novel target in pancreatic cancer therapy. Cancer Ther. 2004, 2, 227–238. [Google Scholar]
- Mayo, L.D.; Donner, D.B. The PTEN, Mdm2, p53 tumor suppressor-oncoprotein network. Trends Biochem. Sci. 2002, 27, 462–467. [Google Scholar] [CrossRef] [PubMed]
- Wang, S.; Zhao, Y.; Bernard, D.; Aguilar, A.; Kumar, S. Targeting the MDM2-p53 protein-protein interaction for new cancer therapeutics. Top Med. Chem. 2012, 8, 57–80. [Google Scholar]
- Ogawara, Y.; Kishishita, S.; Obata, T.; Isazawa, Y.; Suzuki, T.; Tanaka, K.; Masuyama, N.; Gotoh, Y. Akt enhances Mdm2-mediated ubiquitination and degradation of p53. J. Biol. Chem. 2002, 277, 21843–21850. [Google Scholar] [CrossRef] [PubMed]
- Lee, S.H.; Koo, B.S.; Park, S.Y.; Kim, Y.M. Anti-angiogenic effects of resveratrol in combination with 5-fluorouracil on B16 murine melanoma cells. Mol. Med. Rep. 2015, 12, 2777–2783. [Google Scholar] [CrossRef] [PubMed]
- Totzke, G.; Schulze-Osthoff, K.; Jänicke, R.U. Cyclooxygenase-2 (COX-2) inhibitors sensitize tumor cells specifically to death receptor-induced apoptosis independently of COX-2 inhibition. Oncogene. 2003, 22, 8021–8030. [Google Scholar] [CrossRef] [PubMed]
- Choi, E.M.; Heo, J.I.; Oh, J.Y.; Kim, Y.M.; Ha, K.S.; Kim, J.I.; Han, J.A. COX-2 regulates p53 activity and inhibits DNA damage-induced apoptosis. Biochem. Biophys. Res. Commun. 2005, 328, 1107–1112. [Google Scholar] [CrossRef]
- Safarzadeh, E.; Shotorbani, S.S.; Baradaran, B. Herbal medicine as inducers of apoptosis in cancer treatment. Adv. Pharm. Bull. 2014, 1, 421–427. [Google Scholar]
- Johnstone, R.W.; Ruefli, A.A.; Lowe, S.W. Apoptosis : A link between cancer genetics and chemotherapy. Cell. 2002, 108, 153–164. [Google Scholar] [CrossRef] [PubMed]
- Singh, N.P.; Ferreira, J.F.; Park, J.S.; Lai, H.C. Cytotoxicity of ethanolic extracts of Artemisia annua to Molt-4 human leukemia cells. Planta Med. 2011, 77, 1788–1793. [Google Scholar] [CrossRef] [PubMed]
- Ferreira, J.F.; Luthria, D.L.; Sasaki, T.; Heyerick, A. Flavonoids from Artemisia annua L. as antioxidants and their potential synergism with artemisinin against malaria and cancer. Molecules. 2010, 15, 3135–3170. [Google Scholar] [CrossRef] [PubMed]
- Elmore, S. Apoptosis: A review of programmed cell death. Toxicol. Pathol. 2007, 35, 495–516. [Google Scholar] [CrossRef] [PubMed]
- Saikumar, P.; Venkatachalam, M.A. Apoptosis and cell death. In: Philip, T. (ed) Basic Concepts of Molecular Pathology, vol 2. Springer, Heidelberg, 2009, 29-40.
- Emine, E.; Oliver, L.; Cartron, P.F.; Juin, P.; Manon, S.; Vallette, F.M. Mitochondria as the target of the pro-apoptotic protein Bax. Biochim. Biophys. Acta. 2006, 1757, 1301–1311. [Google Scholar]
- Westphal, D.; Kluck, R.M.; Dewson, G. Building blocks of the apoptotic pore: how Bax and Bak are activated and oligomerize during apoptosis. Cell Death Differ. 2014, 21, 196–205. [Google Scholar] [CrossRef] [PubMed]
- Wei, Y.; Yuan, F.J.; Zhou, W.B.; Wu, L.; Chen, L.; Wang, J.J.; Zhang, Y.S. Borax-induced apoptosis in HepG2 cells involves p53, Bcl-2, and Bax. Genet. Mol. Res. 2016, 15, 2. [Google Scholar] [CrossRef] [PubMed]
- Balan, K.V.; Demetzos, C.; Prince, J.; Dimas, K.; Cladaras, M.; Han, Z.; Wyche, J.H.; Pantazis, P. Induction of apoptosis in human colon cancer HCT116 cells treated with an extract of the plant product, chios mastic gum. In Vivo. 2005, 19, 93–102. [Google Scholar] [PubMed]
- Kim, H.J.; Park, S.Y.; Lee, H.M.; Seo, D.I.; Kim, Y.M. Antiproliferation effect of the methanol extract from the roots of Petasites japonicus on Hep3B hepatocellular carcinoma cells in vitro and in vivo. Exp. Ther. Med. 2015, 9, 1791–1796. [Google Scholar] [CrossRef]
- Kim, G.T.; Lee, S.H.; Kim, Y.M. Torilis japonica extract, a new potential EMT suppressor agent by regulation of EGFR signaling pathways. Int. J. Oncol. 2014, 45, 1673–1679. [Google Scholar] [CrossRef]
- Jin, Y.; Duan, L.X.; Xu, X.L.; Ge, W.J.; LI, R.F.; Qiu, X.J.; Song, Y.; Cao, S.S.; Wang, J.G. Apoptosis-inducing effects of extracts from desert plants in HepG2 human hepatocarcinoma cells. Biomed. Rep. 2016, 5, 73–78. [Google Scholar] [CrossRef] [PubMed]
- Brown, G.D. The biosynthesis of Artemisinin (Qinghaosu) and the phytochemistry of Artemisia annua L. (Qinghao). Molecules. 2010, 15, 7603–7698. [Google Scholar] [CrossRef] [PubMed]
- Engeu, P.O.; Omujal, F.; Agwaya, M.; Kyakulaga, H.; Obua, C. Variations in antimalarial components of Artemisia annua Linn from three regions of Uganda. Afr. Health Sci. 2015, 15, 828–834. [Google Scholar] [CrossRef] [PubMed]
- Nicholson, K.M.; Anderson, N.G. The protein kinase B/Akt signalling pathway in human malignancy. Cell Signal. 2002, 14, 381–395. [Google Scholar] [CrossRef] [PubMed]
- Kennedy, S.G.; Wagner, A.J.; Conzen, S.D.; Jordán, J.; Bellacosa, A.; Tsichlis, P.N.; Hay, N. The PI 3-kinase/Akt signaling pathway delivers an anti-apoptotic signal. Genes Dev. 1997, 11, 701–713. [Google Scholar] [CrossRef] [PubMed]
- Ogawara, Y.; Kishishita, S.; Obata, T.; Isazawa, Y.; Suzuki, T.; Tanaka, K.; Masuyama, N.; Gotoh, Y. Akt enhances Mdm2-mediated ubiquitination and degradation of p53. J. Biol. Chem. 2002, 277, 21843–21850. [Google Scholar] [CrossRef] [PubMed]
- Meek, D.W.; Knippschild, U. Posttranslational Modification of MDM2. Mol. Cancer Res. 2003, 1, 1017–1026. [Google Scholar]
- Daniele, S.; Costa, B.; Zappelli, E.; Pozzo, E.D.; Sestito, S.; Nesi, G.; Campiglia, P.; Marinelli, L.; Novellino, E.; Rapposelli, S.; Martini, C. Combined inhibition of AKT/mTOR and MDM2 enhances Glioblastoma Multiforme cell apoptosis and differentiation of cancer stem cells. Scientific Reports. 2015, 2015. 5, 9956. [Google Scholar] [CrossRef]
- Zhen, Y.; Li, D.; Li, W.; Yao, W.; Wu, A.; Huang, J.; Gu, H.; Huang, Y.; Wang, Y.; Wu, J.; Chen, M.; Wu, D.; Lyu, Q.; Fang, W.; Wu, B. Reduced PDCD4 expression promotes cell growth through PI3K/Akt signaling in non-small cell lung cancer. Oncol Res. 2016, 23, 61–68. [Google Scholar] [CrossRef]
- Moon, D.O.; Park, S.Y.; Choi, Y.H.; Kim, N.D.; Lee, C.; Kim, G.Y. Melittin induces Bcl-2 and caspase-3-dependent apoptosis through downregulation of Akt phosphorylation in human leukemic U937 cells. Toxicon. 2008, 51, 112–120. [Google Scholar] [CrossRef]
- Park, E.J.; Choi, K.S.; Yoo, Y.H.; Kwon, T.K. Nutlin-3, a small-molecule MDM2 inhibitor, sensitizes Caki cells to TRAIL-induced apoptosis through p53-mediated PUMA upregulation and ROS-mediated DR5 upregulation. Anticancer Drugs. 2013, 24, 260–269. [Google Scholar] [CrossRef] [PubMed]
- Dlugosz, P.J.; Billen, L.P.; Annis, M.G.; Zhu, W.; Zhang, Z.; Lin, J.; Leber, B.; Andrews, D.W. Bcl-2 changes conformation to inhibit Bax oligomerization. EMBO J. 2006, 25, 2287–2296. [Google Scholar] [CrossRef]
- Murphy, K.M.; Ranganathan, V.; Farnsworth, M.L.; Kavallaris, M.; Lock, R.B. Bcl-2 inhibits Bax translocation from cytosol to mitochondria during drug-induced apoptosis of human tumor cells. Cell Death Differ. 2002, 7, 102–111. [Google Scholar] [CrossRef] [PubMed]
- Teijido, O.; Dejean, L. Upregulation of Bcl2 inhibits apoptosis-driven BAX insertion but favors BAX relocalization in mitochondria. FEBS Lett. 2010, 584, 3305–3310. [Google Scholar] [CrossRef] [PubMed]
- Wolff, S.; Erster, S.; Palacios, G.; Moll, U.M. p53's mitochondrial translocation and MOMP action is independent of Puma and Bax and severely disrupts mitochondrial membrane integrity. Cell Res. 2010, 18, 733–744. [Google Scholar] [CrossRef] [PubMed]
- Karimi, M.; Conserva, F.; Mahmoudi, S.; Bergman, J.; Wiman, K.G.; Bykov, V.J. Extract from Asteraceae Brachylaena ramiflora induces apoptosis preferentially in mutant p53-expressing human tumor cells. Carcinogenesis. 2010, 31, 1045–1053. [Google Scholar] [CrossRef] [PubMed]
- Liu, J.; Zhang, X.; Liu, A.; Liu, S.; Zhang, L.; Wu, B.; Hu, Q. Berberine induces apoptosis in p53-null leukemia cells by down-regulating XIAP at the post-transcriptional level. Cell Physiol. Biochem. 2012, 32, 1213–1224. [Google Scholar] [CrossRef]
- Sparfel, L.; Grevenynghe, J.V.; Vee, M.L.; Aninat, C.; Fardel, O. Potent inhibition of carcinogen-bioactivating cytochrome P450 1B1 by the p53 inhibitor pifithrin α. Carcinogenesis. 2006, 27, 656–663. [Google Scholar] [CrossRef]
- Hoagland, M.S.; Hoagland, E.M.; Swanson, H.I. The p53 inhibitor pifithrin-α is a potent agonist of the aryl hydrocarbon receptor. J. Pharmacol. Exp. Ther. 2005, 314, 603–610. [Google Scholar] [CrossRef]
- Yusup, G.; Akutsu, Y.; Mutallip, M.; Qin, W.; Hu, X.; Komatsu-Akimoto, A.; Hoshino, I.; Hanari, N.; Mori, M.; Akanuma, N.; Isozaki, Y.; Matsubara, H. A COX-2 inhibitor enhances the antitumor effects of chemotherapy and radiotherapy for esophageal squamous cell carcinoma. Int. J. Oncol. 2004, 44, 1146–1152. [Google Scholar] [CrossRef]
- Ninomiya, I.; Nagai, N.; Oyama, K.; Hayashi, H.; Tajima, H.; Kitagawa, H.; Fushida, S.; Fujimura, T.; Ohta, T. Antitumor and anti-metastatic effects of cyclooxygenase-2 inhibition by celecoxib on human colorectal carcinoma xenografts in nude mouse rectum. Oncol. Rep. 2012, 28, 777–784. [Google Scholar] [CrossRef] [PubMed]
- Dai, Z.J.; Ma, X.B.; Kang, H.F.; Gao, J.; Min, W.L.; Guan, H.T.; Diao, Y.; Lu, W.F.; Wang, X.J. Antitumor activity of the selective cyclooxygenase-2 inhibitor, celecoxib, on breast cancer in vitro and in vivo. Cancer Cell Int. 2012, 12, 53. [Google Scholar] [CrossRef] [PubMed]
Figure 1.
AAE inhibits cell proliferation in LS174T colon cancer cells. (A) Cell proliferation rate was measured by MTT assay. Fibroblast cells were treated with the indicated concentrations of AAE for 24 h. (B) LS174T cells were treated with the indicated concentrations of AAE for 12-48 h. (C) AAE increased the LDH release in cells. LS174T cells were treated with the indicated concentrations of AAE for 12-48 h. The statistical analysis of the data was carried out by use of a t-test. *P < 0.05, **,##,ooP < 0.01,***,###,oooP < 0.001 compared to control. N.S.;not significant (each experiment, n=3). (D) Phase contrast image-based monitoring of apoptosis induction. 40x phase contrast images LS174T cells after 24 h incubation.
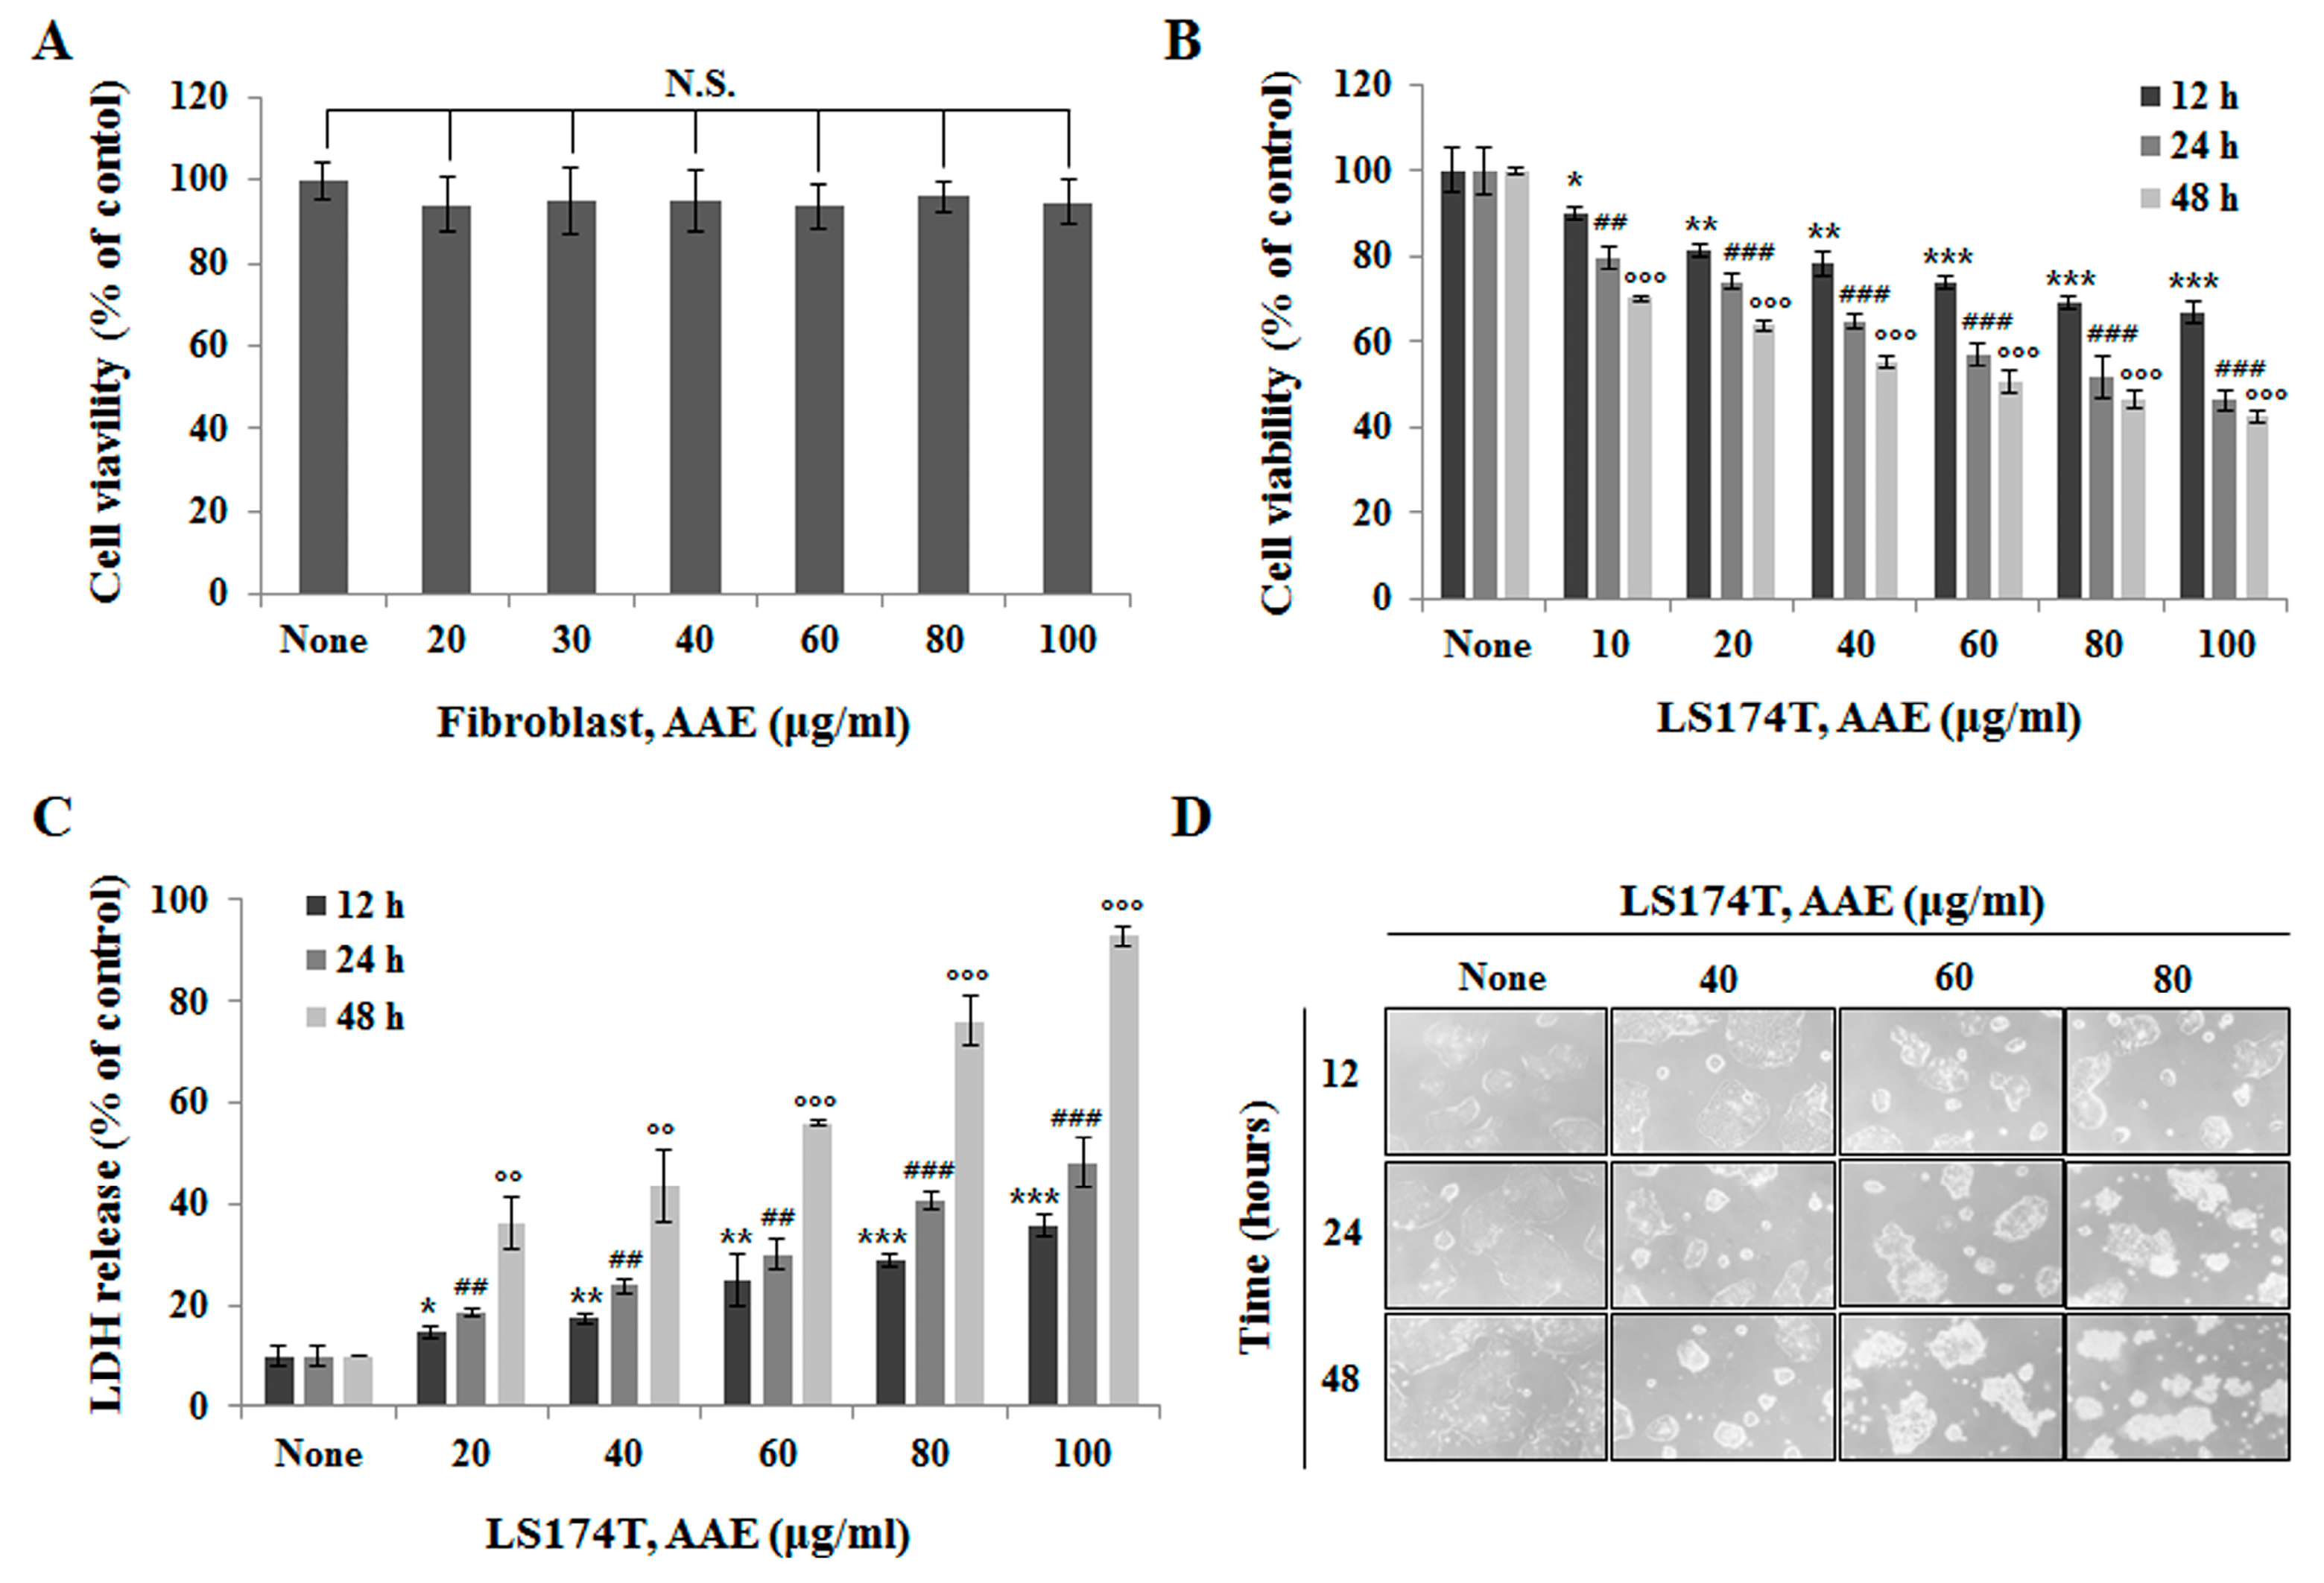
Figure 2.
AAE induces apoptosis in LS174T colon cancer cells. (A) Cell apoptosis observed using Hoechst 33342 staining. Cells were treated with the indicated concentrations of AAE for 24 h. Fluorescence was detected using a fluorescence microscope. Arrows indicate apoptotic bodies, which were DNA fragments produced when apoptosis occurred. (B) Cells were treated with the indicated concentrations of AAE for 24 h. Cells stained with Muse™ Annexin V and Dead Cell Assay kit and analyzed by Muse™ Cell Analyzer. Data shows four cell populations – Live, Dead, Late Apop./Dead, Early Apop.
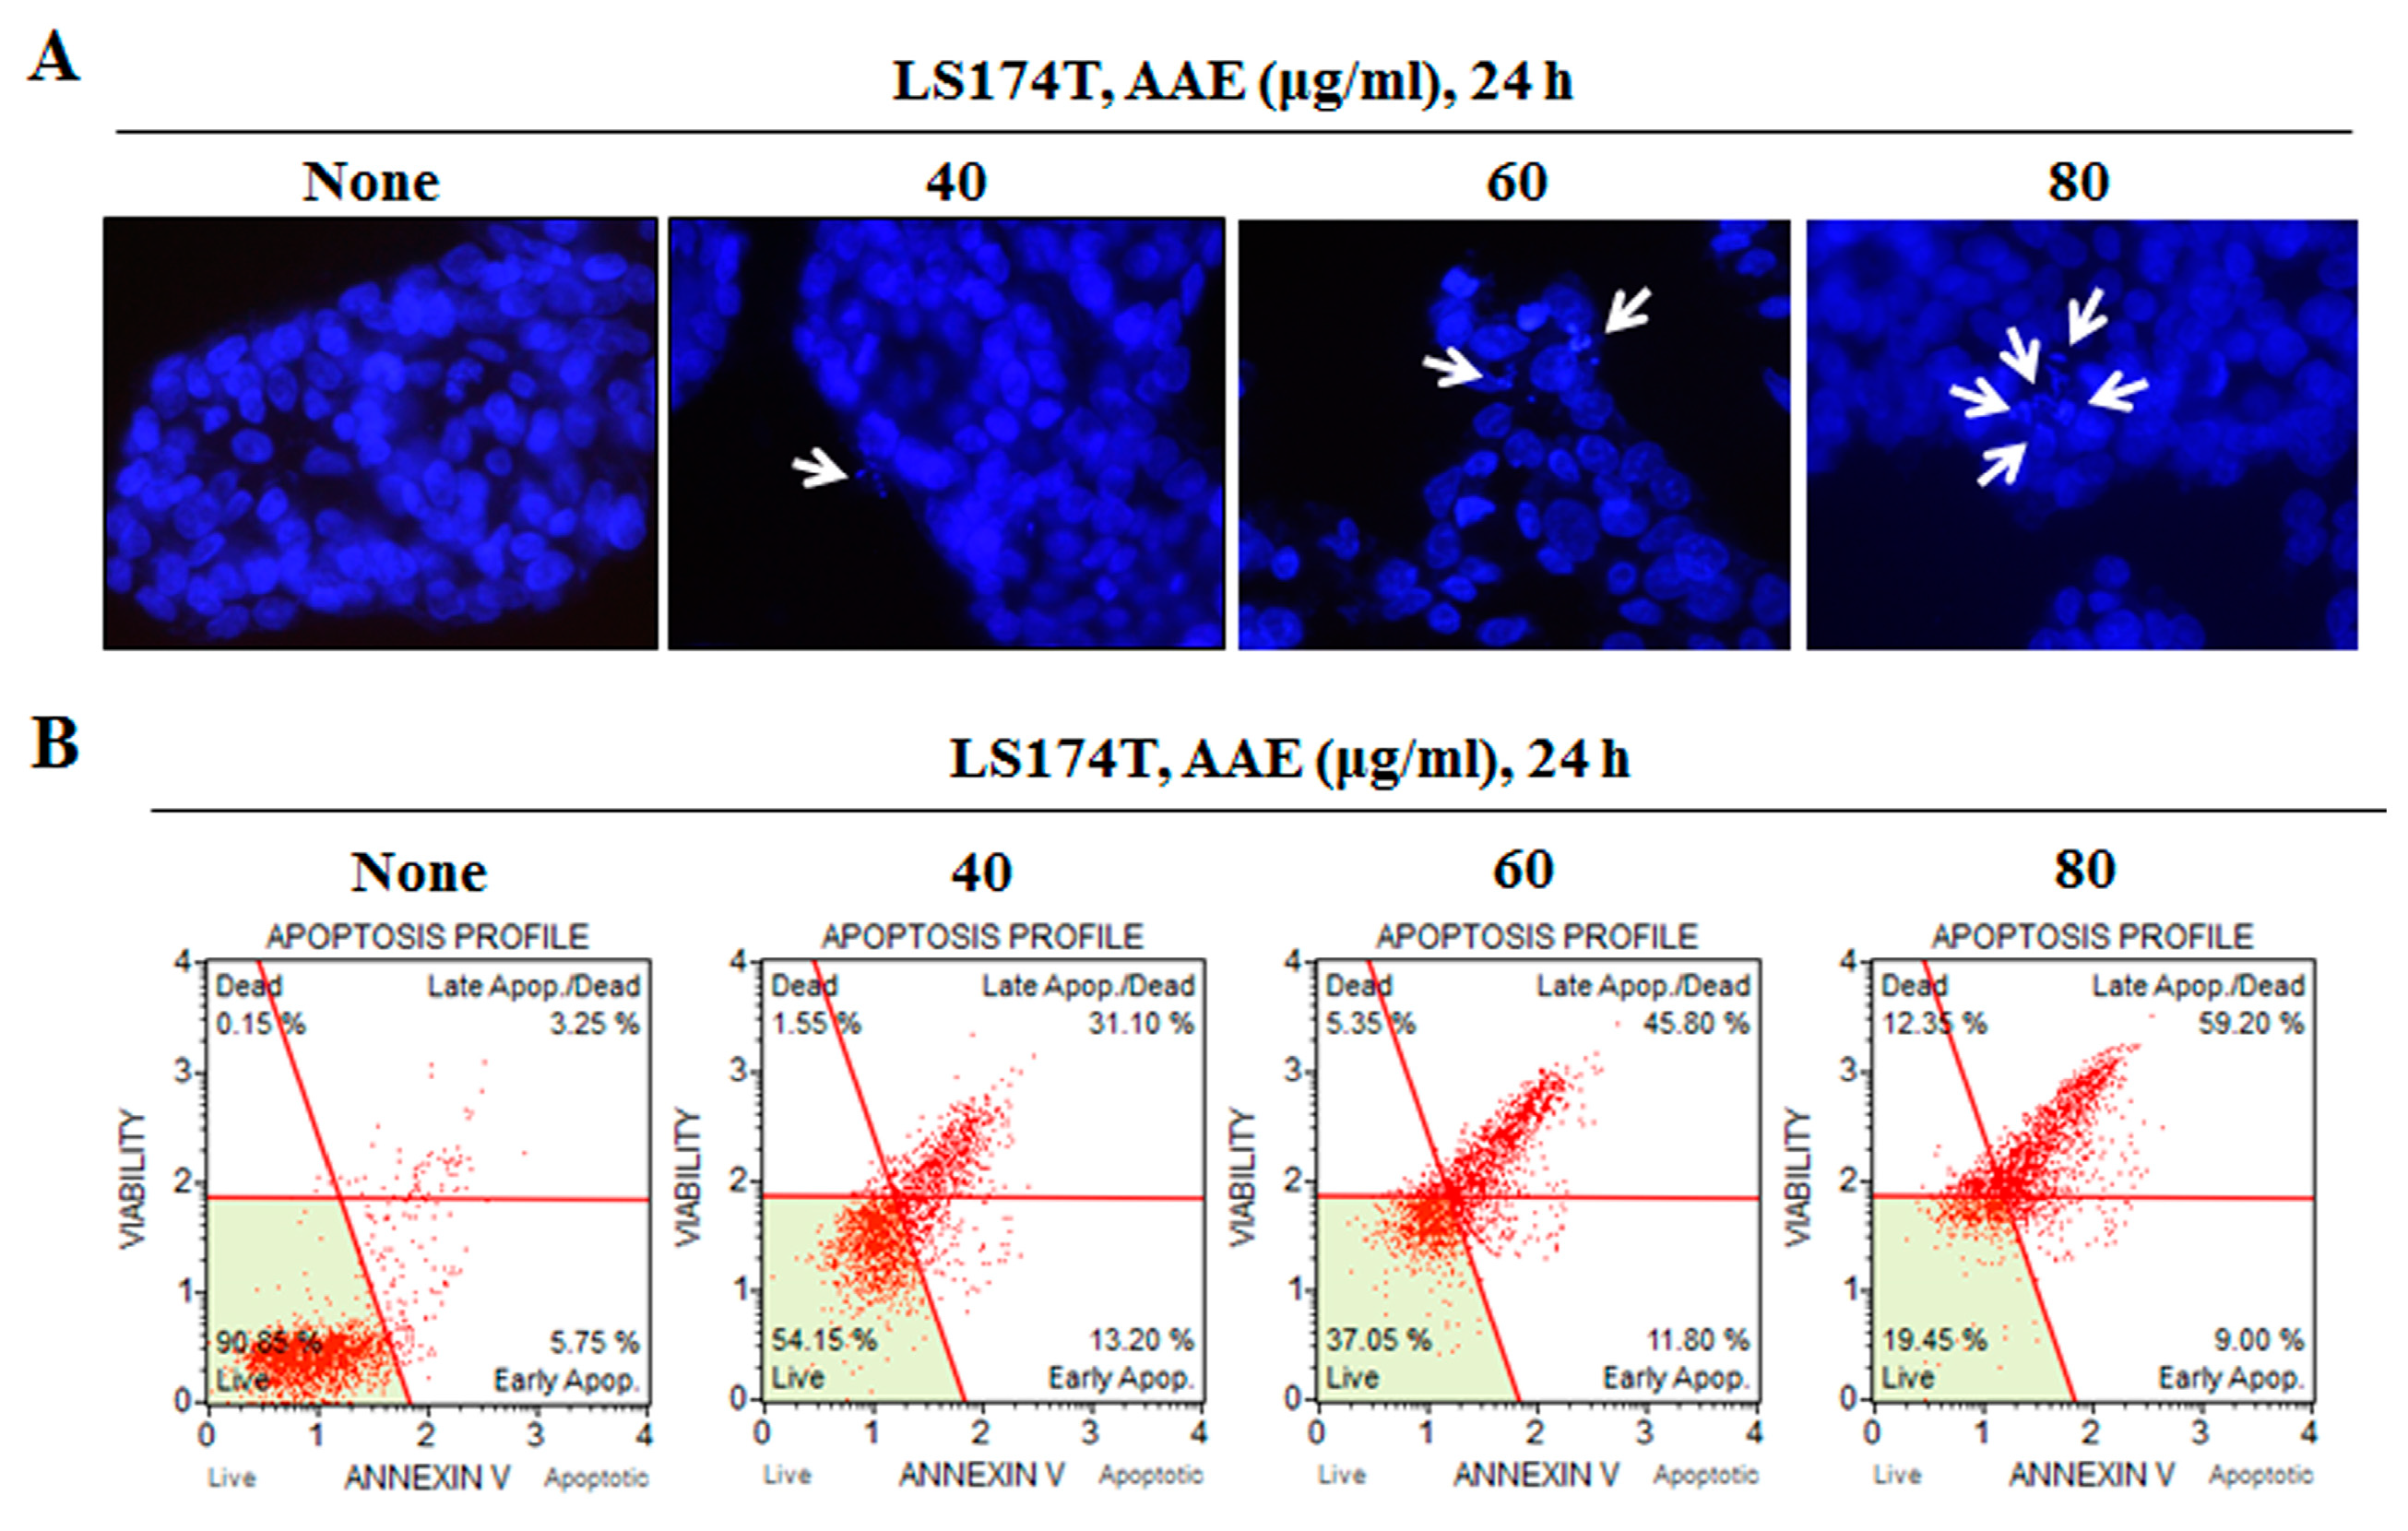
Figure 3.
Evaluation of the effect of AAE on the apoptosis through the mitochondrial signaling pathway. (A) Cells were treated with the indicated concentrations of AAE for 24 h. Cells stained with Muse™ Mitopotential Kit and analyzed by Muse™ Cell Analyzer. Data shows four cell populations - Live, Depolarized/Live, Depolarized/Dead, and Dead cells. (B) Cells stained with Muse™ Caspase-3/7kit and analyzed by Muse™ Cell Analyzer. Data shows four cell populations – Live, Dead, Apoptotic, Apoptotic/Dead. (C) AAE induces caspase-3 activation . The statistical analysis of the data was carried out by use of a t-test. **P < 0.01, ***P < 0.001 compared to control. N.S.; not significant (each experiment, n=3). (D) Cells were treated with the indicated concentrations of AAE for 24 h. Protein level was measured by Western blotting. The β-actin probe served as protein-loading control.
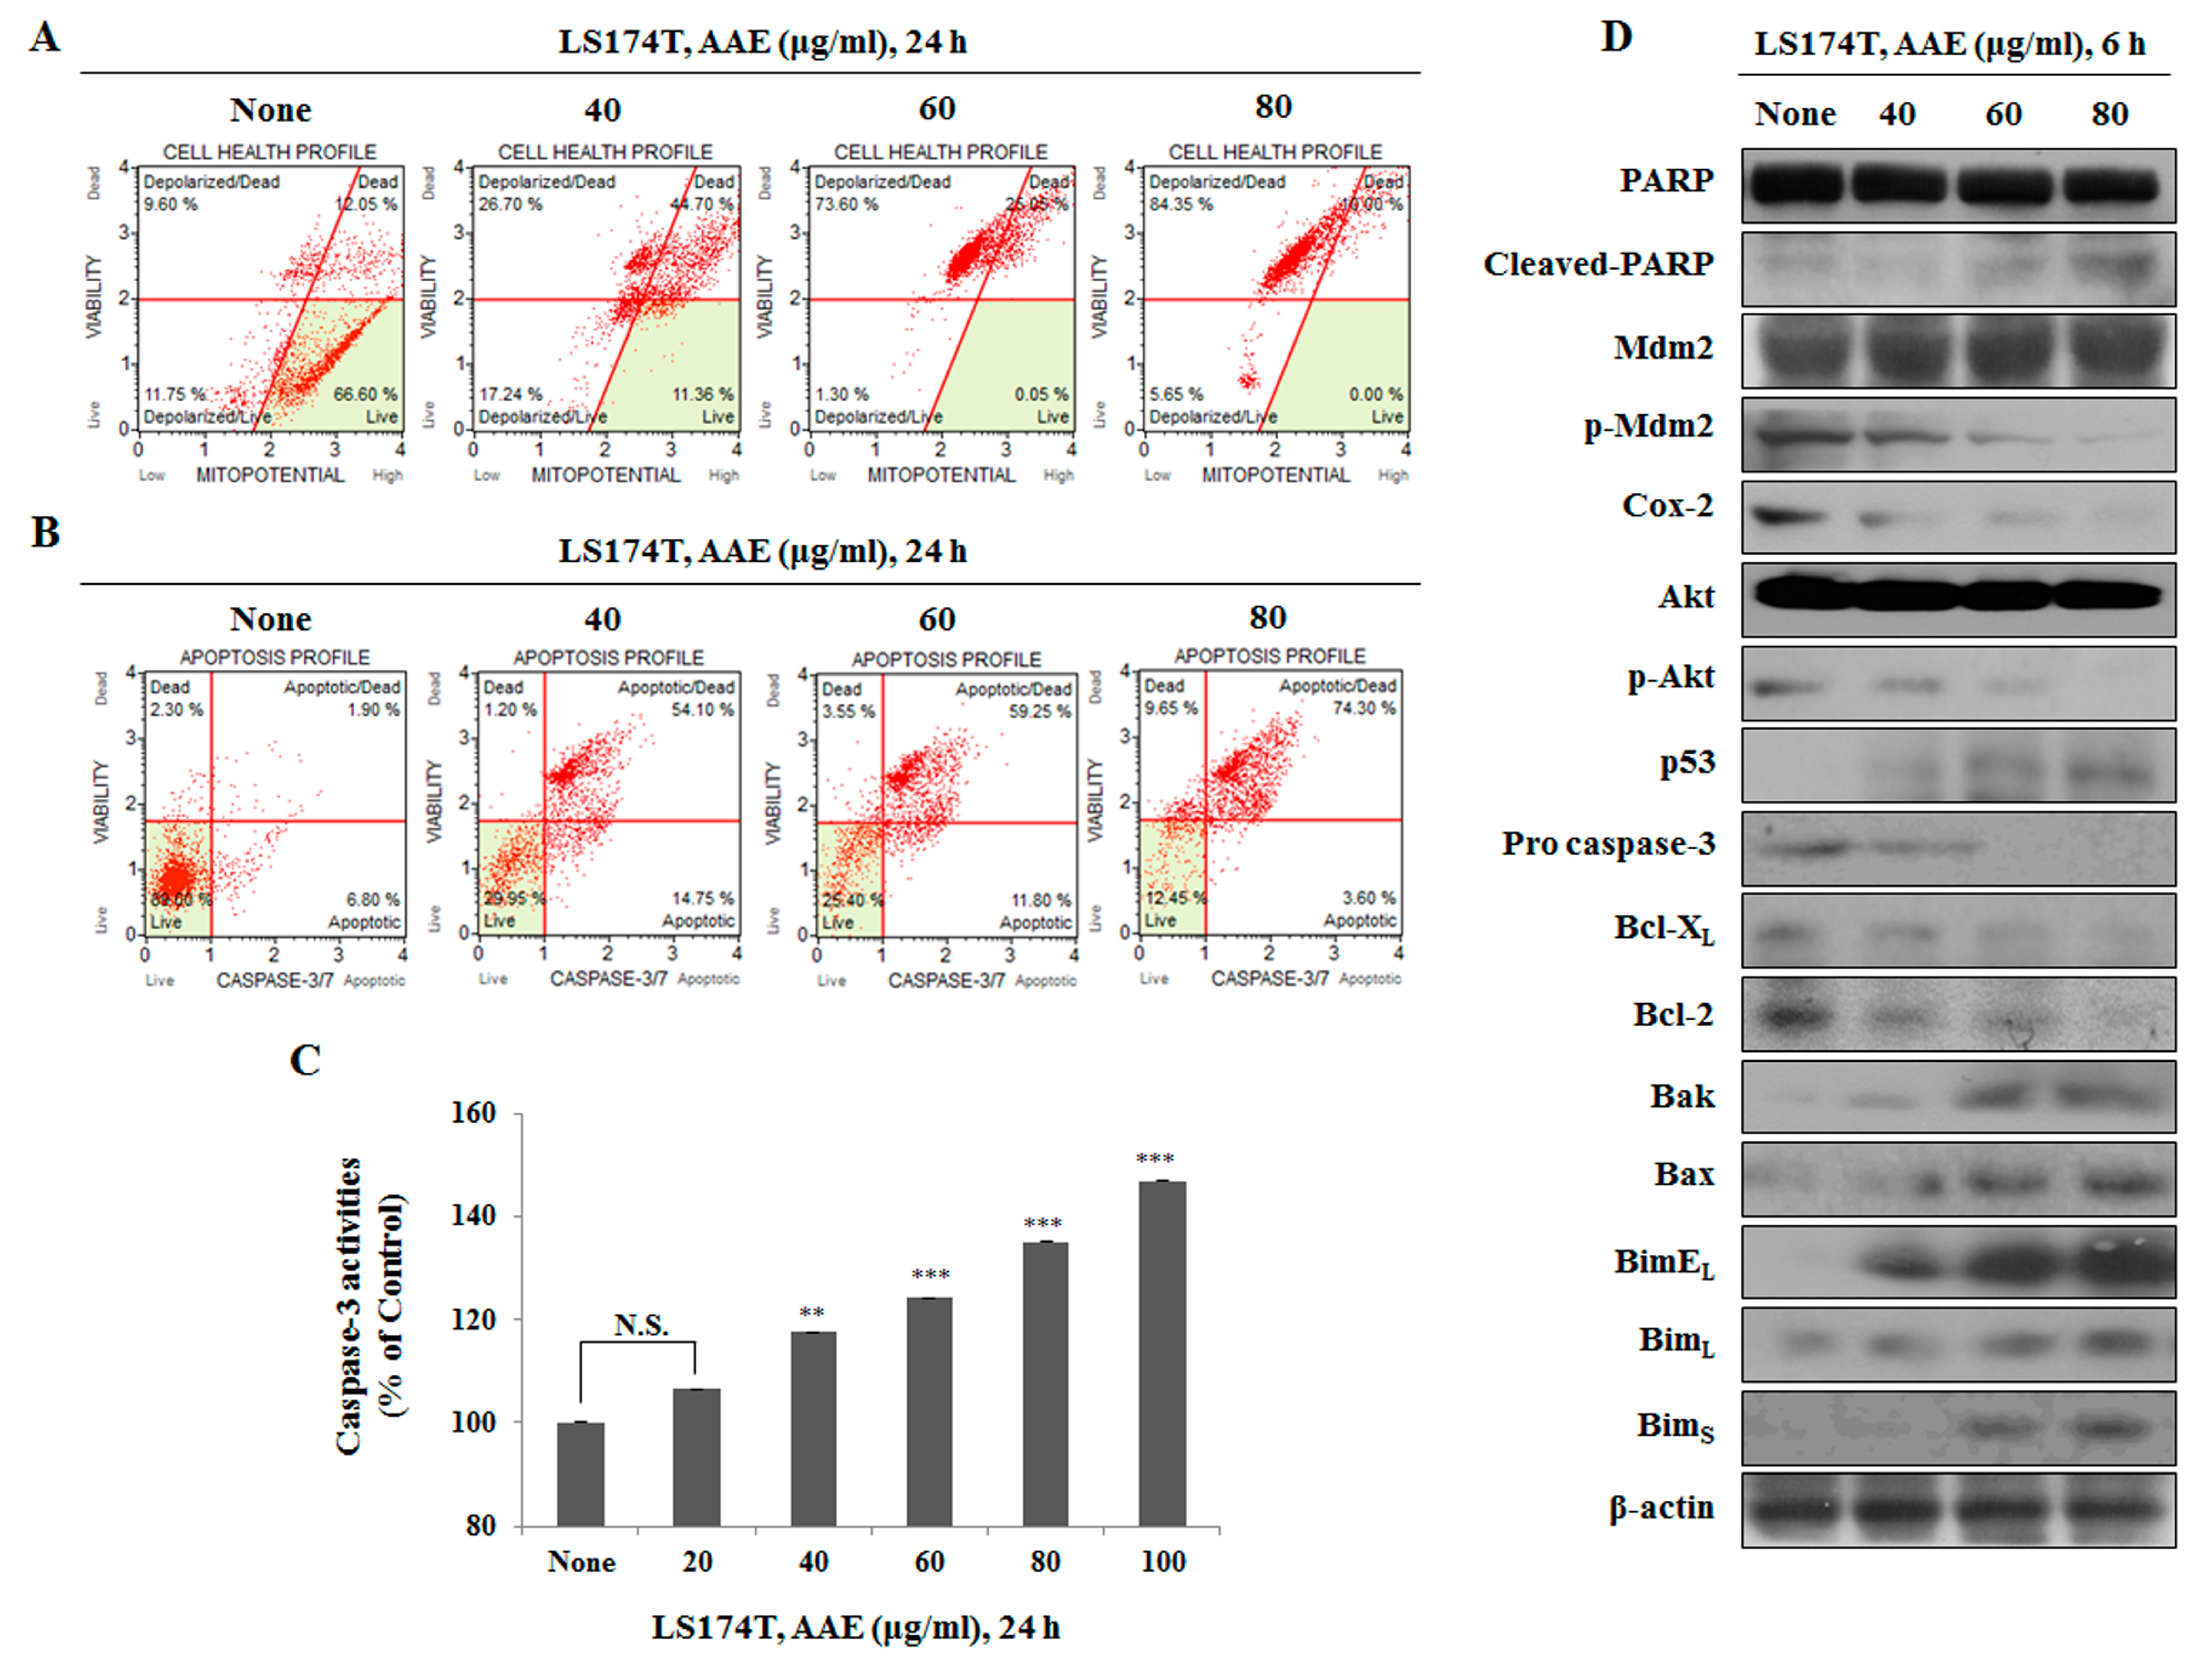
Figure 4.
AAE exerts apoptotic effects via p53-dependent manner. (A) Cells were pre-treated with 20 μM LY294002 or 10 μM Nutlin-3 for 30 min and co-treated with 60 μg/ml AAE 24 h. The statistical analysis of the data was carried out by use of a t-test. ***P<0.001 compared to control (each experiment, n=3). (B) AAE increased the LDH release in LS174T cells. The statistical analysis of the data was carried out by use of a t-test. ***P<0.001 compared to control (each experiment, n=3). (C) Cells stained with Muse™ Annexin V and Dead Cell Assay kit and analyzed by Muse™ Cell Analyzer. (D) Cells stained with Muse™ Mitopotential Kit and analyzed by Muse™ Cell Analyzer. (E) Cells stained with Muse™ Caspase-3/7kit and analyzed by Muse™ Cell Analyzer. (F) Protein level was measured by Western blotting. The β-actin probe served as protein-loading control.
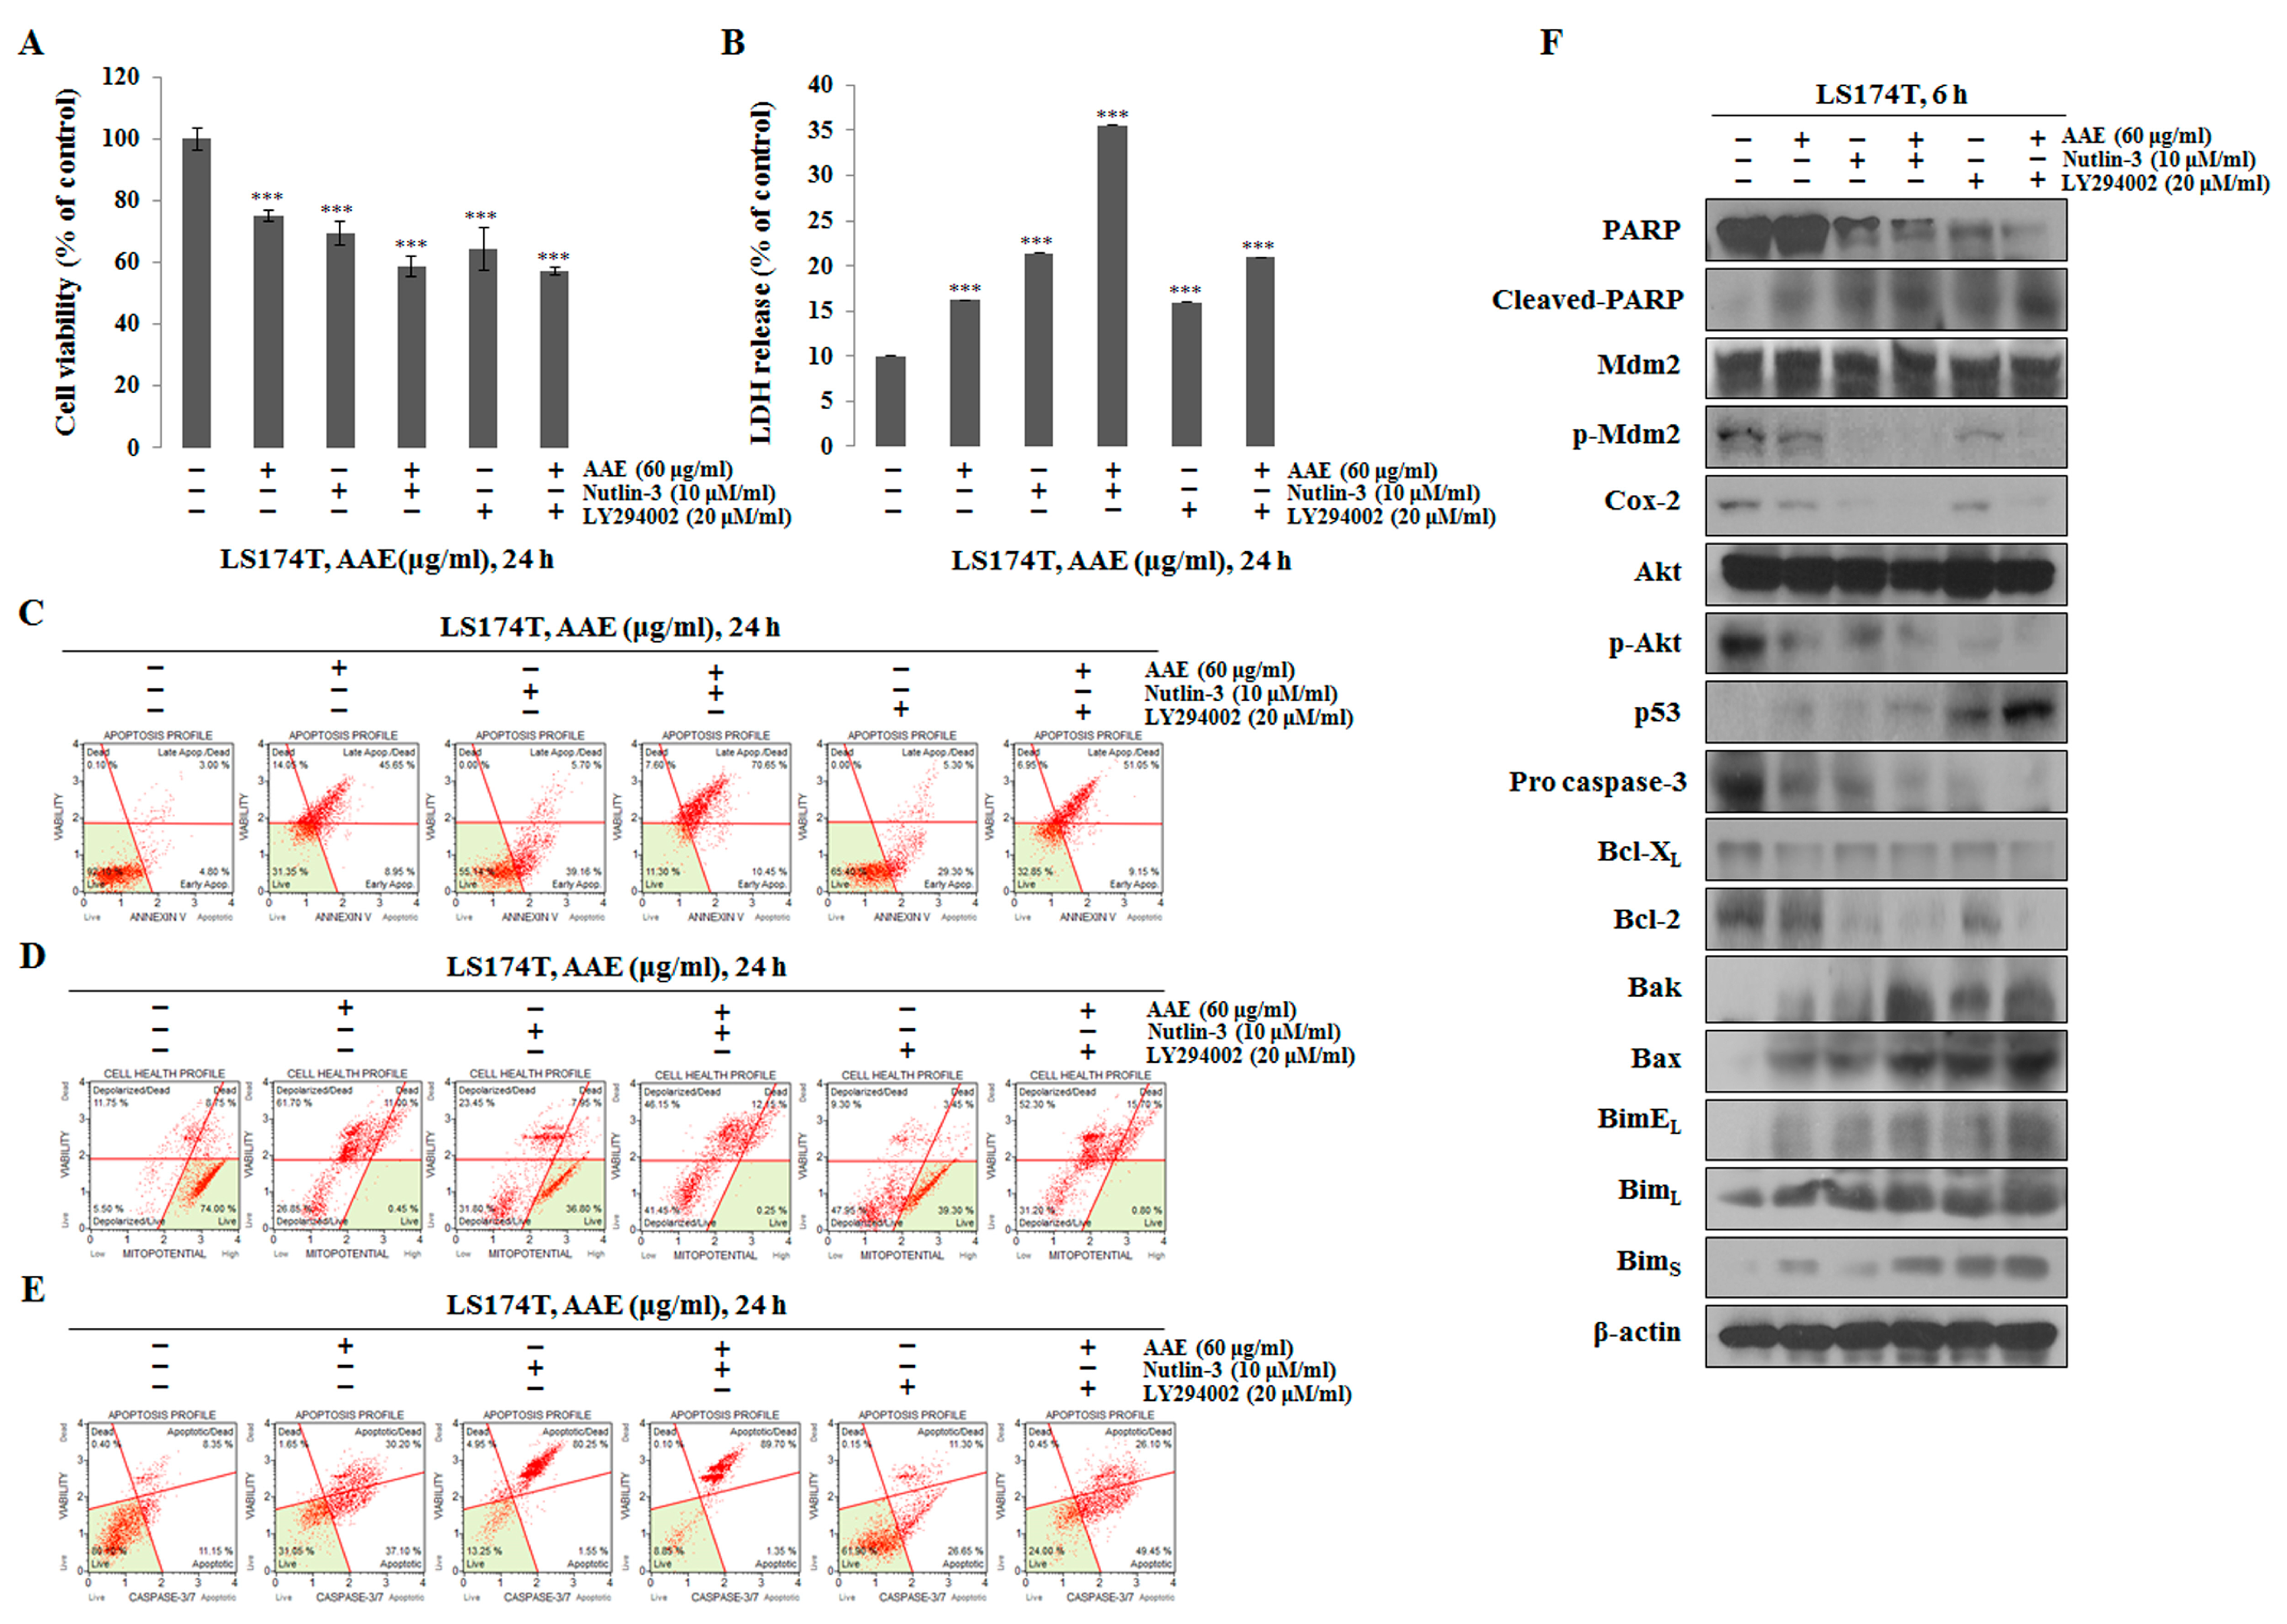
Figure 5.
AAE regulates mitochondrial membrane potential, leading to the secretion of cytochrome c and p53’s translocation to mitochondria. (A) Cells were treated with the indicated concentrations of AAE for 24 h. Fraction of mitochondria/cytosol proteins were analyzed by western blotting. (B), (C) Cells were treated with 60 μg/ml AAE 24 h, pre-stained with mitotracker before fixiation and permeabilization of cells and reacted with specific antibody. Florescence detected by confocal microscope.
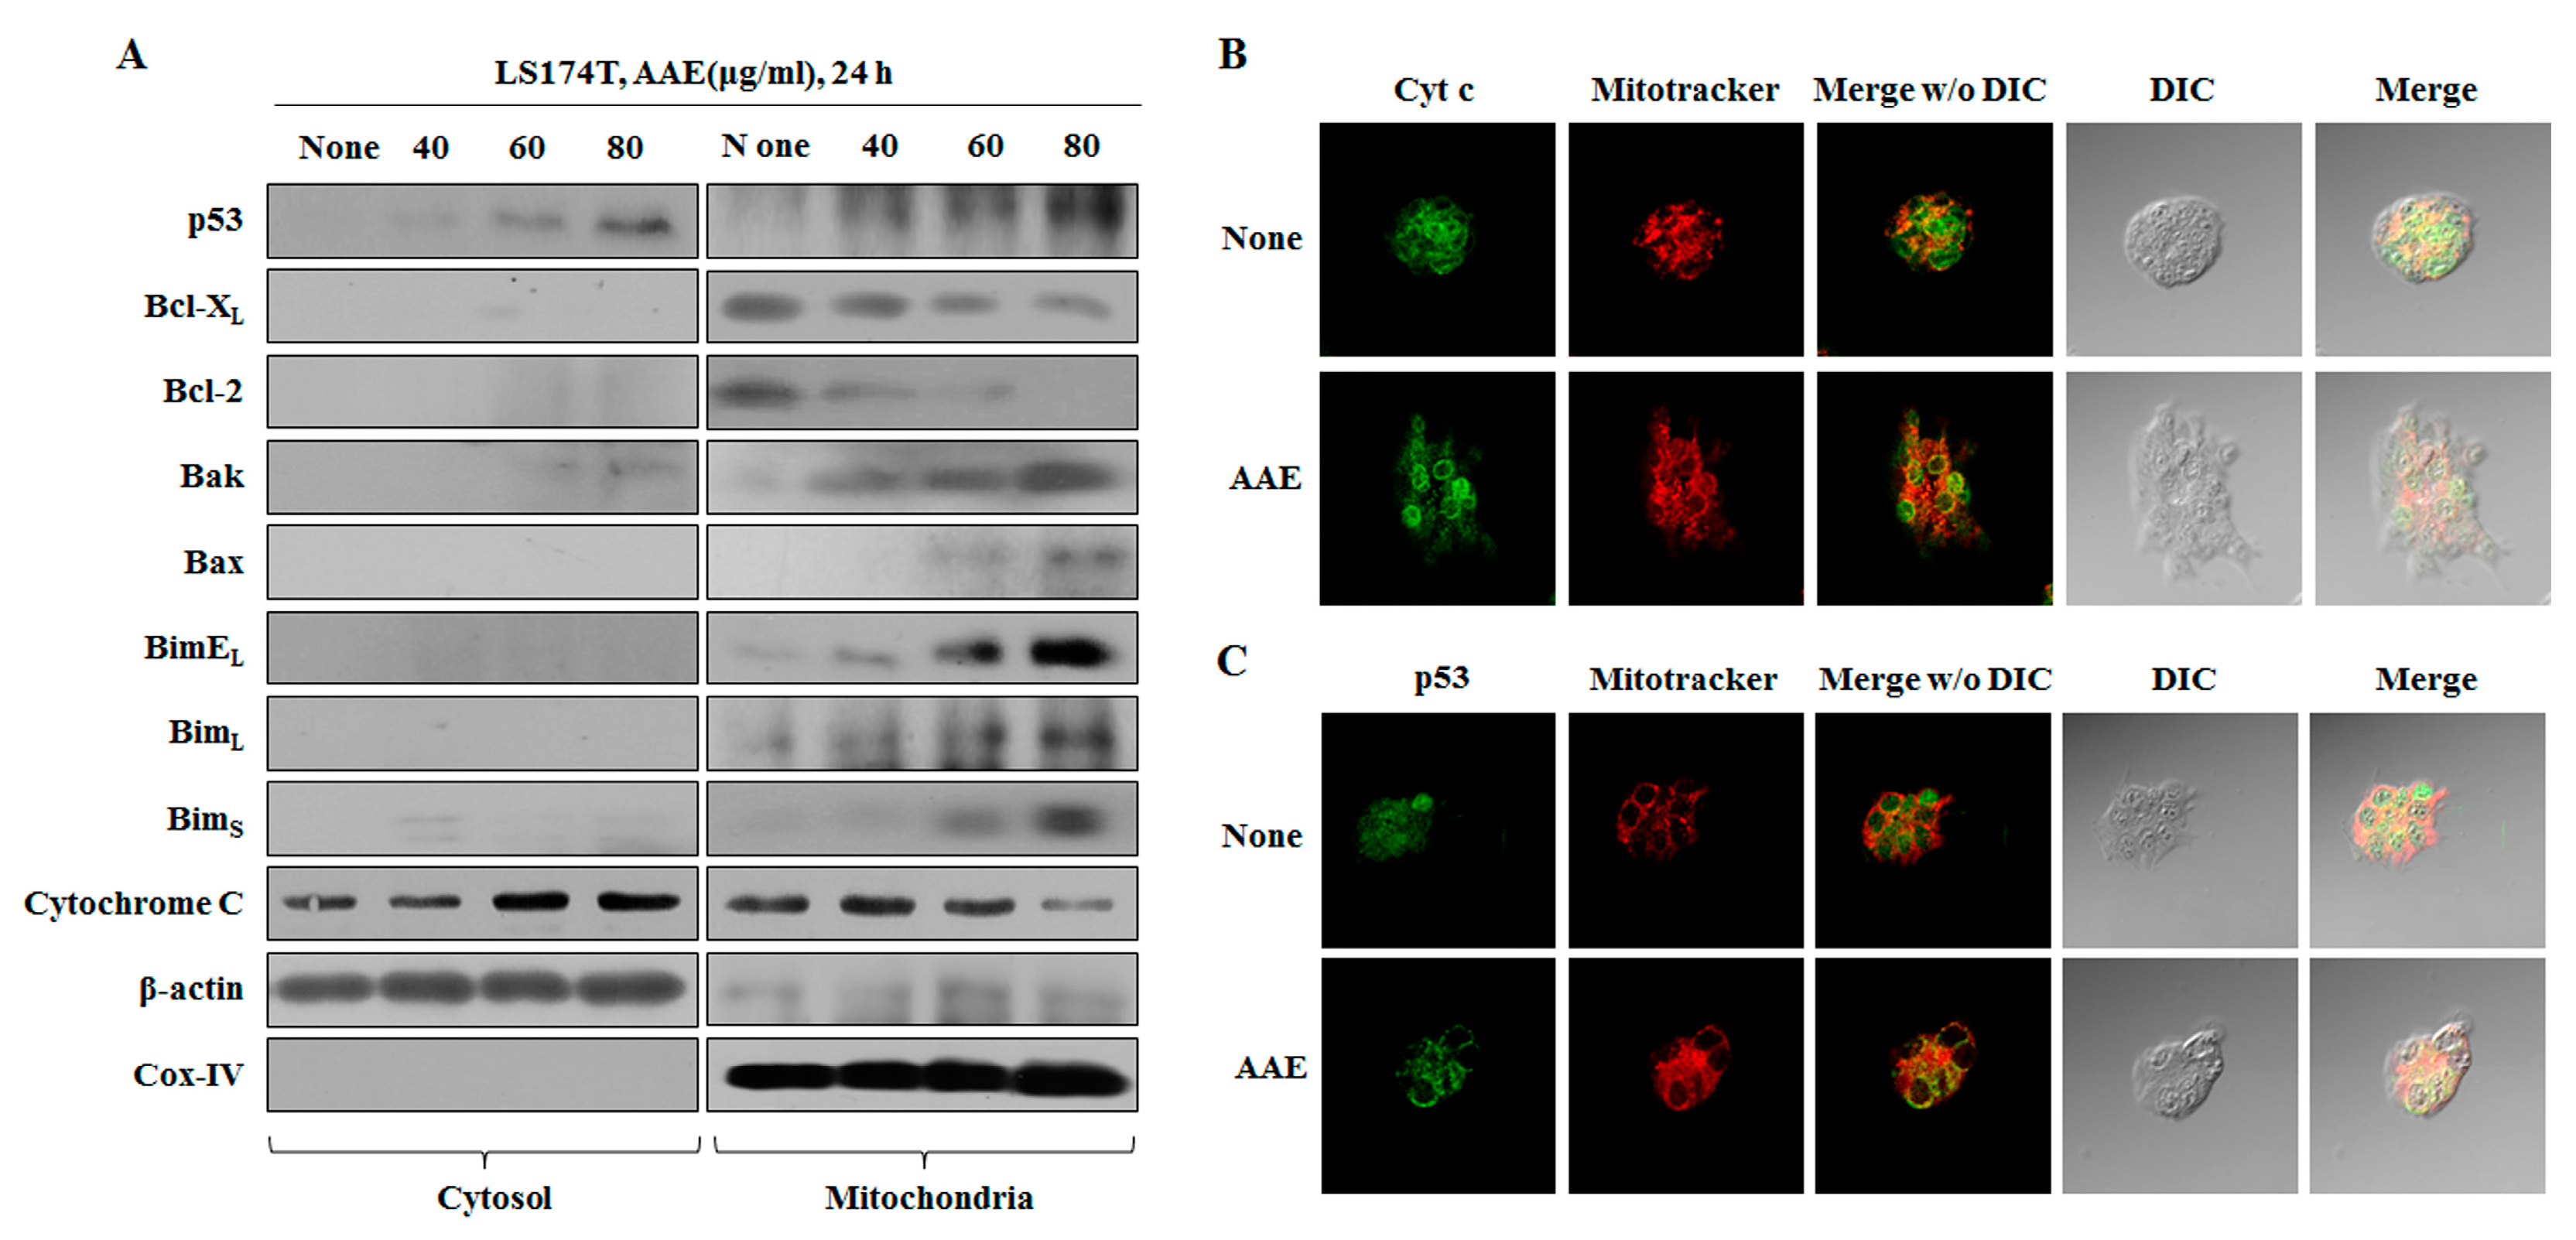
Figure 6.
AAE exerts apoptotic effects via p53-independent manner. (A) Cells were pre-treated with 20 μM pifithrin-α or 100 μM celecoxib for 30 min and co-treated with 60 μg/ml AAE 24 h. (B) AAE increased the LDH release in LS174T cells. The statistical analysis of the data was carried out by use of a t-test. **P < 0.01, ***P < 0.001 compared to control. N.S.;not significant (each experiment, n=3). (C) Cells stained with Muse™ Annexin V and Dead Cell Assay kit and analyzed by Muse™ Cell Analyzer. (D) Cells stained with Muse™ Mitopotential Kit and analyzed by Muse™ Cell Analyzer. (E) Cells stained with™ Caspase-3/7kit and analyzed by Muse™ Cell Analyzer. (F) Protein level was measured by Western blotting. The β-actin probe served as protein-loading control.
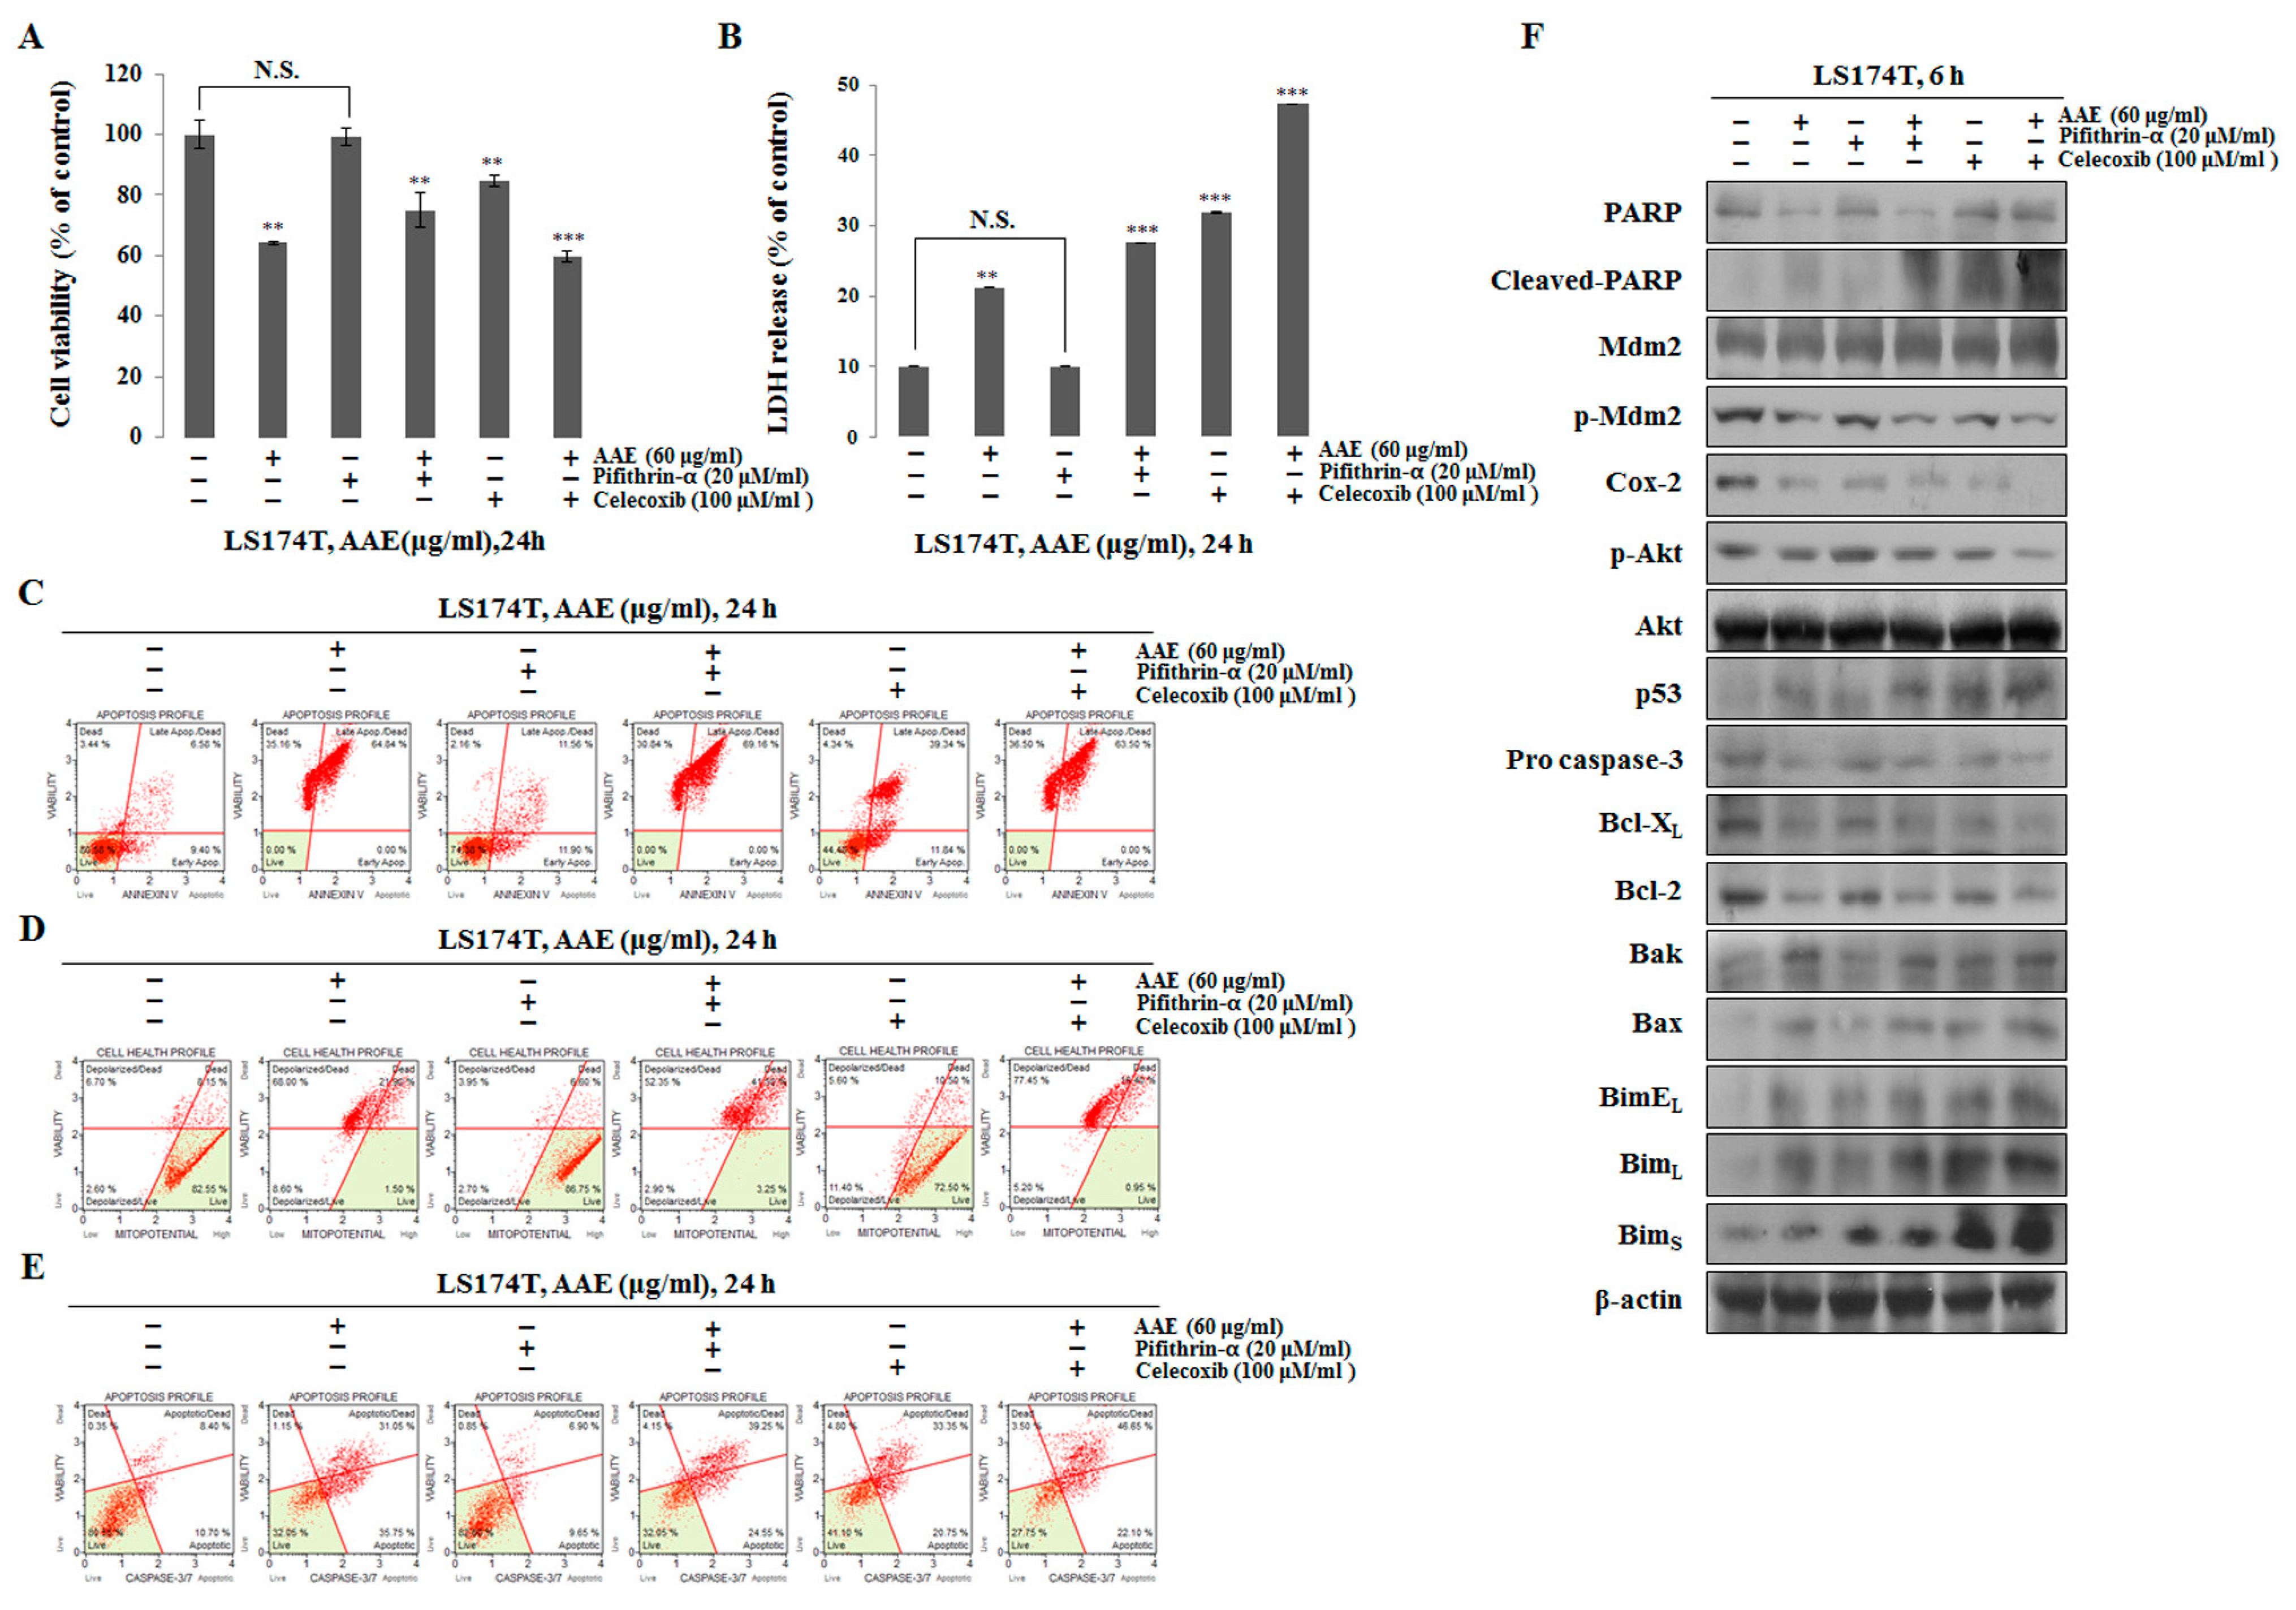
Figure 7.
AAE induces cell death and suppresses cell growth in LS174T xenograft model. (A) Measurement of tumor size and mouse weight. AAE groups reduced tumor growth compared with the control group. (B), (C) Analyzed protein levels by western blotting. Tissue samples were homogenized in RIPA lysis buffer. Mitochondria/cytosol protein fraction executed like an in vitro experiment. (D) H&E and TUNEL assay. Magnification, x100. (E) Specific proteins immunohistochemical staining assay. Arrows indicate positive reaction to specific proteins.
Disclaimer/Publisher’s Note: The statements, opinions and data contained in all publications are solely those of the individual author(s) and contributor(s) and not of MDPI and/or the editor(s). MDPI and/or the editor(s) disclaim responsibility for any injury to people or property resulting from any ideas, methods, instructions or products referred to in the content. |
© 2024 by the authors. Licensee MDPI, Basel, Switzerland. This article is an open access article distributed under the terms and conditions of the Creative Commons Attribution (CC BY) license (http://creativecommons.org/licenses/by/4.0/).
Copyright: This open access article is published under a Creative Commons CC BY 4.0 license, which permit the free download, distribution, and reuse, provided that the author and preprint are cited in any reuse.


