Submitted:
06 May 2024
Posted:
06 May 2024
You are already at the latest version
Abstract
Triticale is known for being an alternative energy source to usual cereals such as maize and wheat in poultry nutrition. Several studies suggested opposite results regarding its incorporation as a feed ingredient on laying hens’ production parameters. This article used a meta-analysis to assess the factors influencing the effects of triticale on layers’ performance. In July 2022, papers studying the effect of triticale on layers’ egg production (EP), egg weight (EW), egg yolk color (EYC), feed intake (FI), and feed conversion ratio (FCR) were identified on Google Scholar, PubMed, and Science Direct. According to the eligibility criteria of PRISMA (Preferred Reporting Items for Systematic Reviews and Meta-Analyses) guidelines, 6 articles were registered and segmented into 16 experiments for our meta-analysis. Overall, the trim and fill method revealed that triticale had similar impacts to conventional cereals on laying hens' performance. However, the meta-ANOVA and the meta-regression emphasized that triticale percentage, triticale strains and laying hens strains could significantly influence the effect of triticale on layers' performance. Indeed, the meta-Anova highlighted that the Hy-Line Brown strain and Joesong and Juanilo triticale strains in-duced the best laying hens’ performance. Moreover, the meta-regression emphasized a positive correlation between the triticale inclusion percentage and the EW in Juanilo triticale diets and a negative correlation between the triticale inclusion percentages and the EYC in the triticale and laying hens strains studied. Even though the funnel plot and the Egger linear test suggested sig-nificant publication bias, the present meta-analysis remains consistent research to understand how certain factors could influence the impact of triticale on layers' performance.
Keywords:
Triticale
; laying hens
; Performance
; Meta-analysis
1. Introduction
Corn and wheat, significant cereal grains, are frequently incorporated into the creation of poultry feed formulations. However, the last century opened a race to replace these conventional energy sources with new feed ingredients in the field of poultry production. Many factors such as global warming, the high price of these cereals (maize, wheat, etc.) and the current competition to improve animal productivity have been the sources of this trend [1]. Indeed, finding alternative cereals able to adapt to difficult weather, with lower production costs and similar nutritive values to common energy sources is of great importance in the present era.
The first steps of this process started with the inclusion of other cereals such as sorghum, or barley showing promising outputs in poultry nutrition [2,3]. Nevertheless, the use of these ingredients in human diets limited their utilization [4,5]. This context led several researchers to elaborate on new feed ingredients having most of the characteristics of interest to be used as an alternative energy source [6,7].
Among these human-made plants, Triticale stands as a hybrid cereal derived from crossing wheat and rye and employed as a substitute for maize [8] and wheat [9] in the nutrition of layers and broilers. Additionally, this crop is distinguished by its low cost and favorable protein content when compared to other cereals [8]. Furthermore, triticale is less used in human nutrition than conventional cereals [10,11,12,13], demonstrated a great ability to grow even under hard conditions and might be a good choice to increase the cereal’s production in the world [9].
Regarding the laying hens industry, numerous articles have explored the impact of varying levels of triticale inclusion on egg production. However, these papers underscored a range of conflicting outcomes regarding the effects of triticale on layer production parameters. The results of Cuca and Avila [14] and Choudhary and Netke [15] suggested that triticale decreased hens’ performance when it replaced 100% of wheat, milo, and maize. Moreover, other articles [16,17,18] reported that higher incorporation of triticale grain in the diet could decrease egg production. On the other hand, some scientists found that there was no significant difference in laying hens’ productivity, even when the feed formula was based only on triticale [19,20,21]. The conflicting results highlight the need for a more thorough investigation to gain a clearer understanding of triticale’s impact on laying hens’ production parameters. In this context, aggregating the findings across all the published papers is crucial to ultimately identify the factors that influence the impact of triticale on layer nutrition. Utilizing meta-analysis, a statistical tool to obtain an unbiased evaluation from multiple articles [22], would indeed be the appropriate approach to achieve these objectives. Meta-analysis can appropriately combine study findings and ascertain the genuine impact of an intervention, considering the sources of heterogeneity among studies and increasing the sample size [23]. As previously asserted, a huge number of articles have examined the effect of triticale on the production parameters of laying hens. Yet, none of them have explored the impact of various levels of triticale inclusion on the production parameters of layers through the utilization of meta-analysis. To bridge the existing knowledge gap, this study sought to obtain precise insights into the impact of triticale on hens’ performance and identify the factors that influence triticale’s effect on laying hens’ production parameters via the application of meta-analysis.
2. Materials and Methods
2.1. Literature Search and Screening Procedure
A systematic search was conducted following the PRISMA 2020 statement, which provides updates for the systematic reporting of reviews [24]. The articles were acquired using the keywords “triticale” and “laying hens”, either individually or in combination, from Google Scholar (https://scholar.google.com/ (accessed on July 04, 2022)), PubMed (https://pubmed.ncbi.nlm.nih.gov/ (accessed on July 04, 2022)), and Science Direct (https://www.sciencedirect.com/ (accessed on July 04, 2022)). The utilization of these two keywords aimed to enhance the likelihood of identifying eligible articles, particularly because certain studies assessed relevant parameters without explicitly mentioning them in the title and abstract. The searched articles were saved in separate folders according to the online database in which they were identified. Then, they were screened, at first, using the title and abstract. In this step, review papers and articles on different topics were removed. The last stage was the full-text screening in which papers were assessed according to the inclusion and exclusion criteria as it is detailed in the next subsection and Figure 1. It is noteworthy to highlight that articles were treated as variables without regard to the year of publication.
2.2. Inclusion and Exclusion Criteria
A study was deemed eligible for inclusion in this meta-analysis if it fulfilled the following criteria: (1) conducted as an in vivo study in English; (2) focused on examining the impact of dietary triticale inclusion levels as treatment variable; (3) compared the effects of one or more triticale inclusion levels to those of other cereals (such as maize, wheat, etc.); (4) utilized laying hens as the experimental animal model; (5) reported at least one response related to hens’ production parameters (including Egg production (EP); Egg Weight (EW); Feed intake (FI); Feed Conversion Ratio (FCR); and Egg Yolk Color (EYC)), along with the respective variance (standard deviation (SD), or standard error (SE)). Conversely, review articles, studies where triticale served as the sole basal diet, and experiments involving animals other than laying hens were excluded from consideration.
2.3. Evaluation of Bias Risk
The risk of bias for the included papers was independently appraised by two researchers using the Systematic Review Center for Laboratory Animal Experimentation (SYRCLE)’s RoB tool [25]. The evaluation involved scrutiny across ten distinct categorical domains of bias: Selection bias (domains 1-3), Performance bias (domains 4 and 5), Detection bias (domains 6 and 7), Attrition bias (domain 8), Reporting bias (domain 9), and other potential biases (domain 10) [25]. Each domain was categorized in an Excel file as “Yes” indicating a low risk of bias, “No” indicating a high risk of bias, or “Unclear” indicating an uncertain risk of bias. The disagreements occurring in the assessment process were settled through discussions between the two researchers. After completing the full assessment, the proportions of high, low, or unclear risk of biases in each domain were expressed in percentages and visualized through an Excel diagram.
2.4. Collection of Data
The eligible articles were documented using an electronic form designed in Microsoft Excel (Microsoft Corp., Redmond, WA, USA). Information extracted from the studies encompassed (1) author, (2) year of publication, (3) experimental starting age, (4) experimental period, (5) laying hens’ strain, (6) triticale’s strain, and (7) treatment. Extracted result data included (1) egg production, (2) egg weight, (3) feed intake, (4) feed conversion ratio, and (5) egg yolk color.
2.5. Analysis of Data
Statistical analyses were conducted via the R software (version 4.1.0, R Development Core Team, 2021, http://www.r-project.org (accessed on August 2022)), employing the meta and metafor packages, and all hypothesis testing was performed at the 5% significance level. The averages of the experimental units (control and treatment) were recorded as continuous result data, inserted into a comma-separated value (CSV) file, and then analyzed in R software. Separate meta-analyses were carried out for each laying hen’s production parameter studied (egg production, egg weight, feed intake, feed conversion ratio, and egg yolk color). The variability in triticale effects on laying hens’ production parameters was assessed using standardized mean difference (SMD) analysis. Hedges’ g was employed to calculate the effect size of each experimental unit comparing diets with or without triticale inclusion levels for each outcome variable. The random-effects model was chosen due to the typical presence of heterogeneity at various levels in pooled analysis [23]. Cochran’s Q test was utilized to evaluate the statistical heterogeneity of the effect size, with heterogeneity identified by the I2 value. This value represents the percentage of variation in effect sizes not attributable to sampling error [26]. Meta-ANOVA and meta-regression tests were conducted to explore whether factors such as triticale strain, laying hens’ strain, and triticale inclusion percentages influenced heterogeneity in effect size. Finally, publication bias was assessed to validate the study results and evaluate the risk of bias in individual studies. Funnel plots were generated to visualize bias, and Egger’s linear test was conducted to precisely evaluate publication bias using numerical data.
3. Results
3.1. Data Set
In Figure 1, the PRISMA flow diagram outlines the steps of our search strategy. In short, 3741 citations were found across various databases (Google Scholar: 3460, PubMed: 7; Science Direct: 274). Through screening, duplicates and unsuitable papers were removed. Ultimately, 6 articles were selected for data extraction and meta-analysis. These articles yielded 16 experiments, as some contained multiple treatments, particularly various percentages of triticale inclusion. Each article’s triticale inclusion percentages determined the experiment divisions. An experiment was constituted by a control diet linked with a specific triticale inclusion percentage. Table 1 showcases the datasets and experimental specifics of these 6 studies, published between 1987 and 2021. The experiments involved laying hens from various strains including Leghorn, Babcock B-380, Dekalb XL, Lohmann, and Hy-Line Brown. Triticale inclusion levels in these studies ranged from 0% to 70%.
3.2. Assessment of Bias Risk
Figure 2 illustrates the results of assessing bias risk across the six studies included in this meta-analysis. In terms of sequence generation (domain 1), 83% of the studies demonstrated low bias risks, with one study (17%) showing unclear bias risk. Regarding baseline characteristics (domain 2), 67% of studies had low bias risks, while 33% exhibited high bias risks. Allocation concealment (domain 3) revealed that 67% of studies had unclear bias risks, with 33% showing high bias risks. In random housing (domain 4), 67% of studies had low bias risks, and 33% had unclear bias risks. Caregiver blinding (domain 5) showed 67% unclear and 33% high bias risks. For random outcome assessment (domain 6), 83% of studies had unclear bias risks, while 17% had low bias risks. Outcome assessor blinding (domain 7) indicated 67% unclear and 33% high bias risks. Assessment of incomplete outcome data (domain 8) revealed 50% low and 50% unclear bias risks. Selective outcome reporting (domain 9) displayed 17% low, 50% high, and 33% unclear bias risks. Other sources of bias (domain 10) showed 34% high bias risks, with both unclear and low bias risks at 33%. Overall, the included studies had approximately 45% unclear, 33% low, and 22 high bias risks.
3.3. Impact of Triticale on Production Parameters of Laying Hens
Figure 3, Figure 4, Figure 5, Figure 6 and Figure 7 illustrate the impact of triticale on laying hens’ performance using random-effect models. Incorporating triticale into laying hens’ diet demonstrated varied effects: an increase in EP (Figure 3; SMD = 0.1654, 95% CI: -0.2072 to 0.5380, P = 0.38), EW (Figure 4; SMD = 1.7458, 95% CI: -0.0068 to 3.4984, P = 0.05) and FI (Figure 6; SMD = 0.5568, 95% CI: -0.3069 to 1.4206, P = 0.21). Conversely, it led to a decrease in FCR (Figure 7; SMD = -0.1494, 95% CI: -0.7207 to 0.4219, P = 0.61) and EYC (Figure 5; SMD = -7.7299, 95% CI: -10.4179 to -5.0419, P < 0.01). Notably, the most substantial impact (P < 0.01) was observed on EYC, indicating a significant reduction induced by triticale. These findings suggest that triticale’s influence on laying hens’ EP, EW, FI, and FCR is comparable to that of common cereals (corn, wheat, milo…). However, it significantly reduced the EYC compared to these conventional energy sources. The analysis of the effect size heterogeneity was conducted using I2 and τ2 values, revealing significant levels of heterogeneity (I2 >75%) for all parameters studied. EYC exhibited the highest I2 and τ2 values (I2 = 98.2%, τ2 = 23.5434) while EP demonstrated the lowest (I2 = 90.4%, τ2 = 0.4730).
3.4. Impact of Triticale and Laying Hens' Strains on Performance of Laying Hens
Another moderator analysis was conducted due to significant heterogeneities (I2 > 75%) observed in all studied parameters. The outcomes of the meta-ANOVA analysis examining the effects of triticale on EP, EW, FI, FCR, and EYC are outlined in Table 2 and Table 3.
Initially, the studies were categorized into five groups to investigate the impact of different triticale strains (Juanilo, Tathcak-97, Bogo, Joesong and Unknown strains) on laying hens' production parameters (Table 2). Sub-group analyses (meta-ANOVA) revealed that the strain factor influenced (P < 0.0001) the effects of triticale on EP. Apart from the Unknown strain (SMD = -1.2838), every triticale strain exhibited a positive effect size or increasing effect on EP (Juanilo: SMD = 0.0802; Joesong: SMD = 0.0322; Tathcak-97: SMD = 1.1490; Bogo: SMD = 0.7258) with significant differences (P < 0.0001) between the group of triticale’s strains. Additionally, the meta-ANOVA indicated that EW was increased (P < 0.0001) by Juanilo (SMD = 4.0086), Joesong (SMD = 0.7262), and Unknown strains (SMD = 0.7336) whereas it was significantly decreased by Tathcak-97 (SMD = -1.4569) and Bogo (SMD = -1.6405) strains. Regarding FI, it was increased (P < 0.0001) by Juanilo (SMD = 0.0554), Joesong, Bogo and Unknown triticale’s strain but decreased by Tathcak-97 strain (SMD = -0.1010). For FCR, the Tathcak-97 triticale strain induced negative effect size (SMD = -2.2018), whereas the other triticale strains induced positive effect sizes (Juanilo: SMD = 0.2868; Bogo: SMD = 0.1146; Joesong: SMD = 0.0322) with significant differences (P < 0.0001) between the triticale strains. EYC was reduced by every triticale strain (Juanilo: SMD = -9.3294; Bogo: SMD = -8.0388; Joesong: SMD = -4.8350) despite no differences between the strain’s groups (P = 0.0936).
Subsequently, a second meta-ANOVA (Sub-group analysis) was performed based on laying hens’ strains to check if that factor could impact layers’ performance (Table 3). The sub-group analysis results suggested that EP was increased in Hy-Line Brown (SMD = 0.0322), Babcock B-380 (SMD = 1.1490), and Lohmann (SMD = 0.7258) strains, but it was decreased in Leghorn strain (SMD = -0.1060) and showing differences (P < 0.0001) between the group of strains. The EW showed positive effect sizes in Leghorn (SMD = 3.5801), and Hy-Line Brown (SMD = 0.7262) strains but negative effect sizes in Babcock B-380 (SMD = -1.4569) and Dekalb XL (SMD = -1.6405) strains with differences (P < 0.0001) between the group of strains. The impact of the layers’ strains was also significant (P < 0.0001) on FI and FCR, with negative effects in Babcock B-380 (FI: SMD = -1.3847; FCR: SMD = -2.2018) and positive effects in Leghorn (FI: SMD = 0.6657; FCR: SMD = 0.2868), Lohmann (FI: SMD = 3.4901; FCR: SMD = 0.1146) and Hy-Line Brown (FI: SMD = 0.6019; FCR: SMD = 0.0322). Every laying hen’s strain (Leghorn: SMD = -9.3294; Hy-Line Brown: SMD = -4.8350; Dekalb
XL: SMD = -15.4948; Lohmann: SMD = -0.6231) induced a negative effect on EYC with differences (P < 0.0001) between the group of strains.
3.5. Impact of Triticale Percentages on Performance of Laying Hens
The meta-regression test (Table 4 and Table 5) was conducted according to the triticale inclusion percentages in groups of triticale and laying hens’ strains with significant heterogeneity levels (I2 > 50%) to find out if it could influence the performance of laying hens. The meta-regression regarding the impact of triticale percentages in triticale strains suggested that the regression models were not significant for the EP, FI, and FCR (Table 4). On the other hand, a significant effect of triticale percentages was noticed on EW in the group of Juanilo strain (Estimate = 0.1292, QM = 4.7301, R2 = 39.40, P = 0.0296). In addition, the meta-regression showed a significant effect of triticale percentages on EYC in the groups of Juanilo (Estimate = -0.1695, QM = 24.7806, R2 = 89.16, P < 0.0001) and Joesong (Estimate = -0.3741, QM = 48.4956, R2 = 77.84, P = 0.0011) strains. For the meta-regression on the effect of triticale percentages in laying hens’ strains, the results showed that only the EYC was influenced (P < 0.05) by the triticale inclusion percentages (Table 5). Indeed, EYC was linearly reduced by the constant augmentation of triticale inclusions in diets on Leghorn and Hy-Line strains.
3.6. Publication Bias
A publication bias assessment was conducted to examine potential errors in this meta-analysis concerning the factors of interest (EP, EW, FI, FCR, and EYC). Funnel plots (Figure 8) indicated noticeable publication bias for EW and EYC, as evidenced by the clustering of grey data points primarily on the right and left sides, respectively. Specifically, for EW, most studies showed a positive standardized mean difference (SMD: [0; 15[) on the right side, with a standard error range of 0 to 1.4, while EYC exhibited studies with a negative SMD (]-20; 0]) on the left side, with a standard error ranging from 0 to 2, and few symmetrical articles on the opposite side of the plot. In contrast, funnel plots for the remaining laying hens’ parameters (EP, FI, and FCR) displayed symmetry, with a roughly equal number of studies on each side of the vertical line representing the average effect size. Results from Egger’s linear regression test (Table 6) supported these findings, indicating significant study bias only for EW (Bias = 7.7581, P = 0.0256) and EYC (Bias = -10.1189, P = 0.0008). The white data points on various funnel plots (Figure 8) represent studies added through the trim-and-fill procedure to address potential publication bias. Table 7 presents the outcomes of this procedure, suggesting negative effect sizes for FCR (SMD = -0.1494, I2 = 94.2%, P = 0.6082) and EYC (SMD = -3.2429, I2 = 98.5%, P = 0.0872), while EP (SMD = 0.0069, I2 = 92.0%, P = 0.9723), EW (SMD = 0.2126, I2 = 97.7%, P = 0.8561), and FI (SMD = 0.3401, I2 = 96.9%, P = 0.4675) displayed positive effect sizes.
4. Discussion
Finding alternative energy sources to usual cereals (Maize, wheat, etc.) is a continual concern in poultry nutrition. Several articles have proposed the advantageous effects of cereal substitutes such as triticale on layers’ performance [20,21]. Conversely, specific reports have highlighted the negative impact of including triticale on egg production [17,18]. Given the potential variability among these previous findings due to various factors, the current meta-analysis aims to explore the determinants influencing the effects of different triticale inclusion levels on laying hens’ production parameters.
4.1. Assessment of Risk of Bias
A good systematic review (SR) is the result of credible data associated with consistent outcomes of the included articles [31]. Assessing the risk of bias in specific studies is crucial for systematic reviews (SR). In this meta-analysis, we employed SYRCLE’s RoB tool for animal intervention studies to evaluate bias risk. This tool, designed to assess methodological quality in articles, has been adapted to address fundamental bias aspects in animal experiments [25]. Our assessment revealed that low risk of bias (33%) was more prevalent in the meta-analysis studies compared to unclear risk of bias (45%) and high risk of bias (22%). The notable levels of high (22%) and unclear (45%) bias risk could be attributed to articles (5) published before 2005, potentially characterized by inadequate scientific rigor and methodological clarity. However, despite these findings, this meta-analysis remains valuable for investigating triticale's effects on layers' production parameters, as the high risk of bias (22%) remains below 50%.
4.2. Effects of Triticale Grains, Triticale and Laying Hens’ Strains on Layers Performance
The initial findings from our meta-analysis indicate that triticale did not have significant impacts (p > 0.05) on EP, EW, FI, and FCR but consistently decreased (P < 0.05) EYC. These results align with those of Lim et al. [8], who also found that triticale had no significant effects on layers' production parameters (EP, EW, FI, and FCR) but did reduce EYC. The paler yolk color associated with triticale consumption has been attributed to its low carotenoid content [21,32]. Additionally, several authors [29,33] have suggested that incorporating triticale into laying hens’ diets, either as a primary energy source or as a partial replacement for other cereals, did not significantly affect laying rate, feed conversion ratio, egg mass, or productivity. Conversely, Cuca and Avila [14] and Choudhary and Netke [15] reported that replacing cereals such as wheat and milo with triticale decreased layers’ performance. This discrepancy in results may be due to the use of different triticale varieties in various experiments. Older triticale strains were known to contain higher levels of soluble pentosans [34,35], trypsin inhibitors, alkyl-resorcinols, and pectins [36]. Thus, studies reporting the negative effects of triticale on laying hens' production parameters likely used these older triticale varieties, as they were conducted before 1990 [14,15]. The non-significant impact of triticale on layers' performance could be attributed to the use of triticale varieties characterized by lower levels of anti-nutritional factors. Boros [37] and Bielski et al. [38] have emphasized new triticale varieties with reduced anti-nutritional factors, improving yield and nutritive value.
The variation in anti-nutritional factors’ concentrations among different triticale strains may also explain the significant differences observed in the results of the meta-ANOVA or subgroup analysis based on triticale strains. For example, the unknown triticale strain developed before 1990 [16] induced a negative effect size on EP and a less pronounced increase in EW, whereas recent strains such as Juanilo and Joesong exhibited positive effect sizes on EP, EW, and FI [8,28].
Several authors [39,40] have recognized animal strain as a factor influencing dietary impacts in poultry nutrition. The results of our meta-analysis confirm this notion by demonstrating significant differences in triticale's effects on the performance of various laying hens' strains. Overall, the Leghorn and Hy-Line Brown strains appear to yield the best outcomes across all parameters studied. However, the Hy-Line Brown strain may have a slight advantage over Leghorn due to its higher EP, lower FCR, and less pronounced decrease in EYC. These findings may be attributed to the use of a recent Hy-Line Brown strain [8] compared to older Leghorn strains [21,30]. It is hypothesized that the recent strain may possess a higher ability to counteract the anti-nutritional factors in triticale, thereby leading to better performance compared to older laying hens’ strains (Leghorn, Babcock B-380, Lohman, Dekalb XL…).
4.3. Effects of Triticale Percentages on Layers Performance
The meta-regression was run using the triticale inclusion percentages of studies as a covariate to find out if that factor could influence the performance of laying hens grouped according to the triticale and hens’ strains. In the meta-regression of the impact of triticale percentages on laying hens grouped according to the triticale strains. The results revealed that the regression model was significant only in the Juanilo strain on EW and in the Juanilo and Joesong strains on EYC. The outcomes suggested that there was a significant positive correlation between the triticale percentages and the laying hens’ EW in the Juanilo strain while there were significant negative correlations between the triticale percentages and the laying hens' EYC in the Juanilo and Joesong strains. Silversides and Budgell [41] stated that there is a clear relationship between albumen (egg protein component) and egg weight. Also, triticale has been reported to contain a relatively high protein level oscillating between 10.5 and 14.6% [42]. Therefore, the increasing tendency of EW according to the progressive inclusion of triticale in diets might be due to its higher protein level of triticale compared to other cereals. Whereas the linear reductions of EYC in Juanilo and Joesong strains are simply caused by the low level of carotenoid in triticale as stated previously [21,32].
Concerning the meta-regression of the impact of triticale percentages on laying hens grouped according to the laying hens’ strains. The outcomes showed that the regression model was significant in Leghorn and Hy-Line Brown strains on EYC. Similarly, to the previous meta-regression, these results meant that there were negative correlations between the triticale percentages and the laying hens’ EYC in Leghorn and Hy-Line Brown strains. This decreasing tendency of EYC is also due to the small amount of carotenoid in triticale [11,23].
4.4. Analysis of Heterogeneity and Publication Bias
Significant heterogeneities between studies (I2 > 75%) were evident for every laying hen’s production parameter (EP, EW, EYC, FI, and FCR), potentially linked to the diverse triticale varieties or inclusion percentages utilized in the meta-analysis studies.
Furthermore, the quality of studies included in this meta-analysis was assessed, revealing a publication bias in EW and EYC (Egger's test P < 0.05). Publication bias occurs when research findings are distorted due to the selective publication of studies based on their characteristics or results [43]. This discrepancy in published literature can potentially influence the outcomes of meta-analyses. To mitigate this bias, we addressed it using the trim-and-fill procedure. This approach is effective in identifying and adjusting for publication bias by removing studies contributing to asymmetrical funnel plots, thereby minimizing its impact on overall effect estimates [44]. Additionally, it involves inputting missing studies based on bias-adjusted overall estimates [45].
The trimmed effect sizes indicated that incorporating triticale into the diet resulted in decreased egg yield and feed conversion ratio (FCR), but increased egg production, egg weight, and feed intake. However, these effects did not reach statistical significance, suggesting that dietary triticale had a comparable impact to conventional cereals on layers' production parameters. These findings align with previous research by Castanon et al. [21].
Despite employing the trim and fill model, high heterogeneity (I2 > 75%) persisted for each factor. This outcome may be attributed to the variability among layers and triticale strains, as well as environmental factors such as air movement, temperature, humidity, and the type of housing utilized across the experiments included in our meta-analysis.
5. Conclusions
The trim and fill method suggested that triticale had a comparable overall effect on layers' performance to that of common cereals like wheat and corn. Also, the meta-ANOVA showed that triticale and laying strains could significantly influence the effects of triticale on laying hens' performance. In addition, the meta-regression analysis emphasized that higher inclusion of Juanilo and Joesong triticale strains might significantly increase the EW and decrease the EYC. Although this study exhibited some evidence of bias risk and publication bias, it remains essential to evaluate the factors influencing the impact of triticale grains on laying hens' production parameters. It would assist farmers in the laying hen industry who are considering incorporating triticale into their diet formulations by providing valuable insights into the essential parameters that those farmers need to consider when making this decision. However, further exploration into the factors influencing the impact of triticale on laying hens' performance is necessary. This is particularly important due to the multitude of triticale strains available and their varying chemical compositions, influenced by soil characteristics and planting seasons.
Author Contributions
Conceptualization, J. I. C.-P. D. and S.I-A.; methodology, , J. I. C.-P. D.; software, , J. I. C.-P. D.; validation, N.J.-C., S.- C. and , J. I. C.-P. D.; formal analysis, , J. I. C.-P. D.; investigation, , J. I. C.-P. D; resources, N.J.-C and B.-C.; data curation, J. I. C.-P. D., and F.- H.; writing—original draft preparation, J. I. C.-P. D.; writing—review and editing, J. I. C.-P. D, and S.I-A.; visualization, I.- C., N.J.-C, S.- C, F.- H, and B.-C; supervision, N.J.-C, S.- C, S.I-A; project administration, , N.J.-C., I.- C. All authors have read and agreed to the published version of the manuscript.
Funding
This research received no external funding.
Institutional Review Board Statement
Not applicable.
Informed Consent Statement
Not applicable.
Data Availability Statement
The original contributions presented in the study are included in the supplementary material, further inquiries can be directed to the corresponding author.
Conflicts of Interest
The authors declare no conflicts of interest.
References
- Munaweera, T.I.K.; Jayawardana, N.U.; Rajaratnam, R.; Dissanayake, N. Modern plant biotechnology as a strategy in addressing climate change and attaining food security. Agric. Food Secur. 2022, 11, 1–28. [Google Scholar] [CrossRef]
- Amerah, A. M. , Péron, A. , Zaefarian, F., Ravindran, V. Influence of insoluble fiber and whole wheat inclusion on the performance, digestive tract development, and ileal microbiota profile of broiler chickens. Poultry Science 2011, 90, 2575–2582. [Google Scholar] [CrossRef]
- Olukosi, O. A. , & van Kuijk, S. J. A. Evaluation of sorghum (Sorghum bicolor L. Moench) as a feed ingredient for broilers: Effects of xylanase supplementation. Animal Feed Science and Technology 2018, 245, 1–10. [Google Scholar] [CrossRef]
- Bulgur, S. A. , & Carré, B.. (2014). Barley in human nutrition. In Barley (pp. 293-307). AACC International Press. [CrossRef]
- Hassan, Shamsedin Mahdi. "Nutritional, Functional and Bioactive Properties of Sorghum (Sorghum Bicolor I. Moench) with its Future Outlooks: A Review." (2023).
- Paine, J.A.; Shipton, C.A.; Chaggar, S.; Howells, R.; Kennedy, M.J.; Vernon, G.; Wright, S.Y.; Hinchliffe, E.; Adams, J.L.; Silverstone, A.L.; et al. Improving the nutritional value of Golden Rice through increased pro-vitamin A content. Nat. Biotechnol. 2005, 23, 482–487. [Google Scholar] [CrossRef]
- Van Eenennaam, A.L.; Young, A.E.; Douglas, S.L.; Wellock, I.; Edwards, S.A.; Kyriazakis, I. Prevalence and impacts of genetically engineered feedstuffs on livestock populations1. J. Anim. Sci. 2014, 92, 4255–4278. [Google Scholar] [CrossRef]
- Lim, C.I.; Ditengou, J.P.; Ryu, K.S.; Ku, J.H.; Park, M.R.; Whiting, I.M.; Pirgozliev, V. Effect of maize replacement with different triticale levels on layers production performance, egg quality, yolk fatty acid profile and blood parameters. J. Anim. Feed. Sci. 2021, 30, 360–366. [Google Scholar] [CrossRef]
- Alijošius, S. , Švirmickas, G. J., Gružauskas, R., Daukšienė, A., Šašytė, V., Racevičiūtė-Stupelienė, A., and Kliševičiūtė, V. The Application of triticale in nutrition of broiler chickens. Vet. ir zootech 2016, 73.
- Shewry, P.R.; Hey, S.J. The contribution of wheat to human diet and health. Food Energy Secur. 2015, 4, 178–202. [Google Scholar] [CrossRef]
- Ranum, P.; Peña-Rosas, J.P.; Garcia-Casal, M.N. Global maize production, utilization, and consumption. Ann. N. Y. Acad. Sci. 2014, 1312, 105–112. [Google Scholar] [CrossRef]
- Guttieri, M. J. , Baenziger, P. S., Frels, K., Carver, B., & Arnall, B. Agronomic performance of winter triticale and winter wheat across the Great Plains. Agronomy Journal 2015, 107, 792–800. [Google Scholar] [CrossRef]
- Erekul, O. , Özkaya, H. , & Demirbaş, E. Development of triticale bread with improved quality characteristics. Journal of Cereal Science 2013, 57, 231–237. [Google Scholar] [CrossRef]
- G. , M.C.; G., E.A. Preliminary Studies on Triticale in Diets for Laying Hens. Poult. Sci. 1973, 52, 1973–1974. [Google Scholar] [CrossRef]
- Choudhary, K.S.; Netke, S.P. Incorporation of triticale in layer diets. Br. Poult. Sci. 1976, 17, 361–369. [Google Scholar] [CrossRef]
- Leeson, S.; Summers, J.D. RESPONSE OF WHITE LEGHORNS TO DIETS CONTAINING GROUND OR WHOLE TRITICALE. Can. J. Anim. Sci. 1987, 67, 583–585. [Google Scholar] [CrossRef]
- Ebrahimi, E. , Sobhanirad, S. , and Zarghi, H. Effect of triticale level and exogenous enzyme in the grower diet on performance, gastrointestinal tract relative weight, jejunal morphology and blood lipids of Japanese quail (Coturnix coturnix Japonica). J. Agr. Sci. Tech. 2017, 19, 569–580. [Google Scholar]
- Bakhtiyary Moez, N. , Mirzaie Goudarzi, S. , Saki, A. A., and Ahmadi, A. Effect of ground or whole wheat and triticale on productive performance, egg quality, gastrointestinal tract traits and nutrient digestibility of laying Japanese quails. Iran J of Appl Anim Sci 2020, 10, 355–363. [Google Scholar]
- Fernandez, R.; Kim, S.M.; Buenrostro, J.L.; McGinnis, J. Triticale and Rye as Main Ingredients in Diets for Laying Hens. Poult. Sci. 1973, 52, 2244–2252. [Google Scholar] [CrossRef]
- McNab, J.M.; Shannon, D.W.F. The nutritive value of triticale and rye for the laying hen. Br. Poult. Sci. 1975, 16, 9–15. [Google Scholar] [CrossRef]
- Castanon, J.I.; Ortiz, V.; Perez-Lanzac, J. Effect of high inclusion levels of triticale in diets for laying hens containing 30% field beans. Anim. Feed. Sci. Technol. 1990, 31, 349–353. [Google Scholar] [CrossRef]
- Balduzzi, S.; Rücker, G.; Schwarzer, G. How to perform a meta-analysis with R: a practical tutorial. Évid. Based Ment. Health 2019, 22, 153–160. [Google Scholar] [CrossRef]
- Ogbuewu, I.P.; Mokolopi, B.G.; Mbajiorgu, C.A. Meta-analysis of growth performance indices of broiler chickens in response to turmeric (Curcuma longa L.) supplementation. Anim. Feed. Sci. Technol. 2021, 283. [Google Scholar] [CrossRef]
- Page, M. J. , McKenzie, J. E., Bossuyt, P. M., Boutron, I., Hoffmann, T. C., Mulrow, C. D., Shamseer, L., Tetzlaff, J. M., Akl, E. A., Brennan, S. E., Chou, R., Glanville, J., Grimshaw, J. M., Hrobjartsson, A., Lalu, M. M., Li, T., Loder, E. W., Mayo-Wilson, E., McDonald, S., McGuinness, L. A., Stewart, L. A., Thomas, J., Tricco, A. C., Welch, V. A., Whiting, P., & Moher, D. The PRISMA 2020 statement: an updated guideline for reporting systematic reviews. Int J Surg 2021, 88, 105906. [Google Scholar]
- Hooijmans, C. R. , Rovers, M. M., De Vries, R. B., Leenaars, M., Ritskes-Hoitinga, M., and Langendam, M. W. SYRCLE’s risk of bias tool for animal studies. BMC Med Res methodol 2014, 14, 1–9. [Google Scholar]
- Harrer, M. , Cuijpers, P., Furukawa, T. A., and Ebert, D. D. 2021. Doing meta-analysis with R: A hands-on guide. 1st ed. CRC Press, New York.
- Çiftci, I.; Yenice, E.; Eleroglu, H. Use of triticale alone and in combination with wheat or maize: effects of diet type and enzyme supplementation on hen performance, egg quality, organ weights, intestinal viscosity and digestive system characteristics. Anim. Feed. Sci. Technol. 2003, 105, 149–161. [Google Scholar] [CrossRef]
- Hermes, J.C.; Johnson, R.C. Effects of Feeding Various Levels of Triticale var. Bogo in the Diet of Broiler and Layer Chickens. J. Appl. Poult. Res. 2004, 13, 667–672. [Google Scholar] [CrossRef]
- Jamroz, D.; Skorupinska, J.; Orda, J.; Wiliczkiewicz, A.; Klünter, A.-M. Use of Wheat, Barley or Triticale in Feed for Laying Hens Supplemented with Carbohydrases Derived fromTrichoderma longibrachiatum. J. Appl. Anim. Res. 2001, 19, 107–116. [Google Scholar] [CrossRef]
- Leeson, S.; Summers, J.D. RESPONSE OF WHITE LEGHORNS TO DIETS CONTAINING GROUND OR WHOLE TRITICALE. Can. J. Anim. Sci. 1987, 67, 583–585. [Google Scholar] [CrossRef]
- Macleod, M. R. , Fisher, M., O'collins, V., Sena, E. S., Dirnagl, U., Bath, P. M., Buchan, A., Van Der Worp, H. B., Traystman, R., Minematsu, K., Donnan, G. A., and Howells, D. W. 2009.
- Karunajeewa, H. Effect of triticale, lucerne pellets, furazolidone, ethoxyquin and oxycarotenoids on egg yolk colour and performance of crossbred layers. Aust. J. Exp. Agric. 1978, 18, 396–403. [Google Scholar] [CrossRef]
- Franco, D.; Rois, D.; Arias, A.; Justo, J.R.; Marti-Quijal, F.J.; Khubber, S.; Barba, F.J.; López-Pedrouso, M.; Lorenzo, J.M. Effect of Breed and Diet Type on the Freshness and Quality of the Eggs: A Comparison between Mos (Indigenous Galician Breed) and Isa Brown Hens. Foods 2020, 9, 342. [Google Scholar] [CrossRef] [PubMed]
- Pettersson, D.; Åman, P. Effects of enzyme supplementation of diets based on wheat, rye or triticale on their productive value for broiler chickens. Anim. Feed. Sci. Technol. 1988, 20, 313–324. [Google Scholar] [CrossRef]
- Rundgren, M. Evaluation of triticale given to pigs, poultry and rats. Anim. Feed. Sci. Technol. 1988, 19, 359–375. [Google Scholar] [CrossRef]
- Smith, R.L.; Jensen, L.S.; Hoveland, C.S.; Hanna, W.W. Use of Pearl Millet, Sorghum, and Triticale Grain in Broiler Diets. J. Prod. Agric. 1989, 2, 78–82. [Google Scholar] [CrossRef]
- Boros, D. Influence of R genome on the nutritional value of triticale for broiler chicks. Anim. Feed. Sci. Technol. 1999, 76, 219–226. [Google Scholar] [CrossRef]
- Bielski, S. , Dubis, B. , and Budzyński, W. Influence of nitrogen fertilisation on the technological value of semi-dwarf grain winter triticale varieties Alekto and Gniewko. Pol. J. Nat. Sci 2015, 30, 325–336. [Google Scholar]
- Rahimi, S. H. , Esmaeilzadeh, L. , and Karimi-Torshizi, M. A. Comparison of growth performance of six commercial broiler hybrids in Iran. Iran J Vet Res 2006, 7, 38–44. [Google Scholar]
- Hossain, M.; Suvo, K.; Islam, M. Performance and Economic Suitability of Three Fast Growing Broiler Strains Raised Under Farming Condition in Bangladesh. Int. J. Agric. Res. Innov. Technol. 2013, 1, 37–43. [Google Scholar] [CrossRef]
- Silversides, F.G.; Budgell, K. The Relationships Among Measures of Egg Albumen Height, pH, and Whipping Volume. Poult. Sci. 2004, 83, 1619–1623. [Google Scholar] [CrossRef] [PubMed]
- Dennett, A.L.; Wilkes, M.A.; Trethowan, R.M. Characteristics of Modern Triticale Quality: The Relationship Between Carbohydrate Properties, α-Amylase Activity, and Falling Number. Cereal Chem. 2013, 90, 594–600. [Google Scholar] [CrossRef]
- Drucker, A.M.; Fleming, P.; Chan, A.-W. Research Techniques Made Simple: Assessing Risk of Bias in Systematic Reviews. J. Investig. Dermatol. 2016, 136, e109–e114. [Google Scholar] [CrossRef] [PubMed]
- Ahn, S. I. , Cho, S. , Jeon, E., Park, M., Chae, B., Ditengou Jr, I. C. P., and Choi, N. J. The effect of probiotics on intestinal tight junction protein expression in animal models: a meta-analysis. Appl Sci (Basel) 2022, 12, 4680. [Google Scholar]
- Shi, L.; Lin, L. The trim-and-fill method for publication bias: Practical guidelines and recommendations based on a large database of meta-analyses. Medicine 2019, 98, e15987. [Google Scholar] [CrossRef]
Figure 1.
Systematic literature search and selection process.
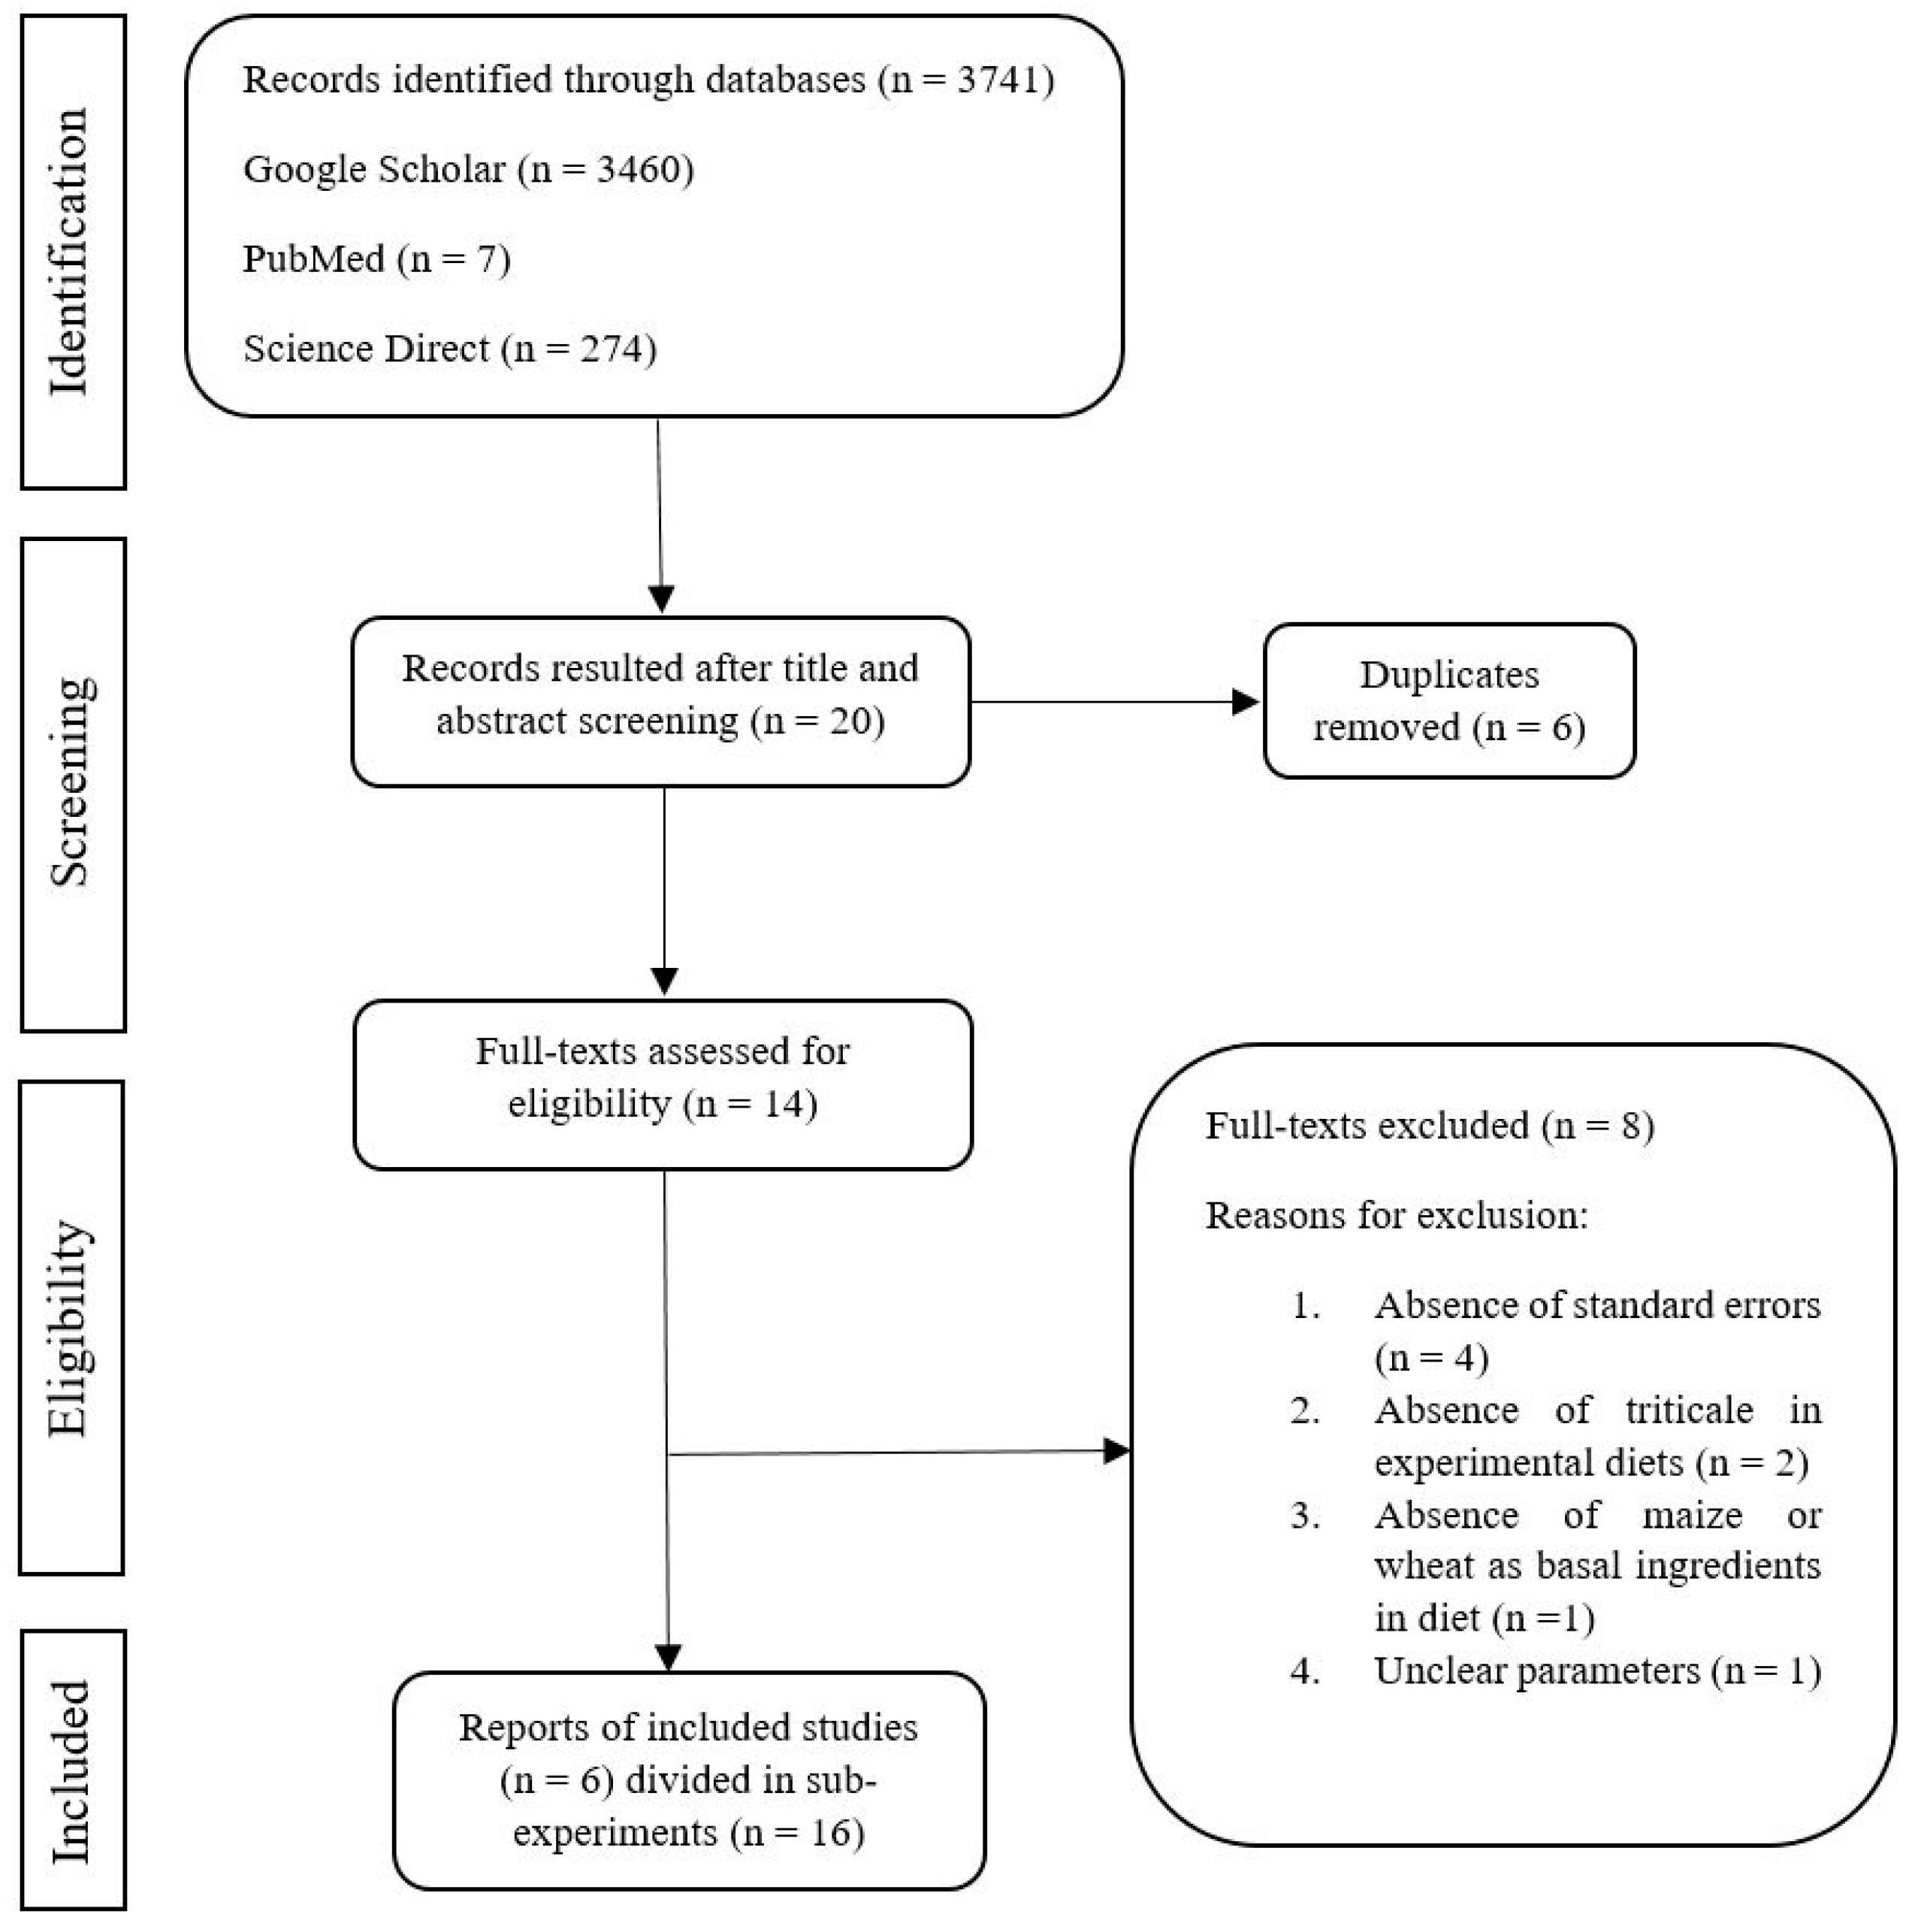
Figure 2.
Bias Risk Percentage across the 6 Articles.
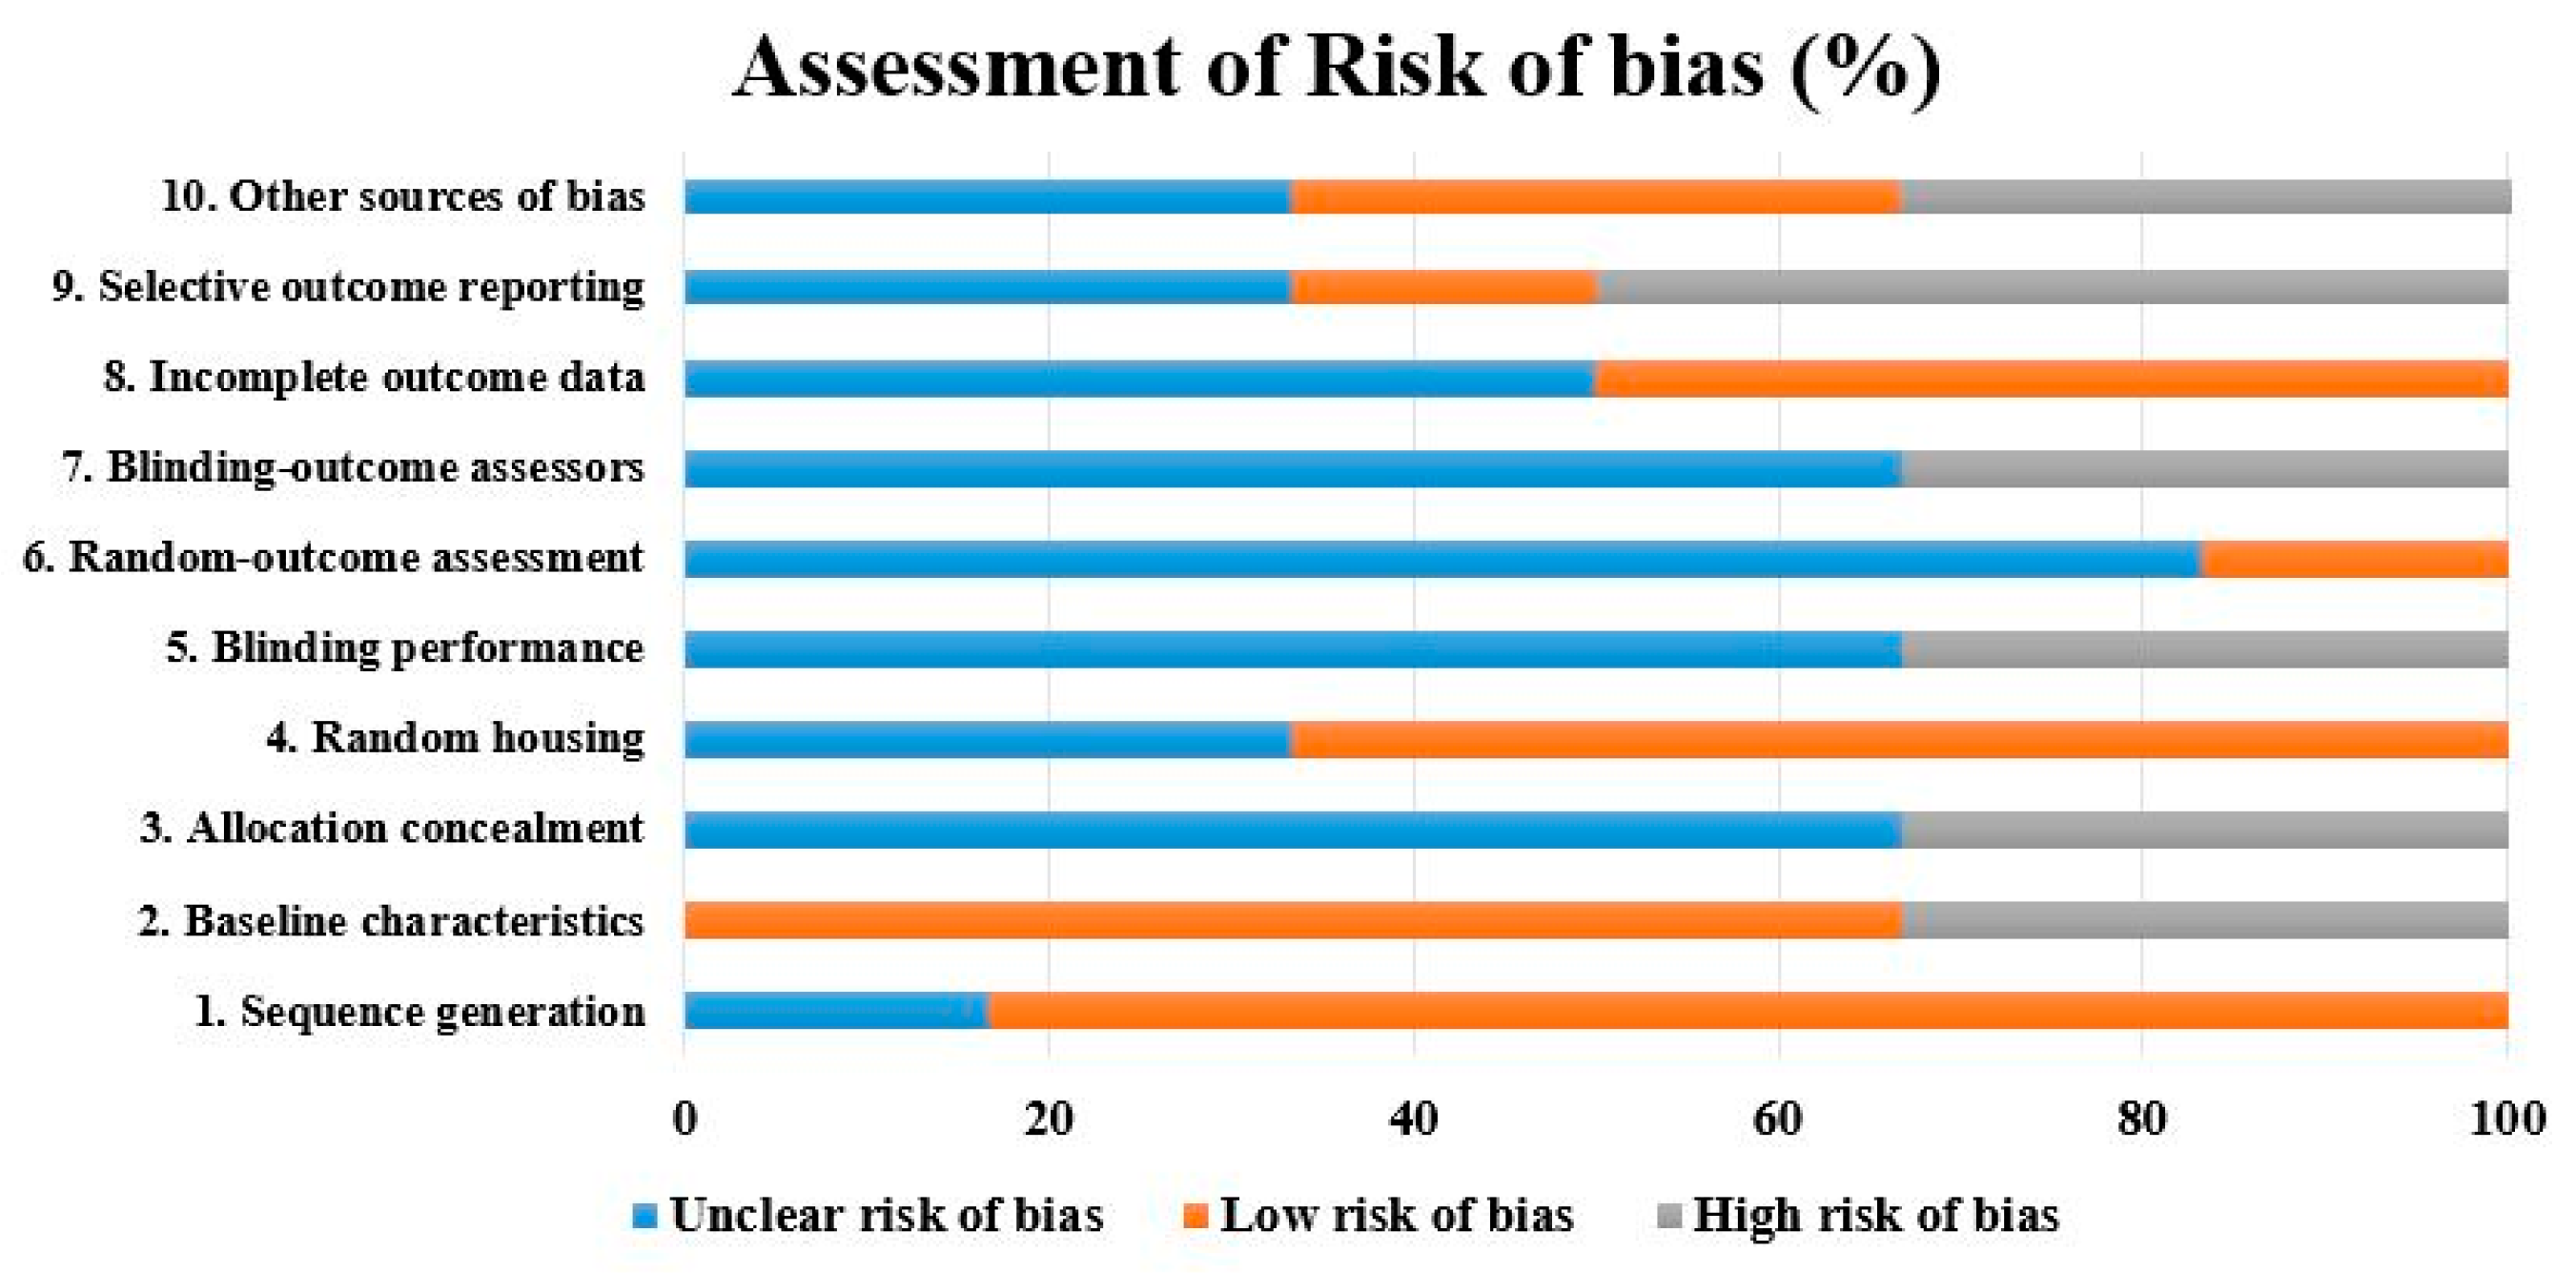
Figure 3.
Impact of triticale on laying hens’ egg production.
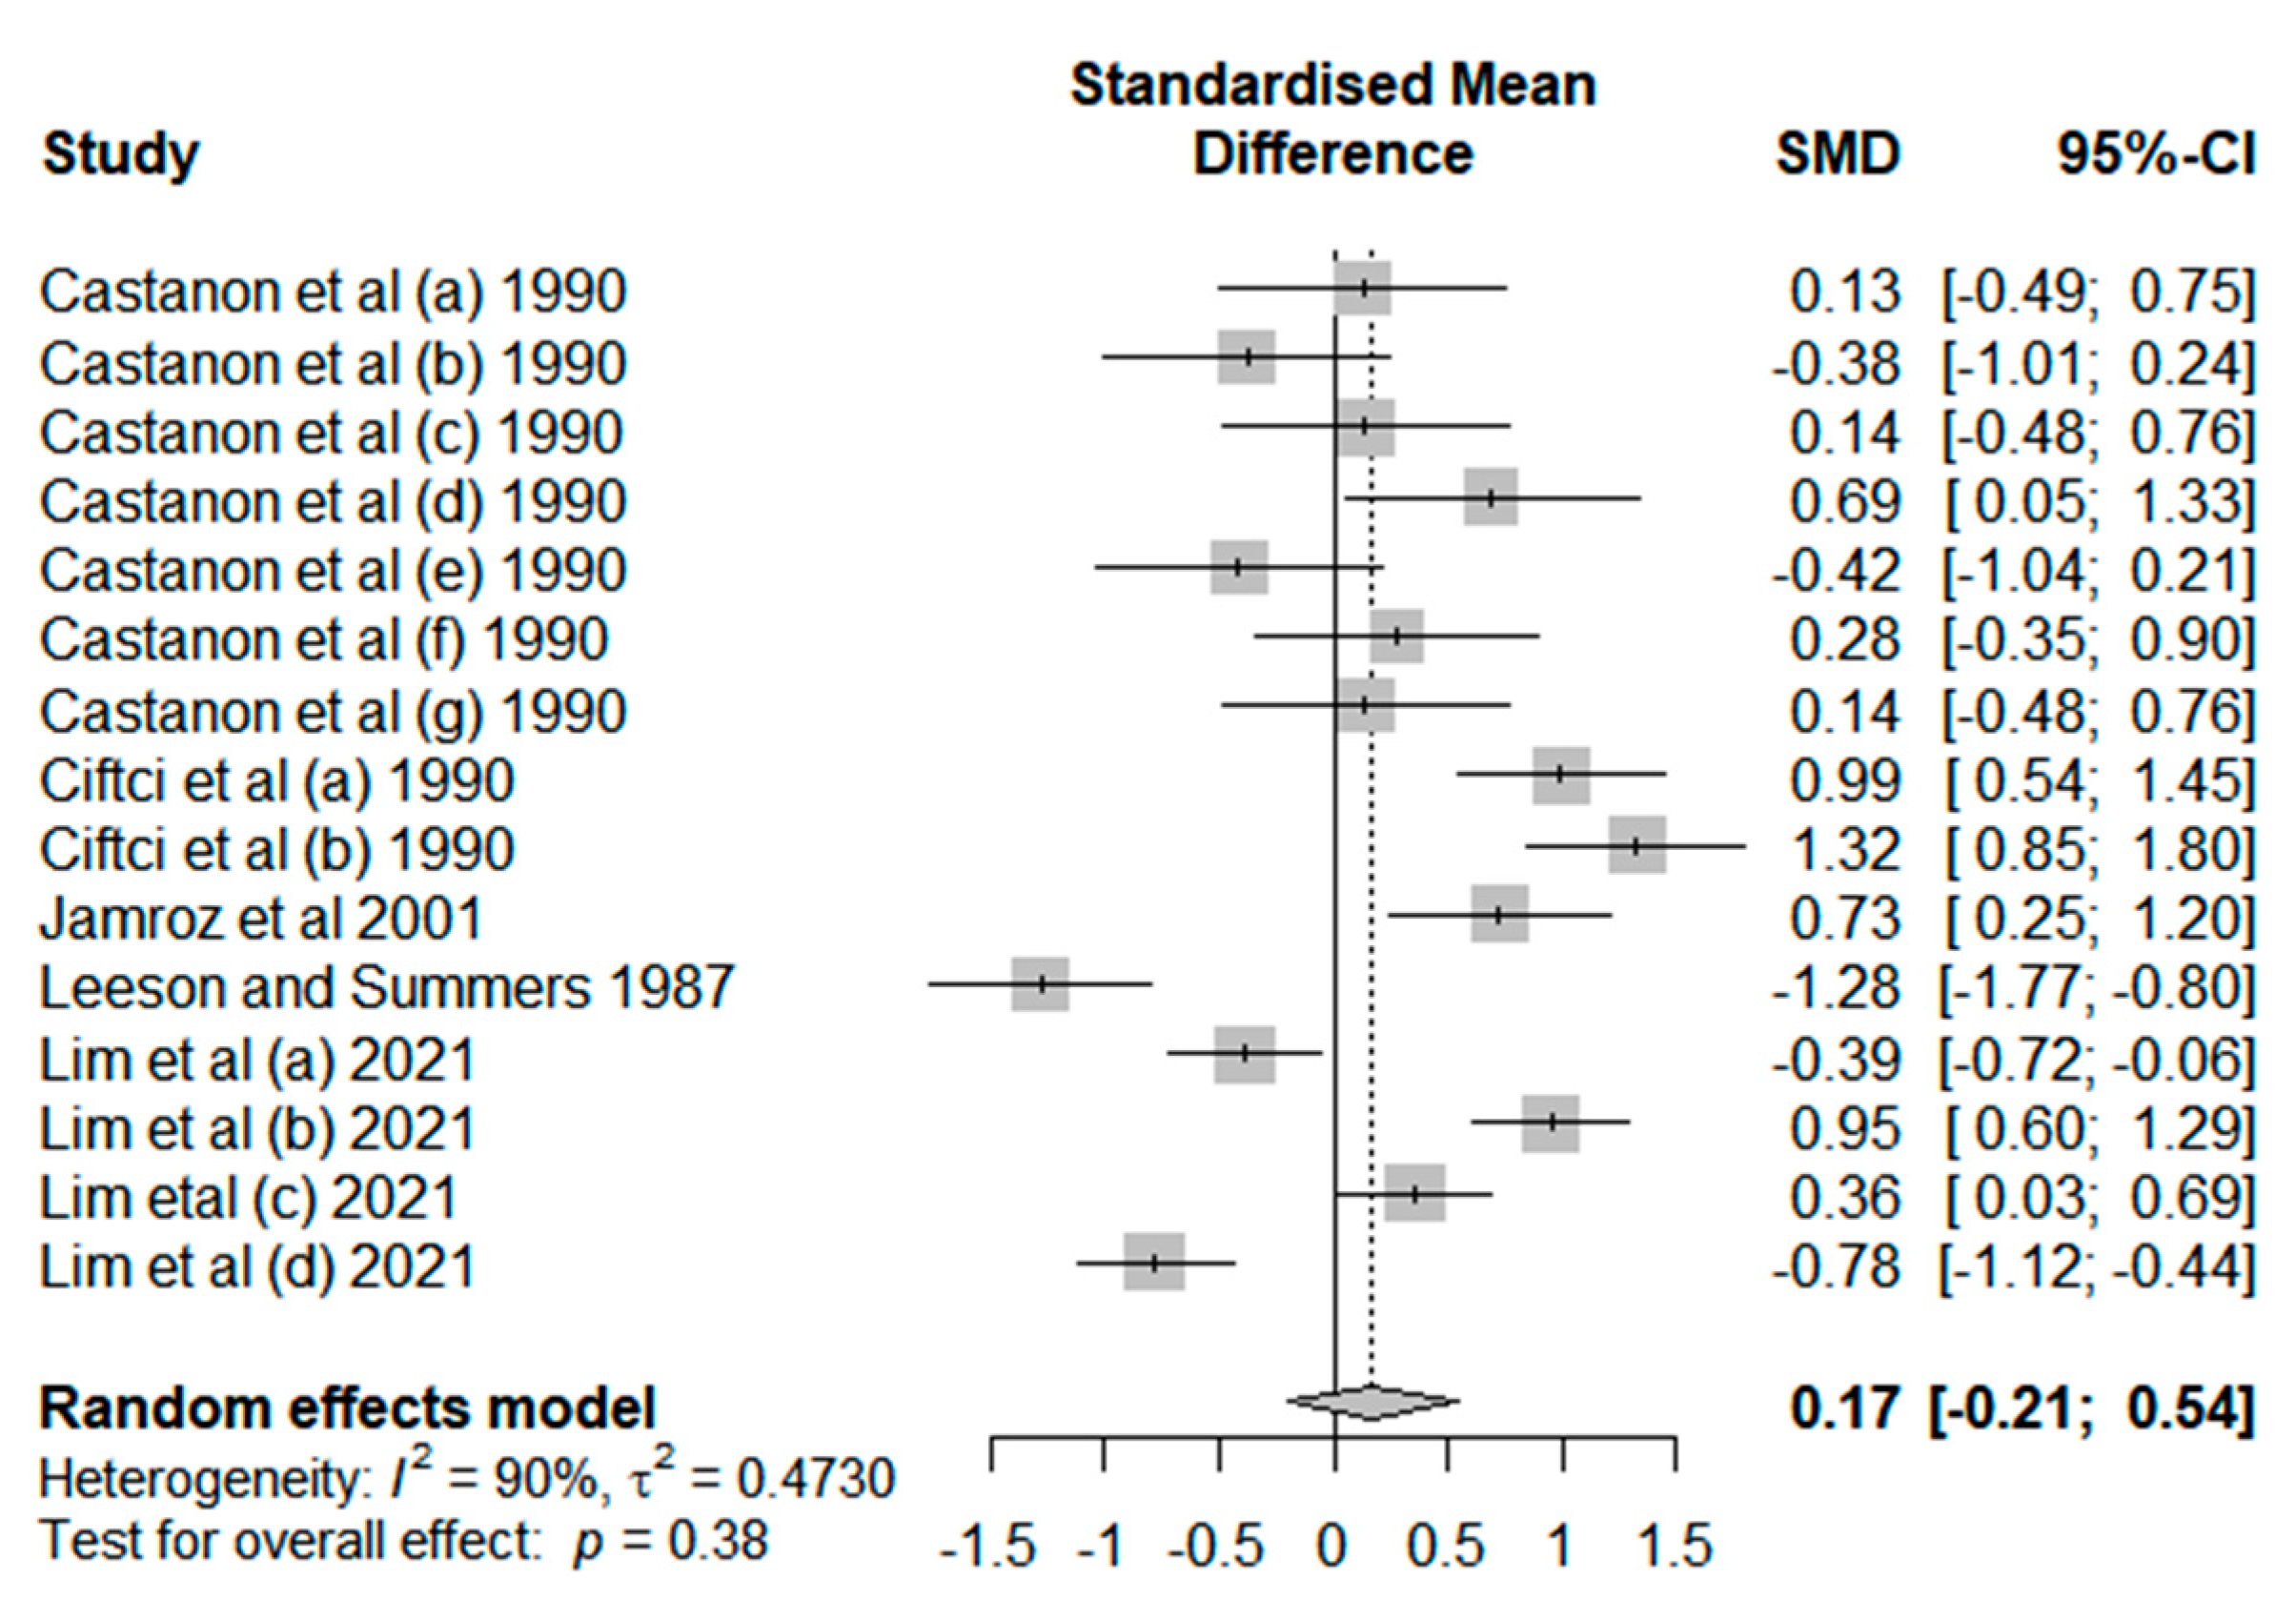
Figure 4.
Impact of triticale on laying hens’ egg weight.
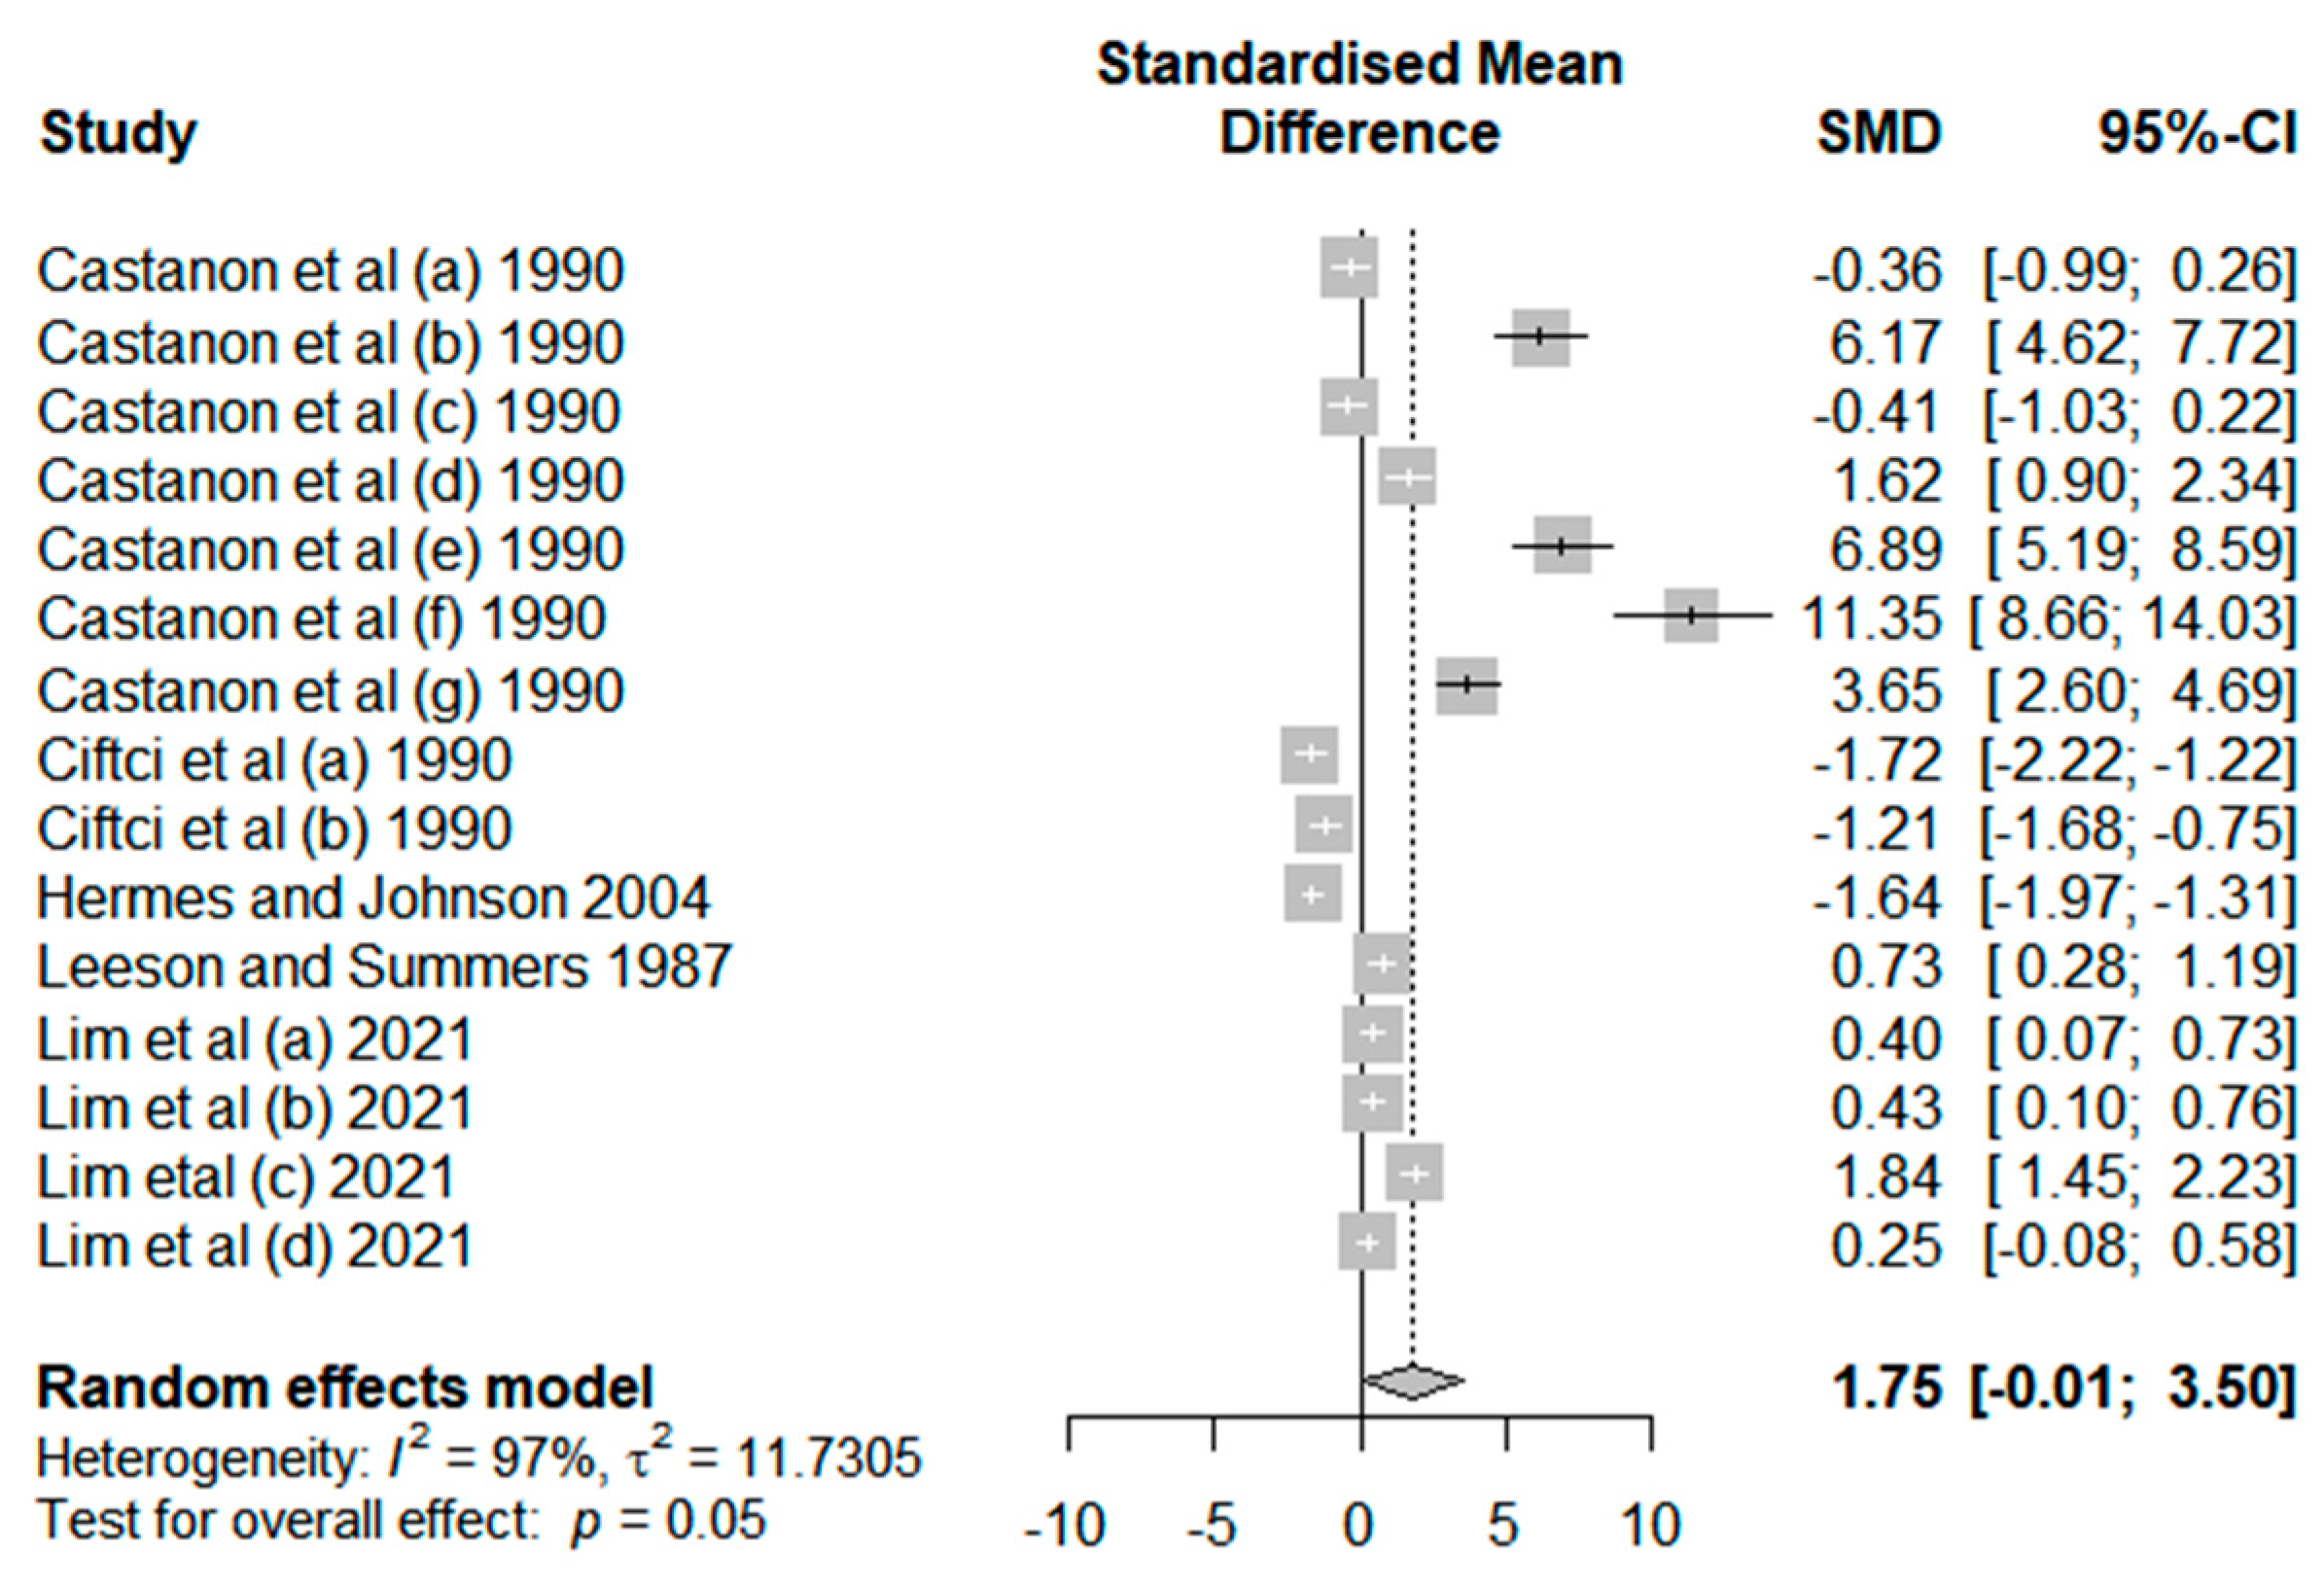
Figure 5.
Impact of triticale on laying hens’ egg yolk color.
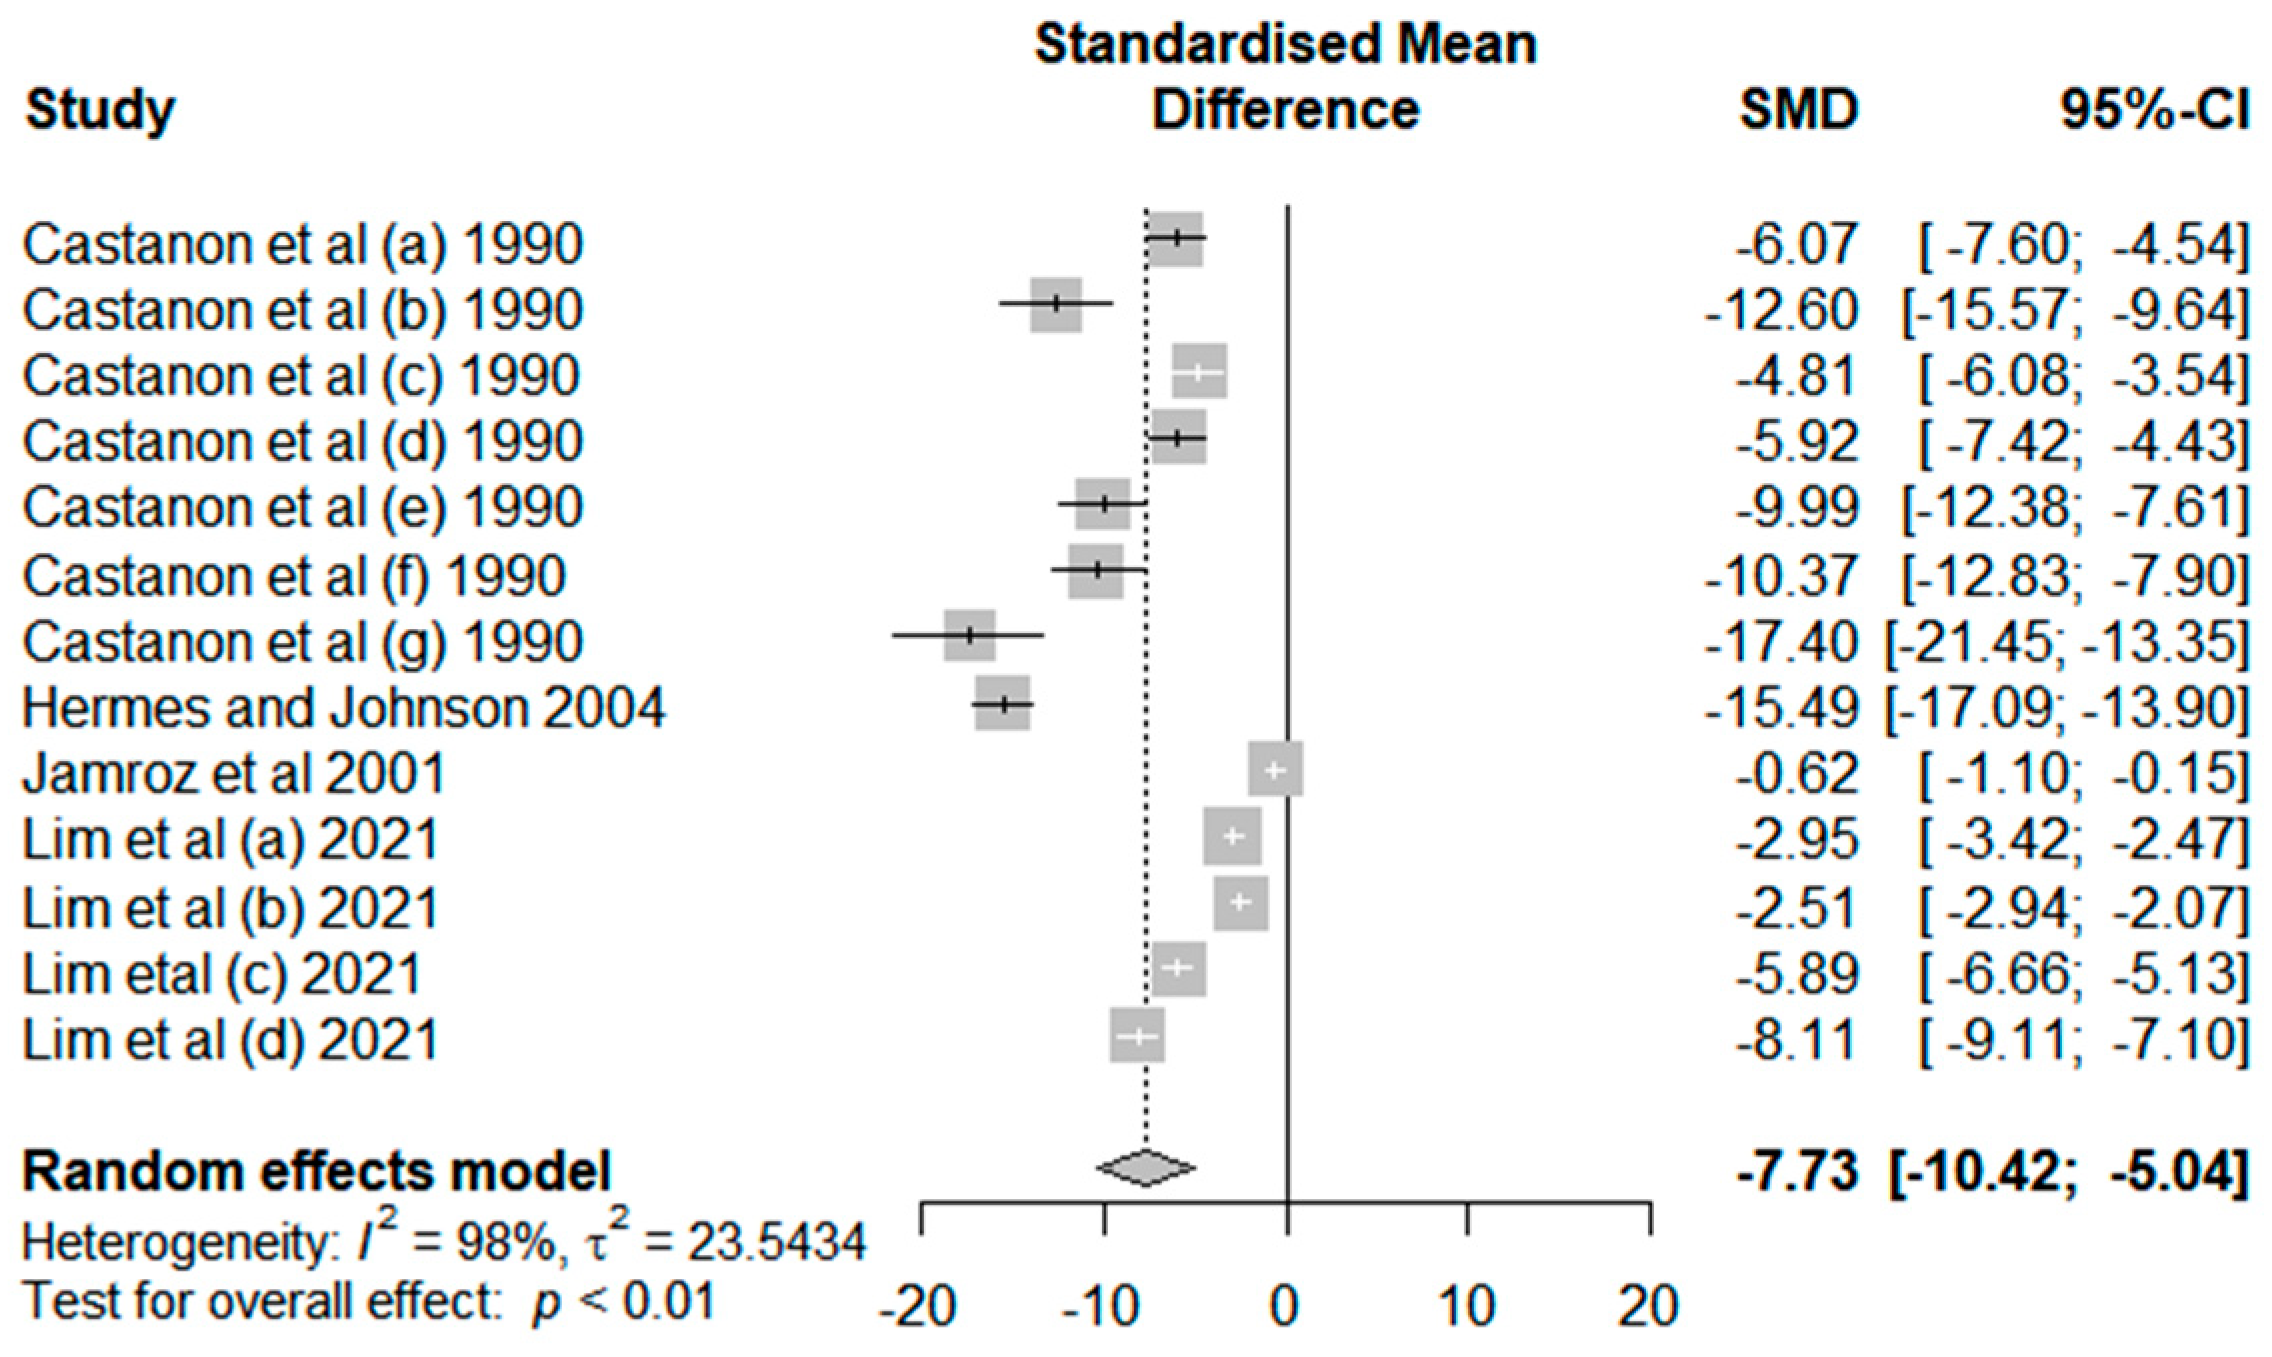
Figure 6.
Impact of triticale on laying hens’ feed intake.
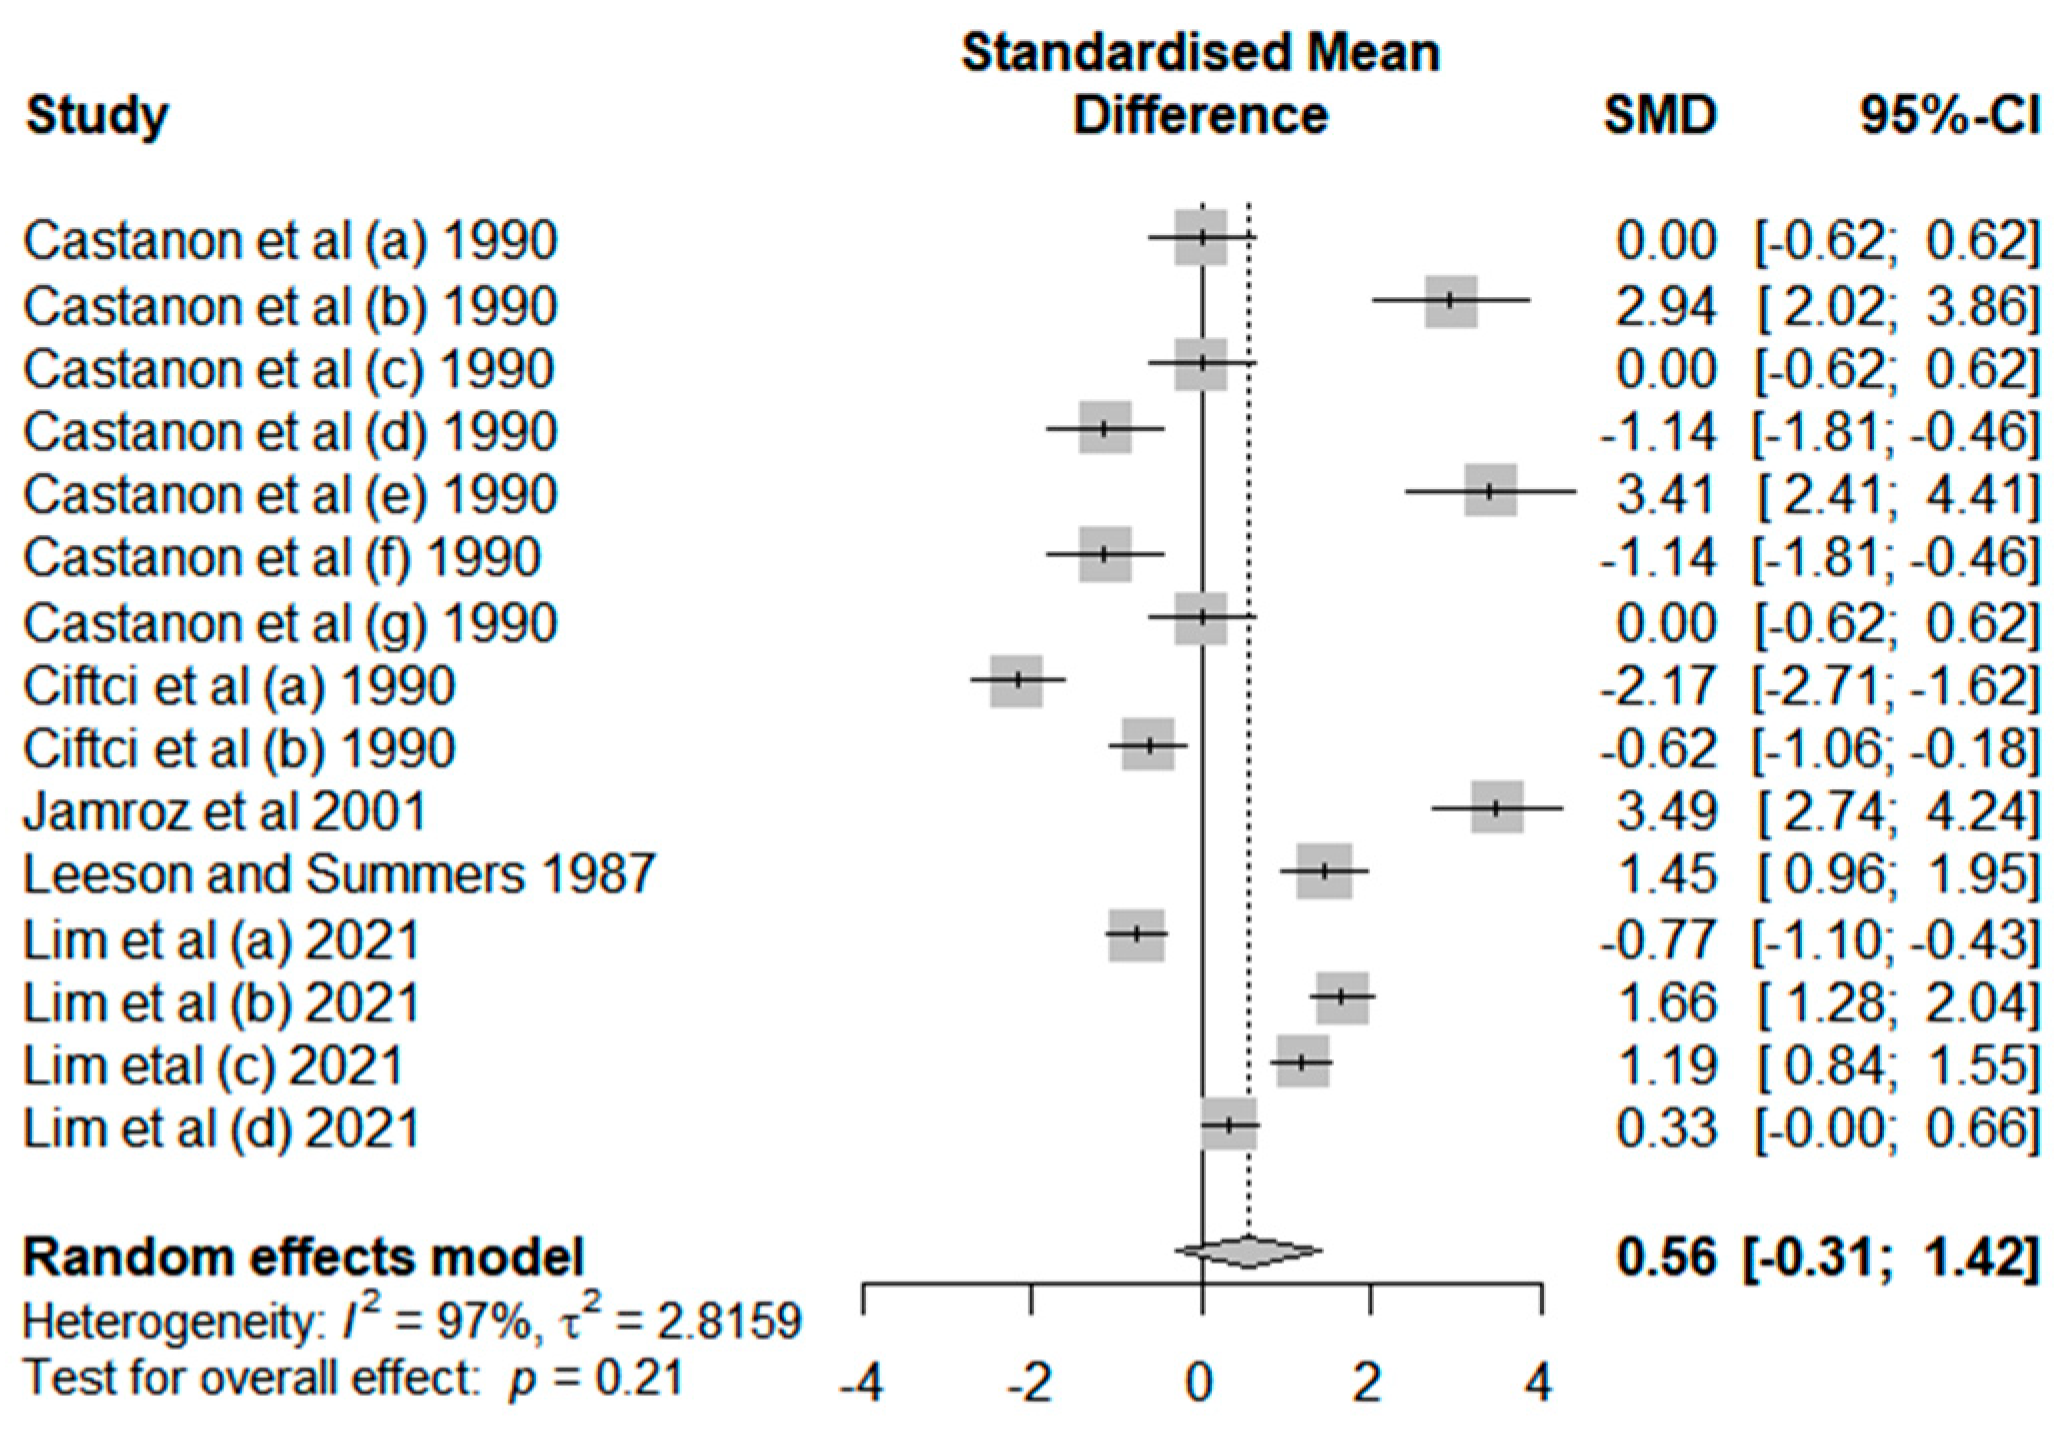
Figure 7.
Impact of triticale on laying hens’ feed conversion ratio.
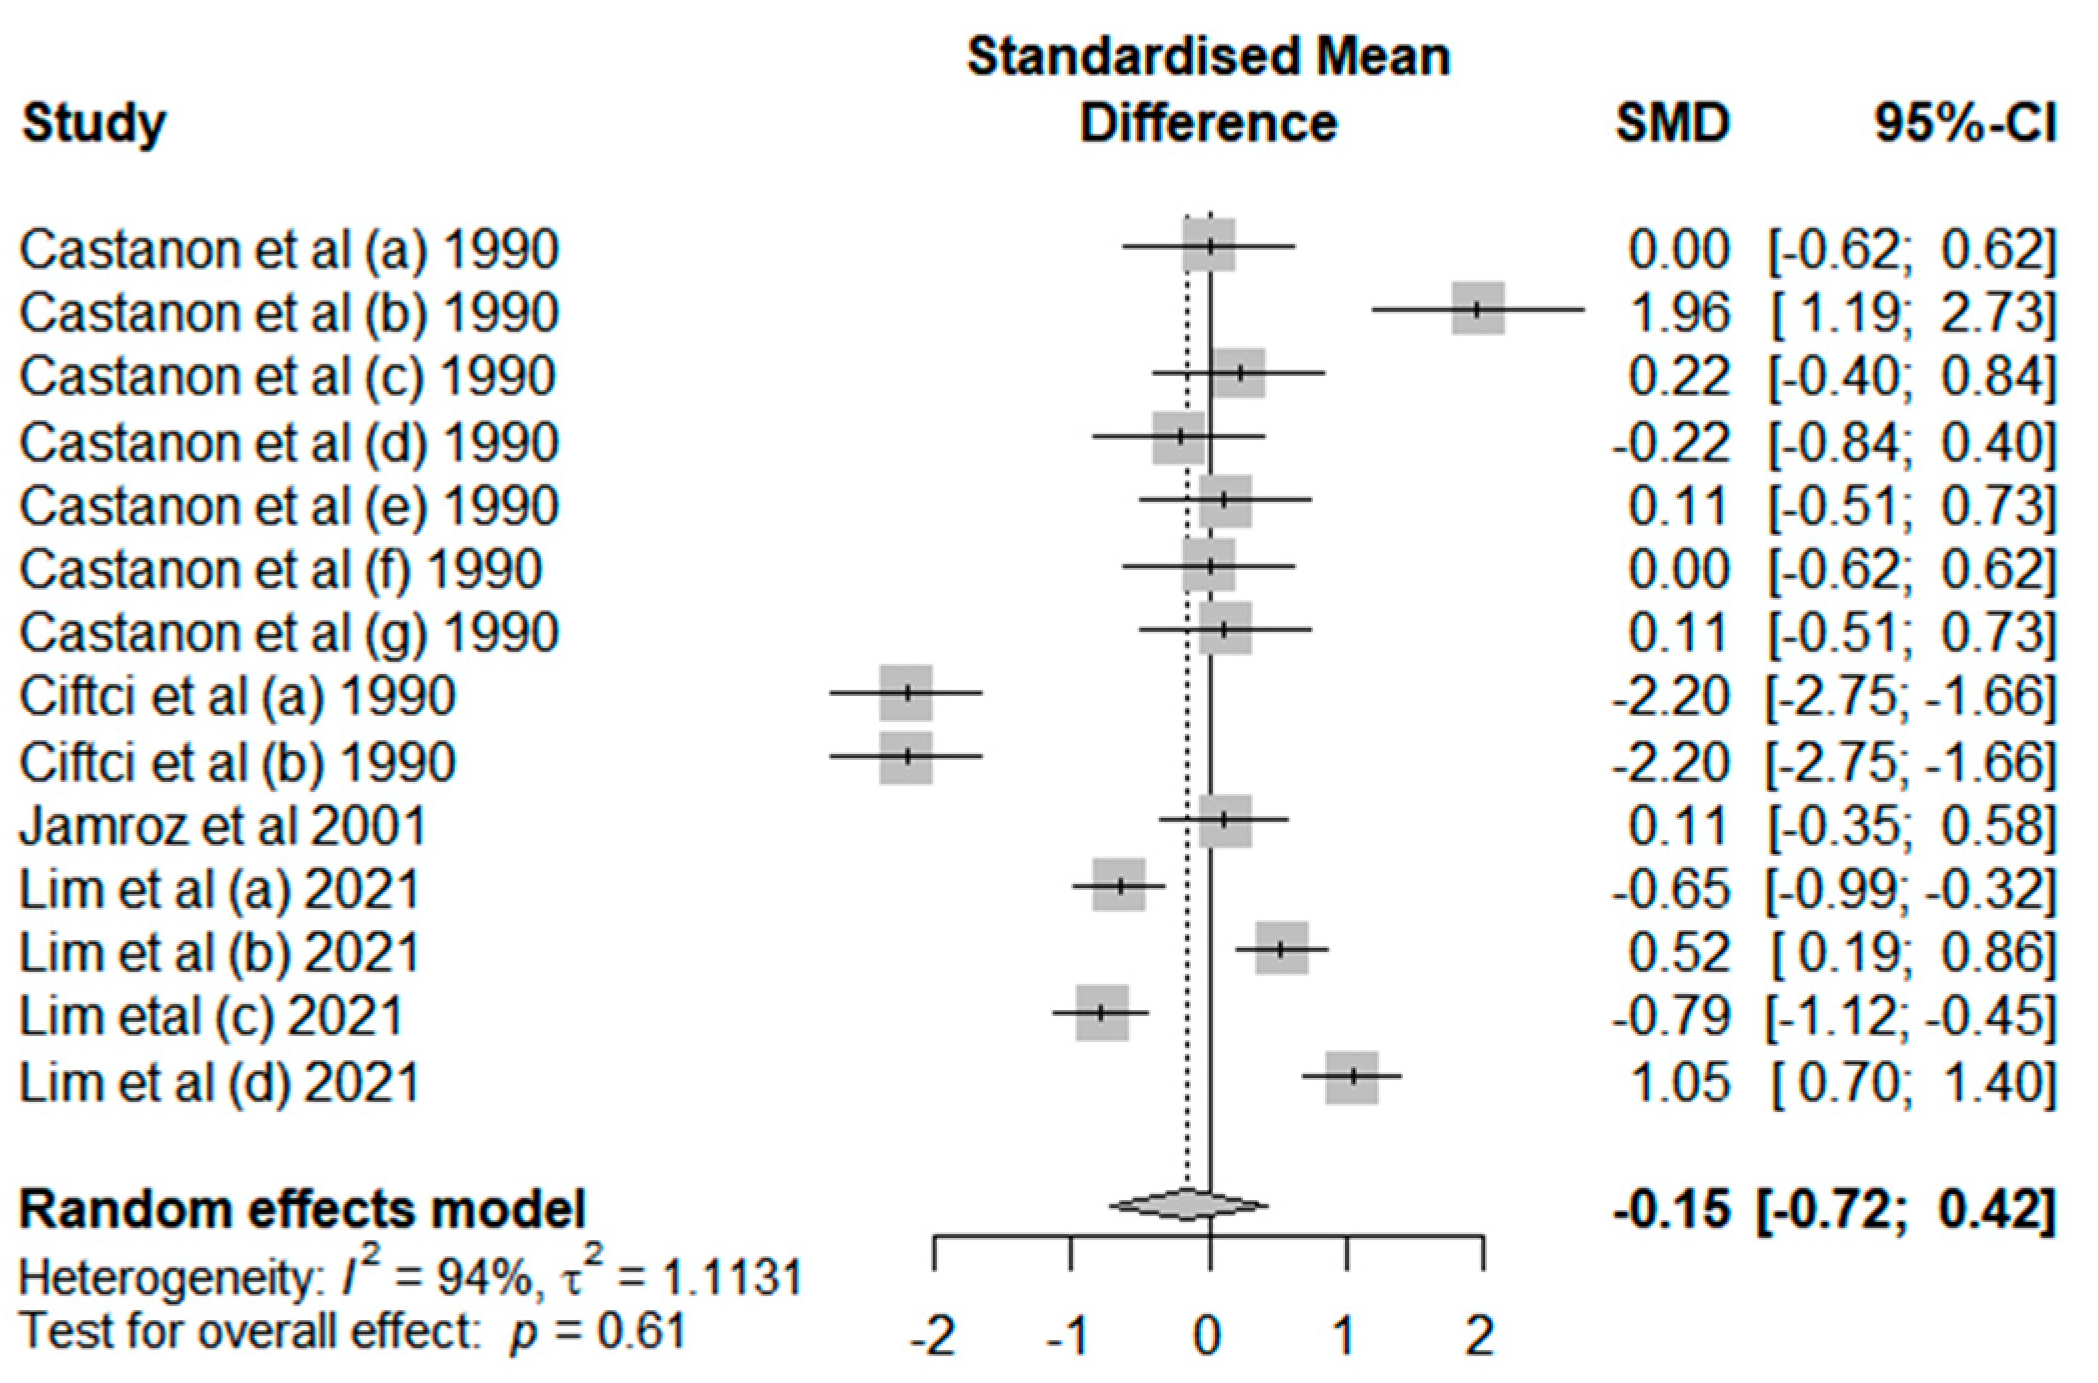
Figure 8.
Publication bias. (A): Egg production; (B): Egg weight; (C): Egg yolk color; (D): Feed intake; (E): Feed conversion ratio.
Figure 8.
Publication bias. (A): Egg production; (B): Egg weight; (C): Egg yolk color; (D): Feed intake; (E): Feed conversion ratio.
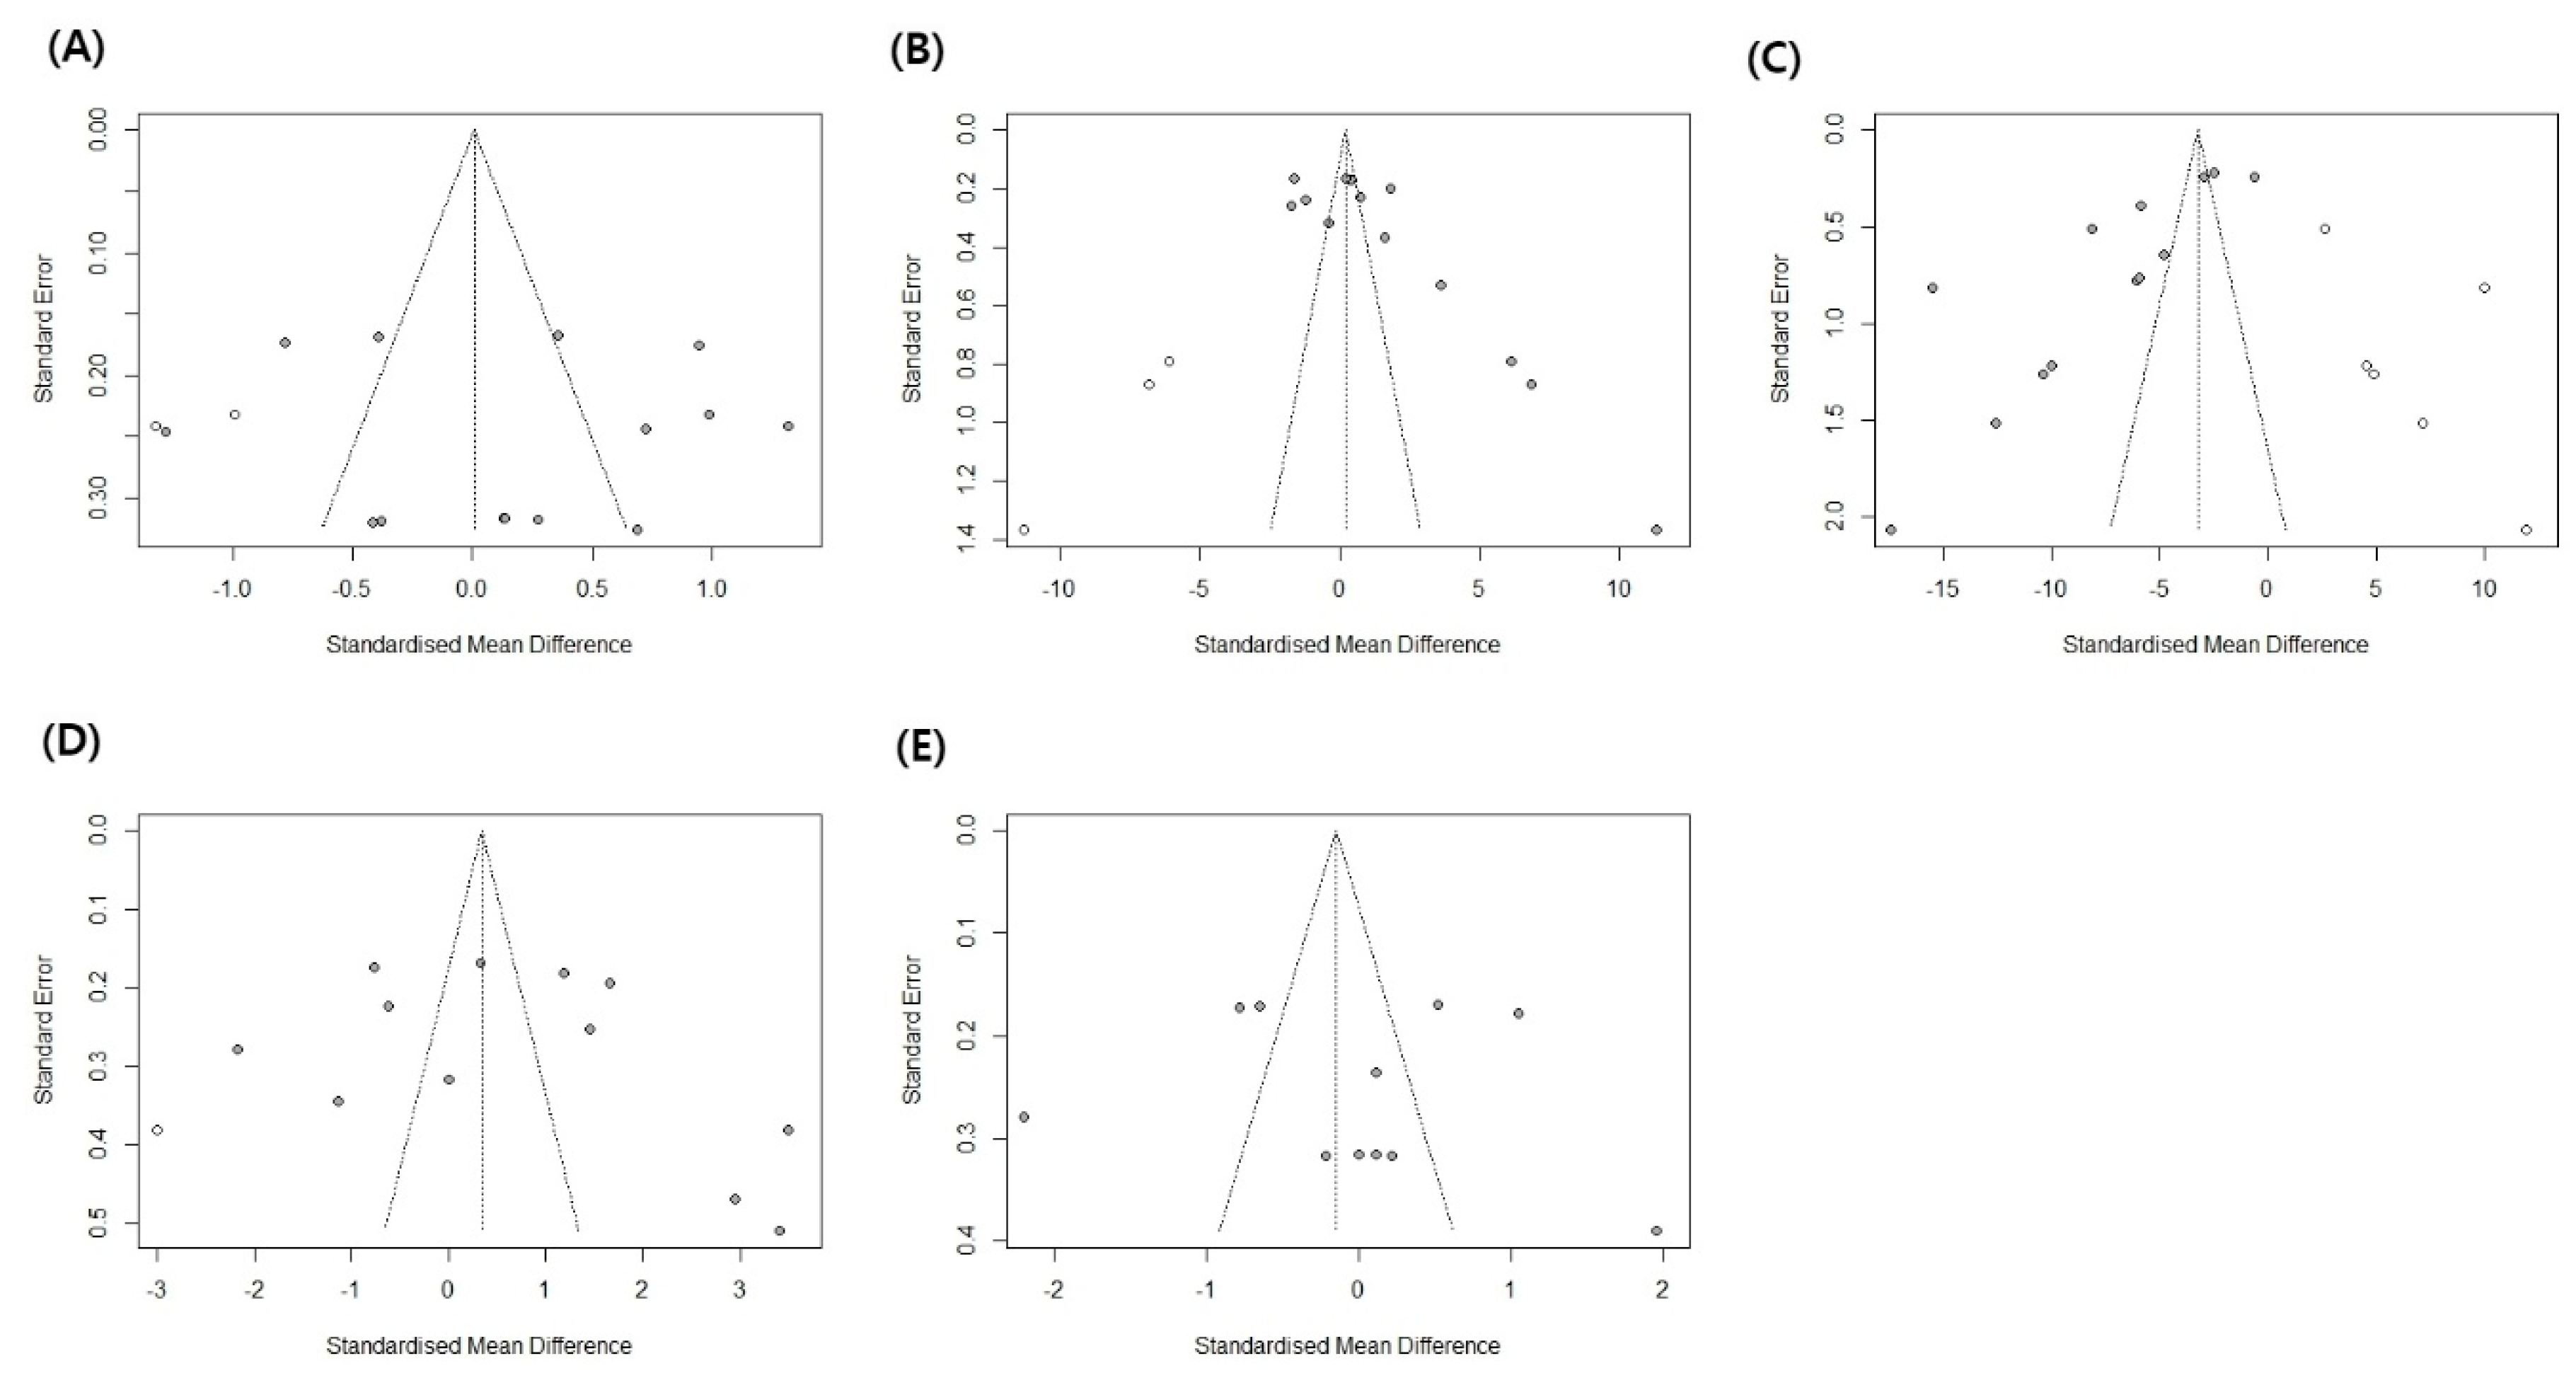

Table 1.
Data Set Overview and Meta-Analysis Details.
| Author (Year) | Hens’ strains | Hens’ numbers | Triticale strains | Triticale percentages (%) | Factors of analysis1 |
|---|---|---|---|---|---|
| Castanon et al. [21] | Leghorn | 180 | Juanilo | 30; 45; 60; 75; 90 | EP, EW, EYC, FI, FCR |
| Ciftci et al. [27] | Babcock B-380 | 126 | Tathcak-97 | 30; 60 | EP, EW, FI, FCR, |
| Hermes and Johnson [28] | Dekalb XL | 192 | Bogo | 30 | EW, EYC |
| Jamroz et al. [29] | Lohmann | 72 | Bogo | 70 | EP, EYC, FI, FCR |
| Leeson and Summers [30] | Leghorn | 80 | Unknown | 70 | EP, EW, EYC, FI |
| Lim et al. [8] | Hy-Line Brown | 360 | Joesong | 5 ; 10 ; 15 ; 20 | EP, EW, EYC, FI, FCR |
1EP: Egg production; EW: Egg weight; FI: Feed intake; EYC: Egg yolk color.
Table 2.
Meta-ANOVA analysis of the effect of Triticale Strains on Laying Hens' Performance.
| Variables1 | Random-effect model2 | Heterogeneity3 | P-value | |||||||
|---|---|---|---|---|---|---|---|---|---|---|
| 95% CI | I2 (%) | τ2 | τ | Q | df | |||||
| k | SMD | Lower | Upper | |||||||
| EP | ||||||||||
| Juanilo | 7 | 0.0802 | -0.1994 | 0.3599 | 29.2 | 0.0407 | 0.2018 | 72.88 | 4 | <0.0001 |
| Joesong | 4 | 0.0322 | -0.7241 | 0.7885 | 95.0 | 0.5662 | 0.7524 | |||
| Tathcak-97 | 2 | 1.1490 | 0.8210 | 1.4770 | 0.0 | 0 | 0 | |||
| Bogo | 1 | 0.7258 | 0.2481 | 1.2036 | -- | -- | -- | |||
| Unknown | 1 | -1.2838 | -1.7671 | -0.8005 | -- | -- | -- | |||
| EW | ||||||||||
| Juanilo | 7 | 4.0086 | 0.8962 | 7.1210 | 97.1 | 17.1170 | 4.1373 | 102.25 | 4 | <0.0001 |
| Joesong | 4 | 0.7262 | 0.0041 | 1.4484 | 93.4 | 0.5119 | 0.7155 | |||
| Tathcak-97 | 2 | -1.4569 | -1.9520 | -0.9618 | 51.9 | 0.0664 | 0.2576 | |||
| Bogo | 1 | -1.6405 | -1.9684 | -1.3127 | -- | -- | -- | |||
| Unknown | 1 | 0.7336 | 0.2801 | 1.1871 | -- | -- | -- | |||
| FI | ||||||||||
| Juanilo | 7 | 0.5537 | -0.7914 | 1.8989 | 94.3 | 3.1532 | 1.7757 | 45.71 | 4 | <0.0001 |
| Joesong | 4 | 0.6019 | -0.4436 | 1.6474 | 97.1 | 1.1061 | 1.0517 | |||
| Tathcak-97 | 2 | -1.3847 | -2.9017 | 0.1324 | 94.7 | 1.1349 | 1.0653 | |||
| Bogo | 1 | 3.4901 | 2.7443 | 4.2359 | -- | -- | -- | |||
| Unknown | 1 | 1.4525 | 0.9573 | 1.9477 | -- | -- | -- | |||
| FCR | ||||||||||
| Juanilo | 7 | 0.2868 | -0.2218 | 0.7954 | 73.8 | 0.3642 | 0.6035 | 86.52 | 3 | <0.0001 |
| Joesong | 4 | 0.0322 | -0.8457 | 0.9102 | 96.2 | 0.7727 | 0.8790 | |||
| Tathcak-97 | 2 | -2.2018 | -2.5884 | -1.8152 | 0.0 | 0 | 0 | |||
| Bogo | 1 | 0.1146 | -0.3478 | 0.5770 | -- | -- | -- | |||
| EYC | ||||||||||
| Juanilo | 7 | -9.3294 | -12.4773 | -6.1814 | 91.0 | 16.5335 | 4.0661 | 4.74 | 2 | 0.0936 |
| Joesong | 4 | -4.8350 | -7.4031 | -2.2668 | 97.9 | 6.7380 | 2.5958 | |||
| Bogo | 2 | -8.0388 | -22.6128 | 6.5352 | 99.7 | 110.2256 | 10.4988 | |||
1EP: Egg production; EW: Egg weight; FI: Feed intake; EYC: Egg yolk color 2k: Study number; SMD: Standard mean difference. 3I2: Higgins statistic; Q: χ2statistics; τ2: Heterogeneity variance of the true effect sizes; τ: Standard deviation of the true effect sizes; df: Degree of freedom.
Table 3.
Meta-ANOVA Analysis of the Effects of Laying Hens' Strains on Performance.
| Variables1 | Random-effect model2 | Heterogeneity3 | P-value | |||||||
|---|---|---|---|---|---|---|---|---|---|---|
| 95% CI | I2 (%) | τ2 | τ | Q | df | |||||
| k | SMD | Lower | Upper | |||||||
| EP | ||||||||||
| Leghorn | 8 | -0.1060 | -0.5410 | 0.3291 | 78.9 | 0.2980 | 0.5459 | 23.14 | 3 | <0.0001 |
| Hy-Line Brown | 4 | 0.0322 | -0.7241 | 0.7885 | 95.0 | 0.5662 | 0.7524 | |||
| Babcock B-380 | 2 | 1.1490 | 0.8210 | 1.4770 | 0.0 | 0 | 0 | |||
| Lohmann | 1 | 0.7258 | 0.2481 | 1.2036 | -- | -- | -- | |||
| EW | ||||||||||
| Leghorn | 8 | 3.5801 | 0.7868 | 6.3734 | 96.7 | 15.7773 | 3.9721 | 46.38 | 3 | <0.0001 |
| Hy-Line Brown | 4 | 0.7262 | 0.0041 | 1.4484 | 93.4 | 0.5119 | 0.7155 | |||
| Babcock B-380 | 2 | -1.4569 | -1.9520 | -0.9618 | 51.9 | 0.0664 | 0.2576 | |||
| Dekalb XL | 1 | -1.6405 | -1.9684 | -1.3127 | -- | -- | -- | |||
| FI | ||||||||||
| Leghorn | 8 | 0.6657 | -0.5159 | 1.8472 | 94.5 | 2.7739 | 1.6655 | 45.18 | 3 | <0.0001 |
| Hy-Line Brown | 4 | 0.6019 | -0.4436 | 1.6474 | 97.1 | 1.1061 | 1.0517 | |||
| Babcock B-380 | 2 | -1.3847 | -2.9017 | 0.1324 | 94.7 | 1.1349 | 1.0653 | |||
| Lohmann | 1 | 3.4901 | 2.7443 | 4.2359 | -- | -- | -- | |||
| FCR | ||||||||||
| Leghorn | 7 | 0.2868 | -0.2218 | 0.7954 | 73.8 | 0.3642 | 0.6035 | 86.52 | 3 | <0.0001 |
| Hy-Line Brown | 4 | 0.0322 | -0.8457 | 0.9102 | 96.2 | 0.7727 | 0.8790 | |||
| Babcock B-380 | 2 | -2.2018 | -2.5884 | -1.8152 | 0.0 | 0 | 0 | |||
| Lohmann | 1 | 0.1146 | -0.3478 | 0.5770 | -- | -- | -- | |||
| EYC | ||||||||||
| Leghorn | 7 | -9.3294 | -12.4773 | -6.1814 | 91.0 | 16.5335 | 4.0661 | 334.41 | 3 | <0.0001 |
| Hy-Line Brown | 4 | -4.8350 | -7.4031 | -2.2668 | 97.9 | 6.7380 | 2.5958 | |||
| Dekalb XL | 1 | -15.4948 | -17.0853 | -13.9044 | -- | -- | -- | |||
| Lohmann | 1 | -0.6231 | -1.0968 | -0.1495 | -- | -- | -- | |||
1EP: Egg production; EW: Egg weight; FI: Feed intake; EYC: Egg yolk color 2k: Study number; SMD: Standard mean difference. 3I2: Higgins statistic; Q: χ2statistics; τ2: Heterogeneity variance of the true effect sizes; τ: Standard deviation of the true effect sizes; df: Degree of freedom.
Table 4.
Meta-regression Analysis of the Effect of Triticale Percentage on Laying Hens’s Performance in Juanilo and Joesong Strains.
Table 4.
Meta-regression Analysis of the Effect of Triticale Percentage on Laying Hens’s Performance in Juanilo and Joesong Strains.
| Variables1 | Mixed-effect model | Heterogeneity3 | P-value | ||||||||
|---|---|---|---|---|---|---|---|---|---|---|---|
| 95% CI | I2 (%) | τ2 | τ | R2 | QM | df | |||||
| k2 | Estimate | Lower | Upper | ||||||||
| EP | |||||||||||
| Joesong | 4 | -0.0353 | -0.1937 | 0.1232 | 96.39 | 0.7875 | 0.8874 | 0.00 | 0.1902 | 1 | 0.6628 |
| EW | |||||||||||
| Juanilo | 7 | 0.1292 | 0.0128 | 0.2457 | 97.77 | 10.2875 | 3.2074 | 39.90 | 4.7301 | 1 | 0.0296 |
| Joesong | 4 | 0.0189 | -0.1377 | 0.1754 | 96.02 | 0.7684 | 0.8766 | 0.00 | 0.0558 | 1 | 0.8133 |
| FI | |||||||||||
| Juanilo | 7 | 0.0056 | -0.0651 | 0.0762 | 96.59 | 3.8256 | 1.9559 | 0.00 | 0.0237 | 1 | 0.8777 |
| Joesong | 4 | 0.0562 | -0.1591 | 0.2715 | 97.80 | 1.4786 | 1.2160 | 0.00 | 0.2615 | 1 | 0.6091 |
| FCR | |||||||||||
| Juanilo | 7 | 0.0029 | -0.0241 | 0.0298 | 81.49 | 0.4706 | 0.6860 | 0.00 | 0.0441 | 1 | 0.8336 |
| Joesong | 4 | 0.0758 | -0.0854 | 0.2371 | 96.49 | 0.8154 | 0.9030 | 0.00 | 0.8501 | 1 | 0.3565 |
| EYC | |||||||||||
| Juanilo | 7 | -0.1695 | -0.2363 | 0.1028 | 64.70 | 1.7919 | 1.3386 | 89.16 | 24.7806 | 1 | <0.0001 |
| Joesong | 4 | -0.3741 | -0.5990 | -0.1493 | 94.29 | 1.4933 | 1.2220 | 77.84 | 10.6328 | 1 | 0.0011 |
1EP: Egg production; EW: Egg weight; FI: Feed intake; EYC: Egg yolk color. 2k: Study number. 3I2: Higgins statistic; QM: Model sum of square; τ2: Heterogeneity variance of the true effect sizes; τ: Standard deviation of the true effect sizes; R2: Percentage of variation explained by the model; df: Degree of freedom.
Table 5.
Meta-regression Analysis of the Effect of Triticale Percentage on Laying Hens’s Performance in Leghorn and Hy-Line Brown Strains.
Table 5.
Meta-regression Analysis of the Effect of Triticale Percentage on Laying Hens’s Performance in Leghorn and Hy-Line Brown Strains.
| Variables1 | Mixed-effect model | Heterogeneity3 | P-value | ||||||||
|---|---|---|---|---|---|---|---|---|---|---|---|
| 95% CI | I2 (%) | τ2 | τ | R2 | QM | df | |||||
| k2 | Estimate | Lower | Upper | ||||||||
| EP | |||||||||||
| Leghorn | 8 | -0.0081 | -0.0306 | 0.0144 | 77.40 | 0.3224 | 0.5678 | 0.00 | 0.4990 | 1 | 0.4799 |
| Hy-Line Brown | 4 | -0.0353 | -0.1937 | 0.1232 | 96.39 | 0.7875 | 0.8874 | 0.00 | 0.1902 | 1 | 0.6628 |
| EW | |||||||||||
| Leghorn | 8 | 0.1086 | -0.0138 | 0.2310 | 98.41 | 12.1592 | 3.4870 | 22.93 | 3.0262 | 1 | 0.0819 |
| Hy-Line Brown | 4 | 0.0189 | -0.1377 | 0.1754 | 96.02 | 0.7684 | 0.8766 | 0.00 | 0.0558 | 1 | 0.8133 |
| FI | |||||||||||
| Leghorn | 8 | 0.0088 | -0.0546 | 0.0721 | 96.47 | 3.2404 | 1.8001 | 0.00 | 0.0733 | 1 | 0.7865 |
| Hy-Line Brown | 4 | 0.0562 | -0.1591 | 0.2715 | 97.80 | 1.4786 | 1.2160 | 0.00 | 0.2615 | 1 | 0.6091 |
| FCR | |||||||||||
| Leghorn | 7 | 0.0029 | -0.0241 | 0.0298 | 81.49 | 0.4706 | 0.6860 | 0.00 | 0.0441 | 1 | 0.8336 |
| Hy-Line Brown | 4 | 0.0758 | -0.0854 | 0.2371 | 96.49 | 0.8154 | 0.9030 | 0.00 | 0.8501 | 1 | 0.3565 |
| EYC | |||||||||||
| Leghorn | 7 | -0.1695 | -0.2363 | -0.1028 | 64.70 | 1.7919 | 1.3386 | 89.16 | 24.7806 | 1 | <0.0001 |
| Hy-Line Brown | 4 | -0.3741 | -0.5990 | -0.1493 | 94.29 | 1.4933 | 1.2220 | 77.84 | 10.6328 | 1 | 0.0011 |
1EP: Egg production; EW: Egg weight; FI: Feed intake; EYC: Egg yolk color. 2k: Study number. 3I2: Higgins statistic; QM: Model sum of square; τ2: Heterogeneity variance of the true effect sizes; τ: Standard deviation of the true effect sizes; R2: Percentage of variation explained by the model; df: Degree of freedom.
Table 6.
Egger's Linear Regression Test for Assessing Publication Bias.
| Items | Bias | SE | t-value1 | df1 | P-value |
|---|---|---|---|---|---|
| Egg production | 0.6967 | 3.3112 | 0.21 | 13 | 0.8366 |
| Egg weight | 7.7581 | 3.0787 | 2.52 | 13 | 0.0256 |
| Feed intake | 2.7927 | 4.4421 | 0.63 | 13 | 0.5404 |
| Feed conversion ratio | -0.4714 | 4.0891 | -0.12 | 12 | 0.9101 |
| Egg yolk color | -10.1189 | 2.2244 | -4.55 | 11 | 0.0008 |
1df: Degree of freedom; t-value: Relative difference in units of standard error.
Table 7.
The Trimmed Effect Size of Triticale Percentage on Laying Hens' Performance.
| Items | df1 | Random effects model | Heterogeneity2 | |||
|---|---|---|---|---|---|---|
| Effect size | P-value | Q ( P-value ) | I2 (%) | τ2 | ||
| Egg production | 16 | 0.0069 | 0.9723 | 200.69(<0.0001) | 92.0 | 0.6022 |
| Egg weight | 17 | 0.2126 | 0.8561 | 726.42(<0.0001) | 97.7 | 24.3241 |
| Feed intake | 15 | 0.3401 | 0.4675 | 479.96(<0.0001) | 96.9 | 3.4058 |
| Feed conversion ratio | 13 | -0.1494 | 0.6082 | 224.88(<0.0001) | 94.2 | 1.1131 |
| Egg yolk color | 18 | -3.2429 | 0.0872 | 1236.58(<0.0001) | 98.5 | 67.1063 |
1df: Degree of freedom. 2I2: Higgins statistic; Q: χ2statistics; τ2: Heterogeneity variance of the true effect sizes.
Disclaimer/Publisher’s Note: The statements, opinions and data contained in all publications are solely those of the individual author(s) and contributor(s) and not of MDPI and/or the editor(s). MDPI and/or the editor(s) disclaim responsibility for any injury to people or property resulting from any ideas, methods, instructions or products referred to in the content. |
© 2024 by the authors. Licensee MDPI, Basel, Switzerland. This article is an open access article distributed under the terms and conditions of the Creative Commons Attribution (CC BY) license (http://creativecommons.org/licenses/by/4.0/).
Copyright: This open access article is published under a Creative Commons CC BY 4.0 license, which permit the free download, distribution, and reuse, provided that the author and preprint are cited in any reuse.


