Submitted:
04 May 2024
Posted:
06 May 2024
You are already at the latest version
Abstract
Dearth of information on extent of genetic variability in cassava limits the genetic improvement of cassava in Sierra Leone. This study aimed at assessing the genetic variability and relationships within 103 cassava genotypes using agro-morphological and culinary markers. A field trial was conducted in the School of Agriculture and Food Sciences research site. The experiment was laid in an augmented randomized block design. Morphological classification based on qualitative and quantitative traits categorized the germplasm into three different groups. A total of ten principal components (PCs) in the qualitative and six PCs in the quantitative trait sets accounted for 66.74% and 67.27% of the total genetic variation, respectively. Traits with significantly strong and positive correlations included presence of fruit (PFRT) and presence of seed (PSE)(r = 0.86***),root yield per plant (RYPP) and number of storage root (NSR) (r = 0.76***), RYPP and number of commercial root (NCR) (r = 0.68***), length of leaf lobe (LLL) and width of leaf lobe (WLL) (r = 0.66***),and between NSR and NCR (0.84***). Cooking time, cooking percentage, texture, mealiness, taste and aroma varied widely among the accessions. Findings established that the cassava germplasm possess useful genetic variability that could be exploited through selection for short term release programme, genetic conservation of valuable germplasm and genetic improvement of the crop.
Keywords:
Cassava
; Germplasm
; Genetic variability
; Morpho-culinary markers
; phenotypic relationship
1. Introduction
Cassava (Manihot esculenta Crantz) is a highly significant root crop, widely utilized for human consumption, animal feed, and industrial applications [1]. The starchy storage roots of cassava have emerged as a crucial source of dietary energy in sub-Saharan Africa (SSA), offering higher returns per unit of input compared to other staple crops [1,2]. Cassava exhibits exceptional resilience, thriving in nutrient-poor soils and displaying superior yield performance in comparison to other root and tuber crops [2,3]. Nevertheless, the response of cassava genotypes to diverse environmental factors (soil, climate) and biotic stresses can vary significantly [3,4].
In Sierra Leone, the lack of comprehensive data regarding the genetic variation within the cassava breeding population hampers the development of superior cassava genotypes. Assessing the extent of genetic variation within the breeding population is essential for identifying valuable genetic divergence that is crucial for improving cassava populations. Genetic markers serve as an effective tool for evaluating genetic divergence within the breeding population [5]. Preliminary studies often utilize genetic markers, including agro-morphological markers, due to their efficiency and simplicity in assessing the diversity among germplasm [6]. Certain morphological traits have proven to accurately reflect the perceived diversity by farmers [7,8]. Additionally, Elias et al. [9] reported that morphological traits exhibit heritable genetic variation. Morphological traits, both quantitative and qualitative, have been widely employed in the systematic identification of genotypes, species, and genera in various crops [10]. Qualitative traits are typically governed by a few major genes, resulting in distinct observable differences that facilitate genotype differentiation and identification. On the other hand, quantitative traits are influenced by numerous minor genes with complex inheritance patterns. These traits are more susceptible to environmental effects and the developmental stage of the crop. Genetic diversity studies based solely on morphological traits can be constrained by environmental factors and genotype-environment interactions [11]. These limitations may hinder the accurate identification of duplicate genotypes through morphological classification techniques alone. To overcome these challenges, Collard et al. [11] highlighted the use of molecular markers, which enable the detection of genetic distinctions among closely related genotypes. This study assessed the genetic variability and relationships within 103 cassava genotypes using agro-morphological and culinary markers
2. Materials and Methods
2.1. Description of the study area
A field experiment was carried out in the upland ecology of the School of Agriculture and Food Sciences experimental site, Njala during May 2020/2021 cropping season. Njala is located on an elevation of 50 m above sea level on latitude 8°6N and longitude 12°6W of the equator. Njala experiences distinct dry and wet seasons. The rainy season starts from April to November and the dry season starts from October to May. The mean monthly air temperature ranges from 21°C to 23°C for greater part of the day and night especially during the rainy season. The land cover of the experimental site is predominantly secondary bush and consists of well-balanced mixture of sand, clay, and humus.
2.2. Plant material, experimental design and layout
The experimental materials included stem cuttings of 103 cassava genotypes, of which, 100 accessions were collected from all districts of Sierra Leoneand3 improved released varieties (SLICASS 4, SLICASS 6 and SLICASS 7) utilized as checks. The experiment was laid out in an Augmented Randomized Design with four blocks, each block measuring 28 m × 10 m with 1 m apart between two blocks. The total experimental area utilized was 43 m × 28 m. About 10 stem cuttings per genotype each measuring 30cm long were planted on a 10 m long ridges at 1 m × 1 m spatial arrangement
2.3. Data collection
2.3.1. Agro-morphological traits
Agro-morphological traits comprising both quantitative and qualitative traits were evaluated based on the agro-morphological descriptor of cassava described by Fukuda et al. [12]. Harvest index (HI) was calculated at harvest as the ratio of fresh root yield to the total fresh biomass (weight of roots and weight of above ground biomass). Root dry matter content (RDMC) determination was done at harvest by selecting three representative roots from the bulk of roots harvested from 5 plants. Cassava roots were washed and shredded into pieces. A standard measure of 100 g weight of the fresh samples was taken and oven dried at 65–70°C and reweighed to obtain a constant weight after 72 h [12]. The qualitative and quantitative data collected, codes, scoring and sampling period are presented in Table 1 and Table 2.
2.3.2. Culinary traits of selected cassava genotypes
Thirty farmers were randomly selected for participatory identification and selection of five best preferred, five moderately preferred and five least preferred cassava accessions based on above ground (leaf, petiole) traits for marketability and consumption. The selected 15 cassava accessions were tagged for further culinary evaluation after harvest. The culinary traits measured included time of cooking (CT), cooking percentage (CP), surface appearance of the cooked storage root, mealiness, aroma, texture and taste of the cooked cassava root.
For CT (min), a 5cm long piece was removed from the central region of each of the 10 fresh storage roots per genotype. The 10 pieces were peeled, washed in fresh water and placed in 1.5 l of boiling water. Checking was done at 5 min intervals for ease of cooking using a folk and the cooking time was recorded when 6 pieces (50% + 1) no longer resisted penetration with a fork [13]. The roots continued to cook for a maximum of 30 min in total and after this period, the number of tender cooked pieces was recorded. The CP (%) was calculated by dividing the number of tender cooked pieces by the total number of the roots placed in the boiling water.
Mealiness of the root is an attribute used in describing cassava roots which when boiled become soft and chewable [14]. Thus, all cassava roots were categorized to reflect the degrees of mealiness. The cooked samples were divided into small pieces and placed randomly on labeled plates. Each panelist was given a glass of water to rinse his or her mouth before the next sample. Each of the samples was rated for surface appearance (surface color); mealy (floury); taste (mouth feel and after taste); texture (feel of the tongue before chewing) and aroma (smell). Sensory evaluation was carried out according to a method by Iwe [15]. A five-point hedonic scale (5 = very good, 4 = good, 3 = fair, 2 = poor, 1 = worst) was utilized. A product with a mean score of M≥3 for a given attribute was considered acceptable and each accepted variety was further sampled for its culinary aspects by six trained panelists.
2.4. Data analysis
The data were first entered into an Excel spreadsheet in the form of an ̏accessions / morphological characters ̋ matrix. The genetic variation among the studied genotypes for agro-morphological traits was explored using multivariate analysis technique. Multivariate analysis of the 103 × 25 qualitative data and 103 × 14 quantitative data matrices were separately subjected to principal component analysis (PCA) and descriptive statistics was performed for the quantitative data using R software program [16]. In the PCA, eigen-values and load coefficient values were generated from the data sets. The relevance of trait contribution to the variation accounted by each principal component was based on the absolute eigenvector arbitrary cutoff value of 0.30 [17]. The PCA and correlation matrices were used to determine the relationships among the traits. The organization and structure of the morphological variability was visualized using the Ascending Hierarchical Clustering (AHC) to plot a dendrogram. Data on culinary traits were subjected to analysis of variance using the R software program [16] and the means were compared using Scott-Knott test.
3. Results
3.1. Correlation analysis, principal component analysisand genetic relationshipsamong cassava assessions based on 25 qualitative agro-morphological traits
The results on the correlation matrices of 25 qualitative characters revealed a significant and positive correlation between color of leaf vein and leaf color (r= 0.22*), color of leaf vein and petiole color (r= 0.62***), leaf color and color of apical leaf (r= 0.39***), leaf color and petiole color (r= 0.43***), leaf color and leaf retention (r= 0.22*), color of apical leaf and leaf retention (r= 0.23*), shape of center leaflet and color stem epidermis (r=0.23*), leaf margin and presence of foliar scar (r= 0.29**), leaf margin and color of end branches (r= 0.24*), petiole color and leaf retention (r=0.24*), root taste and fruit (r= 0.25*), color of stem epidermis and plant shape(r = 0.21*), leaf retention and stipule margin (r= 0.24*), height at first branching and fruit(r= 0.32**), height at first branching and seed (r= 0.31**), plant shape and fruit (r= 0.47***), plant shape and seed (r= 0.44***), fruits and seeds (r= 0.86***) (Table 3). Conversely, significant and negative correlation were noted between leaf color and shape of center leaflet(r= -0.30***), leaf color and branching habit (r= 0.20*), shape of center leaflet and petiole color (r= -0.42***), shape of center leaflet and root constriction (r= -0.29**), petiole color and color stem exterior (r= -0.25*), root shape and color of root cortex (r= -0.24*), color of stem cortex and leaf retention (r= -0.27**), color of stem exterior and seed (r= -0.24*), orientation of petiole and plant shape (r= -0.23*), stipule margin and root constriction (r= -0.19*), and branching habit and plant shape (r= -0.53***).
The eigenvalues and percent variations of the principal components are presented in Table 4. Ten principal components (PC) that accounted for 66.744% of the total variation among the genotypes were identified. The first PC axis with eigenvalue of 2.971 accounted for 11.885% of the total variation, while the second, third and fourth PCs with eigenvalues of 2.611, 1.774 and 1.651 accounted for 10.444%, 7.098% and 6.604% of the total variation, respectively. The fifth, sixth and the seventh PCs with eigenvalues of 1.577, 1.501 and 1.177 accounted for 6.309%, 6.004% and 4.707% of the total variation, respectively, while the eighth, nineth and tenth PCs with eigenvalues of 1.167, 1.156 and 1.1 accounted for 4.669%, 4.625% and 4.4% of the total variation, respectively. The first principal component positively associated with root taste, orientation petiole, branching habit, presence of fruits and presence of seeds. The second PC with second highest loadings factor was positively associated with color of leaf vein, leaf color, color of apical leaf and petiole color. The third PC was associated with root taste, color of apical leaf, leaf retention and orientation petiole, while fourth PC was associated with leaf margin, root cortex and color of end branches. Traits that were positively associated with fifth PC are leaf color, color of apical leaf, color of root cortex, color of stem exterior, presence of fruit and Seeds while leaf retention, color of end branches and stipule margin were the traits was associated with the sixth PC and the Seventh PC was positively associated with mainly with storage root characteristics (root taste and external color of storage). The eighth and ninth PCs were positively associated with root taste, root shape, external color of storage and leaf margin, color of root cortex and leaf retention, respectively, while petiole color and prominence of foliar scale were the only traits that associated positively with the tenth PC.
The hierarchical classification of 103 cassava genotypes based on qualitative traits grouped the genotypes into three classes almost with the same characteristics as a function of the variable. The genetic similarity for the 25 qualitative traits ranged from zero to two with a mean similarity of 2.0. The cassava genotypes were grouped into three distinct cluster at 1.4 similarities. Clusters I and III have a higher number of genotypes with 40 and 34, respectively, while 29 individuals were in cluster II (Figure 1).
3.2. Descriptive statistics, correlation analysis, principal component analysis and genetic relationships among cassava assessions based on 14 quantitative agro-morphological traits
The cassava genotypes showed variability for fourteen quantitative morphological traits assessed (Table 5). The range of the values produced were 1.0 to 5.0 cm for distance between leaf scar, 0.0 to 165.9 cm for height at first branching, 0.16 to 0.68 for harvest index, 0.0 to 20.0 for level of branching, 5.7 cm to 21.8cm for length of leaf lobe, 1.0 cm to 5.0 cm for length of stipule, 1.0 to 24.0 for number of commercial root, 3.0 to 9.0 for number of leaf lobe, 2.0 to 53.0 for number of storage root, 41.0 cm to 346 cm for plant height, 4.7 cm to 37.3 cm for petiole length, 15.0% to 36.0% for root dry matter content, 1.0 kg to 19.0 kg for root yield per plant and 1.5 cm to 6.0 cm for width of leaf lobe(Table 5). The coefficient of variation varied from 14.7% (root dry matter content) to 81.2% (level of branching). Based on the 14 quantitative characters/traits, 11 had high (CV>20%) coefficient of variation (Table 5). Only three characters had low variation including root dry matter content (14.8%), distance between leaf scar (18.7%) and number of leaf lobe (17.8%).
Phenotypic correlations among 14 quantitative traits revealed that harvest index is the principal trait that is significantly and positively correlated with root yield per plant (r= 0.40***) and number of storage root (r= 0.24*) (Table 6). Root yield per plant is highly significant and positively correlated with number of storage root (r= 0.76***) and number of commercial root (r= 0.68***). Petiole length significantly and positively correlated with length of leaf lobe (r= 0.22*) and number of leaf lobe (r= 0.26**). The length of leaf lobe is significantly and positively correlated with the width of leaf lobe (r= 0.66***) and number of leaf lobe (r= 0.41***); the width of leaf lobe also positively correlated with plant height (r= 0.20*).
Number of storage root was significantly and positively correlated with number of commercial roots (r= 0.84***), while plant height was positively correlated with number of leaf lobe (r= 0.24*), and height at first branching positively correlating with level of branching (r= 0.25*). Conversely, significant and negative correlation were noted between harvest index and distance between leaf scar (r= 0.20*), length of leaf lobe and level of branching (r= 0.21*), and between width of leaf lobe and level of branching (r=0.21*).
The principal component analysis of quantitative agro-morphological traits revealed that the six main principal components accounted for 67.723% of the total variation among the genotypes (Table 7). The first factorial plane contains 18.34% of the variance. The traits that significantly correlated with axis 1 are: harvest index (43.0%), root yield per plant (86.0%), number of storage root (90.0%) and number of commercial root (85.0%). The variables that were significantly correlated with axis 2 are: petiole length (43.0%), length of leaf lobe (83.0%), width of leaf lobe (70.0%), plant height (40.0%) and number of leaf lobe (53.0%).
The traits that were significantly related to axis 3 are: petiole length (44.0%), height at first branching (35.0%) and level of branching (30.0%), the variables significantly correlated to axis 4 are: plant height (30.0%), height at first branching (66.0%) and level of branching (61.0%). The variables significantly related to axis 5 are: harvest index (54.0%), number of leaf lobe (44.0%) and length of stipule (32.0%) and the traits that are significantly correlated to axis 6 are: root dry matter content (54.0%) and length of stipule (44.0%) (Table 7).
Hierarchical classification of 14 quantitative agro-morphological traits grouped the genotypes in three classes almost with same characteristics as a function of the variable (Figure 2). The genetic similarity for the even quantitative traits ranged from zero to two with a mean similarity of 1.8. Cluster I contains 53 genotypes, cluster II contains 6 genotypes and cluster III contains 44 genotypes.
3.3. Culinary traits and marketable leaf assessment of 15 selected cassava genotypes
The mean cooking time (CT) ranged from 15.2 to 30.0 min (Table 8). The genotypes that have short and better cooking time were Cookson (15.2 min) and Butter cassava (15.4 min), those with longest cooking time were pink lady(30.0min), SLICASS 4(30.0 min) and SLICASS 6(30min).The cooking percentage was incorporated as an important culinary trait due to the large variation that is normally observed between the cooking time of cassava varieties. The mean cooking percentage (CP) ranged from 27.9% to 96.4%. The mean percentage were classified into two groups.The group with lowest membership had genotypes SLICASS 4(27.9%), SLICASS 6(30.2%) and SLICASS 7(58.3%). The mean of the other groups of genotypes ranging from 63.2% to 96.4% are pink lady (63.2%), Soja colour (70.3%), Kendemeh (73.4%), Tangagboi (76.2%), Mende tangai (78.4%), Yaa kanu (80.2%), Nikaneh (80.2%), Tapiyoka (82.0%), Cocoa cassada (83.2%), Ndiamonyamalo (88.3%), Butter cassava (95.0%) and Cookson (96.4%).
Mean score for surface appearance, mealiness, taste, and aroma ranged from 2.0 to 4.75 and for texture,from 2.0 to 4.50,indicatingthe acceptable mean threshold (Table 8). Comparing the mean for sensory characteristics, genotypes that had the highest mean scores for surface appearance were cook soon (4.50±0.50), Butter cassava (4.50±0.58) and Cocoa cassada (4.50±0.50), closely followed by Ndiamonyamalo (4.3±0.50), Nikaneh (4.3±0.58), Tapiyoka (4.3±0.55) and Tangagboi (4.25±0.58), Mende Tangai (4.0±0.65), Yaa kanu(4.0±0.50) and SLICASS 7 (4.0±0.50) which clearly indicate good acceptability by consumers for this traits, while other genotypes like Kendemeh(3.5±0.58), Pink lady(3.5±0.82),SLICASS 6 (3.5±0.58) and Soja colour(3.5±0.50) were fairly accepted by consumers. SLICASS 4 has the lowest mean score (2.0±0.40) for surface appearance thus indicating poor acceptability by consumers/farmers (Table 8).
The result on the mealiness revealed that cook soon has the highest mean score (4.75±0.80) followed by Butter cassava (4.50±0.50), Tapiyoka (4.3±0.50), Nikaneh (4.3±0.58), Ndiamonyamalo (4.25±0.48), Cocoa cassada (4.25±0.80), Tangagboi (4.0±0.40), Mende tangai (4.0±0.65), Yaa kanu (4.0±0.60) and Kendemeh (4.0±0.63) thus indicating good acceptable of the genotypes by consumers/farmers for mealiness. Pink lady (3.5±0.82), SLICASS 6 (3.5±0.58) and Soja colour (3.0±0.50) were fairly accepted by farmers. The genotype that recorded the lowest mean score in terms of mealiness was SLICASS 4(2.0±0.82) indicating poor acceptability by consumers of the genotype for this trait. Cook soon was highly rated for its taste and thus records the highest mean score (4.75±0.50), closely followed by Butter cassava (4.50±0.43), Ndiamonyamalo (4.50±0.50), Cocoa cassada (4.50±0.58), Tapiyoka (4.50±0.80) and Tangagboi (4.50±0.50), Nikaneh (4.3±0.58), Yaa kanu (4.25±0.50), Kendemeh (4.25±0.50) and Mende tangai (4.0±0.65) indicating good acceptability by farmers while Pink lady(.5±0.65) and SLICASS 7(3.0±0.45) were fairly accepted for this trait by farmers. However, SLICASS 4 (2.0±0.50), SLICASS 6 (2.0±0.50) and Soja colour (2.0±0.50) were rated poorly for taste quality. Sensory evaluation on the aroma of the cooked root of the genotypes revealed that Cook soon (4.75±0.50) and Butter cassava (4.75±0.50) scored the highest mean followed by Ndiamonyamalo (4.3±0.50), Tapiyoka(4.3±0.50), Cocoa cassada(4.25±0.58), Tangagboi(4.25±0.58), Nikaneh(4.25±0.50), Yaa kanu(4.25±0.82), Mende tangai (4.0±0.65), Kendemeh(4.0±0.58) and SLICASS 7(4.0±0.60) which indicate good acceptability by consumers while Soja colour(3.0±0.65), Pink lady(3.0±0.50) and SLICASS 6(3.0±0.50) was fair accepted by consumers in terms aroma. However, SLICASS 4 was poorly accepted by consumers being a mean score of 2.0±0.82. Cook soon and Butter cassava scored the highest means of 4.50±0.58 and 4.50±0.50, respectively, in terms their texture, followed by Ndiamonyamalo (4.3±0.50), Cocoa cassada (4.25±0.58), Tangagboi (4.25±0.58), Mende Tangai (4.0±0.65), Nikaneh (4.0±0.50) and Tapiyoka (4.0±0.60), which indicate good acceptability by consumers. Other genotypes like Yaa kanu (3.5±0.58), Kendemeh (3.5±0.50), pink lady (3.0±0.58), SLICASS 7(3.0±0.50) and SLICASS 6 (3.0±0.50) were fairly accepted by consumers. SLICASS 4 (2.0±0.82) and Soja color (2.0±0.82) were poorly accepted.
3.3. Marketable leaf assessment
The five elite varieties selected by farmers based on desired leaf traits for selling and consumption included Tangaigboi Coco cassada, Cooksoon, Butter cassava and Ndiamonyamalo, followed by moderately preferred varieties. Tapiyoka, Yaa kanu, Nikaneh, Mende tangai, and Kendemeh (Table 9). However, the leaves of varieties SLICASS 4, SLICASS 6, SLICASS 7, Pink lady, and Sojarcolourare not usually consumed and sold.
4. Discussion
Significant variation was noted from the analysis of the qualitative morphological traits (root taste, external color of storage root, color of root pulp, ease of peeling, color of leaf vein, lobe margins, leaf color, color of apical leaves, shape of central leaflet leaf color, color of root cortex, petiole color, root cortex, color of stem exterior, presence of fruit and seeds, leaf retention, color of end branches and stipule margin, external color of storage) among the studied genotypes. The most representative and distinctive trait was color possibly due to the fact that most of the exhibited white root pulp and dark brown external storage root. The above- ground leaf attributed of the studied genotypes were green leaf vein, light green leaf, light green apical leaf, smooth lobe margin, and elliptic-lanceolate center leaflet. The leaf attribute plays significant role in cultivar identification and more significant in cassava selection for leafy vegetable market for farmers. The findings agree with work of Karim et al. [18] who reported that leaf attribute is important for cassava identification and selection for leaf vegetable market in Sierra Leone where cassava leaves are widely consumed. Findings also agree with Agre et al. [19], who reported that farmers use color of the leaves and stem to identify their cassava cultivars.
The principal component analysis is a powerful data reduction technique utilized to reduce large number of correlated variables to a small number that is independent and very useful. The PCA unraveled traits that contributed most to the variation present in the cassava germplasm. Qualitative traits with highest positive contribution to the first PCA include root shape, orientation of petiole, branching habit, presence of fruits and seeds. The findings of the study revealed the usefulness of these traits for genotype identification and genetic diversity studies in cassava. Hence these traits are among key traits often considered relevant for selection of varieties for genetic improvement of the crop.
The clustering based on similarity index of the qualitative traits in this study grouped the 103 cassava accessions into three clusters. Cluster I contained the accessions characterized by green apical leaves, light green leaf, green leaf vein, yellowish-green petiole, umbrella plant shape and average leaf retention. Cluster II grouped accessions having elliptic-lanceolate shape leaflets, light brown stem epidermis, light brown stem exterior, ease of peeling, sweet root taste. Cluster III characterized accessions based on absence of fruits, absence of seeds, dichotomous branching habit, horizontal petiole orientation, dark brown external storage roots, light green leaves and ease of peeling. Similar study conducted by Karim et al. [18] identified five distinct groups using 102 cassava accessions. In this research, the first two principal components explained 22.33% of the total cumulative variance for the qualitative traits. This result underscored the findings of Karim et al. [18] and Afonso et al. [20] who found 31.18% and 32.56% of the genetic variance in the first factorial plane, respectively. It can also be explained by the fact that the variance distribution is associated with the nature and number of characters used in the analysis and focuses on the first principal components.
The 103 cassava accessions also showed variability for 14 quantitative morphological traits assessed. In other to appreciate the variability of each trait, all the quantitative traits recorded were subjected to descriptive statistical analysis (minimum, maximum, mean, variance, standard deviation and coefficient of variation). This study revealed high variability and higher coefficient of variation for most of the studied traits which indicated the presence of high heterogeneity within the population characterized that could be exploited for future breeding. These results are similar to those reported by Agre et al. [21] and Kumba [22]. Agre et al. [21] found higher coefficient of variation for 75% of the traits studied.
The first six principal components analysis explained 67.72% of the overall variability in the quantitative analysis. Principal component I obtained from the quantitative traits presents yield and yield attribute traits such as harvest index, root yield per plant, number of storage root and number of commercial root, while principal components II, III, and IV present growth attribute traits such as petiole length, length of leaflet, width of leaflet, plant height, height at first branching, level of branching. Principal components V and VI present both yield and growth attribute traits such as harvest index, root dry matter content and length of stipule. The quantitative traits with highest positive contribution to the distinguishing accessions in the first PCA include harvest index, root yield per plant, number of storage root and number of commercial roots. These traits are among the key traits often considered for selection of varieties and genetic improvement of cassava. This study agreed with work of Karim et al. [18], who observed that the first principal component present yield and yields and attribute traits such as d harvest index, average yield per plant, number of storage roots, root dry matter content and starch content and they were the highest contributors positively the principal component. The cluster analysis of the 14 quantitative agro-morphological trails also grouped the accessions into three groups. Cluster I characterized accessions with high number of storage root, number of commercial roots, root yield per plant, harvest index and number of leaf lobe, cluster II characterized accessions based on high petiole length and root dry matter content and cluster III accessions exhibited high number of commercial roots, number of storage root, root yield per plant, width of leaf lobe and harvest index. It can be seen from the result of this study the relevance of above ground and root attribute traits in characterizing the cassava accessions. This study also pointed out the usefulness of the agro-morphological descriptor by Fukuda et al. [12] in identifying variability and reducing dimensionality in the traits set. In this study, the 25 qualitative and 14 quantitative trait sets sufficiently discriminated the 103 genotypes into distinct cluster groups.
Root tenderness after cooking is a relevant attribute for cassava since dry matter content in cassava sometimes plays an important role. The results revealed that only cooksoon and butter cassava accessions recorded cooking time below 20 min, which is considered acceptable for cassava according the work of De Pedri et al. [23]. These authors further reported that the easier the cooking, the better the taste of the cooked product, indicating the relevance of dry matter content for acceptable cassava taste. Due the importance of cooking sweet cassava and the variation of the time of cooking that usually exist between cassava accessions, it is important to consider the cooking percentage of each accession. Among all the accessions evaluated for this trait, cooksoon and butter cassava had highest and better cooking percentage than other accessions. The result implied that the shorter the cooking time, the higher the cooking percentage. Thus, cooksoon and butter cassava had shorter cooking time and higher cooking percentage than other accessions. SLICASS 4 and SLICASS 6 had low cooking percentage during the 30 min maximum cooking time set. This study confirms the work of Santos et al. [24] who reported wide variation in the cooking percentage of 11 cassava clones evaluated at different harvesting time. The sensory evaluation results indicate that 60% of the total accessions evaluated had good acceptable cooking qualities (surface appearance, mealiness, taste, aroma and texture). Only one accession (SLICASS 4) was poorly rated by farmers for all the culinary traits. This variety is an improved variety that was developed by Sierra Leone Agricultural Institute (SLARI). The variety is high yielding, but lacks the acceptable cooking qualities (mealiness, taste and texture). The findings imply the significance of incorporation of desired end-user traits in cassava breeding programs. Similar research conducted by Mugalavai et al. [25] revealed that 18.0% of the 51 accessions evaluated had acceptable cooking qualities such as texture, taste and mealiness.
5. Conclusions
This study successfully determined the extent of genetic divergence within cassava germplasm of Sierra Leone using morphological markers. It also provides vital information for cassava scientists to make informed decision for parental selection based on genetic diversity for morphological and culinary traits. The useful genetic variability for root dry matter content, number of storage root, number of commercial root, root yield per plant, harvest index, length of leaflet, width of leaflet, height at first branching, distance between leaf scar, and level of branching that were identified could be exploited for the genetic improvement of the crop and its conservation. The root shape, orientation of petiole, branching habit, presence of fruits and seeds and color attribute of various qualitative traits studied contributed most to the differentiation of genotypes. The agro-morphological and culinary traits were useful in distinguishing and selecting cassava genotypes, respectively. Both approaches should therefore be used for genetic diversity studies of cassava.
Author Contributions
Conceptualization, V.A. and A.E.S.; methodology, A.E.S., V.A., P.E.N.; software, V.A., and P.E.N.; validation, V.A., P.E.N. and F.T formal analysis, V.A. and P.E.N.; investigation, V.A., A.E.S., P.E.N., K.Y.K., S.A.K.; resources, A.E.S., and J.S.P.; data curation, V.A. and P.E.N.; writing—original draft preparation, V.A., P.E.N.; writing—review and editing, A.E.S., V.A., P.E.N. F.T; visualization, P.E.N.; supervision, A.E.S., P.E.N., K.Y.K., S.A.K.; project administration, A.E.S., and J.S.P.; funding acquisition, A.E.S., and J.S.P. All authors have read and agreed to the published version of the manuscript.
Funding
This work was supported, in whole or in part, by the Bill & Melinda Gates Foundation and The United Kingdom Foreign, Commonwealth & Development Office (FCDO) under grant with investment record ID OPP1212988/INV002969 to the Central and West African Virus Epidemiology (WAVE) Program for root and tuber crops - through a subgrant from Université Félix Houphouët-Boigny (UFHB) to Njala University.
Data Availability Statement
Data from this survey can be made available on request from the corresponding author.
Acknowledgments
The authors are grateful to the crop protection and cassava breeding team at the Njala University, the Sierra Leone Agricultural Research Institute (SLARI) and WAVE Ivory Coast, for their technical support during the course of this study.
Conflicts of Interest
The authors declare no conflicts of interest.
References
- Maziya-Dixon, B.; Dixon, A.G.O.; Adebowale, A.A.; Akinyele, I.O.; Dixon, J.; Egesi, C.N.; Ojo, A. Cassava: Africa's food security crop in the face of climate change. Food Security 2019, 11, 1083–1098. [Google Scholar]
- Akinola, A.; Ojo, B.; Adeyemi, C. Resilience and superior yield performance of cassava compared to other root and tuber crops. Journal of Crop Science 2020, 25, 215–224. [Google Scholar]
- Lemchi, J.; Anyanwu, C.; Eze, P. Comparative study of cassava's yield performance in nutrient-poor soils compared to other root and tuber crops. Agriculture and Environment 2020, 17, 98–107. [Google Scholar]
- Iheanacho, O.M.; Mba, C.; Chikoye, D.; Eke-Okoro, O.N.; Onyishi, G.C.; Asiegbu, J.E.; Iwuchukwu, E. Response of cassava genotypes to drought stress at different growth stages in the subhumid tropics of Nigeria. Journal of Agronomy 2021, 20, 177–187. [Google Scholar]
- Andrade, R.M.; de Jesus Sanchez, D.; Taipe-Ochoa, W.; Roca, W.M.; Beebe, S.E. The use of molecular markers in cassava breeding programs: Past, present, and future perspectives. Crop Science 2021, 61, 733–755. [Google Scholar]
- Asare, A.T.; Offei, S.K.; Danquah, E.Y.; Sarkodie-Addo, J. Genetic diversity and agro-morphological characterization of cassava (Manihot esculenta Crantz) germplasm in Ghana. African Journal of Biotechnology 2011, 10, 16642–16653. [Google Scholar]
- McKey, D.; Elias, M.; Pujol, B.; Duputié, A. Local seed systems and their importance for an improved management of genetic resources: case studies from Mali. Euphytica 2001, 120, 83–104. [Google Scholar]
- Pinton, F.; Emperaire, L. Cassava diversity and crop reproduction in traditional farming systems: a cognitive approach. Economic Botany 2001, 55, 353–368. [Google Scholar]
- Elias, M.; Mühlen, G.S.; McKey, D.B.; Roa, A.C.; Tohme, J.; Restrepo, M.T. The influence of morphological variation on germplasm collection in cassava (Manihot esculenta Crantz) in Peru. Economic Botany 2001, 55, 256–269. [Google Scholar]
- Smykal, P.; Aubert, G.; Burstin, J.; Coyne, C.J.; Ellis, N.T.H.; Flavell, A.J.; Ford, R.; Hýbl, M.; Macas, J.; Neumann, P.; McPhee, K.; Redden, R.J.; Rubiales, D.; Weller, J.L.; Warkentin, T.D.; Thomas, W.T.B. Genetic diversity and population structure of pea (Pisum sativum L.) varieties derived from combined retrotransposon, microsatellite and morphological marker analysis. Theoretical and Applied Genetics 2008, 117, 413–424. [Google Scholar] [CrossRef]
- Collard, B.C.Y.; Jahufer, M.Z.Z.; Brouwer, J.B.; Pang, E.C.K. Prospects for using morphological, molecular and geographic distance data to estimate gene flow and seed migration in wild Phaseolus vulgaris populations from Mexico. Crop Science 2005, 45, 336–350. [Google Scholar]
- Fukuda, W.M.G.; Guevara, C.L.; Kawuk, R.; Ferguson, M.E. Selected morphological and agronomic descriptors for the characterization of cassava; International Institute of Tropical Agriculture (IITA): Ibadan (Nigeria), 2010. [Google Scholar]
- De Oliveira, M.A.; de Moraes, P.S.B. Technological and postharvest characteristics and productivity of cassava. Ciência e Agrotecnologia 2009, 33, 837–843. [Google Scholar]
- Ngeve, J.M. Mealiness of cassava roots: A descriptive attribute for boiled root texture. Journal of Food Science 1998, 45, 215–220. [Google Scholar]
- Iwe, M.O. Sensory evaluation of cassava products: A descriptive method for assessing surface appearance, mealy (floury) texture, taste, and aroma. Journal of Food Science and Technology 2002, 35, 231–238. [Google Scholar]
- R Core Team. R: A Language and environment for statistical computing; R foundation for statistical computing: Vienna, Austria, 2018; Available online: https://www.R-project.org/.
- Richman, M.B. A cautionary note concerning a commonly applied eigen analysis procedure. Tellus 1988, 40, 50–58. [Google Scholar] [CrossRef]
- Karim, K.Y.; Norman, P.E.; Dzidzienyo, D.; Ifie, B.; Kulakow, P.; Rabbi, I.; Omoigui, L.; Parkes, E. Gene action analysis studies for agronomic traits in cassava (Manihot esculenta Crantz) genotypes developed using line by tester mating design. African Journal of Agricultural Research 2020, 16, 1471–1479. [Google Scholar]
- Agre, A.P.; Gueye, B.; Adjatin, A.; Dansi, M.; Bathacharjee, R.; Rabbi, I.Y.; Gedil, M. Folk taxonomy and traditional management of cassava (Manihot esculenta Crantz) diversity in southern and central Benin. International Journal of Innovative Science Research 2016, 20, 500–551. [Google Scholar]
- Afonso, S.D.J.; Ledo, C.D.S.; Moreira, R.F.C.; Silva, S.D.O.; Leal, V.D.J.; Conceição, A.D.S. Selection of descriptors in a morphological characteristic considered in cassava accessions by means of multivariate techniques. IOSR Journal of Agriculture and Veterinary Science 2014, 7, 13–20. [Google Scholar] [CrossRef]
- Agre, A.P.; Dansi, A.; Rabbi, I.Y.; Battachargee, R.; Dansi, M.; Melaku, G.; Augusto, B.; Sanni, A.; Akouegninou, A.; Akpagana, K. Agro morphological characterization of elite cassava (Manihot esculenta Crantz) cultivars collected in Benin. International Journal Current Research Bioscience Plant Biology 2015, 2, 1–14. [Google Scholar]
- Karim, K.Y. Genetic characterization of exotic and landraces of cassava in Ghan; Kwame Nkrumah University of Science and Technology, College of Agriculture and Natural Resources, Faculty of Agriculture, Department of Crop and Soil Science, 2012. [Google Scholar]
- De Pedri, E.C.M.; Rossi, A.A.B.; Cardoso, E.S.; Tiago, A.V.; Hoogerheide, E.S.S.; Yamashita, O.M. Morphological characteristics and culinary quality of cassava ethno-varieties at different harvesting times. Brazilian Journal of Food Technology 2018, 21, e2018073. [Google Scholar]
- Santos, H.G.; Jacomine, P.K.T.; dos Anjos, L.H.C.; de Oliveira, V.A.; Lumbreras, J.F.; Coelho, M.R.; Cunha, T.J.F. Sistema Brasileiro de Classificação de Solos, rev. e ampl., 5th ed.; Embrapa: Brasília, DF, 2018. [Google Scholar]
- Mugalavai, E.; Patel, R.; Singh, S. Evaluation of cassava accessions for cooking qualities: Texture, taste, and mealiness. Journal of Crop Science and Food Technology 2018, 22, 215–224. [Google Scholar]
Figure 1.
Dendrogram showing relationships among 103 genotypes of cassava classified by Ward method using twenty-five 25 qualitative agro-morphological traits.
Figure 1.
Dendrogram showing relationships among 103 genotypes of cassava classified by Ward method using twenty-five 25 qualitative agro-morphological traits.
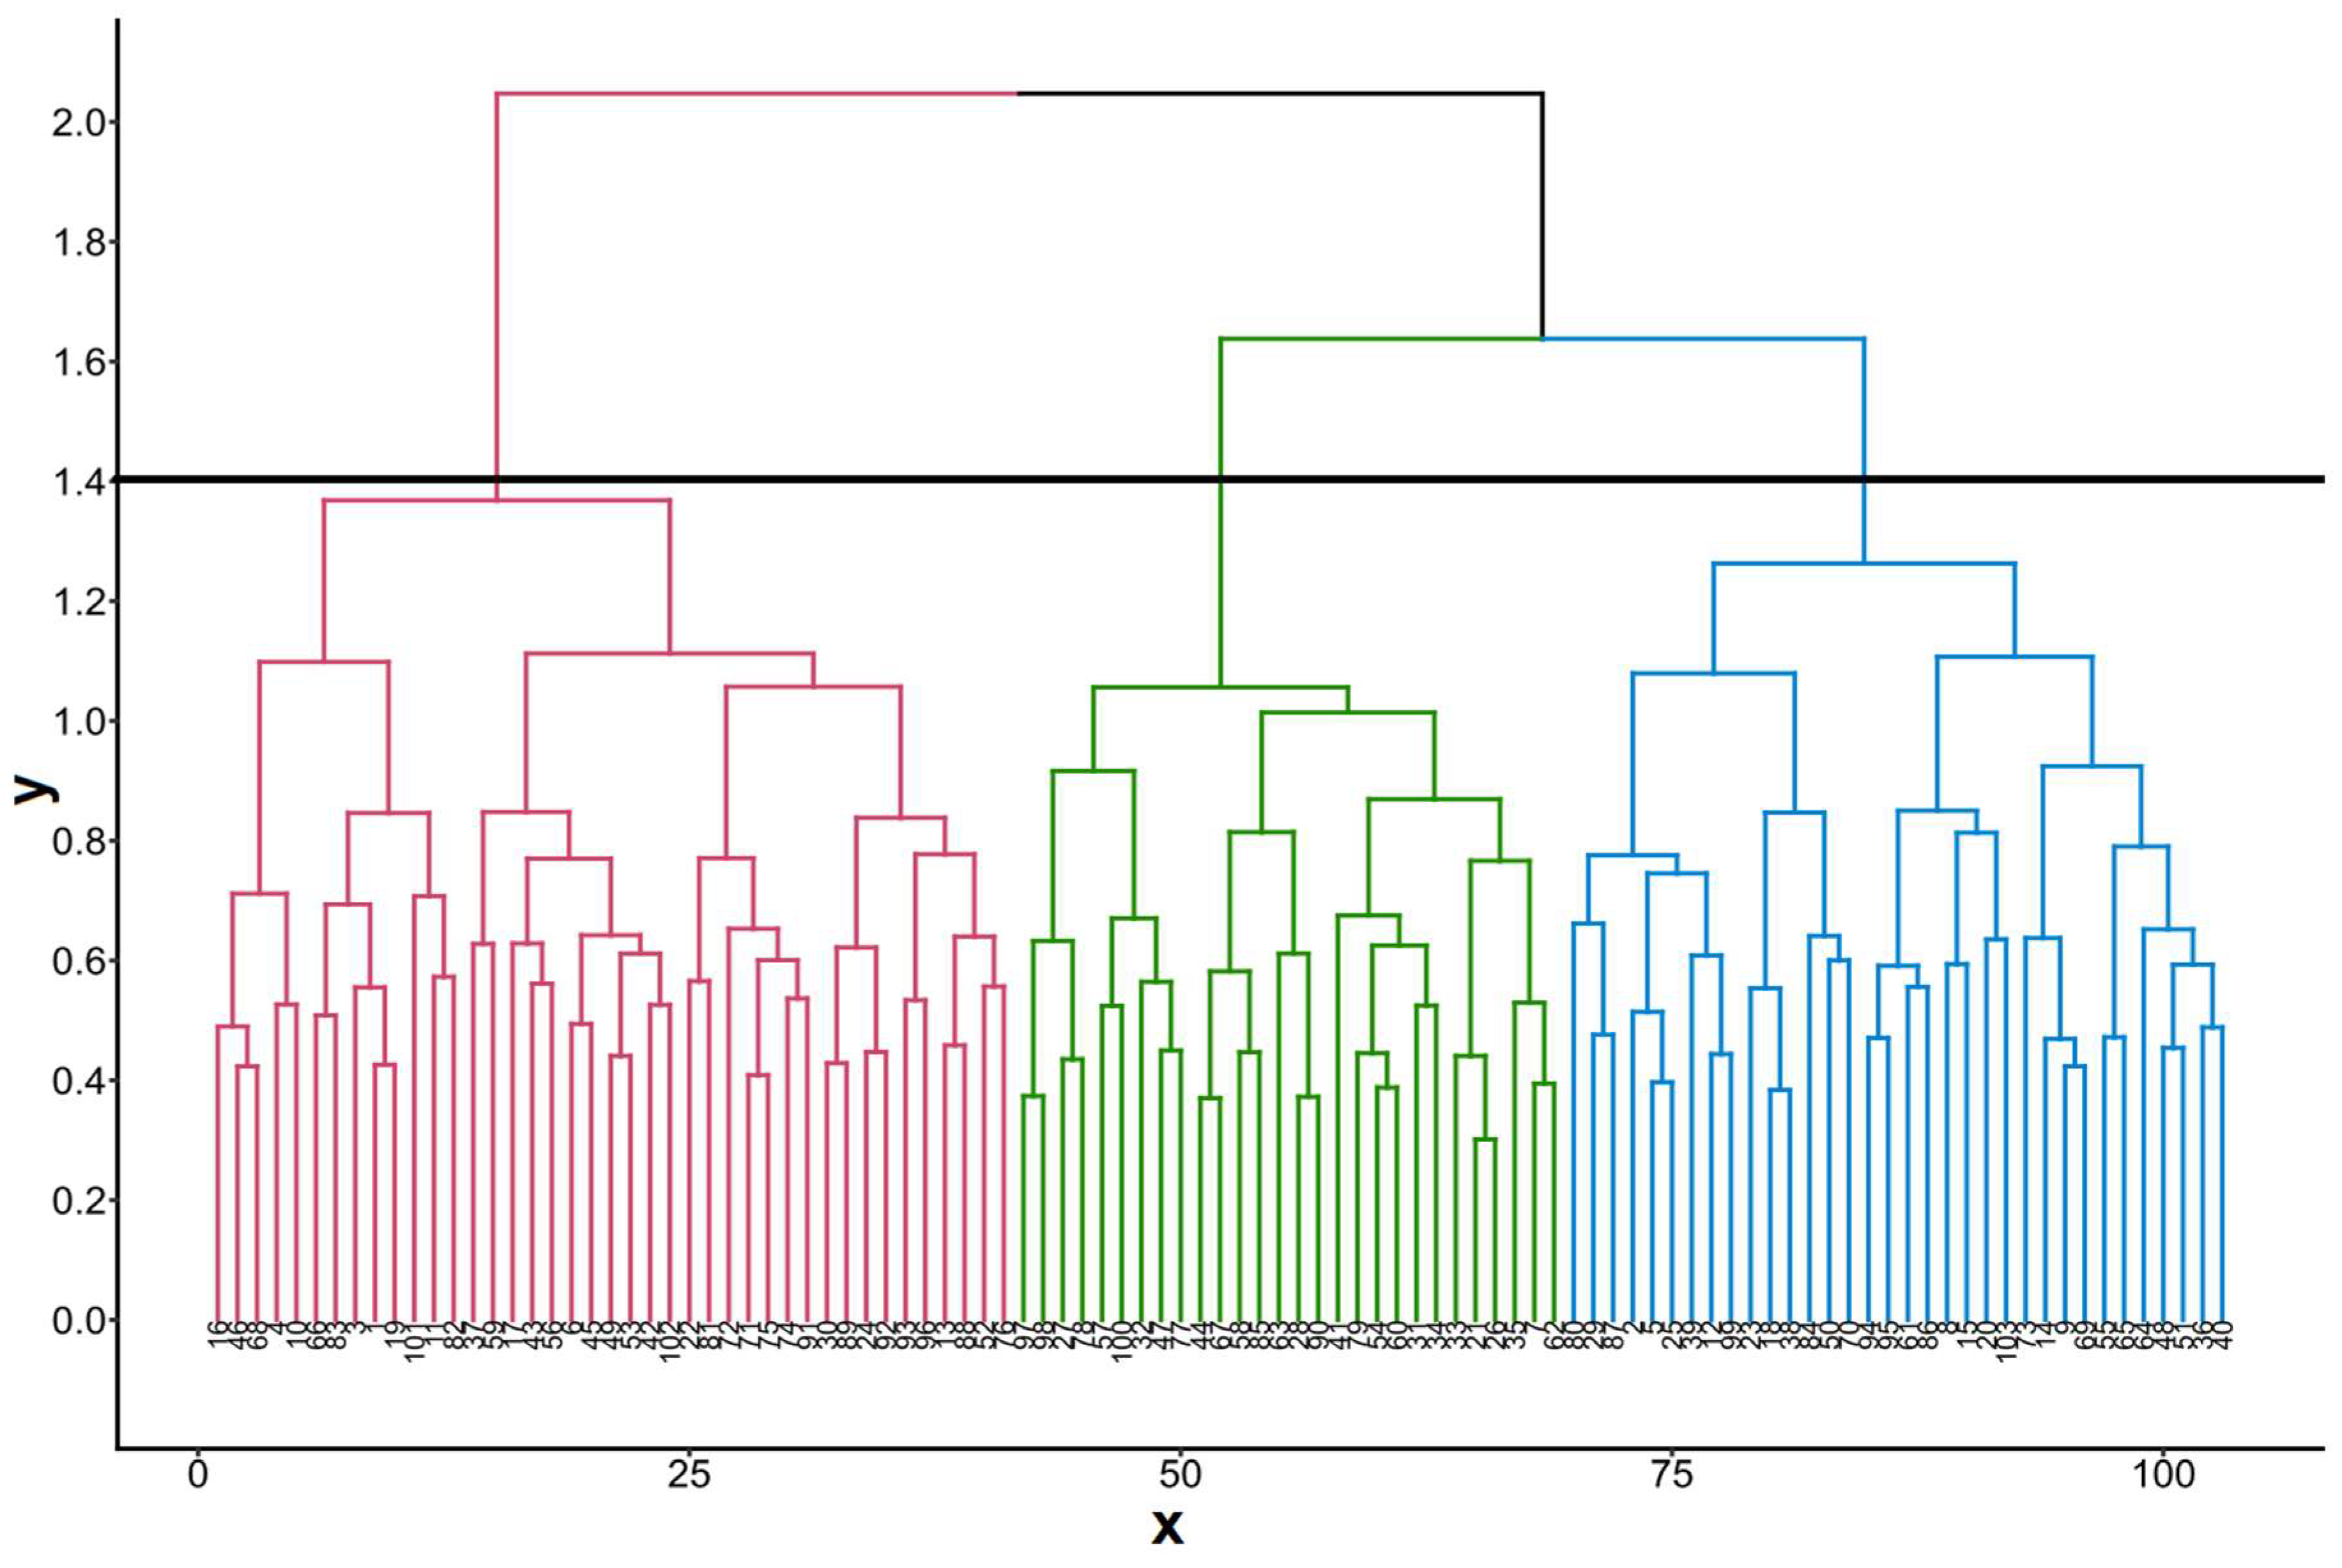
Figure 2.
Dendrogram showing relationships among 103 genotypes of cassava classified by Ward method using 14 quantitative agro-morphological traits.
Figure 2.
Dendrogram showing relationships among 103 genotypes of cassava classified by Ward method using 14 quantitative agro-morphological traits.
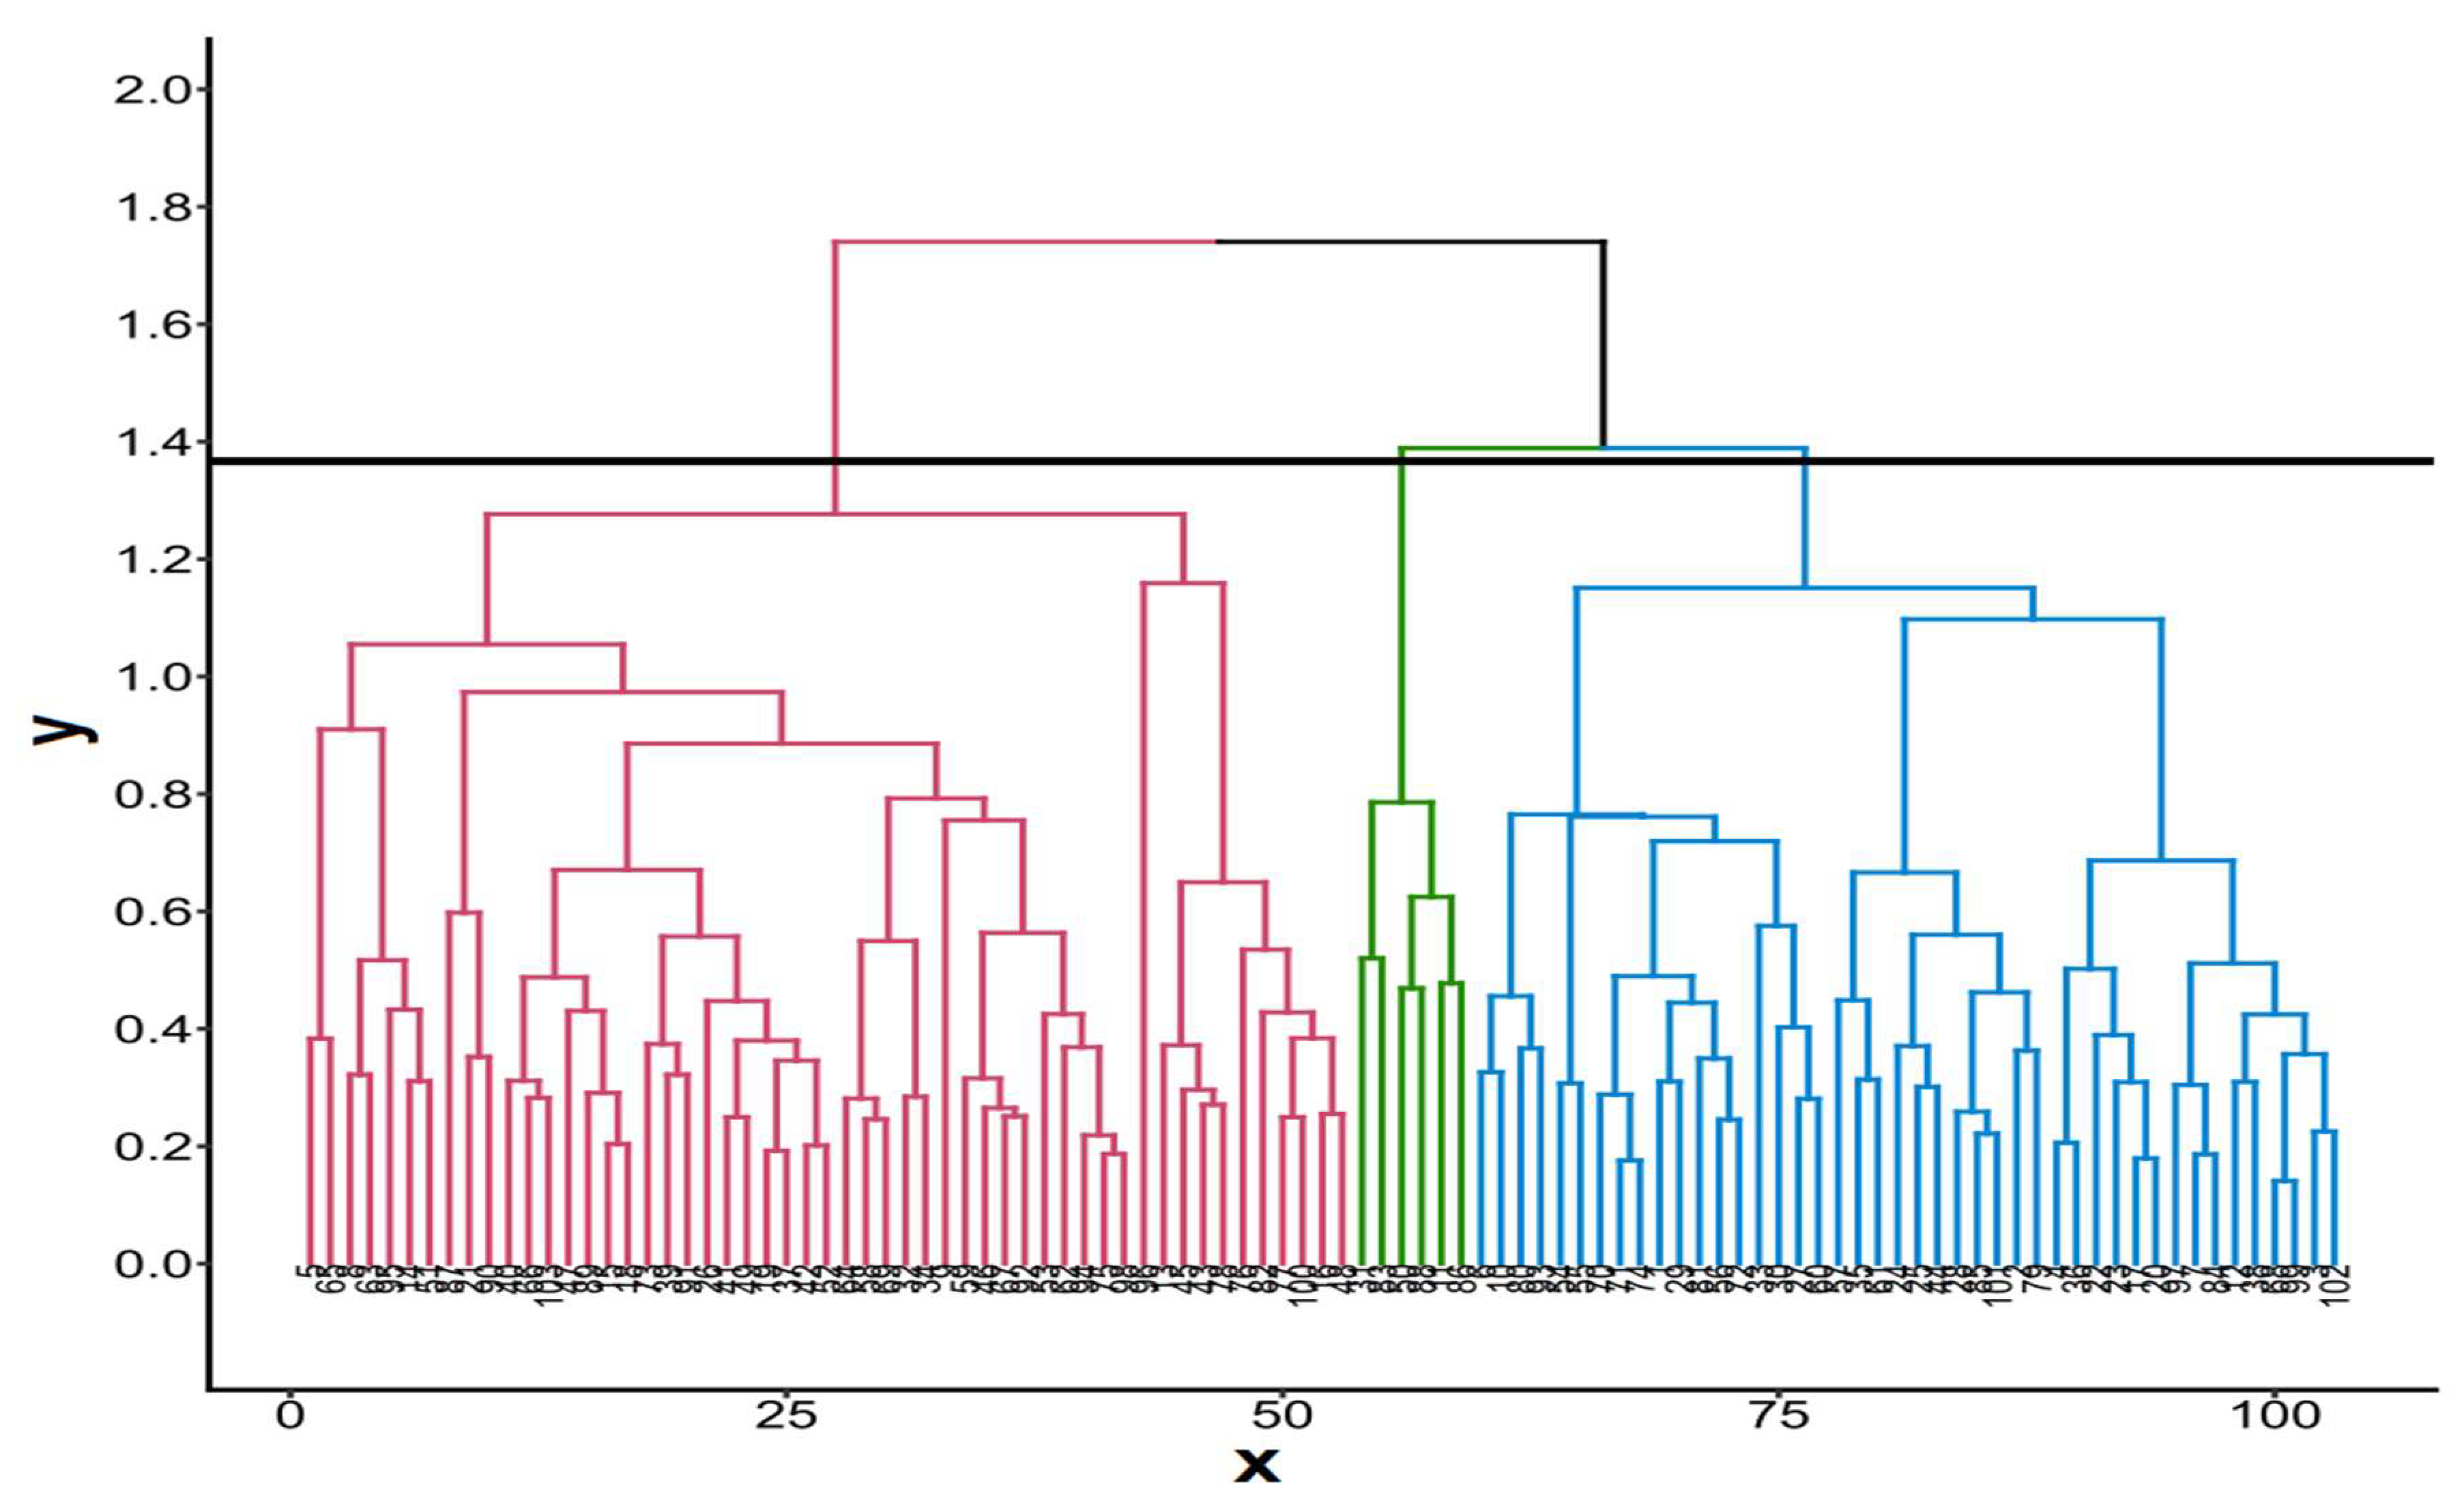

Table 1.
Qualitative data and techniques used for scoring.
| Trait | Code | Scoring | Sampling time (MAP) |
|---|---|---|---|
| Color of apical leaves | CAL | (3) Light green; (5) Dark green; (7) Purplish green; (9) Purple |
3 |
| Leaf color | LC | 3 = light green; 5 = dark green; 7 = purple green; 9 = purple | 6 |
| Presence of fruit | PFRT | (0) Absent; (1) Presence | 6 |
| Presence of seeds | PSE | (0) Absent; (1) Presence | 9 |
| Lobe margins | LM | (3) Smooth; (7) Winding | 6 |
| Color of leaf vein | CLV | (3) Green; (5) Green-reddish; (7) Red | 6 |
| Petiole color | PEC | (1) Yellowish-green; (2) Green; (3) Reddish-green; (5) Greenish-red; (7) Red; (9) Purple | 6 |
| Shape of central leaflet | SCL | (1) Ovoid; (2) Elliptic-lanceolate; (3) Obovate-lanceolate; (4) Oblong-lanceolate; (5) Lanceolate; (6) Straight or linear; (7) Pandurate; (8) Linera-piramidal; (9) Linear-pandurate; (10) Linear-hostatilobalate | 6 |
| Orientation of petiole | OPE | (1) Inclined-upwards; (3) Horizontal; (5) inclined-downwards; (7) Irregular | 6 |
| Leaf retention | LRE | (1) Very poor retention; (2) Less than average retention; (3) Average; (4) Better than average retention | 6 |
| Stipule margin | STM | (1) Entire; (2) Split | 9 |
| Color of stem epidermis | CSTE | (1) Creme; (2) Light brown; (3) Dark brown; (4) Orange | 9 |
| Color of end branches | CEBR | (3) Green; (5) Green-purple; (7) purple | 9 |
| Color of stem cortex | CSC | (1) Orange; (2) Light green; (3) Green | 9 |
| Color of stem exterior | CSE | (3) Orange; (4) Greeny-yellowish (5) Golden; (6) Light brown; (7) Silver; (8) Gray; (9) Dark brown. | 9 |
| Prominence of foliar scar | PFS | (3) Semi-prominent; (5) Prominent | 9 |
| Branching habit | BRH | (1) Erect; (2) Dichotomous; (3) Trichotomous; (4) Tetrachomotous | 12 |
| Root constrictions | RCO | (1) Few to none; (2) Some; (3) Many | 12 |
| Color of root cortex | CRC | (1) White or cream; (2) Yellow; (3) Pink; (4) Purple | 12 |
| Color of root pulp | CRP | (1) White; (2) Cream; (3) Yellow; (4) Orange; (5) Pink | 12 |
| External color of storage root | ECSR | (1) White or cream; (2) Yellow; (3) Light brown; (4) Dark brown | 12 |
| Extent of root peduncle | ERP | (0) Sessile; (3) Pedunculate; (5) Mixed | 12 |
| Root taste | RT | (1) Sweet; (2) Intermediate; (3) Bitter | 12 |
| Root shape | RS | (1) Conical; (2) Conical-cylindrical; (3) Cylindrical; (4) Irregular | 12 |
| Plant shape | PLNS | (1) Compact; (2) Open; (3) Umbrella; (4) Cylindrical | 12 |
Source: Fukuda et al. [12].
Table 2.
Quantitative data and techniques used for scoring.
| Trait | Code | Techniques of measurement | Sampling time (MAP) |
|---|---|---|---|
| Width of leaf robe | WLL | Two leaves from the middle of the plant measured from the widest part of the middle lobe | 6 |
| Length of leaf lobe | LLL | Measured from the intersection of all lobes to the end of the middle lobe | 6 |
| Petiole length | PLEN | Measured on two leaves per plant | 6 |
| Number of leaf robes | NLL | Counted on five leaves per plant with consideration of the predominant number of lobes | 6 |
| Distance between foliar scar | DSL | Measuring the distance between two foliar scars | 6 |
| Length of stipule | LST | Measured using meter rule. | 9 |
| Height at first branching | HFB | Measured vertically from ground to first primary branch | 12 |
| Level of branching | LBR | Number of branching points or levels | 12 |
| Plant height | PHT | Measured vertically from the ground to the top of the canopy | 12 |
| Number of commercial roots | NCR | Recorded on root with length greater than 20 cm from three plants | 12 |
| Number of storage root | NSR | Number of roots with length greater than 20 cm from three plant | 12 |
| Harvest index | HI | Measured as ratio of fresh root yield to the total fresh biomass | 12 |
| Root yield per plant | RYPP | All the root showing length greater than 20 cm are weighted | 12 |
| Root dry matter content | RDMC | Weighed the dry roots | 12 |
Source: Fukuda et al. [12]; MAP=months after planting.
Table 3.
Correlation coefficient among 25 qualitative traits of 103 cassava genotypes.
| Trait | RT | CLV | LC | CAL | SCL | LM | PEC | RS | PFS | CRP | CSC | CSE | ECR | CRC |
| RT | 1 | |||||||||||||
| CLV | -0.08 | 1 | ||||||||||||
| LC | 0.03 | 0.22* | 1 | |||||||||||
| CAL | 0.11 | 0.03 | 0.39*** | 1 | ||||||||||
| SCL | 0.1 | -0.14 | -0.30** | -0.1 | 1 | |||||||||
| LM | 0.14 | -0.08 | -0.1 | 0.06 | -0.16 | 1 | ||||||||
| PEC | 0.08 | 0.62*** | 0.43*** | 0.04 | -0.42*** | 0.02 | 1 | |||||||
| RS | -0.13 | -0.09 | -0.02 | 0.02 | 0 | 0.06 | 0.01 | 1 | ||||||
| PFS | 0.13 | -0.14 | -0.11 | 0.09 | 0.03 | 0.29** | -0.18 | 0 | 1 | |||||
| CRP | 0.10 | 0.05 | -0.03 | -0.01 | 0.02 | 0.08 | -0.06 | 0.03 | -0.09 | 1 | ||||
| CSC | 0.01 | -0.07 | -0.03 | -0.03 | -0.05 | 0.12 | -0.05 | 0.10 | 0 | -0.09 | 1 | |||
| CSE | 0.11 | -0.12 | -0.1 | -0.06 | 0.13 | 0 | -0.15 | -0.15 | 0.07 | -0.03 | -0.02 | 1 | ||
| ECSR | 0.12 | -0.04 | -0.05 | -0.18 | 0.08 | -0.14 | 0.02 | 0.07 | -0.01 | 0.11 | -0.05 | -0.05 | 1 | |
| CRC | -0.17 | 0.01 | 0.05 | -0.14 | -0.06 | -0.06 | -0.01 | -0.24* | -0.24* | -0.05 | 0.12 | 0.08 | 0.07 | 1 |
| LR | 0.07 | 0.03 | 0.22* | 0.23* | -0.12 | 0.13 | 0.24* | -0.01 | -0.05 | 0.06 | -0.27** | -0.19 | -0.14 | -0.1 |
| PO | 0.10 | 0.11 | 0.1 | 0.15 | 0.04 | 0 | 0.04 | -0.03 | 0.10 | 0.13 | -0.05 | -0.14 | -0.06 | -0.2 |
| CSE | 0.04 | -0.13 | -0.01 | -0.02 | 0.23* | -0.11 | -0.25* | -0.01 | 0.12 | -0.21* | -0.08 | 0.18 | -0.03 | 0.15 |
| CEBR | 0.04 | 0.06 | -0.07 | -0.03 | -0.16 | 0.24* | 0.16 | 0.07 | -0.17 | 0.02 | 0.09 | -0.12 | -0.03 | -0.04 |
| STM | -0.01 | 0.03 | -0.08 | -0.10 | 0.06 | -0.03 | 0.04 | -0.05 | -0.12 | -0.05 | -0.12 | 0.06 | 0.04 | 0.09 |
| BRH | -0.03 | -0.08 | -0.20* | 0 | 0.07 | 0.10 | -0.14 | 0.10 | 0.04 | -0.11 | 0.03 | -0.02 | 0.01 | -0.1 |
| PLNS | -0.03 | 0 | 0.16 | 0.05 | 0.01 | -0.12 | 0.09 | -0.13 | -0.10 | -0.12 | -0.09 | 0.21* | -0.06 | 0.12 |
| ERP | -0.02 | 0 | -0.18 | -0.07 | 0.09 | -0.10 | -0.07 | 0 | 0.04 | 0.08 | -0.12 | -0.10 | 0.10 | -0.1 |
| RCO | -0.04 | 0.08 | 0.11 | -0.15 | -0.29** | 0.02 | 0.13 | 0.16 | -0.01 | 0.13 | 0.01 | -0.04 | 0.05 | 0.07 |
| PFRT | 0.02 | -0.11 | -0.04 | 0.16 | 0.01 | 0.06 | -0.03 | 0.25* | -0.03 | -0.03 | 0.03 | -0.18 | 0.03 | -0.1 |
| PSE | 0 | -0.05 | -0.07 | 0.14 | 0.05 | 0.03 | 0 | 0.14 | 0.01 | -0.08 | 0.01 | -0.24* | 0.04 | -0.1 |
Table 3.
Continues.
| Trait | LR | OPE | CSE | CEBR | STM | BRH | PS | EXT | RCO | PFRT | PSE |
| LR | 1 | ||||||||||
| PO | 0.19 | 1 | |||||||||
| CSE | -0.08 | -0.22* | 1 | ||||||||
| CEBR | -0.05 | -0.12 | -0.19 | 1 | |||||||
| STM | 0.24* | -0.07 | -0.04 | 0.11 | 1 | ||||||
| BRH | 0.06 | 0.18 | -0.05 | 0.07 | -0.06 | 1 | |||||
| PLNS | -0.03 | -0.23* | 0.05 | -0.04 | 0.16 | -0.53*** | 1 | ||||
| ERP | 0.06 | 0.06 | -0.08 | -0.18 | -0.09 | 0.06 | -0.18 | 1 | |||
| RCO | -0.05 | -0.05 | -0.08 | -0.11 | -0.19* | 0 | -0.11 | 0.09 | 1 | ||
| PFRT | 0.14 | 0.17 | 0 | 0.01 | -0.14 | 0.32** | 0.47*** | 0.08 | 0.07 | 1 | |
| PSE | 0.09 | 0.14 | 0.07 | -0.01 | -0.17 | 0.31** | 0.44*** | 0.13 | 0.04 | 0.86*** | 1 |
RT=root taste, CLV=color of leaf vein, LC=leaf color, CAL=color of apical leaf, SCL= shape of center leaflet, LM=lobe margin, PEC=petiole color, RS=root shape, PFS=prominent of foliar scar, CRP=color of root pulp, CSC=color of stem cortex, CSE=color of stem epidermis, ECSR= external color of storage root, CRC=color of root cortex, LR=leaf retention, PO= petiole orientation, CSE=color of stem exterior, CEBR=color of end branches, STM=stipule margin, BRH=branching habit, PLNS=plant shape, ERP=extent of root penduncle, RCO=root constrictions, PFRT=presence of fruits, PSE=presence of seeds.
Table 4.
Principal component analysis, eigen value and percentage variation of 25 characters of 103 cassava genotypes.
Table 4.
Principal component analysis, eigen value and percentage variation of 25 characters of 103 cassava genotypes.
| Trait | PC1 | PC2 | PC3 | PC4 | PC5 | PC6 | PC7 | PC8 | PC9 | PC10 |
| RT | 0.053 | -0.003 | 0.384 | 0.184 | -0.230 | -0.115 | 0.574 | 0.402 | -0.007 | 0.052 |
| CLV | -0.150 | 0.581 | -0.149 | -0.185 | -0.111 | 0.002 | 0.246 | -0.293 | -0.083 | 0.356 |
| LC | -0.181 | 0.628 | 0.230 | -0.141 | 0.339 | -0.228 | 0.077 | 0.105 | -0.085 | -0.129 |
| CAL | 0.144 | 0.327 | 0.573 | 0.048 | 0.301 | -0.081 | -0.032 | 0.025 | -0.212 | -0.243 |
| SCL | 0.057 | -0.594 | 0.206 | -0.266 | -0.134 | 0.199 | 0.137 | -0.025 | -0.314 | -0.003 |
| LM | 0.188 | 0.081 | 0.135 | 0.704 | -0.114 | -0.021 | -0.061 | 0.108 | 0.340 | 0.010 |
| PEC | -0.143 | 0.805 | -0.124 | -0.032 | -0.004 | 0.02 | 0.197 | 0.049 | 0.012 | 0.347 |
| RT | 0.327 | 0.036 | -0.222 | 0.113 | 0.079 | -0.082 | -0.482 | 0.349 | -0.385 | 0.117 |
| PFS | 0.168 | -0.237 | 0.401 | 0.295 | -0.084 | -0.418 | -0.080 | -0.042 | 0.158 | 0.369 |
| CRP | 0.056 | 0.095 | -0.046 | -0.031 | -0.568 | -0.159 | 0.032 | 0.216 | -0.039 | -0.536 |
| COX | 0.055 | -0.089 | -0.313 | 0.440 | 0.248 | -0.144 | 0.216 | -0.211 | -0.236 | -0.216 |
| CSE | -0.331 | -0.374 | 0.167 | 0.096 | 0.055 | -0.112 | 0.210 | 0.019 | 0.222 | 0.047 |
| ECSR | 0.037 | -0.115 | -0.292 | -0.248 | -0.262 | -0.054 | 0.323 | 0.488 | -0.110 | 0.123 |
| CRC | -0.315 | -0.057 | -0.338 | -0.152 | 0.316 | 0.135 | 0.230 | -0.040 | 0.441 | -0.372 |
| LR | 0.142 | 0.429 | 0.424 | -0.152 | -0.090 | 0.336 | -0.250 | 0.168 | 0.350 | -0.104 |
| PO | 0.354 | 0.228 | 0.336 | -0.124 | -0.296 | -0.050 | 0.146 | -0.371 | -0.093 | -0.177 |
| CSE | -0.089 | -0.419 | 0.182 | -0.207 | 0.487 | -0.053 | 0.083 | 0.206 | 0.130 | 0.212 |
| CEBR | 0.008 | 0.204 | -0.264 | 0.550 | -0.070 | 0.438 | 0.090 | 0.118 | -0.169 | 0.033 |
| STM | -0.273 | 0.010 | 0.073 | -0.032 | -0.165 | 0.651 | -0.122 | 0.177 | 0.157 | 0.097 |
| BRH | 0.594 | -0.130 | -0.070 | 0.099 | -0.016 | 0.218 | 0.098 | -0.257 | 0.193 | 0.112 |
| PLNS | -0.749 | 0.018 | 0.171 | -0.025 | 0.120 | 0.002 | -0.169 | 0.145 | -0.161 | -0.012 |
| ERP | 0.248 | -0.099 | -0.066 | -0.394 | -0.374 | -0.158 | -0.181 | -0.105 | 0.124 | 0.118 |
| RCO | 0.099 | 0.212 | -0.409 | -0.071 | -0.025 | -0.540 | -0.148 | 0.190 | 0.341 | -0.034 |
| PFRT | 0.804 | 0.073 | -0.048 | -0.128 | 0.305 | 0.128 | 0.094 | 0.187 | 0.034 | -0.079 |
| PSE | 0.788 | 0.047 | -0.039 | -0.182 | 0.307 | 0.119 | 0.128 | 0.126 | 0.003 | 0.040 |
| Eigenvalue | 2.97 | 2.61 | 1.77 | 1.65 | 1.58 | 1.50 | 1.18 | 1.17 | 1.16 | 1.10 |
| Proportion of variance (%) | 11.88 | 10.44 | 7.1 | 6.6 | 6.31 | 6.00 | 4.71 | 4.67 | 4.63 | 4.4 |
| Cumulative variance (%) | 11.88 | 22.33 | 29.43 | 36.03 | 42.34 | 48.34 | 53.05 | 57.72 | 62.34 | 66.74 |
RT=root taste, CLV=color of leaf vein, LC=leaf color, CAL=color of apical leaf, SCL= shape of center leaflet, LM=lobe margin, PEC=petiole color, RT=root taste, PFS=prominent of foliar scar, CRP=color of root pulp, COX= cortex, CSE=color of stem epidermis, ECSR= external color of storage root, CRC=color of root cortex, LR=leaf retention, PO=petiole orientation, CSE=color of stem exterior, CEBR=color of end branches, STM=stipule margin, BRH=branching habit, PLNS=plant shape, ERP=extent of root penduncle, RCO=root constrictions, PFRT=presence of fruits, PSE=presence of seeds.
Table 5.
Descriptive statistics of 14 quantitative characters of 103 cassava genotypes.
| Traits | Minimum | Maximum | Mean | Standard deviation | Coefficient of variance (%) |
| Distance between leaf scar (cm) | 1.0 | 5.0 | 3.0 | 0.5 | 18.7 |
| Height at first branching (cm) | 0.0 | 165.9 | 78.8 | 45.4 | 57.6 |
| Harvest index | 0.2 | 0.6 | 0.4 | 0.1 | 23.9 |
| Level of branching | 0.0 | 20.0 | 2.8 | 2.3 | 81.2 |
| Length of leaf lobe (cm) | 5.7 | 21.8 | 14.2 | 2.8 | 20.1 |
| Length of stipule (cm) | 1.0 | 5.0 | 3.3 | 1.1 | 34.8 |
| Number of commercial roots | 1.0 | 24.0 | 8.8 | 5.1 | 57.9 |
| Number of leaf lobe | 3.0 | 9.0 | 6.3 | 1.1 | 17.8 |
| Number of storage root | 2.0 | 53.0 | 15.9 | 9.7 | 61.1 |
| Plant height (cm) | 41.0 | 346.0 | 178.1 | 43.1 | 24.2 |
| Petiole length (cm) | 4.7 | 37.3 | 20.9 | 6.1 | 29.2 |
| Roots dry matter content (%) | 15.0 | 36.0 | 27.8 | 4.1 | 14.8 |
| Root yield per plant (kg) | 1.0 | 19.0 | 6.4 | 4.2 | 65.0 |
| Width of leaf lobe (cm) | 1.5 | 6.0 | 3.3 | 0.8 | 24.9 |
Table 6.
Correlation coefficient among 14 quantitative traits of 103 cassava genotypes.
| HI | RYPP | PLEN | LLL | WLL | RDMC | NSR | PHT | HFB | NLL | DLS | LST | LBR | NCR | |
| HI | 1 | |||||||||||||
| RYPP | 0.40*** | 1 | ||||||||||||
| PLEN | -0.06 | -0.12 | 1 | |||||||||||
| LLL | 0.02 | 0.02 | 0.22* | 1 | ||||||||||
| WLL | -0.05 | 0.08 | 0.05 | 0.66*** | 1 | |||||||||
| RDMC | 0.01 | 0.07 | 0.11 | 0.05 | 0.05 | 1 | ||||||||
| NSR | 0.24* | 0.76*** | -0.03 | 0.09 | 0.12 | -0.08 | 1 | |||||||
| PHT | 0.03 | 0.09 | 0.09 | 0.17 | 0.20* | 0.08 | 0.08 | 1 | ||||||
| HFB | 0.08 | 0.04 | 0.04 | 0.11 | 0.04 | 0.08 | -0.02 | 0.11 | 1 | |||||
| NLL | 0.06 | 0 | 0.26** | 0.41*** | 0.14 | 0.02 | 0.08 | 0.24* | -0.12 | 1 | ||||
| DLS | -0.20* | -0.01 | 0.19 | 0.03 | -0.04 | 0.07 | 0.02 | 0.06 | 0.16 | -0.05 | 1 | |||
| LST | 0.16 | 0.08 | 0 | 0.13 | 0.06 | 0.02 | 0.11 | 0.09 | 0 | 0.01 | -0.07 | 1 | ||
| LBR | 0.08 | 0.08 | 0.02 | -0.21* | -0.21* | -0.05 | 0.06 | 0.04 | 0.25* | 0.09 | 0.02 | -0.05 | 1 | |
| NCR | 0.17 | 0.68*** | -0.09 | 0.02 | 0.08 | -0.05 | 0.84*** | 0.04 | 0.01 | 0.05 | 0.01 | 0.06 | 0.04 | 1 |
Significant at alpha = 0.05, HI=harvest index, RYPP=root yield per plant, PLEN=petiole length, LLL=length of leaflet, WLL=width of leaflet, RDMC=root dry matter content, NSR=number of storage root, PHT=plant height, HFB=height at first branching, NLL=number of leaflet, DLS=distance between leaf scar, LST=length of stipule, LBR=level of branching, NCR=number of commercial root.
Table 7.
Principal component analysis, eigen value and percentage variation of 14quantitative characters of cassava genotypes.
Table 7.
Principal component analysis, eigen value and percentage variation of 14quantitative characters of cassava genotypes.
| Variable | Prin1 | Prin2 | Prin3 | Prin4 | Prin5 | Prin6 |
| Harvest index | 0.43 | -0.13 | 0.07 | 0.24 | 0.54 | 0.27 |
| Root yield per plant | 0.86 | -0.20 | 0.06 | -0.01 | -0.05 | 0.08 |
| Petiole length | -0.08 | 0.43 | 0.44 | -0.11 | 0.05 | -0.13 |
| Length of leaflet | 0.23 | 0.83 | 0.01 | -0.06 | 0.01 | 0.07 |
| Width of leaflet | 0.23 | 0.70 | -0.48 | 0.13 | -0.30 | -0.01 |
| Root dry matter content | -0.01 | 0.17 | 0.21 | 0.12 | -0.09 | 0.54 |
| Number of storage root | 0.90 | -0.13 | 0.07 | -0.18 | -0.11 | -0.09 |
| Plant height | 0.19 | 0.40 | 0.15 | 0.30 | 0.04 | -0.09 |
| Height at first branching | 0.05 | 0.05 | 0.35 | 0.66 | -0.32 | 0.16 |
| Number of leaflet | 0.16 | 0.53 | 0.23 | -0.09 | 0.44 | -0.42 |
| Distance between leaf scar | -0.06 | 0.08 | 0.55 | -0.15 | -0.56 | 0.05 |
| Length of stipule | 0.20 | 0.12 | -0.11 | 0.15 | 0.32 | 0.44 |
| Level of branching | 0.06 | -0.26 | 0.30 | 0.61 | 0.06 | -0.49 |
| Number of commercial root | 0.85 | -0.19 | 0.05 | -0.18 | -0.18 | -0.09 |
| Eigenvalue | 2.75 | 2.09 | 1.73 | 1.24 | 1.22 | 1.11 |
| Proportion of variance (%) | 18.34 | 13.94 | 11.53 | 8.30 | 8.18 | 7.40 |
| Cumulative variance (%) | 18.34 | 32.29 | 43.83 | 52.13 | 60.31 | 67.72 |
Table 8.
Culinary traits evaluation of 15 selected cassava accessions in 2020 cropping season.
|
Genotypes |
Cooking time | Cooking percent | Surface appearance | Mealiness | Taste | Aroma | Texture |
| Mean ± SE | Mean ± SE | Mean ± SE | Mean ± SE | Mean± SE | Mean± SE | Mean± SE | |
| Cook soon | 15.2±1.2 | 96.4±2.4 | 4.5±0.50 | 4.75±0.80 | 4.8±0.50 | 4.8±0.50 | 4.5±0.58 |
| Butter cassava | 15.4±1.2 | 95.0±1.8 | 4.5±0.58 | 4.50±0.50 | 4.9±0.43 | 4.8±0.50 | 4.5±0.50 |
| Ndiamonya-malo | 21.0±1.4 | 83.3±1.6 | 4.3±0.50 | 4.25±0.48 | 4.5±0.50 | 4.3±0.50 | 4.3±0.50 |
| Cocoa cassada | 20.0±1.7 | 88.2±2.1 | 4.5±0.50 | 4.25±0.80 | 4.5±0.58 | 4.5±0.58 | 4.3±0.58 |
| Tangagboi | 28.7±1.8 | 76.2±2.3 | 4.3±0.58 | 4.0±0.40 | 4.5±0.50 | 4.3±0.58 | 4.3±0.58 |
| Mende Tangai | 28.6±1.5 | 78.4±2.0 | 4.0±0.65 | 4.0±0.65 | 4.0±0.65 | 4.0±0.65 | 4.0±0.65 |
| Nikaneh | 27.0±1.5 | 80.2±2.5 | 4.3±0.58 | 4.3±0.58 | 4.3±0.58 | 4.3±0.50 | 4.0±0.50 |
| Yaa Kanu | 27.0±1.7 | 80.2±3.0 | 4.0±0.50 | 4.0±0.60 | 4.3±0.50 | 4.3±0.82 | 3.5±0.58 |
| Kendemeh | 28.6±1.6 | 73.4±1.9 | 3.5±0.58 | 4.0±0.63 | 4.3±0.50 | 4.0±0.58 | 3.5±0.50 |
| Tapiyoka | 25.7±1.4 | 82.0±3.2 | 4.3±0.55 | 4.3±0.50 | 4.5±0.80 | 4.3±0.50 | 4.0±0.60 |
| Soja color | 29.8±1.5 | 70.3±2.8 | 3.0±0.50 | 3.0±0.58 | 2.0±0.50 | 3.0±0.65 | 2.0±0.82 |
| Pink lady | 30.0±1.5 | 63.2±2.6 | 3.5±0.82 | 3.0±0.80 | 3.5±0.65 | 3.0±0.50 | 3.0±0.58 |
| SLICASS 7 | 29.8±1.8 | 58.3±1.7 | 4.0±0.50 | 3.5±0.40 | 3.0±0.45 | 4.0±0.60 | 3.0±0.50 |
| SLICASS 6 | 30.0±1.7 | 30.2±3.1 | 3.5±0.58 | 3.0±0.55 | 2.0±0.50 | 3.0±0.50 | 3.0±0.50 |
| SLICASS 4 | 30.0±1.3 | 27.9±1.8 | 2.0±0.40 | 2.0±0.82 | 2.0±0.50 | 2.0±0.82 | 2.0±0.82 |
Table 9.
List of 15 varieties selected by farmers for marketability and consumption.
| Varieties/Genotypes | Rating |
| Tangaigboi | Highly preferred |
| Coco cassada | Highly preferred |
| Cooksoon | Highly preferred |
| Butter cassava | Highly preferred |
| Ndiamonyamalo | Highly preferred |
| Tapiyoka | Moderately preferred |
| Yaa kanu | Moderately preferred |
| Nikaneh | Moderately preferred |
| Mende tangai | Moderately preferred |
| Kendemeh | Moderately preferred |
| SLICASS 4 | Not good |
| SLICASS 6 | Not good |
| SLICASS 7 | Not good |
| Pink lady | Not good |
| Soja colour | Not good |
Disclaimer/Publisher’s Note: The statements, opinions and data contained in all publications are solely those of the individual author(s) and contributor(s) and not of MDPI and/or the editor(s). MDPI and/or the editor(s) disclaim responsibility for any injury to people or property resulting from any ideas, methods, instructions or products referred to in the content. |
© 2024 by the authors. Licensee MDPI, Basel, Switzerland. This article is an open access article distributed under the terms and conditions of the Creative Commons Attribution (CC BY) license (http://creativecommons.org/licenses/by/4.0/).
Copyright: This open access article is published under a Creative Commons CC BY 4.0 license, which permit the free download, distribution, and reuse, provided that the author and preprint are cited in any reuse.


