Submitted:
30 April 2024
Posted:
01 May 2024
You are already at the latest version
Abstract
In the rapidly evolving field of real estate economics, the prediction of house prices continues to be a complex challenge, intricately tied to a multitude of socio-economic factors. However, traditional predictive models have often overlooked the spatial interdependencies that play a vital role in shaping housing prices. This study applies Graph Neural Networks (GNNs) on Open Statistics Knowledge Graphs to model spatial dependencies and predict house prices across Scotland’s 2011 data zones. To this end, integrated statistical indicators are retrieved from the official Scottish Open Government Data portal. The three representative GNN algorithms employed - ChebNet, GCN, and GraphSAGE - demonstrate higher prediction accuracy than traditional models, including the tabular-based XGBoost and a simple Multi-Layer Perceptron (MLP). In addition, local and global explainability are employed to increase transparency and trust in the predictions made by the most accurate GNN - GraphSAGE. The global feature importance is determined by a logistic regression surrogate model while the local, region-level understanding of the GNN predictions is achieved through the use of GNNExplainer. Explainaibility results are compared with those from a previous work that applied the XGBoost machine learning algorithm and the SHapley Additive exPlanations (SHAP) explainability framework on the same dataset. Interestingly, both global surrogate model and the SHAP approach underscored the Comparative Illness Factor, a health indicator, and the ratio of detached dwellings as the most crucial features in the global explainability. In the case of local explanations, while both methods showed similar results, the GNN approach provided a richer, more comprehensive understanding of the predictions for two specific data zones.
Keywords:
Linked Statistical Data
; Knowledge Graphs
; Graph Neural Networks
; Explainable Artificial Intelligence
; House Price Prediction
; Explainable Graph Neural Networks
1. Introduction
Buying a house is probably one of the major decisions and financial commitments in the life of people. This decision is usually affected by prices that fluctuate due to many factors such as changes in interest rates, economic growth, government policy, and supply and demand dynamics [1]. Changes in property prices not only reflect broader economic trends but also impact the socio-economic fabric of societies, with far-reaching consequences for home-ownership and wealth distribution [2,3]. Between 2010 and 2021, the European Union experienced a surge in house prices by 37%, rents by 16%, and inflation by 17%[4]. Concurrently, the cost of construction for new residences soared by 25%, particularly since 2016. The phenomenon has been exacerbated by recent global crisis events such as the Covid-19 pandemic and war conflict in Ukraine, resulting in unprecedented inflation levels[5] that have dramatically altered the landscape of housing prices and rents[6,7]. In such a complex environment, a realistic estimation of house prices becomes not just a theoretical exercise, but an essential tool for governments, policymakers, and the private sector to form strategies and policies that reflect the ever-changing dynamics of the housing market.
In the era of accelerating digitization and advanced big data analytics, due to the growing availability of data, machine learning models have become efficient approaches for predicting house prices [8]. However, traditionally, these approaches rely heavily on socioeconomic indicators to estimate house prices, which might not always yield accurate results. On the contrary, making predictions based on features with spatial context like the presence of schools nearby, the availability of parking facilities or gas stations in the same or nearby neighborhood, and the proximity to public transport can significantly improve the prediction accuracy [9,10], since they reflect the realistic representation of geographical regions and the connectivity between them. This results from the fact that neighboring regions may influence the house prices of each other due to their proximity and shared features. For example, the presence of schools or hospitals in a region that has high house prices might similarly affect house prices of the nearby regions. Recently, advancements in deep learning have demonstrated the superiority of approaches based on neural networks over both traditional statistical methods and conventional machine learning approaches, especially when working with geospatial data [11]. In the past few years, algorithms from graph machine learning have emerged as efficient candidates for predicting node or edge features from graph-structured data [12]. Specifically, Graph Neural Networks (GNNs) constitute a family of algorithms uniquely tailored for scenarios where spatial representation of data must be explicitly modeled. Explainable Artificial Intelligence can be applied on top of the GNN in order to understand the decisions made by the model improving its explainability and interpretability.
At the same time, linked data technologies have been used to facilitate the integration of open statistical data on the Web. Linked statistical data are highly structured data describing statistical indicators based on a set of dimensions, including a geographical dimension and temporal dimension, and attributes [13]. As a result, linked statistical data formulate Open Statistics Knowledge Graphs (KGs). The structure of Open Statistics KGs that already captures spatial relationships between geographical dimensions, make them suitable for creating GNNs. Currently, Open Statistics KGs can be accessed as linked data by many official government data portals (e.g., the official portal for European data 1 allowing their integration and creation of valuable applications for governments, policy makers, enterprises, and citizens. For example, linked statistical data have been previously used to help house owners, buyers, and investors understand which factors affect and determine the prices of houses in the Scottish data zones [14].
This paper aims to create a model that accurately predicts house prices by creating a GNN using Open Statistics KGs. Towards this end, a case study is presented that leverages (i) three GNN variants, namely Chebyshev Neural Network (ChebNet), Graph Convolutional Network (GCN), and GraphSAGE, and (ii) a KG modeled as linked statistical data from the Scottish data portal, to predict the probability the average house prices across Scotland’s “2011 data zones” to be above the Scotland’s total average. In order to understand the decisions of the best performed model, both global and local explainability are employed using a global surrogate model and the GNNExplainer framework respectively.
The paper is organized as follows. Section 2 delineates the theoretical background essential to this work, specifically focusing on the theory of house price prediction, linked open government data, GNNs and their explainability. In Section 3, the research approach utilized in the study is described, laying the foundation for the use case that follows. Section 4 is dedicated to the use case, elucidating the steps taken, including data collection, data pre-processing, and a detailed presentation of the predictive model creation and its explainability. The subsequent discussion in Section 5 compares the methods used and the results produced by this study with the methods and results of previous studies. Finally, Section 6 concludes this work.
2. Background
2.1. House Prices Prediction
The accurate estimation of the house prices in the market of real estates is of great importance for a large number of individual parties ranging from homeowners to policy-makers. Apart from the obvious supply and demand conditions, the house prices may be influenced by other factors that encompass, for example, the physical attributes of the dwellings (e.g., dwelling size, room count) [15,16], the marketing strategies employed during sale [17], environmental elements (like air quality and neighborhood safety) [18], and socioeconomic indicators including the presence of urban amenities in the area like parks and parking facilities [15,19,20] and statistical indicators like employment rate and population growth [21].
In the past, the task of estimating house prices was typically carried out by experienced appraisers. Nevertheless, the appraisers’ assessments could be influenced by external factors and individuals, leading to potential biases. Consequently, there has been a growing demand for using automated methods to address this issue. These methods range from conventional statistical approaches (e.g., hedonic regression, geographically weighted regression) and time series forecasting methods (e.g., autoregressive integrated moving average - ARIMA models) [22,23,24,25] to sophisticated Artificial Intelligence (AI) solutions including machine learning (e.g., [14,15,19,21,26,27,28,29]) and deep learning approaches (e.g. [30,31,32,33]). From the previous methods, the majority uses hedonic models and linear regression.
However, conventional statistical methods face limitations in effectively analyzing vast amounts of data, resulting in the underutilization of available information [34]. Additionally, hedonic-based regression for house price estimation has received considerable criticism for various reasons including potential issues with fundamental assumptions and estimation (e.g., challenges in identifying supply and demand, market imbalances) [35]. Another issue with this method is that it relies on the assumption of a linear relationship between influencing factors and prices [10] as opposed to machine learning methods that are able to explore to multilevel interactions and nonlinear correlations [21].
Recently, advancements in deep learning have demonstrated the superiority of approaches based on neural networks over both traditional statistical methods and conventional machine learning approaches, especially when working with geospatial data [11]. For example, in house price prediction, neural networks can effectively capture and leverage the spatial relationships between dwellings, leading to more accurate results and promising outcomes.
2.2. Open Government Data
Open Government Data (OGD) refers to data published by the public sector in open formats and that are freely available to be accessed and re-used by the society. During the past years, OGD have been present in the political agenda of numerous countries worldwide that aspire to improve policy-making.
The rapidly increasing velocity and diversity of public sector data have motivated the establishment of several government data portals. These portals have as a primary objective to provide unrestricted access to public sector data as Open Government Data (OGD) increasing their economic and social potential. Examples include the European Data Portal 2 and the data.gov in the U.S. that are currently hosting more than 1,500,000 and 250,000 datasets respectively.
Recently, the European Commission has recognised dynamic OGD, including data generated by sensors, as high valuable data [36]. The basic feature of these data is their real time nature, being very frequently updated. To promote the integration of such data into the development of value-added services and applications using OGD, proper access methods must be offered by OGD portals. Traditionally, OGD could be accessed from government data portals as downloadable files (e.g., CSV and JSON files). They could also be explored directly using the portals’ graphical interfaces. However, the growing demand for real-time data analysis, forced OGD portals are now also investing in the development of application programming interfaces (APIs). These APIs enable programmatic access to real-time data, facilitating easy and efficient analysis in real-time (e.g., in [37,38,39]).
Nevertheless, the most prevalent type of OGD are still statistical data that are traditionally regularly but not very frequently (e.g., annually) created, published, and updated by governments and national statistical agencies. Statistical OGD are usually aggregated data monitoring various socioeconomic indicators across countries including demographical, social, and business-related metrics. Given their multidimensional nature, where measures are described based on multiple dimensions, statistical data are commonly represented using the data cube model, initially introduced for the needs of the Online Analytical Processing (OLAP) and data warehouse systems. A data cube comprises two main components[40,41,42,43]: measures that represent numerical values, and dimensions that provide contextual information for the measures. For example, consider a dataset on the population at risk of poverty in European countries in 2021 - 2022. The data cube incorporates “risk of poverty” as a measure, described by a geospatial dimension, “European country”, and a temporal dimension, “year”. Each dimension consists of a set of distinct values; the “European country” dimension has values “GR”, “FR”, etc., while the “year” dimension values 2022 and 2023. Optionally, there could be an additional dimension like "age group" with values “00–19”, “20–24”, “25-39”, and “50+”. The values of the dimension values can be organized in hierarchies that representing different levels of granularity. For example, the geospatial dimension might have both countries and regions as hierarchical levels, while the temporal dimension might have both years and quarters. The data cube’s cells are then specified by the combination of dimension values, with each cell holding the value of the corresponding measure (e.g., the percentage of population at risk of poverty in “GR” in “2022” is “29.1%”).
2.2.1. Linked Open Government Data
Open Government Data (OGD) have a huge potential when exploited using artificial intelligence methods including machine learning and deep learning to bring new and fruitful insights [44]. Linked Data technologies facilitate retrieving integrated OGD by defining and executing SPARQL queries. Linked data has already been adopted by numerous OGD portals (e.g., https://statistics.gov.scot/ managed by the Scottish government and the European data portal). Linked data has not only facilitated seamless integration of data within and across different data portals but has also ensured the provision of high-quality data. This aspect is particularly crucial for specific types of OGD, such as statistical data, where data is described at varying levels of granularity [14]. In addition, linked data has the potential to realize the vision of performing data analytics on top of integrated but previously isolated statistical data coming from various sources across the Web [45,46].
Connecting linked OGD from the data portals would create a Knowledge Graph of qualitative and fine-grained data that would facilitate data discovery and collection. In the pursuit of this objective, the existing literature has already recognized [47] and tackled [48] interoperability challenges associated with connecting data from multiple reliable and trustworthy sources. The majority of official OGD portals provide access to data using linked data through their SPARQL endpoints. In this case, OGD can be easily collected by specifying and submitting relevant SPARQL queries.
Linked data are based on the principles and philosophy of the Semantic Web. They primarily involve the publication of structured data using the Resource Description Framework (RDF), which is a W3C standard. Instead of focusing on the ontological level or inferencing, linked data use HTTP Uniform Resource Identifier (URIs) for naming entities and concepts. This approach allows accessing further information from looking up entities and concepts.
The naming convention in linked data follows the prefix:localname notation, where the prefix signifies a namespace URI. For instance, consider the name foaf:Person, representing the Person class of the FOAF3 vocabulary with the URI <http://xmlns.com/foaf/0.1/Person>.
The QB vocabulary [49] is a W3C standard that adopts the principles of linked data to publish statistical data on the Web. By utilizing the QB vocabulary, statistical data can be effectively structured and made available as linked data, facilitating better integration and accessibility on the Web. At the core of this vocabulary is the qb:DataSet. The latest serves as a representation of a data cube that comprises a collection of observations (qb:Observation), and each observation corresponds to a cell within the data cube. The data cube itself consists of three essential components:
- Dimensions (qb:DimensionProperty) that define the aspects to which the observations are applicable. Examples of dimensions include gender, reference area, time, and age.
- Measures (qb:MeasureProperty) that represent the specific phenomena or variables that are being observed and recorded within the data cube.
- Attributes (qb:AttributeProperty) that are used to convey structural metadata, such as the unit of measurement, associated with the data.
Since the dimensions with similar context usually re-use the same values, code lists have been created and commonly used to populate the dimension values. An code list includes the URIs for all the potential values that can be used to populate the dimension. The values included in the code lists are usually specified using the QB vocabulary of the Simple Knowledge Organization System (SKOS) vocabulary [50], which is also a W3C standard.
Code lists can be hierarchical such as the ones that can be used to populate geogstatial dimensions. Such code lists include, for example, the URIs for all geographical or administrative divisions of a country. The hierarchical relations are usually expressed using the SKOS vocabulary (e.g., using the skos:narrower property), the QB vocabulary (e.g., using the qb:parentChildProperty) or the XKOS4 vocabulary (e.g., using the xkos:isPartOf property).
Essential concepts such as dimensions, measures, attributes, and code lists also lend themselves to reuse (i.e., employ the same URI) to enhance their discoverability. To this end, the UK Government Linked Data Working Group has delineated a set of shared concepts, drawing inspiration from the SDMX guidelines5. Despite not being an integral component of the QB vocabulary, these concepts enjoy widespread adoption. Noteworthy examples of dimension concepts encompass sdmx:timePeriod, sdmx:refArea, and sdmx:sex, while measure concepts include sdmx:obsValue.
2.2.2. The Scottish Data Portal
The data used in this work are linked Open Government Data (OGD) from the Scottish OGD portal. The portal disseminates official statistics using linked data technologies. The portal currently hosts 297 linked datasets covering various societal and business aspects of Scotland classified into 18 themes. Datasets are provided at different levels of spatial granularity in Scotland starting from the level of postcodes to the level of council areas. Users can navigate through the data portal to view and retrieve data as tables, maps, and charts or download them in various formats (e.g., html, json, csv), or, alternatively, retrieve them as linked data by submitting flexible queries to the SPARQL endpoint6 released by the portal.
In the Scottish data portal, datasets are made available at various spatial granularities, with a distinct hierarchy comprising sixteen (16) geographic levels. These levels span from the finest-grain postcodes to broader council areas. For instance, data zones serve as the primary geographic units for dispensing small-area statistics within Scotland. These zones were introduced subsequent to the 2001 census and underwent revisions in 2011, following the 2011 census. Comprising a total of 6,976 units across the entirety of Scotland, the 2011 data zones exhibit a well-balanced distribution of resident populations, typically ranging from 500 to 1,000 individuals. This population distribution ensures that each data zone contains no fewer than 375 people and no more than 1,125 individuals.
The Scottish data portal offers users the ability to access and retrieve data in various formats, such as tables, maps, and charts, or to download them in formats like HTML, JSON, and CSV. Alternatively, users can use advanced queries via the SPARQL endpoint to retrieve linked data. The portal employs linked data technologies to create a unified knowledge graph, organizing datasets as data cubes and connecting them using the QB vocabulary. This allows for seamless searching across datasets and easy data combination.
Each dataset in the portal contains multiple measures, like the “Employment deprivation” dataset, which includes counts and rates of employment deprivation. Measures are identified by unique URIs that are sub-properties of the property sdmx-measure:obsValue. The measure used in each observation is indicated through qb:MeasureType. Dimensions, such as time, geography, age, and gender, are common in these data cubes. Time and geography dimensions often reuse terms from the SDMX vocabulary, while age and gender dimensions have their own properties.
Dimensions are populated with values from code lists. For instance, the spatial dimension (“reference period”) might have values like calendar years, two-year intervals, or three-year intervals. These values are defined using properties like “timePeriod” for reference periods and are sometimes organized hierarchically through generalization/specialization relations in geographical hierarchies.
2.3. Graph Neural Networks
Graphs are defined as complex mathematical structures that model the relationships between various objects. They consist of vertices that represent entities and edges that represent the connections between these entities. As a result, graphs can effectively depict complex networks and systems including social networks [51], mobility traffic networks [39,52], telecommunication networks [53], biological [54] or chemical networks [55] and so on. Deep learning has emerged as a powerful tool in artificial intelligence over the past decade, offering state-of-the-art performance in a range of fields including speech recognition [56], computer vision [57] and natural language processing [58]. However, its application to graph data presents unique challenges [59], due to the irregular structure of graphs, their heterogeneity and diversity, and their immense size in the era of big data. In addition, the interdisciplinary nature of graphs adds another layer of complexity, as it requires the integration of domain knowledge, which may not be straightforwardly incorporated into model designs [60]. To this end, these obstacles make it difficult to apply traditional deep learning architectures, such as convolution and pooling, on graph data, necessitating innovative modeling approaches. Deep learning on graphs [60] or geometric deep learning [61] is a recently emerged field that consists of a broad range of architectures, also called Graph Neural Networks (GNNs). Graph neural networks have found widespread application across a variety of domains, from physics [62], chemistry [63] to computer vision [64] and natural language processing [65]. GNNs span a wide array from supervised to unsupervised techniques, each possessing distinct models and architectures determined by their specific training processes and inherent convolution mechanisms, including Graph Convolutional Networks [66], Graph Recurrent Neural Networks [67], Graph Auto-encoders [68] and Graph Reinforcement Learning [69].
GNNs are applied on different graph structures depending on the data and use case requirements [70]. A graph is directed (or undirected) when the direction of the connections between entities are explicitly modelled. The type of nodes and edges determine whether the graph is homogeneous or heterogeneous, where heterogeneous graphs consist of different types of nodes or edges [71]. In addition, a graph is defined as dynamic when the input features or the topology of the graph varies over time [72]. There are three learning tasks in the context of GNNs. Node-level tasks include node classification [73] for categorizing nodes into several classes, node regression [74] for predicting a continuous variable for each node and node clustering [75] aiming at defining groups of nodes within a graph. Edge-level tasks include edge regression/classification [76] and link prediction [77] and graph-level tasks such as graph classification [78]. Finally, from the supervision’s method perspective, there are three categories of GNNs training methods. Fully supervised learning involves labeled data for the entire training set [79], while semi-supervised involves both labeled and unlabeled nodes in the training phase using inductive or transductive schemes for testing [80,81]. As in traditional deep learning tasks, graph unsupervised representation learning requires only unlabeled data. For example Graph Auto-encoders apply an encoder to embed the graph into the latent representation space, while a decoder is deployed to regenerate the graph structure [82].
In general, Graph Neural Networks are deep learning models that use the structure of a graph , where V is the set of nodes, E is the set of edges and A the adjacency matrix, and a feature vector , for , to learn a representation vector of a node in the latent space. To achieve this, GNNs use several neighbourhood aggregation methods to iteratively update a node’s representation by aggregating representations of its adjacent nodes. After k layers of aggregations, a node’s representation, also named as node embedding, contains the topological information within the node’s k-hop neighbourhood. As a high-level definition, the k-th layer of a GNN is:
where is the vector of features of node v at the k-th layer, N(v) is the set of adjacent nodes to v and AGG is a graph convolutional operation or a neighbourhood aggregation function.
In this study we focus on the feature representations of graph nodes for a node classification task, where the node representation of the final layer is used for prediction. As described in equation 1, GNNs apply graph convolutions to generate a node’s representation, mimicking the convolution operation applied in images [83]. There are two categories of graph convolutions described in the literature, named spectral methods and spatial-based methods [59,70]. Spectral methods employ graph convolutions applying techniques from graph signal processing [84], by transforming node representations into the spectral domain using Fourier transformations and its variants, and spatial-based convolutions apply spatial filters and neighbourhood aggregation techniques to define the node’s representation. In the following subsections we present a brief theoretical background regarding these two groups of GNN models in order to set the foundations for understanding the results of this study.
2.3.1. Spectral Methods
Spectral methods are a class of techniques used in graph representation learning that leverage the graph signal processing theory [84,85,86]. They are built on the concept of the eigenvectors of the graph Laplacian matrix that forms an orthonormal space, facilitating the application of Fourier transformations on the feature vectors of the graph nodes, also called graph signals. The normalized Laplacian matrix of a graph and the Fourier transformation of a graph signal x are defined as:
where U is the matrix of eigenvectors is the diagonal matrix of eigenvalues. Graph convolutions of a graph signal x are then defined based on these transformations using a specific filter :
These filters vary among different spectral convolutional graph neural networks. In the Spectral Convolutional Neural Network [87], these filters consist of a set of learnable parameters and are designed to deal with multi-channel graph signals. However, this architecture encounters challenges due to its dependence on the eigendecomposition of the Laplacian matrix, as well as the instability under graph perturbations, and high computational complexity. On the other hand, Deep Convolutional Graph Networks [88] introduce smooth coefficients on spatially localized filters.
Succeeding methods such as ChebNet [89] and GCN [81] made certain approximations and simplifications to overcome these limitations. ChebNet approximates the graph filters by using Chebyshev polynomials of the diagonal matrix of eigenvalues, thus enabling the extraction of local features, also reducing computational complexity. As a result, the convolutional operation for a graph signal x can be written as:
where , is a vector of Chebysev coeficients, adn the Chebysev polynomials are defined as . CayleyNet [90] goes further by using parametric rational complex functions to capture narrow frequency bands, with ChebNet considered as its special case.
Graph Convolutional Network (GCN) introduces a first-order approximation to ChebNet, reducing the number of parameters to avoid overfitting, setting and , simplifying equation 5 to the following form:
GCN has both spectral and spatial interpretations and can be viewed as a method for aggregating feature information from a node’s neighborhood, bridging the gap between spectral-based and spatial-based approaches. There have been further improvements over GCN, with methods like the Adaptive Graph Convolutional Network (AGCN) [91] and Dual Graph Convolutional Network (DGCN) [92] exploring alternative symmetric matrices, learning hidden structural relations, and using dual graph convolutional layers to encode both local and global structural information without the need for multiple layers.
2.3.2. Spatial Methods
Spatial-based approaches define graph convolutions based on the target node’s spatial relations similar to the convolutional operations of traditional CNNs on grids (images) [93]. Precisely, an image is considered as a special case of graphs with pixels represented as nodes of the grid-graph. A pixel’s representation into the latent space is defined by a convolutional filter that computes the weighted average of pixel values of the central node as well as its adjacent nodes. Towards this direction, spatial-based approaches apply convolutional operations to define a node’s representation with several sized neighbourhoods, propagating information along edges, while maintaining the major local invariance of CNNs.
For example, GraphSAGE [94] is a model that generate low-dimensional node representations by sampling and aggregating features from the target node’s local neighbourhood. In addition, authors propose a framework that applies the inductive paradigm for generating node embeddings for previously unseen nodes of the graph. The graph convolution is defined as:
where F is an aggregation function including mean, LSTM and pooling aggregator. The main novelty of GraphSAGE is a neighborhood sampling step during training, performing graph node aggregations in a batch of nodes instead of using the full neighbor set. Similarly, Fast Learning with GCNs [79] proposes node sampling independently for each layer, further improving the training efficiency. Other Spatial-based models that employ several neighborhood sampling techniques include PinSage [95] that introduces sampling neighbors using random walks on graphs, Stochastic GCN [96] and Adaptive sampling [97] that propose mechanisms for reducing sampling variances. Apart from sampling methods, several aggregation operators are mentioned in the literature, assigning different weights to neighbours improving the training performance and the overall accuracy of GNN models. Graph Attention Network [98] (GAT) defines the contribution of neighbouring nodes and introduces the attention mechanism by computing attention weights for determining the connection strength between two nodes. Moreover, Gated Attention Network [99] (GAAN) performs a self-attention mechanism for each attention head. Other significant spatial-based approaches include Graph Isomorphism Networks [100], Diffusion Convolutional Neural Networks [101] and Large-scale learnable graph convolutional networks [102].
2.4. Explainability of Graph Neural Networks
Graph Neural Networks are adept at achieving state-of-the-art performance in representation learning for graph-structured data. However, a notable shortcoming lies in their inability to provide human-intelligible explanations for their predictions. Several methods currently exist for interpreting other types of neural networks [103], including those that generate simpler surrogate models for providing explanations [104], and those that explore interpretations of high-level features or instances impacting the model’s predictions [105,106]. However, these methods are unable to address the intricate, non-Euclidean nature of graph-structured data. In light of these limitations, much research is dedicated to devising methods for interpreting the predictions of deep graph networks. Such methods explore different aspects of the GNN models, usually with a focus on understanding the significance of input features, nodes, edges, and graph structures on the model’s predictions [107,108,109], providing insights for the design of new GNN-based models across various domains [110].
Perturbation-based methods employ input importance scores by analyzing the variations in predictions due to different input perturbations [111,112,113,114]. Surrogate-based methods, on the other hand, fit a simple explainable model, such as a decision tree or a logistic regression, to a sampled dataset to generate explanations for the initial predictions [115,116,117]. Decomposition methods involve disassembling prediction scores in the last hidden layer and subsequently backpropagating these scores layer by layer to the input space. This process is conducted to compute the importance scores [118,119]. Gradient/feature-based methods utilize gradients or feature values to establish the importance of input features [109]. Lastly, model-level methods deliver high-level input-independent explanations, interpreting the general behaviors of GNNs without respect to any specific input instance [120].
The majority of these methods aim to output local explanations for a single instance identifying important parts of data that contribute to the model’s prediction. Local explainability is a crucial aspect of understanding complex machine learning models. It refers to the ability to explain the prediction for a specific instance, rather than explaining the model’s global behavior. Currently, most research efforts in GNN interpretability have primarily focused on instance-level explanation techniques, referred to as local explainability [121]. For example, a significant work in this area, GNNExplainer [111] defines an explanation in a form of a subgraph that contains a subset of nodes and node features that contribute on the prediction. GNN Explainer is a widely used explanation method for local explainability in GNNs that operates on a perturbation-based principle. It works by identifying the most critical edges or nodes contributing to a particular prediction by creating a binary mask over the graph’s adjacency matrix. The mask is learned through gradient descent by maximizing the mutual information between the model’s predictions on the masked graph and the original prediction. This process ultimately reveals the minimal sub-graph that most significantly influences the prediction of interest. The explainer performs this process gradually learning which edges and nodes are most important for each prediction, allowing it to mask out the parts of the graph that are not important. The final output is a subgraph that maintains the most relevant nodes and edges for the prediction, providing an interpretable local explanation for the prediction made by the GNN. On the contrary, global explanation methods provide instance-independent, model-agnostic and high-level interpretations of the overall behaviour of the black box models [122]. However, global understanding of GNNs is yet an unexplored area while studies on benchmarking graph explainers have focused on instance-based methods [123]. A few recent efforts towards global explainability in GNNs include generative-based techniques such as XGNN [120] and GNNInterpreter [124], GLGExplainer [125] that extends local explanations of PGExplainer, and Global counterfactual explainer [126] that employs a selection of top k counterfractuals using random walks. Furthermore, a common method that provides global explainability for complex machine learning and deep learning models is the creation of a simpler, surrogate model. A global surrogate model is an interpretable model constructed to explain the predictions of a more complex, ’black box’ model. This approach allows us to interpret the surrogate model, thereby making conclusions about any intricate model, including GNNs, without delving into its complex internal mechanisms. The surrogate model should be both interpretable and capable of mimicking the predictions of the GNN model. The primary goal is to closely approximate the GNN’s prediction function f with an interpretable surrogate model prediction function g. Any interpretable model can be employed for the function g. For instance, a logistic regression model could be chosen as a surrogate:
where represents features and represents the coefficients corresponding to these features. The higher the absolute value of the coefficient, the more significant the feature is in predicting a specific class. As a result, the coefficients of the logistic regression model serve as a measure of feature importance, providing insight into the original GNN model predictions.
3. Research Approach
In order to fulfill the objectives of this work, we use the following steps:
(1) Collect data. This work utilizes linked statistical data from the Scottish Open Government Data portal. Towards this end, multiple SPARQL queries were submitted to the SPARQL endpoint provided by the data portal. More details on the method used to retrieve data, the SPARQL queries, as well as descriptive statistics of the dataset can be found in [127].
(2) Pre-process data. This step transforms the integrated statistical indicators to a geo-centric knowledge graph that is suitable for being used by Graph Neural Network (GNN) algorithms to predict the house prices in Scottish “2011 data zones”. Towards this end, a sub-graph of the original linked dataset is selected that centers on geographical attributes, particularly emphasizing the Scottish “2011 data zones”.
(3) Predict house prices. This study leverages graph modeling for the prediction of house prices. Three distinct variants of GNNs are employed, each representative of the two key methodologies concerning graph convolutions, as detailed in subsection 2.3.1 and Section 2.3.2 of this paper: Chebyshev Neural Network (ChebNet), Graph Convolutional Network (GCN), and GraphSAGE. The problem is formulated as a node classification task for classifying Scottish “2011 data zones” into two categories: above the mean house price of all data zones or below the mean house price of all data zones. The training/validation/test split of this dataset is aligned with the fully-supervised scenario. To this end, all labels of the training examples are used for training following the implementation of [79] with a split ratio of 0.6/0.2/0.2 respectively. The created models are evaluated and then compared with each other. They are also juxtaposed against with the model created in a previous work [14], which utilized the XGBoost machine learning algorithm and a straightforward Multilayer Perceptron (MLP), based on the same dataset.
(4) Explain the model. To facilitate an in-depth understanding of the mechanisms behind the model’s predictions, both local and global explainability are used to provide comprehensive insights into the model’s behavior.
Global explainability is tackled through the implementation of a simple surrogate model using logistic regression, chosen for its interpretability and simplicity. This model is trained on the predictions of the superior performing GNN based on the results of the previous step, which is GraphSAGE. Specifically, the model is trained on the original features in combination with the predicted probabilities of the binary classification outcomes from the GraphSAGE model. The subsequent calculation of feature importance is based on the coefficients of the logistic regression. It is assumed that the magnitude of the coefficients inherently determines the relative importance of each feature for the GNN’s predictions. Therefore, these coefficients form the basis for interpreting the GraphSAGE’s prediction behavior on a global level.
Local explainability, on the other hand, is addressed through the application of a well-established method, GNNExplainer [111]. Towards this direction, two neighboring data zones are selected, both with house prices above the mean. For each data zone, local feature importance is computed, determining the most critical features that influence the model’s prediction for the specific node. Additionally, an explanation subgraph is visualized, highlighting the most significant nodes, edges, and features that strongly impact the prediction. Interestingly, these two data zones have previously been examined in another study [14] using the XGBoost model and the SHAP explainability framework. This previous research offers a valuable benchmark, allowing for the comparison of results, not merely on the level of predictive performance, but also in terms of explainability and feature importance.
4. Using Explainable Graph Neural Networks to Predict the House Prices in Scottish Data Zones
This Section presents the implementation of the case study based on the steps described in the methodology Section 3 namely, (i) Collect data, (ii) Pre-process data, (iii) Predict house prices, and (iv) Explain the model.
4.1. Collect Data
The statistical data used in this work were retrieved as linked data from the official OGD portal of Scottland. The data were retrieved from sixteen (16) datasets of the OGD portal classified in seven categories including health and social care, housing, and crime and justice resulting in sixty (60) statistical indicators (see Table A1 in the Appendix). The majority of the indicators are “Crime and Justice” data (22 indicators or 37.2%), followed by “Housing” indicators (13 indicators or 22%). Excluding Comparative Illness Factor (CIF) and Urban Rural Classification that are integer and categorical variables respectively, the rest of the indicators are numeric.
A total of 6,014 observations were extracted using the SPARQL queries. Each observation refers to a Scottish “2011 data zone” accompanied by its associated statistical indicators. This quantity of data zones represents a 86.2% coverage of the entire collection of “2011 data zones” within Scotland. The reason for this disparity is that certain data zones that lack values for one or more statistical indicators are not included. The main year of reference is 2015, while for indicators pertaining to two or three-year spans, we have chosen 2014-2015 and 2014-2016 as the designated reference periods. A small part of the data (1.4%) are null values. Comprehensive descriptive analysis of these indicators can be found in our previous work in [127].
The problem’s dependent variable is the mean house price, which ranges from £20,604 (Cumbernauld Central, Glasgow) to £1,244,910 (Leith (Albert Street) - 03 in the city of Edinburgh) across all data zones. The average cost of a house across all data zones is £163,478; the mean price of houses is higher in 39% of the “2011 data zones”. Therefore, determining whether a Scottish "2011 Data Zone"’s average house price is (a) over or (b) less £163,478 is the classification problem this study addresses. Finally, there is a small imbalance in the data.
4.2. Pre-Process Data
The Scottish statistical indicators were retrieved as linked data. To facilitate the development of Graph Neural Networks for house price prediction, a sub-graph was extracted from the retrieved dataset that centers on geographical attributes, particularly emphasizing the Scottish “2011 data zones”.
In Figure 1 an example of the initially retrieved graph with the Scottish statistical data is presented. The graph comprises four observations derived from two datasets (two observations per dataset). All observations pertain to 2015. The observations of dataset 1 describe “Comparative Illness Factor” (CIF), which is an indicator of health conditions, for two data zones, namely “City Centre West 01” and “City Centre East 04”. The two data zones are neighboring areas within Aberdeen, a city in North East Scotland and the third most populous city in the country. The value of CIF is 55 and 95 for the “City Centre West 01” and the “City Centre East 04” of Aberdeen respectively. Similarly, the observations of dataset 2 describe the percentage of employment deprivation in the same data zones, which 6% in the “City Centre West 01” and 9% in the “City Centre East 04”.
In Figure 2 (a), the part of the geo-centric graph that will be used for constructing the GNNs is selected. Only nodes with information regarding the “2011 data zones”, the value of the measure of the statistical indicator, and the values of additional properties (e.g., gender, age, etc.) are required. All other information, such as the dataset or the observations, is excluded. The final sub-graph is presented in Figure 2 (b). The edge connecting the data zone nodes represents the neighboring relationship between the data zones.
The final graph comprises a total of 6,014 interconnected nodes (or data zones), with 20,521 edges representing the adjacency of the respective data zones (Figure 3). Consequently, there is a connection between each data zone and its adjacent data zones. The hue of the data zones signifies the mean house price within its locale, ranging from deep blue to intense red as the mean house price ascends, thereby offering a visual gradient of housing costs.
4.3. House Price Prediction with Graph Neural Networks
Three GNN variants are implemented, as explained in Section 3, namely, Graph Convolutional Network (GCN), Chebyshev Neural Network (ChebNet), and GraphSAGE. The three GNN variants are compared against an XGBoost model that has been previously tested on the same dataset, and against a Multilayer Perceptron (MLP) that acts as a per-node baseline classifier that does not incorporate the underlined graph structure.
The study utilizes an undirected, attributed graph, wherein each node incorporates a 59-feature vector. This graph is comprised of 6,014 nodes and 20,521 unweighted edges. Prior to the implementation of the experiments, all features are normalized to a 0-1 scale to ensure consistent comparability across various feature ranges. The implementation details of the experiments are the following. All networks consist of 2 layers followed by a Relu non-linear activation function and the final layer is used for binary classification followed by a logistic sigmoid activation. The learning rate of all networks is 0.01, the dimension of hidden units is set to 32, while the dropout rate is 0. Furthermore, the Adam optimization method [128] is selected for all GNN models during training. Early stopping was implemented to mitigate the potential of model overfitting. If no improvement in validation accuracy was observed over 20 consecutive epochs, the training process was terminated. The Cross Entropy Loss function was adopted to assess the performance of all neural networks.
The original GCN is modified to the inductive setting following the work of [79]. On the contrary, GraphSAGE applies neighbour sampling and aggregation compared to the GCN that aggregates features from all neighbours. To this end, mean aggregator is selected for GraphSAGE with a neighbour sampling size set to 20 and 10 for each layer. In addition, for the Chebyshev spectral graph convolutional operator the size of the Chebyshev filter K is set to 2.
Figure 4 shows the test and validation learning curves of the 3 GNN variants and MLP. Notably, GraphSAGE exhibited the highest accuracy scores, both in test and validation scenarios, from the very beginning of the training process. This suggests a promising level of learning efficiency and model stability in GraphSAGE. GraphSAGE’s early high accuracy scores can be attributed to its robust learning mechanism, which effectively harnesses the features of the local neighborhood of each node. The capacity to employ sampling to aggregate information from the node’s neighborhood appears to confer an initial advantage to GraphSAGE over the other architectures in the test and validation plots. Moreover, high initial accuracy suggests that GraphSAGE requires fewer epochs to reach an optimal or near-optimal performance, leading to reduced training times and resource expenditure, while all other models are trained for longer epochs.
To validate the representational power of GNNs to incorporate the spatial dependencies among data zones, comparative evaluation results are summarized in Table 1. The evaluation involves common classification metrics including accuracy, precision, recall, f1 score and Area Under the ROC Curve (AUC-ROC) score. The evaluation metrics of the XGBoost model have been drawn from the prior work in [14]. GraphSAGE model achieves the highest accuracy, precision, recall, and F1 score among all models, coming in at 0.876 for each of these metrics, while also having an AUC-ROC value of 0.94. Additionally, GraphSAGE accomplishes these results in 68 epochs, indicating a relatively efficient learning process compared to the other graph-based models like GCN and ChebNET, which required 112 and 103 epochs respectively. The GCN and ChebNET models perform similarly on accuracy, precision, recall, and F1 score, each achieving around 0.85, but their AUC-ROC values indicate some difference in model performance. GCN’s AUC-ROC value is 0.89, suggesting a decent trade-off between sensitivity and specificity, while ChebNET’s AUC-ROC value is 0.91, indicating a slightly better performance at distinguishing between the two classes. considering XGBoost and MLP, both methods fall short in comparison to the graph neural network models. Although XGBoost has an AUC-ROC score of 0.92, which is higher than GCN, its overall accuracy, precision, recall, and F1 score are lower than all three GNN models. MLP has the lowest performance across all metrics, despite having a competitive AUC-ROC score of 0.91.
Figure 5 depicts the classification metrics further, by displaying the results for each class (0 and 1) separately. In general, the GraphSAGE model outperforms other models across most of the metrics and for both classes, demonstrating its strength in the binary classification task. This is particularly noticeable in the case of accuracy, where it consistently achieves top results. Its superiority extends to the recall for class 1, F1 score for class 0, and precision for class 1. However, there are some metrics where other models exhibit stronger performance. Interestingly, the MLP model surpasses other models in terms of recall for class 0. This suggests that MLP, while not the best overall performer, is particularly adept at identifying true positives in the instances that are actually of class 0. Similarly, XGBoost shows effectiveness in the precision metric for class 0, indicating that when it predicts an instance to be class 0, it is likely to be correct. It also achieves higher scores for F1 class 1, demonstrating its balanced performance between precision and recall for instances of class 1. The figure also reveals some of the models’ weak points. For instance, GCN appears to struggle with precision for class 0, where it ranks last among the models. This suggests that it has a higher rate of false positives when predicting class 0, which could be a significant drawback if precision in identifying this class is a priority.
4.4. Explainability
In order to better understand the decisions of the prediction models, we use both global and local explainability. Both methods are applied to the most accurate model, i.e., GraphSAGE, based on the results of the previous sections.
4.4.1. Global Explainability
In this study a logistic regression model is chosen as surrogate to provide global explainability. The predicted probabilities produced by the GraphSAGE model along with the initial features are used to train the logistic regression. The higher the absolute value of the coefficient, the more significant the feature is in predicting whether a house price is above or below the mean price. Each provided coefficient represents the change in the log-odds of the target variable, given a one-unit change in the predictor, all other variables being held constant. Figure 6 depicts feature importance as determined by the coefficients of the surrogate model. Each bar corresponds to a feature used in the GNN model, and the length of the bar signifies the magnitude of the feature’s impact on the model’s predictions. The direction of the bar indicates the polarity of the coefficient, i.e., whether the feature contributes positively or negatively to a house price being above the mean price.
Notably, several indicators are negatively associated with a data zone having house prices above the average. For example,“Comparative Illness Factor” (CIF) shows the largest negative coefficient, suggesting that data zones with higher values for CIF tend to have lower mean house prices. Similar trends can be observed for features such as “Households with single adult discounts (ratio)”, “Terraced dwellings”, and “Mothers currently smoking (ratio)”. On the other hand, factors that increase the likelihood of a data zone having house prices above the mean are also identified. The most substantial of these is the ratio of “Detached dwellings”, suggesting that regions with a higher proportion of detached dwellings are more likely to have higher house prices. Other significant positive factors include the proportion of “Mothers never smoked”, “Occupied households ratio”, “School attendance ratio”, and “Flats ratio”. This could reflect the impact of education and healthier living environments on house prices. Coefficients for travel times to different services (like retail centres, schools, and GP surgeries) by car and public transport are mostly negative, suggesting that longer travel times might be associated with lower house prices. However, these coefficients are small, implying that these factors might not be influential in determining whether house prices are above or below the mean. Features related to fires show both positive and negative associations with house prices. For instance, “Accidental outdoor fires” and “Vehicle fires” have positive coefficients, indicating a slight increase in the likelihood of house prices being above the mean, while “Other primary fires” and “Accidental refuse fires” are negatively associated.
4.4.2. Local Explainability
The GNN Explainer is applied to two specific nodes corresponding to data zones S01006552 or Hazlehead - 06 and S01006553 or Summerhill - 01. Hazlehead - 06 and Summerhill - 01 are adjacent data zones located within the council area of Aberdeen city, in the north-eastern region of Scotland. The average house price in these zones is £257,621 and £251,658 respectively, both of which are higher than the average house prices across Scotland. GraphSAGE model correctly predicted them as having house prices above the mean.
To understand and interpret the model’s predictions for these two data zones, the explanation sub-graph is visualized. Figure 7,9 depict the explanation graphs of Summerhill - 01 and Hazlehead - 06 data zones respectively, illustrating the most influential nodes and edges contributing to this node’s prediction. Each node represented in this sub-graph is characterized by its most important feature. The sub-graph also depicts the structural interdependencies between the target node and its neighboring nodes. The edge opacity in the explanation sub-graph signifies the importance of each connection, with more opaque edges corresponding to stronger influential relationships.
It is noted that all nodes within a one-hop distance from the target node have highly influential connections for both data zones, suggesting that the immediate neighborhood of a node plays a crucial role in the model’s predictions. It is observed that not all regions contribute equally to the prediction outcome. In the case of Summerhill - 01 (Figure 7), data zones like S01006704, S01006705, S01006702, S01006717, S01006552 and S01006722 appear to have less influence on the prediction of the target node, all of which display house prices that fall below the mean. Furthermore, the “Employment deprivation” (ED) feature appears several times across the nodes, suggesting that it is a significant predictor for the target node. Similarly, “Comparative Illness Factor” (CIF), “Other building fires” (OBF), and “Urban Rural Classification” (URC) also come up multiple times across nodes, suggesting their significant role in predicting the target variable.
Figure 8 depicts the total feature importance for data zone Summerhill - 01 as the sum of the node mask values across all nodes for each feature. This plot aggregates the importance of each feature across all nodes of the explanation subgraph, offering a comprehensive understanding of the relative importance of features. As a result, “Urban Rural Classification” is ranked first in terms of importance, followed by “Comparative Illness Factor”, “Employment Deprivation”, “Educational Attainment of School Leavers”, and “Detached Dwellings”. In this case, the local interpretation for classifying this specific region as an area likely to have house prices above the mean, aligns well with the global interpretation as presented in subsection 4.4.1. It is observed that features like “Urban Rural Classification” and “Comparative Illness Factor”, which hold high importance on a global scale, also play a substantial role in driving the local prediction for this particular region.
Finally, in the case of Hazlehead - 06, Figure 9 depicts stronger relations of the target node with the one-hop neighbours as well as data zones S01006703, S01006557. “Flats” (F), “Accidental Refuse Fires” (ARF), “Occupied Households” and “Households with single adult discounts” (HWSAD) are features that prominently appear across multiple nodes, suggesting their pivotal role in forecasting whether house prices in Hazlehead - 06 will surpass the mean value.
However, as seen from the feature importance plot in Figure 10, other features like “Comparative illness factor” and “Dwelling fires” have high aggregate importance scores. While the explanation subgraph provide valuable insights into the structural dependencies and reveals localized feature influences, the feature importance plot captures the collective importance of each feature in the model’s predictive behavior by aggregating the importance scores of all features across all nodes of the explanation graph. Furthermore, it is noteworthy that key features such as “Comparative Illness Factor”, “Flats”, “Mothers who are Former Smokers”, and “Occupied Households” appear in both global and local importance plots. The consistency indicates that despite their different methodologies and assumptions, both models perceive these particular features as having significant influence on the prediction of house prices in Hazlehead - 06.
5. Discussion
This study utilizes Graph Neural Networks to forecast housing prices across Scotland’s “2011 data zones”. House price prediction, a research area that is rapidly gaining traction in the current academic literature[14,19,21], is a problem intricately intertwined with spatial dependencies[23,129]. Recognizing that house prices of a region are not solely determined by its inherent characteristics, such as health and social care indicators, economic statistics or housing details, but also by the socio-economic context of its surrounding regions, it becomes evident that models must incorporate these spatial interdependencies. GNNs, by their nature, are uniquely suited to handle this spatial context due to their inherent ability to model relationships between entities, hence providing an innovative approach to tackle house price prediction.
However, GNNs, like many other sophisticated machine learning models, are often referred to as “black box” models due to their opaque decision-making processes. Explainability of such models remains a largely unexplored area. While numerous explainability techniques have been proposed, many are unsuitable for GNNs because they fail to consider the nature of graph-structured data, while most applications in GNN explainability focus on areas like biology and chemistry [107,130], rather than house price prediction. Moreover, another shortcoming in the existing body of GNN research is the absence of global explanations, with most interpretability efforts focusing on instance-level explanations [111,112,115]. This narrows the scope of the interpretability, preventing comprehensive insights into the overall decision-making process of the GNN. In this study, we tackle this limitation head-on by deploying an interpretable surrogate model for the “black box model” to provide a global explanation for its predictions.
Finally, this work compares the outcomes of the graph-based approach with a previously conducted study using the XGBoost machine learning algorithm and the SHAP explainability framework [14].
From the results, it can be observed that the GNNs produced accurate predictions for classifying data zones above or below the mean house prices. Comparatively, the GNN variants (ChebNet, GCN, GraphSAGE) outperformed the XGBoost algorithm utilized in the prior research. Notably, GraphSAGE was particularly superior in classifying whether a data zone would have house prices above or below the mean.
In the realm of explainability, the global explainability revealed similar tendencies to those observed in [14]. The “Comparative Illness Factor”, in particular, was shown to negatively impact house prices in both studies, while the proportion of “Detached Dwellings” is ranked as the most important feature that positively affects house prices. Additionally, however, the surrogate model approach also highlighted the effect of various types of dwellings such as the proportion of “Flats” and “Occupied Households” in the prediction of the house prices. Local explainability results showcased the ability of GNNExplainer to capture per-node structural dependencies within the graph data. The significance of the immediate neighborhood in predicting the house price category for a specific data zone was one of the noteworthy findings. Comparing the local explainability results to the results of [14], it was observed that while some global factors also played a crucial role locally, certain areas demonstrated different patterns. For instance, the graph-based interpretability model indicated that some variables that hold high importance globally might be less influential in some specific data zones, such as the “Urban Rural Classification” for the Hazlehead - 06 data zone.
While the similiarities between the findings of the GNN-Explainer and the SHAP-based approach were substantial, especially with regards to top contributors to feature importance, there were also distinct differences. These differences can be traced back to the intrinsic variations in the methods used in the two models. Specifically, the XGBoost-SHAP approach works with tabular data, treating each data zone as an isolated entity, whereas the GNN-GNNExplainer framework utilizes the underlying graph structure of the data, allowing for the capture of more intricate dependencies between data zones. This distinction is made clear in the context of local explainability, where GNNExplainer pinpointed different features as most important compared to the XGBoost-SHAP analysis. Moreover, the GNNExplainer provides additional information in the form of explanation graphs for each target node. This is a significant advantage over the SHAP approach, which lacks the topological context. However, the difference between the two is not a mere matter of one being superior to the other, rather it emphasizes the unique insights that can be garnered when considering or not the topology and complex dependencies within data zones. Moreover, the fact that both explainability frameworks produced similar results for top contributors in the predictions is indicative of the robustness of these top contributors across different machine learning models, such as “Comparative Illness factor” and “Detached Dwellings”. However, it also illustrates that the choice of the machine learning model and explainability framework can yield varying insights, especially on a local level, thereby emphasizing the importance of a comprehensive approach when performing such analyses.
Regarding prediction accuracy, it is noteworthy that the GNN variants achieved a marginally higher classification performance than the XGBoost model, with GraphSAGE outperforming XGBoost by a relatively slim margin of 3.6%. While this result might not be substantial, it underscores the potential value of modeling geographical regions as graphs.
For future research in house price prediction, the exploration of additional data zone-specific features could be instrumental in further improving the accuracy and enhakncing the explainability of GNNs for this particular task. In addition, the presence of a hierarchy in the georaphical dimension of the dataset could also be exploited to construct a hierarchical graph similarly to [131] and get better results. This study, therefore, serves as an important stepping stone, highlighting the promise of GNNs and their explainability frameworks in the context of spatial-based prediction tasks.
6. Conclusions
The results from this study provide compelling evidence of the efficacy of Graph Neural Networks in predicting house prices. Moreover, the research delves into both global and local explainability. Towards this end, three GNN variants (GCN, ChebNet, and GraphSAGE) are epmloyed. The comparative analysis of the results reveals that the three GNN variants outperform the conventional models XGBoost and MLP. These findings underline the significance of incorporating the underlying graph structure of Scottish data zones, with GraphSAGE demonstrating the highest accuracy, precision, recall, and F1 score among all models. GraphSAGE’s early high accuracy scores indicate a robust learning mechanism that efficiently harnesses the local neighborhood information of each node, thereby reducing the model’s training time. The global explainability analysis suggests that features related to living and health conditions, such as “Comparative Illness Factor”, “School attendance”, “Mothers never smoked”, “Mothers currently smoking”, and housing types such as “Detached dwellings”, “Flats”, “Occupied households”, and “Terraced households” play a significant role in determining house prices. Local explainability of the model showed the influential nodes and features contributing to the prediction. Interestingly, the local explanations align well with the global interpretations, suggesting consistency in the model’s decision-making process. However, there are some cases that global contributors are less important in specific data zones.
In conclusion, this research contributes valuable insights into the use of Graph Neural Networks for house price prediction. Our findings support the potential of these methods to not only deliver superior prediction performance but also to provide a clear understanding of the factors driving these predictions. Future work can further investigate the use of GNNs in other prediction tasks, i.e., node regression and explore additional strategies for enhancing their explainability.
Author Contributions
X. X.: Formal analysis, Data Curation, Software, Writing - Original Draft; X. X.: Formal analysis, Software, Writing - Original Draft; X. X.: Methodology, Conceptualization, Supervision, Writing - Review & Editing; X. X.: Supervision
Funding
This research received no external funding
Data Availability Statement
The study was conducted utilizing data that have been previously published in: Karamanou, A.; Kalampokis, E.; Tarabanis, K. Integrated statistical indicators from Scottish linked open government data. Data in Brief 2023, 46, 108779. https://doi.org/10.1016/j.dib.2022.108779.
Conflicts of Interest
The authors declare no conflict of interest
Appendix A

Table A1.
The Statistical Indicators used in the Open Statistics Graph classified by theme.
| Theme | Statistical Indicator | Details/ Type |
| Travel times to GP surgeries by public transport | Minutes/Numeric | |
| Travel times to post office by public transport | Minutes/Numeric | |
| Access to Services | Travel times to retail centre by public transport | Minutes/Numeric |
| Travel times to petrol station by car | Minutes/Numeric | |
| Travel times to post office by car | Minutes/Numeric | |
| Travel times to GP surgeries by car | Minutes/Numeric | |
| Travel times to primary school by car | Minutes/Numeric | |
| Travel times to secondary school by car | Minutes/Numeric | |
| Travel times to retail centre by car | Minutes/Numeric | |
| Chimney fires | Ratio/Numeric | |
| Dwelling fires | Ratio/Numeric | |
| Other building fires | Ratio/Numeric | |
| Other primary fires | Ratio/Numeric | |
| Outdoor fires | Ratio/Numeric | |
| Refuse fires | Ratio/Numeric | |
| Vehicle fires | Ratio/Numeric | |
| Crime & Justice | Accidental chimney fires | Ratio/Numeric |
| Accidental dwelling fires | Ratio/Numeric | |
| Accidental other building fires | Ratio/Numeric | |
| Accidental other primary fires | Ratio/Numeric | |
| Accidental outdoor fires | Ratio/Numeric | |
| Accidental refuse fires | Ratio/Numeric | |
| Accidental vehicle fires | Ratio/Numeric | |
| Not accidental chimney fires | Ratio/Numeric | |
| Not accidental dwelling fires | Ratio/Numeric | |
| Not accidental other building fires | Ratio/Numeric | |
| Not accidental other primary fires | Ratio/Numeric | |
| Not accidental outdoor fires | Ratio/Numeric | |
| Not accidental refuse fires | Ratio/Numeric | |
| Not accidental vehicle fires | Ratio/Numeric | |
| Crime indicators | Ratio/Numeric | |
| Children 0–15 living in low income families | Ratio/Numeric | |
| Economic Activity, Benefits & Tax Credits | Children 0–19 living in low income families | Ratio/Numeric |
| Age of first time mothers 19 years and under | Ratio/Numeric | |
| Age of first time mothers 35 years and older | Ratio/Numeric | |
| Employment deprivation | Ratio/Numeric | |
| Education, Skills & Training | School attendance | Ratio/Numeric |
| Educational attainment of school leavers | Score/Numeric | |
| Geography | Land area | Hectares/Numeric |
| Urban Rural Classification | 6–fold/Categorical | |
| Mothers currently smoking | Ratio/Numeric | |
| Mothers former smokers | Ratio/Numeric | |
| Mothers never smoked | Ratio/Numeric | |
| Health & Social Care | Low birth–weight (less than 2500g) babies (single births) | Ratio/Numeric |
| Mothers not known if they smoke | Ratio/Numeric | |
| Comparative Illness Factor | –/Integer | |
| Dwellings per hectare | Ratio/Numeric | |
| Detached dwellings | Ratio/Numeric | |
| Flats | Ratio/Numeric | |
| Semi–detached dwellings | Ratio/Numeric | |
| Terraced dwellings | Ratio/Numeric | |
| Dwellings of unknown type | Ratio/Numeric | |
| Housing | Long–term empty households | Ratio/Numeric |
| Occupied households | Ratio/Numeric | |
| Second–home households | Ratio/Numeric | |
| Vacant households | Ratio/Numeric | |
| Households with occupied exemptions | Ratio/Numeric | |
| Households with unoccupied exemptions | Ratio/Numeric | |
| Households with single adult discounts | Ratio/Numeric |
References
- Égert, B.; Mihaljek, D. Determinants of House Prices in Central and Eastern Europe. Comparative Economic Studies 2007, 49, 367–388. [Google Scholar] [CrossRef]
- Hromada, E.; Čermáková, K.; Piecha, M. Determinants of House Prices and Housing Affordability Dynamics in the Czech Republic. European Journal of Interdisciplinary Studies 2022, 14, 119–132. [Google Scholar] [CrossRef]
- Campbell, J.Y.; Cocco, J.F. How do house prices affect consumption? Evidence from micro data. Journal of Monetary Economics 2007, 54, 591–621. [Google Scholar] [CrossRef]
- Eurostat. Housing in Europe — 2022 interactive edition, 2022. [CrossRef]
- Mbah, R.E.; Wasum, D.F. Russian-Ukraine 2022 War: A review of the economic impact of Russian-Ukraine crisis on the USA, UK, Canada, and Europe. Advances in Social Sciences Research Journal 2022, 9, 144–153. [Google Scholar] [CrossRef]
- Pereira, P.; Zhao, W.; Symochko, L.; Inacio, M.; Bogunovic, I.; Barcelo, D. The Russian-Ukrainian armed conflict will push back the sustainable development goals. Geography and Sustainability 2022, 3, 277–287. [Google Scholar] [CrossRef]
- Hoesli, M.; Malle, R. Commercial real estate prices and COVID-19. Journal of European Real Estate Research 2022, 15, 295–306. [Google Scholar] [CrossRef]
- Truong, Q.; Nguyen, M.; Dang, H.; Mei, B. Housing Price Prediction via Improved Machine Learning Techniques. Procedia Computer Science 2020, 174, 433–442. [Google Scholar] [CrossRef]
- Yang, L.; Chu, X.; Gou, Z.; Yang, H.; Lu, Y.; Huang, W. Accessibility and proximity effects of bus rapid transit on housing prices: Heterogeneity across price quantiles and space. Journal of Transport Geography 2020, 88, 102850. [Google Scholar] [CrossRef]
- Song, Y.; Ma, X. Exploration of intelligent housing price forecasting based on the anchoring effect. Neural Computing and Applications 2023. [Google Scholar] [CrossRef]
- Kiwelekar, A.W.; Mahamunkar, G.S.; Netak, L.D.; Nikam, V.B. Deep learning techniques for geospatial data analysis. Machine Learning Paradigms: Advances in Deep Learning-based Technological Applications.
- Chami, I.; Abu-El-Haija, S.; Perozzi, B.; Ré, C.; Murphy, K. Machine Learning on Graphs: A Model and Comprehensive Taxonomy. J. Mach. Learn. Res. 2022, 23. [Google Scholar]
- Kalampokis, E.; Tambouris, E.; Tarabanis, K. A classification scheme for open government data: towards linking decentralised data. International Journal of Web Engineering and Technology 2011, 6, 266–285. [Google Scholar] [CrossRef]
- Karamanou, A.; Kalampokis, E.; Tarabanis, K. Linked Open Government Data to Predict and Explain House Prices: The Case of Scottish Statistics Portal. Big Data Research 2022, 30, 100355. [Google Scholar] [CrossRef]
- Law, S.; Paige, B.; Russell, C. Take a Look Around: Using Street View and Satellite Images to Estimate House Prices. ACM Trans. Intell. Syst. Technol. 2019, 10. [Google Scholar] [CrossRef]
- Chwiałkowski, C.; Zydroń, A. Socio-Economic and Spatial Characteristics of Wielkopolski National Park: Application of the Hedonic Pricing Method. Sustainability 2021, 13, 1–17. [Google Scholar] [CrossRef]
- Wongleedee, K. Important marketing decision to purchase condominium: A case study of Bangkok, Thailand. The Business and Management Review 2017, 9, 122–125. [Google Scholar]
- Xiao, Y.; Chen, X.; Li, Q.; Yu, X.; Chen, J.; Guo, J. Exploring Determinants of Housing Prices in Beijing: An Enhanced Hedonic Regression with Open Access POI Data. ISPRS International Journal of Geo-Information 2017, 6. [Google Scholar] [CrossRef]
- Taecharungroj, V. Google Maps amenities and condominium prices: Investigating the effects and relationships using machine learning. Habitat International 2021, 118, 102463. [Google Scholar] [CrossRef]
- Levantesi, S.; Piscopo, G. The importance of economic variables on London real estate market: A random forest approach. Risks 2020, 8, 112. [Google Scholar] [CrossRef]
- Rico-Juan, J.R.; Taltavull de La Paz, P. Machine learning with explainability or spatial hedonics tools? An analysis of the asking prices in the housing market in Alicante, Spain. Expert Systems with Applications 2021, 171, 114590. [Google Scholar] [CrossRef]
- Gollini, I.; Lu, B.; Charlton, M.; Brunsdon, C.; Harris, P. GWmodel: An R Package for Exploring Spatial Heterogeneity Using Geographically Weighted Models. Journal of Statistical Software 2015, 63, 1–50. [Google Scholar] [CrossRef]
- Bourassa, S.C.; Cantoni, E.; Hoesli, M. Spatial Dependence, Housing Submarkets, and House Price Prediction. The Journal of Real Estate Finance and Economics 2007, 35, 143–160. [Google Scholar] [CrossRef]
- Bourassa, S.; Cantoni, E.; Hoesli, M. Predicting house prices with spatial dependence: A comparison of alternative methods. Journal of Real Estate Research 2010, 32, 139–160. [Google Scholar] [CrossRef]
- Anselin, L.; Lozano-Gracia, N. Spatial hedonic models. In Palgrave handbook of econometrics; Springer, 2009; pp. 1213–1250. [Google Scholar]
- Park, B.; Bae, J.K. Using machine learning algorithms for housing price prediction: The case of Fairfax County, Virginia housing data. Expert Systems with Applications 2015, 42, 2928–2934. [Google Scholar] [CrossRef]
- Varma, A.; Sarma, A.; Doshi, S.; Nair, R. House price prediction using machine learning and neural networks. 2018 Second International Conference on Inventive Communication and Computational Technologies (ICICCT). IEEE, 2018, pp. 1936–1939.
- Hu, L.; He, S.; Han, Z.; Xiao, H.; Su, S.; Weng, M.; Cai, Z. Monitoring housing rental prices based on social media: An integrated approach of machine-learning algorithms and hedonic modeling to inform equitable housing policies. Land use policy 2019, 82, 657–673. [Google Scholar] [CrossRef]
- Kang, Y.; Zhang, F.; Peng, W.; Gao, S.; Rao, J.; Duarte, F.; Ratti, C. Understanding house price appreciation using multi-source big geo-data and machine learning. Land Use Policy 2021, 111, 104919. [Google Scholar] [CrossRef]
- Das, S.S.S.; Ali, M.E.; Li, Y.F.; Kang, Y.B.; Sellis, T. Boosting house price predictions using geo-spatial network embedding. Data Mining and Knowledge Discovery 2021, 35, 2221–2250. [Google Scholar] [CrossRef]
- Sun, Z.; Zhang, J. Research on Prediction of Housing Prices Based on GA-PSO-BP Neural Network Model: Evidence from Chongqing, China. INTERNATIONAL JOURNAL OF FOUNDATIONS OF COMPUTER SCIENCE 2022, 33, 805–818. [Google Scholar] [CrossRef]
- Wang, Z.; Wang, Y.; Wu, S.; Du, Z. House Price Valuation Model Based on Geographically Neural Network Weighted Regression: The Case Study of Shenzhen, China. ISPRS INTERNATIONAL JOURNAL OF GEO-INFORMATION 2022, 11. [Google Scholar] [CrossRef]
- Peng, H.; Li, J.; Wang, Z.; Yang, R.; Liu, M.; Zhang, M.; Yu, P.S.; He, L. Lifelong Property Price Prediction: A Case Study for the Toronto Real Estate Market. IEEE TRANSACTIONS ON KNOWLEDGE AND DATA ENGINEERING 2023, 35, 2765–2780. [Google Scholar] [CrossRef]
- Wang, F.; Zou, Y.; Zhang, H.; Shi, H. House Price Prediction Approach based on Deep Learning and ARIMA Model. 2019 IEEE 7th International Conference on Computer Science and Network Technology (ICCSNT), 2019, pp. 303–307. [CrossRef]
- Selim, H. Determinants of house prices in Turkey: Hedonic regression versus artificial neural network. Expert Systems with Applications 2009, 36, 2843–2852. [Google Scholar] [CrossRef]
- Parliament, E. Directive (EU) 2019/1024 of the European Parliament and of the Council of 20 June 2019 on open data and the re-use of public sector information (recast). Off. J. Eur. Union 2019, 172, 56–83. [Google Scholar]
- Karamanou, A.; Brimos, P.; Kalampokis, E.; Tarabanis, K. Exploring the Quality of Dynamic Open Government Data Using Statistical and Machine Learning Methods. Sensors 2022, 22. [Google Scholar] [CrossRef]
- Karamanou, A.; Brimos, P.; Kalampokis, E.; Tarabanis, K. Exploring the Quality of Dynamic Open Government Data for Developing Data Intelligence Applications: The Case of Attica Traffic Data. Proceedings of the 26th Pan-Hellenic Conference on Informatics; Association for Computing Machinery: New York, NY, USA, 2023; PCI ’22, p. 102–109. [CrossRef]
- Brimos, P.; Karamanou, A.; Kalampokis, E.; Tarabanis, K. Graph Neural Networks and Open-Government Data to Forecast Traffic Flow. Information 2023, 14. [Google Scholar] [CrossRef]
- Tseng, F.S.; Chen, C.W. Integrating heterogeneous data warehouses using XML technologies. Journal of Information Science 2005, 31, 209–229. [Google Scholar] [CrossRef]
- Berger, S.; Schrefl, M. From Federated Databases to a Federated Data Warehouse System. Proceedings of the 41st Annual Hawaii International Conference on System Sciences (HICSS 2008), 2008, pp. 394–394. [CrossRef]
- Cabibbo, L.; Torlone, R. A logical approach to multidimensional databases. International Conference on Extending Database Technology. Springer, 1998, pp. 183–197.
- Datta, A.; Thomas, H. The cube data model: a conceptual model and algebra for on-line analytical processing in data warehouses. Decision Support Systems 1999, 27, 289–301. [Google Scholar] [CrossRef]
- Janssen, M.; Hartog, M.; Matheus, R.; Ding, A.Y.; Kuk, G. Will Algorithms Blind People? The Effect of Explainable AI and Decision-Makers’ Experience on AI-supported Decision-Making in Government. Social Science Computer Review 2022, 40, 478–493. [Google Scholar] [CrossRef]
- Kalampokis, E.; Tambouris, E.; Tarabanis, K. Linked Open Cube Analytics Systems: Potential and Challenges. IEEE Intelligent Systems 2016, 31, 89–92. [Google Scholar] [CrossRef]
- Perez Martinez, J.M.; Berlanga, R.; Aramburu, M.J.; Pedersen, T.B. Integrating Data Warehouses with Web Data: A Survey. IEEE Transactions on Knowledge and Data Engineering 2008, 20, 940–955. [Google Scholar] [CrossRef]
- Kalampokis, E.; Karamanou, A.; Tarabanis, K. Interoperability Conflicts in Linked Open Statistical Data. Information 2019, 10. [Google Scholar] [CrossRef]
- Kalampokis, E.; Zeginis, D.; Tarabanis, K. On modeling linked open statistical data. Journal of Web Semantics 2019, 55, 56–68. [Google Scholar] [CrossRef]
- Cyganiak, R.; Reynolds, D. The RDF data cube vocabulary: W3C recommendation. W3C Tech. Rep. 2014. [Google Scholar]
- Miles, A.; Bechhofer, S. SKOS simple knowledge organization system reference. W3C recommendation 2009. [Google Scholar]
- Wu, Y.; Lian, D.; Xu, Y.; Wu, L.; Chen, E. Graph Convolutional Networks with Markov Random Field Reasoning for Social Spammer Detection. Proceedings of the AAAI Conference on Artificial Intelligence 2020, 34, 1054–1061. [Google Scholar] [CrossRef]
- Jiang, W.; Luo, J. Graph neural network for traffic forecasting: A survey. Expert Systems with Applications 2022, 207, 117921. [Google Scholar] [CrossRef]
- Jiang, W. Graph-based deep learning for communication networks: A survey. Computer Communications 2022, 185, 40–54. [Google Scholar] [CrossRef]
- Zhang, X.M.; Liang, L.; Liu, L.; Tang, M.J. Graph neural networks and their current applications in bioinformatics. Frontiers in genetics 2021, 12, 690049. [Google Scholar] [CrossRef] [PubMed]
- Yang, Z.; Chakraborty, M.; White, A.D. Predicting chemical shifts with graph neural networks. Chemical science 2021, 12, 10802–10809. [Google Scholar] [CrossRef] [PubMed]
- Liu, A.; Lee, H.y.; Lee, L.s. Adversarial Training of End-to-end Speech Recognition Using a Criticizing Language Model. Acoustics, Speech and Signal Processing (ICASSP). IEEE, 2019.
- He, K.; Zhang, X.; Ren, S.; Sun, J. Deep Residual Learning for Image Recognition. 2016 IEEE Conference on Computer Vision and Pattern Recognition (CVPR), 2016, pp. 770–778. [CrossRef]
- Devlin, J.; Chang, M.; Lee, K.; Toutanova, K. BERT: Pre-training of Deep Bidirectional Transformers for Language Understanding. Proceedings of the 2019 Conference of the North American Chapter of the Association for Computational Linguistics: Human Language Technologies, NAACL-HLT 2019, Minneapolis, MN, USA, June 2-7, 2019, Volume 1 (Long and Short Papers); Burstein, J.; Doran, C.; Solorio, T., Eds. Association for Computational Linguistics, 2019, pp. 4171–4186. [CrossRef]
- Wu, Z.; Pan, S.; Chen, F.; Long, G.; Zhang, C.; Philip, S.Y. A comprehensive survey on graph neural networks. IEEE transactions on neural networks and learning systems 2020, 32, 4–24. [Google Scholar] [CrossRef]
- Zhang, Z.; Cui, P.; Zhu, W. Deep learning on graphs: A survey. IEEE Transactions on Knowledge and Data Engineering 2020, 34, 249–270. [Google Scholar] [CrossRef]
- Bronstein, M.M.; Bruna, J.; LeCun, Y.; Szlam, A.; Vandergheynst, P. Geometric deep learning: going beyond euclidean data. IEEE Signal Processing Magazine 2017, 34, 18–42. [Google Scholar] [CrossRef]
- Seo*, S.; Meng*, C.; Liu, Y. Physics-aware Difference Graph Networks for Sparsely-Observed Dynamics. International Conference on Learning Representations, 2020.
- Do, K.; Tran, T.; Venkatesh, S. Graph Transformation Policy Network for Chemical Reaction Prediction. Proceedings of the 25th ACM SIGKDD International Conference on Knowledge Discovery & Data Mining; Association for Computing Machinery: New York, NY, USA, 2019. [Google Scholar] [CrossRef]
- Qi, S.; Wang, W.; Jia, B.; Shen, J.; Zhu, S.C. Learning Human-Object Interactions by Graph Parsing Neural Networks. Computer Vision – ECCV 2018; Ferrari, V., Hebert, M., Sminchisescu, C., Weiss, Y., Eds.; Springer International Publishing: Cham, 2018; pp. 407–423. [Google Scholar]
- Marcheggiani, D.; Bastings, J.; Titov, I. Exploiting Semantics in Neural Machine Translation with Graph Convolutional Networks. Proceedings of the 2018 Conference of the North American Chapter of the Association for Computational Linguistics: Human Language Technologies, Volume 2 (Short Papers); Association for Computational Linguistics: New Orleans, Louisiana, 2018; pp. 486–492. [Google Scholar] [CrossRef]
- Wu, F.; Souza, A.; Zhang, T.; Fifty, C.; Yu, T.; Weinberger, K. Simplifying Graph Convolutional Networks. Proceedings of the 36th International Conference on Machine Learning. PMLR, 2019, pp. 6861–6871.
- Palm, R.B.; Paquet, U.; Winther, O. Recurrent Relational Networks. Proceedings of the 32nd International Conference on Neural Information Processing Systems; Curran Associates Inc.: Red Hook, NY, USA, 2018. [Google Scholar]
- Salha, G.; Hennequin, R.; Tran, V.A.; Vazirgiannis, M. A Degeneracy Framework for Scalable Graph Autoencoders. Proceedings of the 28th International Joint Conference on Artificial Intelligence. AAAI Press, 2019, IJCAI’19, p. 3353–3359.
- Wang, T.; Liao, R.; Ba, J.; Fidler, S. NerveNet: Learning Structured Policy with Graph Neural Networks. International Conference on Learning Representations, 2018.
- Zhou, J.; Cui, G.; Hu, S.; Zhang, Z.; Yang, C.; Liu, Z.; Wang, L.; Li, C.; Sun, M. Graph neural networks: A review of methods and applications. AI Open 2020, 1, 57–81. [Google Scholar] [CrossRef]
- Zhang, C.; Song, D.; Huang, C.; Swami, A.; Chawla, N.V. Heterogeneous graph neural network. Proceedings of the 25th ACM SIGKDD international conference on knowledge discovery & data mining, 2019, pp. 793–803.
- Trivedi, R.; Farajtabar, M.; Biswal, P.; Zha, H. Dyrep: Learning representations over dynamic graphs. International conference on learning representations, 2019.
- Xiao, S.; Wang, S.; Dai, Y.; Guo, W. Graph neural networks in node classification: survey and evaluation. Machine Vision and Applications 2022, 33, 1–19. [Google Scholar] [CrossRef]
- Yu, B.; Yin, H.; Zhu, Z. Spatio-Temporal Graph Convolutional Networks: A Deep Learning Framework for Traffic Forecasting. Proceedings of the 27th International Joint Conference on Artificial Intelligence. AAAI Press, 2018, IJCAI’18, p. 3634–3640.
- Bianchi, F.M.; Grattarola, D.; Alippi, C. Spectral clustering with graph neural networks for graph pooling. International conference on machine learning. PMLR, 2020, pp. 874–883.
- Gong, L.; Cheng, Q. Exploiting edge features for graph neural networks. Proceedings of the IEEE/CVF conference on computer vision and pattern recognition, 2019, pp. 9211–9219.
- Zhang, M.; Chen, Y. Link prediction based on graph neural networks. Advances in neural information processing systems 2018, 31. [Google Scholar]
- Errica, F.; Podda, M.; Bacciu, D.; Micheli, A. A fair comparison of graph neural networks for graph classification. Proceedings of the 8th International Conference on Learning Representations (ICLR), 2020.
- Chen, J.; Ma, T.; Xiao, C. FastGCN: Fast Learning with Graph Convolutional Networks via Importance Sampling. International Conference on Learning Representations, 2018.
- Benamira, A.; Devillers, B.; Lesot, E.; Ray, A.K.; Saadi, M.; Malliaros, F.D. Semi-supervised learning and graph neural networks for fake news detection. Proceedings of the 2019 IEEE/ACM International Conference on Advances in Social Networks Analysis and Mining, 2019, pp. 568–569.
- Kipf, T.N.; Welling, M. Semi-Supervised Classification with Graph Convolutional Networks. International Conference on Learning Representations, 2017.
- Pan, S.; Hu, R.; Long, G.; Jiang, J.; Yao, L.; Zhang, C. Adversarially Regularized Graph Autoencoder for Graph Embedding. IJCAI, 2018, pp. 2609–2615.
- Zhang, S.; Tong, H.; Xu, J.; Maciejewski, R. Graph convolutional networks: a comprehensive review. Computational Social Networks 2019, 6, 11. [Google Scholar] [CrossRef] [PubMed]
- Shuman, D.I.; Narang, S.K.; Frossard, P.; Ortega, A.; Vandergheynst, P. The emerging field of signal processing on graphs: Extending high-dimensional data analysis to networks and other irregular domains. IEEE signal processing magazine 2013, 30, 83–98. [Google Scholar] [CrossRef]
- Ortega, A.; Frossard, P.; Kovačević, J.; Moura, J.M.; Vandergheynst, P. Graph signal processing: Overview, challenges, and applications. Proceedings of the IEEE 2018, 106, 808–828. [Google Scholar] [CrossRef]
- Chen, S.; Varma, R.; Sandryhaila, A.; Kovačević, J. Discrete Signal Processing on Graphs: Sampling Theory. IEEE Transactions on Signal Processing 2015, 63, 6510–6523. [Google Scholar] [CrossRef]
- Bruna, J.; Zaremba, W.; Szlam, A.; Lecun, Y. Spectral networks and locally connected networks on graphs. International Conference on Learning Representations (ICLR2014), CBLS, April 2014. 2014. [Google Scholar]
- Henaff, M.; Bruna, J.; LeCun, Y. Deep Convolutional Networks on Graph-Structured Data. CoRR, 2015; arXiv:1506.05163. [Google Scholar]
- Defferrard, M.; Bresson, X.; Vandergheynst, P. Convolutional neural networks on graphs with fast localized spectral filtering. Advances in neural information processing systems 2016, 29. [Google Scholar]
- Levie, R.; Monti, F.; Bresson, X.; Bronstein, M.M. CayleyNets: Graph Convolutional Neural Networks With Complex Rational Spectral Filters. IEEE Transactions on Signal Processing 2019, 67, 97–109. [Google Scholar] [CrossRef]
- Li, R.; Wang, S.; Zhu, F.; Huang, J. Adaptive graph convolutional neural networks. Proceedings of the AAAI conference on artificial intelligence, 2018, Vol. 32.
- Zhuang, C.; Ma, Q. Dual graph convolutional networks for graph-based semi-supervised classification. Proceedings of the 2018 world wide web conference, 2018, pp. 499–508.
- Chauhan, R.; Ghanshala, K.K.; Joshi, R. Convolutional neural network (CNN) for image detection and recognition. 2018 first international conference on secure cyber computing and communication (ICSCCC). IEEE, 2018, pp. 278–282.
- Hamilton, W.; Ying, Z.; Leskovec, J. Inductive Representation Learning on Large Graphs. Advances in Neural Information Processing Systems; Guyon, I.; Luxburg, U.V.; Bengio, S.; Wallach, H.; Fergus, R.; Vishwanathan, S.; Garnett, R., Eds. Curran Associates, Inc., 2017, Vol. 30.
- Ying, R.; He, R.; Chen, K.; Eksombatchai, P.; Hamilton, W.L.; Leskovec, J. Graph convolutional neural networks for web-scale recommender systems. Proceedings of the 24th ACM SIGKDD international conference on knowledge discovery & data mining, 2018, pp. 974–983.
- Chen, J.; Zhu, J.; Song, L. Stochastic Training of Graph Convolutional Networks with Variance Reduction. International Conference on Machine Learning, 2018, pp. 941–949.
- Huang, W.; Zhang, T.; Rong, Y.; Huang, J. Adaptive sampling towards fast graph representation learning. Advances in neural information processing systems 2018, 31. [Google Scholar]
- Veličković, P.; Cucurull, G.; Casanova, A.; Romero, A.; Liò, P.; Bengio, Y. Graph Attention Networks. International Conference on Learning Representations 2018. [Google Scholar]
- Zhang, J.; Shi, X.; Xie, J.; Ma, H.; King, I.; Yeung, D. GaAN: Gated Attention Networks for Learning on Large and Spatiotemporal Graphs. Proceedings of the Thirty-Fourth Conference on Uncertainty in Artificial Intelligence, 2018, pp. 339–349.
- Xu, K.; Hu, W.; Leskovec, J.; Jegelka, S. How Powerful are Graph Neural Networks? International Conference on Learning Representations, 2019.
- Atwood, J.; Towsley, D. Diffusion-convolutional neural networks. Advances in neural information processing systems 2016, 29. [Google Scholar]
- Gao, H.; Wang, Z.; Ji, S. Large-scale learnable graph convolutional networks. Proceedings of the 24th ACM SIGKDD international conference on knowledge discovery & data mining, 2018, pp. 1416–1424.
- Guidotti, R.; Monreale, A.; Ruggieri, S.; Turini, F.; Giannotti, F.; Pedreschi, D. A Survey of Methods for Explaining Black Box Models. ACM Comput. Surv. 2018, 51. [Google Scholar] [CrossRef]
- Ribeiro, M.T.; Singh, S.; Guestrin, C. " Why should i trust you?" Explaining the predictions of any classifier. Proceedings of the 22nd ACM SIGKDD international conference on knowledge discovery and data mining, 2016, pp. 1135–1144.
- Lundberg, S.M.; Lee, S.I. A unified approach to interpreting model predictions. Advances in neural information processing systems 2017, 30. [Google Scholar]
- Chen, J.; Song, L.; Wainwright, M.; Jordan, M. Learning to explain: An information-theoretic perspective on model interpretation. International Conference on Machine Learning. PMLR, 2018, pp. 883–892.
- Yuan, H.; Yu, H.; Gui, S.; Ji, S. Explainability in Graph Neural Networks: A Taxonomic Survey. IEEE Transactions on Pattern Analysis & Machine Intelligence 2023, 45, 5782–5799. [Google Scholar] [CrossRef]
- Agarwal, C.; Queen, O.; Lakkaraju, H.; Zitnik, M. Evaluating explainability for graph neural networks. Scientific Data 2023, 10, 144. [Google Scholar] [CrossRef]
- Pope, P.E.; Kolouri, S.; Rostami, M.; Martin, C.E.; Hoffmann, H. Explainability methods for graph convolutional neural networks. Proceedings of the IEEE/CVF conference on computer vision and pattern recognition, 2019, pp. 10772–10781.
- Warmsley, D.; Waagen, A.; Xu, J.; Liu, Z.; Tong, H. A Survey of Explainable Graph Neural Networks for Cyber Malware Analysis. 2022 IEEE International Conference on Big Data (Big Data), 2022, pp. 2932–2939. [CrossRef]
- Ying, Z.; Bourgeois, D.; You, J.; Zitnik, M.; Leskovec, J. Gnnexplainer: Generating explanations for graph neural networks. Advances in neural information processing systems 2019, 32. [Google Scholar]
- Luo, D.; Cheng, W.; Xu, D.; Yu, W.; Zong, B.; Chen, H.; Zhang, X. Parameterized explainer for graph neural network. Advances in neural information processing systems 2020, 33, 19620–19631. [Google Scholar]
- Funke, T.; Khosla, M.; Anand, A. Hard Masking for Explaining Graph Neural Networks, 2021.
- Schlichtkrull, M.S.; Cao, N.D.; Titov, I. Interpreting Graph Neural Networks for {NLP} With Differentiable Edge Masking. International Conference on Learning Representations, 2021.
- Huang, Q.; Yamada, M.; Tian, Y.; Singh, D.; Chang, Y. Graphlime: Local interpretable model explanations for graph neural networks. IEEE Transactions on Knowledge and Data Engineering 2022. [Google Scholar] [CrossRef]
- Zhang, Y.; Defazio, D.; Ramesh, A. Relex: A model-agnostic relational model explainer. Proceedings of the 2021 AAAI/ACM Conference on AI, Ethics, and Society, 2021, pp. 1042–1049.
- Vu, M.; Thai, M.T. Pgm-explainer: Probabilistic graphical model explanations for graph neural networks. Advances in neural information processing systems 2020, 33, 12225–12235. [Google Scholar]
- Schwarzenberg, R.; Hübner, M.; Harbecke, D.; Alt, C.; Hennig, L. Layerwise Relevance Visualization in Convolutional Text Graph Classifiers. Proceedings of the Thirteenth Workshop on Graph-Based Methods for Natural Language Processing (TextGraphs-13); Association for Computational Linguistics: Hong Kong, 2019; pp. 58–62. [Google Scholar] [CrossRef]
- Schnake, T.; Eberle, O.; Lederer, J.; Nakajima, S.; Schütt, K.T.; Müller, K.R.; Montavon, G. Higher-order explanations of graph neural networks via relevant walks. IEEE transactions on pattern analysis and machine intelligence 2021, 44, 7581–7596. [Google Scholar] [CrossRef]
- Yuan, H.; Tang, J.; Hu, X.; Ji, S. Xgnn: Towards model-level explanations of graph neural networks. Proceedings of the 26th ACM SIGKDD International Conference on Knowledge Discovery & Data Mining, 2020, pp. 430–438.
- Lv, G.; Chen, L.; Cao, C.C. On Glocal Explainability of Graph Neural Networks. Database Systems for Advanced Applications; Bhattacharya, A., Lee Mong Li, J., Agrawal, D., Reddy, P.K., Mohania, M., Mondal, A., Goyal, V., Uday Kiran, R., Eds.; Springer International Publishing: Cham, 2022; pp. 648–664. [Google Scholar]
- Lundberg, S.M.; Erion, G.; Chen, H.; DeGrave, A.; Prutkin, J.M.; Nair, B.; Katz, R.; Himmelfarb, J.; Bansal, N.; Lee, S.I. From local explanations to global understanding with explainable AI for trees. Nature Machine Intelligence 2020, 2, 56–67. [Google Scholar] [CrossRef] [PubMed]
- Longa, A.; Azzolin, S.; Santin, G.; Cencetti, G.; Liò, P.; Lepri, B.; Passerini, A. Explaining the Explainers in Graph Neural Networks: a Comparative Study. arXiv preprint arXiv:2210.15304, arXiv:2210.15304 2022.
- Wang, X.; Shen, H.W. GNNInterpreter: A Probabilistic Generative Model-Level Explanation for Graph Neural Networks. The Eleventh International Conference on Learning Representations, 2023.
- Azzolin, S.; Longa, A.; Barbiero, P.; Lio, P.; Passerini, A. Global Explainability of GNNs via Logic Combination of Learned Concepts. The Eleventh International Conference on Learning Representations, 2023.
- Kosan, M.; Huang, Z.; Medya, S.; Ranu, S.; Singh, A. Global Counterfactual Explainer for Graph Neural Networks. WSDM, 2023.
- Karamanou, A.; Kalampokis, E.; Tarabanis, K. Integrated statistical indicators from Scottish linked open government data. Data in Brief 2023, 46, 108779. [Google Scholar] [CrossRef] [PubMed]
- Kingma, D.; Ba, J. Adam: A Method for Stochastic Optimization. International Conference on Learning Representations 2014. [Google Scholar]
- Liu, X. Spatial and Temporal Dependence in House Price Prediction. The Journal of Real Estate Finance and Economics 2013, 47, 341–369. [Google Scholar] [CrossRef]
- Wu, Z.; Wang, J.; Du, H.; Jiang, D.; Kang, Y.; Li, D.; Pan, P.; Deng, Y.; Cao, D.; Hsieh, C.Y.; Hou, T. Chemistry-intuitive explanation of graph neural networks for molecular property prediction with substructure masking. Nature Communications 2023, 14, 2585. [Google Scholar] [CrossRef]
- Li, M.; Perrier, E.; Xu, C. Deep Hierarchical Graph Convolution for Election Prediction from Geospatial Census Data. Proceedings of the AAAI Conference on Artificial Intelligence 2019, 33, 647–654. [Google Scholar] [CrossRef]
| 1 | |
| 2 | |
| 3 | |
| 4 | |
| 5 | |
| 6 |
Figure 1.
A graph presenting linked statistical indicators from the Scottish data portal. A fragment of the graph will be used to construct the GNNs.
Figure 1.
A graph presenting linked statistical indicators from the Scottish data portal. A fragment of the graph will be used to construct the GNNs.
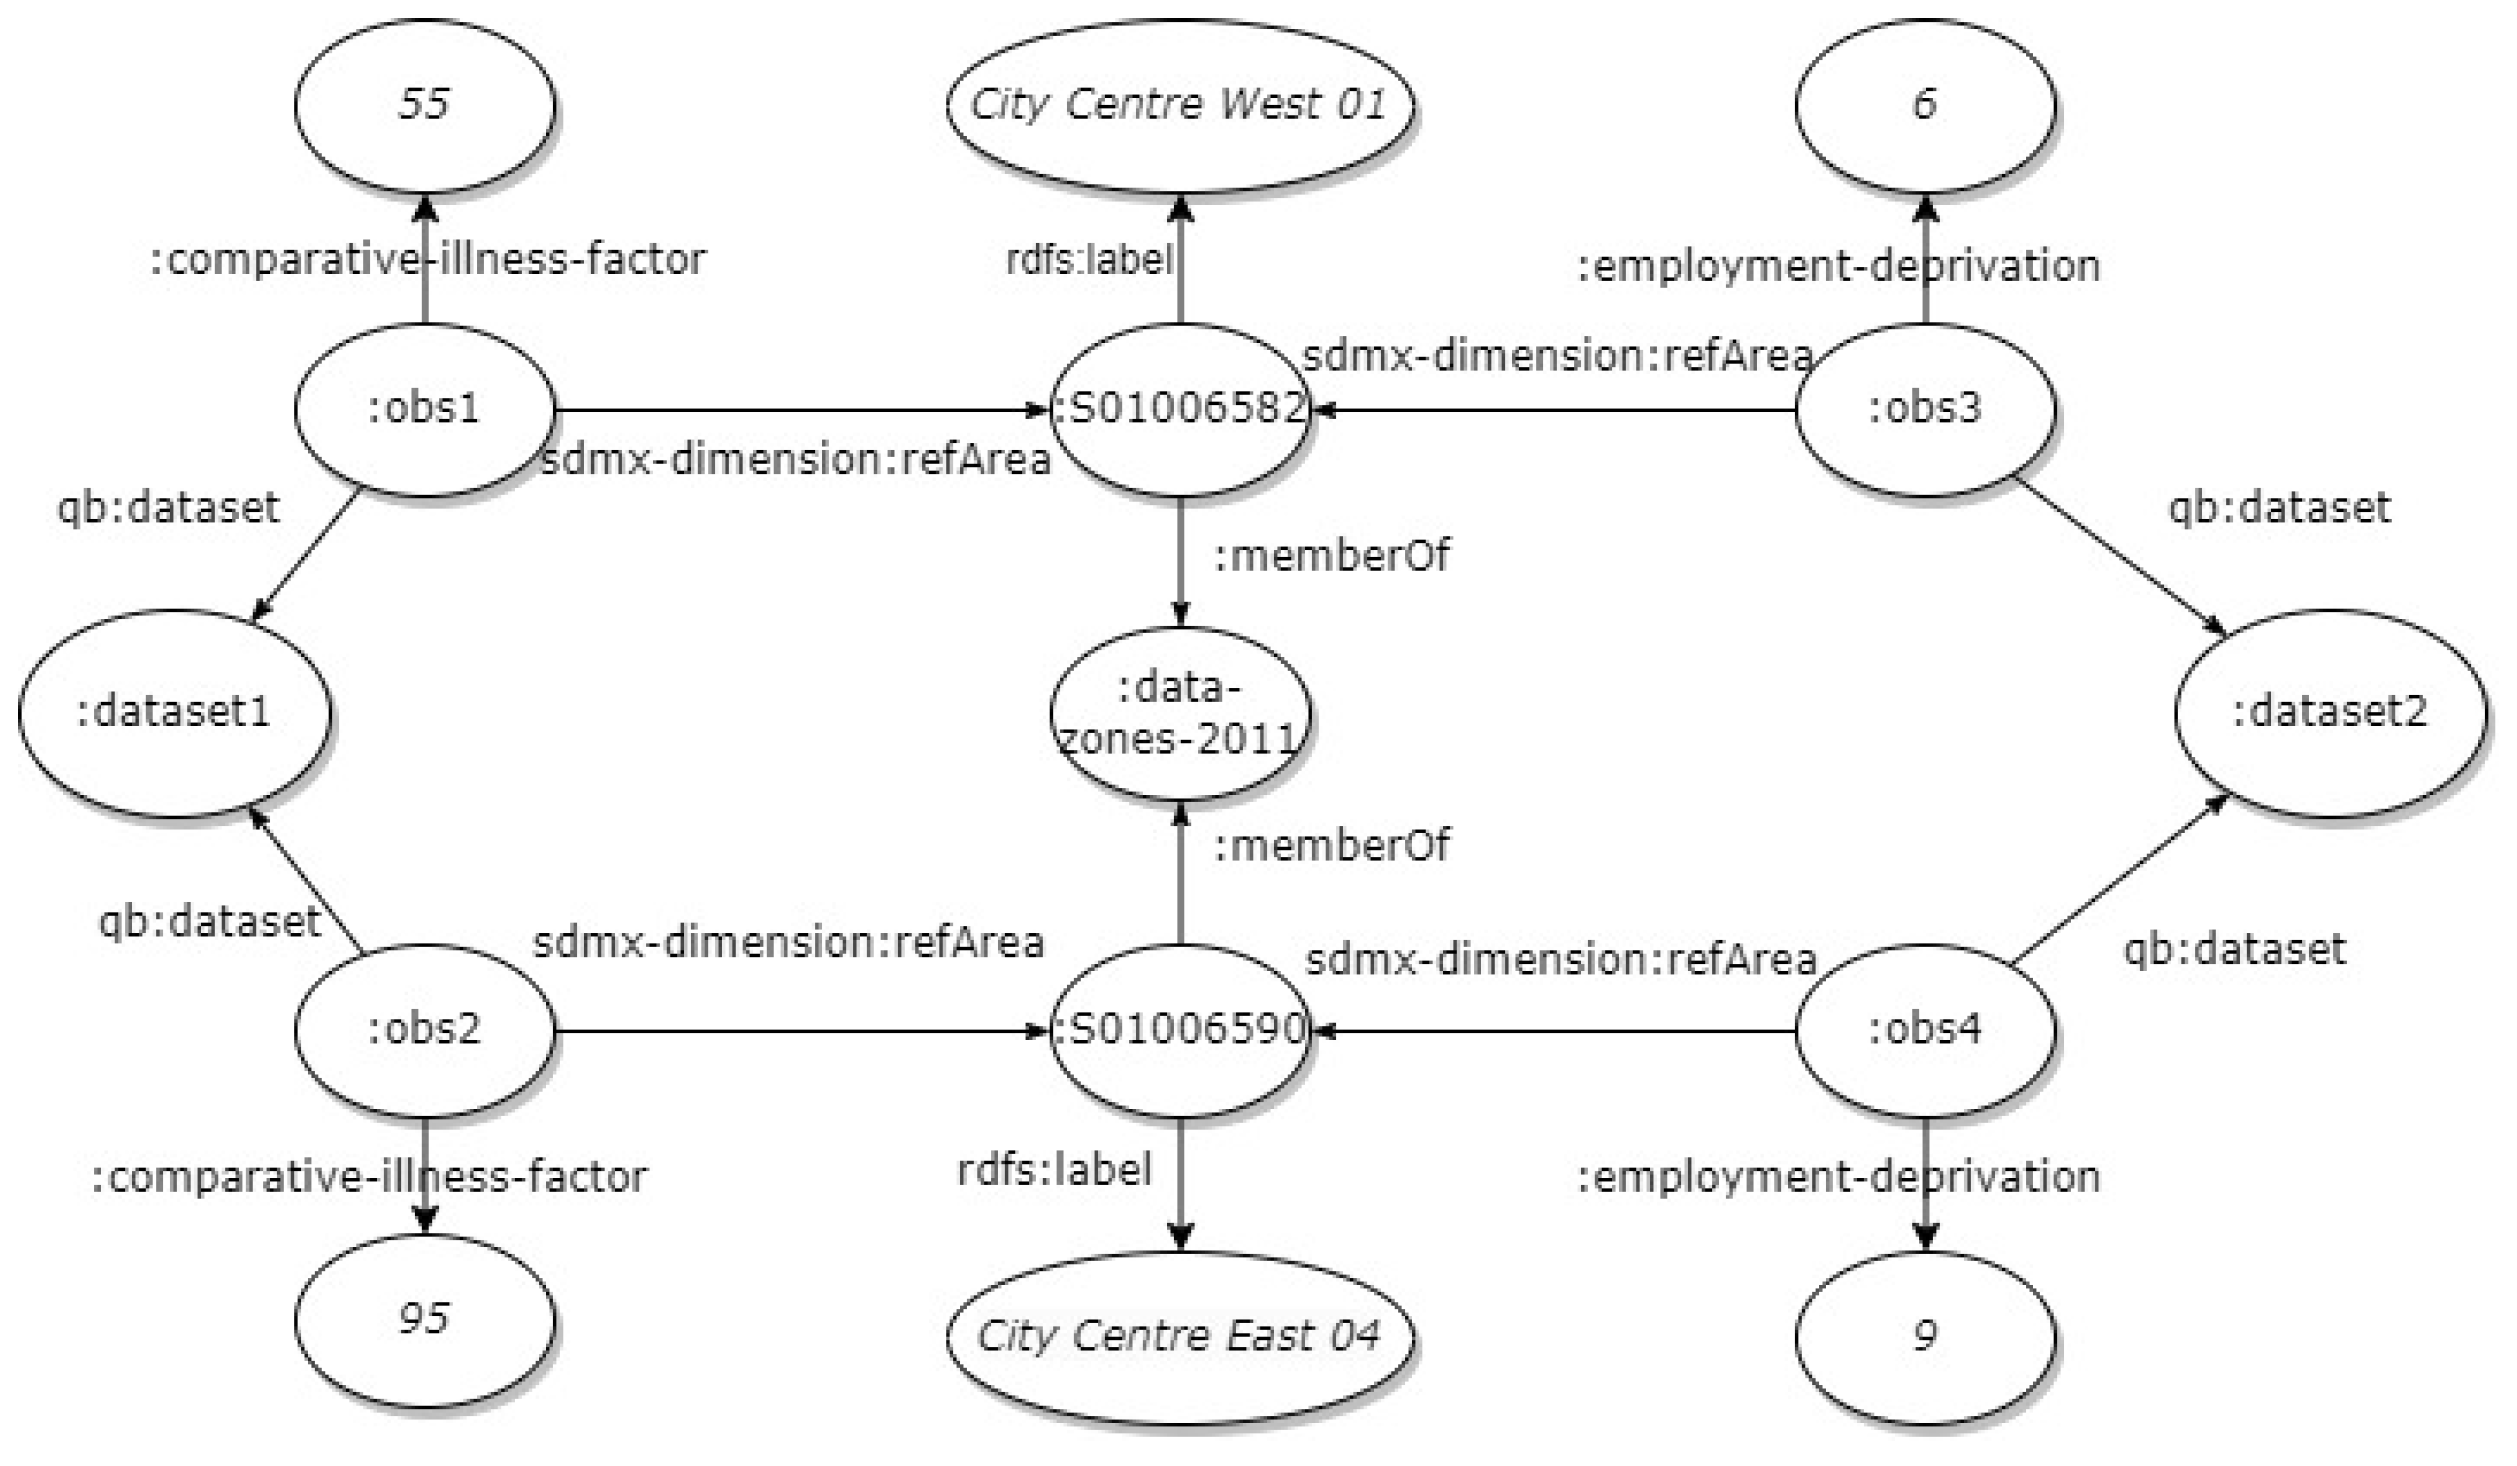
Figure 2.
(a) The nodes of the Scottish linked statistical indicators graph that will be used for constructing the GNNs. (b) Part of the final graph after the transformation of the linked data graph.
Figure 2.
(a) The nodes of the Scottish linked statistical indicators graph that will be used for constructing the GNNs. (b) Part of the final graph after the transformation of the linked data graph.
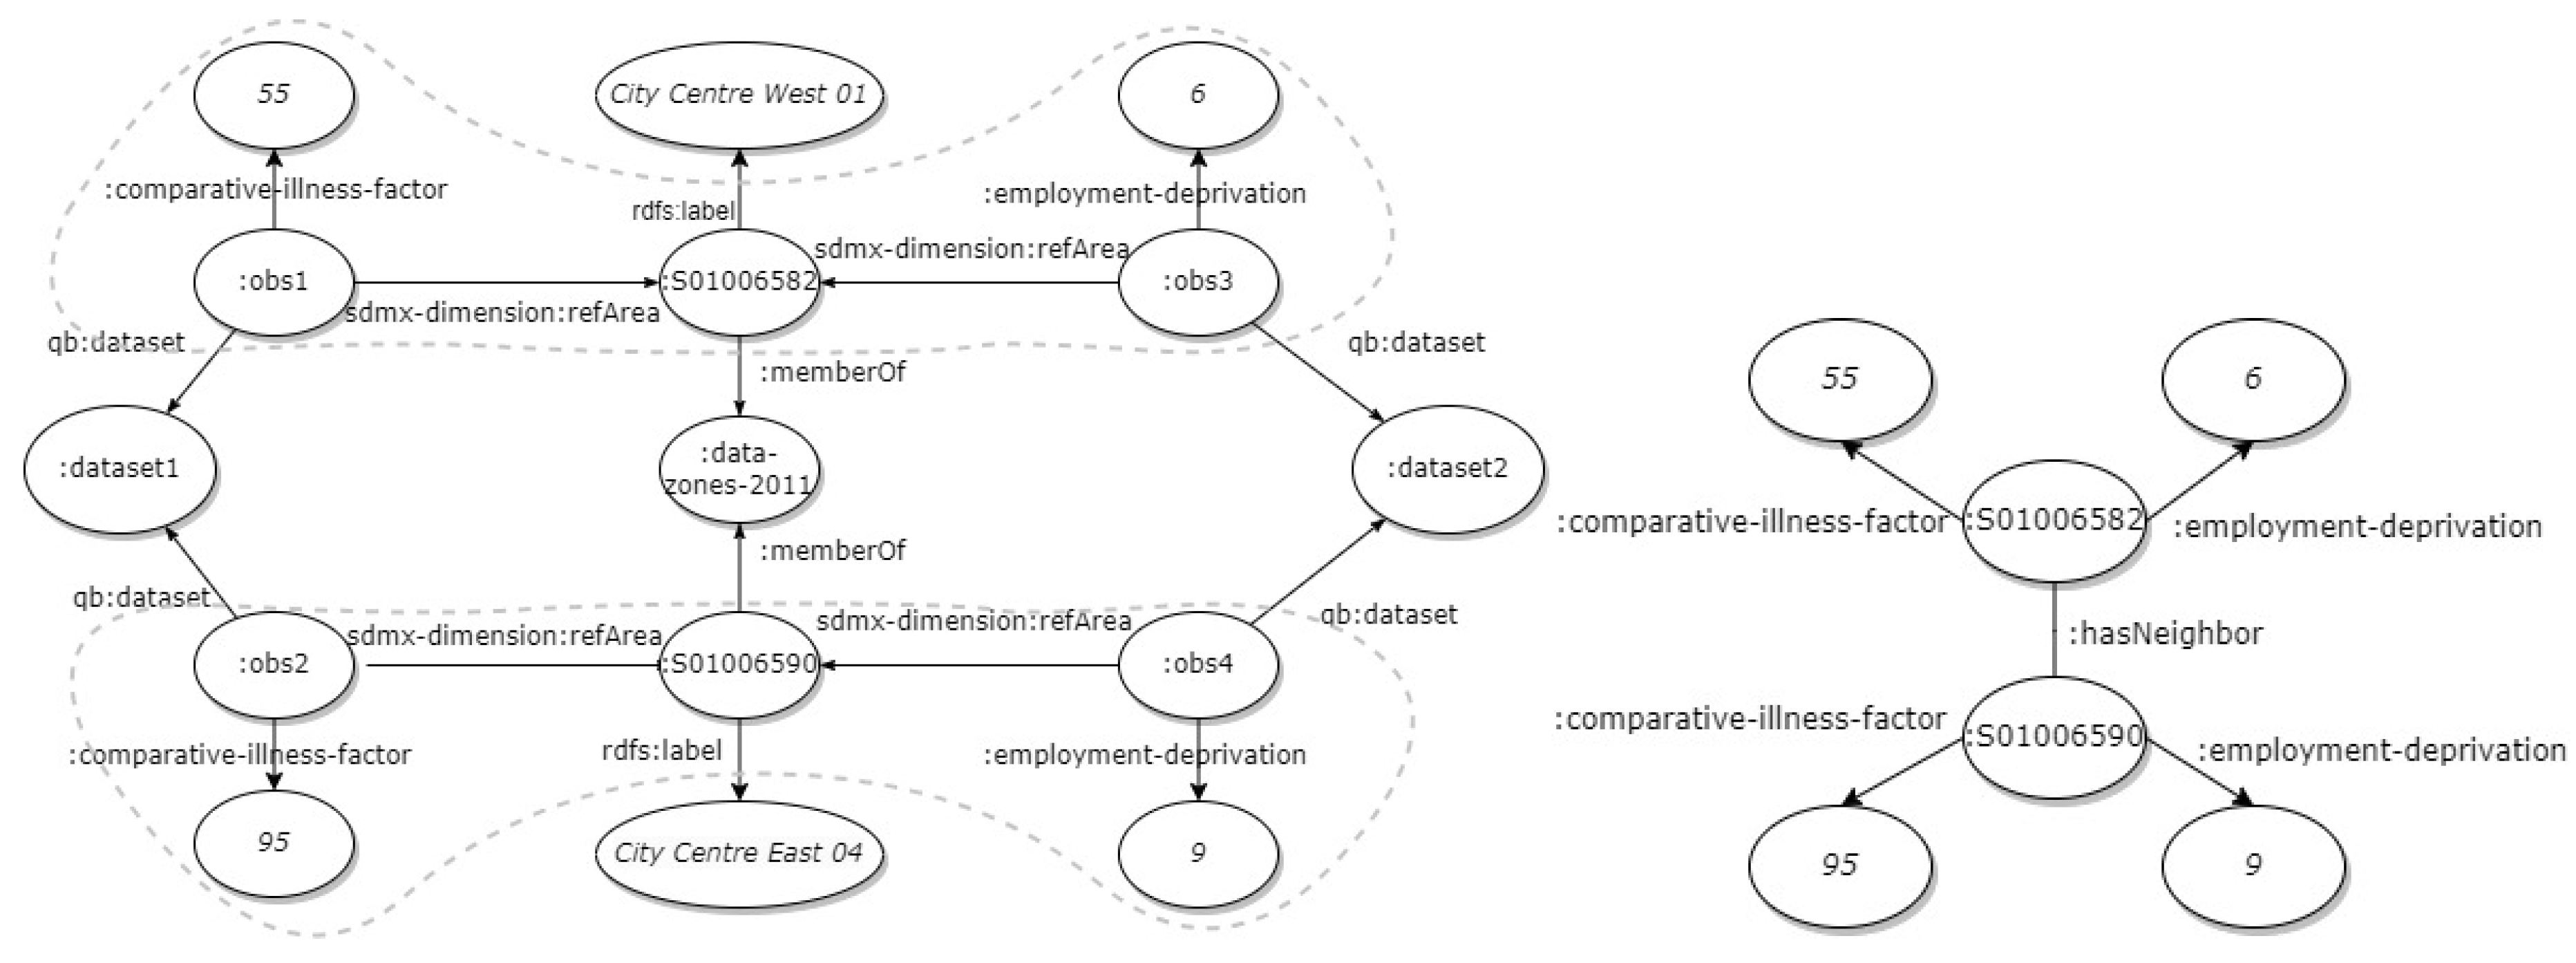
Figure 3.
Visualization of a subset of the final graph that will be utilized for node classification using graph representation learning. Each node corresponds to a data zone and edges connect the centroids of adjacent regions. data zones colored in shades of blue indicate regions with lower mean house prices, while red indicates higher mean house prices.
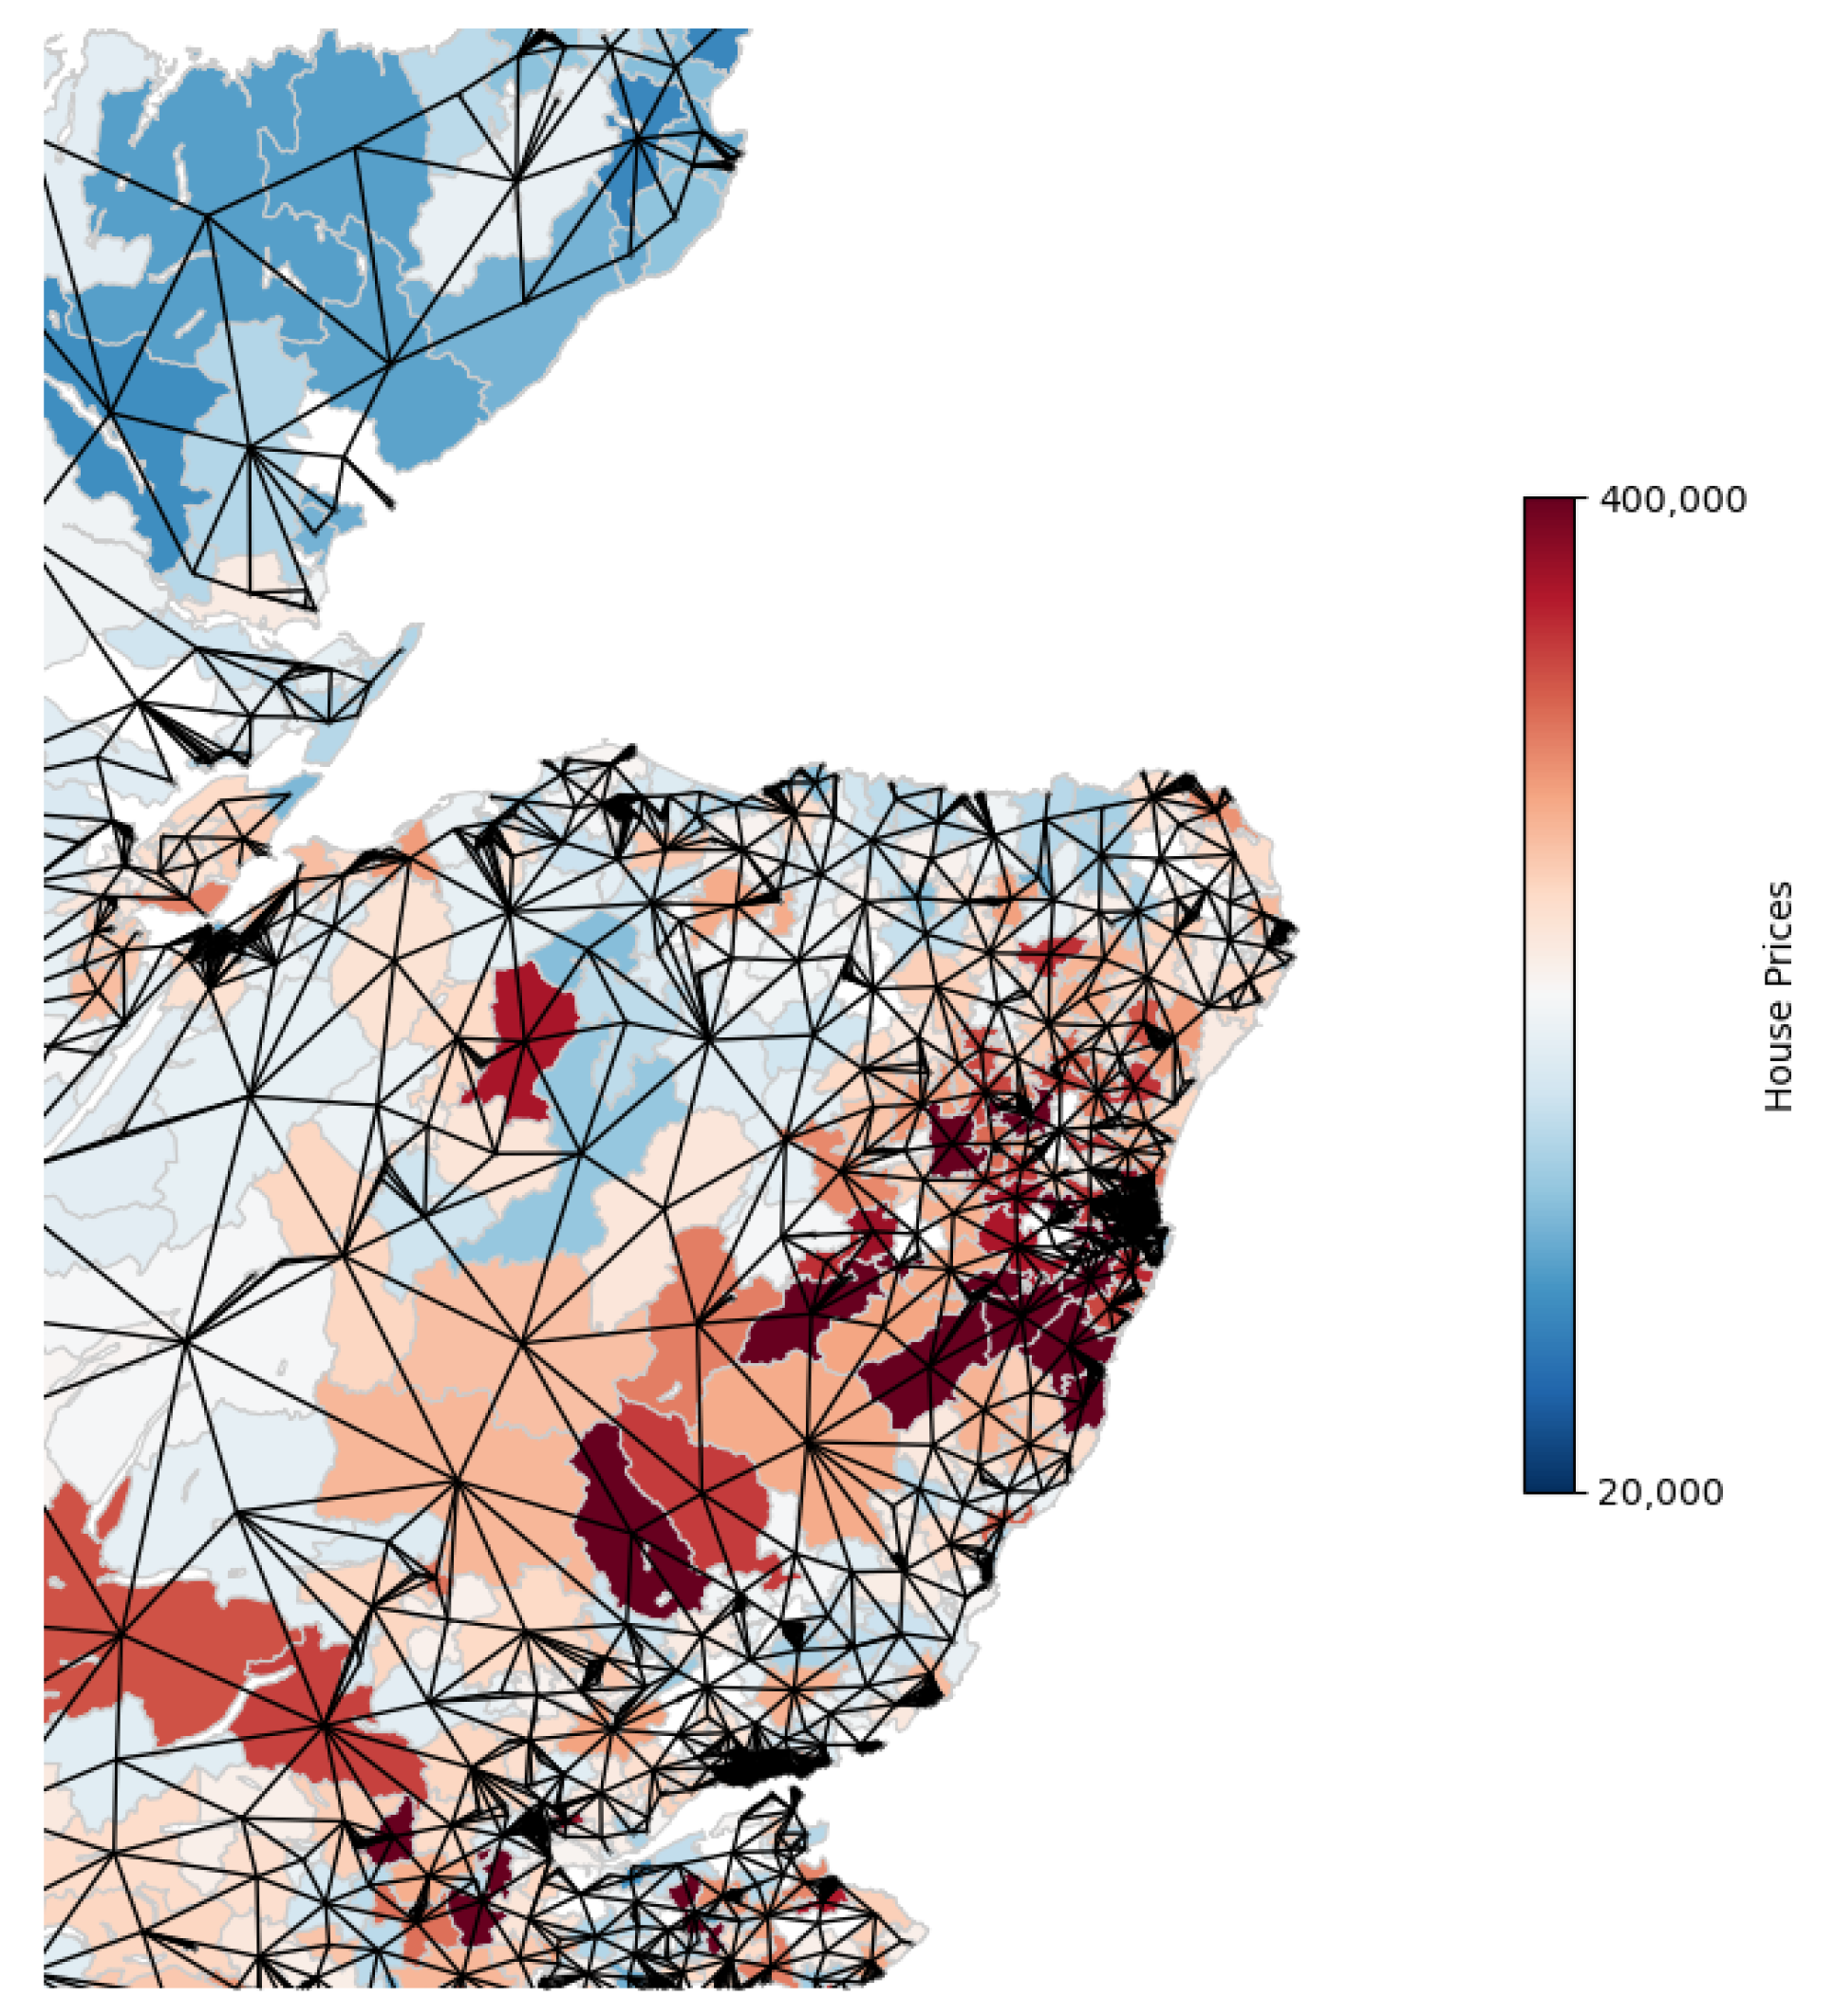
Figure 4.
Learning curves of the three different GNN variants and MLP
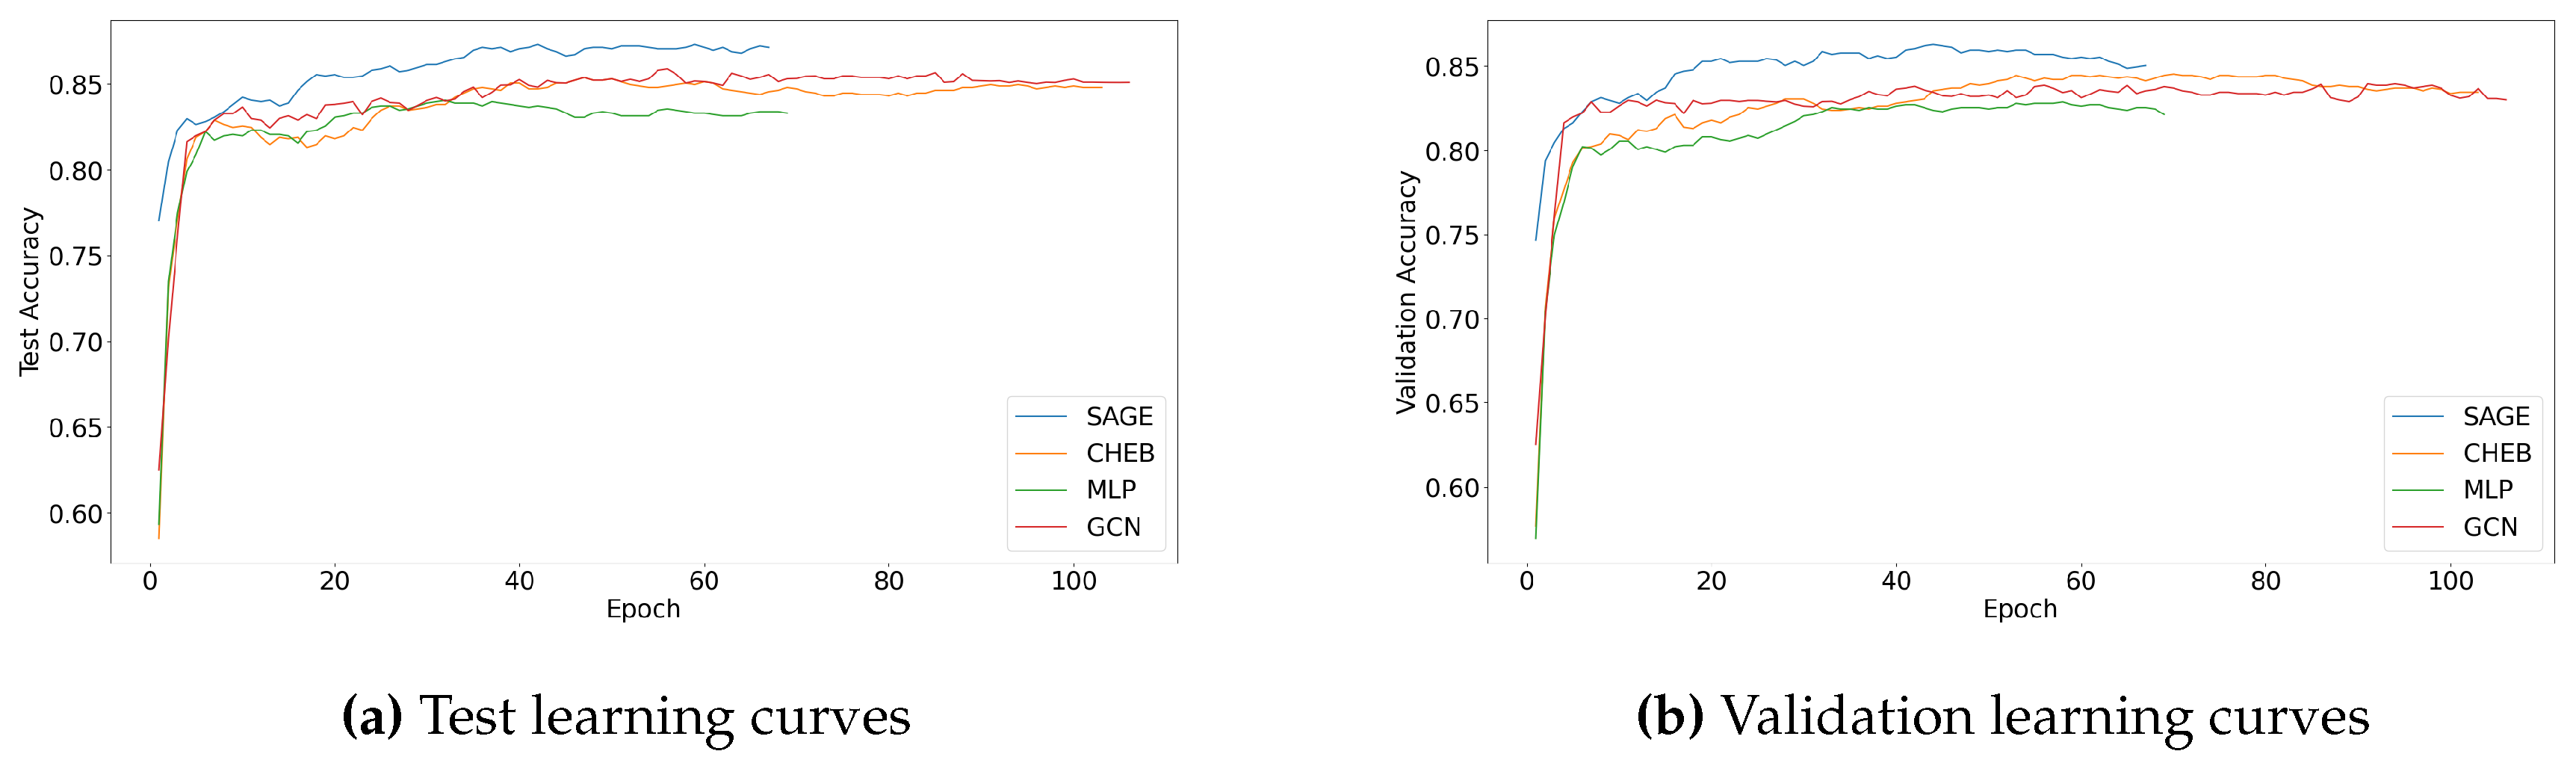
Figure 5.
Visual comparison of the performance metrics Precision, Recall, F1 Score, and Accuracy of the three GNN variants, XGBoost and MLP. The metrics are evaluated separately for the entire dataset (’All’), instances above the mean house prices threshold (’Class 1’), and instances below that threshold (’Class 0’)
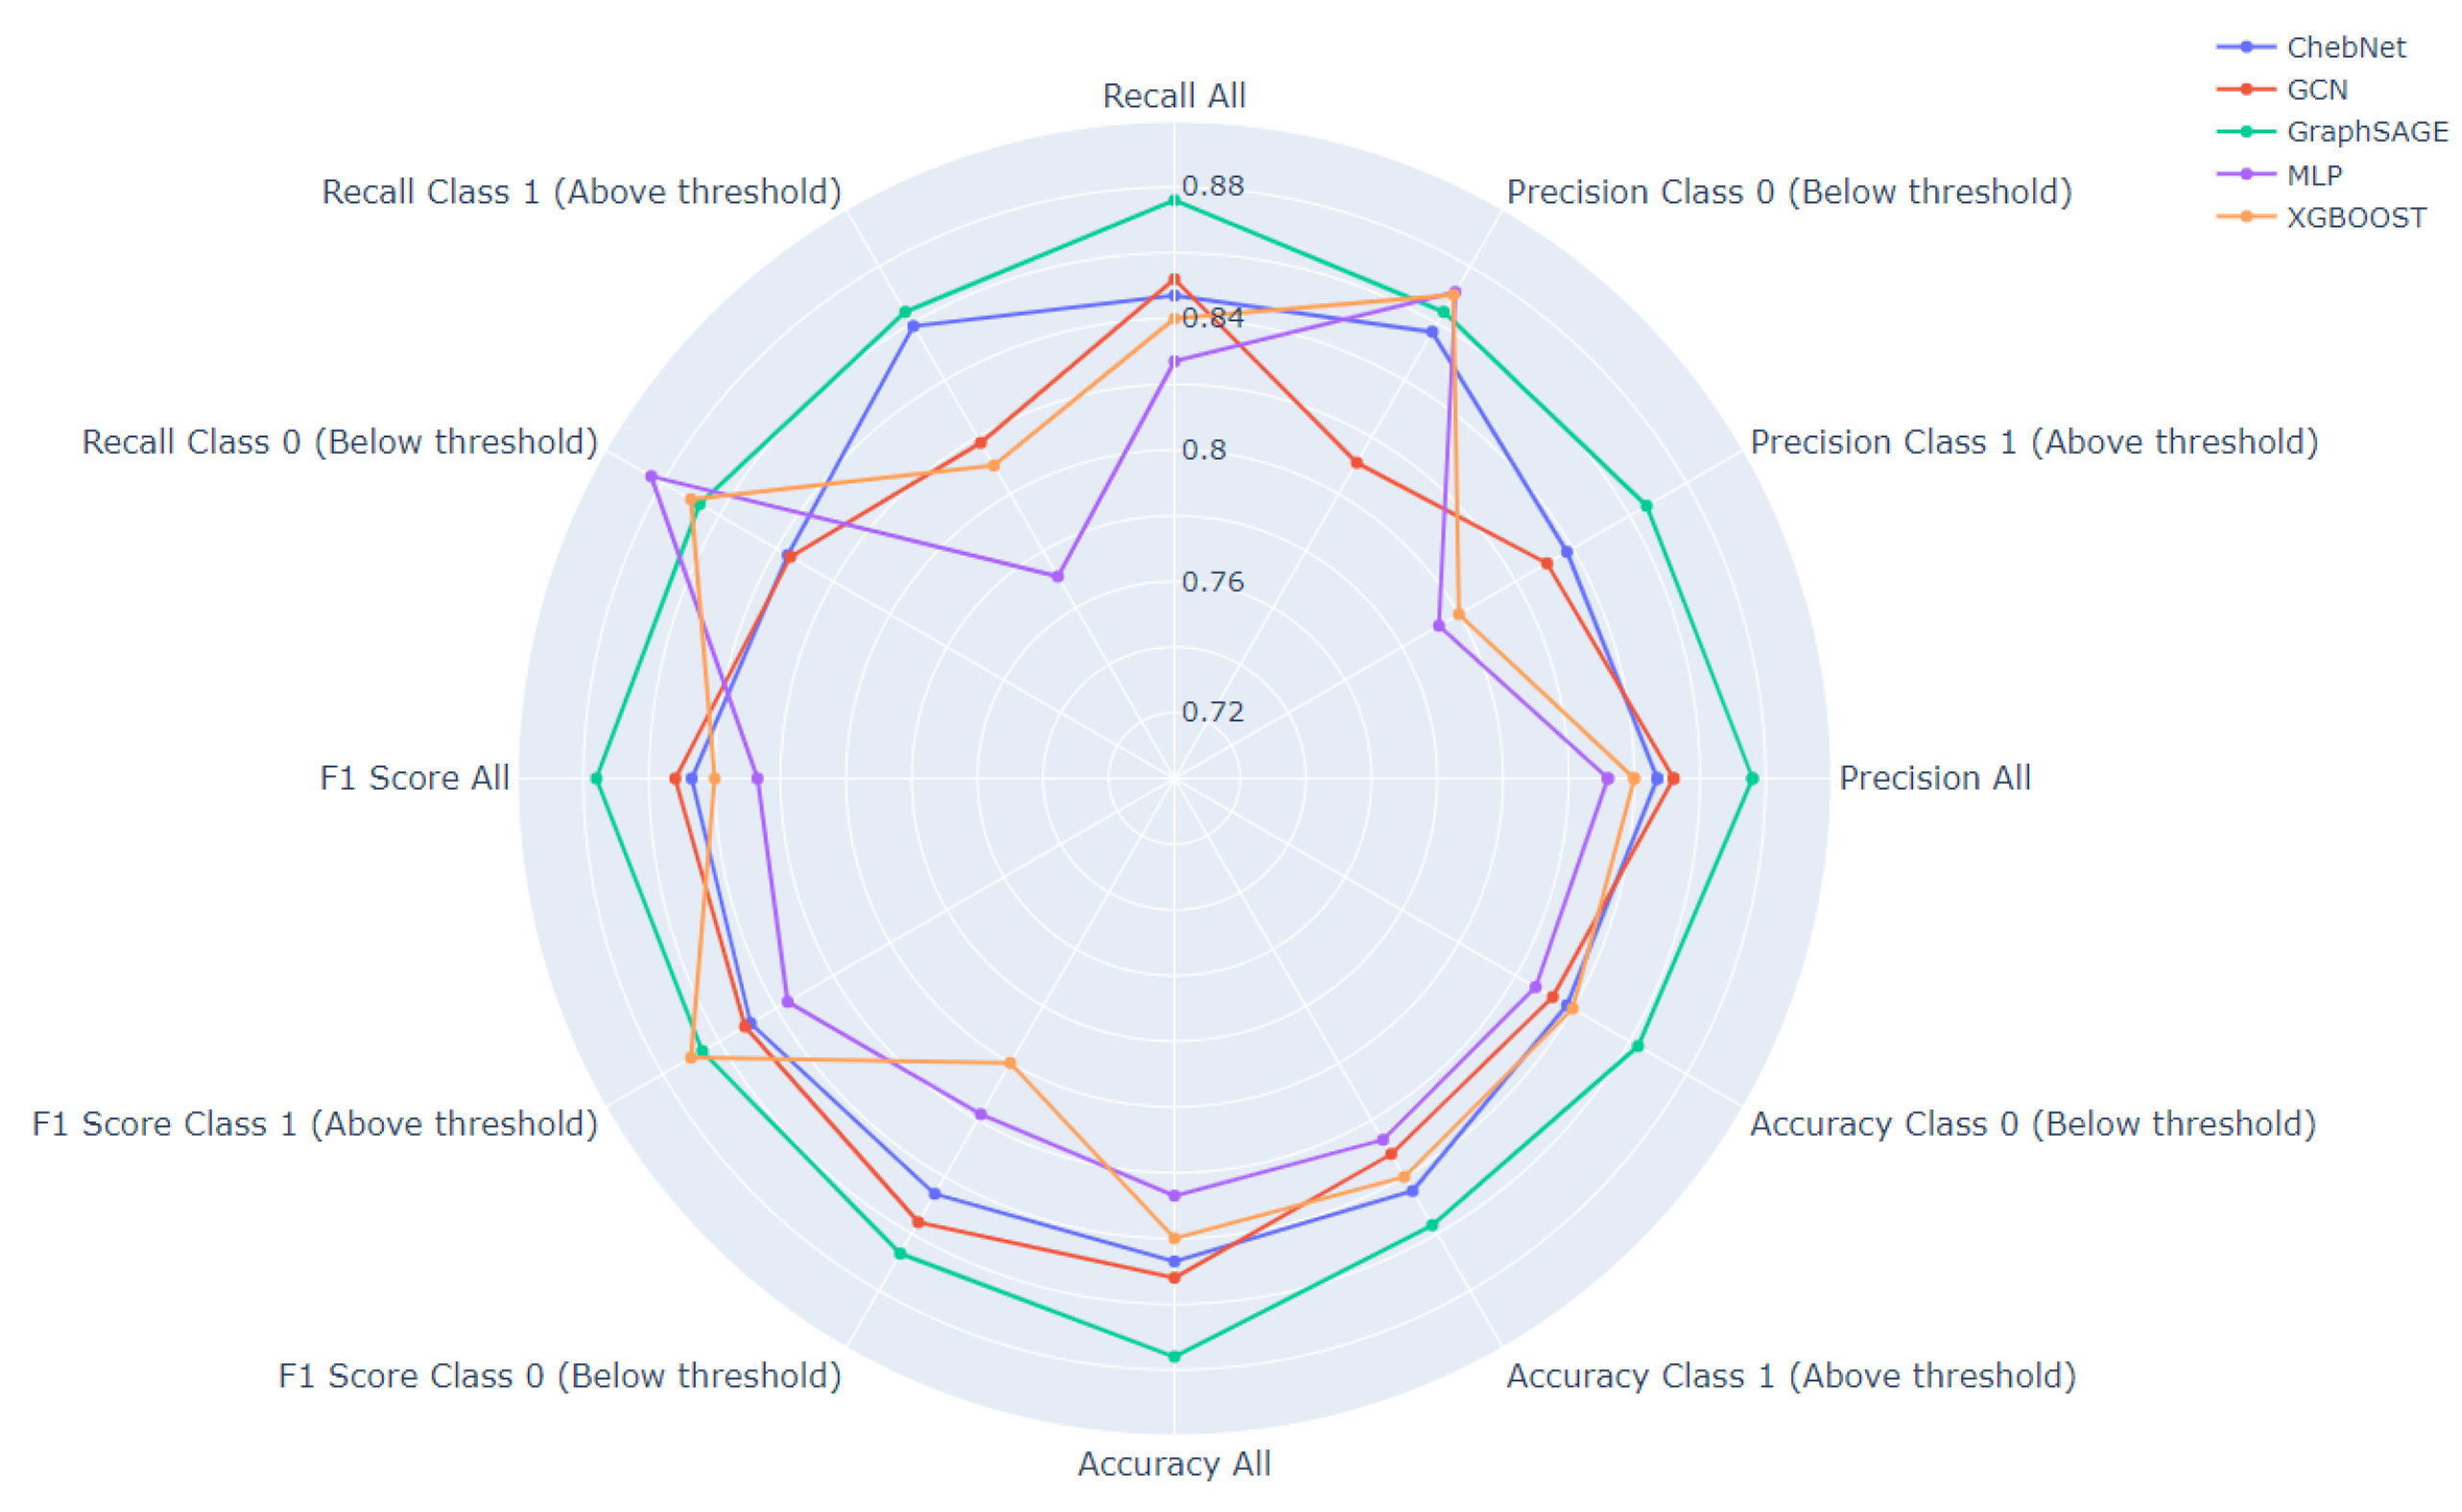
Figure 6.
Global feature importance based on the Logistic Regression surrogate model. Each bar signifies the magnitude of the feature’s coefficient in the logistic regression model, which is interpreted as its importance in the GNN’s predictions.
Figure 6.
Global feature importance based on the Logistic Regression surrogate model. Each bar signifies the magnitude of the feature’s coefficient in the logistic regression model, which is interpreted as its importance in the GNN’s predictions.
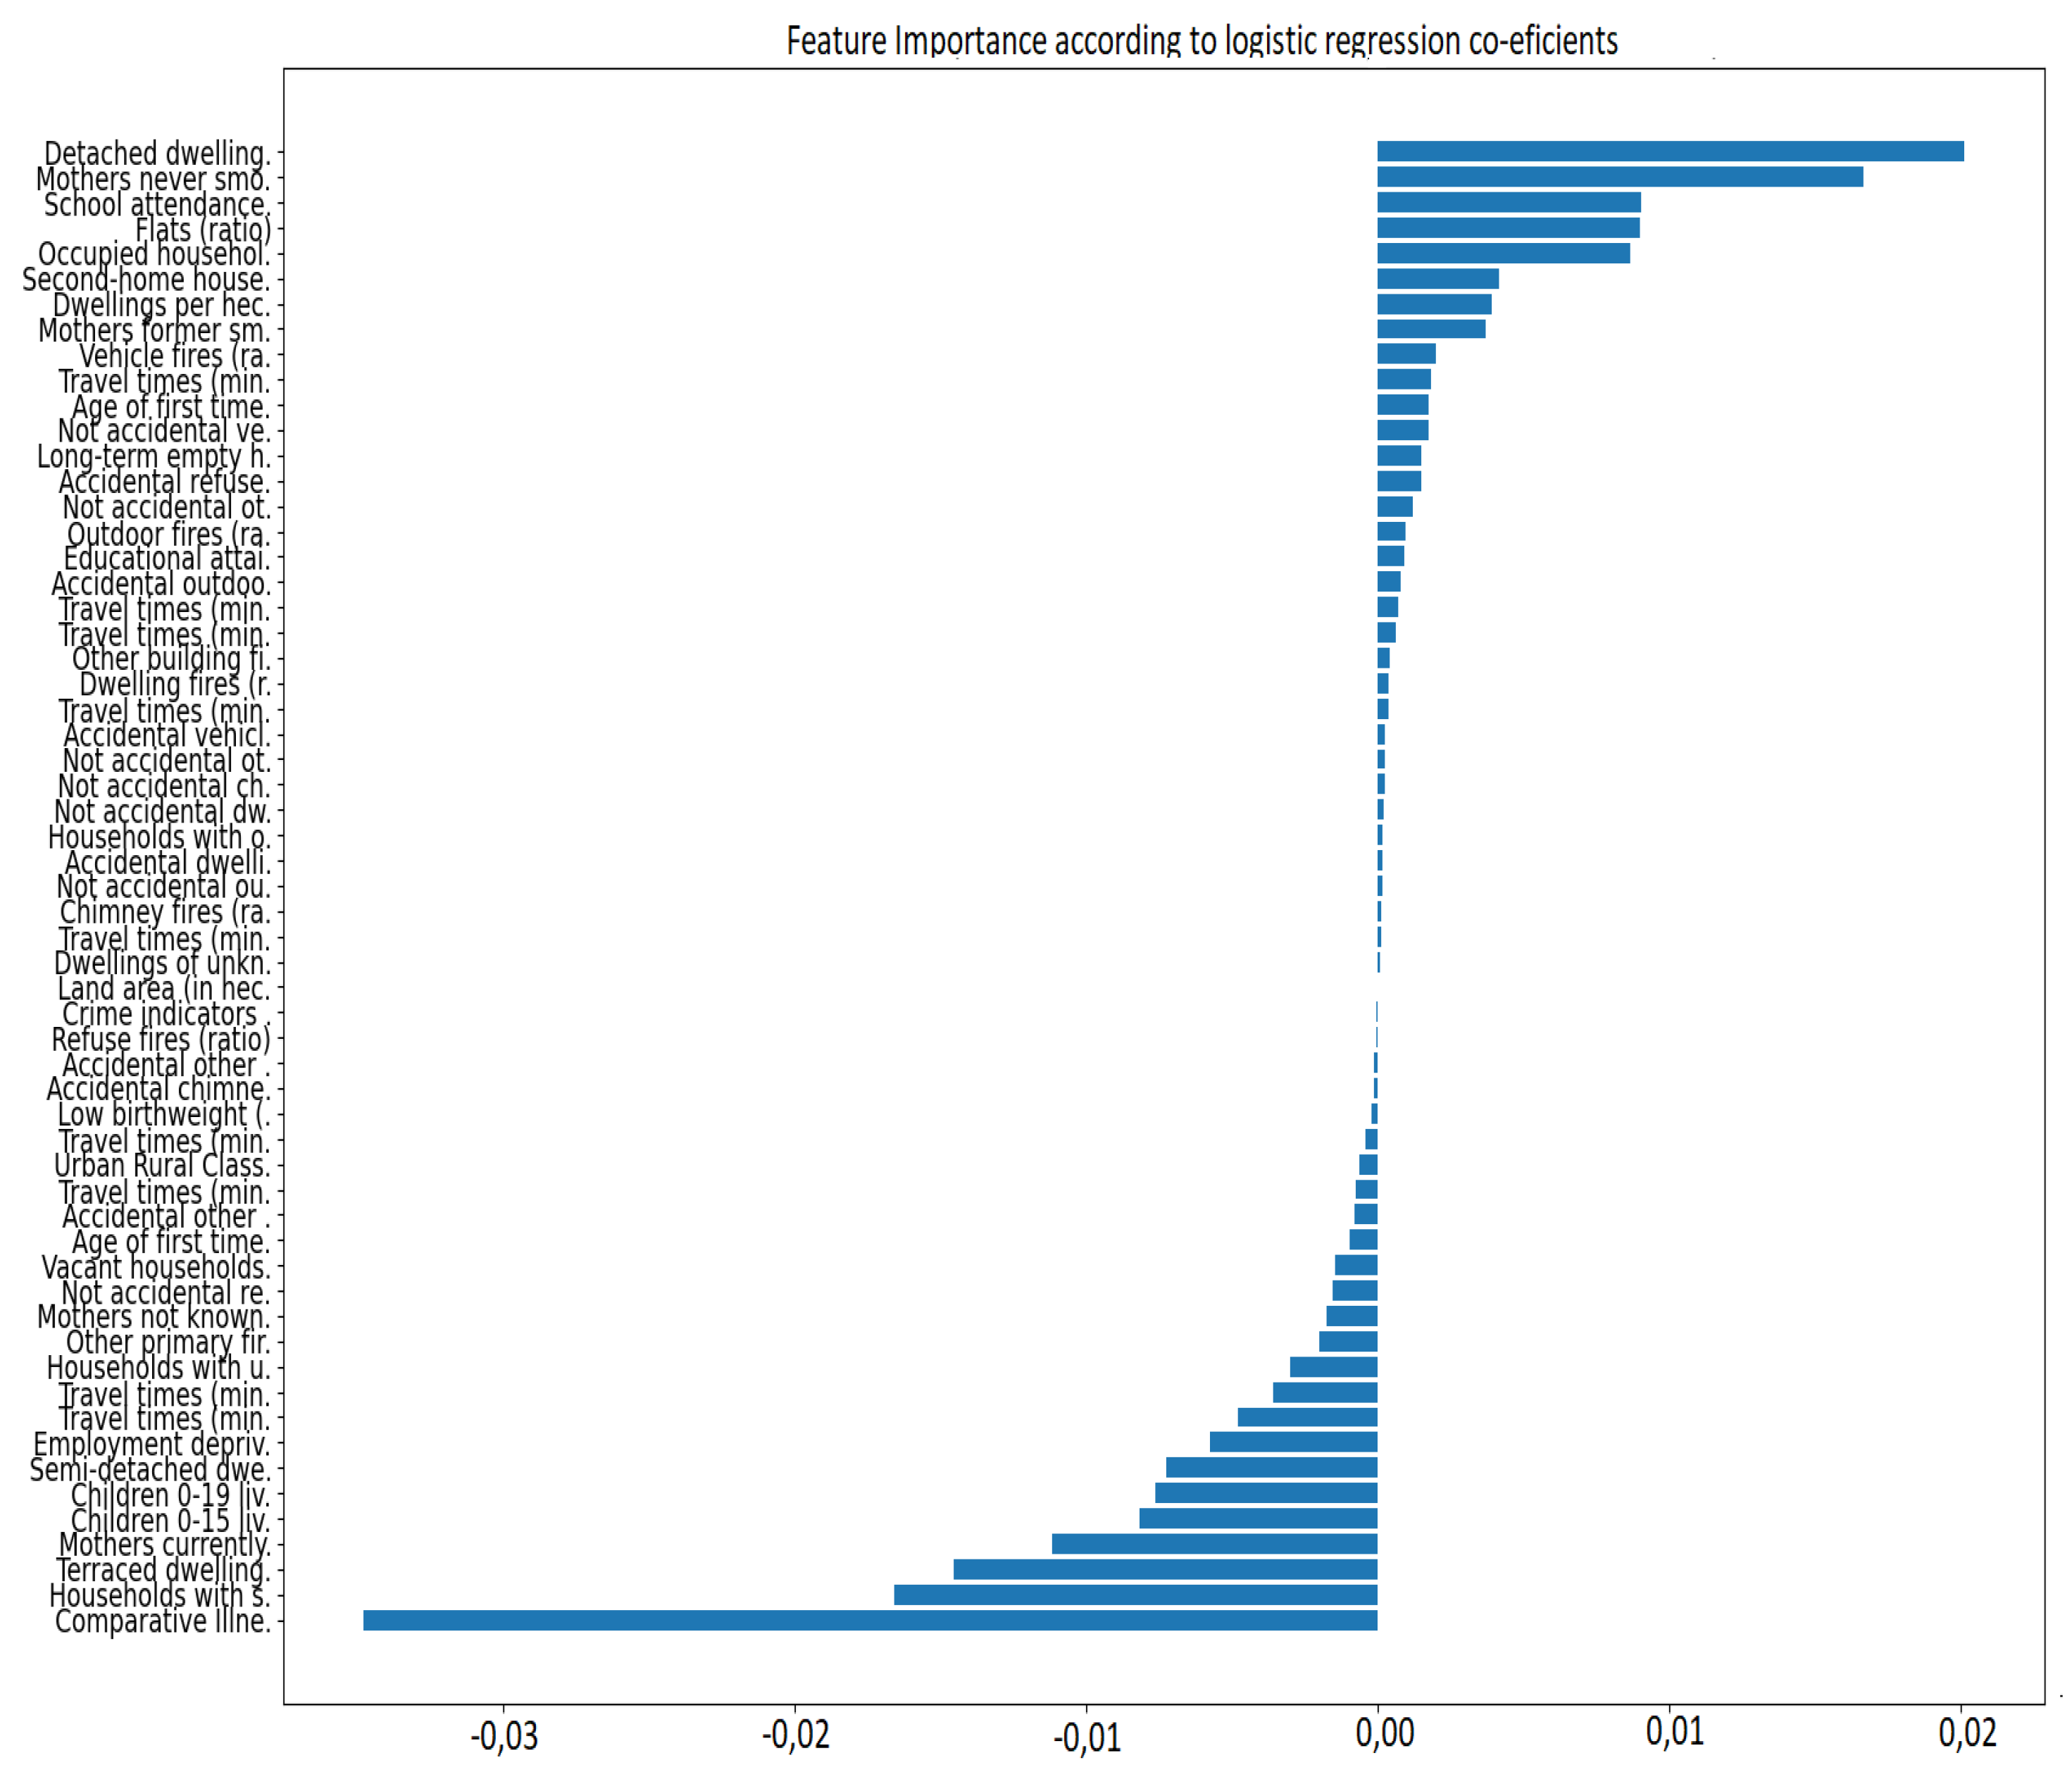
Figure 7.
Visual representation of the explanation subgraph for data zone Summerhill - 01 (S01006553), highlighted in red. Each node in the subgraph is accompanied with with a feature and its importance score, determined as the most influential by GNNExplainer for predicting the class of the target node. The opacity of the edges reflects their respective importance in this prediction process.
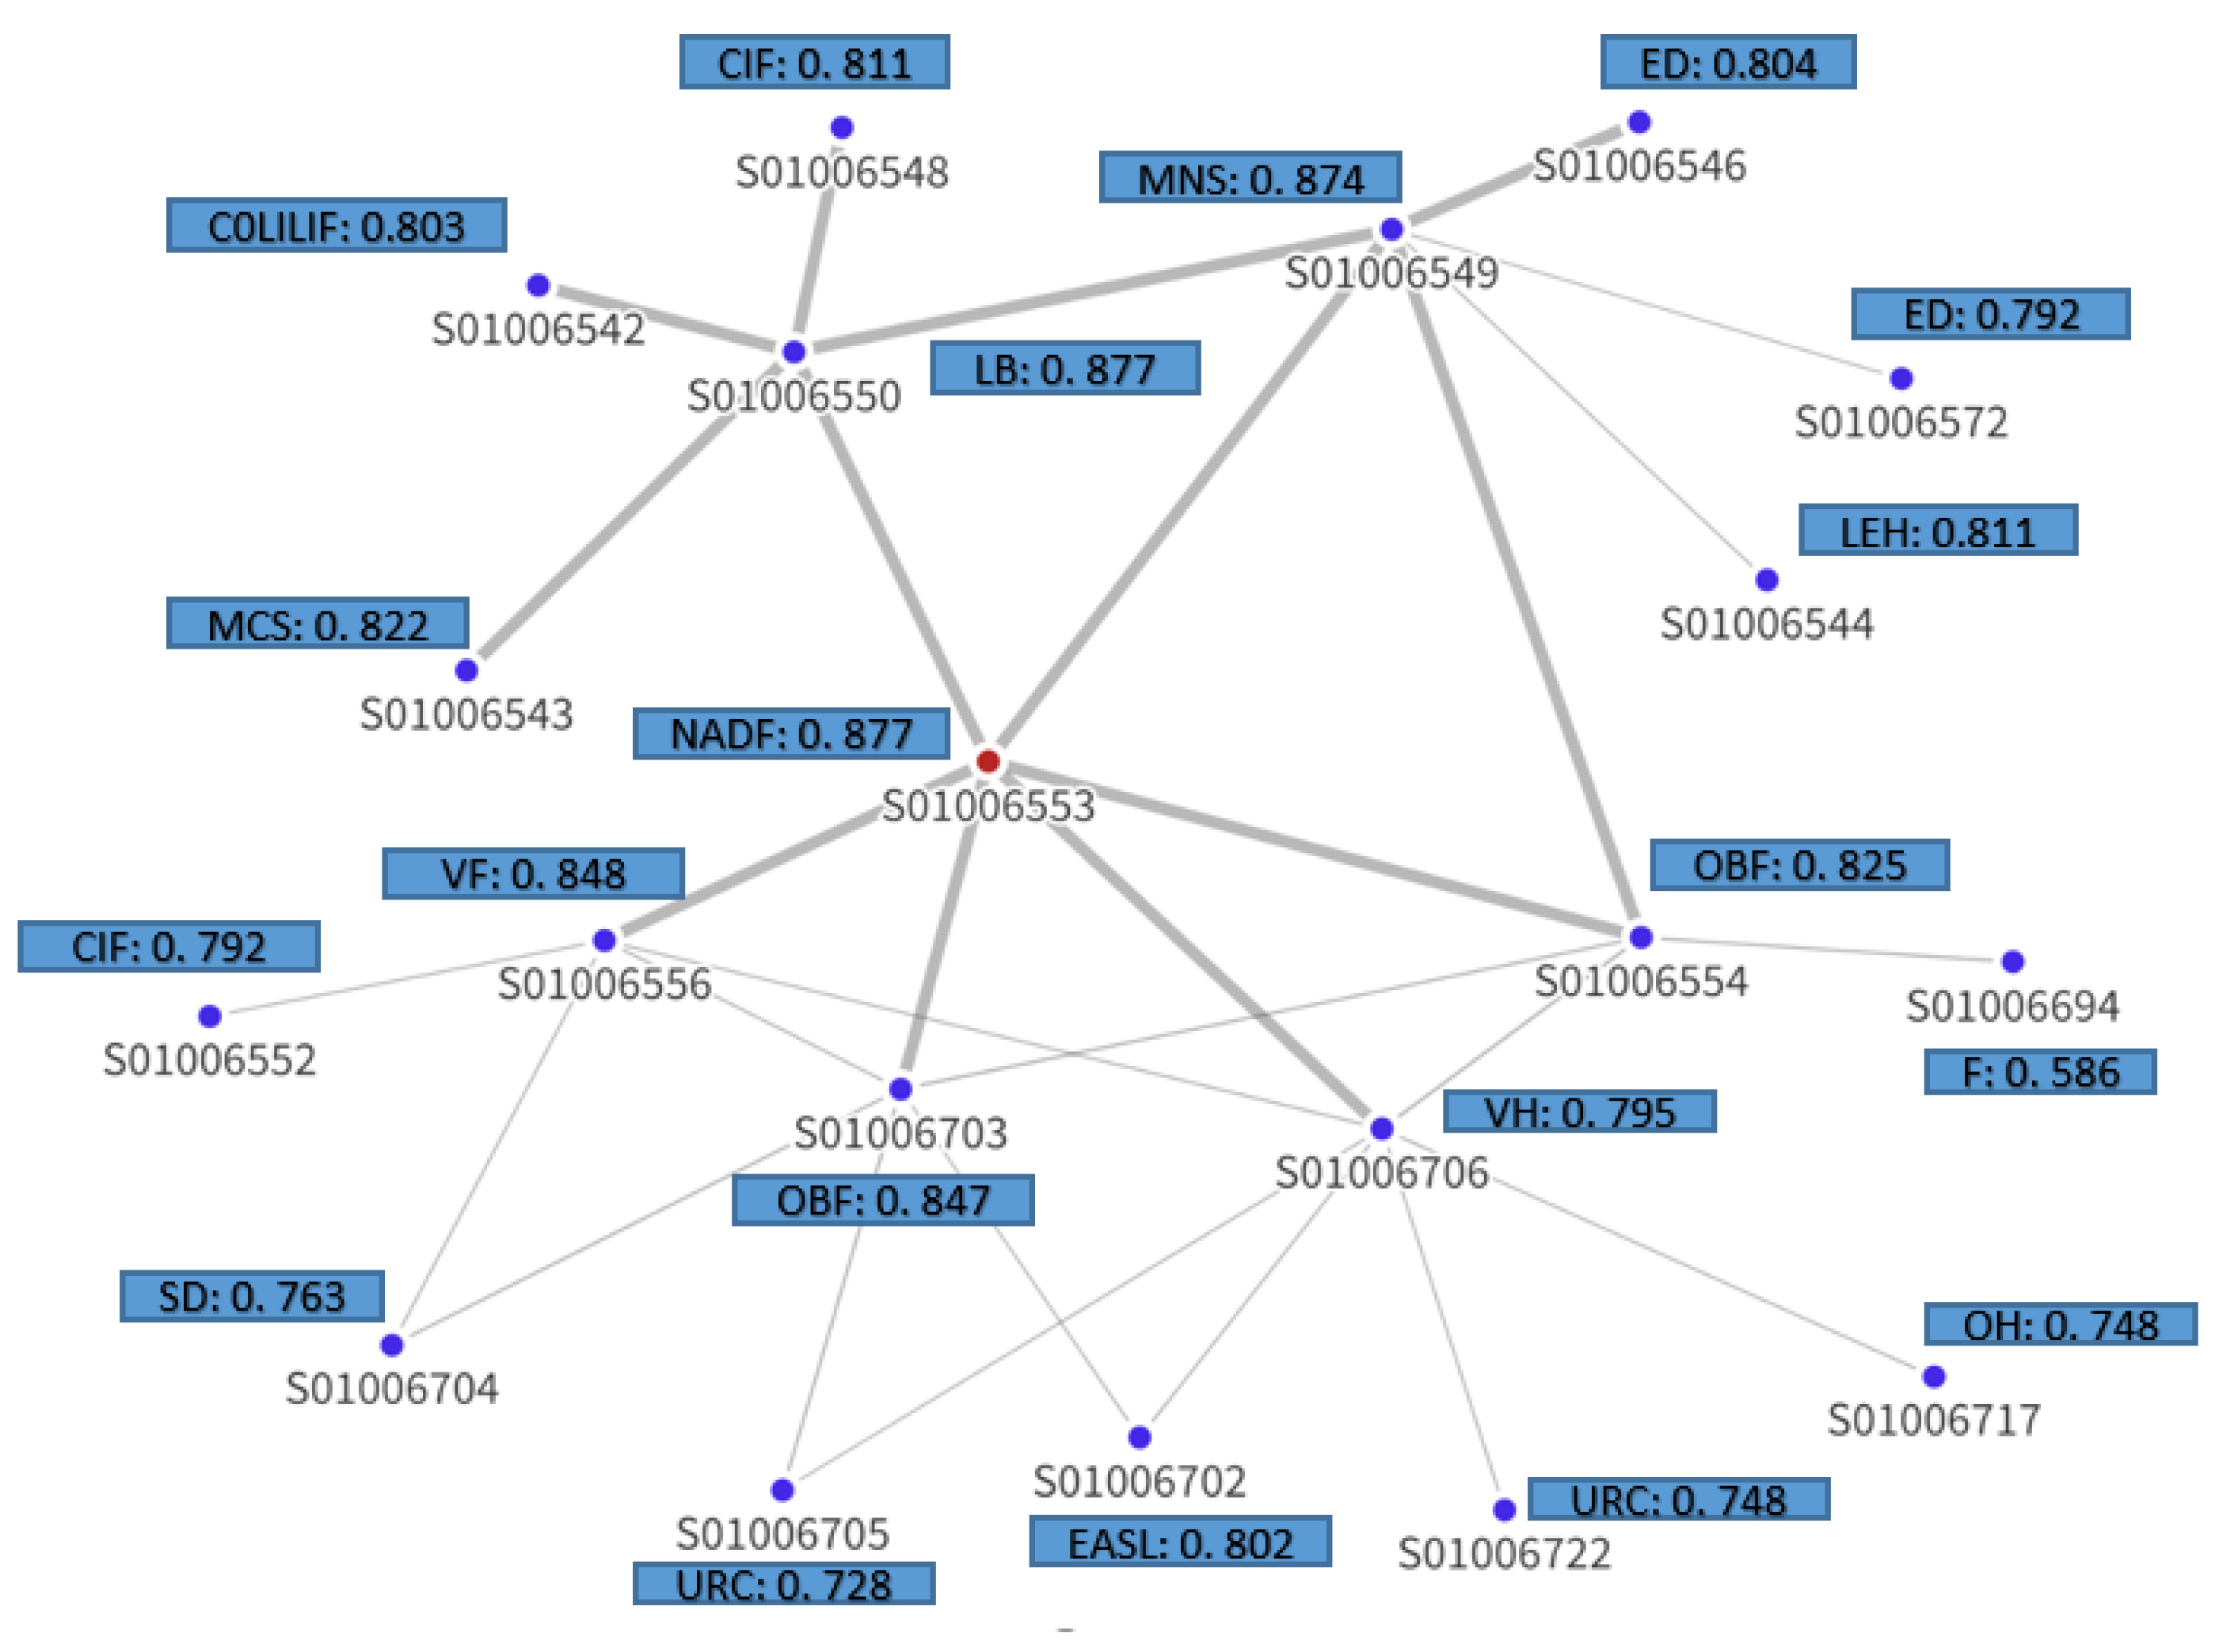
Figure 8.
Feature importance of the top 20 features that play a crucial role to explain the prediction made by GraphSAGE for the data zone Summerhill - 01. The total importance score is based on the sum of the node masks (obtained during model explanation) across all nodes for each feature.
Figure 8.
Feature importance of the top 20 features that play a crucial role to explain the prediction made by GraphSAGE for the data zone Summerhill - 01. The total importance score is based on the sum of the node masks (obtained during model explanation) across all nodes for each feature.
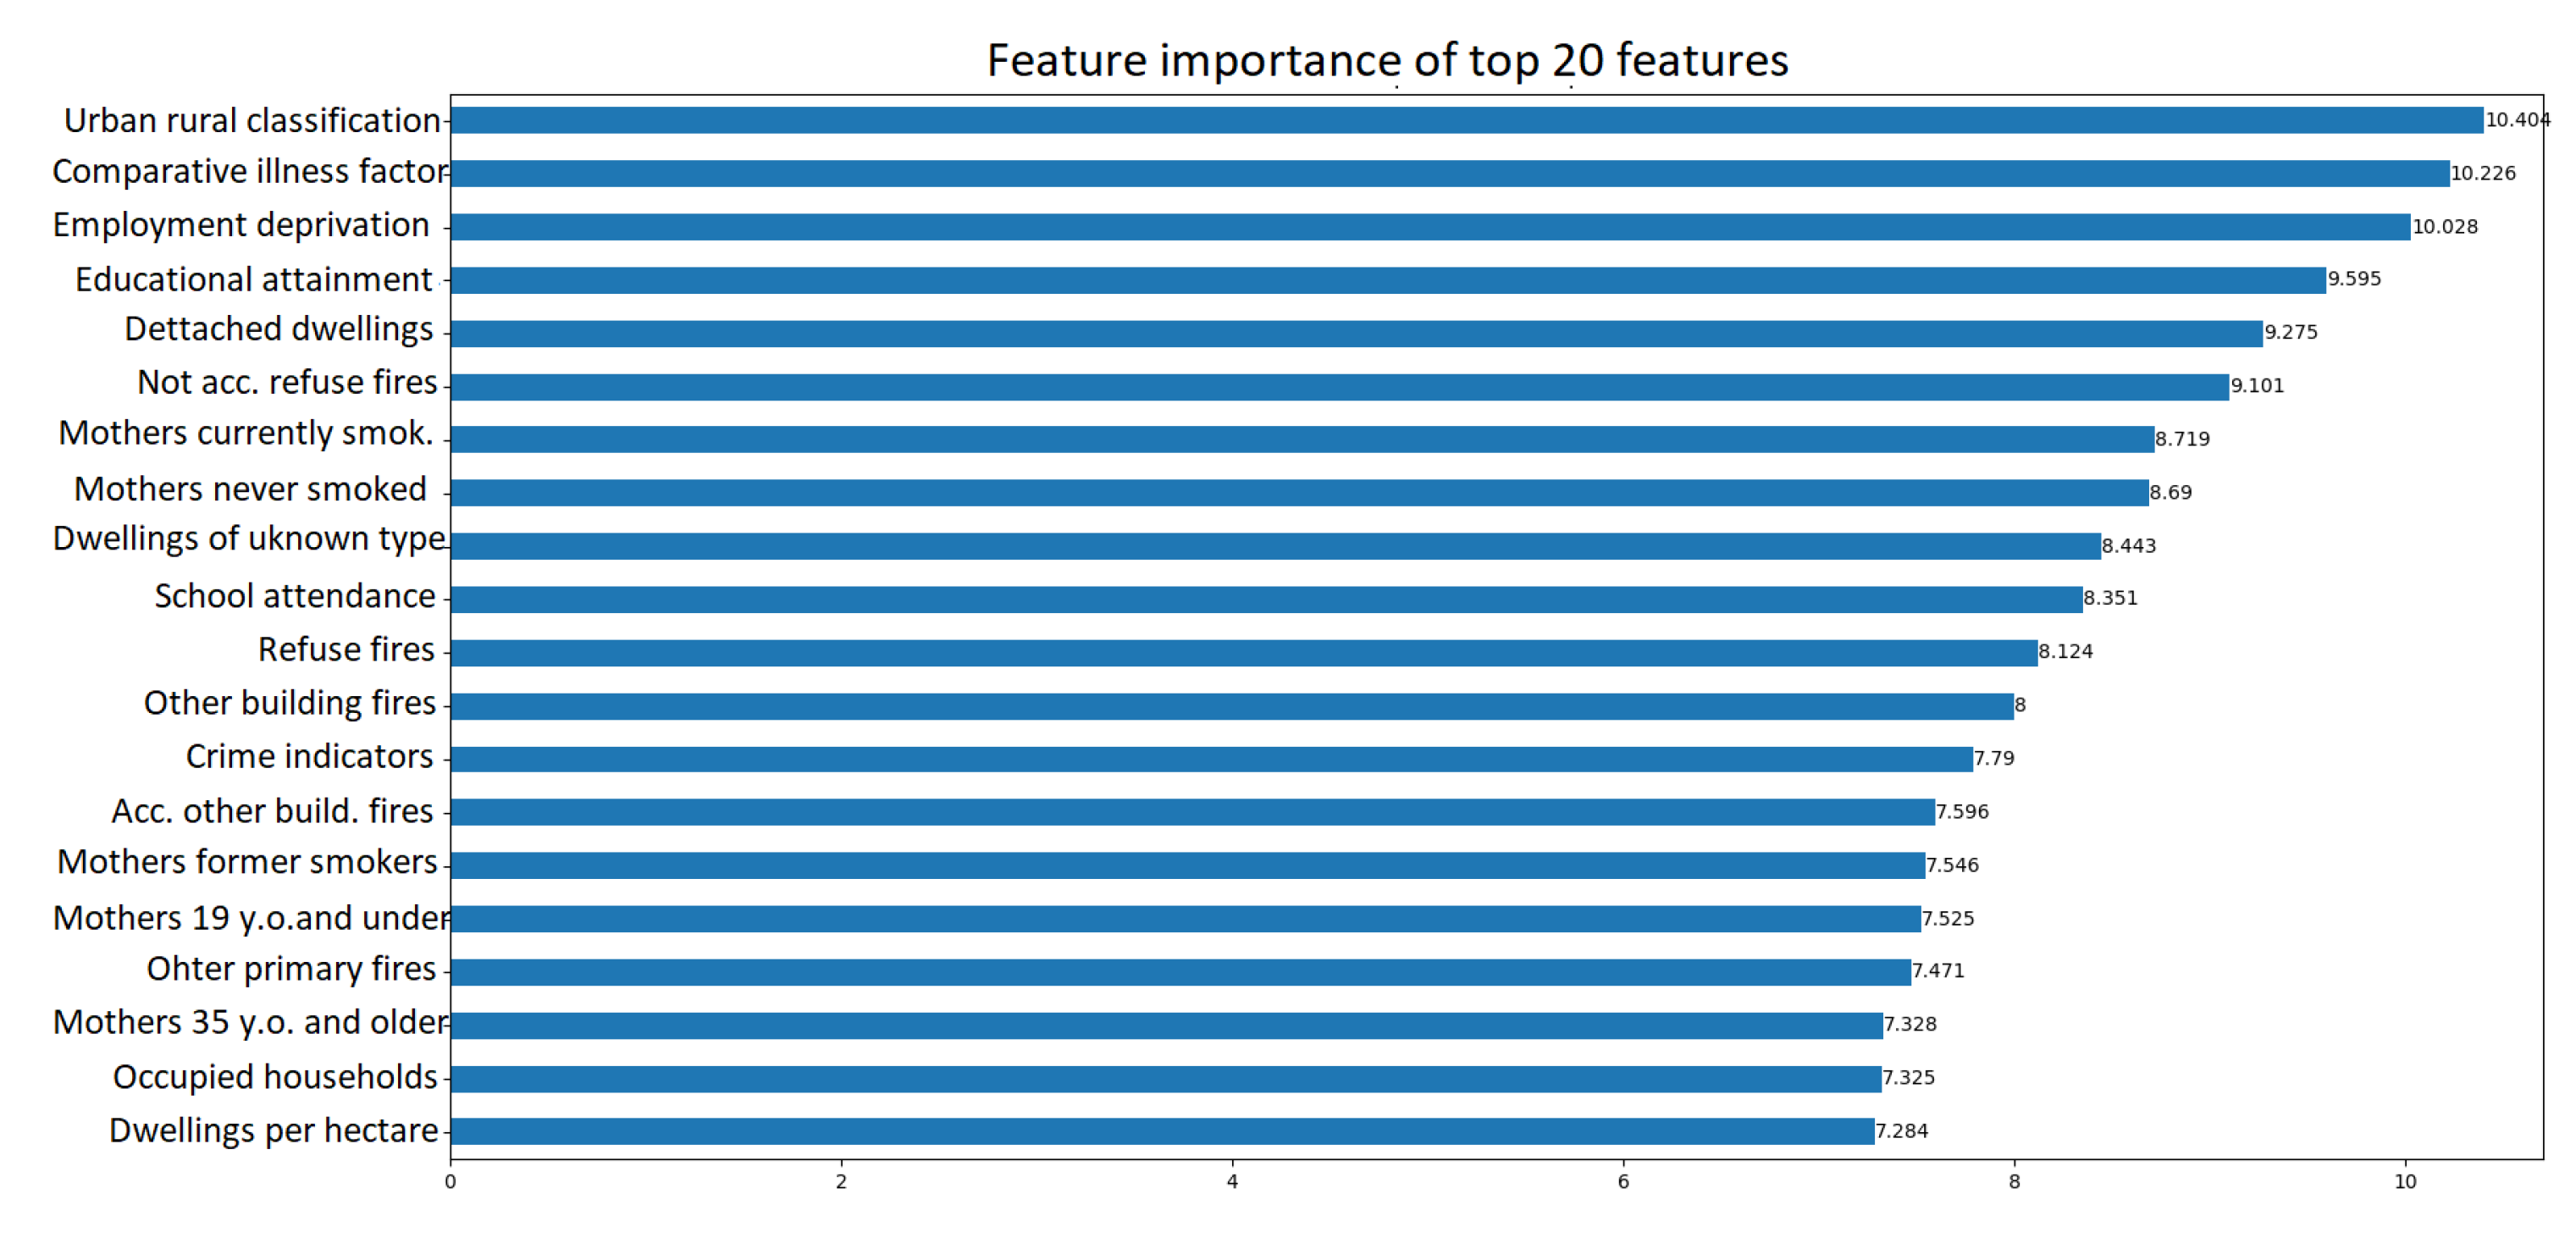
Figure 9.
Visual representation of the explanation sub-graph for data zone Hazlehead - 06 (S01006552), highlighted in red. Each node in the sub-graph is accompanied with a feature and its importance score, determined as the most influential by GNNExplainer for predicting the class of the target node. The opacity of the edges reflects their respective importance in this prediction process
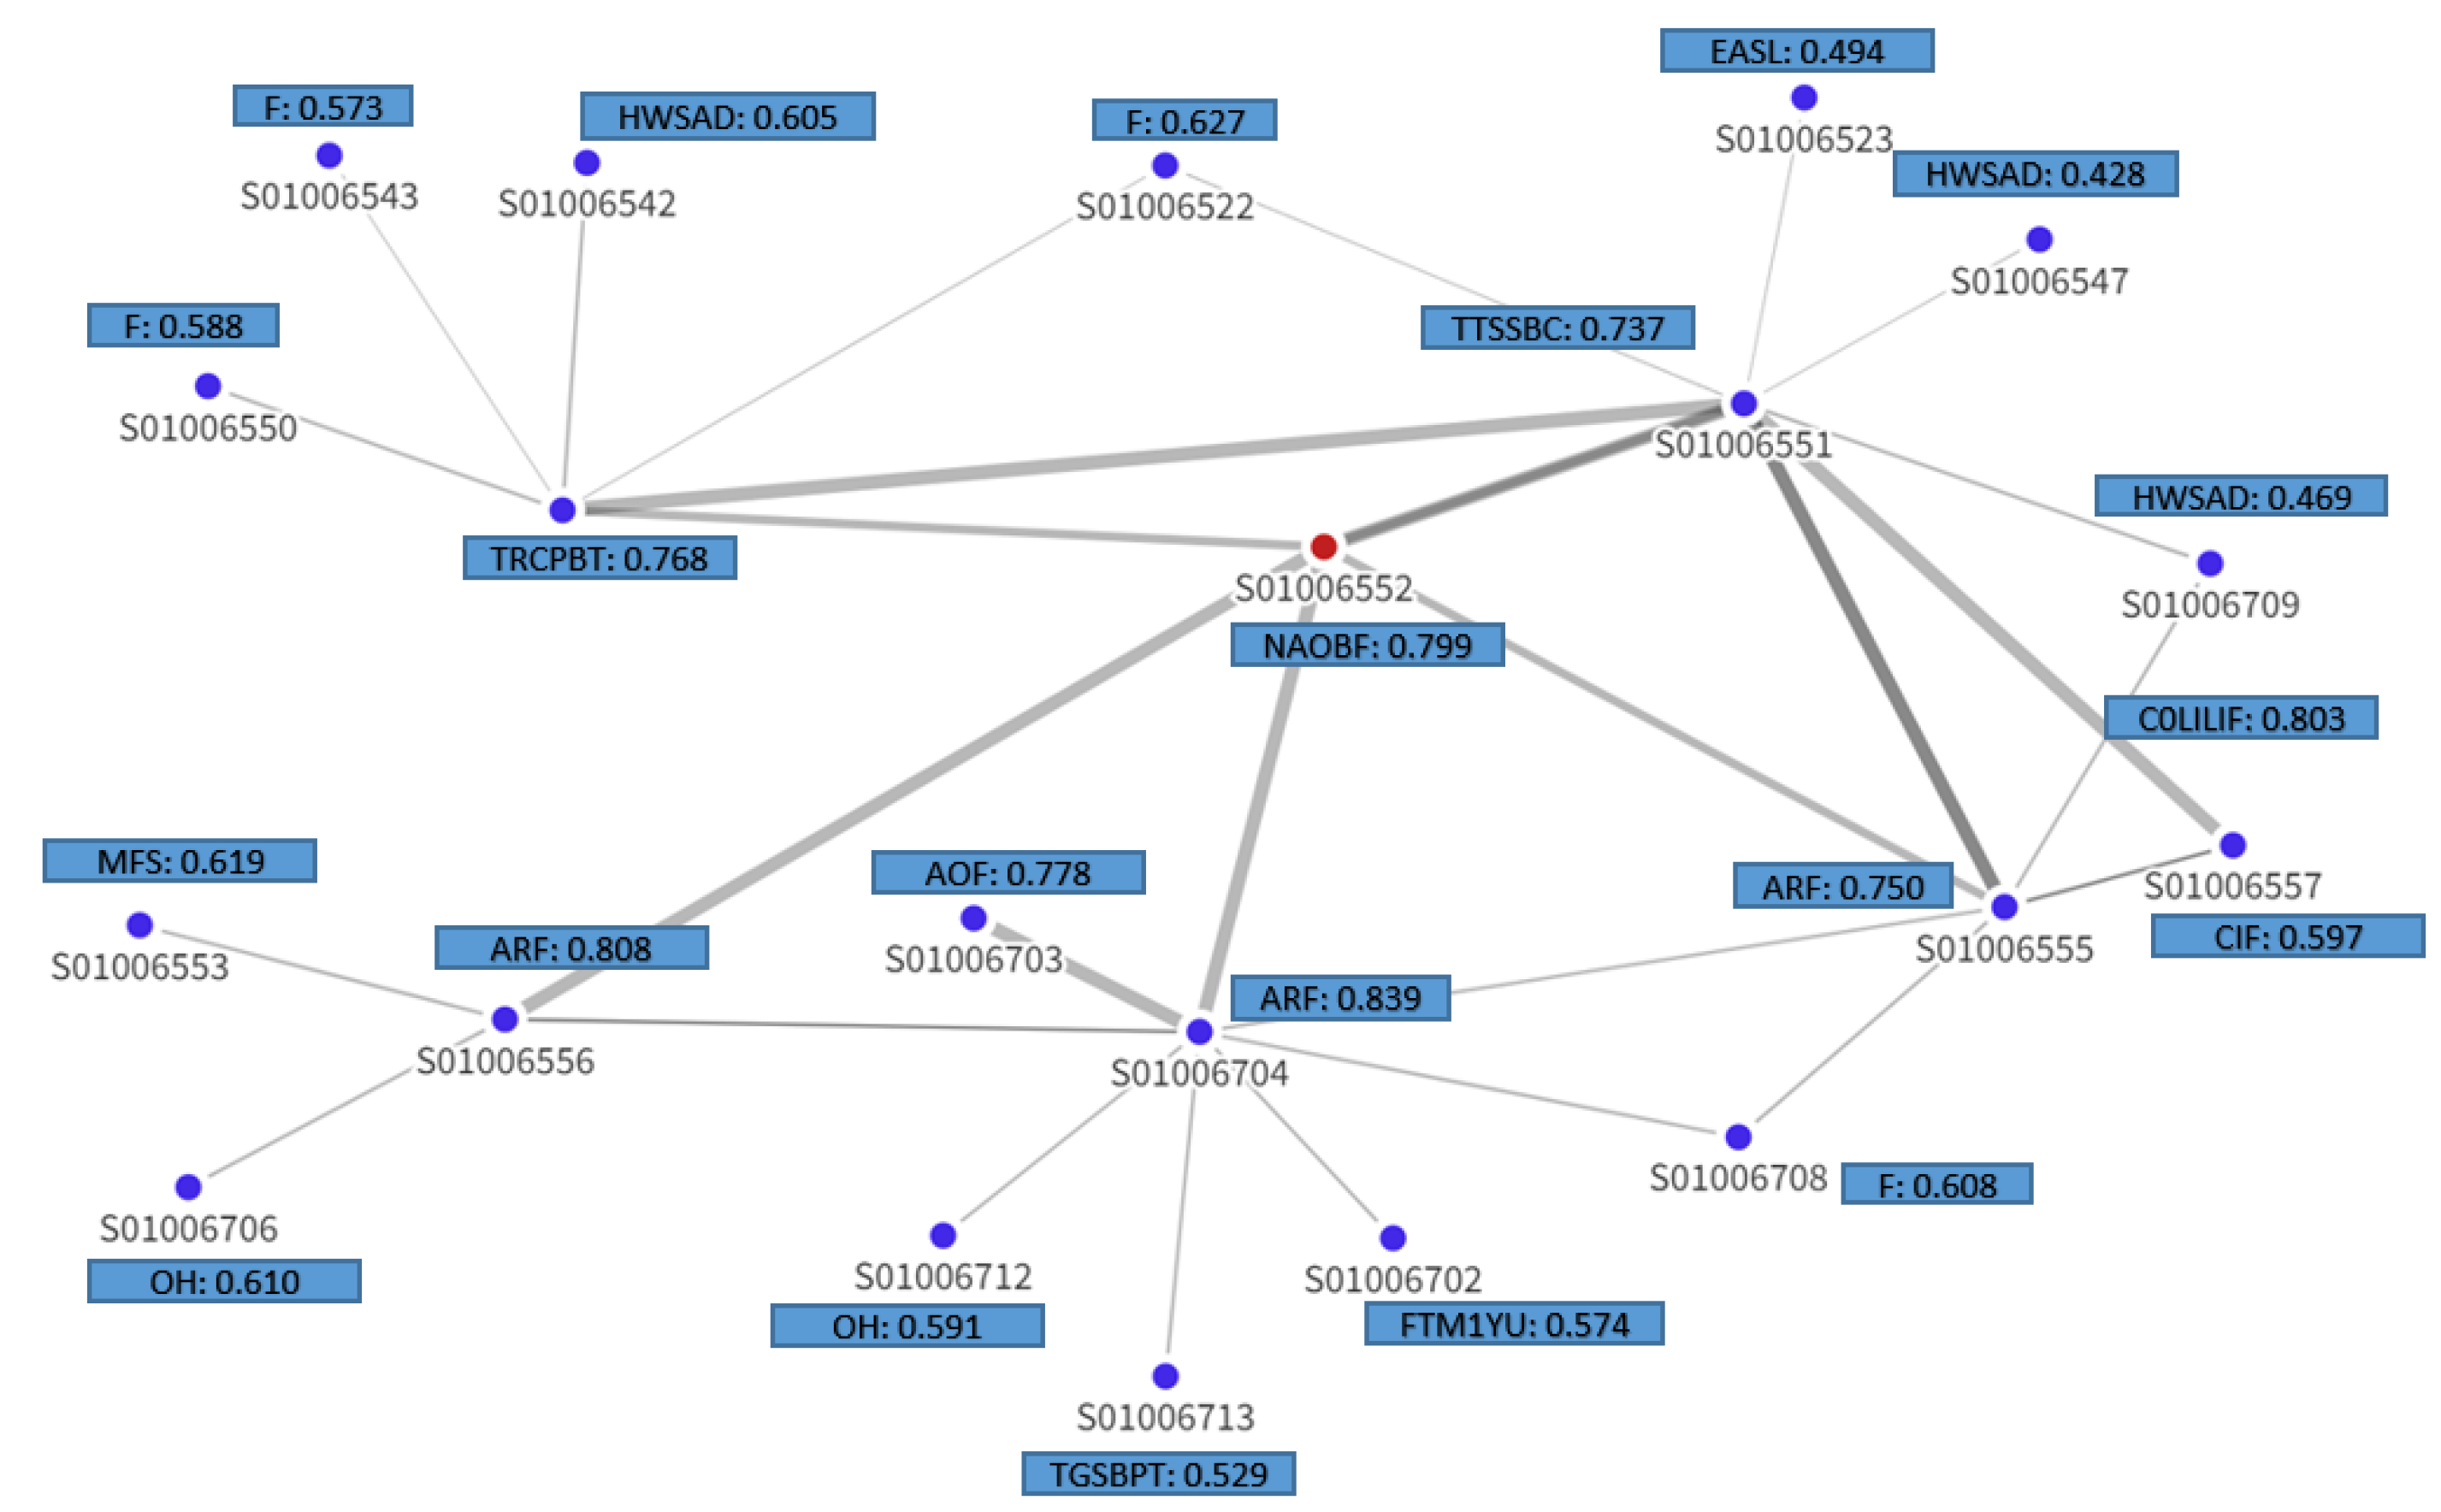
Figure 10.
Feature importance of the top 20 features that play a crucial role to explain the prediction made by GraphSAGE for the data zone Hazlehead - 06.
Figure 10.
Feature importance of the top 20 features that play a crucial role to explain the prediction made by GraphSAGE for the data zone Hazlehead - 06.
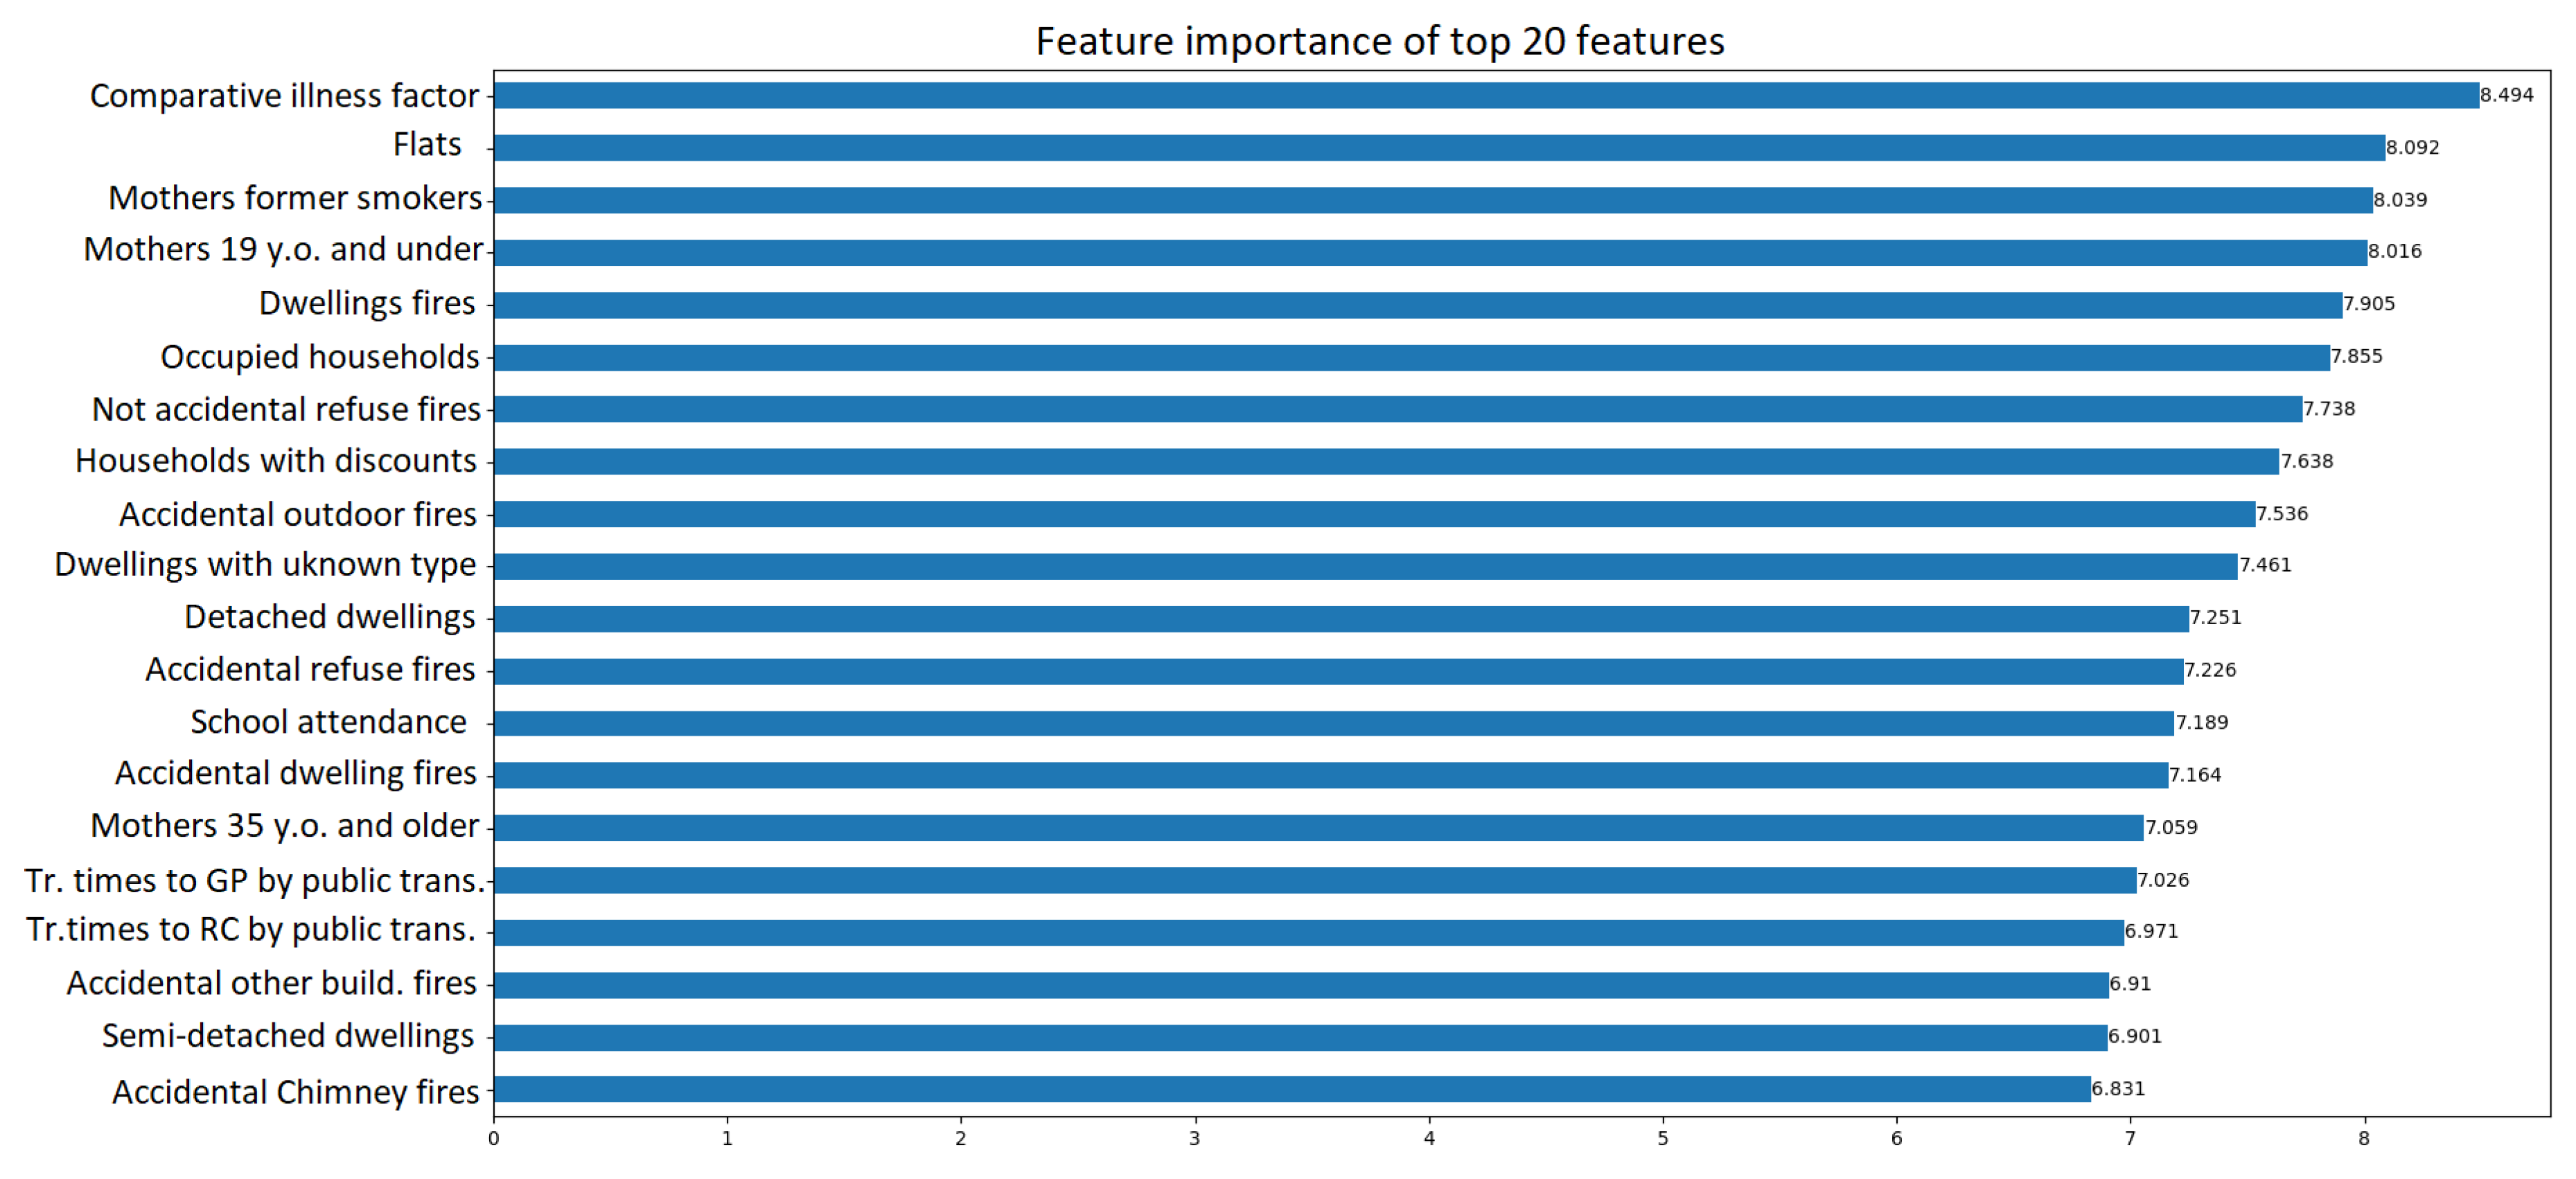
Table 1.
The (test) prediction results on the supervised node classification task for the GNN variants, MLP and XGBoost.
Table 1.
The (test) prediction results on the supervised node classification task for the GNN variants, MLP and XGBoost.
| Model | Accuracy | Precision | Recall | F1 | ROC-AUC | Epochs |
|---|---|---|---|---|---|---|
| GraphSAGE | 0.876 | 0.876 | 0.876 | 0.876 | 0.94 | 68 |
| GCN | 0.852 | 0.852 | 0.852 | 0.852 | 0.89 | 112 |
| ChebNET | 0.847 | 0.847 | 0.847 | 0.847 | 0.91 | 103 |
| XGBoost | 0.840 | 0.850 | 0.840 | 0.840 | 0.92 | - |
| MLP | 0.827 | 0.832 | 0.827 | 0.827 | 0.91 | 72 |
Disclaimer/Publisher’s Note: The statements, opinions and data contained in all publications are solely those of the individual author(s) and contributor(s) and not of MDPI and/or the editor(s). MDPI and/or the editor(s) disclaim responsibility for any injury to people or property resulting from any ideas, methods, instructions or products referred to in the content. |
© 2024 by the authors. Licensee MDPI, Basel, Switzerland. This article is an open access article distributed under the terms and conditions of the Creative Commons Attribution (CC BY) license (http://creativecommons.org/licenses/by/4.0/).
Copyright: This open access article is published under a Creative Commons CC BY 4.0 license, which permit the free download, distribution, and reuse, provided that the author and preprint are cited in any reuse.


