Submitted:
30 April 2024
Posted:
02 May 2024
You are already at the latest version
Abstract
Non-enzyme-catalyzed thiol addition onto the α,β-unsaturated carbonyl system is associated with several biological effects. Kinetics and diastereoselectivity of non-enzyme catalyzed nucleophilic addition of GSH and NAC to the six-membered cyclic chalcone analogs 2a and 2b were investigated at different pH values (pH 3.2, 7.4 and 8.0). The selected compounds displayed in vitro cancer cell cytotoxicity (IC50) of different orders of magnitude. The chalcones intrinsically reacted with both thiols under all incubation conditions. The initial rates and compositions of the final mixtures depended both on the substitution and the pH. The stereochemical outcome of the reactions was evaluated by HPLC-UV method. The structure of the formed thiol-conjugates and the retro-Michael products (Z)-2a and (Z)-2b were confirmed by HPLC-MS. The frontier molecular orbitals and the Fukui function were carried out to investigate their effects on the six-membered cyclic analogs. Data were compared with those obtained with the open-chain (1) and the seven-membered (3) analogs. The observed reactivities do not directly relate to the difference in in vitro cancer cell cytotoxicity of the compounds.
Keywords:
chalcone
; glutathione
; cysteine
; thiols
; Michael addition
; diastereoselective addition
1. Introduction
Chalcones (1) are intermediary compounds of the biosynthetic pathway of a large and widespread group of plant constituents known collectively as flavonoids [1,2]. Among the naturally occurring chalcones and their synthetic analogs, several compounds displayed cytotoxic (cell growth inhibitor) activity toward cultured tumor cells. Chalcones are also effective in vivo as cell proliferating inhibitors, antitumor promoting, anti-inflammatory, and chemopreventive agents [3,4,5,6,7,8,9,10,11].
The molecular mechanisms of the published biological/pharmacological effects can be associated with their (a) non-covalent interactions with biological macromolecules and (b) covalent modification of preferably the soft nucleophilic thiol function(s) of amino acids, peptides, and proteins [7-13]. This latter reaction can alter intracellular redox status (redox signaling), which can modulate events such as DNA synthesis, enzyme activation, selective gene expression, and cell cycle regulation [14,15]. Several biological effects (e.g., NF-κB pathway inhibition (anti-inflammatory effect) [16,17], activation of the Nrf2 pathway (antitumor/cytoprotective effect) [17-19], inhibition of protein kinases (antitumor effect) [7-9], and interaction with tubulin at colchicine binding site (antimitotic effect) [6-12] of chalcones have been associated with their Michael-type reactivity toward cysteine residues of proteins. It was suggested that the lower GSH depletion potential of chalcones with strong electron donor substituents (e.g., dimethylamino) on the B ring could be the consequence of the lower Michael-type reactivity of the derivatives toward GSH [20]. On the other hand, higher reactivity toward GSH and other thiols was found to parallel with higher NQO1-inducing potential of the investigated chalcones.[21].
The chalcone structure can be divided into three structural units: the aromatic rings A and B and the propenone linker (Figure 1). Modifying any of them can tune the main feature of interactions of the synthetic chalcones towards the non-covalent or the covalent pathway. In our previous studies, we have investigated how the substitution of the B-ring and modifying the ring size (n=5-7) of cyclic chalcone analogs affect the cancer cell cytotoxic effect of more than 100 derivatives. It was found that the relative position of the two aromatic rings, as well as the steric properties of the aromatic substituents, plays a determining role in the cytotoxicity of the compounds [22-24].
In our earlier works, reactivity the open-chain 1b, 1c, and their seven-membered cyclic analogs 3b and 3c with reduced glutathione (GSH) and N-acetylcysteine (NAC) was investigated under three conditions with different pH: (a) pH 8.0, (b) pH 6.3, and (c) pH 3.2 [25, 26]. It was found, that both open-chain chalcones (1b and 1c) showed high and comparable reactivity under each condition [25]. On the contrary, between the cyclic analogs, the less cytotoxic methyl substituted 3b showed the higher reactivity [26]. In the comparison of the cytotoxicities of respective six- (2b and 2c) and seven-membered (3b and 3c) derivatives, a reduction in cytotoxicities was observed in both pairs (Table 1).
Based on our previous results, we investigated how the ring size and the 4’-substitution affect the thiol-reactivity of 2b and 2c in the present work. Comparison of the initial reactivities of the open-chain 1a and 1b with the respective 3a and 3b showed that the incorporation of a seven-membered ring into the chalcone moiety reduced the initial reactivity of the polar carbon-carbon double bond towards the thiol nucleophiles. However, no previous data have been published on the effect of the ring size of the cyclic chalcone analogs on their reactivity towards thiols. The diastereomeric selectivity of the addition reactions could also be compared using the earlier HPLC-UV method.
Thiol additions to enones are reported to be reversible, resulting in the formation of an equilibrium mixture. To qualitatively characterize the progress of the reactions, the composition of the incubation mixtures was analyzed at the 15, 45, 75, 105, 135, 165, 195, 225, 255, 285, and 315 min timepoints by HPLC-UV. Furthermore, density functional theory (DFT) calculations were used to analyze the stability and regioselectivity of chalcone analogs on a structural basis. In the analyses, methanethiol (CH3SH) and its deprotonated form (CH3S-) were used as model thiols.
2. Results
2.1. Reactions under Slightly Basic (pH 8.0) Conditions
Initially, we investigated the reactions of 2b and 2c under basic conditions. The basic pH was selected because such conditions mimic that of the GST-catalyzed reactions, in which the ionization of the GSH thiol-function is increased due to its interaction with the basic imidazole N-atom in the enzyme's active site [27]. Considering the pKa values of GSH (pKa 8.83) and NAC (pKa 9.52) [28], 12.8% of the GSH and 2.9% of the NAC molecules are under pH 8.0 conditions. Under such conditions, both GSH (Figure 2) and NAC (Figure 3) showed intrinsic reactivity with the investigated cyclic chalcone analogs.
By the end of the incubation period (315 min) with GSH, the initial HPLC-UV area of the parent compounds 2b and 2c was reduced by 87.2% and 78.1%, respectively (Table 2). While the compounds were incubated with NAC, the respective figures were 32.0% and 33.2% (Table 3), showing the higher reactivity of the GSH thiolate. Changes in the chromatographic peak areas of the starting chalcones as a function of the incubation time indicated that the compositions reflect an equilibrium both in the GSH and the NAC incubations. This observation is similar to those obtained with the respective open-chain analogs (1b and 1c). However, in that case, the conversions were much higher with NAC [25].
As a result of the addition reactions, two new chiral centers are formed. Considering the inherent chirality of the two thiols, formation of four diastereomeric adducts was expected. In the GSH-incubation of 2c, two separate peaks could be detected under the present chromatographic conditions. On the contrary, HPLC analysis of the 2b/GSH incubates showed only one chromatographic peak. Analysis of the 315 min sample of the 2c/GSH incubates showed about twofold excess of the more polar (GSH-1) diastereomers (Table 2). Contrary to the GSH-incubations, analysis of the NAC-incubations showed two separated chromatographic peaks for both compounds (Table 3). The structure of the GSH (Figures S7–S11) and NAC conjugates (Figures S12-S17) were verified by HPLC-MS.
The time course of the adducts’ peak increase has a concave shape in each case (Figure 4, Figure 5, Figure 6 and Figure 7). The initial curvature of the concave curves of the NAC-incubates is similar at the beginning but differs from the 75-minute timepoint (Figure 6 and Figure 7). The time course of increase of the more polar diastereomeric adducts (GSH-1) of 2b and 2c differs from the beginning. Over the incubation period, the ratio of the GSH-1/GSH-2 peak areas of 2c were about 2 (between 2.1 and 2.2). The similar ratios of the NAC-1/NAC-2 peak areas of 2b and 2c were about 1.5 between 1.5-1.8, and 1.4-1.6, respectively. Formation of the (Z)-isomer of the initial 2b and 2c could only be detected in the GSH-incubation of 2c, in very small (negligible) amounts (Table 2 and Table 3).
2.2. Reactions at slightly acidic (pH 6.3) conditions
Reactions under slightly acidic conditions mimic the cellular milieu of the cancer cells [29]. Under such conditions, about 0.3% of the GSH molecules and 0.06% of the NAC molecules exist in the more reactive thiolate form. According to the expectations, the progress of the reactions under such conditions is more restricted than that observed at pH 8.0. The change in the chromatographic peak areas (concentrations) of the starting chalcones 2b and 2c showed parallelism in both reactions (Figure 8 and Figure 9). By the end of the incubation period (315 min) with GSH, the initial area of the HPLC peak of 2b and 2c was reduced by 20.1% and 15.1%, respectively. While the compounds were incubated with NAC, the respective figures were 8.3% and 5.9%. These figures are much lower than those obtained under slightly basic conditions (Table 2 and Table 3).
The HPLC chromatograms of the thiol-adducts of the two cyclic chalcone analogs showed differences. In the GSH incubation of 2c, two separate peaks could be detected. On the other hand, HPLC analysis of the 2b/GSH incubates – similar to the results obtained in the pH 8.0 incubations - showed only one chromatographic peak. The GSH-1 peak areas of the 2b and 2c increased closely parallel over time (Figure 10). Over the whole incubation period, the ratio of the GSH-1/GSH-2 diastereomeric peak areas of 2c - similar to the results obtained in the pH 8.0 incubations - was about 2 (between 2.2 and 2.3) (Figure 10 and Figure 11).
HPLC chromatograms of the chalcone-NAC adducts showed a different pattern. In this case, HPLC analysis of the 2b/NAC incubates showed two small, separated peaks. On the contrary, in the chromatograms of the 2c/NAC incubates, only one peak appeared (Figures S18 and S19). It is worth mentioning that the AUP of the more polar adducts was found in excess in both the GSH-1/GSH-2 ratio of 2c and the NAC-1/NAC-2 ratio of 2b. HPLC-UV analysis showed the presence of the (Z) isomer only in the case of the 2c/GSH and the 2c/NAC incubations, in very small amounts (Table 2 and Table 3).
2.3. Reactions at acidic (pH 3.2) conditions
Under such strongly acidic conditions, the thiol function of GSH and NAC exists exclusively in neutral (protonated) form. According to the lower reactivity of the neutral nucleophiles [30], the reduction of the initial area of 2b and 2c in the chalcone-GSH incubations showed very slight downhill linear curves (Figure 12). By the end of the incubation period (315 min), the initial area of the starting 2b and 2c was reduced by 8.7% and 4.8%, respectively (Table 2 and Table 3).
In parallel, linear increase of two 2c-GSH adducts (GSH-1 and GSH-2) were observed. In the case of 2b, only one chromatographic peak could be detected (Figures S20 and S21). Over the 315 min incubation period, the ratio of the GSH-1/GSH-2 diastereomeric peak areas of 2c was about 3 (between 3.2 and 3.3) (Figures S20 and S21). Formation of the (Z)-isomer of the initial chalcones could only be detected in the GSH-incubation of 2c. The AUP of the (Z)-2c peaks, however, were very low under these conditions as well (Table 2 and Table 3).
In the chalcone-NAC incubations, the reduction of the initial area of the chalcones also showed a rather slight downhill linear shape (Figure S22). By the end of the incubation period (315 min), the initial AUP of 2b and 2c was reduced by 30.8% and 23.6%, respectively (Table 3). Similar to the results obtained in the pH 6.3 incubations, only one 2c-NAC adduct could be detected in the HPLC-UV chromatograms (Figure S23). The ratio of the 2b-NAC isomeric peaks continuously increased (from 0.74 to 1.79) and reached its maximum (1.79) at the 315 min timepoint (Figure S24). Besides the identified compounds, several other small peaks appeared in the chromatograms. Similar results were observed in the NAC-incubation of the seven-membered analogs 3b and 3c [26]. The structures of the formed products could not be identified.
2.4. Molecular Modeling Analysis
The electronic structures of 2a, CH3SH and CH3S- were studied using computational methods. The data, together with those previously published for 1a and 3a [26] are summarized in Table 4. The analysis revealed that the energies of the highest occupied molecular orbital (EHOMO) and the lowest unoccupied molecular orbital (ELUMO) are crucial for understanding the electron-donating and accepting capabilities of the molecules, respectively. The (ΔELUMO-HOMO) differences assist in comprehending chemical stability. Fukui functions suggest preferred sites for nucleophilic attacks, while molecular electrostatic potential (MEP) maps highlight regions vulnerable to electrophilic and nucleophilic attacks (Figure 13).
3. Discussion
Reactivity of chalcones and chalcone analogs with cellular thiols is considered to be one of the molecular mechanisms of their biological activity. The subject of this study was the thiol reactivity of some cyclic chalcone analogs (2b and 2c) that displayed different levels of in vitro cyctotoxic activities towards murine and human cancer cell lines (Table 1). Spontaneous thiol reactivity with GSH and NAC of 2b and 2c was investigated under the previously used in vitro conditions [25,26].
Studies performed under basic (pH 8.0) conditions – mimicking the milieu of the GST-catalyzed reactions [27] - showed the compounds (2b and 2c) to have relatively high reactivity with GSH and NAC (Figure 12 and Figure 13). Such reactivities are comparable with those of the respective open-chain 1b and 1c [25]. On the other hand, both the initial reactivity and the 315-minute conversion of 2b and 2c are much higher than those of the respective seven-membered analogs 3b and 3c [26]. The composition of the incubation of 2b with GSH reached the equilibrium by the end of the 315 minutes incubation periods. The composition of the other incubations is also close to the equilibrium (Figure 12).
The (quasi)equilibrium composition (pH 8.0) of the chalcones with different substituents (b and c) are rather similar with both GSH and NAC. The conversion of the methyl-substituted derivatives (b) is somewhat higher in each case. The respective values of the GSH and the NAC incubations, however, are different. The GSH incubations of chalcones 2 and 3 are much higher in the corresponding conjugates than the NAC incubations. Compositions were most shifted towards the product formation in the case of the conformationally most flexible open chain chalcones (1) (Figure 14 and Figure 15). Based on these observations, the differences can be explained by the higher conformational mobilities (entropy tag) of the GSH-conjugates.
Under slight acidic conditions (pH 6.3), the (quasi)equilibrium compositions of 2 and 3 contain much less GSH and NAC conjugates. Reactivity of the open-chain chalcones (1b and 1c) is much higher than the two cyclic ones (2 and 3). Reactivity of each series (1,2 and 3) is more pronounced with GSH. Similar to the pH 8.0 conditions, the conversion of the methyl-substituted (b) derivatives is higher under each investigated condition (Figures S25 and S26).
Under acidic (pH 3.2) conditions, the 315 minute-conversions were much lower than under the above conditions. Towards both thiol, the methyl substituted derivatives (b) showed somewhat higher reactivity. The only significant difference was the more pronounced reactivity of 1b against GSH (Figures S27 and S28).
13C NMR shifts, indicating the electron density around the particular nucleus of the β-C atom of 2b (136.8 ppm) and 2c (136.6 ppm), - as well as that of 1b and 1c [25], and 3b and 3c [26] - were reported to be similar [32]. Accordingly, the observed difference in the reactivity of chalcones b and c can be explained by the stability of the respective thiol adducts. Humphlett et al. demonstrated that the activity of the α-hydrogen atom of the adduct, the resonance stabilization of the enone formed by cleavage, and the anionic stability of the thiolate ion are the determining factors of the reverse process [33]. Since the 4’-methyl substitution can more effectively increase the electron density on the carbon–carbon double bond, and the formed chalcone is resonance stabilized, the elimination process is more effective in the case of the 4’-OCH3 (c) than the 4’-CH3 (b) derivatives. This is also reflected in the composition of the (quasi)equilibrium mixtures of the three series: the equilibrium mixture is always reacher in the respective 4’-OCH3 chalcones (Figure 12).
As for the isomeric composition of the thiol-adducts, in the case of the 2b//GSH incubations, formation of only one GSH peak were observed, disrespectfully from the actual pH. Since the tR values of the partially separated 2c-GSH conjugates are rather close to each other, it is reasonable to presume that the formed 2b-GSH diastereomers are not separated under the present chromatographic conditions. The diastereomeric ratio (A(GSH-1)/A(GSH-2)) of the separated 2c-GSH conjugates showed about two-times (2.2) excess of the more polar (GSH-1) peak. The ratio was constant, it did not change over the incubation period. Similar observation was obtained when the incubations of 2c were performed under slightly acidic (pH 6.3), and acidic (pH 3.2) conditions; the A(GSH-1)/A(GSH-2) ratios were about two (2.2) and three (3.3), respectively.
In agreement with the constant A(GSH-1)/A(GSH-2) diastereomeric ratios, negligible amount of 2c (Z)-isomers could be detected. These observations are similar with those obtained with the respective open-chain 1b and 1c [25], and opposite to those obtained with the seven-membered cyclic analogs 3b and 3b [26]. In the latter case, much higher amounts of (Z)-isomers were formed under all the three pH conditions. Since the incubations are kept in the dark, it is the retro-Michael reaction the only source of formation of the (Z)-isomers.
According to the above, diastereoselective addition of GSH onto the C=C bond of 2c could be observed under all the three experimental conditions. It can be considered that the similar reactions of 2b are also diastereoselective; the experimental results, however, did not provide unambiguous evidence to state that. Since the highest diastereoselectivity ratio (3.2-3.3) was observed under the acidic (pH 3.2) conditions (Table 2), the results provide further experimental support to consider that the protonated thiol forms a six-membered, hydrogen-bond stabilized intermediate, of which equatorial 4-X-phenyl group determines the structure of the adduct [31].
HPLC analysis of the NAC incubations under basic conditions (pH 8.0) showed two separated chromatographic peaks with both compounds. The ratios of the NAC-1/NAC-2 peak areas of 2b and 2c were between 1.5-1.8, and 1.4-1.6, respectively. In this case, however, the change in the ratio of the two chromatographic peak areas as a function of the pH, showed different patterns for the two compounds. In case of 2c, no NAC-2 peak could be observed under the two acidic conditions. Thus, reaction of 2c with both thiols resulted in a time-independent constant excess of the more polar diastereomeric adducts without (NAC) or with (GSH) formation of small amount of (Z)-2c.
On the contrary, the A(NAC-1)/A(NAC-2) ratios of 2b under the slightly acidic (pH 6.3) and the acidic (pH 3.2) conditions changed between 2.2-4.9 and 0.7-1.8, respectively. In both cases the increase in the ratios was continuous over the incubation time and reached the maximum at the 315 min timepoint. Since relatively high (Z)-isomeric peaks were observed in the pH 6.3 incubations, the continuously increasing A(NAC-1)/A(NAC-2) ratio (between 2.2-4.6) can be partly explained by conversion of the kinetically controlled product to the thermodynamically more stable one, through retro-Michael reaction. Investigations of the respective 4’-CH3 (3b) and 4’-OCH3 (3c) substituted seven-membered analogs also showed a similar increase in the ratio of the chromatographic areas of the NAC-conjugates accompanied by formation of increased amount of the respective (Z)-isomers. The ratio of the NAC-1/NAC-2 areas, however, are opposite in the two series. The numerical value of the ratio of the peaks in both series (2 and 3) was found to be higher in the case of the 4’-CH3 derivative [26]. The retro-Michael (elimination) reaction of the thiol-adducts can result not only the (E) but the (Z) isomers as well. Difference in thiol-reactivity of the (Z) isomers can be the reason for the different level of the isomeric adducts in the incubation mixtures.
By the end of the incubation period under acidic conditions (pH 3.2), the initial integrated chromatographic area (AUC) of 2b and 2c was reduced by 30.8% and 23.6%, respectively (Table 3). Similar to the results obtained in the pH 6.3 incubations, only one 2c-NAC adduct could be detected in the HPLC chromatograms. The ratio of the 2b-NAC isomeric peaks continuously increased (from 0.7 to 1.8) and reached its maximum (1.8) at the 315 min timepoint. The AUC values of the 2-NAC conjugates are rather low; however, several other small peaks appeared in the chromatograms. Similar results were observed in the NAC-incubation of the seven-membered analogs 3b and 3c [26]. The structures of the formed products could not be identified.
We evaluated the physicochemical properties and varying reactivities of 1a and its cyclic analogs (2a and 3a) with the modell thiols CH3SH and CH3S-. We observed that all compounds but CH3SH have similar electron-accepting capabilities. CH3SH exhibits greater chemical stability. LUMO energy analysis indicates that 1a is more acidic compared to 2a and 3a. These results experimentally support the observations, aligning with the Lewis Acid-Base Theory (HSAB), suggesting that reactions prefer partners of similar hardness [36]. In the case of the α,β−unsaturated ketone, the carbonyl oxygen atom withdraws electrons from the C=C bond –generating an electron deficiency at Cβ – the most likely site to receive nucleophilic attacks.
4. Materials and methods
4.1. Chemicals and Reagents
L-Glutathione reduced (GSH), and N-acetyl-L-cysteine (NAC) was obtained from Sigma Aldrich (Budapest, Hungary). Methanol CHROMASOLV gradient for HPLC was obtained from Honeywell (Honeywell, Hungary). Trifluoroacetic acid HiperSolve CHROMANORM was obtained through VWR (Budapest, Hungary). Formic acid was obtained at Fischer Chemical. Deionized water for use in HPLC and HPLC-MS measurements was purified by Millipore Direct QTM (Catalogue Number: PROG00002) at the Institute of Pharmaceutical Chemistry of the Faculty of Pharmacy at the University of Pécs. Mobile phases used for HPLC measurements were degassed by an ultrasonic water bath before use. The compounds were synthesized as previously described [22,23]. The structure of the parent chalcones (2b, 2c) and their (Z)-isomers ((Z)-2b, (Z)-2c) were verified by HPLC-MS method (Figures S1-S6). Authentic (Z)-2b and (Z)-2c were synthesized as published earlier [26].
4.2. Preparation of solutions
To evaluate the reactivity of the investigated chalcone analogs with thiols, reduced glutathione (GSH) and N-acetylcysteine (NAC) solutions of three different pHs - 3.2, 6.3, and 8.0 - were prepared The pH of the solutions was set using 1M NaOH. Both the GSH and NAC solutions were prepared in water to a total volume of 1.5 cm3 with a concentration of 2.0 x 10⁻¹ mol.L-1 (0.3 mmol). Chalcone solution was prepared freshly before incubation to a 4.6 volume of HPLC grade methanol (4.6 cm3 of 6.5 x 10⁻³ mol.L-1, 0.03 mmol).
The NAC or GSH solutions were mixed with the chalcone solution to a final volume of 6.1 cm3, to the final concentration of 4.9 x 10⁻² mol.L-1 of thiol, and 4.9 x 10⁻³ mol.L-1 of chalcone with a molar ratio of 10:1 (thiol:chalcone). The obtained solution was kept in the dark during preparation and analysis in a temperature-controlled (37 °C) water bath for 315 minutes. To monitor the reaction by HPLC-UV, samples were taken at time points 15, 45, 75, 105, 135, 165, 195, 225, 255, 285, and 315 minutes.
4.3. HPLC-UV measurements
The measurements were performed on an Agilent 1100 HPLC system with a UV-Vis detector. The wavelength was set at 260 nm. The separation of the components was carried out in a reversed-phase chromatographic system. A Zorbax Eclipse XBD-C8 (150 mm x 4.6 mm, particle size 5 µm) column (Agilent Technologies, Waldbronn, Germany) was used. The injection volume was 10 µL. During the measurement, the column oven was set at room temperature of 25°C. Data were recorded and evaluated using Agilent ChemStation (B.03.01). The gradient elution was performed at the flow rate of 1.2 mL/min; the mobile phase consisted of (A) water and 0.1% trifluoroacetic acid and (B) methanol and 0.1% trifluoroacetic acid. The gradient profile was as follows: an isocratic period of 8 minutes of 40% mobile phase B followed by a linear increase to 60% for 4 minutes, a second linear gradient to 90% for 3 minutes, and a 5-minute isocratic period of 90%. The column was then equilibrated to its initial conditions with a 2-minute linear gradient to 40%, followed by 3 minutes of the isocratic period.
4.4. HPLC-MS measurements
The measurements in the case of chalcone-GSH adducts were performed on HPLC Ultimate 3000 coupled with a mass spectrometer Q Exactive Focus (Dionex, Sunnyvale, USA). The HPLC separation was performed on an Accucore C18 column (150 mm x 2.1 mm, particle size 2.6 µm), and the Accucore C18 defender guard precolumn (150 mm x 2.1 mm, particle size 2.6 µm) was also used. The injection volume was 5 µL; the flow rate was 0.4 mL/min. Data analysis and evaluations were performed using Thermo Scientific TranceFinder version 4.1.191.0. A binary gradient of eluents, consisting of the mobile phases A and B, was used. (A) water and 0.1% formic acid, (B) methanol, and 0.1% formic acid. The gradient elution was as follows: isocratic elution for 1 minute, 20% eluent B continued by a linear gradient to 100% in 14 minutes, followed by an isocratic plateau for 2 minutes. The column was equilibrated to 20% in 0.5 minutes and continued isocratically for 2.5 minutes. The sampler temperature was at room temperature, and the column oven was at 30 °C.
A Q-Exactive Focus mass spectrometer was operated with an Orbitrap mass analyzer and APCI (atmospheric pressure chemical ionization). The ionization parameters were constant during the measurement and were set to sheat gas (nitrogen gas) 30 A.U., auxiliary gas (nitrogen gas) 10 A.U. Probe heater was set to 300 °C. Capillary temperature 350 °C. The spray voltage (+) was 5000 V, and the S lens R.F. level was 50%. Spectra were acquired in the mass/charge ratio (m/z) range of 50-2,000.
In the case of chalcone-NAC adducts, the HPLC specifications were similar to the chalcone-GSH separation method except for the gradient elution timetable, which was as follows. 1 minute of isocratic elution of 10% of eluent B, followed by a linear increase to 95% till 14 minutes B, followed by an isocratic period of 3 minutes at 95% B, eluent B then was decreased to 10% in 0.1 minutes the column was reequilibrate at 10% eluent B for 2.9 minutes. Diode array detector (DAD) was also performed at 260 nm wavelength alongside MS analysis. Mass spectrometry specifications followed the ionization method: HESI +/- having 35000 resolution at 200 m/z and a scan range of 100-1000 amu. The rest of the specifications were the same as the previously mentioned one.
4.5. Molecular modeling analysis
DFT theoretical calculations were performed on G16 software package [34]. The molecular geometries were optimized using the hybrid exchange and correlation functional with long-range correction, M06-2X, combined with the basis set 6-311++G(d,p) in the gas phase [35]. Frontier molecular orbitals (HOMO and LUMO) [36] were calculated by using DFT. Molecular electrostatic potential maps contributed to the global electrophilicity analysis through their electronic isodensity surfaces. MEP [37] maps provide a visual representation of the electrostatic potential on the surface of a molecule, which can reveal regions of high and low electron density. The electrostatic potential V(r) [38] at point r is defined as.
where Za is the charge of nuclei a at point ra and is the charge density at point r. The local electrophilicity of the molecules was determined by the Fukui function [39, 40] and then it was possible to predict the molecular site selectivity.
where is the number of electrons in the system, and the constant term in the partial derivative is external potential.
5. Conclusions
The initial aim of the present study was to seek correlation between the spontaneous reactivity of chalcones (2b and 2b) with two natural thiols (GSH and NAC) and their in vitro cancer cell cytotoxicity data. As shown in Table 1, 2c was found to be more cytotoxic by at least one order of magnitude than 2b in most investigated cancer cell lines. Similar result was obtained on comparison of the respective cytotoxicity of 3b and 3c (Table 1). Comparison of the initial rates of thiol addition reactions showed the (less cytotoxic) 2b to have higher reactivity. Furthermore, the equilibrium composition of the incubation mixtures was higher in the 2b-thiol adducts in both case. Similar observations could be made on comparison of the respective data of 3b and 3c [26]. Accordingly, the observed cytotoxicity of the compounds do not show direct correlations with their thiol reactivities. On the contrary, it is reasonably to presume that the molecular basis of their cytotoxicity is related to their non-covalent interactions to cellular macromolecules [12].
Comparison of the composition of the equilibrium mixtures, the data indicate importance of the entropy tag of the free enthalpy change of the reactions, which is the highest in the conformative most flexible GSH-adducts of the open-chain chalcones (1). Stereochemical outcome of the reactions showed characteristic differences in the two thiols. In the case of GSH, addition reactions of 2c carried out under acid conditions (pH 3.2) showed a high diastereomeric excess (3.2-3.3) of the more polar diastereomeric pairs. Under the slightly acidic (pH 6.3) and the basic (pH 8.0) conditions, the similar excess was about 2. These results are consistent with our earlier assumption that, as a result of the addition of the protonated (neutral) thiol group, the zwitterionic enolate forms a six-membered transition product stabilized by a hydrogen bridge; the position of the bulky phenyl group orients the stereochemistry of the resulting product [31].
Supplementary Materials
The following supporting information can be downloaded at the website of this paper posted on Preprints.org, Figure S1. High resolution, positive mode HESI MS chromatogram of 2b irradiated with natural light. (tr 13.67 min: (Z)-2b. tr 14.04 min: 2b. (Extracted ion chromatogram of m/z 249.1279 [(2b)+H]+). Figure S2. High resolution, positive mode HESI MS spectrum of (Z)-2b. (m/z 249.1271 [(2b)+H]+, m/z 271.1089 [(2b)+Na]+ and m/z 519.2289 [(2b)2+Na]+). Figure S3. High resolution, positive mode HESI MS spectrum of 2b. (m/z 249.1270 [(2b)+H]+ and m/z 271.1089 [(2b)+Na]+). Figure S4. High resolution, positive mode HESI MS chromatogram of 2c irradiated with natural light. (tr 13.07 min: (Z)-2c. tr 13.31 min: 2c. (Extracted ion chromatogram of m/z 265.1229 [(2c)+H]+). Figure S5. High resolution, positive mode HESI MS spectrum of (Z)-2c. (m/z 265.1220 [(2c)+H]+, m/z 287.1039 [(2c)+Na]+-adduct and m/z 551.2189 [(2c)2+Na]+-adduct). Figure S6. High resolution, positive mode HESI MS spectrum of 2c. (m/z 265.1221 [(2c)+H]+, m/z 287.1039 [(2c)+Na]+-adduct and m/z 551.2191 [(2c)2+Na]+-adduct). Figure S7. High resolution, positive mode HESI MS chromatograms of the 2b/GSH incubate (pH 3.2 ; 315-minute sample). Upper panel: m/z 249.1279 [(2b)+H]+ tr 14.04 min: 2b. Lower panel: m/z 556.2117 [(2b-GSH)+H]+ tr 11.03 min: 2b-GSH. Figure S8. High resolution, positive mode HESI MS spectrum of the 2b-GSH conjugate (tr 11.03 min) formed in the 315-minute sample of the pH 3.2 incubate. (m/z 556.2110 [(2b-GSH)+H]+). Figure S9. High resolution, positive mode HESI MS chromatograms of the 2c/GSH incubate (pH 3.2; 315-minute sample). Upper panel: m/z 265.1229 [(2c)+H]+ tr 13.32 min: 2c. Lower panel: m/z 572.2067 [(2c-GSH)+H]+ tr 10.28 min: 2c-GSH-1, tr 10.33 min: 2c-GSH-2. Figure S10. High resolution, positive mode HESI MS spectrum of the 2c-GSH-1 conjugate (tr 10.28 min) formed in the 315-minute sample of the pH 3.2 incubate. (m/z 572.2057 [(2c-GSH)+H]+ ). Figure S11. High resolution, positive mode HESI MS spectrum of the 2c-GSH-2 conjugate (tr 10.33 min) formed in the 315-minute sample of the pH 3.2 incubate. (m/z 572.2060 [(2c-GSH)+H]+). Figure S12. High resolution, HESI MS chromatograms of 2b/NAC incubate (pH 3.2; 315-minute sample). Upper panel: positive mode m/z 249.1279 [2b+H]+ tr 14.03 min: 2b. Lower panel: negative mode m/z 410.1426 [(2b-NAC)-H]- tr 12.37 min: 2b-NAC-1, tr 12.50 min: 2b-NAC-2. Figure S13. High resolution, negative mode HESI MS spectrum of the 2b-NAC-1 conjugate (tr 12.37 min) formed in the 315-minute sample of the pH 3.2 incubate. (m/z 410.1431 [(2b-NAC)-H]-, m/z 478.1307 [(2b-NAC)+Na-formate clusters-H]-, m/z 821.2936 [(2b-NAC)2-H]-, m/z 843.2751 [(2b-NAC)2+Na-2H]-). Figure S14. High resolution, negative mode HESI MS spectrum of the 2b-NAC-2 conjugate (tr 12.50 min) formed in the 315-minute sample of the pH 3.2 incubate. (m/z 410.1434 [(2b-NAC)-H]-, m/z 478.1309 [(2b-NAC)+Na-formate clusters-H]-, m/z 821.2941 [(2b-NAC)2-H]-, m/z 843.2755 [(2b-NAC)2+Na-2H]-). Figure S15. High resolution, HESI MS chromatograms of the 2c/NAC incubate (pH 3.2, 315-minute sample). Upper panel: positive mode m/z 265.1229 [(2c)+H]+ tr 14.03 min: 2c. Lower panel: negative mode m/z 426.1375 [(2c)-H]- tr 11.64 min: 2c-NAC-1, tr 11.74 min: 2c-NAC-2. Figure S16. High resolution, negative mode HESI MS spectrum of the 2c-NAC-1 conjugate (tr 11.64 min) formed in the 315-minute sample of the pH 3.2 incubate. (m/z 426.1362 [(2c-NAC)-H]-, m/z 494.1249 [(2c-NAC)+Na-formate clusters-H]-, m/z 853.2830 [(2c-NAC)2-H]-, m/z 875.2649 [(2c-NAC)2+Na-2H]-). Figure S17. High resolution, negative mode HESI MS spectrum of the 2c-NAC-2 conjugate (tr 11.74 min) formed in the 315-minute sample of the pH 3.2 incubate. (m/z 426.1364 [(2c-NAC)-H]-, m/z 494.1259 [(2c-NAC)+Na-formate clusters-H]-). Figure S18. Change in the chromatographic peak area of adduct 1 of 2b and 2c in the chalcone-NAC incubations at pH 6.3. Figure S19. Change in the chromatographic peak area of adduct 2 of 2b in the chalcone-NAC incubations at pH 6.3. Figure S20. Change in the chromatographic peak area of adduct 1 of 2b and 2c in the chalcone-GSH incubations at pH 3.2. Figure S21. Change in the chromatographic peak area of adduct 2 of 2c in the chalcone-NAC incubations at pH 3.2. Figure S22. Change in the chromatographic peak area of chalcones 2b and 2c in the chalcone–NAC incubations at pH 3.2. Figure S23. Change in the chromatographic peak area of adduct 2 of 2b in the chalcone-NAC incubations at pH 3.2. Figure S24. Change in the chromatographic peak area of adduct 1 of 2b and 2c in the chalcone-NAC incubations at pH 3.2. Figure S25. Change in the chromatographic peak area of chalcones 1b, 1c, 2b, 2c, 3b and 3c in the chalcone-GSH incubations at pH 6.3. Figure S26. Change in the chromatographic peak area of chalcones 1b, 1c, 2b, 2c, 3b and 3c in the chalcone-NAC incubations at pH 6.3. Figure S27. Change in the chromatographic peak area of chalcones 1b, 1c, 2b, 2c, 3b and 3c in the chalcone-GSH incubations at pH 3.2. Figure S28. Change in the chromatographic peak area of chalcones 1b, 1c, 2b, 2c, 3b and 3c in the chalcone-NAC incubations at pH 3.2.
Author Contributions
Fatemeh Kenari: Writing initial draft, writing review, investigation, data curation; Zoltán Pintér: Writing initial draft, writing-review, investigation, data curation; Szilárd Molnár: Investigation, data curation; Igor D. Borges: Writing review, investigation, data curation; Ademir J. Camargo Writing review, investigation, data curation; Hamilton B. Napolitano: Conceptualization, writing initial draft, writing review and editing; Pál Perjési: Project administration, conceptualization, writing initial draft, writing-review, and editing. All authors have read and agreed to the published version of the manuscript.
Funding
This study was supported by the European Union and co-financed by the European Social Fund (EFOP-3.6.1.-16-2016-00004). The financial support is highly appreciated. The authors are grateful to Conselho Nacional de Desenvolvimento Científico e Tecnológico (CNPq) and Fundação de Amparo à Pesquisa de Goiás (FAPEG). Theoretical calculations were performed in the High-Performance Computing Center of the Universidade Estadual de Goiás.
Institutional Review Board Statement
Not applicable.
Informed Consent Statement
Not applicable.
Data Availability Statement
Not applicable.
Conflicts of Interest
The authors declare no conflicts of interest.
Sample Availability
Samples of compounds 2 are available from the authors.
References
- Part XIX. Kenari, F.; Molnár, S.; Borges, I.D.; Napolitano, H.B.; Perjési, P. (E)-2-Benzylidenecyclanones: Part XVIII Study the Possible Link between Glutathione Reactivity and Cancer Cell Cytotoxic Effects of Some Cyclic Chalcone Analogs A Comparison of the Reactivity of the Open-Chain and the Seven-Membered Homologs. Int. J. Mol. Sci. 2023, 24, 8557. [CrossRef]
- Rozmer, Z.; Perjési, P. Naturally occurring chalcones and their biological activities. Phytochem. Rev. 2016, 15, 87–120. [Google Scholar] [CrossRef]
- Sahu, N.K.; Balbhadra, S.S.; Choudhary, J.; Kohli, V.D. Exploring Pharmacological Significance of Chalcone Scaffold: A Review. Curr. Med. Chem. 2012, 19, 209–225. [Google Scholar] [CrossRef]
- Singh, P.; Anand, A.; Kumar, V. Recent Developments in Biological Activities of Chalcones: A Mini Review. Eur. J. Med. Chem. 2014, 85, 758–777. [Google Scholar] [CrossRef]
- Karthikeyan, C.; Narayana Moorthy, N.S.H.; Ramasamy, S.; Vanam, U.; Manivannan, E.; Karunagaran, D.; Trivedi, P. Advances in Chalcones with Anticancer Activities. Recent Pat. Anti-Cancer Drug Discov. 2014, 10, 97–115. [Google Scholar] [CrossRef]
- Mahapatra, D.K.; Bharti, S.K.; Asati, V. Anti-cancer chalcones: Structural and molecular target perspectives. Eur. J. Med. Chem., 2015, 98, 69–114. [Google Scholar] [CrossRef]
- Zhou, B. Diverse Molecular Targets for Chalcones with Varied Bioactivities. Med. Chem. 2015, 5, 388–404. [Google Scholar] [CrossRef]
- Zhuang, C.; Zhang, W.; Sheng, C.; Zhang, W.; Xing, C.; Miao, Z. Chalcone: a privileged structure in medicinal chemistry. Chem. Rev., 2017, 117(12), 7762-7810. [CrossRef]
- Gomes, M.; Muratov, E.; Pereira, M.; Peixoto, J.; Rosseto, L.; Cravo, P.; Andrade, C.; Neves, B. Chalcone Derivatives: Promising Starting Points for Drug Design. Molecules 2017, 22, 1210. [Google Scholar] [CrossRef]
- Constantinescu, T.; Mihis, A.G. Two Important Anticancer Mechanisms of Natural and Synthetic Chalcones. Int. J. Mol. Sci. 2022, 23, 11595. [Google Scholar] [CrossRef]
- Shalaby, M.A.; Rizk, S.A.; Fahim, A.M. Synthesis, reactions and application of chalcones: a systematic reviewOrg. Biomol. Chem., 2023, 21, 5317–5346. [Google Scholar] [CrossRef]
- Kozurkova, M.; Tomeckova, V. Interaction of Chalcone Derivatives with Important Biomacromolecules. In Chalcones and Their Synthetic Analogs; Nova Science Publishers, Inc, 2020; p. 95 ISBN 978-1-5361-8709-0.
- Amslinger, S. The Tunable Functionality of α,β-Unsaturated Carbonyl Compounds Enables Their Differential Application in Biological Systems. ChemMedChem 2010, 5, 351–356. [Google Scholar] [CrossRef]
- Moran, L.; Gutteridge, J.; Quinlan, G. Thiols in Cellular Redox Signalling and Control. Curr. Med. Chem. 2001, 8, 763–772 [CrossRef] [PubMed]. [Google Scholar] [CrossRef]
- Aw, T.Y. Cellular Redox: A Modulator of Intestinal Epithelial Cell Proliferation. Physiology 2003, 18, 201–204. [Google Scholar] [CrossRef]
- Folmer, F.; Blasius, R.; Morceau, F.; Tabudravu, J.; Dicato, M.; Jaspars, M.; Diederich, M. Inhibition of TNFα-Induced Activation of Nuclear Factor ΚB by Kava (Piper Methysticum) Derivatives. Biochem. Pharmacol. 2006, 71, 1206–1218. [Google Scholar] [CrossRef]
- Laphanuwat, P.; Kongpetch, S.; Senggunprai, L.; Prawan, A.; Kukongviriyapan, V. Licochalcone A Induces Cholangiocarcinoma Cell Death Via Suppression of Nrf2 and NF-ΚB Signaling Pathways. Asian Pac. J. Cancer Prev. 2022, 23, 115–123. [Google Scholar] [CrossRef]
- de Freitas Silva, M.; Pruccoli, L.; Morroni, F.; Sita, G.; Seghetti, F.; Viegas, C.; Tarozzi, A. The Keap1/Nrf2-ARE Pathway as a Pharmacological Target for Chalcones. Mol. Basel Switz. 2018, 23, 1803. [Google Scholar] [CrossRef]
- Egbujor, M.C.; Saha, S.; Buttari, B.; Profumo, E.; Saso, L. Activation of Nrf2 Signaling Pathway by Natural and Synthetic Chalcones: A Therapeutic Road Map for Oxidative Stress. Expert Rev. Clin. Pharmacol. 2021, 14, 465–480. [Google Scholar] [CrossRef]
- Jin, Y. L.; Jin, X. Y.; Jin, F.; Sohn, D. H.; Kim, H. S. Structure activity relationship studies of anti-inflammatory TMMC derivatives: 4-dimethylamino group on the B ring responsible for lowering the potency. Arch. Pharm. Res. 2008, 31, 1145–1152. [Google Scholar] [CrossRef] [PubMed]
- ] Dinkova-Kostova, A. T.; Massiah, M. A.; Bozak, R. E.; Hicks, R. J.; Talalay, P. Potency of Michael reaction acceptors as inducers of enzymes that protect against carcinogenesis depends on their reactivity with sulfhydryl groups. Proc. Natl. Acad. Sci. 2001, 98, 3404–3409. [Google Scholar] [CrossRef]
- Dimmock, J.R.; Kandepu, N.M.; Nazarali, A.J.; Kowalchuk, T.P.; Motaganahalli, N.; Quail, J.W.; Mykytiuk, P.A.; Audette, G.F.; Prasad, L.; Perjési, P.; et al. Conformational and Quantitative Structure−Activity Relationship Study of Cytotoxic 2-Arylidenebenzocycloalkanones. J. Med. Chem. 1999, 42, 1358–1366. [Google Scholar] [CrossRef]
- Dimmock, J.R.; Zello, G.A.; Oloo, E.O.; Quail, J.W.; Kraatz, H.-B.; Perjési, P.; Aradi, F.; Takács-Novák, K.; Allen, T.M.; Santos, C.L.; et al. Correlations between Cytotoxicity and Topography of Some 2-Arylidenebenzocycloalkanones Determined by X-Ray Crystallography. J. Med. Chem. 2002, 45, 3103–3111. [Google Scholar] [CrossRef]
- Perjési, P.; Das, U.; De Clercq, E.; Balzarini, J.; Kawase, M.; Sakagami, H.; Stables, J.P.; Lorand, T.; Rozmer, Z.; Dimmock, J.R. Design, Synthesis and Antiproliferative Activity of Some 3-Benzylidene-2,3-Dihydro-1-Benzopyran-4-Ones Which Display Selective Toxicity for Malignant Cells. European Journal of Medicinal Chemistry 2008, 43, 839–845. [Google Scholar] [CrossRef]
- Kenari, F.; Molnár, S.; Perjési, P. Reaction of Chalcones with Cellular Thiols. The Effect of the 4-Substitution of Chalcones and Protonation State of the Thiols on the Addition Process. Diastereoselective Thiol Addition. Molecules 2021, 26, 4332. [Google Scholar] [CrossRef] [PubMed]
- Kenari, F.; Molnár, S.; Borges, I.D.; Napolitano, H.B.; Perjési, P. (E)-2-Benzylidenecyclanones: Part XVIII Study the Possible Link between Glutathione Reactivity and Cancer Cell Cytotoxic Effects of Some Cyclic Chalcone Analogs A Comparison of the Reactivity of the Open-Chain and the Seven-Membered Homologs. Int. J. Mol. Sci. 2023, 24, 8557. [Google Scholar] [CrossRef]
- Armstrong, R. N. Structure, catalytic mechanism, and evolution of the glutathione transferases. Chem. Res. Toxicol. 1997, 10, 2–18. [Google Scholar] [CrossRef]
- Aldini, G.; Altomare, A.; Baron, G.; Vistoli, G.; Carini, M.; Borsani, L.; Sergio, F. N-acetylcysteine as an antioxidant and disulphide breaking agent: The reasons why. Free Radic. Res. 2018, 52, 751–762. [Google Scholar] [CrossRef]
- Rohani, N.; Hao, L.; Alexis, M.; Joughin, B.; Krismer, K.; Moufarrej, M.; Soltis, A.; Lauffenburger, D.; Yaffe, M.; Burge, C.; et al. Acidification of tumor at stromal boundaries drives transcriptome alterations associated with aggressive phenotypes. Cancer Res. 2019, 79, 1952–1966. [Google Scholar] [CrossRef]
- LoPachin, R.M.; Gavin, T.; DeCaprio, A.; Barber, D.S. Application of the Hard and Soft, Acids and Bases (HSAB) Theory to Toxicant–Target Interactions. Chem. Res. Toxicol. 2012, 25, 239–251. [Google Scholar] [CrossRef]
- Bernardes, A.; D’Oliveira, G.D.C.; Silezin, A.; Kuzma, M.; Molnár, S.; Noda Pérez, C.; Perjési, P. Reagent-induced asymmetric induction in addition reaction of reduced glutathione onto bis-mannich chalcones. Arch. Pharm. 2018, 351, 1700386. [Google Scholar] [CrossRef]
- Perjési, P.; Linnanto, J.; Kolehmainen, E.; Ősz, E.; Virtanen E., E. E-2-Benzylidenebenzocycloalkanones. IV. Studies on transmission of substituent effects on 13C NMR chemical shifts of E-2-(X-benzylidene)-1-tetralones, and -benzosuberones. Comparison with the 13C NMR data of chalcones and E-2-(X-benzylidene)-1-indanones. J. Mol. Struct. 2005, 740, 81–89. [Google Scholar] [CrossRef]
- Allen, C.F.H.; Humphlett, W.J. The Thermal Reversibility of the Michael Reaction: V. the Effect of the Structure of Certain Thiol Adducts on Cleavage. Can. J. Chem. 1966, 44, 2315–2321. [Google Scholar] [CrossRef]
- Frisch, M.; Trucks, G.; Schlegel, H.; Scuseria, G.; Robb, M.; Cheeseman, J.; Scalmani, G.; Barone, V.; Petersson, G.; Nakatsuji, H. Gaussian 16 Revision C. 01. 2016; Gaussian Inc. Wallingford CT 2016, 421. [Google Scholar]
- Zhao, Y.; Truhlar, D.G. The M06 Suite of Density Functionals for Main Group Thermochemistry, Thermochemical Kinetics, Non-covalent Interactions, Excited States, and Transition Elements: Two New Functionals and Systematic Testing of Four M06-Class Functionals and 12 Other Functionals. Theoretical Chemistry Accounts 2008, 120, 215–241. [Google Scholar]
- Zhang, G.; Musgrave, C.B. Comparison of DFT Methods for Molecular Orbital Eigenvalue Calculations. The Journal of Physical Chemistry A 2007, 111, 1554–1561. [Google Scholar] [CrossRef]
- Weiner, P.K.; Langridge, R.; Blaney, J.M.; Schaefer, R.; Kollman, P.A. Electrostatic Potential Molecular Surfaces. Proc. Natl. Acad. Sci. U.S.A. 1982, 79, 3754–3758. [Google Scholar] [CrossRef]
- Naray-Szabo, G.; Ferenczy, G.G. Molecular Electrostatics. Chemical Reviews 1995, 95, 829–847. [Google Scholar] [CrossRef]
- Fukui, K. The Role of Frontier Orbitals in Chemical Reactions (Nobel Lecture). Angewandte Chemie International Edition in English 1982, 21, 801–809. [Google Scholar] [CrossRef]
- Fukui, K. Role of Frontier Orbitals in Chemical Reactions. Science 1982, 218, 747–754. [Google Scholar] [CrossRef] [PubMed]
Figure 1.
Structural formula and numbering of 4-X-chalcones (1) and (E)-2-(4’-X-phenylmethylene)-1-tetralones (2) and -benzosuberones (3).
Figure 1.
Structural formula and numbering of 4-X-chalcones (1) and (E)-2-(4’-X-phenylmethylene)-1-tetralones (2) and -benzosuberones (3).
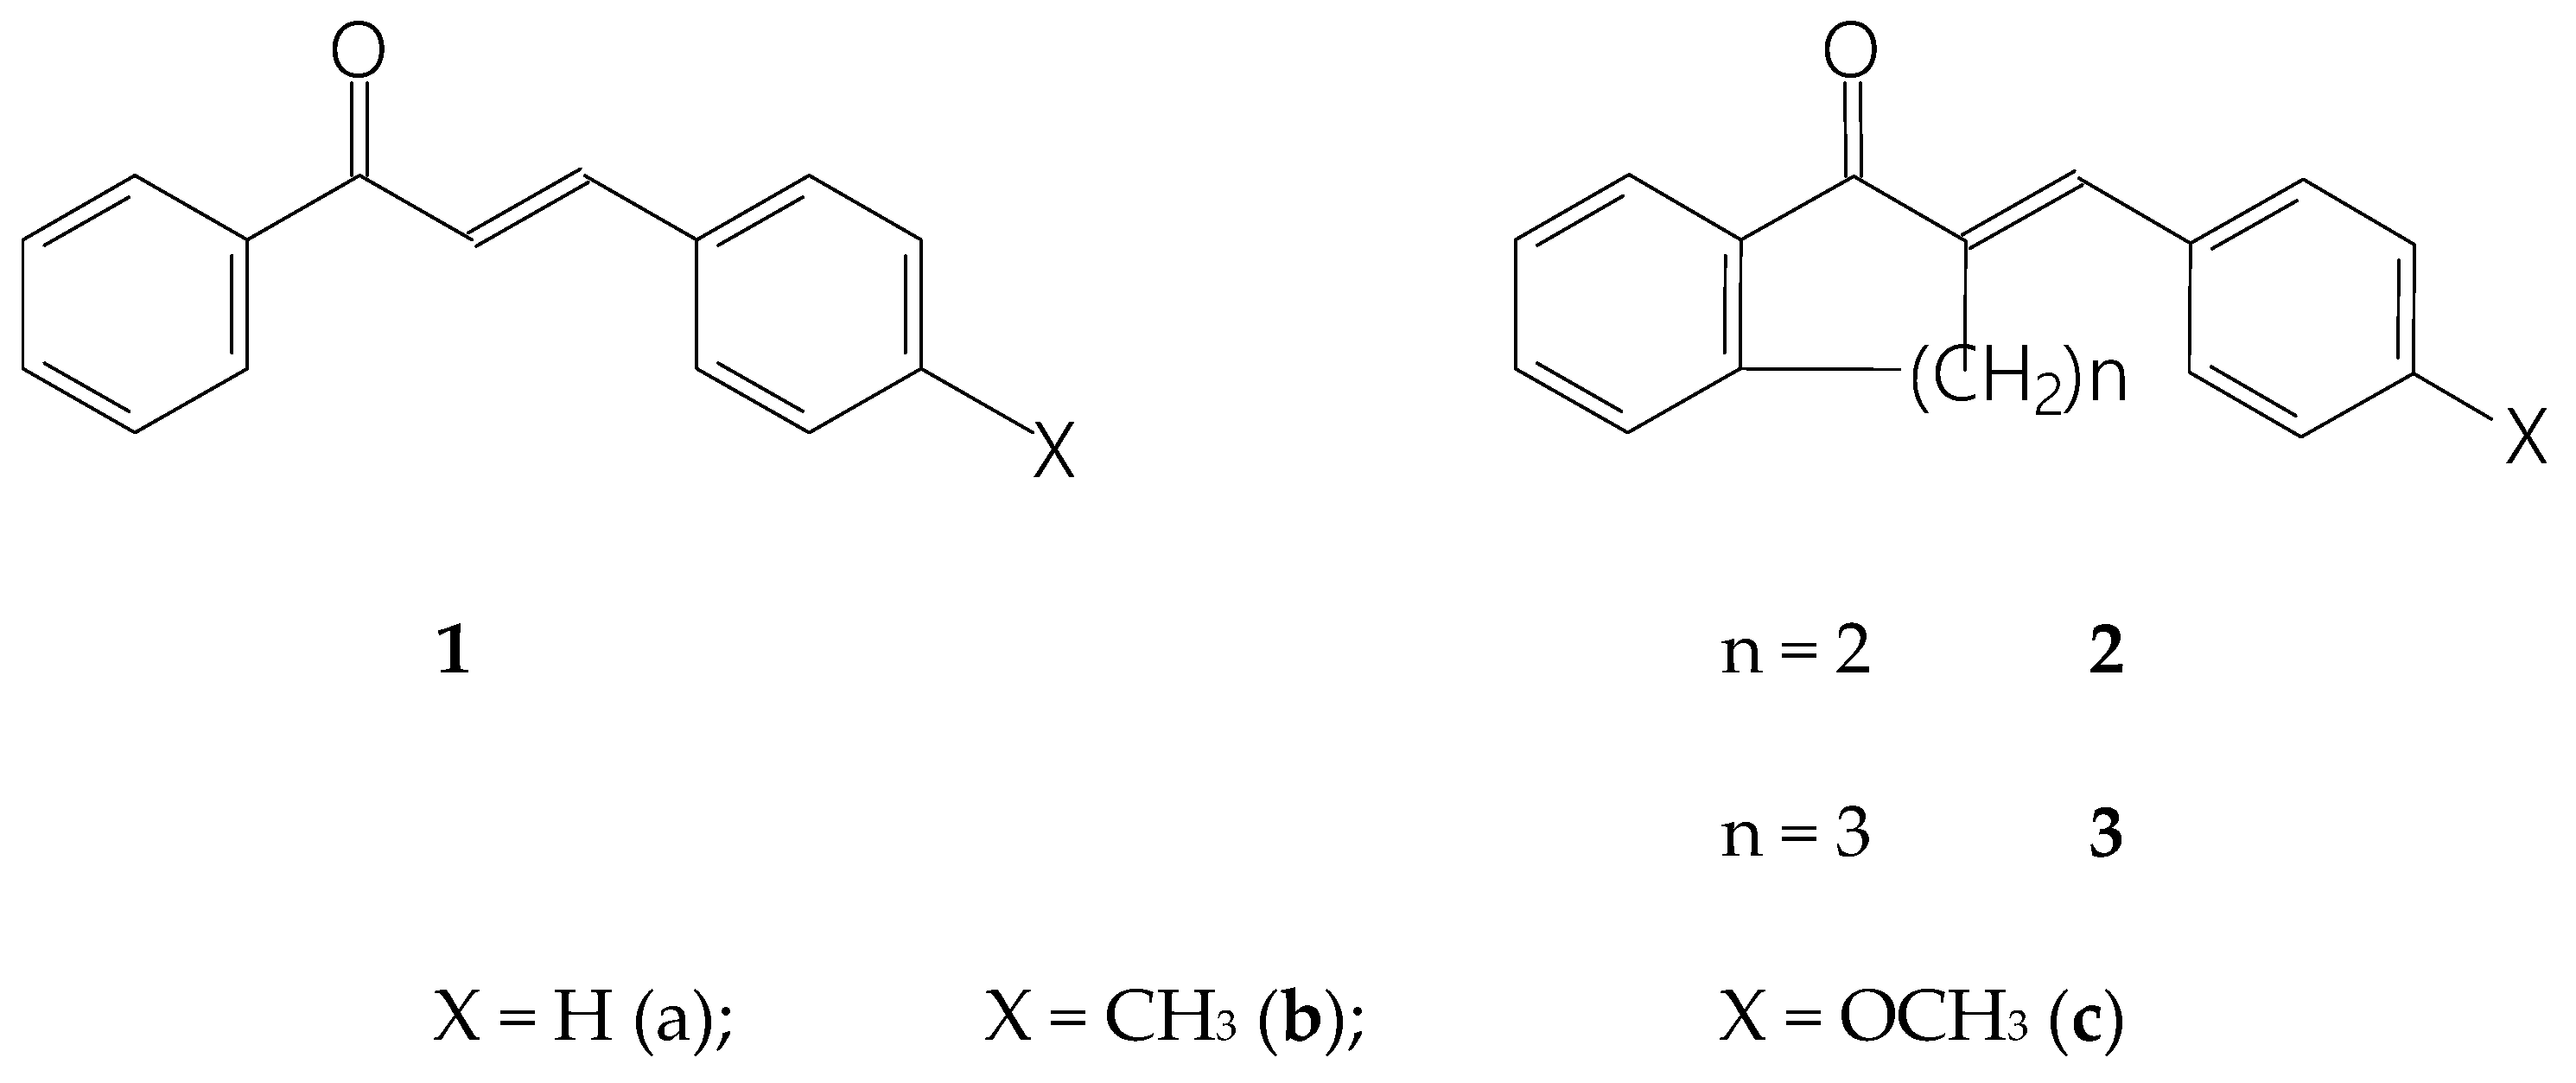
Figure 2.
Change in the chromatographic peak area of chalcones 2b and 2c in the chalcone-GSH incubations at pH 8.0.
Figure 2.
Change in the chromatographic peak area of chalcones 2b and 2c in the chalcone-GSH incubations at pH 8.0.
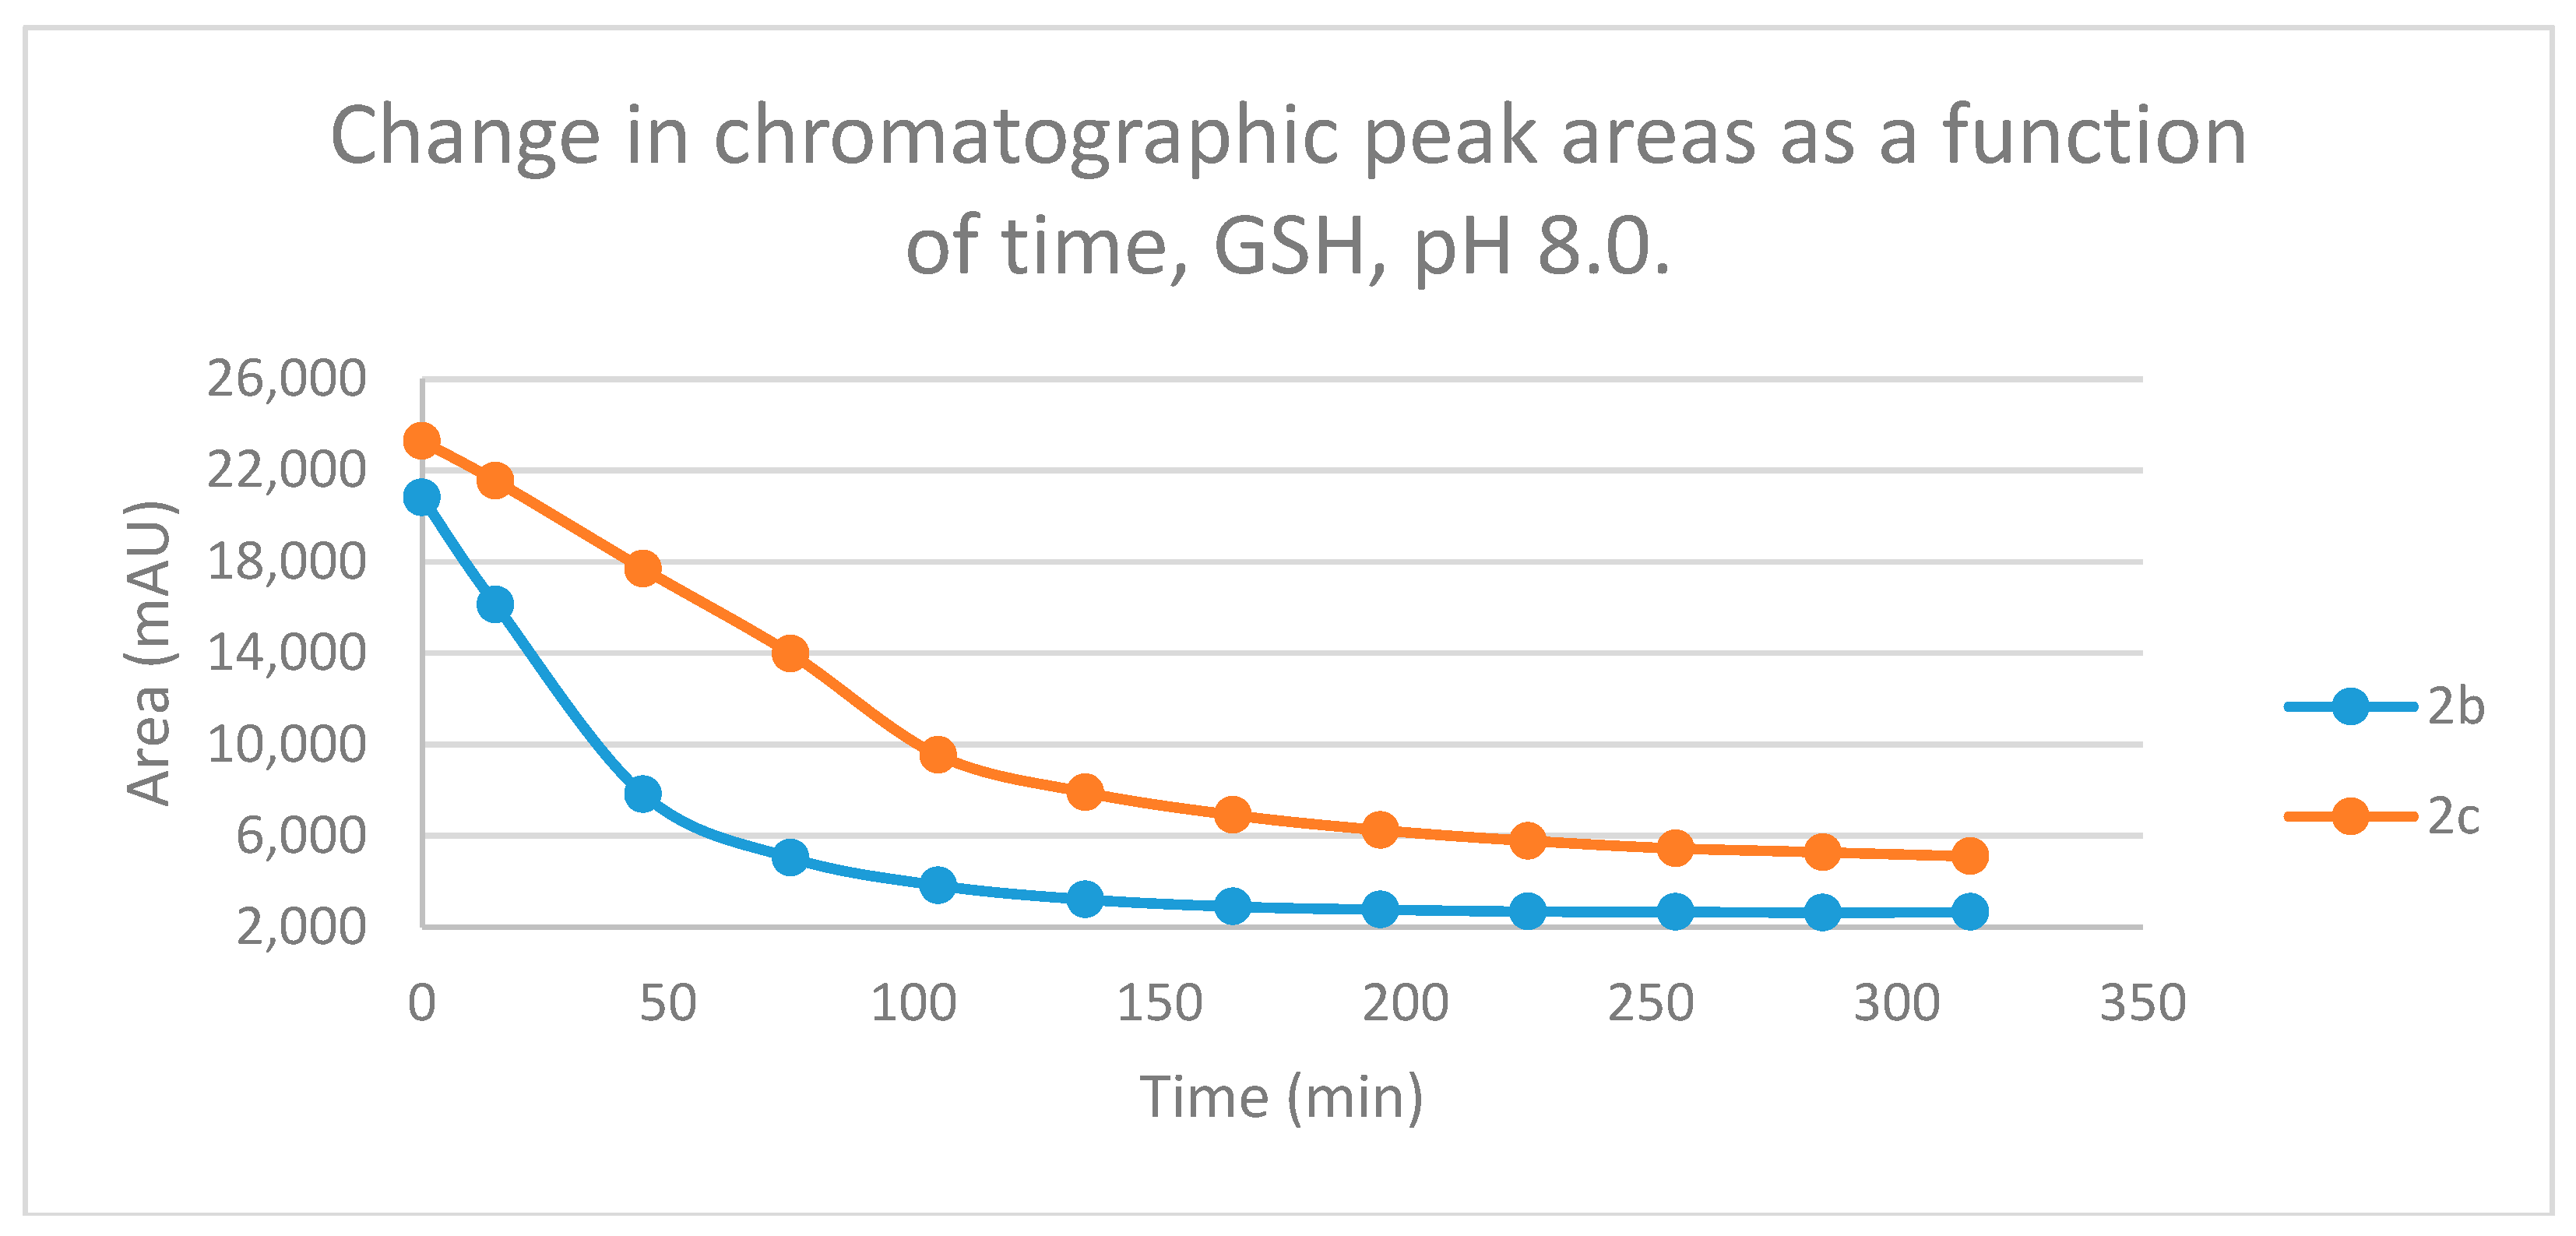
Figure 3.
Change in the chromatographic peak area of chalcones 2b and 2c in the chalcone–NAC incubations at pH 8.0.
Figure 3.
Change in the chromatographic peak area of chalcones 2b and 2c in the chalcone–NAC incubations at pH 8.0.
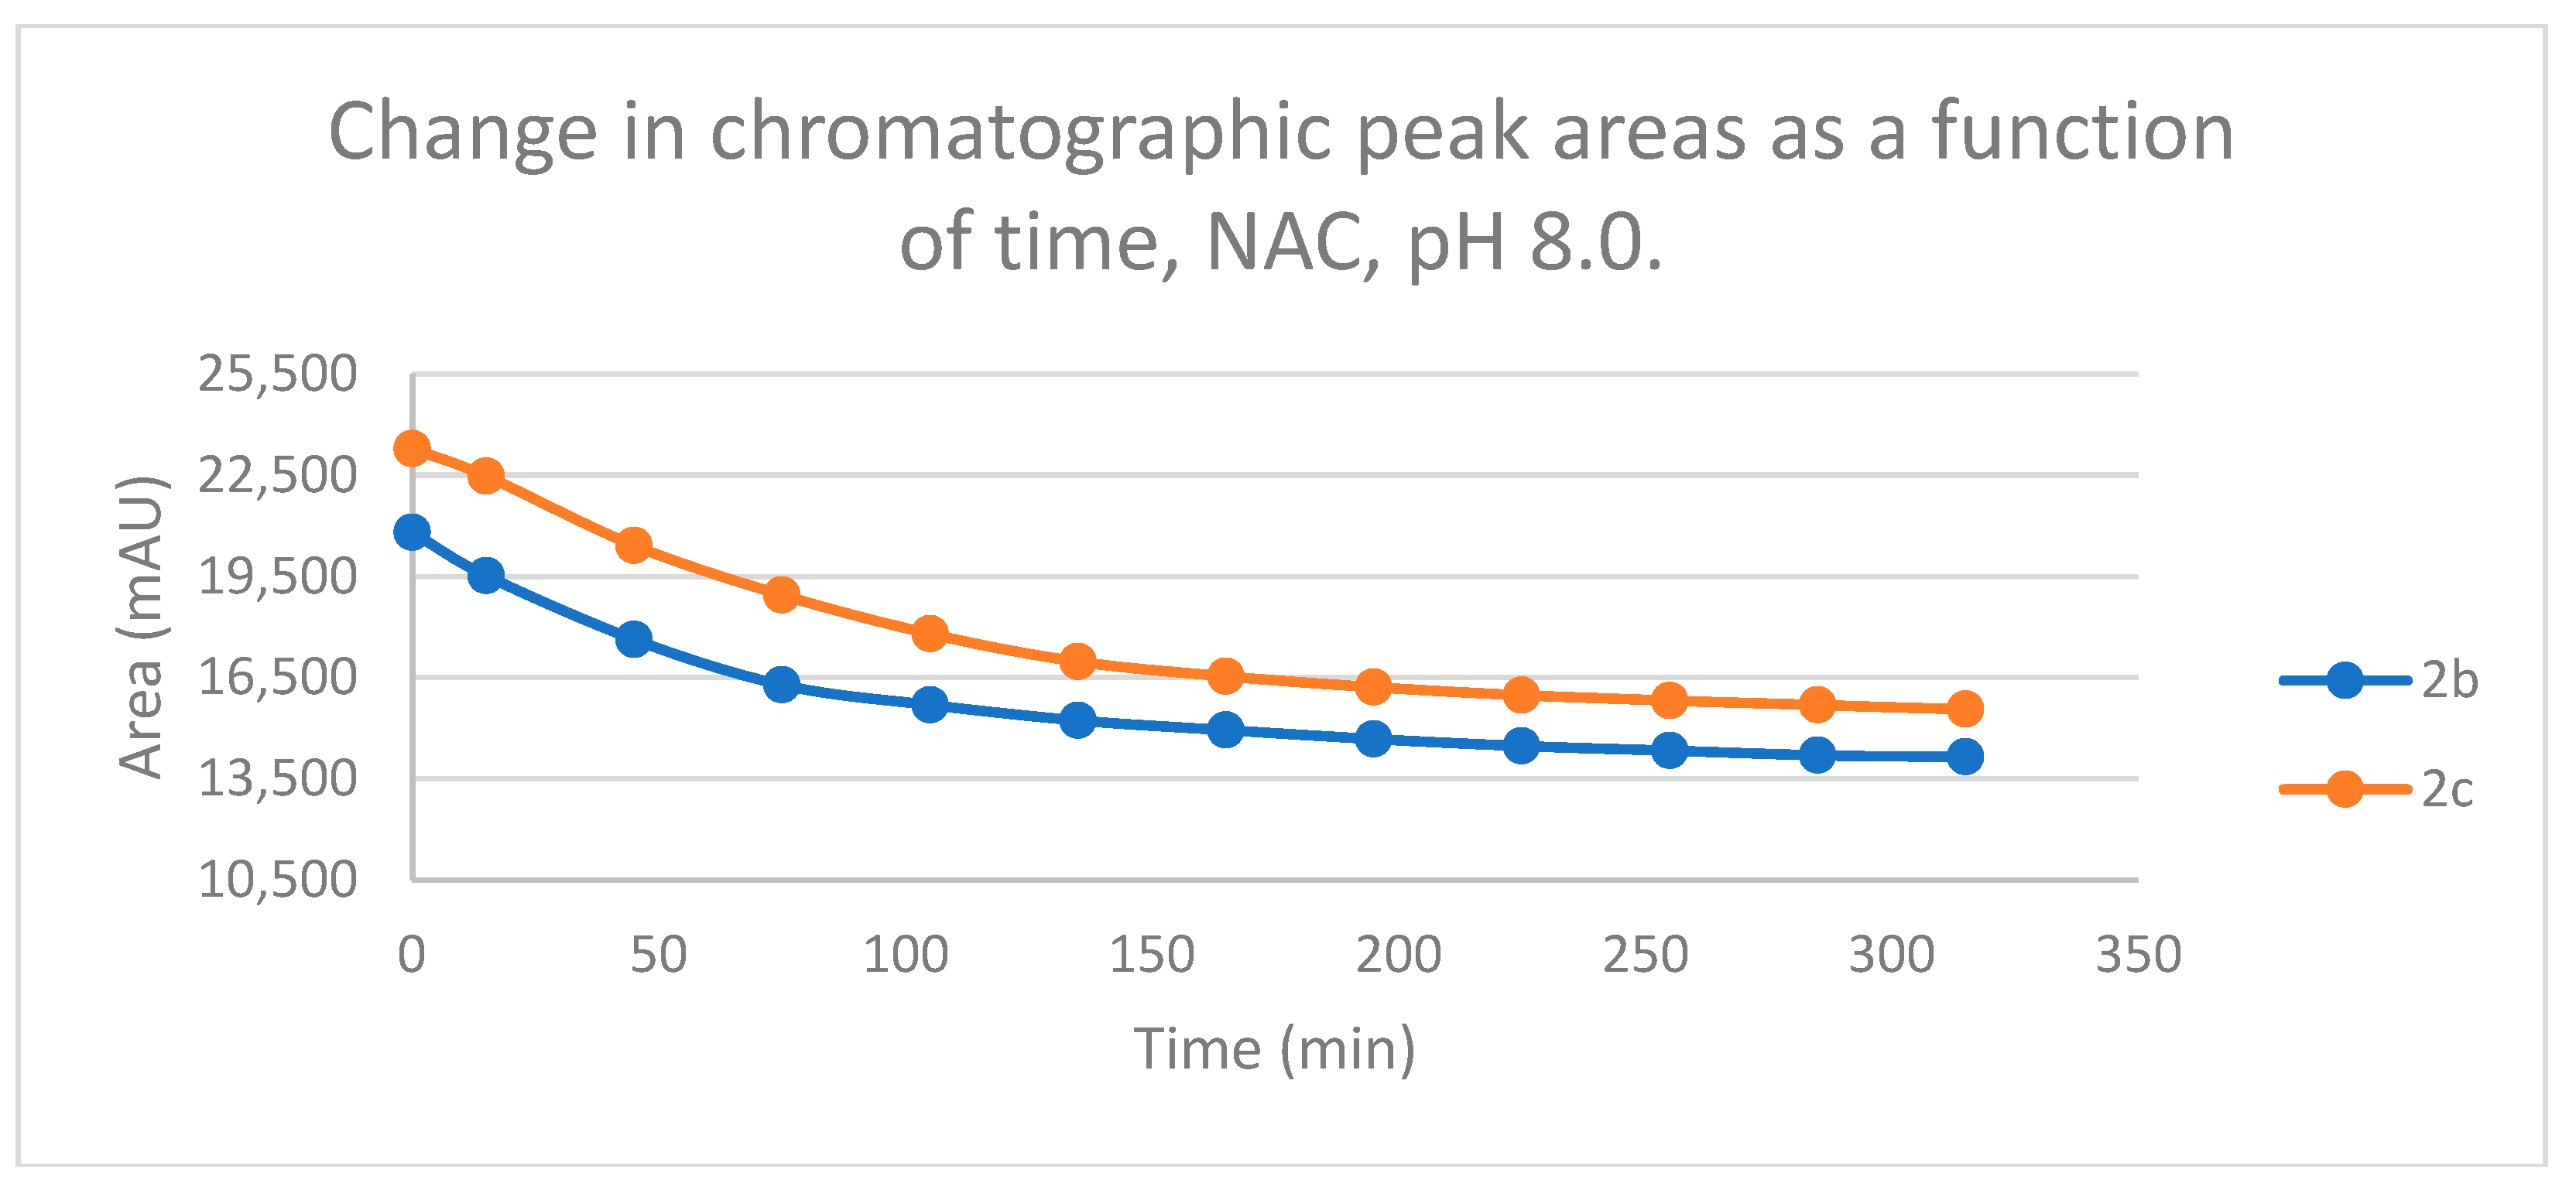
Figure 4.
Change in the chromatographic peak area of adduct 1 of 2b and 2c in the chalcone-GSH incubations at pH 8.0.
Figure 4.
Change in the chromatographic peak area of adduct 1 of 2b and 2c in the chalcone-GSH incubations at pH 8.0.
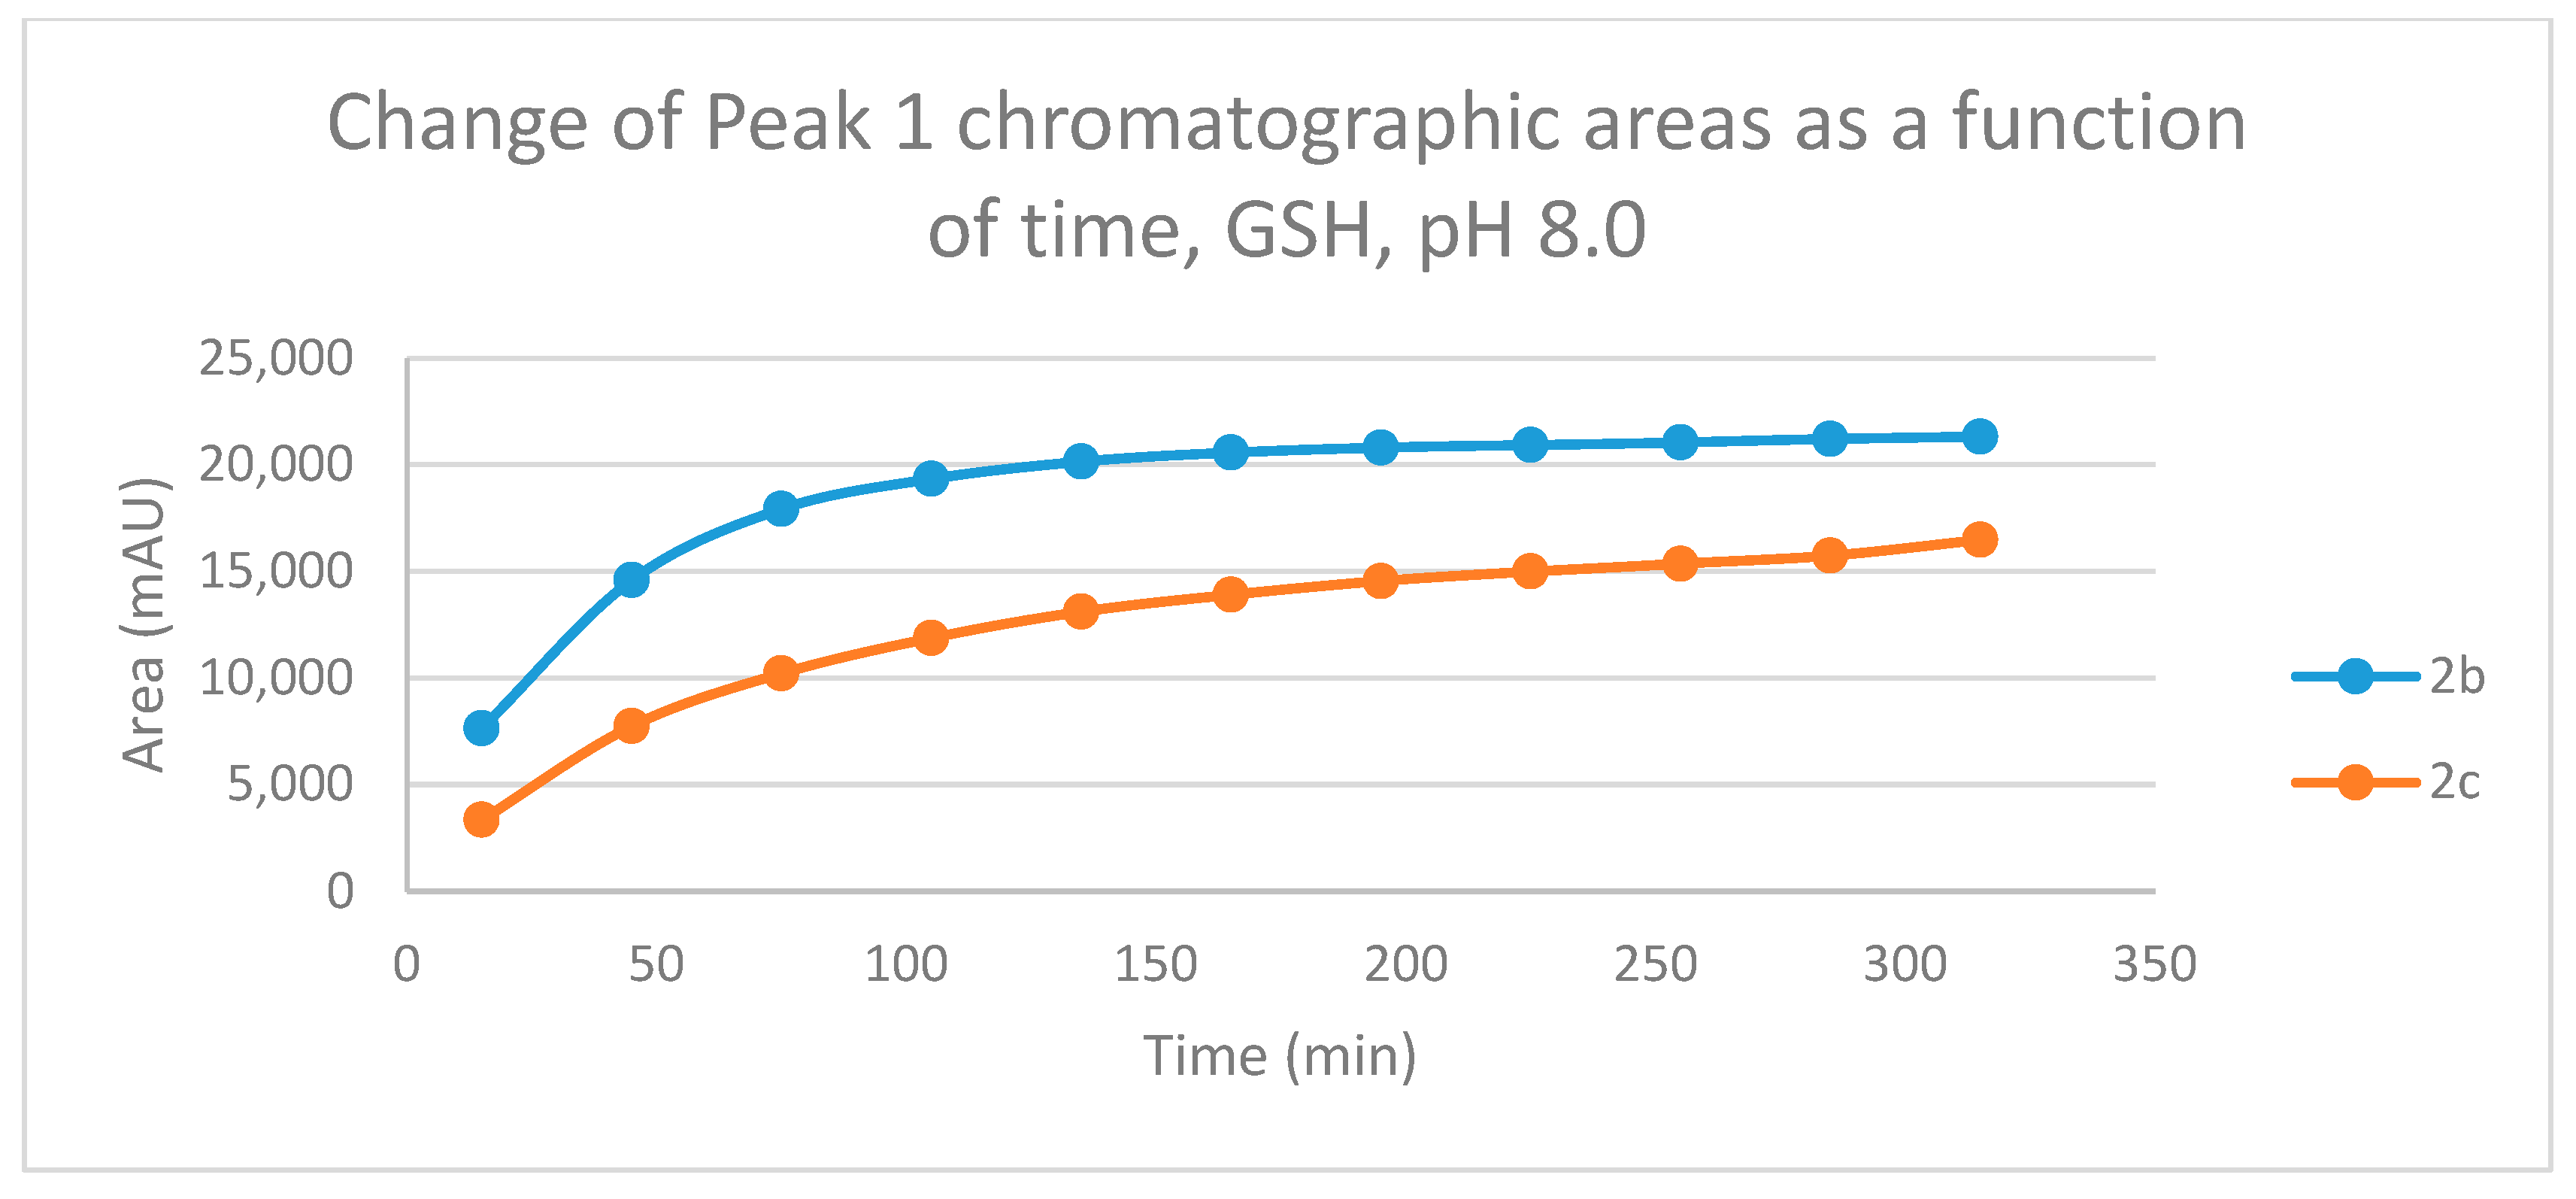
Figure 5.
Change in the chromatographic peak area of adduct 2 of 2c in the chalcone-GSH incubations at pH 8.0.
Figure 5.
Change in the chromatographic peak area of adduct 2 of 2c in the chalcone-GSH incubations at pH 8.0.
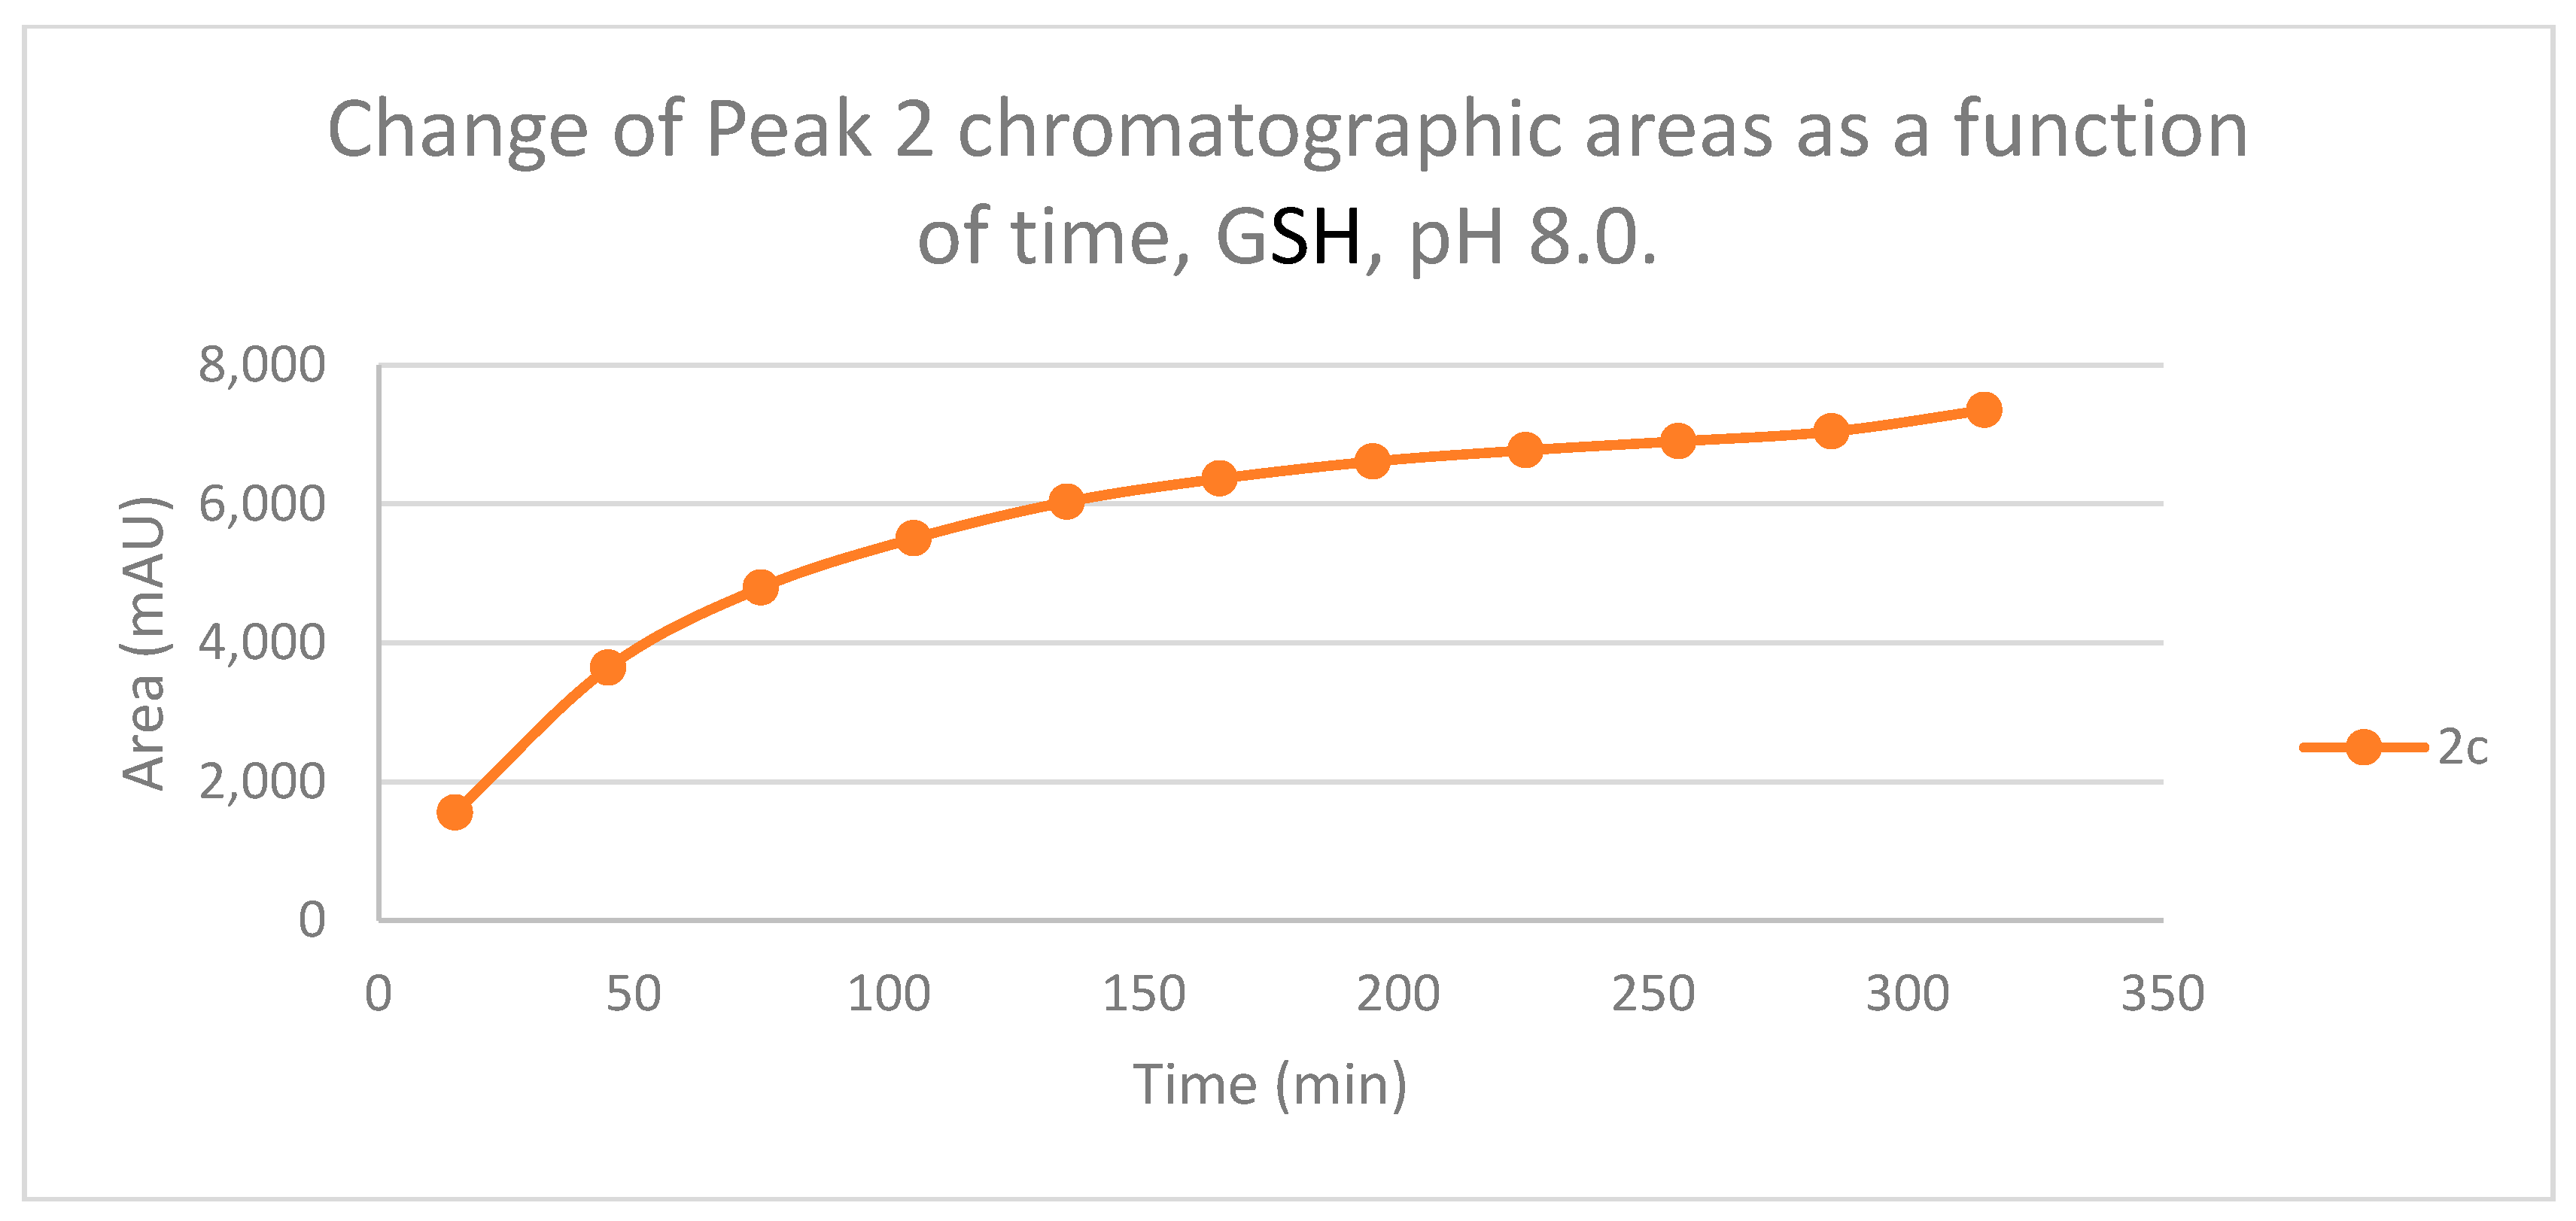
Figure 6.
Change in the chromatographic peak area of adduct 1 of 2b and 2c in the chalcone-NAC incubations at pH 8.0.
Figure 6.
Change in the chromatographic peak area of adduct 1 of 2b and 2c in the chalcone-NAC incubations at pH 8.0.
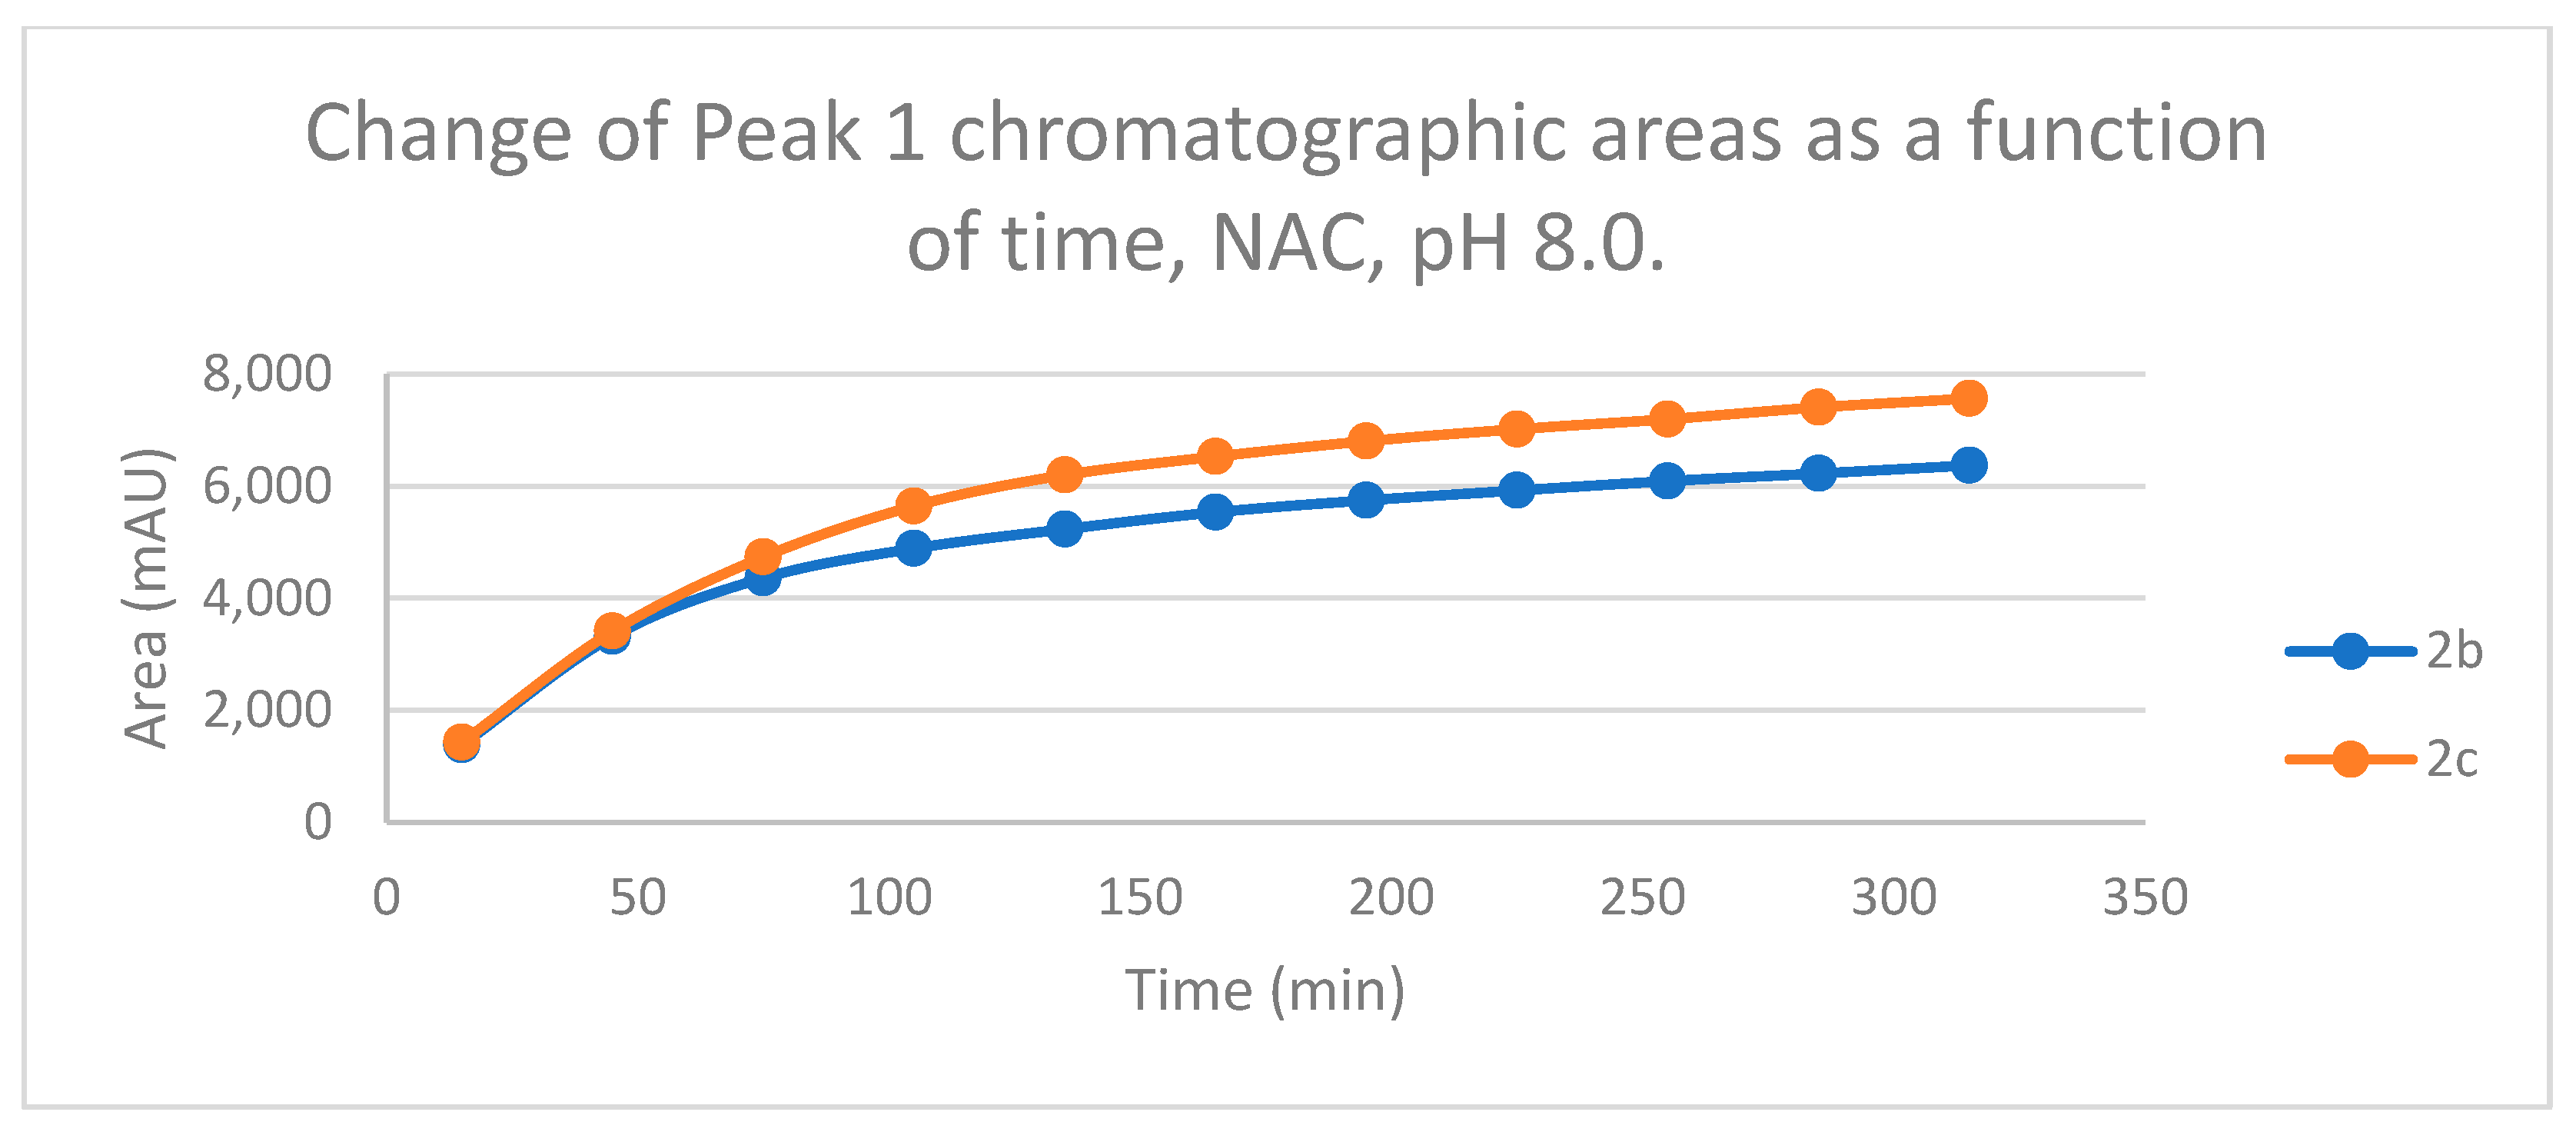
Figure 7.
Change in the chromatographic peak area of adduct 2 of 2b and 2c in the chalcone-NAC incubations at pH 8.0.
Figure 7.
Change in the chromatographic peak area of adduct 2 of 2b and 2c in the chalcone-NAC incubations at pH 8.0.
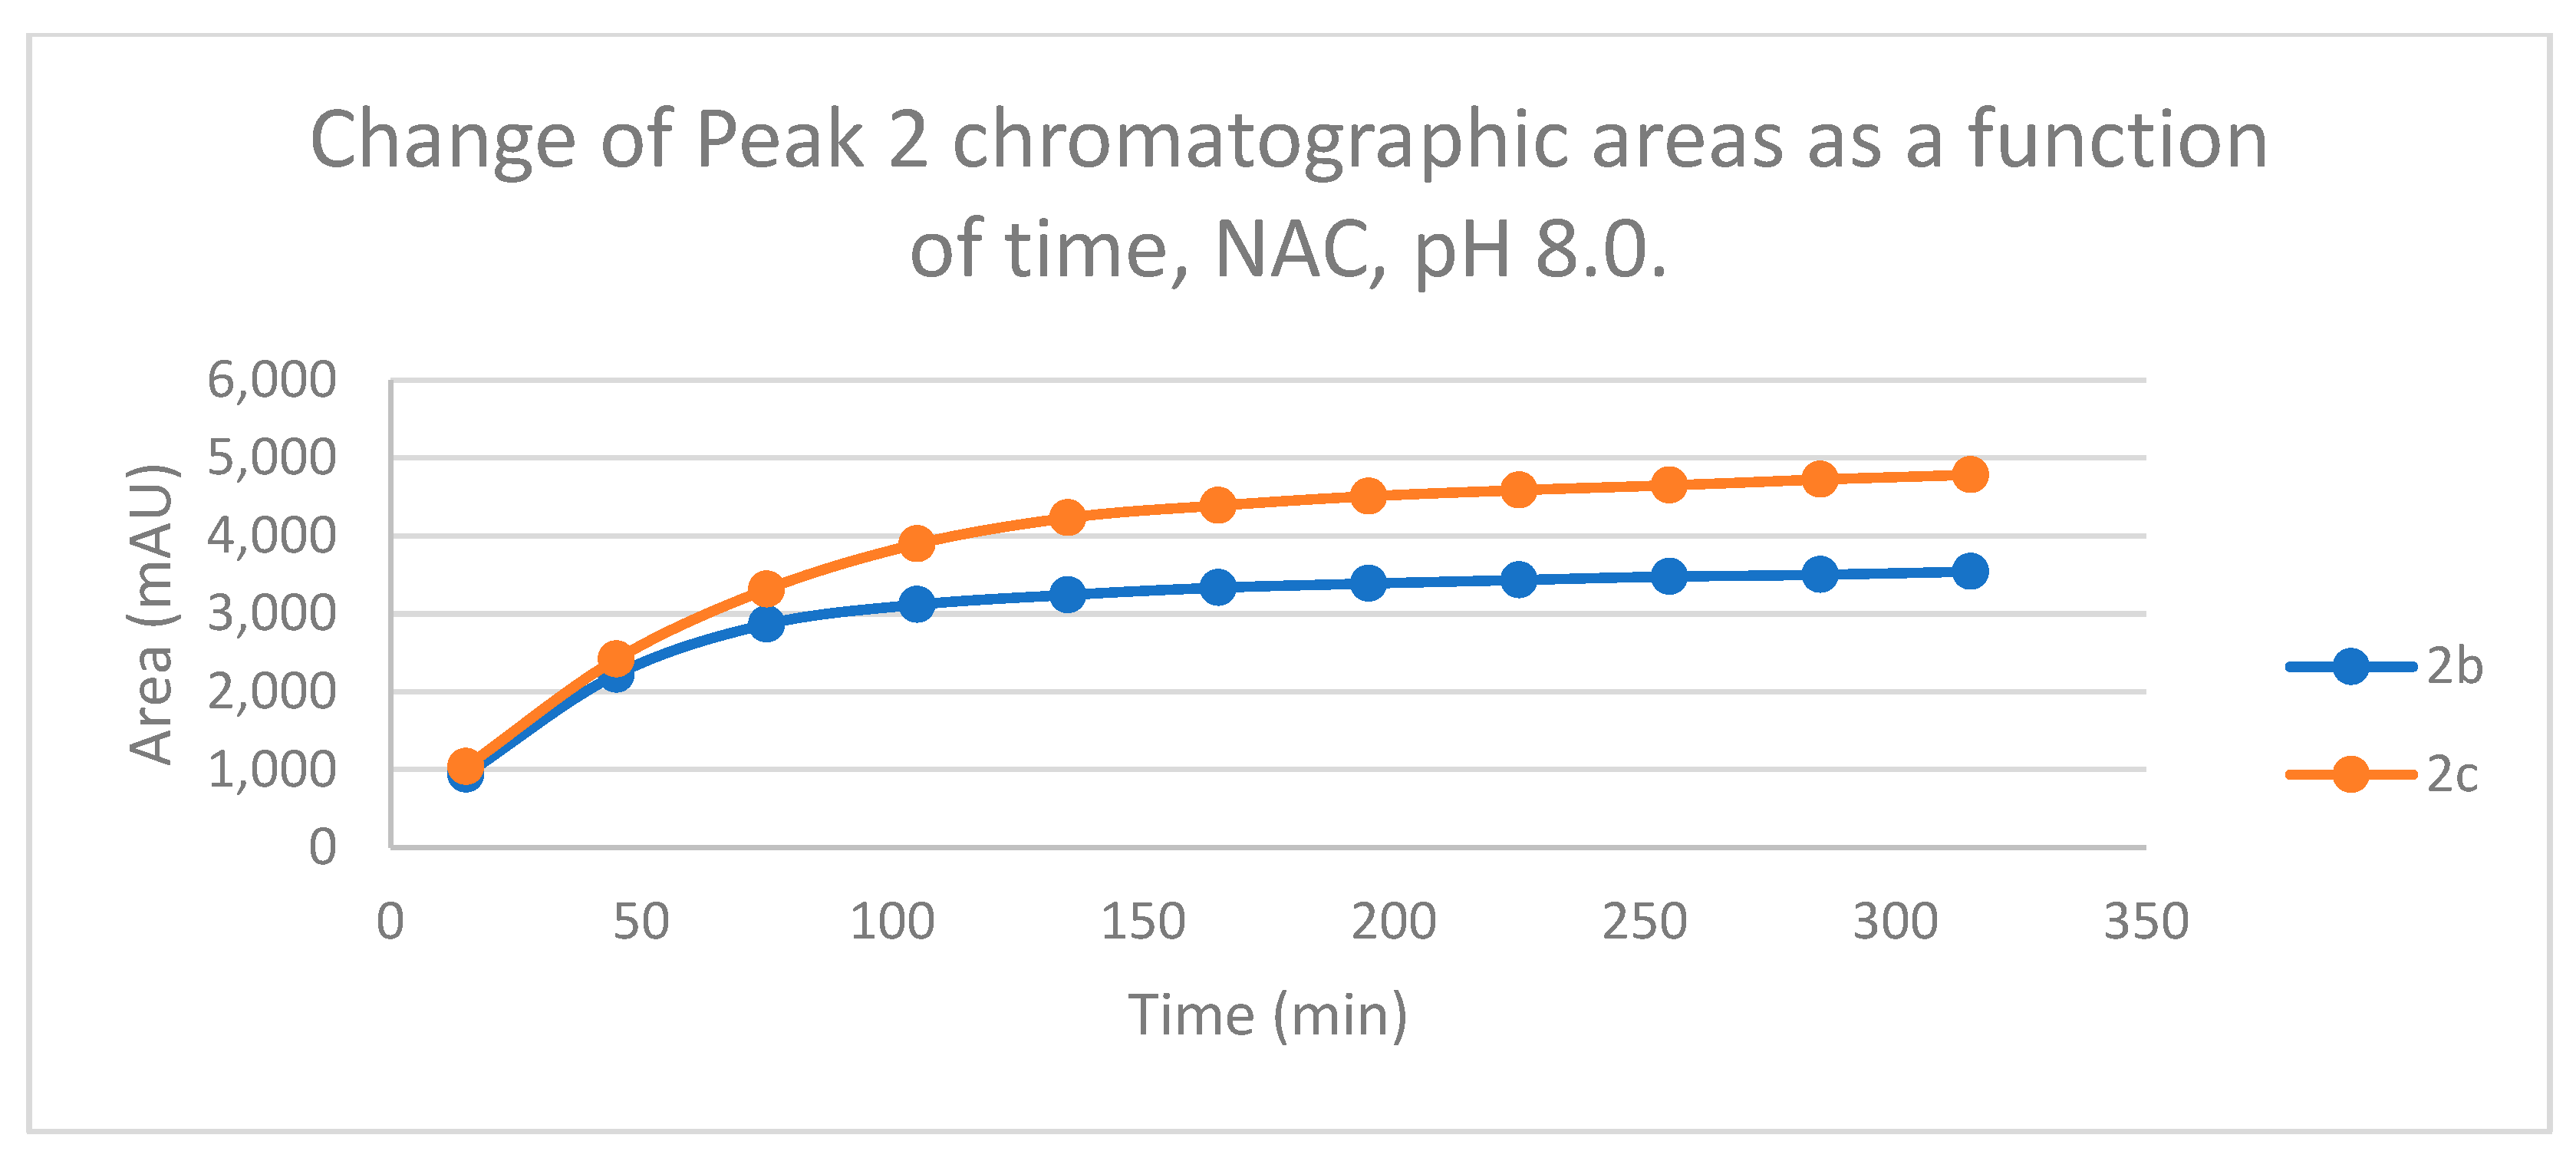
Figure 8.
Change in the chromatographic peak area of chalcones 2b and 2c in the chalcone–GSH incubations at pH 6.3.
Figure 8.
Change in the chromatographic peak area of chalcones 2b and 2c in the chalcone–GSH incubations at pH 6.3.
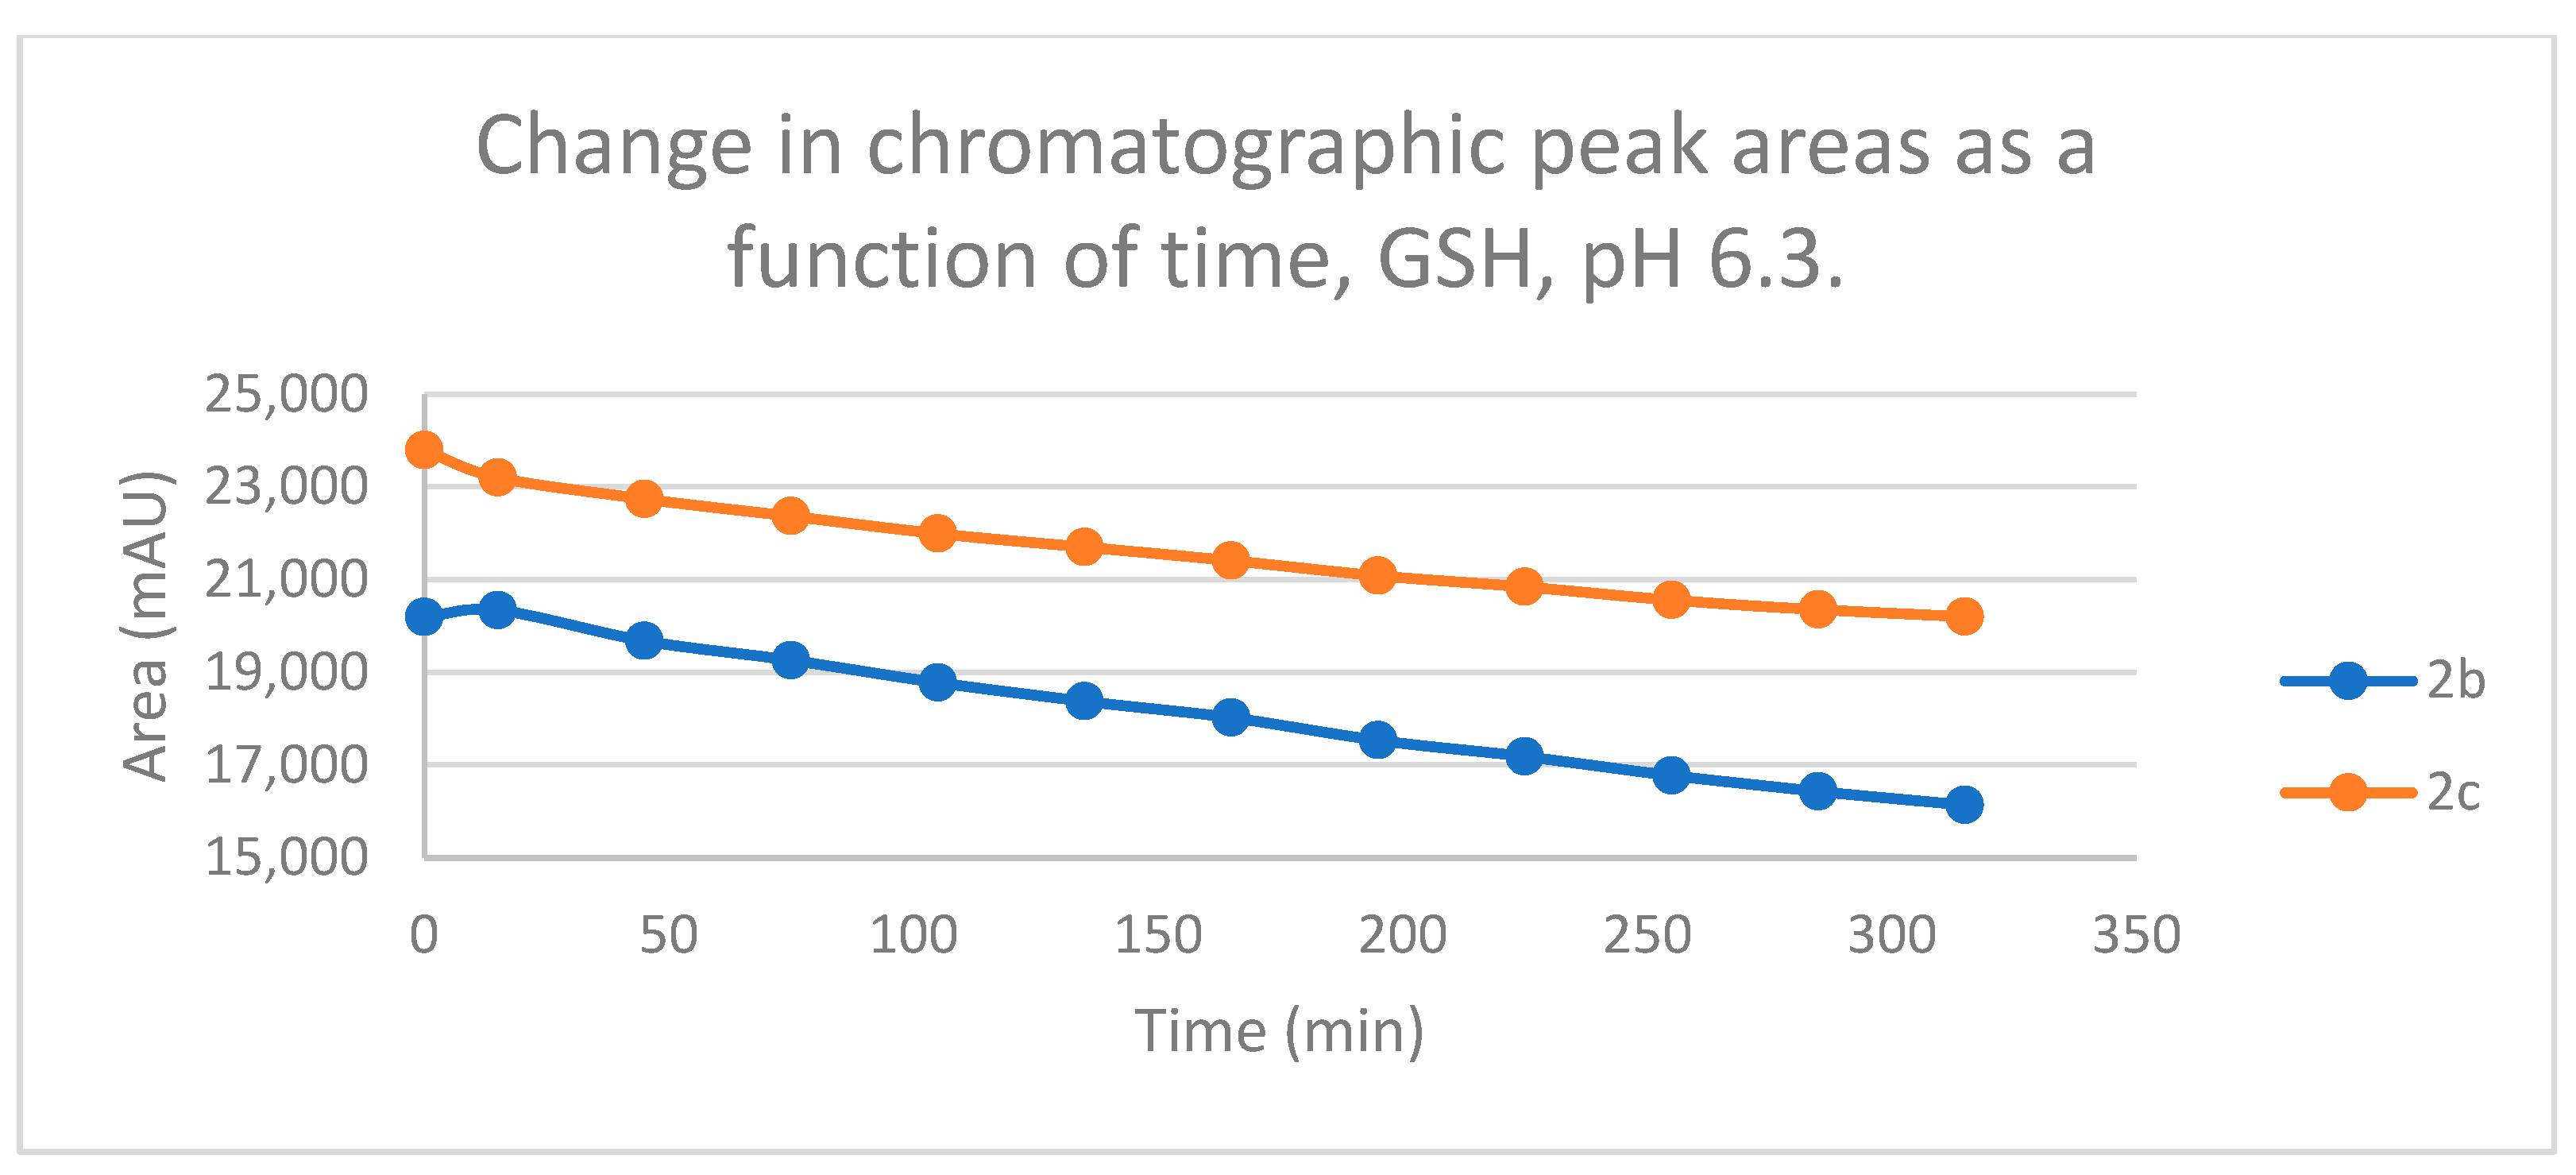
Figure 9.
Change in the chromatographic peak area of chalcones 2b and 2c in the chalcone–NAC incubations at pH 6.3.
Figure 9.
Change in the chromatographic peak area of chalcones 2b and 2c in the chalcone–NAC incubations at pH 6.3.
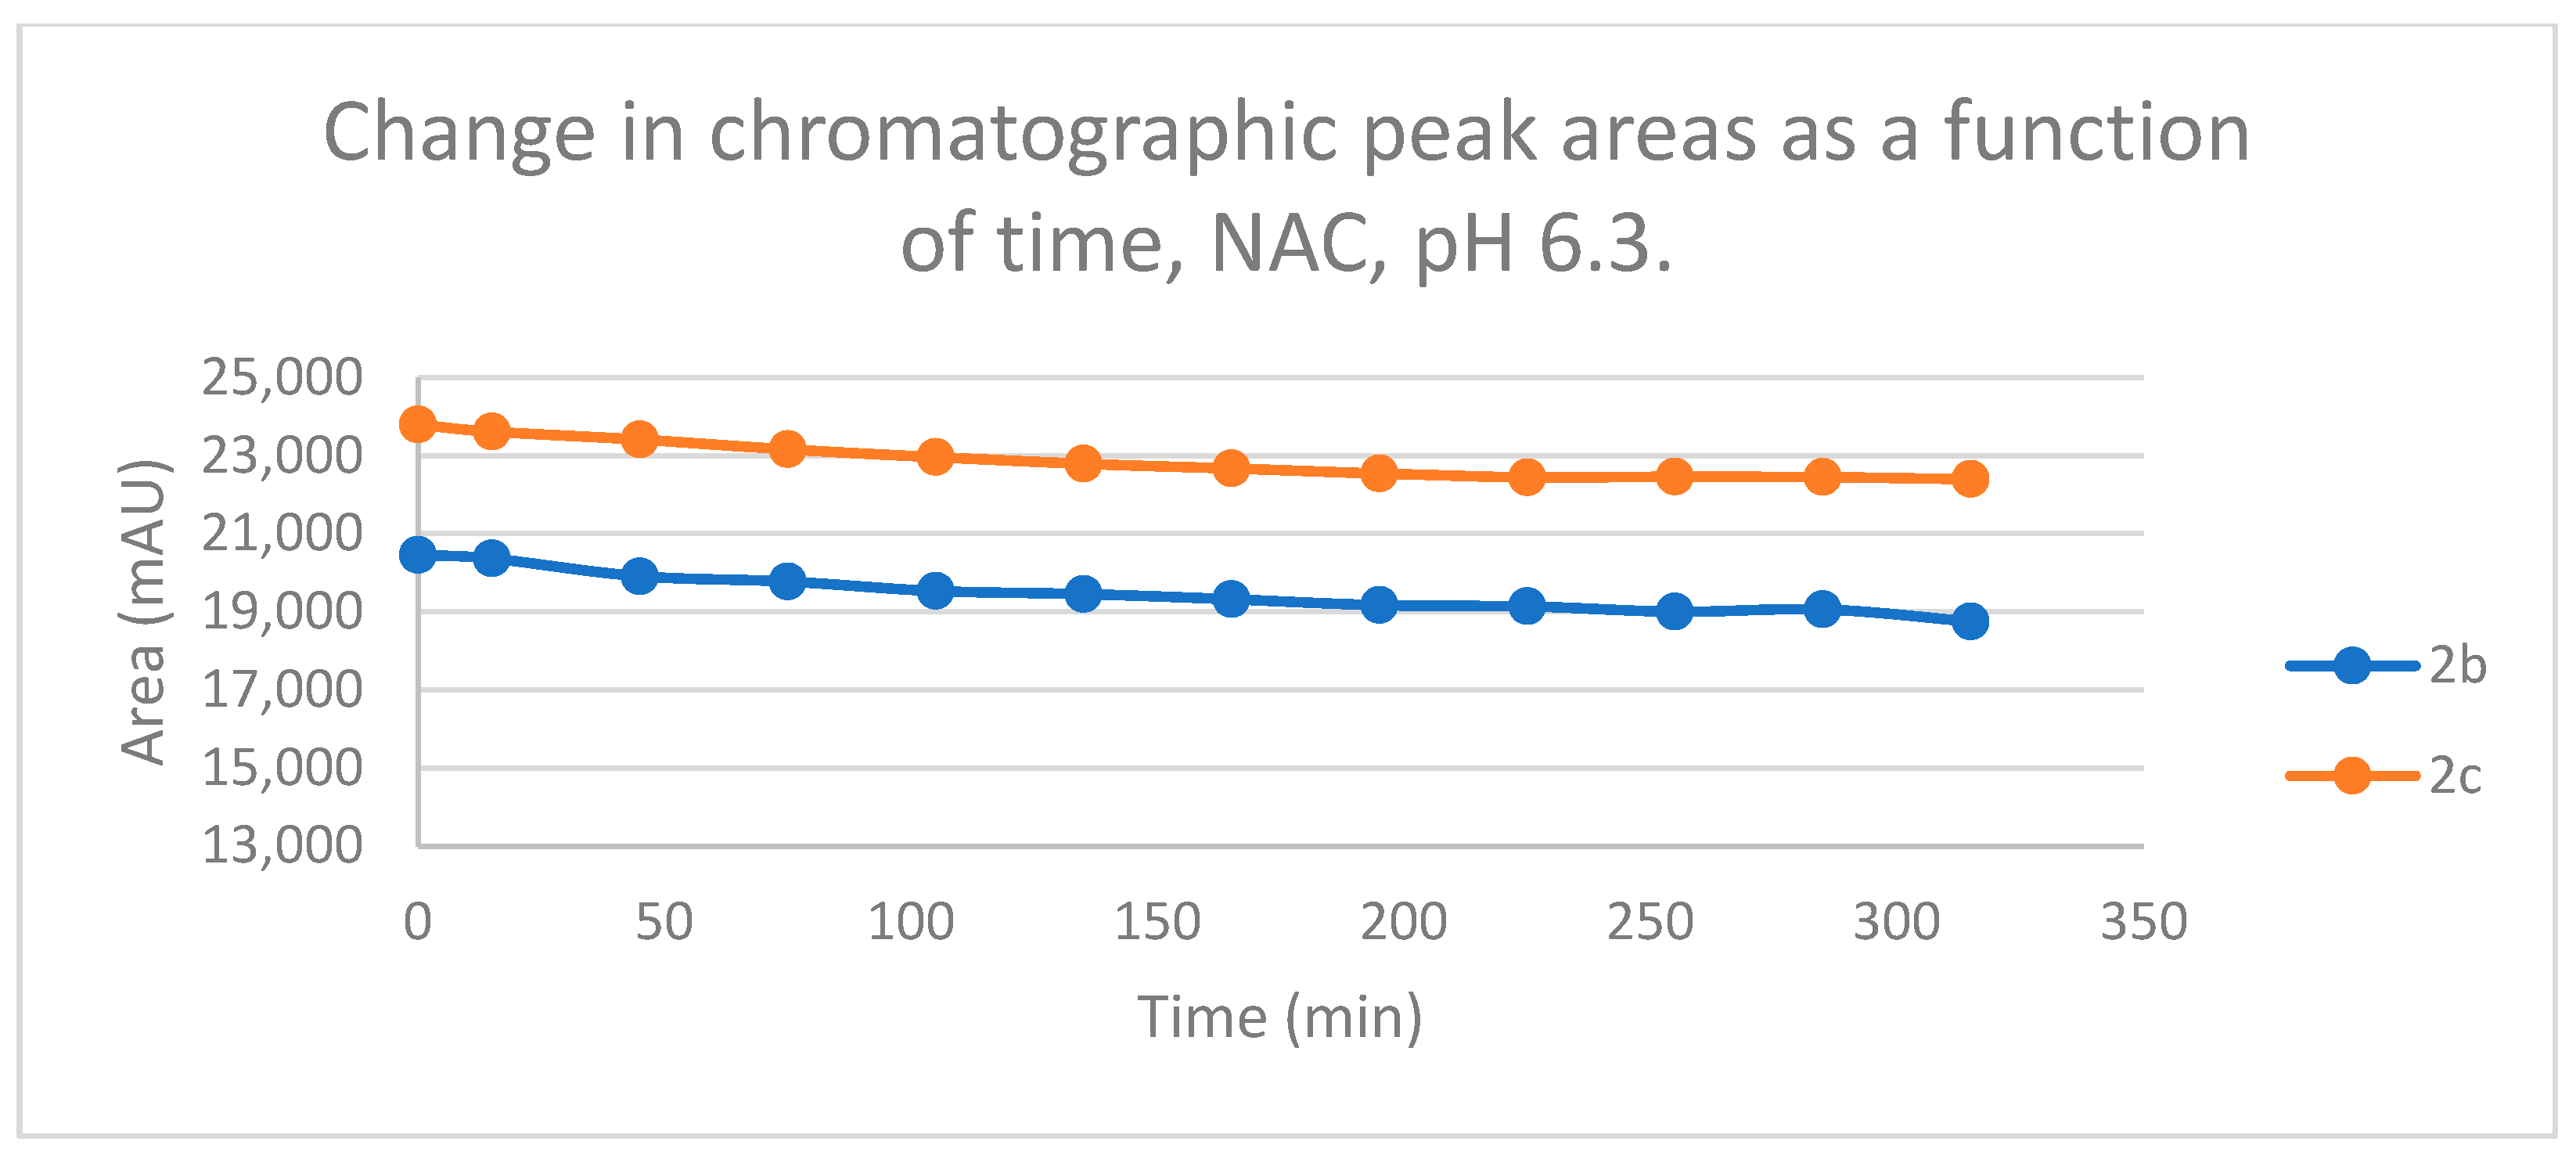
Figure 10.
Change in the chromatographic peak area of adduct 1 of 2b and 2c in the chalcone-GSH incubations at pH 6.3.
Figure 10.
Change in the chromatographic peak area of adduct 1 of 2b and 2c in the chalcone-GSH incubations at pH 6.3.
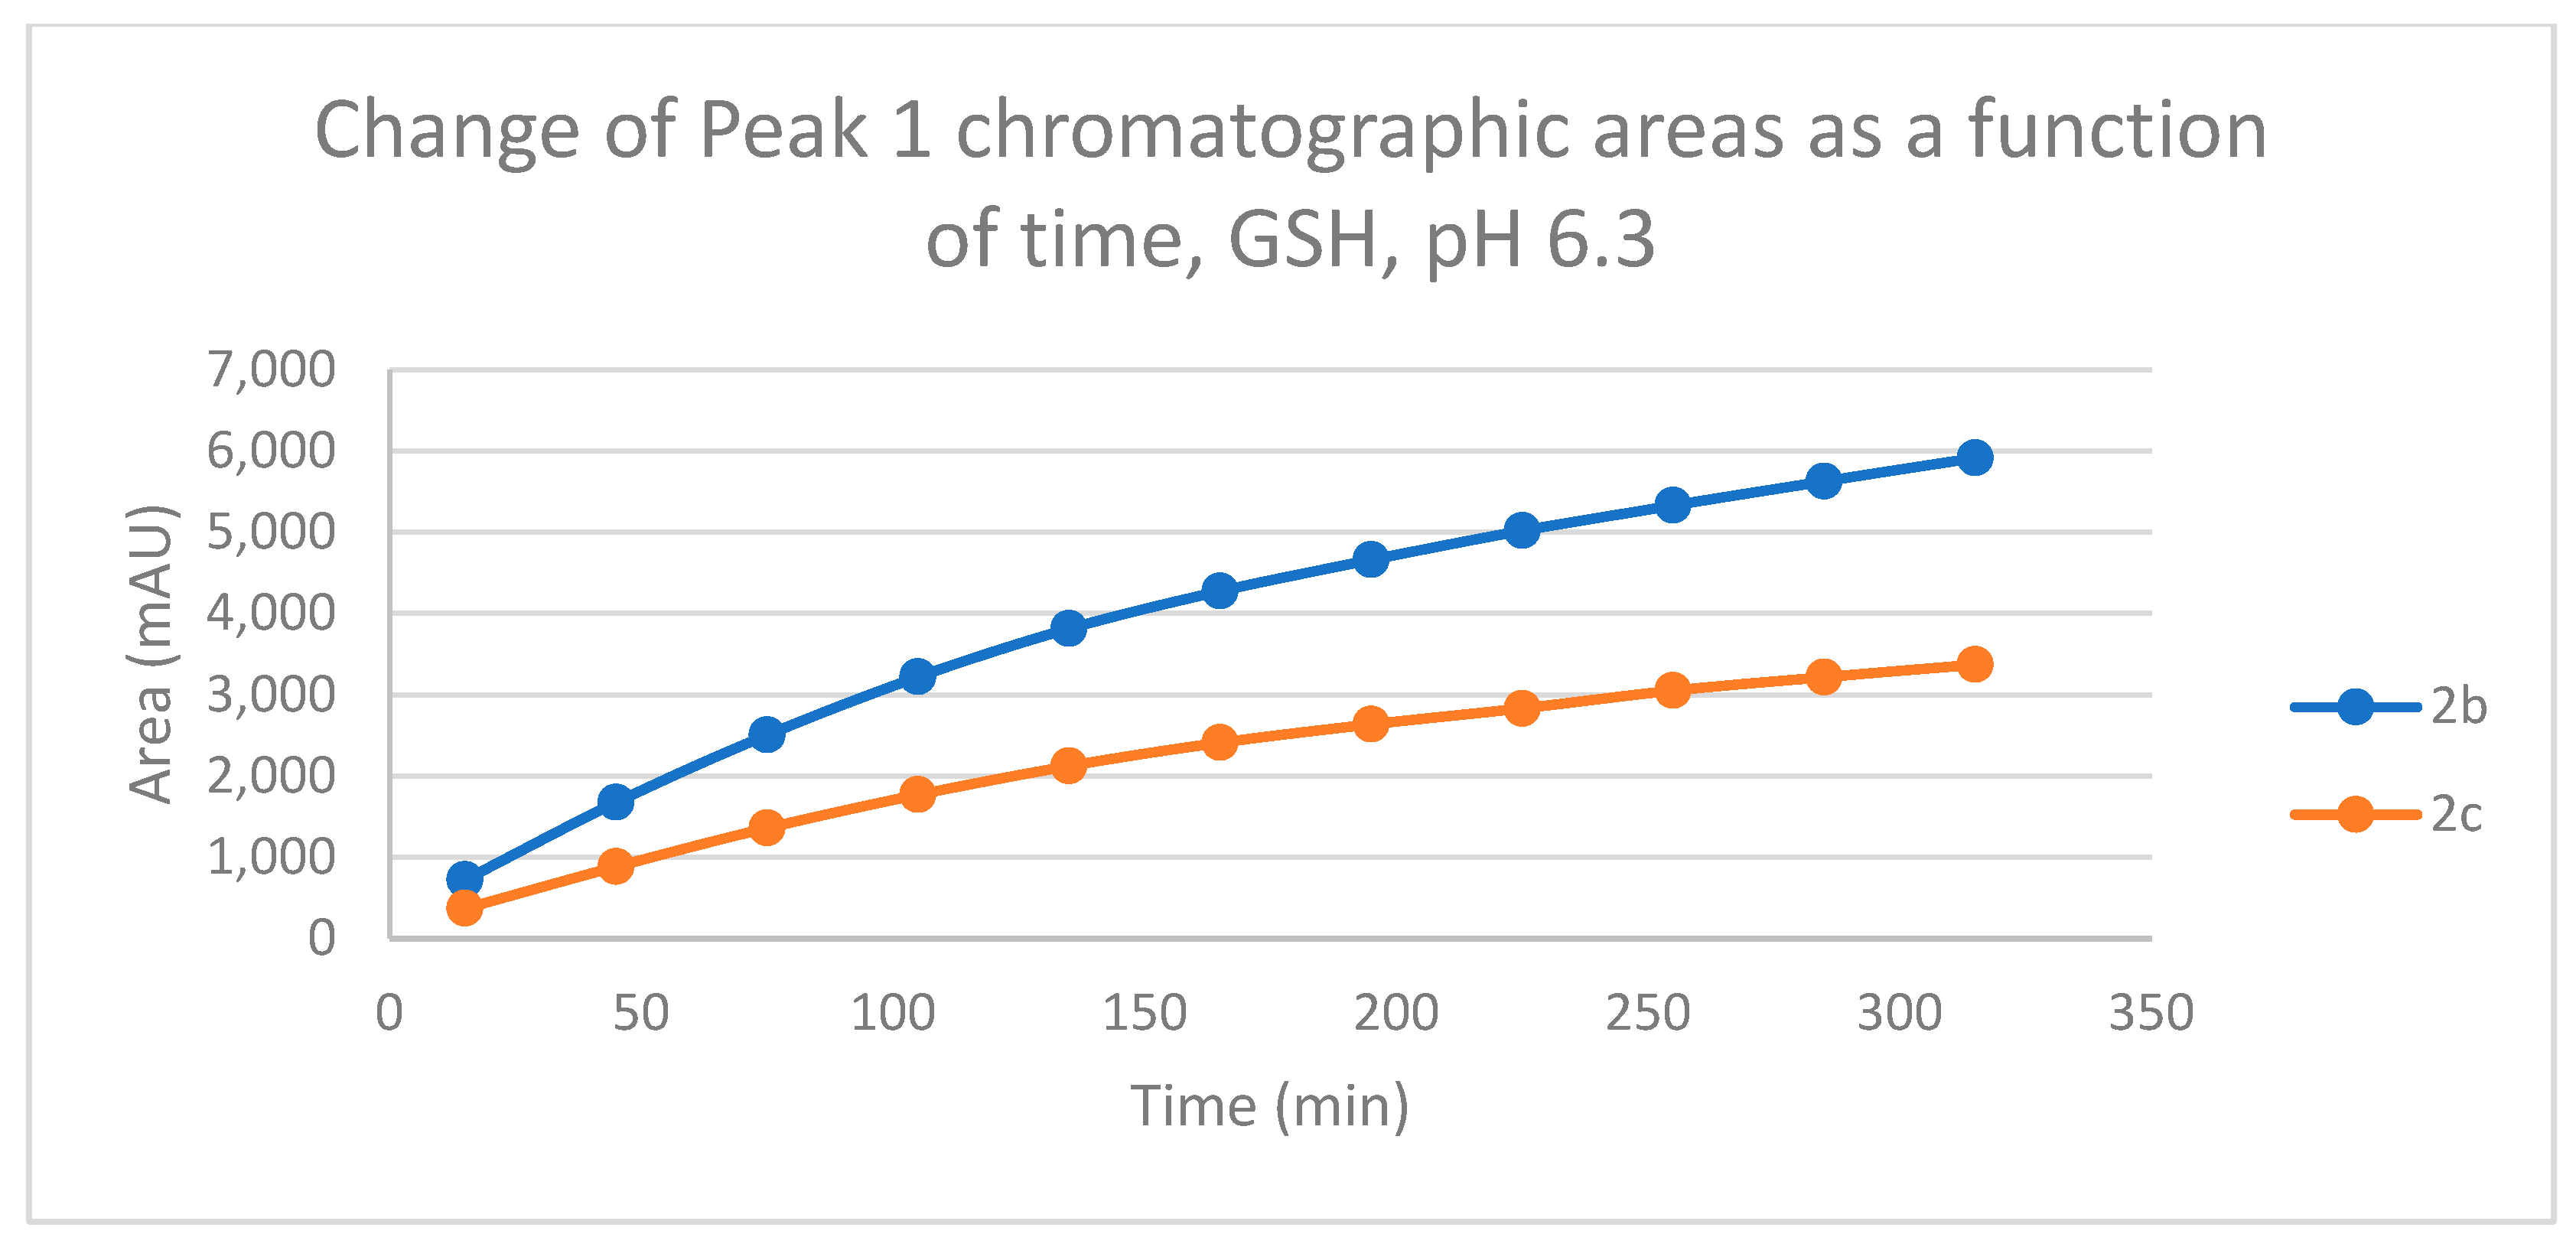
Figure 11.
Change in the chromatographic peak area of adduct 2 of 2c in the chalcone-GSH incubations at pH 6.3.
Figure 11.
Change in the chromatographic peak area of adduct 2 of 2c in the chalcone-GSH incubations at pH 6.3.
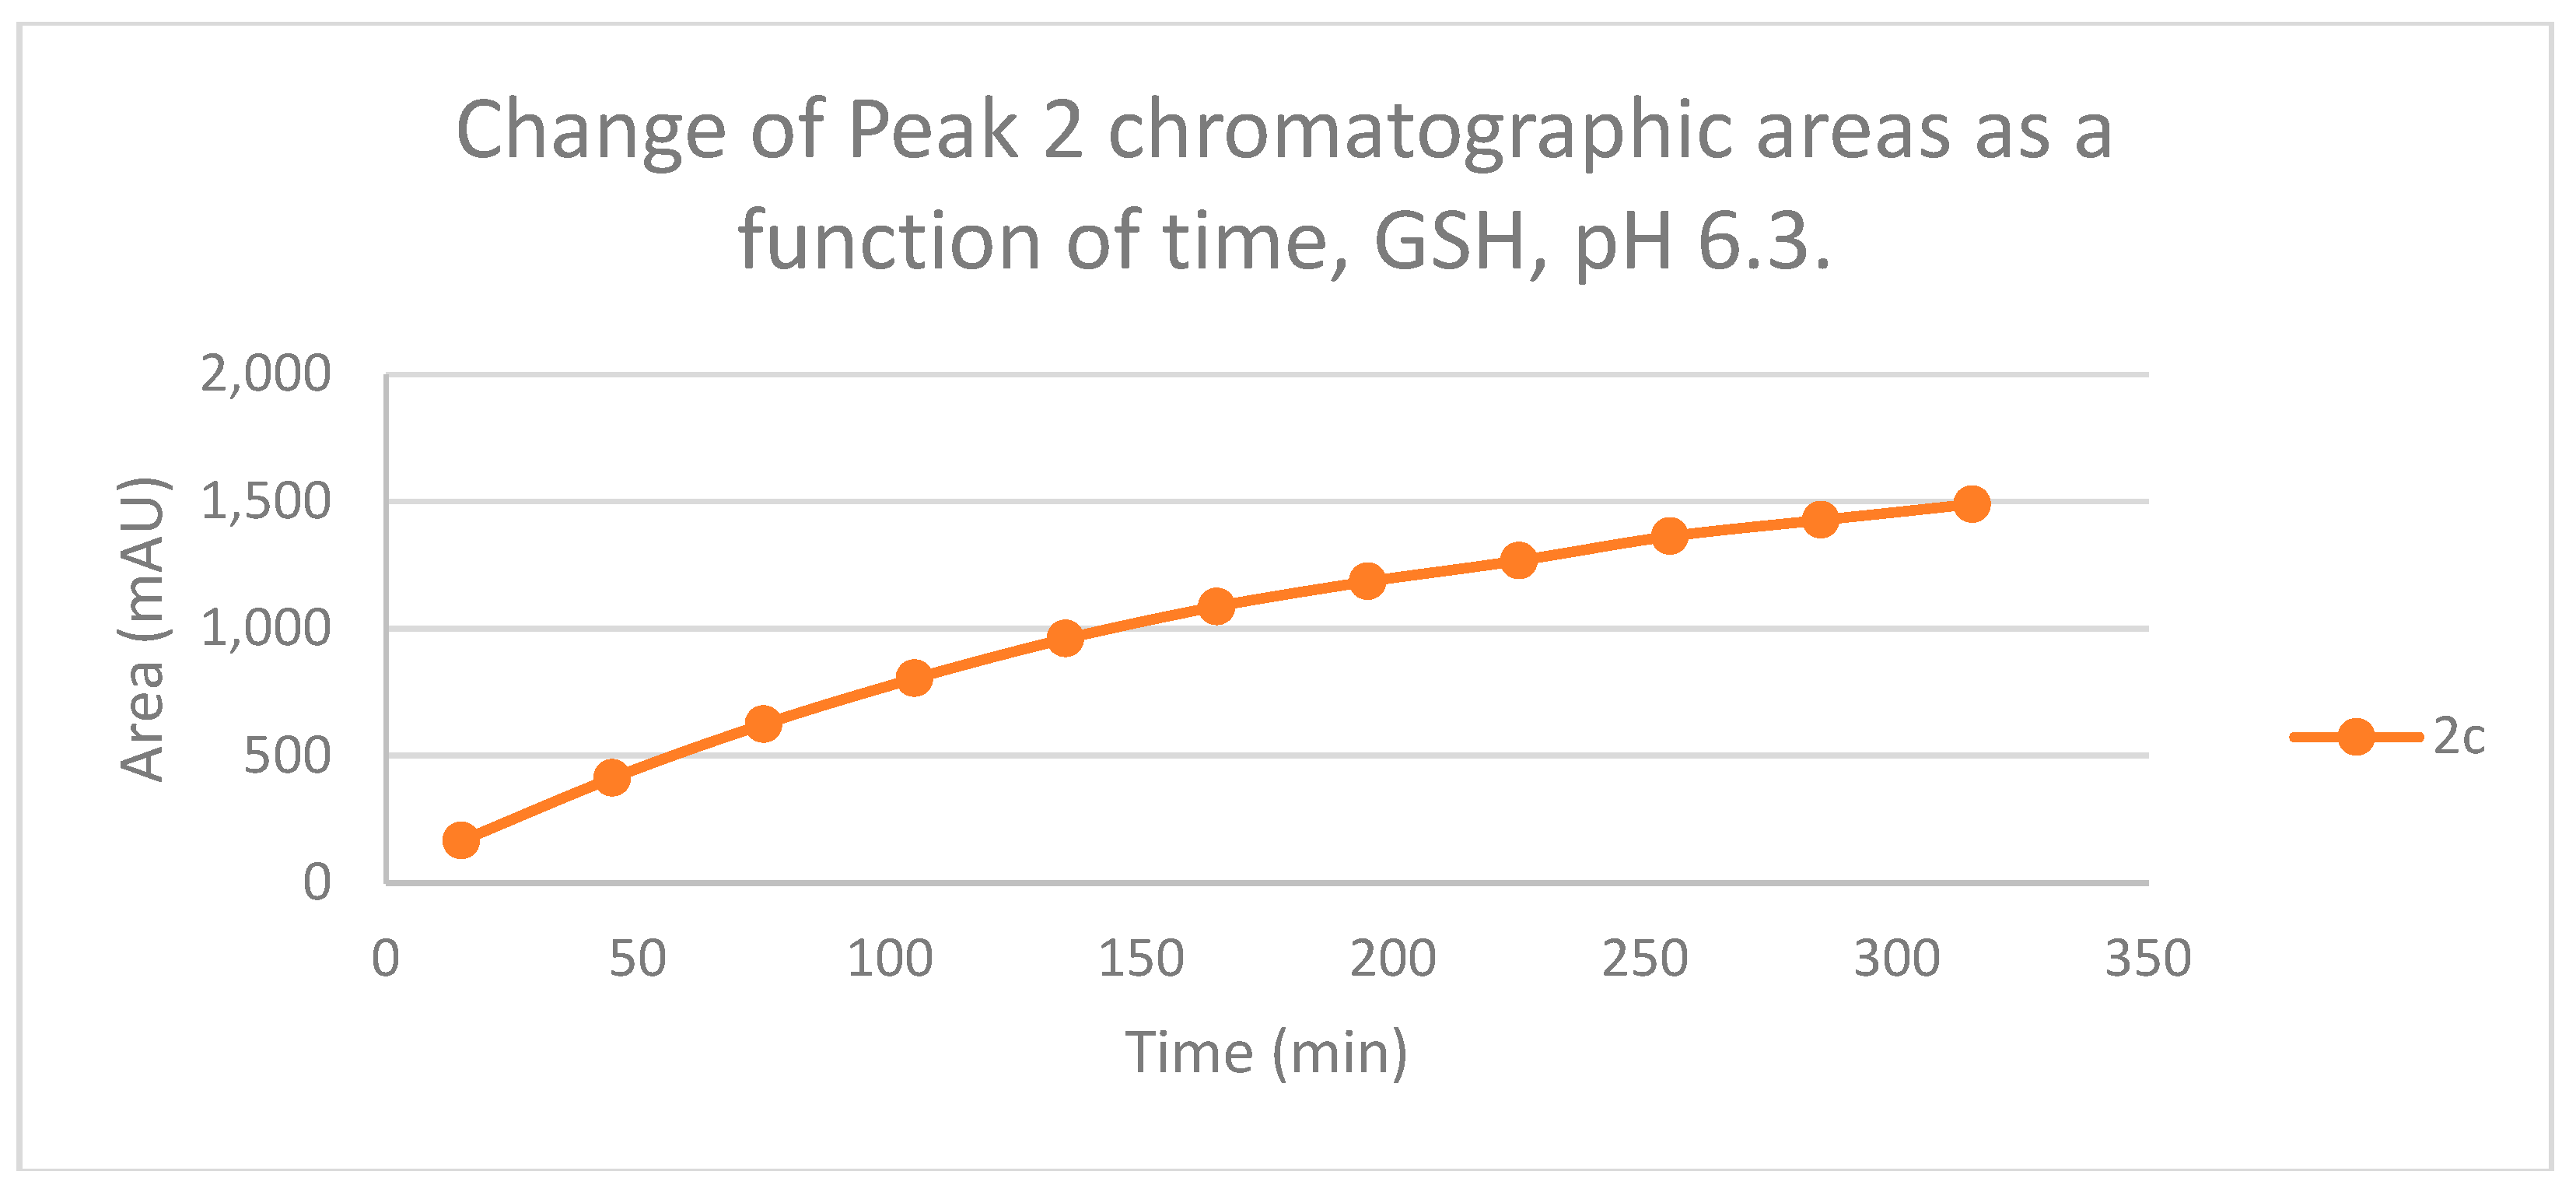
Figure 12.
Change in the chromatographic peak area of chalcones 2b and 2c in the chalcone–GSH incubations at pH 3.2.
Figure 12.
Change in the chromatographic peak area of chalcones 2b and 2c in the chalcone–GSH incubations at pH 3.2.
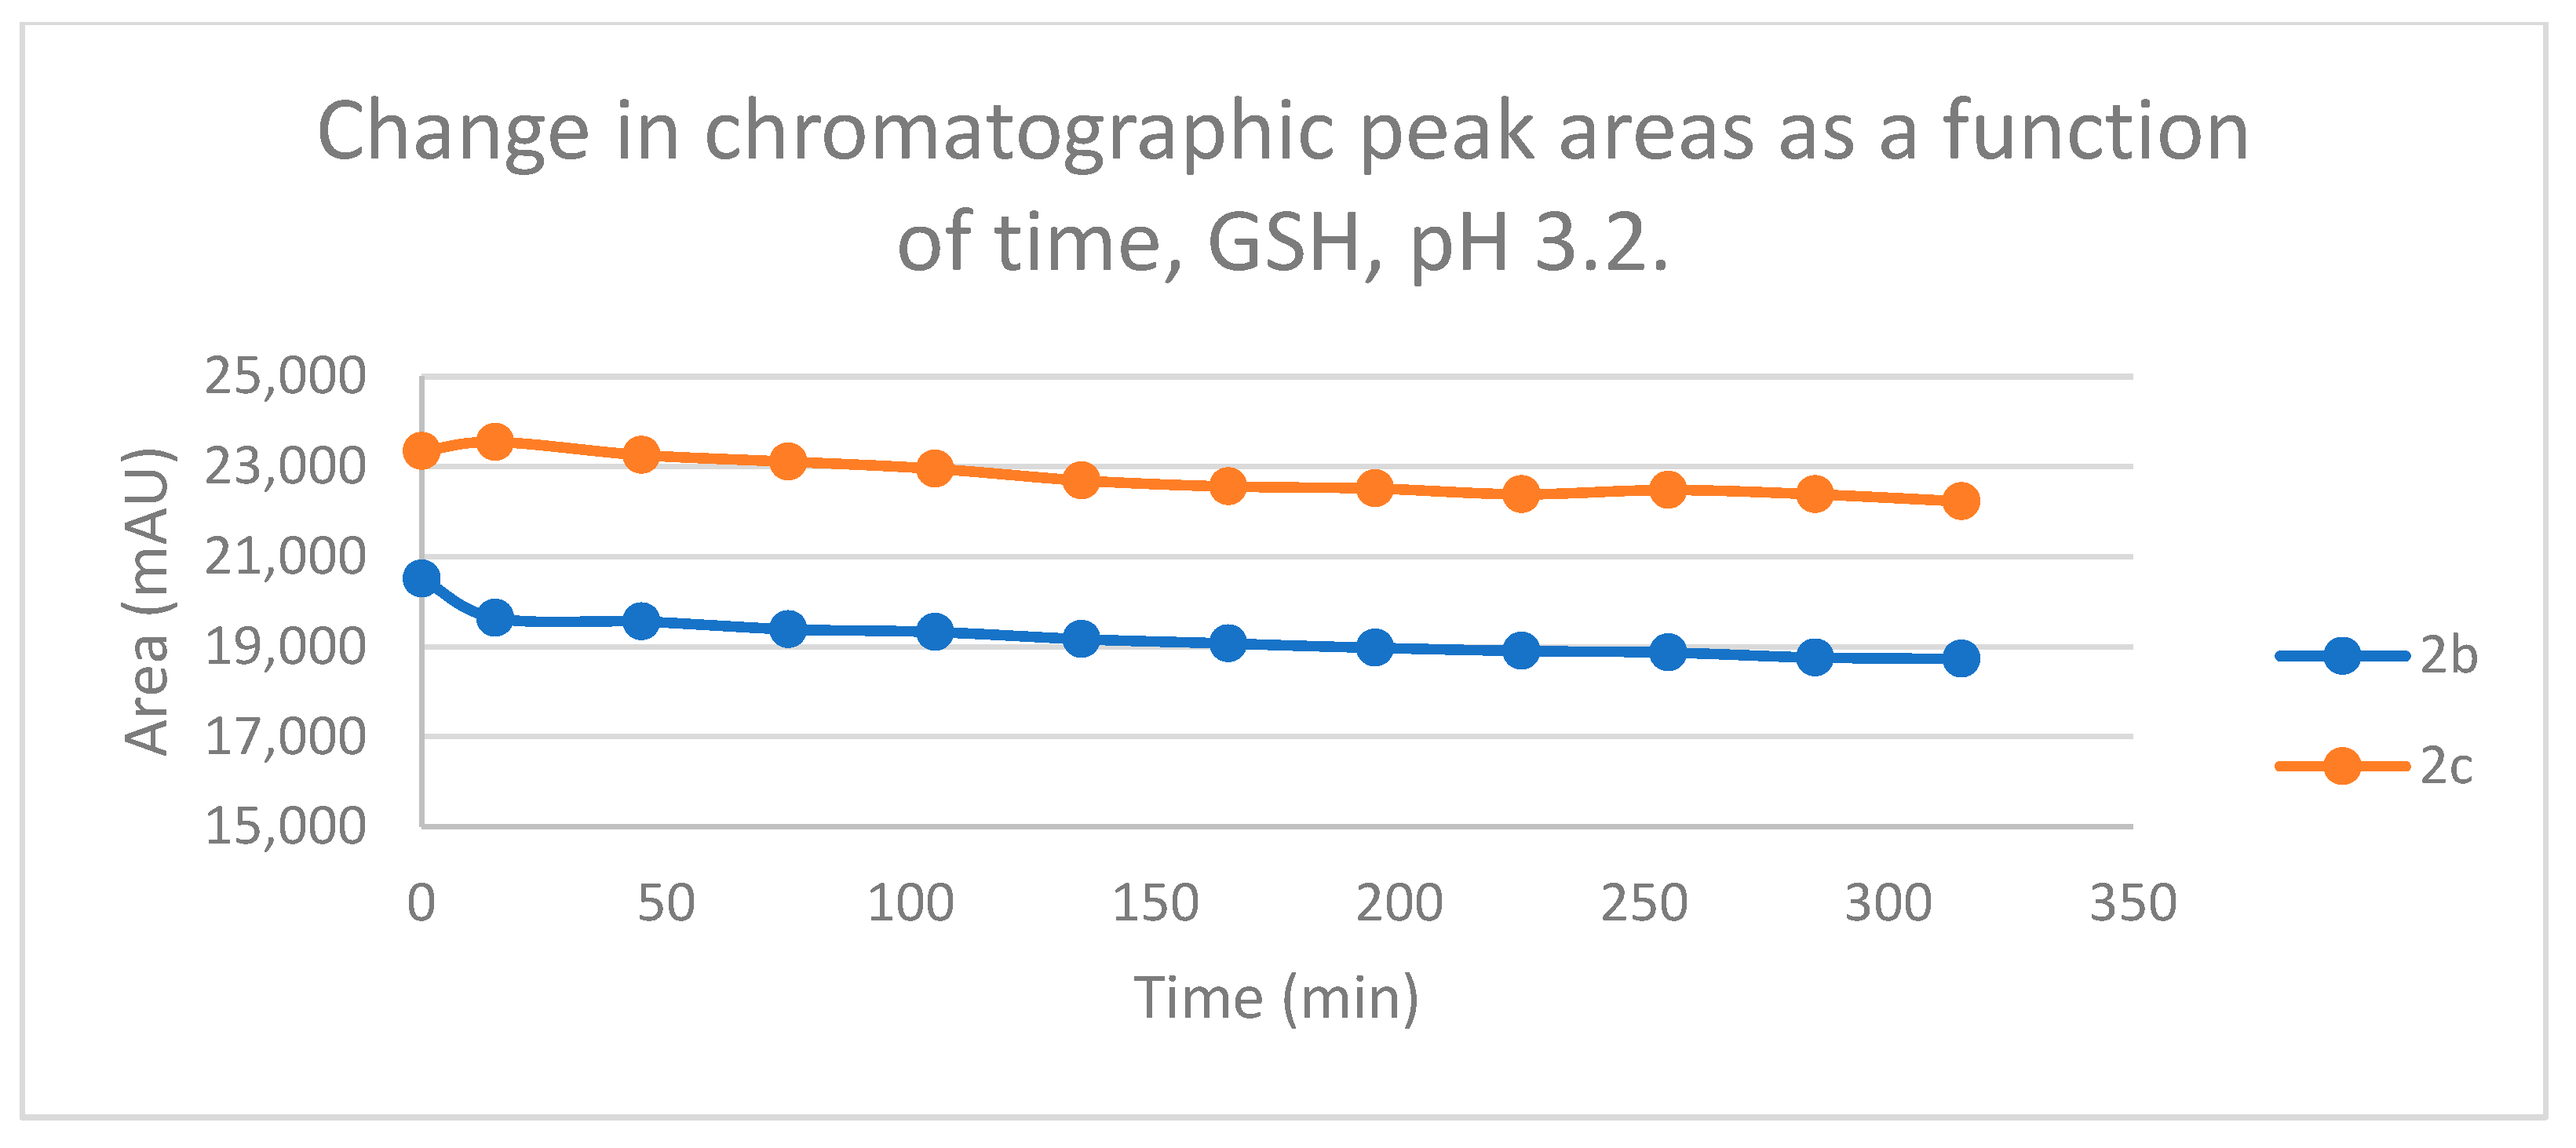
Figure 13.
HOMO and LUMO plots for 2a, CH3SH, and CH3S- calculated at the M06-2X/6-311++G(d,p) level of theory. MEP surface at ρ(r) = 4.0 × 10⁻⁴ electrons/Bohr3 contour of the total SCF electronic density for molecules 2a ,CH3SH, and CH3SH-. Isosurfaces of the nucleophilic attack (f+) for molecule 2a at the M06-2X/6-311++G(d,p) level of theory.
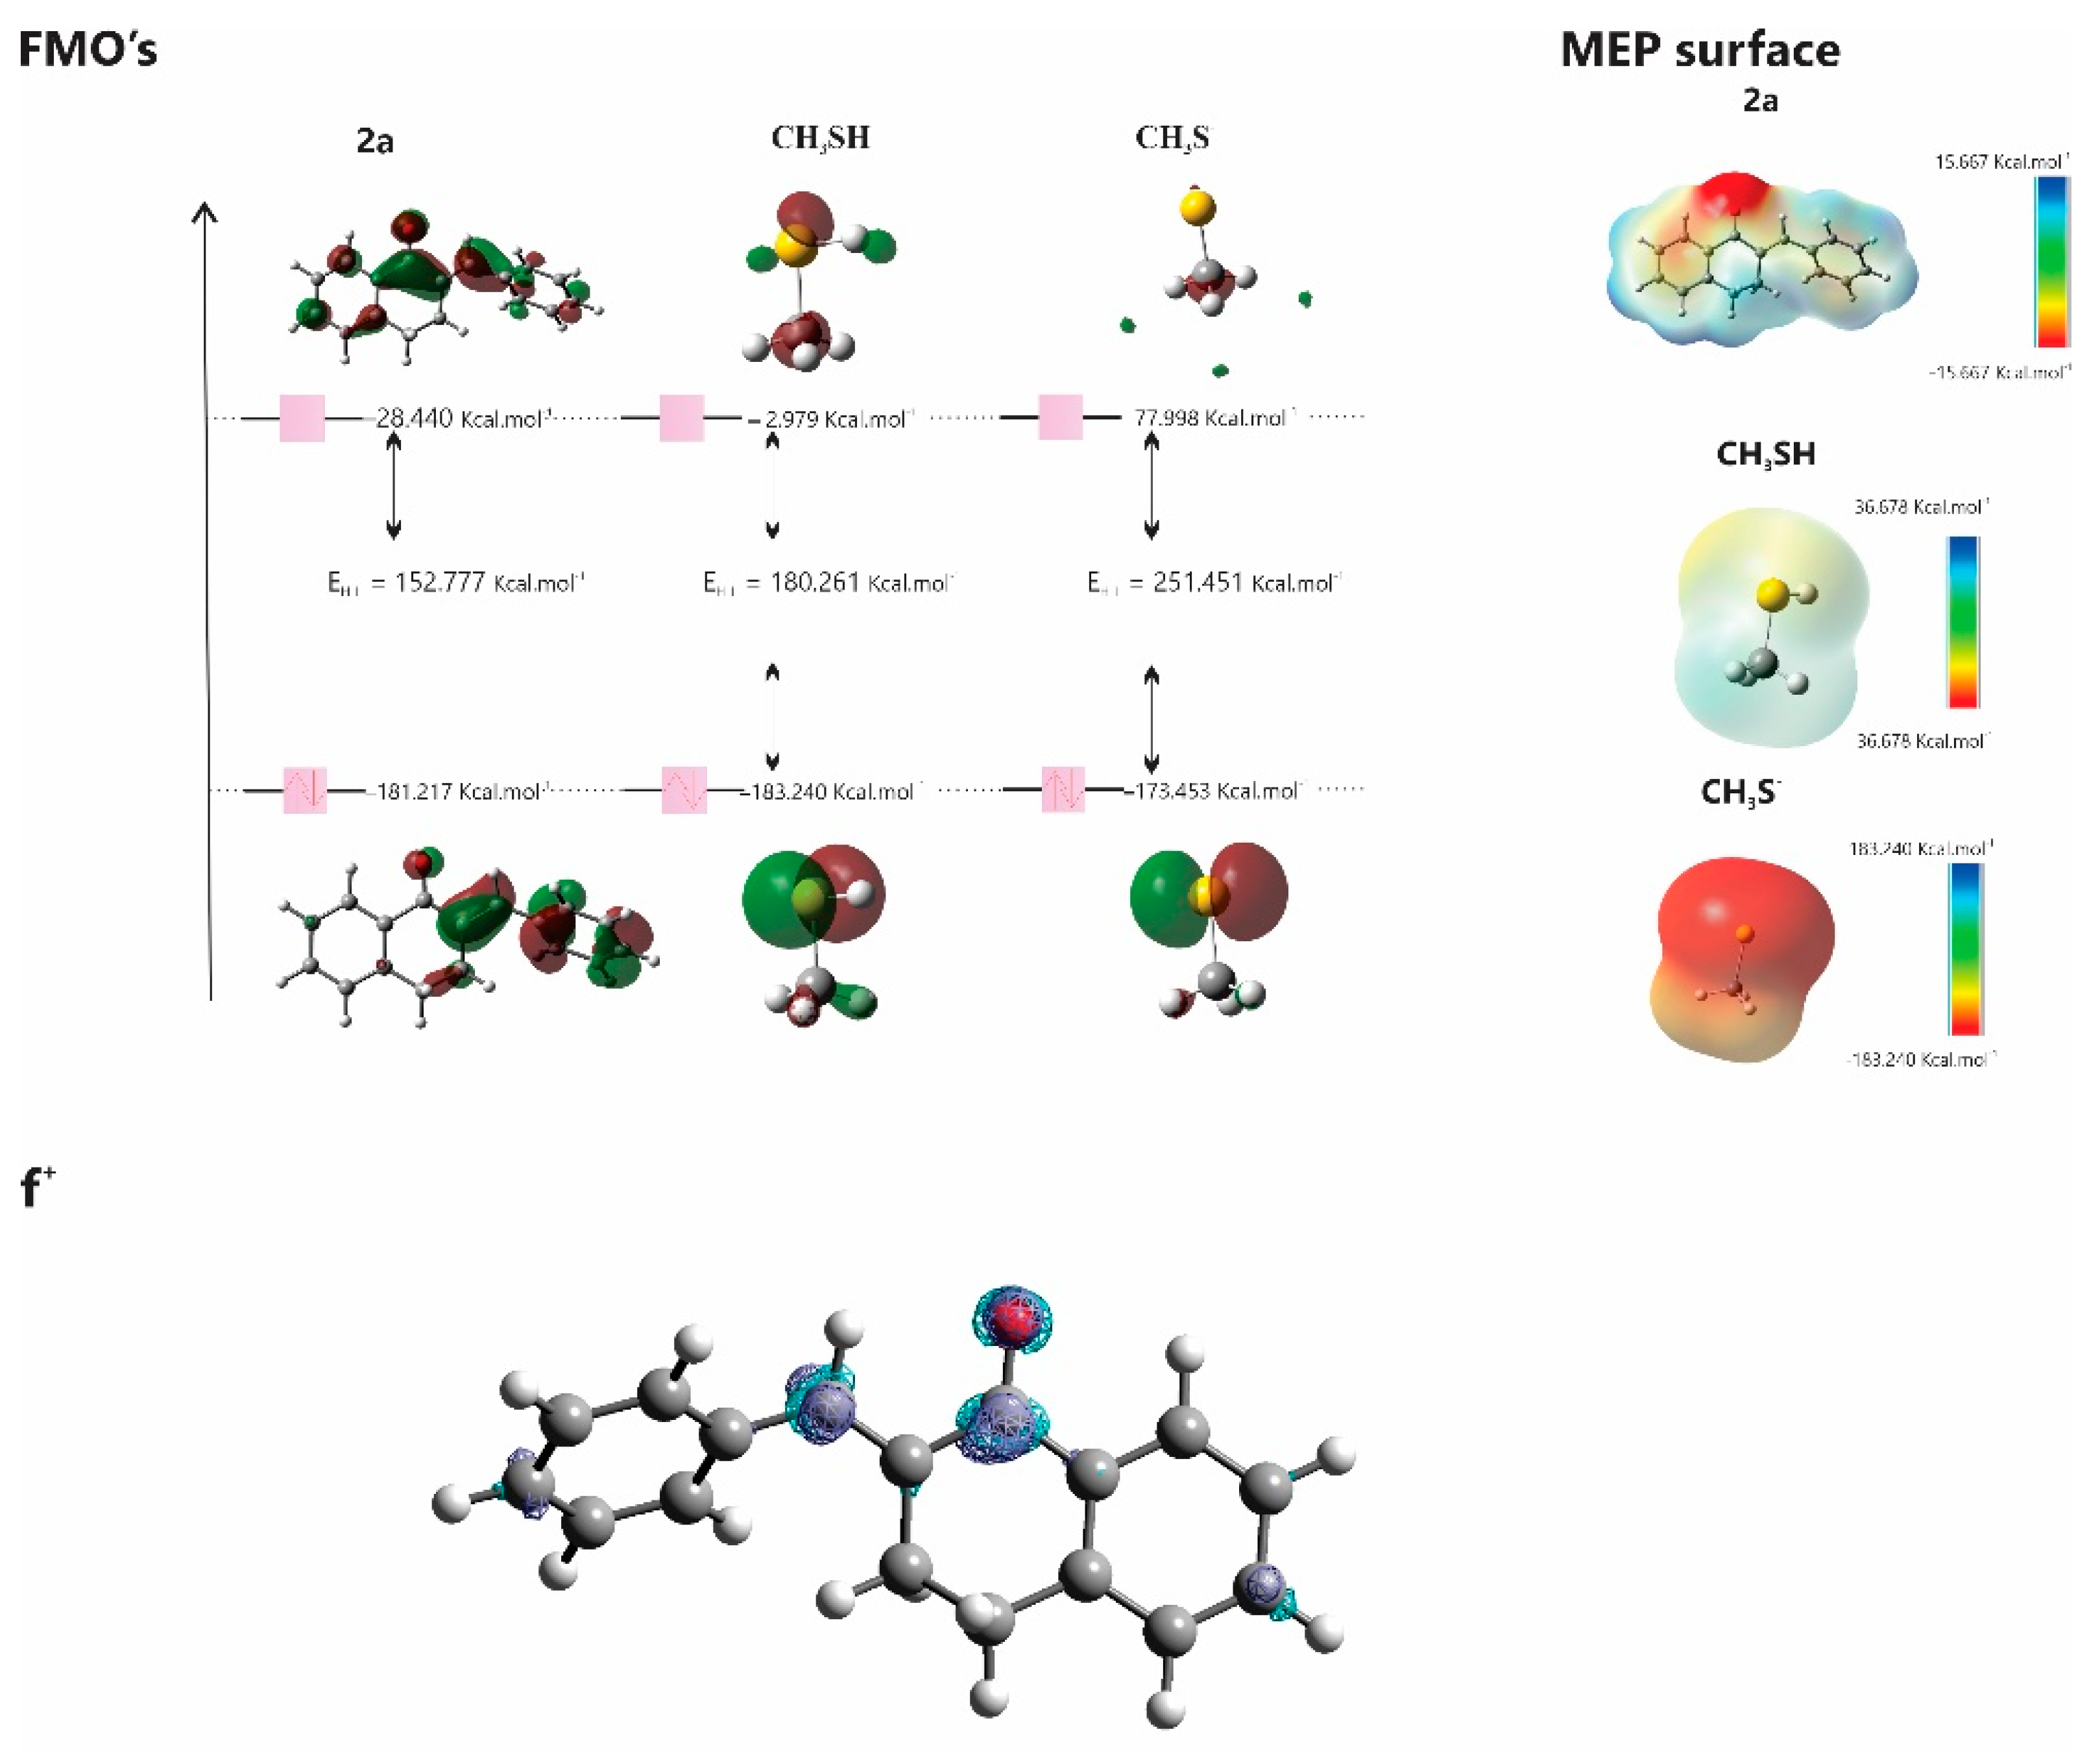
Figure 14.
Change in the chromatographic peak area of chalcones 1b, 1c, 2b, 2c, 3b and 3c in the chalcone-GSH incubations at pH 8.0.
Figure 14.
Change in the chromatographic peak area of chalcones 1b, 1c, 2b, 2c, 3b and 3c in the chalcone-GSH incubations at pH 8.0.
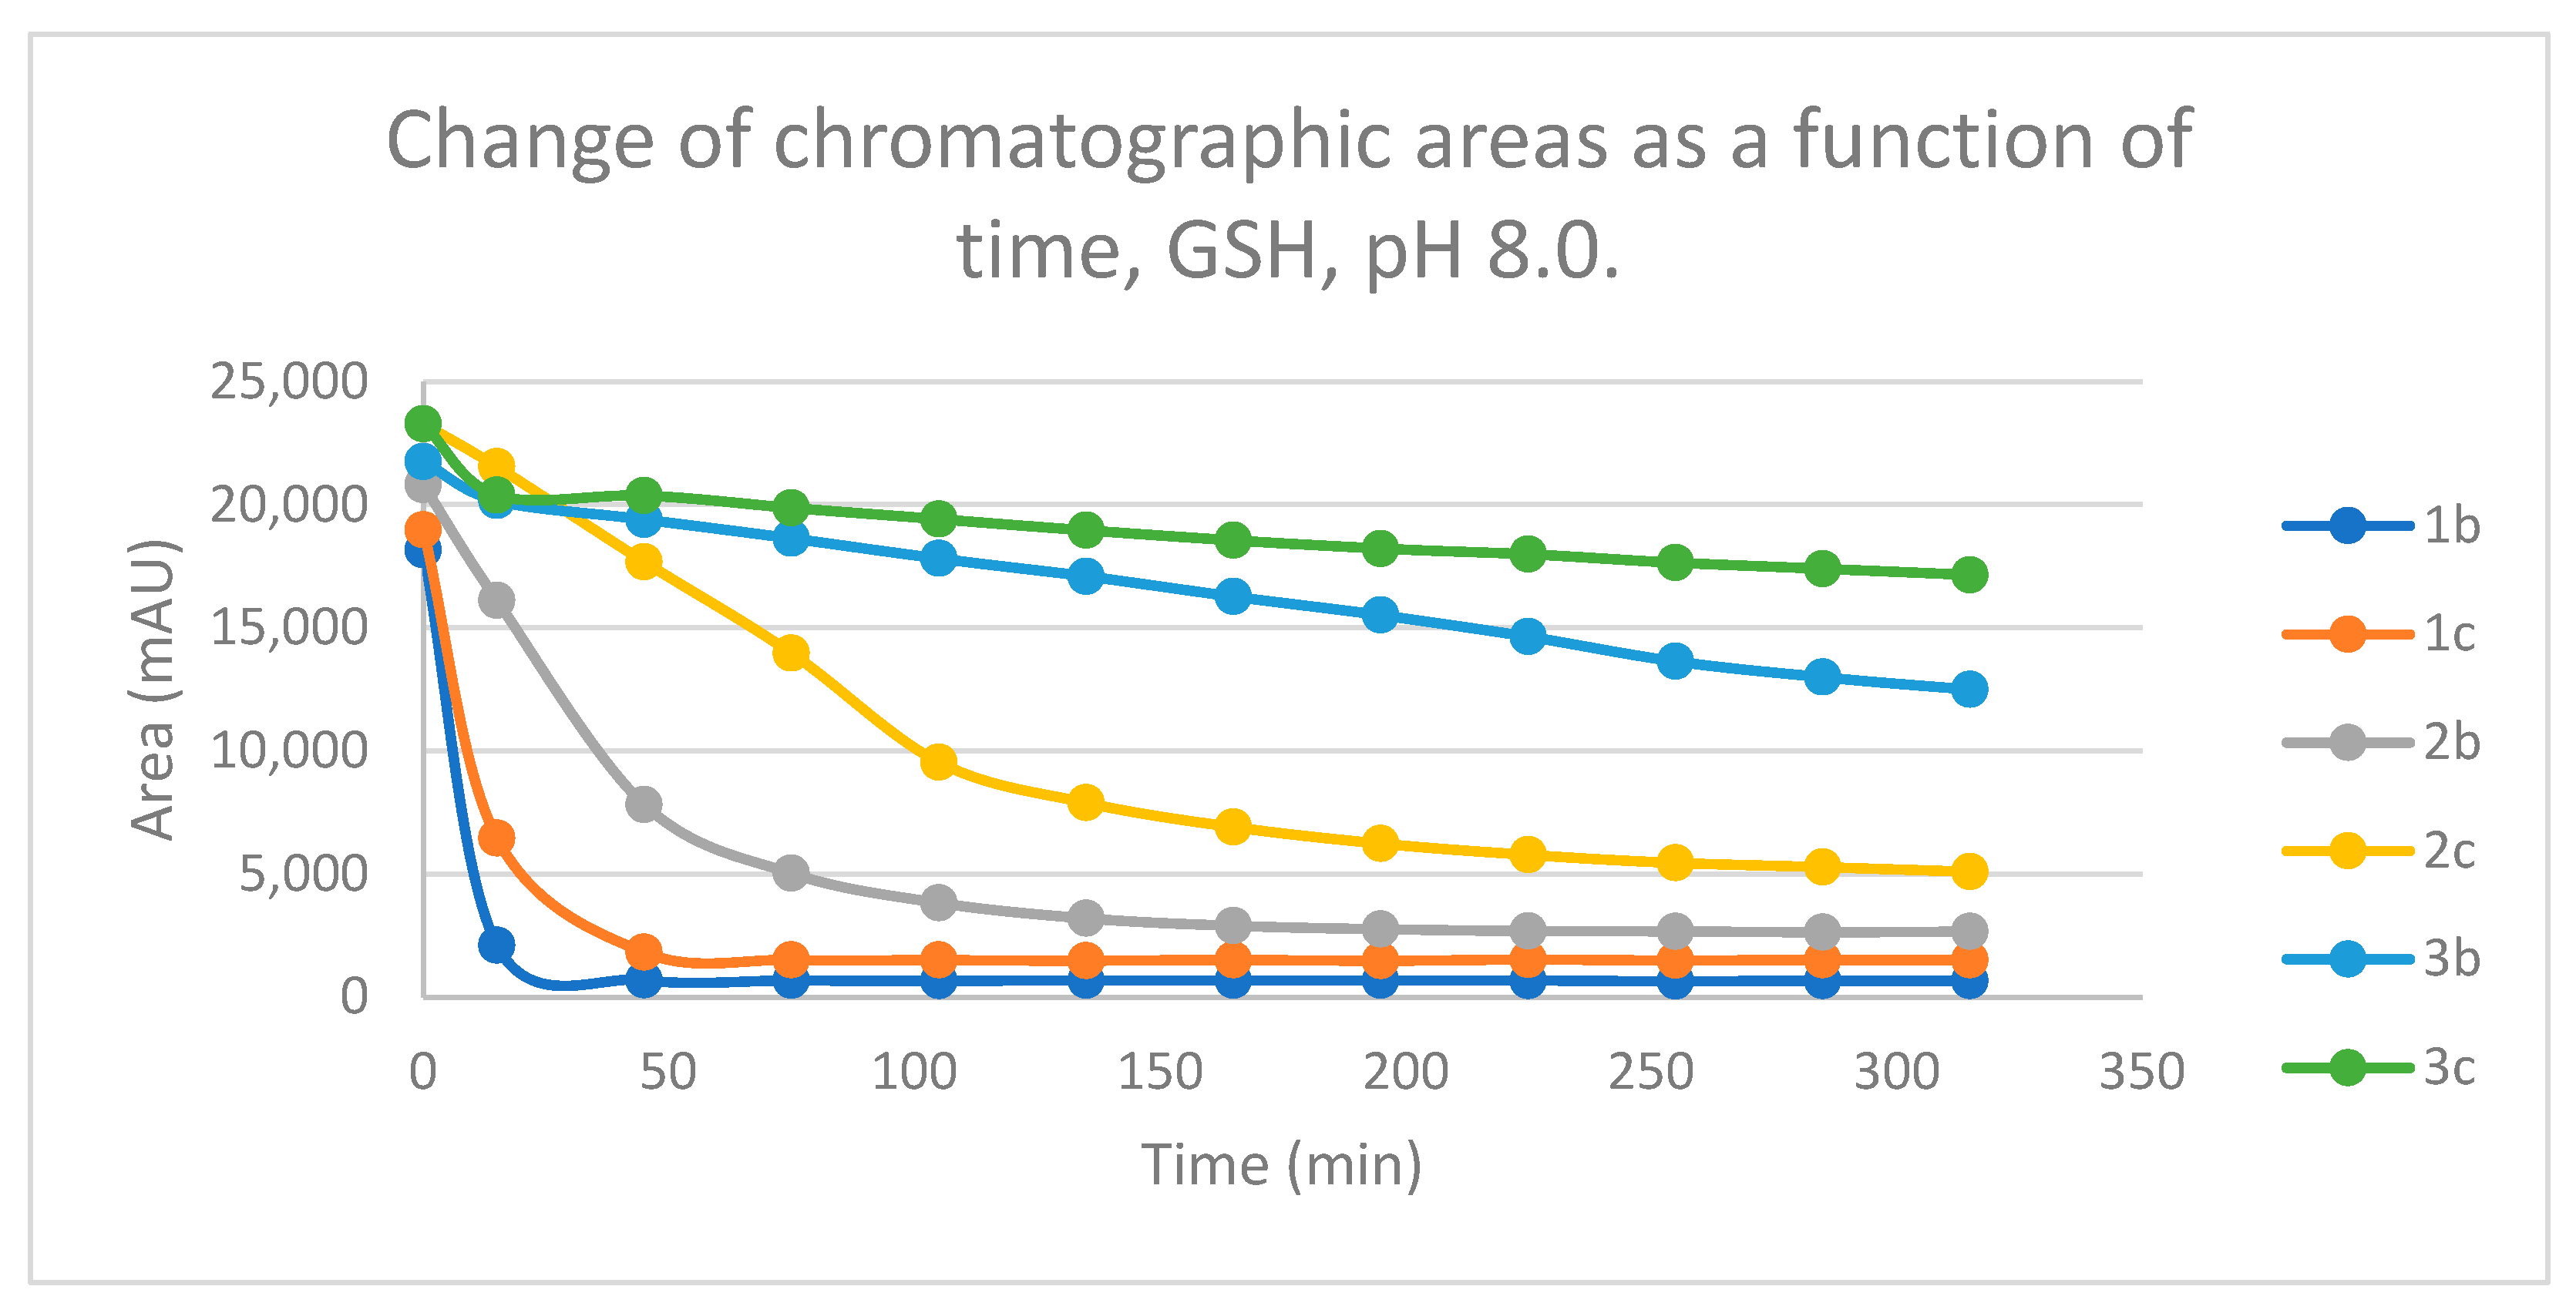
Figure 15.
Change in the chromatographic peak area of chalcones 1b, 1c, 2b, 2c, 3b and 3c in the chalcone-NAC incubations at pH 8.0.
Figure 15.
Change in the chromatographic peak area of chalcones 1b, 1c, 2b, 2c, 3b and 3c in the chalcone-NAC incubations at pH 8.0.
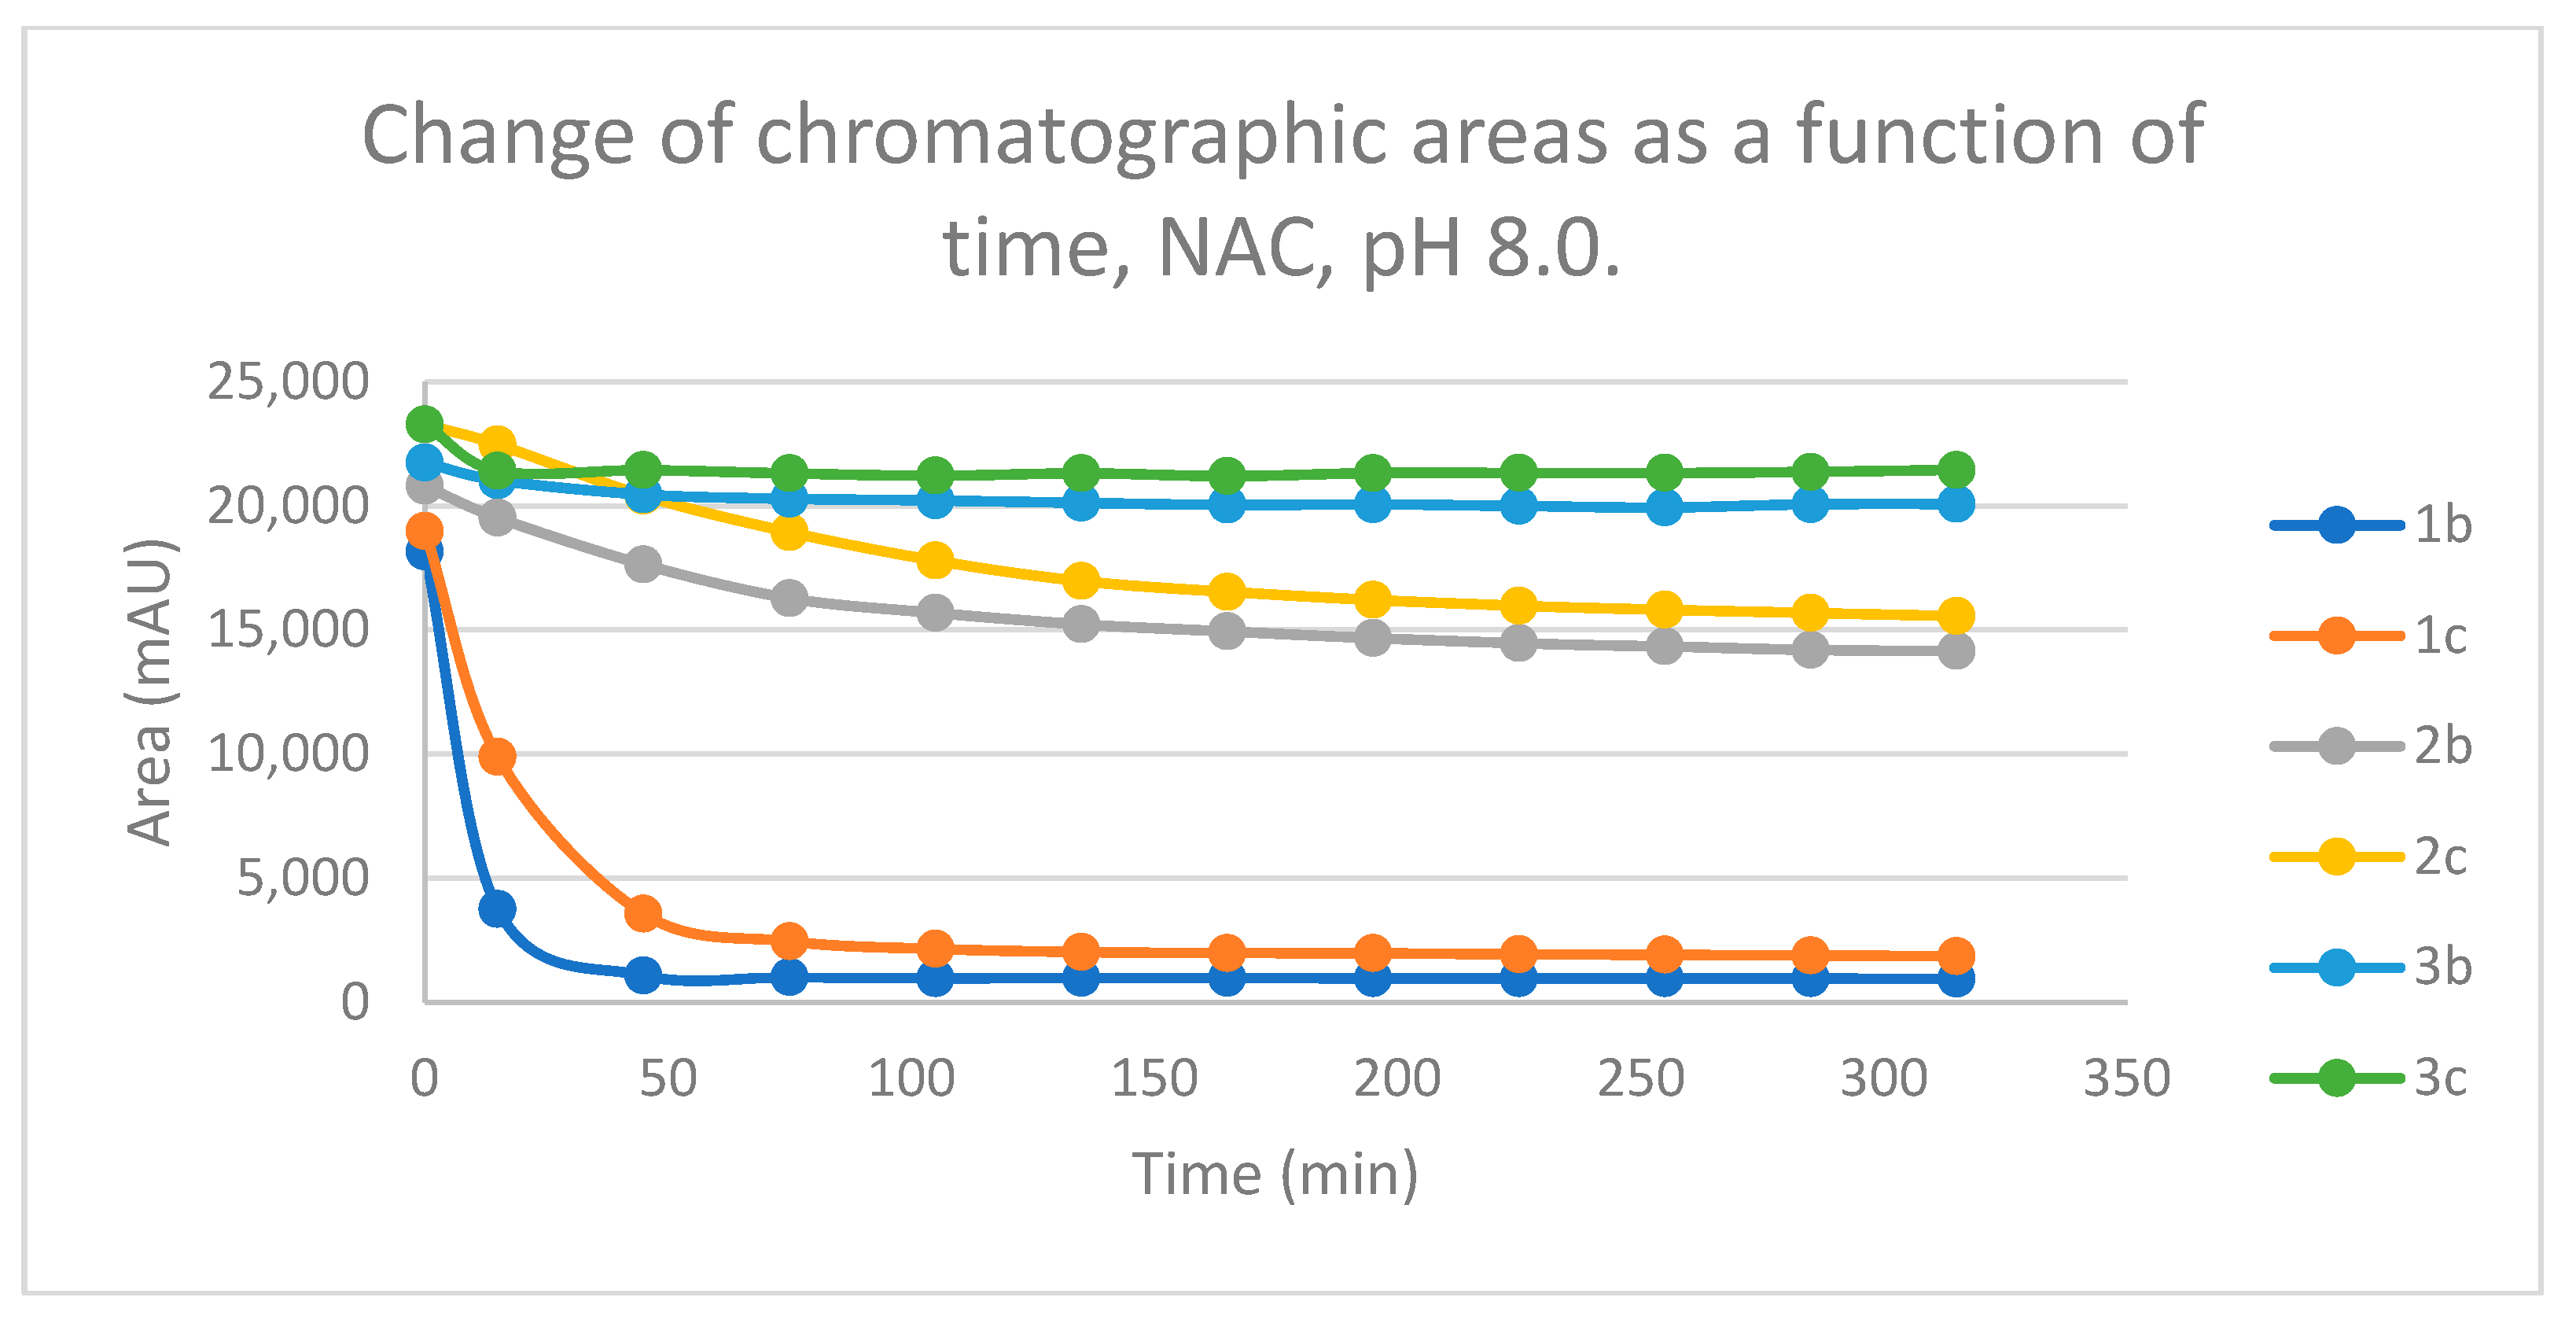

Table 1.
IC50 (μM) data of selected E-2-(4’-X-benzylidene)-1-tetralones (2) and -benzosuberones (3) [22].
Table 1.
IC50 (μM) data of selected E-2-(4’-X-benzylidene)-1-tetralones (2) and -benzosuberones (3) [22].
| CCompound | PP388 | LL1210 | MMolt 4/C8 | CCEM |
|---|---|---|---|---|
| 2a | 30.2 | 121 | 32.4 | 7.42 |
| 2b | 17.7 | 161 | 500 | 460 |
| 2c | 22.1 | 44 | 9.41 | 8.84 |
| 3a | 12.7 | 106 | 42.7 | 28.9 |
| 3b | 11.8 | 25 | 21.3 | 11.4 |
| 3c | 1.6 | 0.34 | 0.47 | 0.35 |
Table 2.
Retention times (tR)1 and integrated peak areas (A) of the investigated cyclic chalcone analogs (2b and 2c) and their GSH adducts2.
Table 2.
Retention times (tR)1 and integrated peak areas (A) of the investigated cyclic chalcone analogs (2b and 2c) and their GSH adducts2.
| pH3 | Compound | tR (E)-isomer |
Area Ratio4 A315/A0 |
tR (Z)-isomer |
Area (Z)-isomer |
tR GSH-1 |
Area GSH-1 |
tR GSH-2 |
Area GSH-2 |
|---|---|---|---|---|---|---|---|---|---|
| 3.2 | 2b | 16.8 | 0.91 | ND5 | - | 14.7 | 753 | ND5 | - |
| 3.2 | 2c | 16.3 | 0.95 | 16.7 | 51.3 | 13.3 | 565 | 13.5 | 171 |
| 6.3 | 2b | 17.2 | 0.80 | ND5 | - | 15.3 | 5914 | ND5 | - |
| 6.3 | 2c | 16.8 | 0.85 | 17.1 | 67.6 | 14.5 | 3371 | 14.6 | 1489 |
| 8.0 | 2b | 17.1 | 0.13 | ND5 | - | 15.1 | 21325 | ND5 | - |
| 8.0 | 2c | 16.9 | 0.22 | 17.2 | 85.9 | 14.6 | 16474 | 14.8 | 7353 |
1Retention times in minutes; 2data refer to the average of two independent measurements at the 315 min time point; 3pH value of the aqueous thiol solution; 4ratios of peak areas measured at 0 and 315 min; 5not detectable.
Table 3.
Retention times (tR)1 and integrated peak areas (A) of the investigated cyclic chalcone analogs (2b and 2c) and their NAC adducts2.
Table 3.
Retention times (tR)1 and integrated peak areas (A) of the investigated cyclic chalcone analogs (2b and 2c) and their NAC adducts2.
| pH3 | Com-pound | tR (E)-isomer |
Area Ratio4 A315/A0 |
tR (Z)-isomer |
Area (Z)-isomer |
tR NAC-1 |
Area NAC-1 |
tR NAC-2 |
Area NAC-2 |
|---|---|---|---|---|---|---|---|---|---|
| 3.2 | 2b | 16.8 | 0.69 | ND5 | ND5 | 15.8 | 738 | 16.2 | 412 |
| 3.2 | 2c | 16.4 | 0.76 | ND5 | ND5 | 15.2 | 660 | ND5 | - |
| 6.3 | 2b | 17.2 | 0.92 | 17.0 | 119 | 16.2 | 1607 | 16.3 | 327 |
| 6.3 | 2c | 16.8 | 0.94 | ND5 | ND5 | 15.7 | 4050 | ND5 | |
| 8.0 | 2b | 16.9 | 0.68 | ND5 | ND5 | 15.9 | 6372 | 16.0 | 3545 |
| 8.0 | 2c | 16.8 | 0.67 | ND5 | ND5 | 15.7 | 7564 | 15.8 | 4785 |
1Retention times in minutes; 2Data refer to the average of two independent measurements at the 315 min time point; 3pH value of the aqueous thiol solution; 4Ratios of peak areas of the starting compounds (2b, 2c) measured at 0 and 315 min; 5not detectable.
Table 4.
Reactivity indices were obtained for 1a[26], 2a, 3a[26], CH3SH[26], and CH3S-[26] at the M06-2X/6-311++G(d,p) level of theory.
| Descriptors | 1a kcal.mol-1 |
2a kcal.mol-1 |
3a kcal.mol-1 |
CH3SH kcal.mol-1 |
CH3S- kcal.mol-1 |
|---|---|---|---|---|---|
| EHOMO | -183.25 | -181.22 | -180.38 | -183.240 | -173.453 |
| ELUMO | -35.98 | -28.44 | -28.44 | -2.979 | 77.998 |
| ΔEHOMO-LUMO | 147.27 | 152.78 | 151.94 | 180.261 | 251.451 |
| Chemical potential (μ) | -109.608 | -108.122 | -104.405 | -93.109 | -47.728 |
| ) | 147.264 | 144.292 | 151.930 | 180.261 | 251.451 |
| ) | 40.791 | 35.976 | 35.873 | 24.047 | 4.530 |
Disclaimer/Publisher’s Note: The statements, opinions and data contained in all publications are solely those of the individual author(s) and contributor(s) and not of MDPI and/or the editor(s). MDPI and/or the editor(s) disclaim responsibility for any injury to people or property resulting from any ideas, methods, instructions or products referred to in the content. |
© 2024 by the authors. Licensee MDPI, Basel, Switzerland. This article is an open access article distributed under the terms and conditions of the Creative Commons Attribution (CC BY) license (http://creativecommons.org/licenses/by/4.0/).
Copyright: This open access article is published under a Creative Commons CC BY 4.0 license, which permit the free download, distribution, and reuse, provided that the author and preprint are cited in any reuse.


