
Submitted:
29 April 2024
Posted:
29 April 2024
You are already at the latest version
Abstract
Leukemia is a form of blood cancer that results in an increase in the number of white blood cells in the body. The correct identification of Leukemia at any stage is essential. The current traditional approaches rely mainly on field expertise' knowledge, which is time consuming. The poor understanding and a long period of examination might damage the human body. In this situation an automated Leukemia identification delivers more reliable and accurate diagnostic information.
To effectively diagnose acute lymphoblastic Leukemia from blood smears pictures, a new strategy based on traditional image analysis techniques with machine learning techniques, and a composite learning approach was constructed in this experiment. To identify the type of acute Leukemia first, four well-known machine learning models were utilized. It was discovered that Support Vector Machine (SVM) Provides the highest accuracy in this scenario. To boost the performance, a deep learning model Resnet50 was hybridized with SVM model. Finally, it was revealed that this composite approach achieved 99.9% accuracy.
Keywords:
Blood Cancer
; Composite Learning
; Deep Learning (DL)
; Hybrid Model
; Acute Lymphoblastic Leukemia (ALL)
; Machine Learning (ML)
; ResNet50
; Support Vector Machine (SVM)
1. Introduction
Leukemia is a form of blood cancer that results in an increase in the number of white blood cells in the body. Whenever these white cells push aside the platelets and red blood cells, the human body begins to behave improperly. It is a diverse category of hematopoietic cancers caused by abnormal multiplication of growing leukocytes. These are categorized as acute or chronic, and myeloid or lymphoid depending on the originating cell. The most common variants are Acute Myeloid Leukemia (AML) and Chronic Myeloid Leukemia (CML), both of which include the myeloid branch, and Acute Lymphoblastic Leukemia (ALL) and Chronic Lymphocytic Leukemia (CLL), both of which involve the lymphoid sequence. In this investigation, the Acute Lymphoblastic Leukemia (ALL) was used as the research subject.
Microscopic image analysis is very important in early Leukemia testing and accurate diagnoses. This analysis describes that how testing blood sample appears under a microscope, including the size of blood cells, shape, and the number of different types of blood cells, including red blood cells, white blood cells, and platelets.
The correct identification of Leukemia at any stage is essential. Since current traditional approaches rely mainly on microscopic inspection, which itself is time intensive and highly dependent on field expertise' knowledge. It has been observed that the lack of knowledge about the disease and the conventional medical tests are so time-consuming that it has a very harmful effect on the human body over time. In this situation an automated Leukemia identification provides a new avenue for reducing human participation while delivering more reliable diagnostic information. ALL prediction is a challenging process. Normal physical examinations and information gathered from group of specimens are time dependent and money-consuming methods for identifying and predicting Leukemia. The condition has occasionally been seen to advance from the premature time to noticeably greater levels due to an inadequate evaluation. In contrast to general medical inspection, digital image analysis is now more successful at identifying this condition. The medical community greatly benefited from ML. It is a technology utilized by the medical industry to assist medical practitioners in managing critical data and delivering clinical outcomes. Finding patterns and insights from a picture that would be hard to detect intuitively can be assisted by ML techniques used in healthcare. In contrast to conventional methods ML models offer a forecast that is reliable, efficient in terms of effectiveness, expense, and time.
In this work, ML and hybrid learning methodologies are employed to build an automated Leukemia monitoring system. This technique will analyze blood smear images for the existence of Leukemia. During the initial phase, three well-known single learning models Support Vector Machine (SVM), K-Nearest Neighbour (KNN), and Naïve Bayes (NB)are employed to predict ALL categories. The top model is chosen after thorough performance comparisons between these three models. The best single learning model discovered in the first phase, then fused it with a deep neural model network in the following phase to improve model forecasting accuracy. The significance of this work is highlighted below –
- The main objective of this work is to create an automatic system that can detect and measure the number of white cells in the blood. Most importantly, it can pinpoint the precise phase of this disease.
- This system uses digital blood smear images for detection and prediction.
- This smart strategy used a known set of information to forecast and monitor the form of Leukemia.
- Whenever it detects a potentially malicious blood cell, this automatic system will send warning massages.
- This approach is significantly more precise and faster than traditional techniques.
2. Litareture Review
In this section, the scientific research related to the inquiry is comprehensively assessed. The suggested process investigated detecting and classifying acute Lymphoblastic Leukemia. As a result, a comprehensive review focusing on the mentioned principles, as well as an overview of the associated literary work, is presented below.
Blood cancer [1] has become an increasing problem in the recent decade, necessitating earlier detection in order to commence appropriate treatment. The therapeutic diagnosing process is expensive and time-consuming, requiring the participation of healthcare professionals and a series of examinations. As a result, an automatic detection method for precise prognosis is far more important than the conventional approach. With the advent of technology, finding abnormal cells from blood smear images has become considerably easier, even more reliable, and significantly less time consuming than the traditional approach. Many scientists and researchers worldwide have focused on developing progressively inventive and accurate ways for such systems and related solutions for these scenarios.
Various investigators employ a variety of computer vision approaches for identification and machine learning model for prediction. To identify the kind of Leukemia from blood smear pictures, they adopted support vector system based on radial kernels [2]. To identifying the characteristics of these cancerous cells, other studies also employed a few different ML models [3,4,5].To assess the abilities of those classifiers, various performance matrices are computed.Other studies have suggested using well-known machine learning techniques in an ensemble automated prediction strategy. They employed pre-trained Deep Neural models for extracting features and the Min-Max-Scaler standardization strategy for data scalability [6].Several ML-based models for Leukemia detection and classification are presented in-depth and methodically by the authors in their review paper.They provide as a concise summary of various performance metrics, benefits, and drawbacks of several related studies that will be informative to other authors [7,8].
Modern society is very interested in deep learning models. These algorithms are capable of processing complicated and huge datasets that would be challenging for conventional ML methods to comprehend. A technique for Leukemia diagnosis using labelled bone marrow pictures was put forth by certain researchers. In order to deliver trustworthy prediction performance, they employed a strong classification methodology with the deep convolutional model approach [9,10,11,12].A deep convolution model with a distinct ALLNET structure was suggested by some other authors for forecasting. The suggested framework has the maximum level of precision [13].Several authors have suggested a multi-step DL strategy. They used this strategy to effectively separate the cells from the pictures and get reliable predictions [14].
3. Methods Details
Leukemia is a kind of cancerous disease that affects blood production elements, particularly bone marrow. In therapeutic terminology, there are several distinct examinations are available that may be employed to detect Leukemia. The amount of White Blood Cells (WBCs), Red Blood Cells (RBCs), and Platelets in the bloodstream is determined by a complete blood count. Cell examinations can be done from the bone marrow or lymphatic vessels to search for signs of Leukemia and the rate at which it is growing. However, it takes time and requires skilled medical specialists. Numerous computer vision algorithms are employed in Digital Image Processing Techniques for the identification of Leukemia. To locate disease-affected tissues, different color intensification and color segmentation approaches are used in this investigation.
3.1. Brightness, Contrast, Sharpness, and Color Intensity Enhancement
In machine vision, brightness [15] is defined as the measurable amplitude of all the image pixels that compose an assembly that made up the digital picture once it has been taken, processed, and presented. To modify the intensity of the brightness of an image, the image pixel intensities should be adjusted by a fixed value. Simply adding a positive fixed value to all the image pixels increases the brightness level of the image. Deducting a positive number from all the picture pixels, on the other hand, darkens the image.
where, K is a constant value for brightness adjustment.
Improving the contrast [15] level of an image improves the range between black and white pixels, making white parts lighter and black ones darker. It simply redesigned the pictures pixel intensity values. A well-contrast photograph features prominently black and white distinctions.
where, M is a constant value for contrast enhancement.
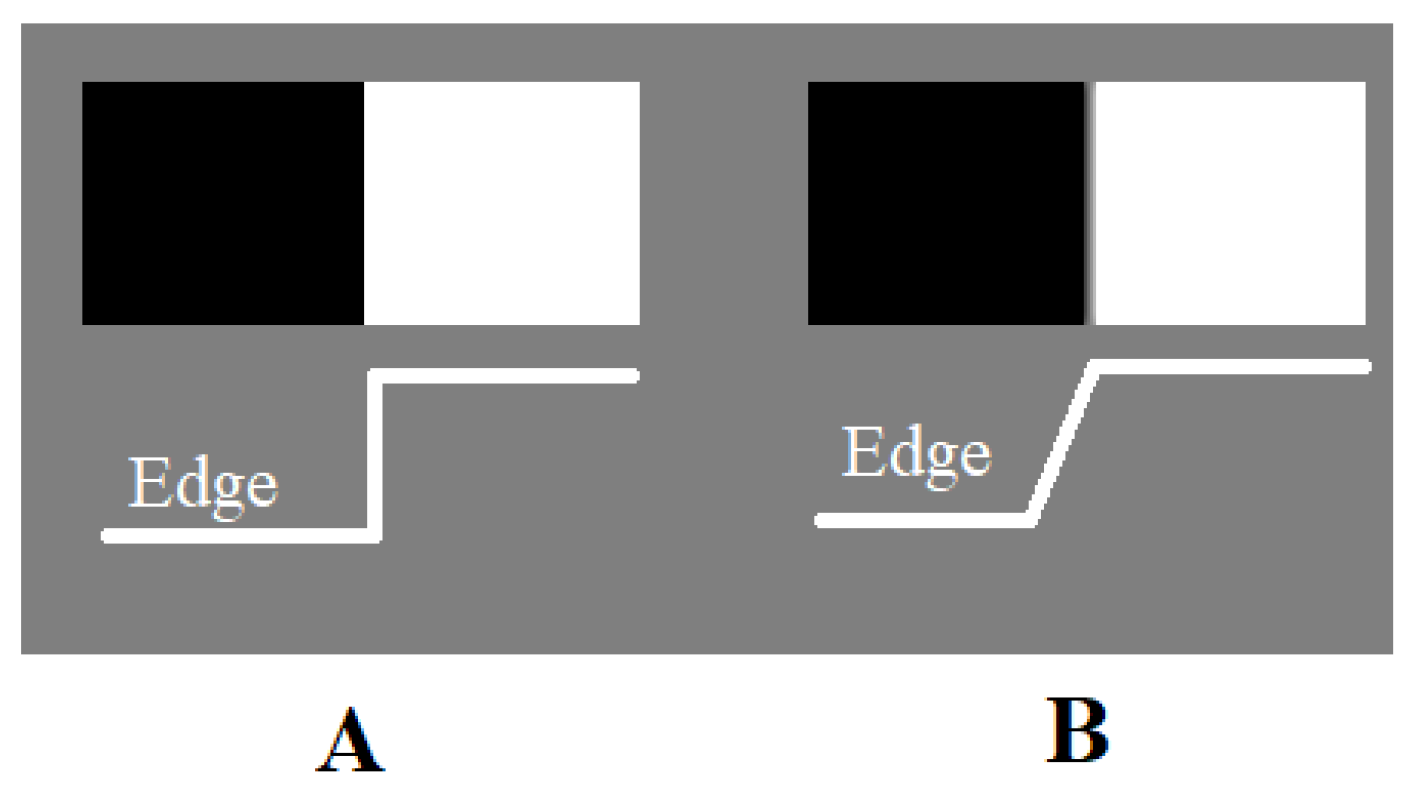
The degree of clarity that an imaging modality can recreate is determined by the sharpness [16] of a picture. It is characterised by the margins between distinct hues or colors in each region. Image sharpening is a technique used to make digitized photos look sharper or clearer. It is a crucial tool in the image processing system. Appropriate sharpening of an image makes it appear more noticeable and livelier.
Figure 1.
Definition of Sharpness Level A) High Sharpness, B) Low Sharpness.
During analysis, an image enhancement approach is employed to enhance the image quality and save the informative characteristics of the original data. Color augmentation is an important aspect of it. This approach is a set of processes that strive to improve the visual look of a picture or to transform the picture to a state that is more suitable for analysis by a person or computer. This procedure also included brightness and contrast adjustments, as well as histogram equalisation adjustments.
3.2. Image Segmentation
Image segmentation is a technique [17,18] used in digital image processing. It analyses a picture and divides it into distinct segments or sections based on the pixels in the object's attributes. It is widely used to discern and properly identify foreground and background areas.
An image can be segmented using several different techniques. One of these, the thresholding-based segmentation method [19], is both fast and significant. The intensity histogram of each pixel in the image is considered throughout this approach. After that, a specific threshold value is set to segment the image. Global thresholding is one of the most well-liked techniques for segmenting images based on thresholds. The idea behind global thresholding is that the subject can be separated from the background using a straightforward process that compares image contents with a predetermined threshold value when the image has a bimodal histogram. Figure 2 depicted the histogram distribution of Global thresholding model.
Let consider the is the coordinate of an image pixel, and if the threshold value of an image is defined as . Then the threshold image is defined as:
The result of thresholding approach is a binary image. The pixels with an intensity value of 1 are specified as foreground objects and pixels with an intensity value of 0 are specified as background.
3.3. Feature Extraction and Machine Learning Models for Classification
3.3.1. Feature Selection
To develop a ML model, only a few variables in the dataset plays the leading role. As a result, the remaining features either became unnecessary or irrelevant. Finding and choosing the best characteristics from the dataset is very crucial for reducing this redundancy and improving predictive accuracy. A feature is a characteristic that affects or helps to solve a problem, and selecting the key characteristics for the model is referred to as feature selection.
For feature selection [20], typically two models—one supervised and the other unsupervised—are considered. Supervised feature selection approaches are employed when the dataset is categorized and aids in finding the pertinent features to improve the model's efficacy. This is the main justification for using supervised feature selection model in this research. One of the broadly used supervised feature selection techniques is the histogram-oriented gradient approach [21]. In the confined area of an image, this process counts instances of gradient direction. It concentrates on an object's structure and extracts the information from it. By employing the gradient's dimensions and orientation to create histograms, it collected the characteristics from those areas of the image. If and is the gradient of a pixel of an image , then it is calculated as follows:
And the magnitude of that pixel is represented as:
3.3.2. Machine Learning Models for Classification
ML [22] concentrates mostly on developing algorithms that allow a computer autonomously to learn from available knowledge and prior experiences. The identification of correlations from given knowledge is one of the objectives of a machine learning model. The patterns are then discovered from the training data by a learning algorithm, which creates a model that recognize the patterns and forecasts the results of new data.
Depending on the kind and characteristics of the task, three different types of machine learning models are available: 1) supervised, 2) unsupervised, and 3) reinforcement. The most straightforward one is the supervised model. It is mostly applied to training data with label information. The input-output combination principle explains how it functions. It is important to create an operation which can be trained using a learning set of data before being used on selections of unidentified data to execute forecasting. The effectiveness of supervised learning is evaluated using sets of labelled data. Three supervised ML models SVM, KNN, and NB are employed to carry out this investigation. These three models are widely used and effective for multi-class classification problems.
The SVM [23] method aims to generate a decision boundary that can characterize the n-dimensional space. Depending on that, it can quickly classify the latest data point. The term "hyperplane" refers to this optimal decision threshold. This approach generates the extreme vectors or points that assist in the formation of this hyperplane. Support vectors are referred to as these extreme points. Whenever there is a distinct line distinguishing the classes, it functions much as intended. SVM becomes a potent tool to forecasts for all the data that cannot be characterized by linear decision functions. In addition to using relatively low memory, it works well in high-dimensional spaces.
The KNN [24] model is a highly straightforward and efficient learning approach. By placing the new case in the category that closely resembles the currently accessible categories, it assumes that the new instances and existing instances are alike. Every new instance is categorized based on these similarities after the system stores all the existing information. In other words, when data appear, this algorithm can quickly classify the new information into a suitable category.
Naive Bayes [25] is a simplistic learning algorithm. It makes predictions using Bayes principles. It is termed Nave since it is depended on the assumption of conditional probability. Since it operates independently with each characteristic, it may be employed for big datasets to create forecasting model. It is particularly sensitive to other aspects, which indicates that it is not significantly affected by other components due to its Naive characteristic.
3.4. Hybrid Approach
The hybrid approach [26] is a combination of two or even more computational approaches that outperform any single approach. The advantage of implementing this approach is that it improves performance by increasing model effectiveness. The DL and ML models are integrated to carry out this study. In order to categorise the input photos depending on these deep characteristics, the deep neural model first extracts these characteristics from the input images. Then the ML model is employed to classify the images based on these features. The extraction of deep features makes this hybrid approach particularly effective. The deep features gathered all the essential data for classification and performed considerably better than any generative model. Figure 3 provides an illustration of the proposed hybrid approach preferred for this study.
4. Proposed Methodology
An study of a digital blood smear image reveals that the amount of white-blood cells is significantly greater than the proportion of red blood cells. Such aberrant white-blood cell occurrences and counting the numbers can be used to determine whether an individual has Leukemia. To identify if a person has Leukemia, wide varieties of clinical evidence, haematological and bone marrow observations, and outcomes of more specialised definitive tests studies are required. These procedures are both time-consuming and expensive. Therefore, in response to these concerns, this study describes a strategy for forecasting Leukemia using digital image evaluation.
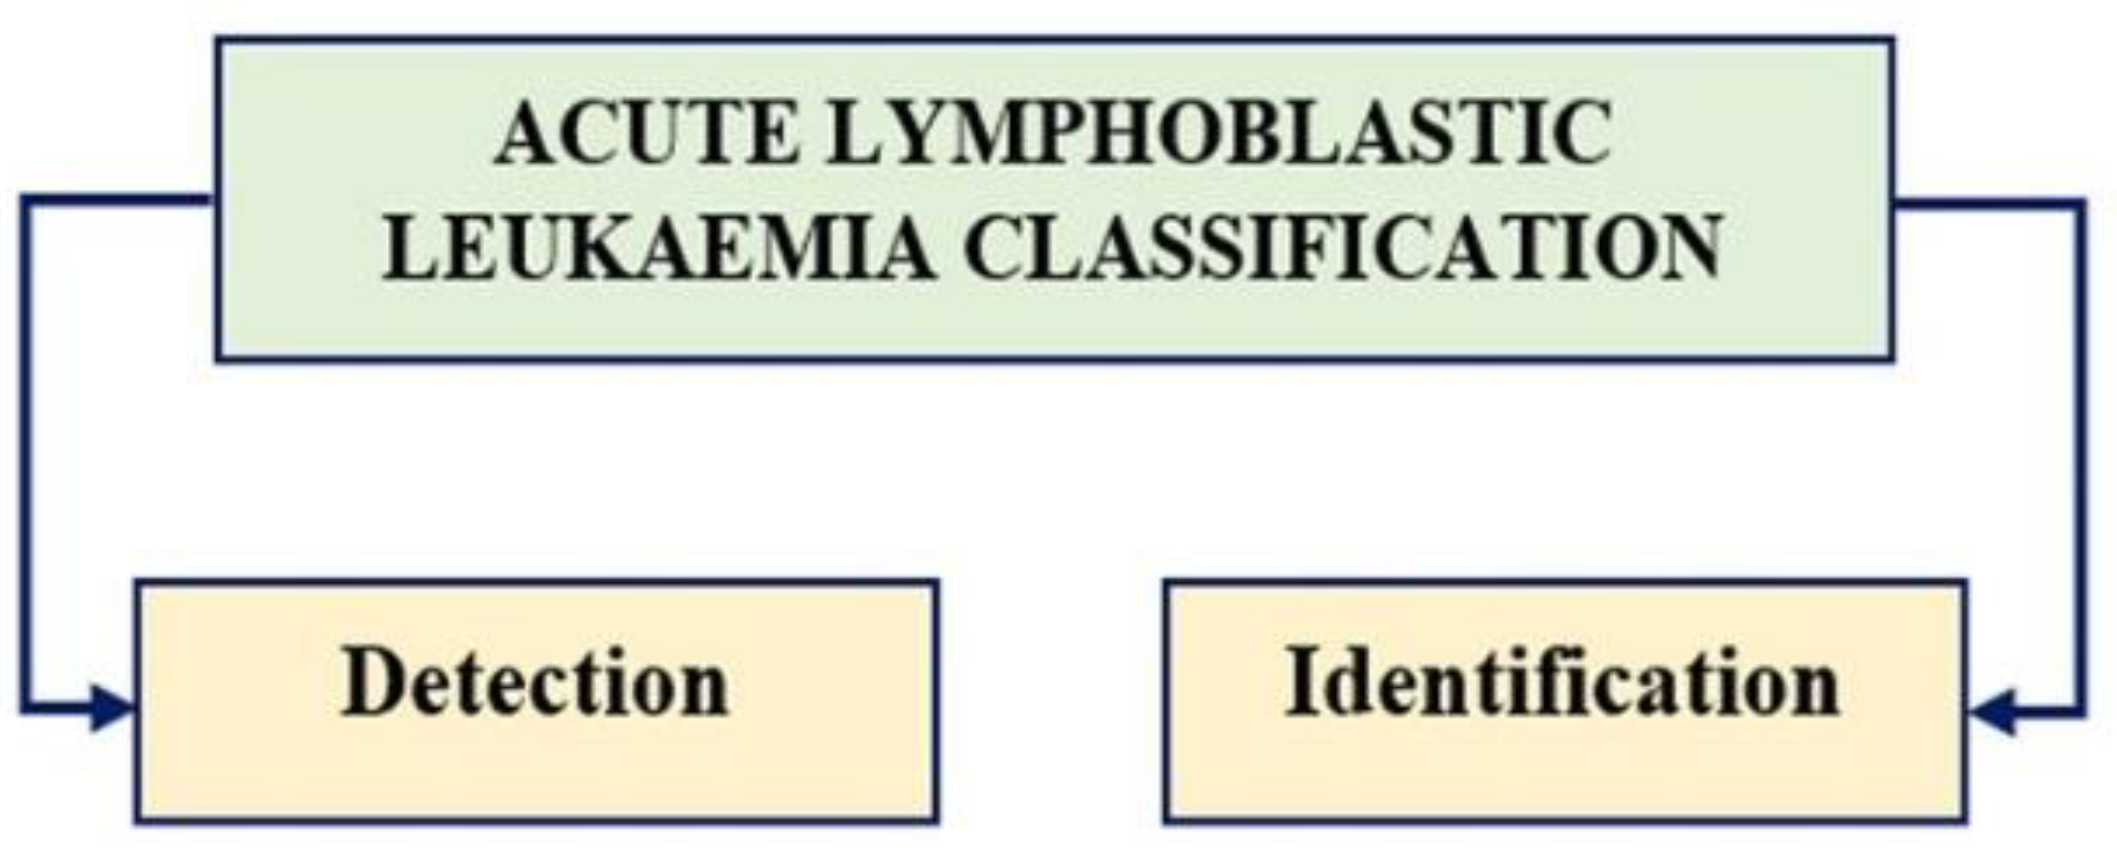
To assess and anticipate these digital photos, the following procedures were taken: 1) Detection and 2) Identification.
Figure 4.
The Prediction Process for Acute Lymphoblastic Leukemia Prediction.
4.1. Detection Process
The fundamental and perhaps most successful approach to identify Leukemia is to count the amount of white blood cells, platelets, and red blood cells in a person's blood. Contemporary research revealed that the white-blood cells detected in Leukemia patients' blood are substantially darker than natural blood cells. This color contrast [27] principle may now be used to locate Leukemia cells by examining a digital picture.
This study employed a machine vision technique to identify Leukemia from a digital picture. It has been noticed that appropriate white-blood cells are often difficult to detect due to low image clarity and details. To correctly identify Leukemia from blood smear pictures, the affected cells must be precisely distinguished. This is one of the most crucial procedures. Address this issue, a considerable pre-processing procedure was implemented in this study. This pre-processing procedure consists of four stages: 1) Equalize the color intensity level and increase the contrasting level and sharp the objects boundaries to make the impacted cells more visible, 2) Use the color clustering model to detect the cell boundaries, 3) apply the morphological operators to segment the appropriate regions, and 4) Enumerate the damaged cells. The algorithm and the pictorial working process for Leukemia detection are presented in algorithm 1 and Figure 2.
Algorithm 1: Leukemia_Detection(im)
Step 1: Collect the Leukemia blood smear images of from dataset repository.
Step 2: Pre-process the images.
Step 2.1: Adjust the brightness level to meet the requirements of each image.
Step 2.2: Adjust the contrast level to enhance the image intensity of image pixels.
Step 2.3: Increase the sharpness level to properly detect the cell boundaries.
Step 2.4: Increase the intensity of each RGB color channel to meet the requirements of each image. This step will increase the color intensity level of dark image pixels.
Step 3: Convert the RGB image into lab color model and apply the K-means color clustering model.
Step 4: Convert the resulted image into 2-color Binary image.
Step 5: Take complement of the binary image. It will separate actual Leukemia cells from other cells.
Step 6: Apply morphological operator ‘Erosion’ to detect the proper area of the effect cell.
Step 7: Then apply the ‘Dilation’ operator to thinning the edges of the cells to properly detect the cell area.
Step 8: Give the boundary of all the detected foreground regions and count the regions. This will help to count the number of white-blood cells present in the blood stream.
4.2. Identification Process
The procedure of predicting acute Leukemia is difficult. The identification and prediction of Leukemia through standard physical evaluations, as well as the way of gathering information from collective samples, are both time consuming and expensive. In the lack of early diagnosis, the disease will progress from the early stage to higher stages. As a result, the patient's life might be at risk.
However, diagnosing this condition through digital image evaluation is more effective than conventional healthcare examination. This procedure was considerably more significant, requires less time, is much less expensive, and is far more precise than the conventional one. This investigation employs machine learning and fusion learning methods to detect Leukemia from digital images. One of the benefits of employing these learning techniques is their ability to rapidly and precisely detect the type of the condition.
To carry out this investigation first three well-known single learning models are utilized. The best model is selected among them based on its precision. In order to boost the effectiveness of the forecasting model, the selected model is paired with a deep convolution system Resnet50 [28]. Figure 5 and Algorithm 2 both provide descriptions of the workflow and associated algorithm.
Algorithm 2: Leukemia_Prediction(L_Pred)
[Single Learning Approaches]
Step-1: Apply HOG feature selection model to collect the top features from pre-processed images.
Step-2: Separate the collected features for training and testing into 4:1 ratio.
Step-3: Develop single learning approaches and use them to train the characteristics that have been segregated for training.
Step-4: Apply this trained data on the test data to evaluate the model performances.
Step-5: Evaluate the performance matrices model accuracy, model accuracy under curve, true positive rate (TPR), true negative rate (TNR), False Detection Rate (FDR), Positive Predicted Value (PPV).
Step-6: Select the best predicted model based on performance accurate rate.
[Composite Approach]
Step-7: Construct the pre-trained deep convolution model ResNET50 to collect the features from the pre-processed images.
Step-8: To enhance the model performance tuned different layers of the constructed network model.
Step-9: Split the features into training and testing (4:1 ratio).
Step-10: Apply the best single learner model to train the training data.
Step-11: Apply the trained data on test data for final prediction.
Step-12: Evaluate the model performance.
5. Experimental Result
5.1. Dataset Details
Image Samples for this investigation were gathered from the Kaggle library [29]. the database. This collection included 3256 blood smear pictures from 89 people who were thought to have acute lymphocytic Leukemia. The bone marrow research lab at Taleqani Hospital generated the samples for this collection. The collection is categorized into two primary classes – ‘Benign’ and ‘Malignant—and three additional malignant classes - ‘Early’, ‘Pre’, and ‘Pro’. Figure 7 illustrates the distribution of images across all categories.
5.2. The Outcome of Leukemia Detection:
The results of Leukemia identification from blood smear images are shown in Figure 8. In the identification process, a number of algorithms based on computer vision were employed to recognize the white-blood components.The detailed descriptions of each stage in this procedure are provided in the illustrations beneath.
5.3. The Outcome of Leukemia Identification:
There are two stages in the Leukemia prediction method. Three well-known machine learning processes are employed during the first stage. The specifications for each model prior to the training procedure are shown in Table 1. The effectiveness of the three single learning models that have been proposed are represented in Table 2. The effectiveness of the models was assessed using the subsequent metrics: model accuracy, area under the curve (AUC), (TPR)rate of true positives,(FNR) rate of false negatives, positive predicted value (PPV), and false detected rate (FDR). The highest model is chosen from stage one based on these performance benchmarks. The receiver operative cuve (ROC) for the top model is illustrated in Figure 9. In the following step, a deep residual network is constructed to retrieve deep features, and the best predictive model from stage one is used for classification. The performance of this hybrid strategy is displayed in Table 3 and the receiver curve evaluation of each classification category is illustrated in Figure 10.
5.3.1. Identification Based on Single Learner Models
5.3.2. Identification Based on Hybrid Learning Model
6. Discussions
Finding blood cancers in their earliest stages is a big challenge. Leukemia is similar to them in this regard. Therefore, creating a reliable detection method is one of the most significant priorities. Leukemia assessment and forecasting have proven to be challenging and time - consuming tasks based on tradition therapeutic approach. The prediction using ML algorithms using just a digital blood smear image has become incredibly successful and efficient as a result of high popularity of AI and ML in medical industry. The following real-world cases can benefit from using this automated decision-making method, depending on the predicted outcome:
- This technique can be useful in the healthcare field since it allows doctors to effortlessly and precisely diagnose Leukemia in its early stages. As a result, it offers a trustworthy option to begin early treatment and reduce the severity of mortality situations.
- To identify the white-blood cells, the color clustering strategy for monitoring is a very trustworthy and effective technique. This automated technique aids in analyzing the development of these white-blood cells so it will send warning messages when the effects of the disease reach to a harmful level.
- This study shows that the hybrid approach to determining the type ALL also presents a successful and efficient method. Unlike the typical ML paradigm, this method integrated both ML and DL strategies. The DL method extracts the deepest characteristics from the images. This hybrid strategy has this as one of its main advantages. These in-depth features allowed the ML classification model to outperform any single learning methods in terms of effectiveness.
- It has been found that the Resnet50 model for deep feature extraction and the SVM model for machine learning surpasses all other hybrid models in terms of performance. This combined strategy offers accuracy levels exceeding 99%.
7. Conclusions
A form of blood cancer called Leukemia produces huge amount of abnormal blood cells and typically starts inside the bone marrow. As of today, four different forms of Leukemia have been identified. One of the regular types of Leukemia is ALL. Typically, young children are the ones who have it. A significant rise in white-blood cells is one of its defining features. The effects of these aberrant cells prevent the bone marrow from producing proper blood cells, leading to decreased hemoglobin and insufficient platelets. Due to the rapid growth and build-up of malignant cells in ALL, timely medical attention is necessary. The traditional procedure, which includes blood test examination, genealogy research, and frequent medication, requires an extensive amount of time, and the results may not always be good. When a sickness was not properly diagnosed, it could potentially spread so quickly that it reached a very dangerous level. Artificial Intelligence and machine learning are particularly helpful for resolving these challenges. This automated procedure is incredibly efficient and effective at both identifying white-blood cells and predicting the nature of diseases. This work uses a colour grouping method to identify white-blood cells from digital blood photos. This method separates the darkish white-blood areas from the bloodstream and aids in counting the white-blood cells. Furthermore, the three most widely used ML models is used to estimate the category of white-blood cells. SVM model shown to have the best level of accuracy. After that, a combined approach is developed to improve prediction performance. In this architecture, the SVM is paired with the Resnet50 deep neural network framework and acquires accuracy levels exceeding 99%.
References
- Rupapara, V., Rustam, F., Aljedaani, W., Shahzad, H. F., Lee, E., & Ashraf, I. (2022). Blood cancer prediction using Leukemia microarray gene data and hybrid logistic vector trees model. Scientific Reports, 12(1), 1–15. [CrossRef]
- Dese, K., Raj, H., Ayana, G., Yemane, T., Adissu, W., Krishnamoorthy, J., & Kwa, T. (2021). Accurate Machine-Learning-Based classification of Leukemia from Blood Smear Images. Clinical Lymphoma, Myeloma and Leukemia, 21(11), e903–e914. [CrossRef]
- Patil Babaso, S., Mishra, S. K., & Junnarkar, A. (2020). Leukemia Diagnosis Based on Machine Learning Algorithms. 2020 IEEE International Conference for Innovation in Technology, INOCON 2020, 1–5. [CrossRef]
- Salah, H. T., Muhsen, I. N., Salama, M. E., Owaidah, T., & Hashmi, S. K. (2019). Machine learning applications in the diagnosis of Leukemia: Current trends and future directions. International Journal of Laboratory Hematology, 41(6), 717–725. [CrossRef]
- Dharani, T., & Hariprasath, S. (2018). Diagnosis of Leukemia and its types Using Digital Image Processing Techniques. Proceedings of the 3rd International Conference on Communication and Electronics Systems, ICCES 2018, Icces, 275–279. [CrossRef]
- Almadhor, A., Sattar, U., Al Hejaili, A., Ghulam Mohammad, U., Tariq, U., & Ben Chikha, H. (2022). An efficient computer vision-based approach for acute lymphoblastic leukemia prediction. Frontiers in Computational Neuroscience, 16. [CrossRef]
- Ratley, A., Minj, J., & Patre, P. (2020). Leukemia disease detection and classification using machine learning approaches: A review. 2020 1st International Conference on Power, Control and Computing Technologies, ICPC2T 2020, 161–165. [CrossRef]
- Ghaderzadeh, M., Asadi, F., Hosseini, A., Bashash, D., Abolghasemi, H., & Roshanpour, A. (2021). Machine Learning in Detection and Classification of Leukemia Using Smear Blood Images: A Systematic Review. Scientific Programming, 2021. [CrossRef]
- Rehman, A., Abbas, N., Saba, T., Rahman, S. I. ur, Mehmood, Z., & Kolivand, H. (2018). Classification of acute lymphoblastic leukemia using deep learning. Microscopy Research and Technique, 81(11), 1310–1317. [CrossRef]
- Baig, R., Rehman, A., Almuhaimeed, A., Alzahrani, A., & Rauf, H. T. (2022). Detecting Malignant Leukemia Cells Using Microscopic Blood Smear Images: A Deep Learning Approach. Applied Sciences (Switzerland), 12(13). [CrossRef]
- Genovese, A., Hosseini, M. S., Piuri, V., Plataniotis, K. N., & Scotti, F. (2021). Acute Lymphoblastic Leukemia Detection Based on Adaptive Unsharpening and Deep Learning. ICASSP 2021 - 2021 IEEE International Conference on Acoustics, Speech and Signal Processing (ICASSP), 1205–1209. [CrossRef]
- Baig, R., Rehman, A., Almuhaimeed, A., Alzahrani, A., & Rauf, H. T. (2022). Detecting Malignant Leukemia Cells Using Microscopic Blood Smear Images: A Deep Learning Approach. Applied Sciences (Switzerland), 12(13). [CrossRef]
- Bukhari, M., Yasmin, S., Sammad, S., & Abd El-Latif, A. A. (2022). A Deep Learning Framework for Leukemia Cancer Detection in Microscopic Blood Samples Using Squeeze and Excitation Learning. Mathematical Problems in Engineering, 2022. [CrossRef]
- Eckardt, J. N., Middeke, J. M., Riechert, S., Schmittmann, T., Sulaiman, A. S., Kramer, M., Sockel, K., Kroschinsky, F., Schuler, U., Schetelig, J., Röllig, C., Thiede, C., Wendt, K., &Bornhäuser, M. (2022). Deep learning detects acute myeloid Leukemia and predicts NPM1 mutation status from bone marrow smears. Leukemia, 36(1), 111–118. [CrossRef]
- Maurya, L., Lohchab, V., Kumar Mahapatra, P., & Abonyi, J. (2022). Contrast and brightness balance in image enhancement using Cuckoo Search-optimized image fusion. Journal of King Saud University - Computer and Information Sciences, 34(9), 7247–7258. [CrossRef]
- Hussien, R. M., Al-Jubouri, K. Q., Gburi, M. R. a. A., Qahtan, A. G. H., & Jaafar, A. H. D. (2021). Computer Vision and Image Processing the Challenges and Opportunities for new technologies approach: A paper review. Journal of Physics, 1973(1), 012002. [CrossRef]
- Abdulateef, S. K., & Salman, M. D. (2021). A Comprehensive Review of Image Segmentation Techniques. Al-Maǧallaẗ Al-ʻirāqiyyaẗ Al-Handasaẗ Al-Kahrabāʼiyyaẗ Wa-al-Ilikttrūniyyaẗ, 17(2), 166–175. [CrossRef]
- Sundaram, A., & Sakthivel, C. (2022). Object detection and estimation: A hybrid image segmentation technique using convolutional neural network model. Concurrency and Computation: Practice and Experience, 34(21). [CrossRef]
- Niu, Z., & Li, H. (2019). Research and analysis of threshold segmentation algorithms in image processing. Journal of Physics, 1237(2), 022122. [CrossRef]
- Suresh, S., Newton, D., Everett, T. H., Lin, G., & Duerstock, B. S. (2022). Feature Selection Techniques for a Machine Learning Model to Detect Autonomic Dysreflexia. Frontiers in Neuroinformatics, 16. [CrossRef]
- Patwary, M. J. A., Parvin, S., & Akter, S. (2015). Significant HOG-Histogram of Oriented Gradient Feature Selection for Human Detection. International Journal of Computer Applications. [CrossRef]
- Ray, S. D. (2019). A Quick Review of Machine Learning Algorithms. International Conference Machine Learning, Big Data, Cloud and Parallel Computing. [CrossRef]
- Hearst, M. A., Dumais, S. T., Osman, E., Platt, J., & Schölkopf, B. (1998). Support vector machines. IEEE Intelligent Systems & Their Applications, 13(4), 18–28. [CrossRef]
- Peterson, L. E. (2009). K-nearest neighbor. Scholarpedia, 4(2), 1883. [CrossRef]
- Rish, I. (2001). An empirical study of the naive Bayes classifier. IJCAI 2001 Work Empir Methods Artif Intell.
- Miškovic, V. (2014). Machine Learning of Hybrid Classification Models for Decision Support. Sinteza 2014 - Impact of the Internet on Business Activities in Serbia and Worldwide. [CrossRef]
- Cheng, H., Jiang, X., Ma, J., & Wang, J. (2001). Color image segmentation: advances and prospects. Pattern Recognition, 34(12), 2259–2281. [CrossRef]
- He, K., Zhang, X., Ren, S., & Sun, J. (2015). Deep Residual Learning for Image Recognition. ArXiv (Cornell University). [CrossRef]
- Acute Lymphoblastic Leukemia (ALL) image dataset. (2021, April 30). Kaggle. https://www.kaggle.com/datasets/mehradaria/leukemia.
Figure 2.
Histogram distribution of Global thresholding model.
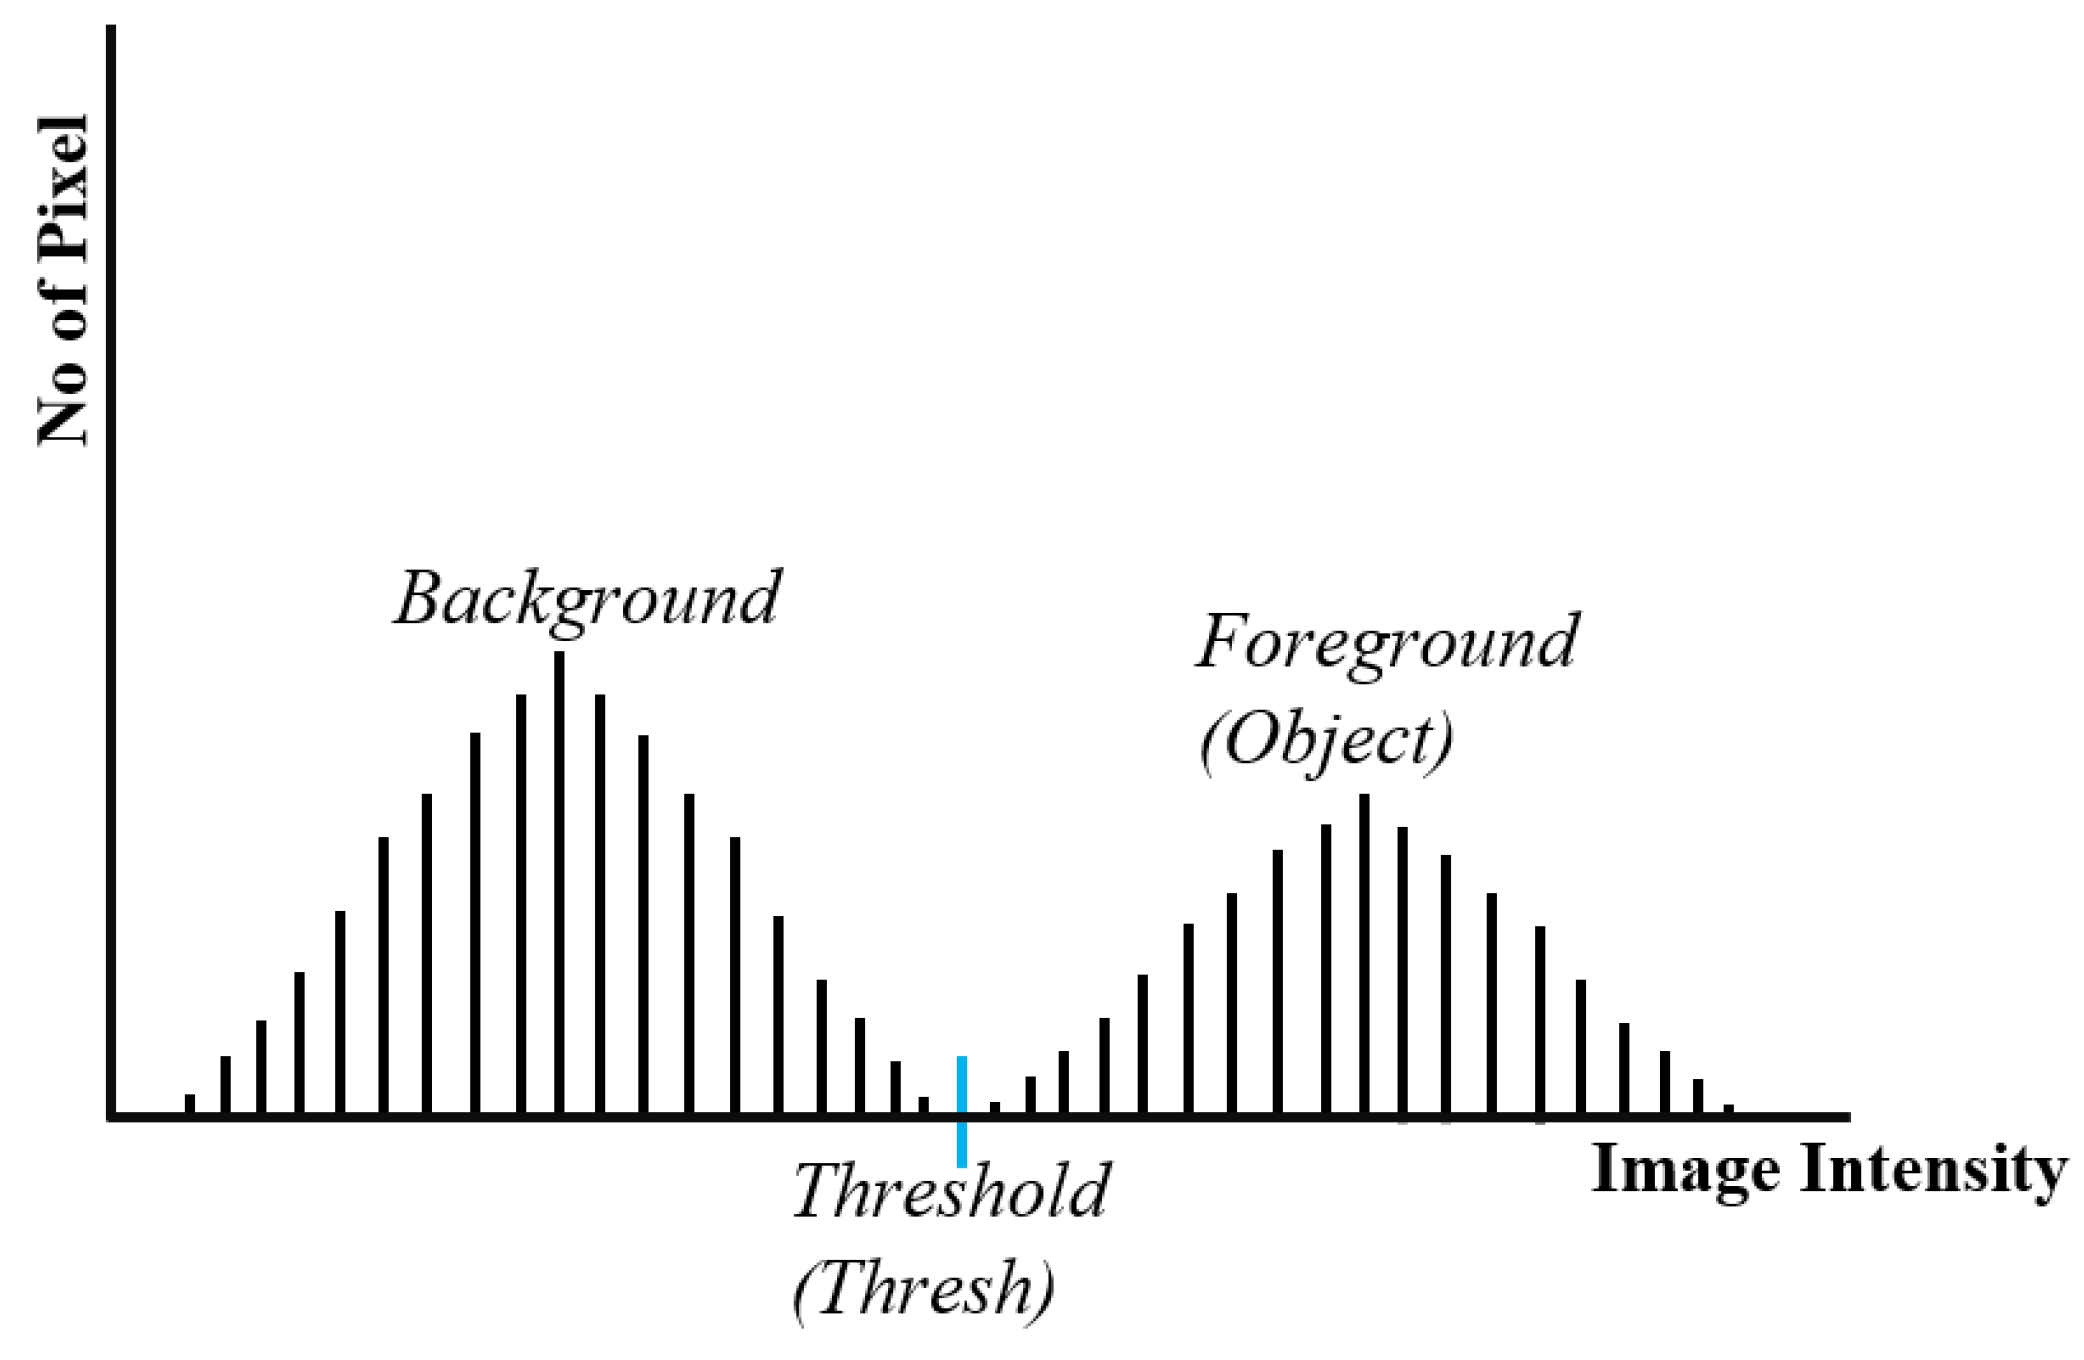
Figure 3.
Outline of the Hybrid Learning Approach.
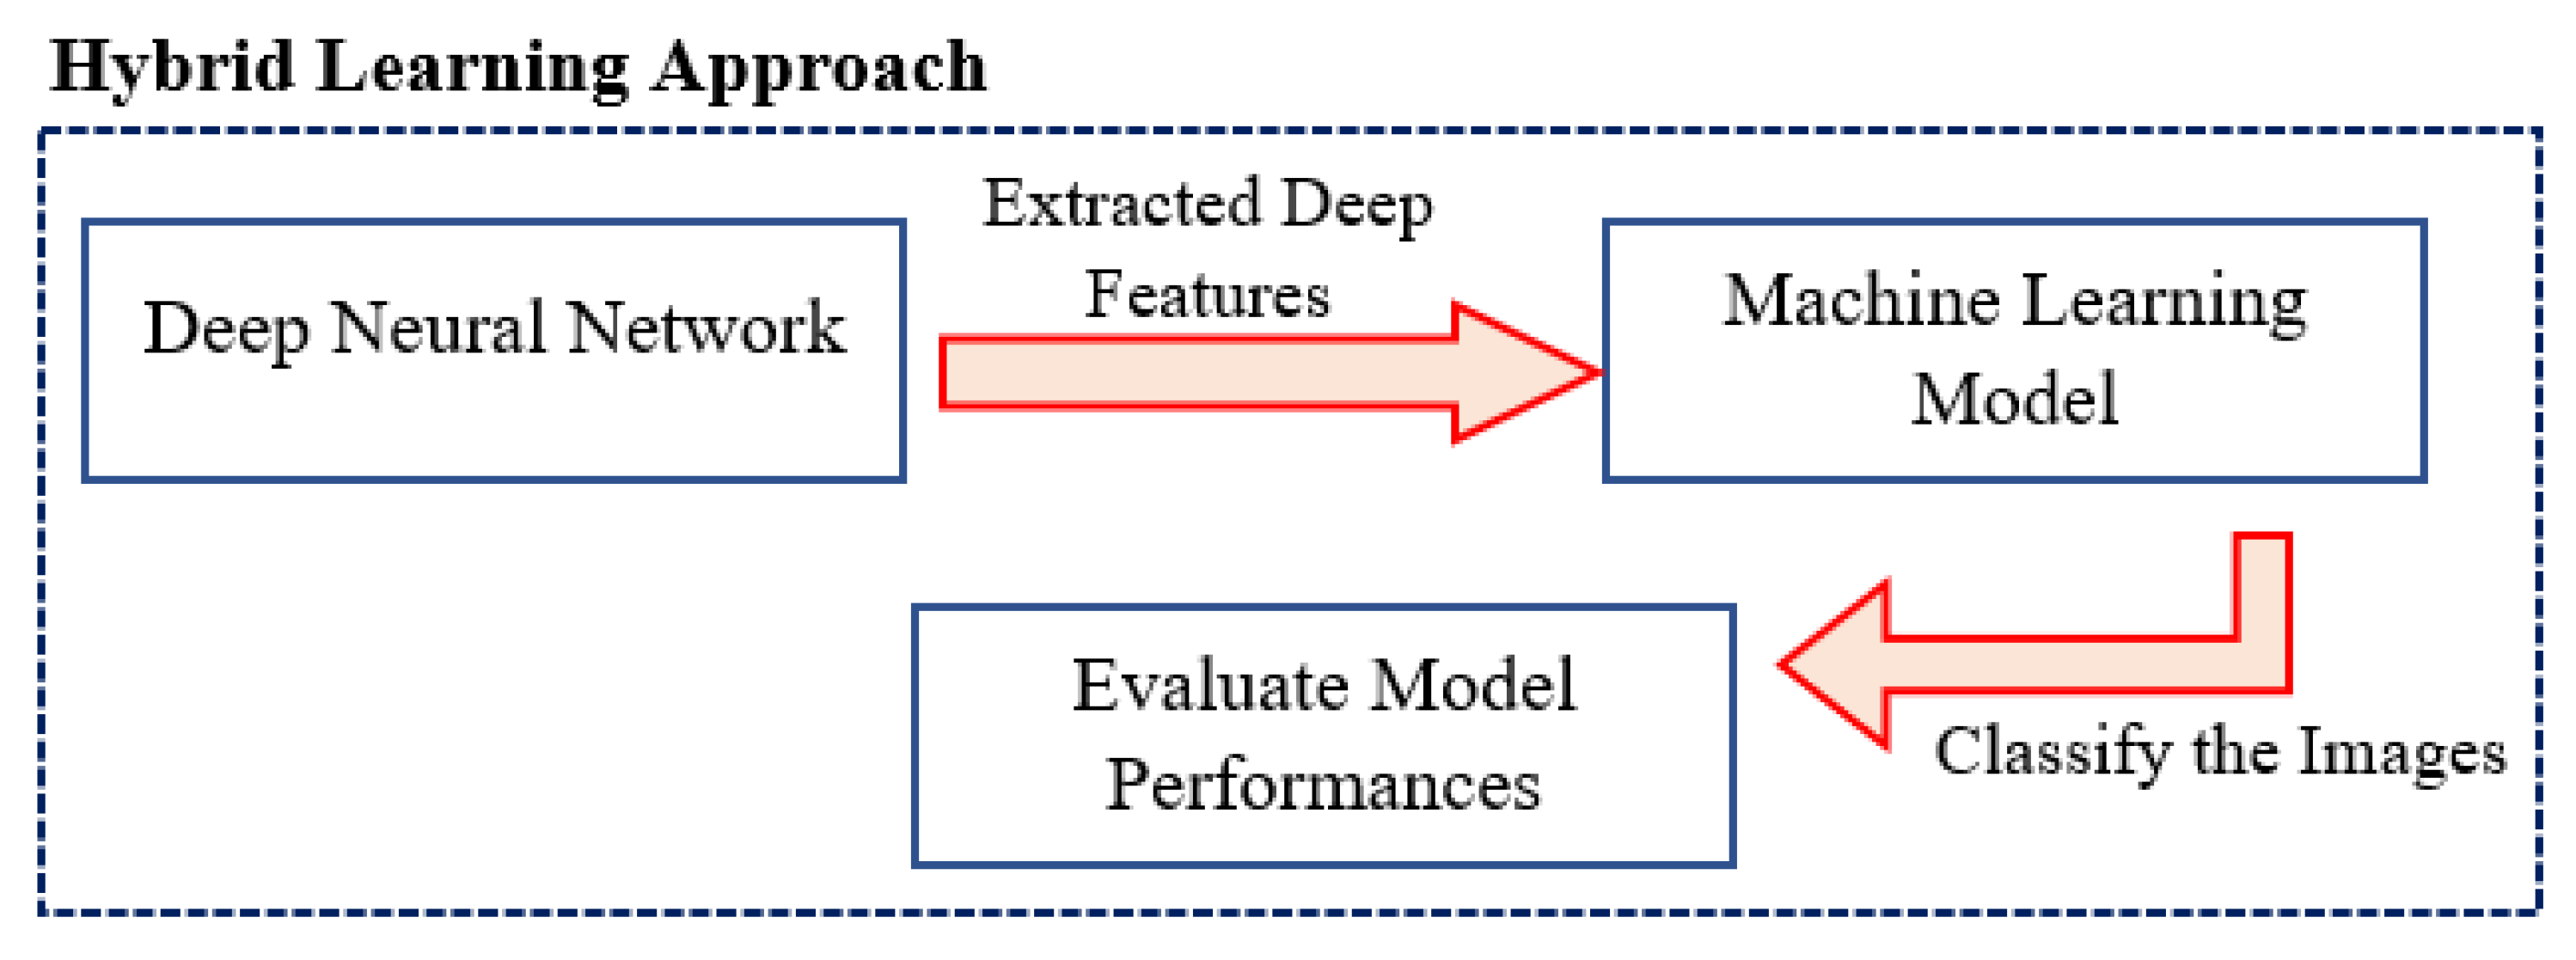
Figure 5.
The Pictorial Representation of the Working Process of Leukemia Detection.
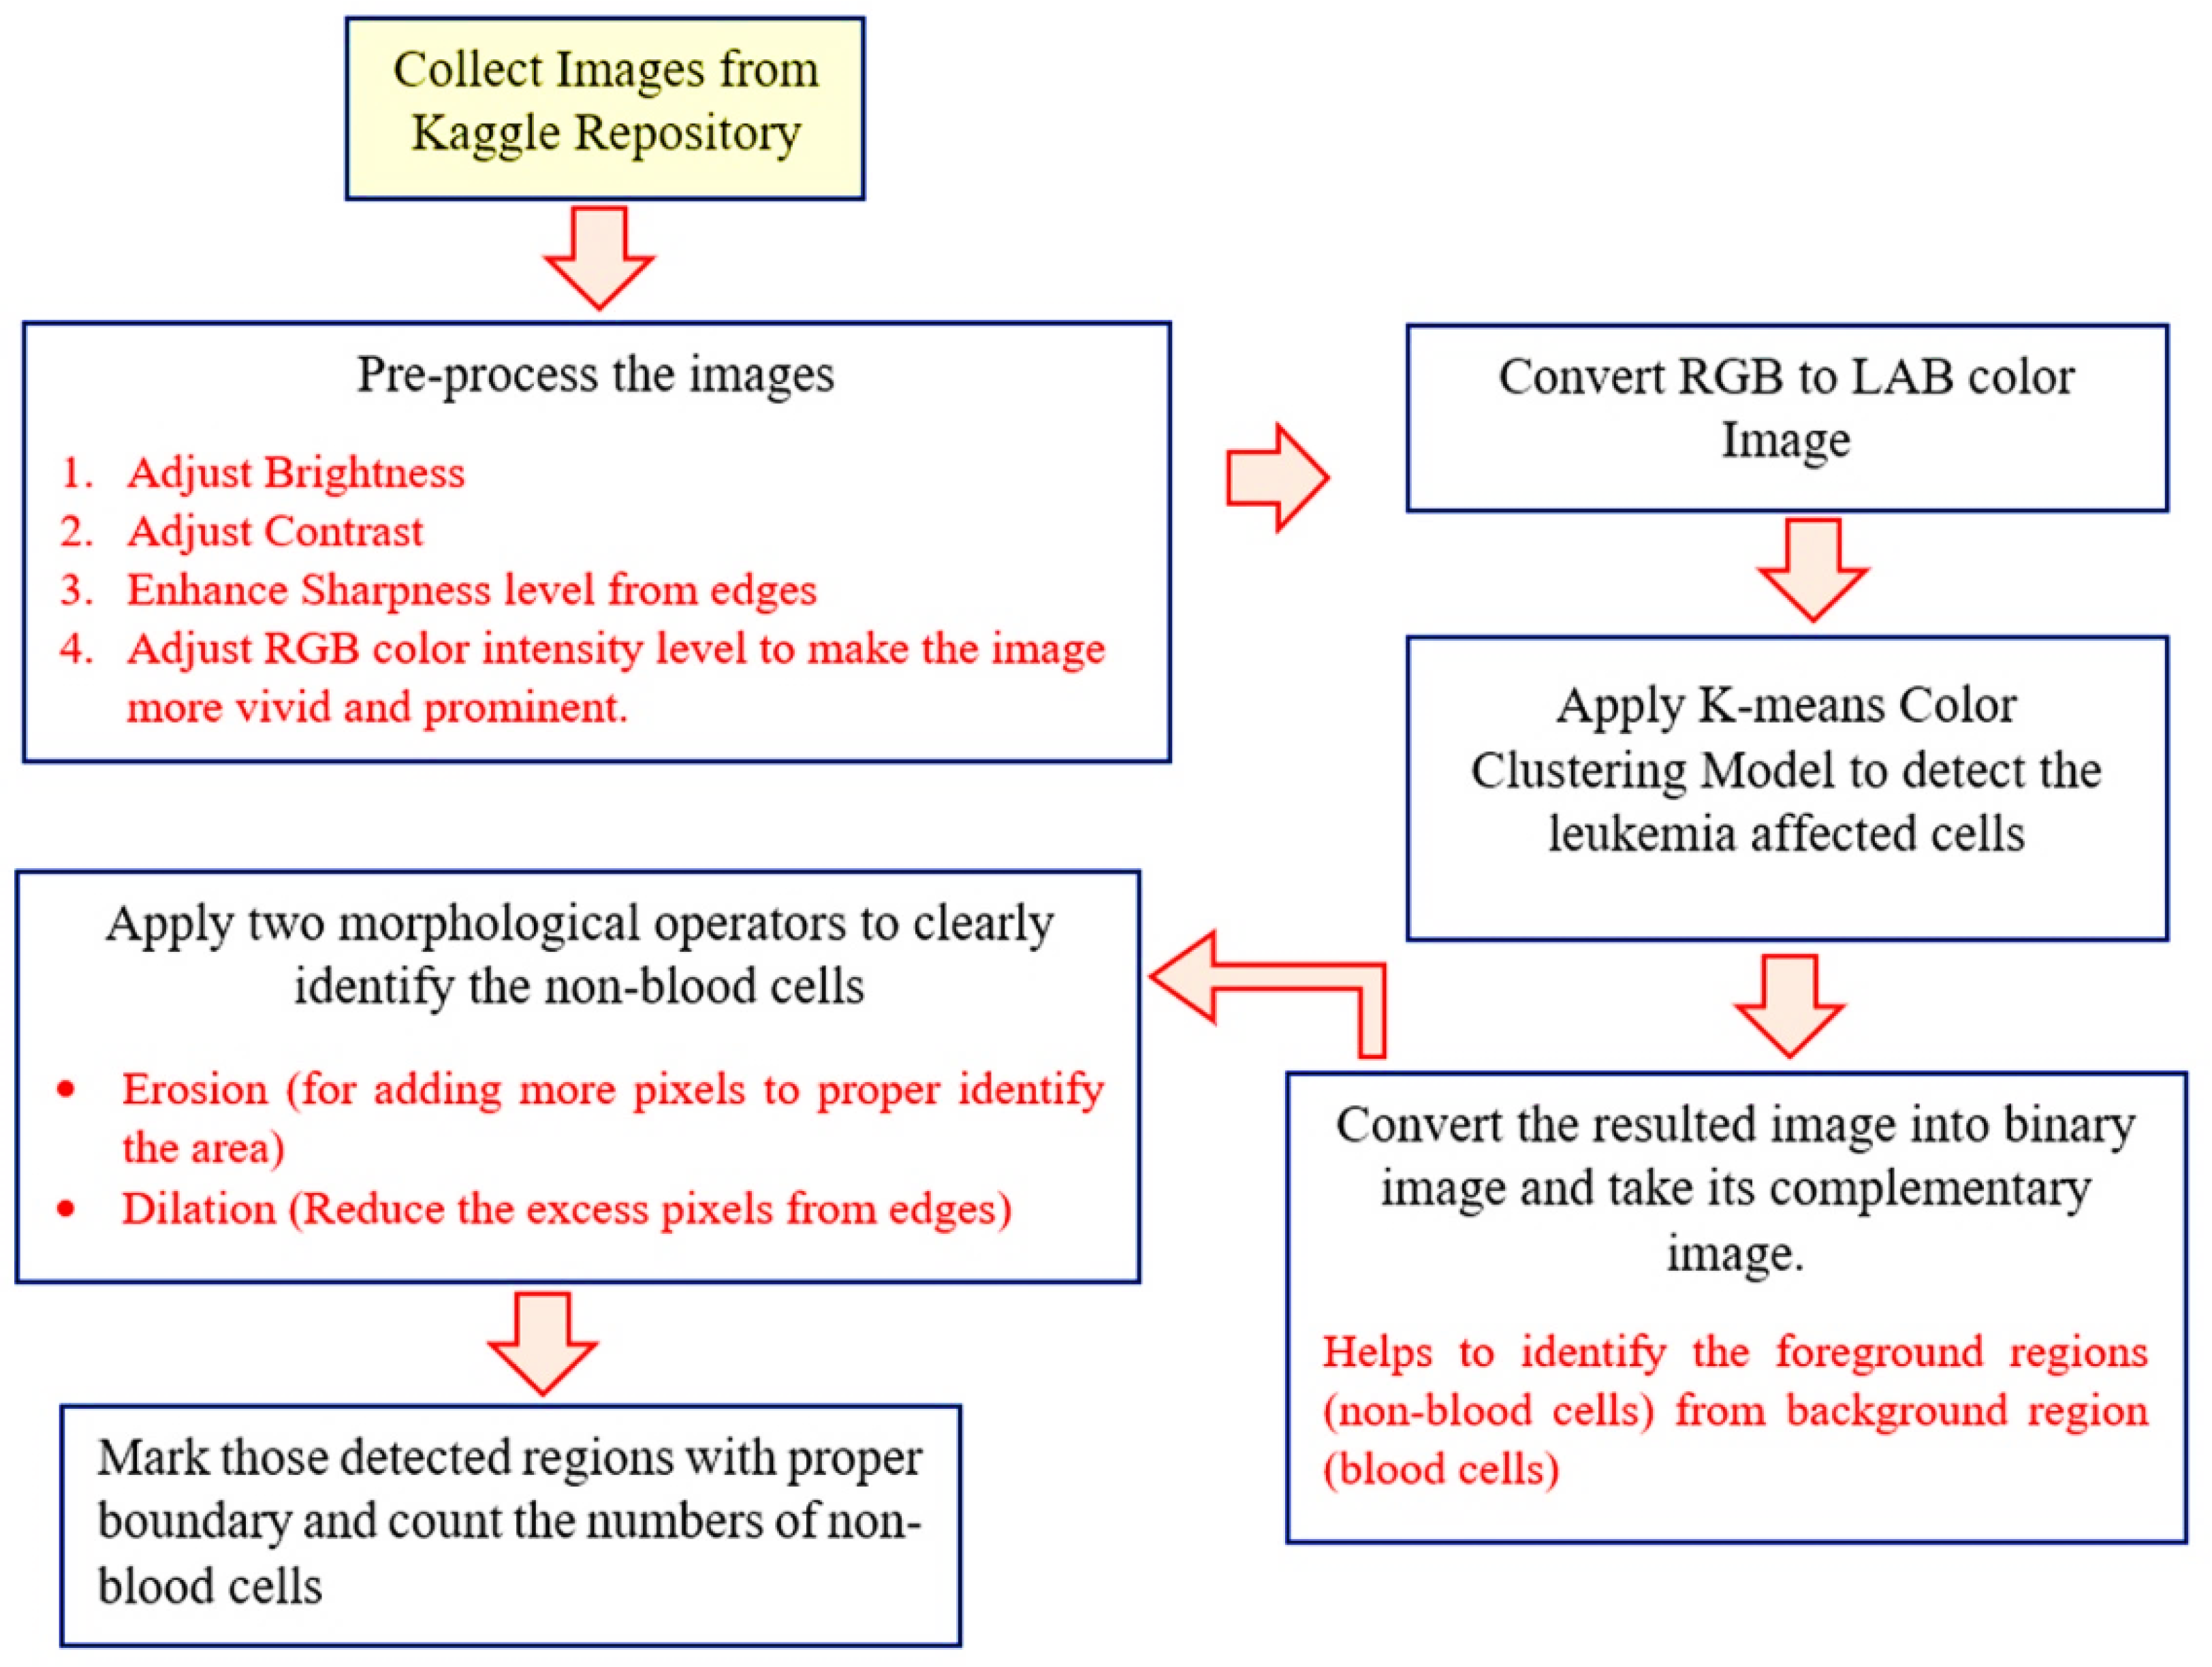
Figure 6.
The Pictorial Representation of the Working Process of LeukemiaType Detection.
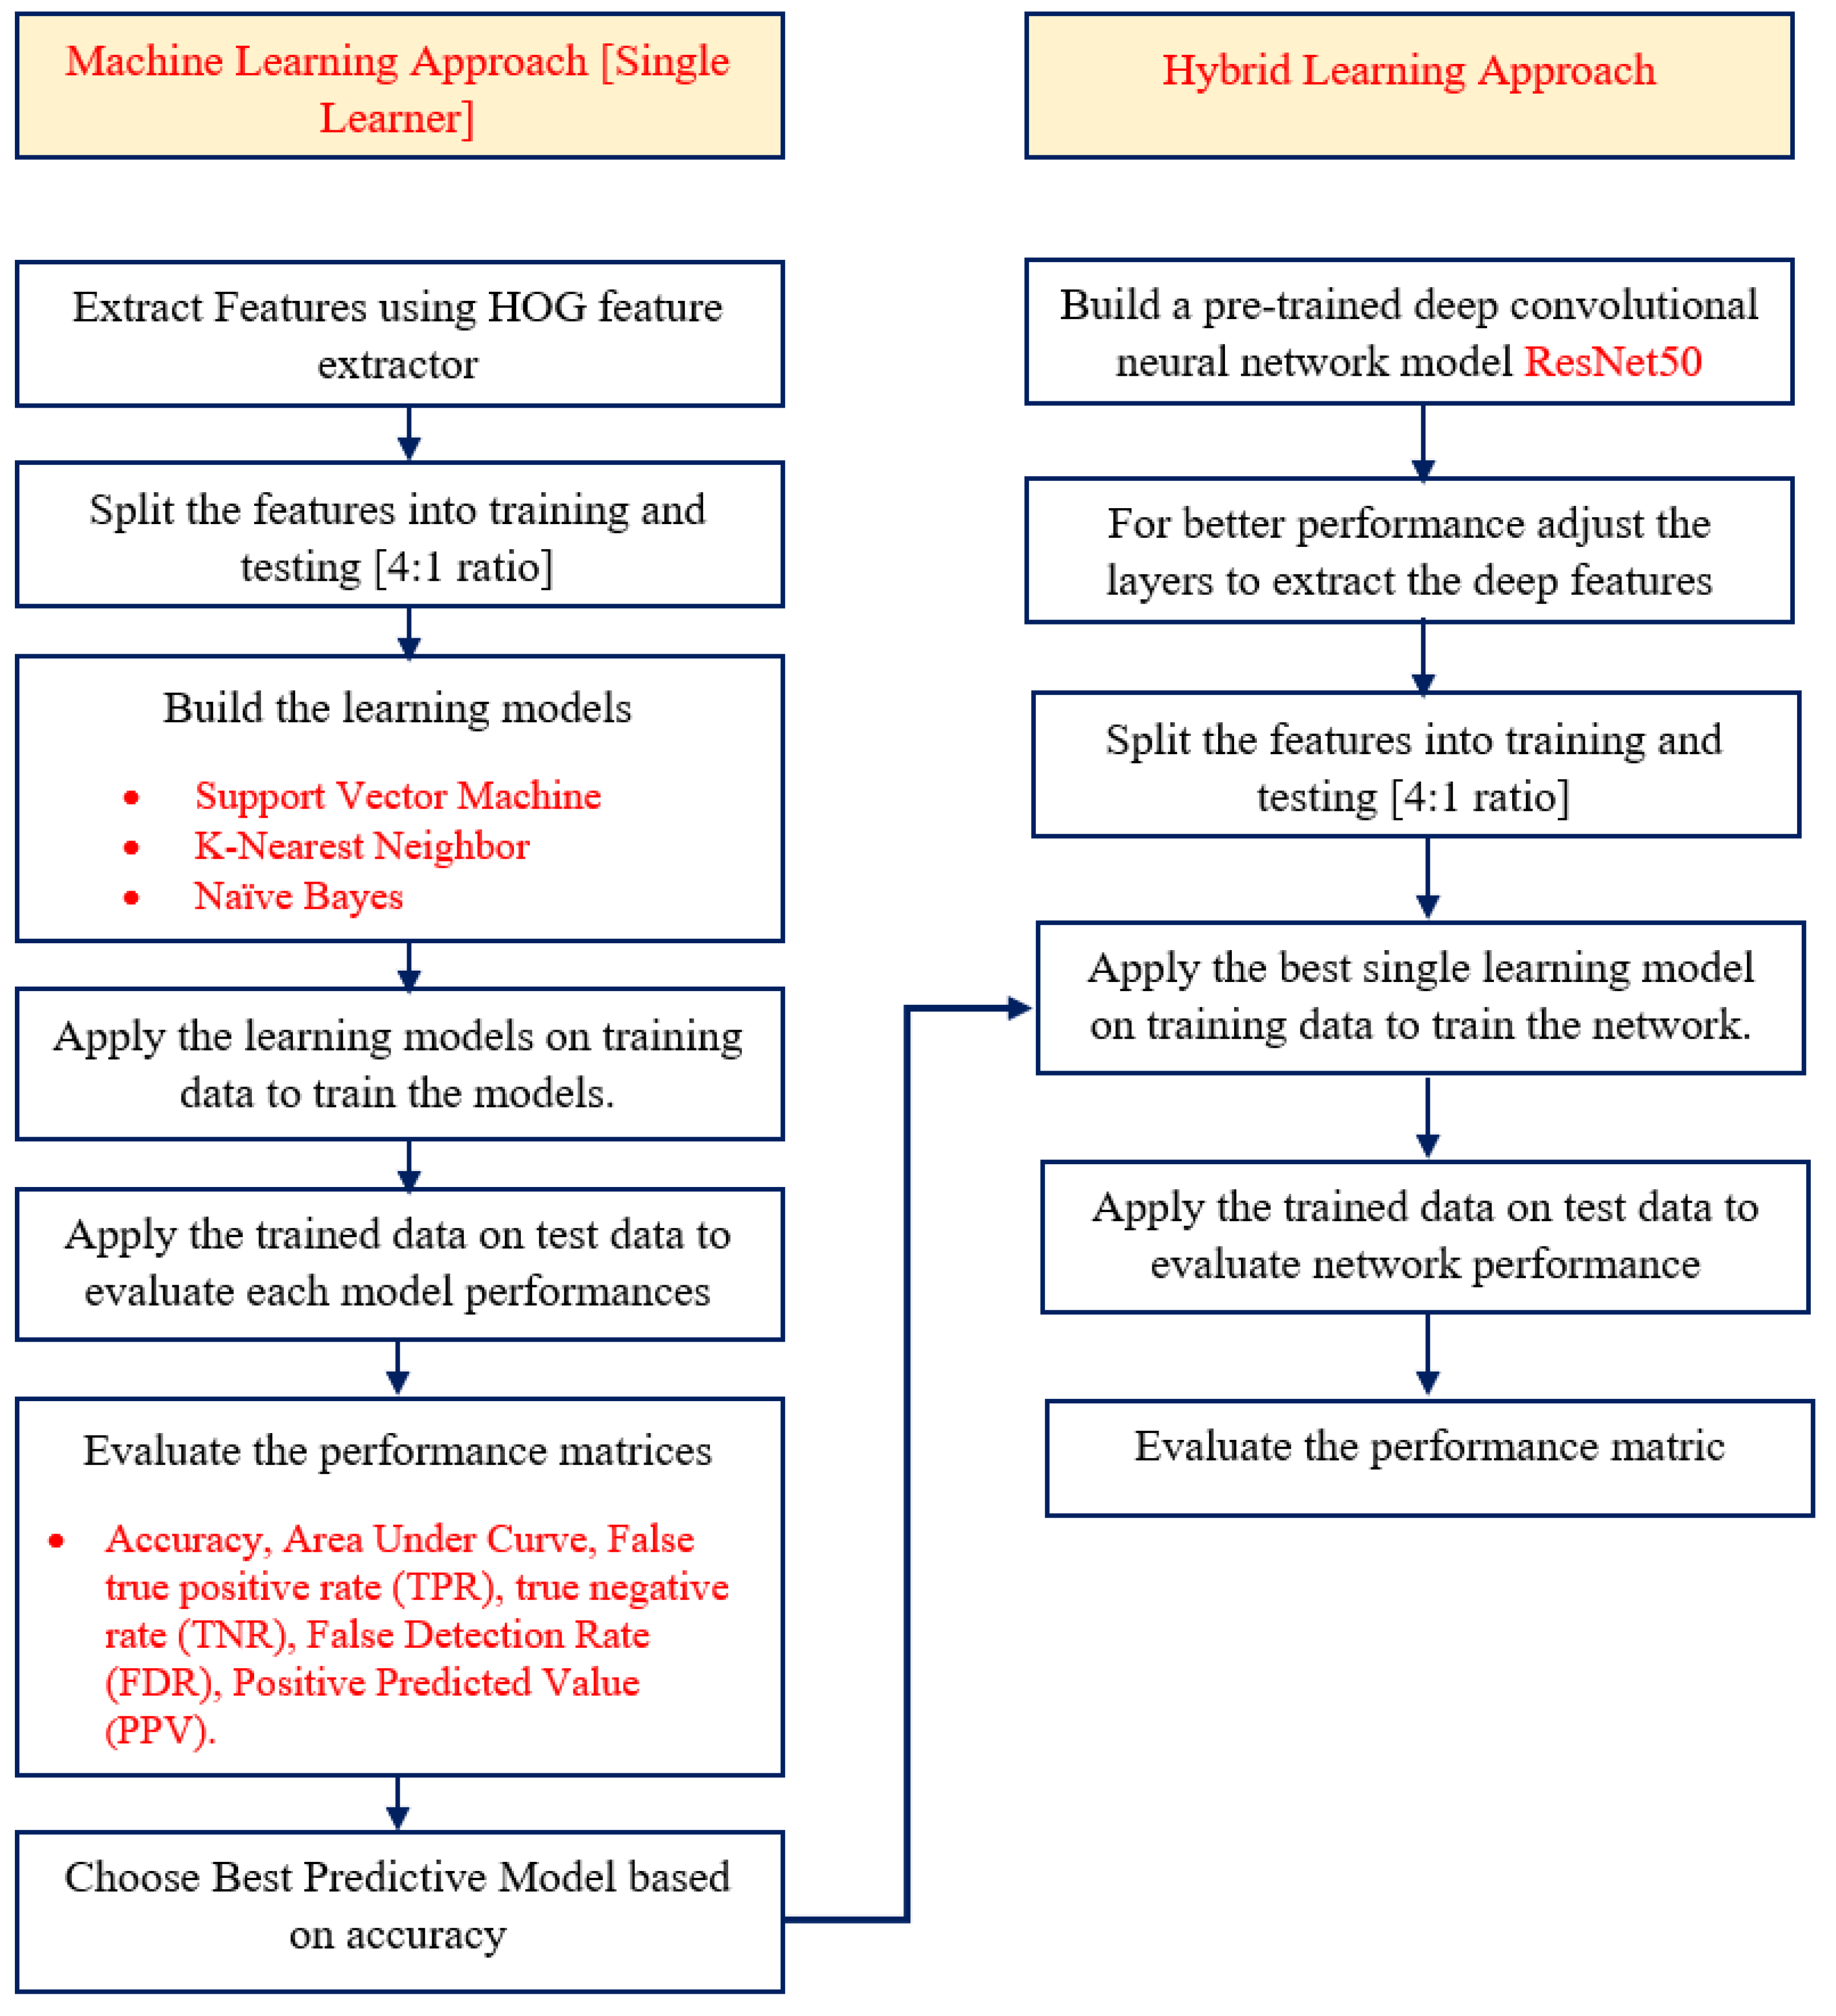
Figure 7.
Visualization of Dataset.
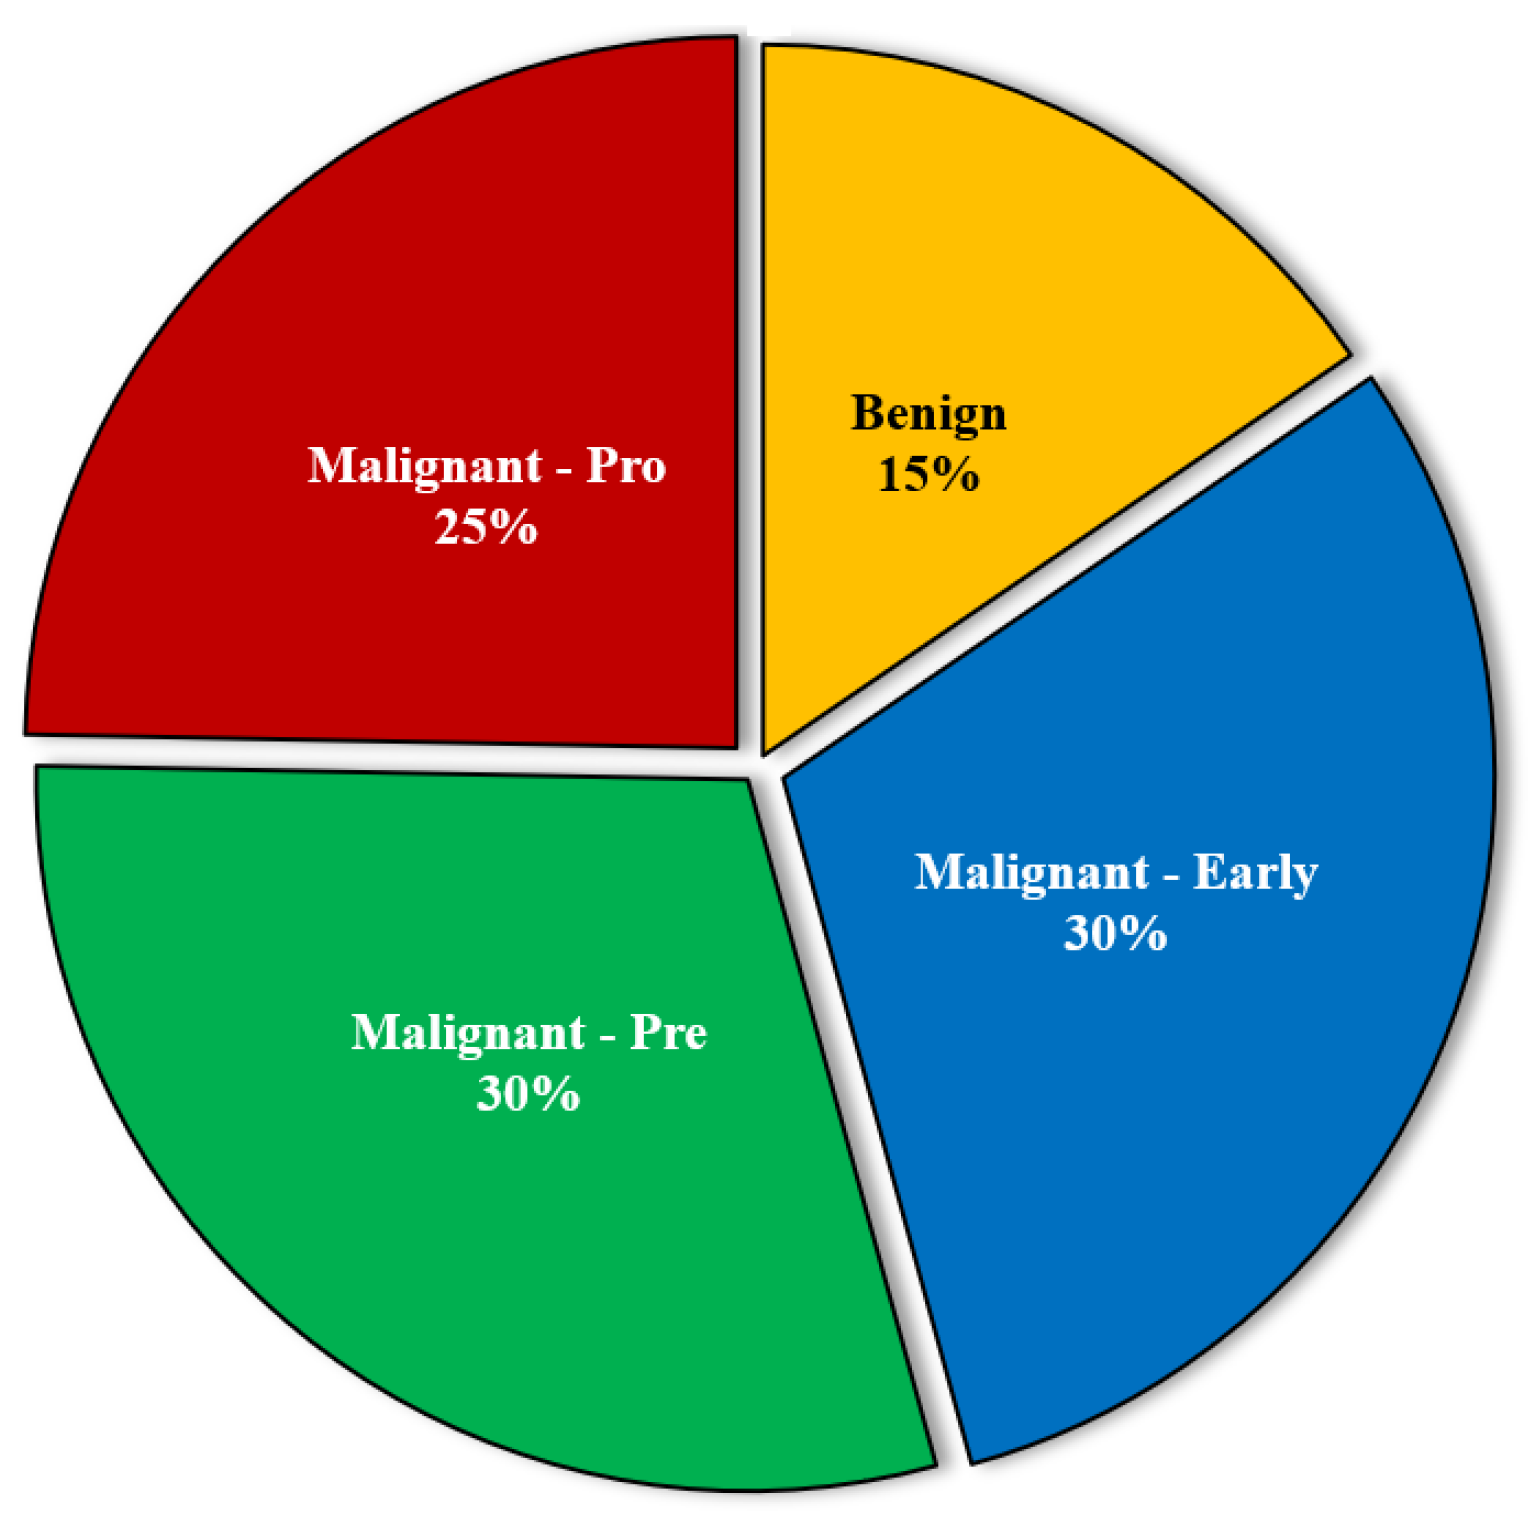
Figure 8.
Leukemia Detection Process A) Original Image: Category Benign, B) Brightness, Contrast, and Sharpness adjustment Image, C) Binary Segmented Image, D) Highlighted White-blood Cells After Applying K-Means Clustering Method and Morphological Operators, E) No of White-blood Cells Calculation.
Figure 8.
Leukemia Detection Process A) Original Image: Category Benign, B) Brightness, Contrast, and Sharpness adjustment Image, C) Binary Segmented Image, D) Highlighted White-blood Cells After Applying K-Means Clustering Method and Morphological Operators, E) No of White-blood Cells Calculation.
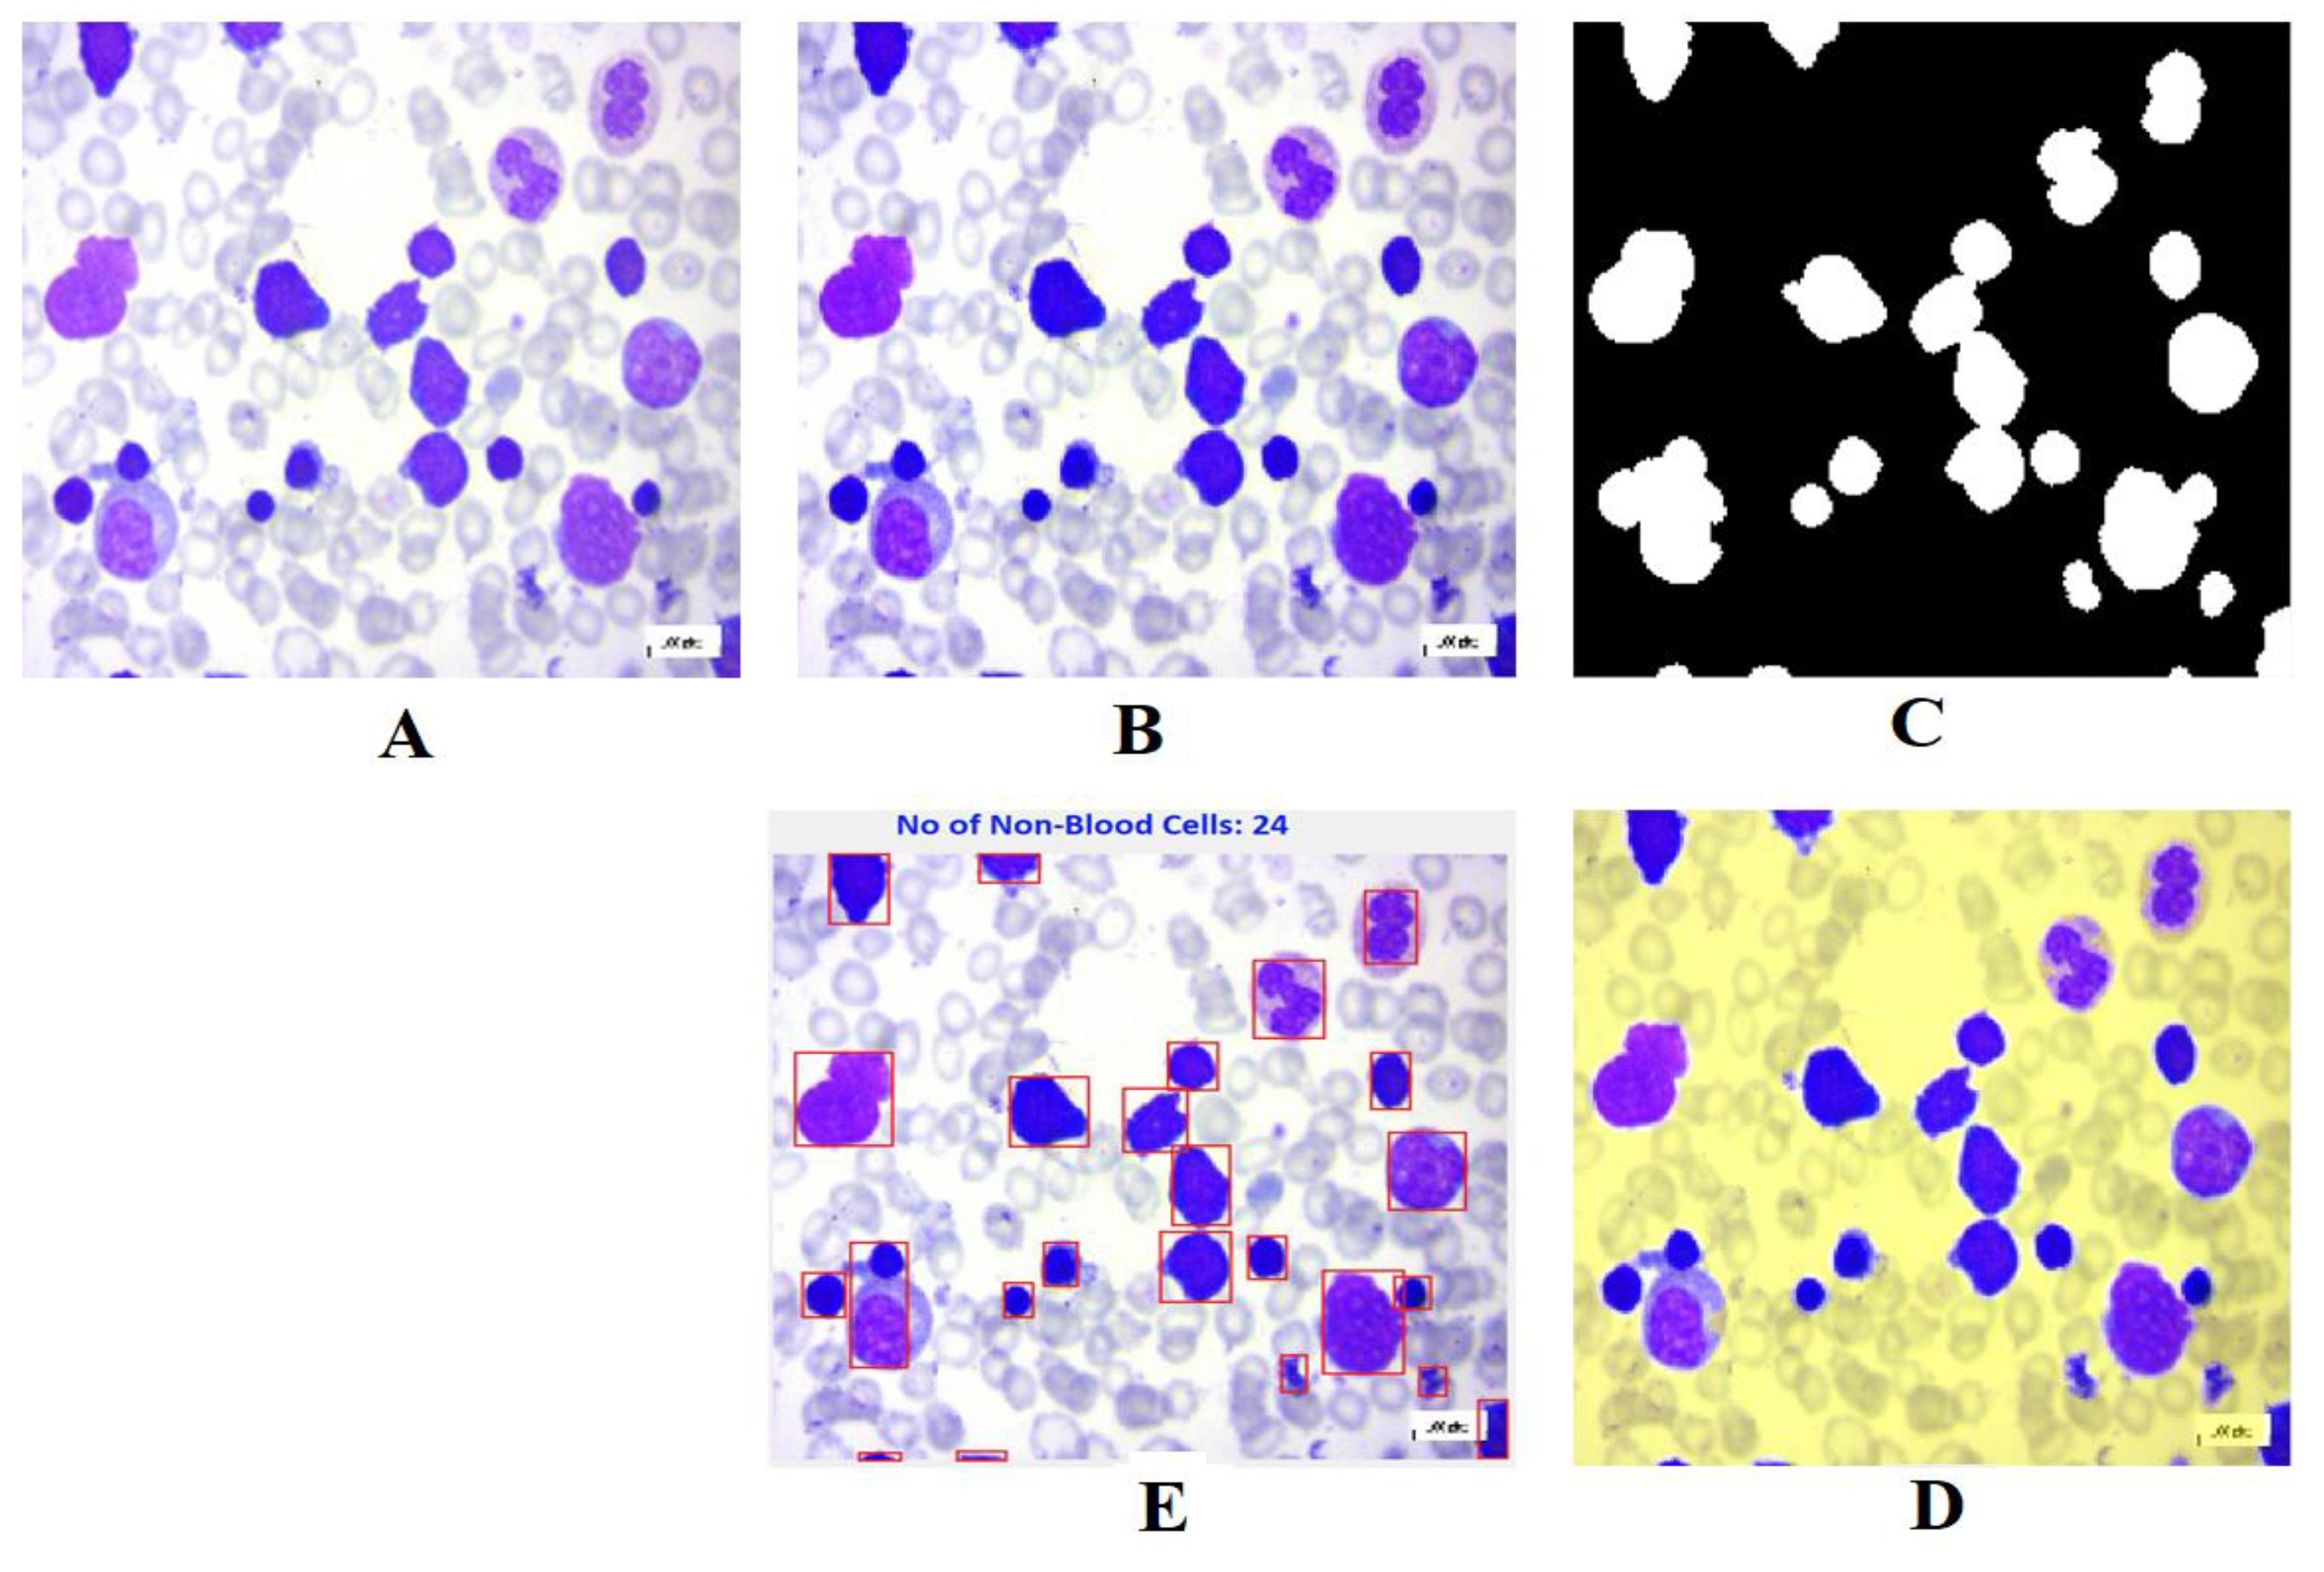
Figure 9.
The ROC analysis for the top model SVM.
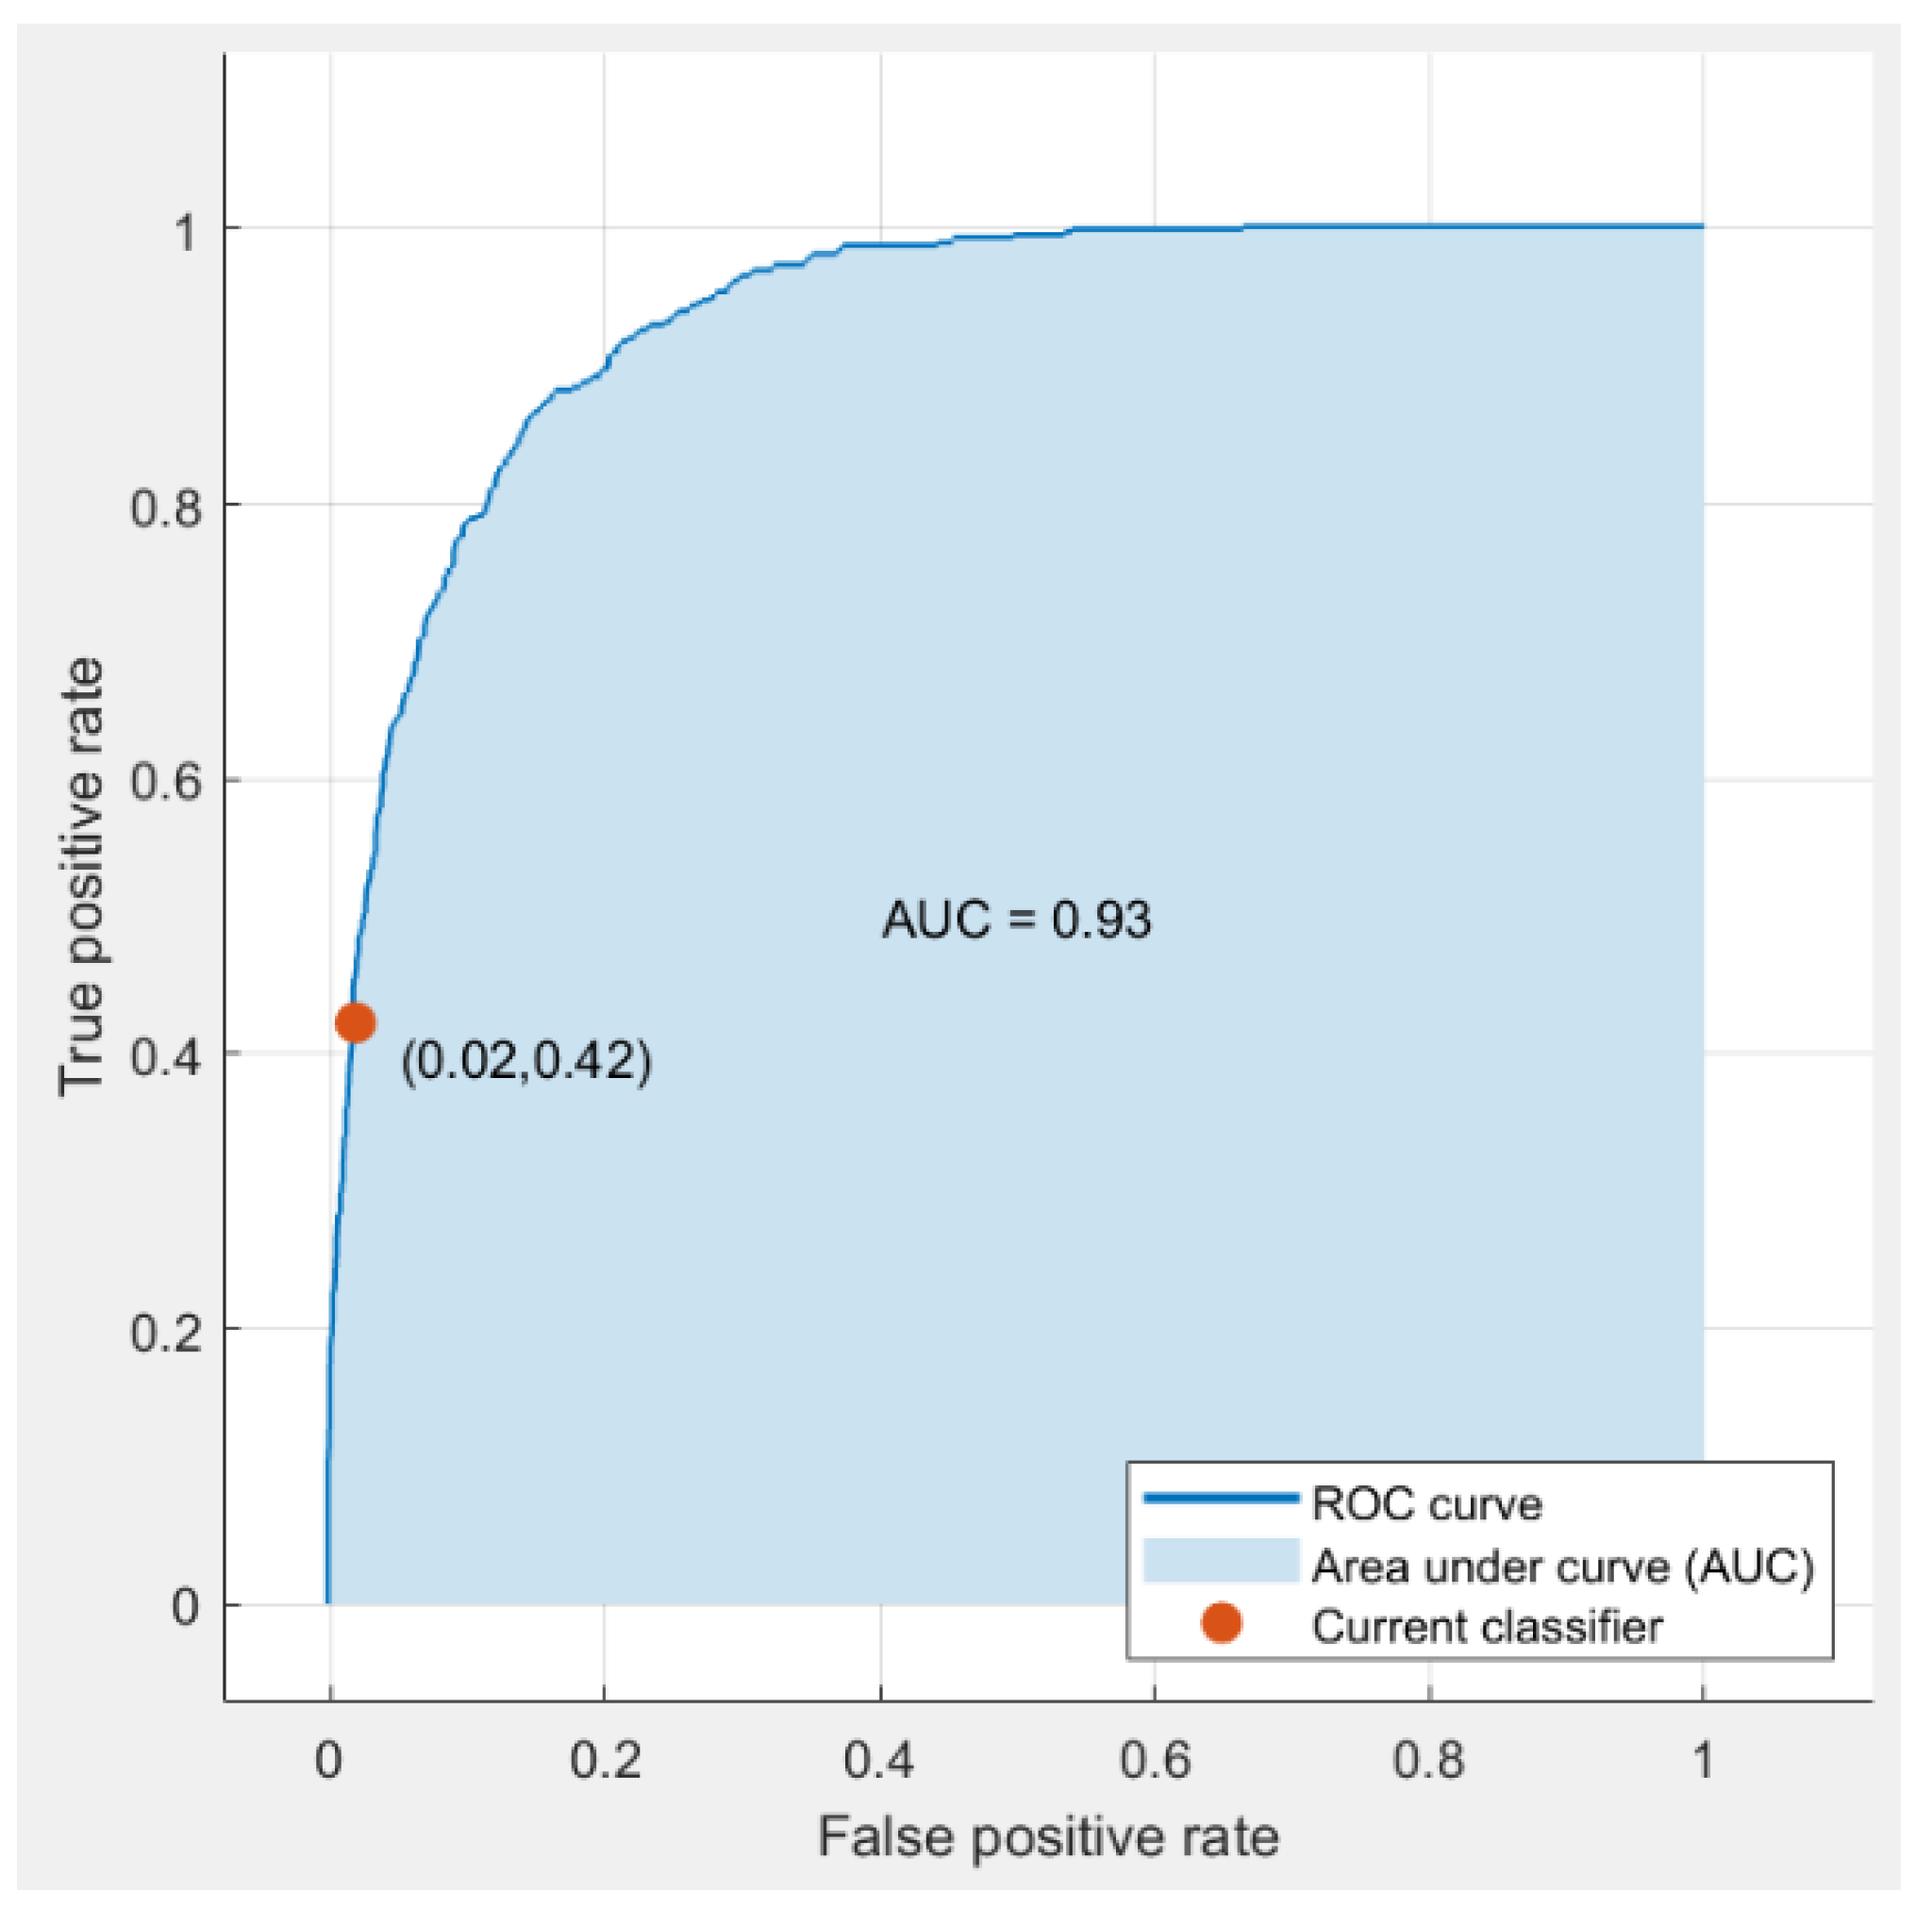
Figure 10.
The ROC analysis for Hybrid Learning Approach [Resnet50 with SVM].
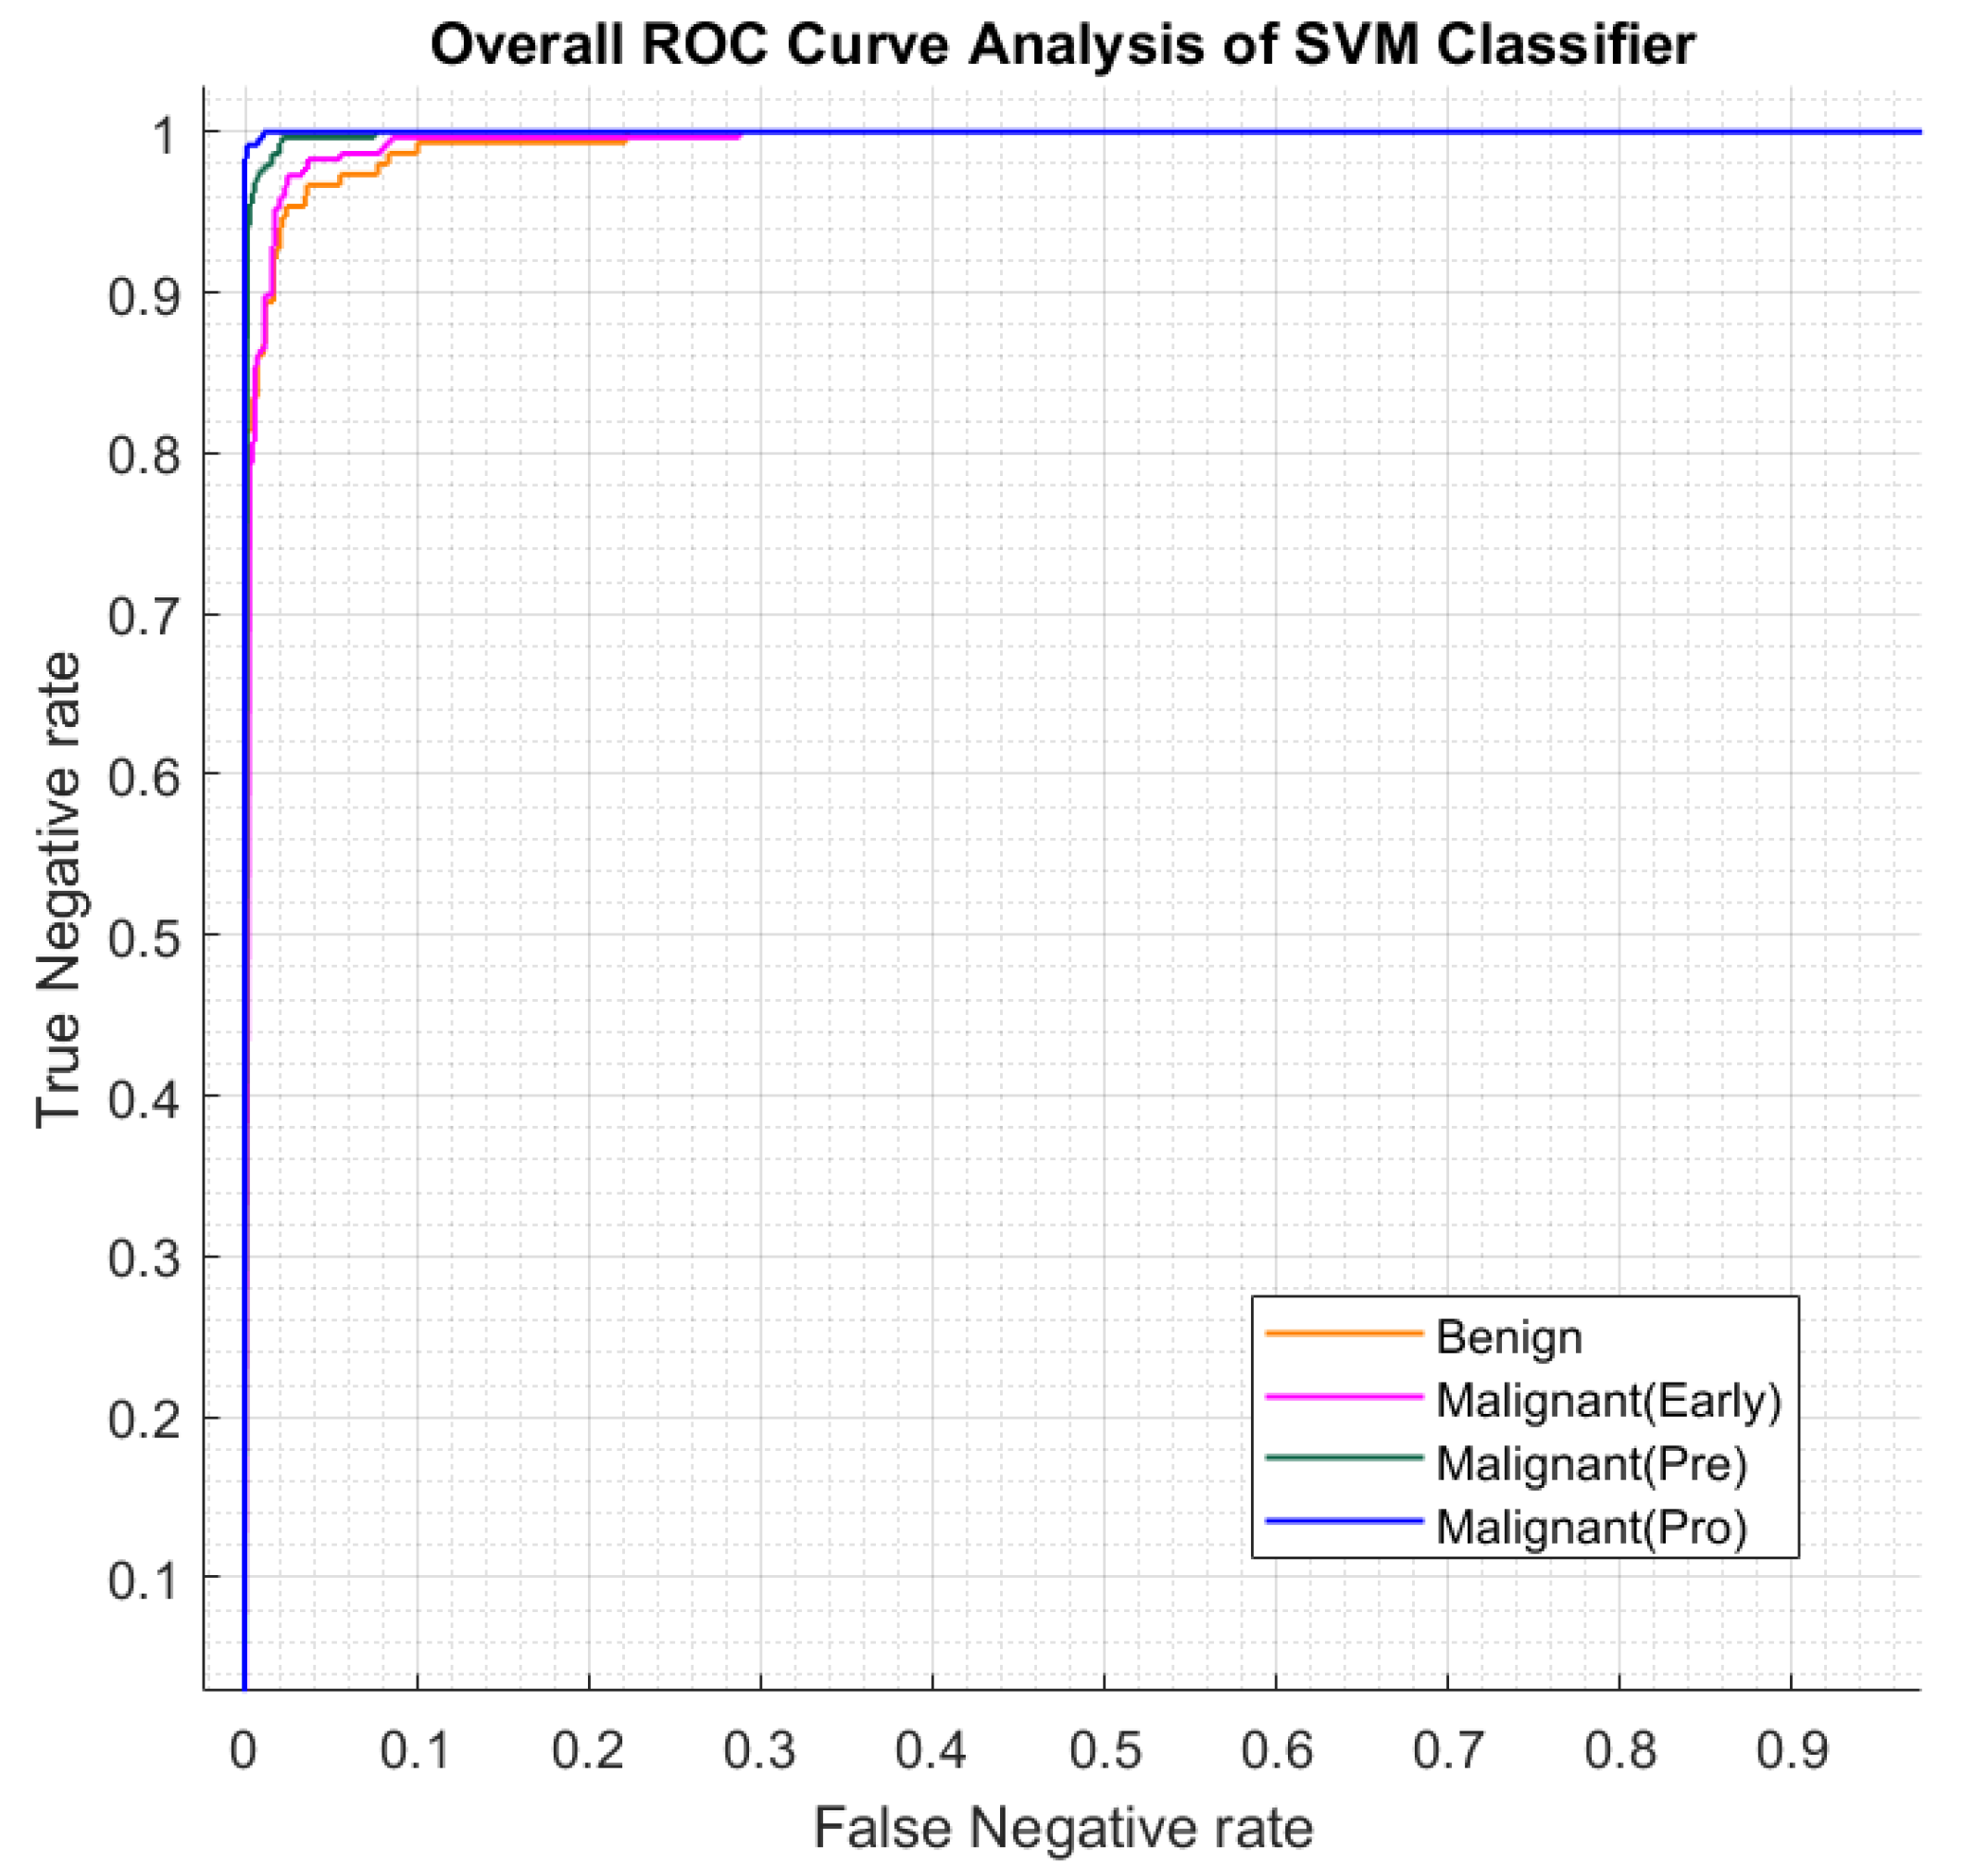

Table 1.
Experimental specifications of applied Single Learning Models.
| Model Name | Model Details for Classification |
|---|---|
| Support Vector Machine (SVM) | Kernel: Linear Kernel scale: Automatic Box Constrain Level: 1 Standardize data: True PCA Disabled Multi-Class Method: One vs One |
| K-Nearest Neighbor (KNN) | Preset: Weighted Number of Neighbors: 10 Distance Metric: Euclidean Distance Weighted: Squared Inverse Standardize data: TruePCA Disabled |
| Naïve Bayes (NB) | Preset: Gaussian Distribution name for numeric predictor: Gaussian Distribution name for categorical predictor: MVMN (Multi-Variate Normal Distribution) |
Table 2.
Performance Analysis of Single Learning Models.
| Model Name | Cross-Validation Value | Model Accuracy (%) | Model AUC (%) | Performance Metrices (%) | |||
|---|---|---|---|---|---|---|---|
| TPR | FNR | PPV | FDR | ||||
| SVM | 5 | 68.22 | 93.12 | 42.3 | 57.7 | 85.22 | 14.8 |
| KNN | 5 | 30.23 | 58.26 | 70.6 | 29.4 | 20.6 | 79.4 |
| NB | 5 | 60.11 | 86.20 | 89.3 | 10.7 | 52.3 | 47.7 |
Table 3.
Performance Analysis of Hybrid Learning Model.
| Method Used | Class Names | Performance Metrices Analysis (%) | Classifier Average Accuracy (%) | Classifier Overall Accuracy (%) | |||
|---|---|---|---|---|---|---|---|
| Accuracy | Precision | Recall | F1_Score | ||||
| ResNet50 with Support Vector Machine | Benign | 98.55 | 92.62 | 91.44 | 91.99 | 99.42 | 99.98 |
| Malignant Early | 99.35 | 95.00 | 95.91 | 95.44 | |||
| Malignant Pre | 99.88 | 98.63 | 98.62 | 98.62 | |||
| Malignant Pro | 99.91 | 99.61 | 99.24 | 99.39 | |||
Disclaimer/Publisher’s Note: The statements, opinions and data contained in all publications are solely those of the individual author(s) and contributor(s) and not of MDPI and/or the editor(s). MDPI and/or the editor(s) disclaim responsibility for any injury to people or property resulting from any ideas, methods, instructions or products referred to in the content. |
© 2024 by the authors. Licensee MDPI, Basel, Switzerland. This article is an open access article distributed under the terms and conditions of the Creative Commons Attribution (CC BY) license (http://creativecommons.org/licenses/by/4.0/).
Copyright: This open access article is published under a Creative Commons CC BY 4.0 license, which permit the free download, distribution, and reuse, provided that the author and preprint are cited in any reuse.


