
Submitted:
27 April 2024
Posted:
29 April 2024
You are already at the latest version
Abstract
Sri Lanka's vulnerability to climate change-induced natural disasters, particularly floods, under-scores the urgent need for an integrated approach to disaster risk management (DRM) that ad-dresses the interconnected challenges within the water-food-land-energy nexus. The Deduru Oya basin, located in the north-western region, exemplifies this vulnerability, with its predominantly intermediate climatic zone susceptible to flooding. While the focus has traditionally been on flood risk reduction, it is imperative to recognize the broader implications of floods on water, food, land, and energy systems. This study aims to strengthen data acquisition and management efforts to better understand rainfall trends and their impact on the water-food-land-energy nexus in the Deduru Oya basin. By compiling 60 years of rainfall data and conducting time series analysis, we observed a decreasing trend in monthly rainfall, particularly during the South-West Monsoon, Second Inter Monsoon, and North-East Monsoon seasons. These findings have significant implica-tions for water availability, agricultural productivity, land use patterns, and energy generation in the basin. Moreover, the malfunction of stakeholders' responsibilities for local-level flood risk management exacerbates the challenges faced by communities living in flood-prone areas. By in-tegrating insights from this study into flood risk management strategies, stakeholders can develop holistic approaches that not only mitigate flood risk but also enhance resilience across the water-food-land-energy nexus. This interdisciplinary approach will inform policymakers, flood manag-ers, practitioners, and the community in formulating effective strategies to address the multifacet-ed challenges posed by floods in the Deduru Oya basin and beyond.
Keywords:
Water-food-land-energy nexus
; Rainfall trends
; Water Governance
; Climate change
; Flood vulnerability
; Flood mitigation
1. Introduction
While flooding is a physical occurrence, effective governance and management can significantly mitigate its impacts [1]. Viewing flooding through a governance lens involves analyzing its causes, effects, and associated risks. Due to insufficient disaster preparedness, fragmented decision-making, and inadequate disaster responses in disaster management, the risks posed by natural disasters are often underestimated and mismanaged [2,3]. Dordi, et al. [4] suggest three key areas for advancing flood risk management (FRM) and flood risk governance (FRG) research: 1. Global Perspective: The authors advocate for broadening the geographical scope of research beyond Europe to include more analysis of FRM and FRG in developing countries. They emphasize the importance of fostering research collaborations across different global regions [4]. 2. Focus on Decision-Making: Building on the work of Morrison, et al. [5], the authors highlight the abundance of technical literature on FRM tools for assessing and managing flood risk. However, they stress the need for more research on frameworks and tools that can facilitate decision-making and the implementation of FRM strategies, particularly in comparison to the relatively limited attention given to FRG scholarship. They underscore the growing significance of social science analysis in understanding governance processes and solutions as flood risk continues to get evolved [4]. 3. Nuanced Examination and Bibliometric Analysis: Dordi, et al. propose a more detailed examination of the distinction between FRM and FRG scholarship, suggesting manual or computer-assisted coding to capture contextual nuances. They advocate for exploring how the principles of risk management align with flood management scholarship and urge further bibliometric analysis to identify key tensions and barriers to knowledge transfer between the academic literature and decision-makers [4].
The World Meteorological Organization (WMO) defines the concept of Integrated Flood Management as “land and water resources development in a river basin, within the context of Integrated Water Resources Management, with a view to maximizing the efficient use of floodplains and to minimizing loss of life and property” [[6], page 4]. Moreover, the identification of challenges faced by policymakers, practitioners, and scientists in flood risk management sector is important [7]. For constructing mitigation projects to control flooding, flood assessments are required based on topography, magnitude of rainfall, land cover, and geology [8]. One of the key criteria is the participation of all stakeholders including planners, and policymakers at all levels. This requires decentralizing decision-making with public consultation and the involvement of stakeholders from planning to implementation [6].
As the Asian Development Bank (ADB) [9] describes, the concept of Integrated Flood Risk Management (IFRM) focuses on four key aspects; 1. Strengthening data acquisition and data management, 2. Improving flood protection asset management, 3. Rehabilitating and constructing flood protection infrastructure; and 4. Raising community awareness and preparing for disaster [9,10]. Samuels, et al. [11], argue how IFRM as the extended concept for Flood Risk Management evolved. The “integration” has three components to be considered, namely space, time, and sectors and actors. The multiple sites or interfaces in the potential flood risk, the water discharge areas, pathways or floodplains should be integrated as the spaces in IFRM [12]. Time integration within IFRM involves updating, modernizing, or abandoning infrastructure, along with implementing maintenance plans for both direct and indirect flood management systems. In IFRM, coordination among stakeholders and subject areas, both directly and indirectly involved, is essential. This governance encompasses actors not only horizontally but also vertically, including public, private, and community sectors [13]. The Sendai Framework for Disaster Risk Reduction 2015-2030 has also mentioned the requirement for integrated disaster risk management approaches [14]. Figure 1 demonstrates the inter-linkage of each component in IFRM. Each component is interlinked with risk identification, risk analysis, risk evaluation, and risk management.
According to the annual report of the International Federation of Red Cross (IFRC) 2022, expenditures totaling 305.9 CHF were allocated for disaster management, including natural disasters such as floods [15]. In Nepal, the government has implemented an effective strategy for Flood Forecasting and Early Warning Systems (FFEWS), providing standardized operating procedures for current and future schemes. In Indonesia, a well-established Incident Command System (ICS) is in place, with hierarchical command structures ranging from site to national levels. The Flood Forecasting and Warning Centre of Bangladesh Water Development was established as a permanent entity in 1972 with international aid, receiving support from UNDP and WMO [16]. Malaysia which is highly vulnerable for flooding, has shown progress and collaboration at the government level regarding flood risk management [17]. In Egypt, the risks associated with dam construction should be carefully considered, with mandatory mitigation measures such as providing dams with spillways designed for a higher return period [18]. In the United Kingdom, Lumbroso and Ramsbottom identified future changes in flood risk management through the TE2100 project plan, addressing various factors such as climate change, socio-economic development, deteriorating flood defense assets, estuary morphology, and public awareness. Proposed adaptations include adjustments to intervention timing, flexibility in option selection through land use planning, and adaptation to new infrastructure [19].
Based on the IFRM approach, data acquisition includes identification, sampling, preparation, and collection [20]. Therefore, climate data should cover a considerable period in data collection and processing [21]. Data management refers to the technical data processing in data repositories and providing the servers for data interpretation as well as the interferences as the interface in the decision-making process [22]. WMO points out that data governance and IT governance are key components in climate data management that allow authorities to take immediate actions in a risky situation and facilitate better disaster preparedness [23]. The lack of flood-related data shared with relevant stakeholders in China faced a complicated situation in the decision-making process [24]. From existing and open-source data, literature and field data can be used to develop a proper database on natural disasters including floods [25]. However, at times, it is challenging to get correct data for the decision-making process within flood management because the water stream within a flood is changing, and difficult to identify its direction [26]. This holistic approach aligns with the principles of the Water-Food-Land-Energy Nexus, recognizing the interconnectedness of water resources, agricultural productivity, land use patterns, and energy generation [26A]. Blicharska et al. [26A] stress the importance of understanding how policies in different areas interact within the nexus framework and underline the need for thorough policy coherence analyses. Stakeholders prioritize climate objectives, revealing the complex dynamics of implementation shaped by stakeholder interests and societal debates. Based on Pahl-Wostl et al.‘s [26AB] argument, the nexus approach promotes an understanding of synergies and conflicts, enhances the capacity of stakeholders, and encourages cross-sectoral cooperation. It advocates aligning policy cycles and engaging stakeholders to ensure consistent policy implementation across sectors.
Sri Lanka is experiencing localized floods and landslides through exposition to hydro-meteorological disaster events [27,28]. Since the aftermath of the 2004 Tsunami, the country has endeavored to develop a disaster management plan. However, though the institutionalization and coordination among different actors have been progressively developed, the data acquisition and data management for IFRM in the country is still unsuccessful. On one side, the structural flood management measures in Sri Lanka show considerable pitfalls [29], and the lack of coordination and information management between stakeholders has been identified as a lacuna in disaster management in Sri Lanka [27,30,31,66]. Due to the absence of a common framework among all actors in flood risk management in different sectors, a sound system cannot be observed [32,33]. Even though meteorological data gathering and processing take place in organized manner in Sri Lanka, those data are not effectively used in flood risk management nor adequately used in analysis [31,34]. The objectives of this study revolve around enhancing data acquisition and management while analyzing rainfall variations in the Deduru Oya basin. Additionally, it aims to assess the engagement of stakeholders responsible for local-level flood management. Over a span of 60 years from 1960 to 2019, the study delves into rainfall patterns, while also investigating the involvement of flood managers, practitioners, policymakers, and the community residing in flood-prone areas within the Deduru Oya basin. The insights garnered from this research stand to greatly benefit these stakeholders, informing better flood risk management practices at the local level.
2. Materials and Methods
2.1. Study Area
The Deduru Oya is the fourth-longest river in Sri Lanka running about 115 km from the headwater in the Hedeniya area in the Kandy district to the sea at Chilaw in the Puttalam District [35]. Its basin is the fifth largest in the country [29], with a total land area of 2,616 km2 (Figure 2), which includes the basins of its tributaries, i.e., Maguru Oya, Kimbulwana Oya, Kuda Oya and Kolamunu Oya. The Deduru Oya basin has a rich history of containing irrigation tanks that provide many ecosystem services in addition to water for crop production with 3,274 medium and small-scale irrigation tanks representing the highest density of irrigation tanks in a river basin in Sri Lanka [36]. Runoff coefficients of the basin vary from 50% to 83% and the runoff ratio varies from 39.8% to 63.7% for Yala1 (dry) and 50.7% to 80.5% in Maha (wet) seasons respectively, as cited by Somaratne et al., 2003 [35]. Flash floods tend to overtop the embankments in the lower segments of Deduru Oya during the rainy seasons, while only a seep passes through during the drought seasons [38], demonstrating a very significant difference.
2.2. Data Collection
Rainfall data were compiled from the Department of Meteorology in 2020 [39] and the data book of Nakagawa, et al. [40]. It entailed monthly rainfall data for a 60 year period, from 1960 to 2019, obtained at six rain gauge stations. The following steps were performed to make the data available for the study: First of all, the list of rain gauge stations in the Deduru Oya basin with the details of data availability by stations for the study period was received from the Department of Meteorology. Through a comprehensive review of the data availability at the stations for the study period and also considering the representation of the entire basin, the best suitable six rain gauge stations were selected to collect data from. The selected rain gauge stations were Chilaw, Polonthalawa, Mediyawa, Wariyapola, Millawana and Kurunegala (Figure 3). The missing data for some of the stations were filled using the Normal Ratio Method (NRM). The NRM has been widely used to fill in missing rainfall data [41,42]. In NRM, the missing values are calculated based on the available rainfall data of nearby rain gauge stations (at least three stations). Accordingly, missing rainfall data were calculated based on three nearby stations using equation 1.
where Px is the missing precipitation value and Nx is the annual average rainfall at station x; P1, P2, P3 and N1, N2, N3 are corresponding rainfall values at stations 1, 2, 3, and annual average rainfall values at stations 1, 2, 3, respectively, while n denotes the number of stations for which rainfall data are available.
There are several methods to calculate the mean areal rainfall. A few popular examples are the arithmetic mean method, Thiessen polygon method and the isohyetal method. The Thiessen polygon method has been widely used in hydrological analysis to find the average areal rainfall [43,44]. In a study, Supriya, et al. [45] used the Thiessen polygon method to calculate the average rainfall in the Vellar River basin in India. The Thiessen polygon method is more favorable for flat areas like the Deduru Oya basin and it has been preferred in this study to calculate the average rainfall in the Deduru Oya basin. Accordingly, Thissen polygons were created for the Deduru Oya basin based on rain gauge stations using ArcGIS software. The created Thiessen polygon map with the rain gauge stations is depicted in Figure 3. Following Chowdhury, et al. [44], the below-mentioned equation was used to calculate the average precipitation of the Deduru Oya basin using the Thiessen polygon method.
where, P is the mean precipitation of the basin; A1, A2, A3 and An stand for the corresponding polygon areas of stations 1,2,3, …,n; P1, P2, P3 and Pn stand for the corresponding precipitation values of stations 1,2,3, …,n.
Six rain gauge stations were strategically chosen based on two primary criteria: their geographic distribution across the basin and the availability of consistent rainfall data spanning the study period. While additional rain gauge stations exist within the basin, many lacked continuous data for the duration of the study. To understand the engagement of local-level stakeholders and community members in flood management, primary data was gathered through semi-structured interviews conducted with both community members and stakeholders.
2.3. Data Analysis
Time-series data analysis method was used in rainfall data analysis using the SPSS software and RStudio software. Alahacoon and Edirisinghe; Amarasinghe; Karunathilaka, et al. [46,47,48] have used and as Asfaw, et al. [49] have mentioned the Mann-Kendall (MK) test has been widely used in detecting the trends in the meteorological variables. The authors have used the MK-test with Sen’s slope estimator. Sridhar & Raviraj [50] have also used the Mann-Kendal and Sen’s slope estimator in rainfall trend analysis in the Amarawathi river basin in India. In a study of annual and seasonal rainfall patterns in the Kandy district, Meegahakotuwa & Rekha Nianthi [51] used a linear regression model and Mann-Kendal test to find the trend over time. Wickramagamage [52] has used the linear regression method on rainfall trends over 30 year period (1981-2010) of Sri Lanka. The author has used the rainfall amounts of 48 stations to estimate the rainfall trend in Sri Lanka.
In this study, the Mann-Kendall and Sen’s slope estimator methods were utilized to discern the monthly, annual, decadal, and seasonal trends of rainfall within the Deduru Oya basin. Initially, the time-series data underwent decomposition into trend, seasonal, and irregular components, which were closely examined to identify any discernible trends, seasons, or cycles. Prior to trend analysis, seasonal effects were mitigated by removing them from the time series, resulting in a seasonality-adjusted time series. In the trend analysis, autocorrelation was accounted for using the Hamed and Rao method. The Autocorrelation Function (ACF) and Partial Autocorrelation Function (PACF) were employed to assess the significance of Lag-1 autocorrelations. Additionally, the Augmented Dickey-Fuller (ADF) test was conducted to determine the stationarity of the time series data. Subsequently, the MK test and Sen’s slope estimator, accompanied by Pettitt’s homogeneity test, were applied to the time-series data. The responses of the individuals were subjected to descriptive analysis. The primary limitations of the study include the absence of continuous rainfall data across most of the rain gauge stations in the basin and the presence of missing rainfall data in some of the selected stations.
3. Results of the Study
3.1. Trend of Monthly Rainfall
The monthly rainfall trend was computed separately for the six rain gauge stations and for the entire basin. Rainfall data over the 60 year-period, from 1960 to 2019, were used for this analysis. The Mann-Kendall (MK) test (tau and p-value) and the Sen’s Slope estimate (SS) were performed to find the trend. Table 1 shows the MK and SS estimates for the six rain gauge stations and the entire Deduru Oya basin.
Table 1 illustrates that, overall, all stations, except Mediyawa, exhibit decreasing trends (indicated by negative MK-tau values), whereas Mediyawa shows a slight increasing trend (positive MK-tau). The MK-P-values for Kurunegala, Chilaw, and Wariyapola fall below the 0.05 confidence interval, signifying significance. Conversely, the P-values for Millawana, Polonthalawa, and Mediyawa surpass the 0.05 confidence level, indicating insignificance. Sen’s Slope estimates reveal decreasing trends of rainfall by 0.062 mm/year in Wariyapola, 0.037 mm/year in Chilaw, 0.029 mm/year in Kurunegala, 0.013 mm/year in Polonthalawa, and 0.011 mm/year in Millawana. Mediyawa exhibits the sole positive slope of 0.013 mm/year. Considering the entire Deduru Oya basin, a decreasing trend of 0.03 mm/year is observed according to Sen’s Slope estimate.
Figure 4 displays the average rainfall trend at the Millawana station, starting at 139 mm in 1960, decreasing to 129 mm by 1983, then increasing to 131 mm by 2001, and subsequently decreasing again to 124 mm by 2019. This represents an overall decline from 139 mm to 124 mm over the study period. The MK p-value of 0.45 exceeds the critical value of 0.05, indicating that Millawana’s rainfall does not exhibit a significant trend. The MK test’s tau value, reported as -0.0179, confirms a minor overall decreasing trend throughout the study period.
The average rainfall trend in Polontalawa station was initially 117 mm in 1960 and it decreased to 89 mm by 1981. It further decreased to 87 mm by 1992 and then increased to 91 mm by 2002. Finally, it has further decreased to 88 mm in 2019. The overall decrease in rainfall was from 117 mm to 88 mm over the period. MK p-value was recorded as 0.290 which is greater than the critical value of 0.05 confirming that Polontalawa rainfall within the study period does not show a significant trend. As per the tau value of the MK test, it was reported as -0.025 confirming the overall decreasing trend within the study period.
The average rainfall trend in Kurunegala station was initially 164 mm in 1960 and it decreased to 155 mm by 1974. It further decreased to 147 mm by 1995 and again to 143 mm by 2000, finally going down to 130 mm in 2019. The overall drop in rainfall was from 164 mm to 130 mm over the period. This was confirmed by the statistical analysis of MK test P-value reporting as 0.012 which is less than the critical value of 0.05 confirming a significant trend present in Kurunegala station within the study period. As per the tau value of the MK test, it was reported as -0.06 confirming the overall decreasing trend within the study period.
The average rainfall trend in Chilaw station was initially 117 mm in 1960, going down to 89 mm by 1980. It further decreased to 85 mm by 1993 and ended up at 59 mm in 2019. The overall drop in rainfall was from 117 mm to 59 mm over the period. This was confirmed by the statistical analysis of the Mann-Kendall test. The P-value of the MK test was reported as 0.00 which is less than the critical value of 0.05 confirming a significant trend in Chilaw rainfall within the study period. As per the tau value of the MK test, it was reported as -0.093 confirming the overall decreasing trend within the study period.
The average rainfall trend in Wariyapola station was initially 153 mm in 1960 going down to 109 mm by 1990. It further decreased and finally ended up with 101mm in 2019. The overall drop of the rainfall from 153 mm to 101mm within 60 years. This was confirmed by the statistical analysis of the Mann Kendall test; the P-value of the MK test was reported as 0.00 which is less than the critical value of 0.05 confirming a significant trend present in Wariyapola rainfall within the study period. As per the tau value of the MK test, it was reported as -0.098 confirming the overall decreasing trend within the study period.
The average rainfall trend in Mediyawa station was initially 103 mm in 1960 and it decreased to 83 mm by 1982. It then increased to 93 mm by 2000 and further increased to 104 mm by 2019, resulting in an overall, statistically insignificant increase in the rainfall from 103 mm to 104 mm within the 60-year study period. MK p-value was reported as 0.912 which is greater than the critical value of 0.05 confirming that Mediyawa rainfall within the study period has not revealed any significant trend. As per the tau value of the MK test, it was reported as 0.002, confirming the overall small increasing trend within the period.
The Thiessen Polygon method was employed to calculate the average rainfall across the entirety of the Deduru Oya basin. The rainfall trend in the basin showcased a noticeable shift over the years. Beginning at 140 mm in 1960, it gradually decreased to 120 mm by 1985. Subsequently, it further dwindled, reaching 108 mm in 2019, marking a cumulative drop of 32 mm over the span of 60 years. Statistical analysis, specifically the Mann-Kendall (MK) test, verified this decline with a p-value of 0.01, indicating a significant downward trend within the study period compared to the critical value of 0.05. The tau value of the MK test, recorded as -0.064, further supported the overall decreasing trend. Sen’s Slope estimate revealed a reduction of 0.03 mm in rainfall annually across the Deduru Oya basin. Notably, the rainfall pattern underwent a significant transformation around the 1980s, as evident from both Figure 4 and Figure 5, not just in the basin as a whole but also across the six individual stations.
Finally, the monthly rainfall variation of the six stations was analyzed separately and for the entire Deduru Oya basin and the results are as follows.
In Chilaw, two prominent rainfall seasons were observed. The highest rainfall season was from September to December where the peak is in October and November. The second highest rainfall season was from March to June where the peak is in April and May. The month of August records the lowest rainfall. In Polonthalawa, two prominent rainfall seasons were observed. The highest season is from September to December where the peak is in October and November. The second season is from March to June where the peak is in April. In Wariyapola, two prominent seasons were identified. The highest season is from September to December and the peak is in November. The other season is from March to May which peaks in April. The Mediyawa station has shown two prominent seasons. The highest is from September to December which peaked in October. The other season is from March to May which peaks in April. Kurunegala station has shown two prominent rainfall seasons. The highest is from September to December where the peak is in October. The second is from March to July where the peak is in April. In Millawana, three prominent seasons were identified. The highest season is from September to December where the peak is in November. The second season is from March to May where the peak is in April. The third season is from January to February where the peak is in January.
The monthly rainfall variation of the entire Deduru Oya basin has been depicted in Figure 6. Each month has different variations during the study period. The dark blue line of the graph represents the monthly median rainfall over the study period. The dark blue colour area beside the median line represents the area where the variation is from 25% to 75%. The light blue colour area represents the variation between 10% - 90%. The ash colour areas represent the maximum and minimum boundaries of monthly rainfall variation. The black dashed horizontal line represents the basin median rainfall (110 mm) for the study period. As shown in the graph, two peaks of rainfall can be identified, and the highest peak of the monthly rainfall is observed during October and November, and the next peak can be observed in April and May. The lowest rainfall amounts have been shown in August, July and February, respectively.
3.2. Trend of Annual Rainfall
The annual average rainfall in the Deduru Oya basin was found to be 1680 mm from 1960 to 2019. The maximum rainfall has been recorded as 2161 mm (1984) and the minimum rainfall has been recorded as 1157 mm (1983) within the period. According to the Mann-Kendall test, an overall decreasing trend in annual rainfall in the Deduru Oya basin can be observed. The MK-tao value is -0.169 and the MK p-value is 0.05, which is less than the critical value, confirming a significant decreasing trend of annual rainfall within the study period. As depicted in Figure 7, the annual rainfall has been recorded as 1875 mm in 1960, decreasing to 1654 mm in 1980. The annual rainfall further decreased to 1613 mm in 1988 and then slightly increased to 1644 in 2000, ending up with 1620 in 2019, confirming an overall drop of 255 mm rainfall within the study period.
3.3. Trend of Decadal Rainfall
The decadal rainfall in the Deduru Oya basin for the study period was analyzed to identify its behavior in the six decades from 1960 to 2019.
According to the MK test, the decadal rainfall variation in the basin is presented in Figure 8. The overall variation is computed as -0.169 according to the MK tau test and the p-value of the MK test is computed as 0.05. The p-value confirms a significant decreasing trend of decadal rainfall. As a confirmatory test, Sen’s Slope test was performed and it also indicates a negative value of -3.832, which is evidence of a decrease in decadal rainfall for the study period. Considering the decadal MK tau estimates separately, it has been reported as -0.244 in the 1960s, -0.333 in the 1970s, 0.066 in the 1980s, -0.022 in the 1990s, 0.289 in the 2000s and -0.200 in the 2010s. Accordingly, in the decades of 1980s and 2000s, positive trends can be observed while in the other four decades, negative trends were reported.
The Decadal Mean rainfall and the Coefficient of Variance (CV) are shown in Figure 9. Overall, the decadal mean rainfall curve displays a fluctuation over the decades. A rapid decrease in rainfall is evident from the 1960s to the 1970s and then to the 1980s. From the 1980s to 1990s an increase in rainfall can be observed, but again from the 1990s to 2000s, a decline has occurred. Then, from the 2000s to 2010s an uplift can be observed. However, the highest decadal mean rainfall has been observed in the 1960s (1812.89 mm), while the lowest decadal mean rainfall has been reported in the 1980s (1565.79 mm). In contrast, these results of the trend of decadal rainfall have confirmed the results of the MK test in the above section.
Considering the CV of decadal rainfall, the minimum CV, 9% has been shown in the 1960s and then in the 1990s (10%) (Figure 9). These two decades have shown the least volatility in decadal rainfall. The maximum CV 20% has been shown in the 1980s and then in 2010s as the 18%. These two decades have shown the most volatility in decadal rainfall.
As mentioned in this section, although there is an overall decreasing trend of the decadal rainfall during the study period, there are differences in rainfall intensities that are shown by the decadal mean and CV of the decadal rainfalls.
3.4. Trend of Seasonal Rainfall
According to the Department of Meteorology of Sri Lanka, there are four climatic seasons in Sri Lanka [53,54]. These seasons are as follows:
- First Inter Monsoon (FIM) - March, April
- South West Monsoon (SWM) - May, June, July, August, September
- Second Inter Monsoon (SIM) - October, November
- North-East Monsoon (NEM) - December, January, February
The rainfall pattern in the Deduru Oya basin depends on these four climatic seasons. Cumulative rainfall of the climatic seasons in Deduru Oya basin was analyzed for the study period and the results are illustrated in Figure 10. As per the box plot, the highest rainfall can be observed during the SIM season, which is 576 mm, followed by the seasons of SWM (475 mm), FIM (314 mm), and lastly the NEM (304 mm).
Considering the trend of seasonal rainfall, several observations were made. Cumulative rainfall during the FIM season has shown an increasing trend within the study period from 1960 to 2019 (Figure 11). Initial cumulative rainfall during the FIM season was 312 mm in 1960. It decreased to 285 mm in 1987, then increased to 320 mm in 2002 and ended up as 325 mm in 2019. As per the Mann Kendal test, the p-value was reported as 0.70, which is greater than the critical value of 0.05, confirming rainfall trend during the FIM season over the study period was not significant. As per MK statistics, the tau value was 0.033 and Sen’s slope statistics is 0.316 confirming the increasing trend of the cumulative rainfall during the FIM season.
Cumulative rainfall during the SWM season over the study period has shown an overall decreasing trend (Figure 12). The initial cumulative rainfall in the Deduru Oya basin during the SWM season was 540 mm in 1960. It decreased to 497 mm in 1978, followed by a decline in 1983 which is 494 mm. It further declined to 434 mm in 1999 and increased to 458 mm in 2019. As per the MK test, the p-value was reported as 0.05, which is equal to the critical value of 0.05, confirming rainfall’s decreasing trend during the SWM seasons over the study period was significant. As per MK statistics, the tau value was -0.168 and Sen’s slope statistics is -1.85 confirming a significant decreasing trend of the cumulative rainfall during SWM season.
Cumulative seasonal rainfall during the SIM season over the study period has shown an overall decreasing trend (Figure 13). The initial cumulative rainfall in the Deduru Oya basin during the SIM season was 625 mm in 1960. It has decreased to 596 mm in 1979 and was followed by an increase in 1984 which was 598 mm. Then it dropped to 589 mm in 1987. Cumulative rainfall was 581 mm in 1993 and decreased to 579 mm in 1999. Cumulative rainfall ended up at 521 mm in 2019. As per the MK test, the p-value was reported as 0.25, which is greater than the critical value of 0.05, confirming that the rainfall trend during the SIM seasons over the study period was not significant. As per MK statistics, the tau value was -0.101 and Sen’s slope statistics is -1.43, confirming a decreasing trend during SIM season.
Cumulative seasonal rainfall of the NEM season over the study period (Figure 14) has shown an overall decreasing trend. The initial cumulative rainfall of the season of Deduru Oya basin during the NEM season was 403 mm in 1960. It decreased to 238 mm in 1986 and then started an increasing trend. In 2001, cumulative rainfall was 289 mm and ended up at 309 mm in 2019. As per the MK test, the p-value was reported as 0.37, which is greater than the critical value of 0.05, confirming that the rainfall trend during the NEM seasons over the study period was not significant. As per MK statistics, the tau value was -0.079 and Sen’s slope statistics is -1.04 confirming the decreasing trend of the cumulative rainfall during the NEM season.
In summary, SWM, SIM, and NEM seasons have shown a decreasing trend of rainfall, in which SWM has shown a significant decreasing trend (MK p = 0.05) while SIM and NEM seasons have shown an insignificant decreasing trend. However, FIM has shown an increasing trend, but it is not significant (MK p = 0.70).
4. Discussion
4.1. Data Acquisition and Management
Data acquisition and management are crucial in disaster management [9,10]. However, the JICA2 [31] has mentioned that there is no proper database management system in the disaster risk management sector in Sri Lanka that includes the necessary data on disaster losses. Disaster Information Management System in Sri Lanka [48] which is the main disaster database maintained by the Disaster Management Centre contains very limited data, especially on disaster losses. The Disaster Information Management System in Sri Lanka includes mainly the number of disaster-affected people and damaged houses by Divisional Secretary Divisions, but there is no data regarding the total disaster losses including damages to crops, property, infrastructure, and industries, in monetary values. Therefore, the data from the Disaster Information Management System in Sri Lanka is difficult to use in advanced disaster studies. However, meteorological data including the rainfall data are maintained by the Department of Meteorology in Sri Lanka [39], and the analysis of rainfall data to identify the rainfall trend for a particular period is necessary in flood risk management. Accordingly, through a detailed analysis of rainfall data in the Deduru Oya basin, the rainfall variation was studied.
4.2. Rainfall Variation and Flood Risk
According to the analysis of monthly, annual, decadal, and seasonal rainfall variations in the Deduru Oya basin, a decreasing trend is observed. However, the peaks in rainfall in a year within the study area have been reported in the months of April, May, October, November and December. Although the rainfall pattern shows a decreasing trend, flood risk increases with the effects of exposure, vulnerability, and climate change. Therefore, flood risk management strategies should be strengthened in the area. In flood risk management, flood risk assessments should be done periodically following standard methods, but there is no evidence to find flood risk assessments conducted in the Deduru Oya basin. Although proper flood mitigation measures and preparedness measures should be identified and implemented by the authorities with the participation of stakeholders and the community to manage flood risk in the area, the current study has revealed that affected communities are not satisfied with the involvement of authorities in flood risk management activities in the area. Only a very few members of the community showed their satisfaction while most of the people were not satisfied with the involvement of government sector agencies in flood risk management. Further, based on the findings of a study, the JICA has also suggested drawing attention to DRR efforts aiming to reduce economic losses, discretionary investment considering overall balance, strengthening local DRR governance, basin-based DRR strategy, and monitoring mechanism to mitigate flood risk effectively. Though integrated flood risk management has been identified as a good tool to minimize flood risk, there is no such developed system in the study area.
4.3. Nexus and Integrated Flood Risk Management in the Deduru Oya basin
Flooding can be identified as the major natural disaster in the Deduru Oya basin, although there are some other disasters like droughts, high winds, animal attacks, etc. [55,56,57,58,59]. The data on 23 flood incidents in the study area (in selected 15 GNDs3 from Chilaw, Arachchikattuwa, Pallama, and Bingiriya DSDs4) were found from secondary data sources; the Disaster Information Management System of Sri Lanka [55], data records from the District Disaster Management Coordinating Units (DDMCU5), [60,61] and Divisional Secretariats [62,63,64,65]. Wanninayake et al. [66] have identified hazard, exposure, vulnerability and capacity as the main components of flood risk in the Deduru Oya basin. The authors have mentioned that if hazard, exposure, or vulnerability increases, flood risk will increase and if capacity increases the flood risk will be decreased. According to the flood risk assessment in the study area, the selected Grama Niladari Divisions (15) have been ranked based on the level of flood risk [59]. Accordingly, Wirakumandaluwa and Thimbilla GNDs come under the very high-risk category where the hazard and vulnerability factors have shown relatively a high contribution to the risk. In the same way, Deduruoya and Bangadeniya GNDs have come under the high-risk category, while Elivitiya, Manuwangama West, Mukkandaluwa, Parappanmulla, Wirapandiyana, and Mahawilattawa GNDs represent moderately risk category. Then, Pallama, Gatulawa, Dematapitaya, and Molaeliya GNDs come under the low-risk category and Nariyagama North GND indicated a very low-risk GND category in the study area (Figure 15). Another point is here the conflict and contest between users upstream and downstream of the Daduru Oya. The diverse demands, fluctuating water supply, and complex political and socioeconomic processes surrounding water resources management could sever the social cohesion between the water users per the politics of scale in river water management [66A]
In the Deduru Oya Basin of Sri Lanka, the Water-food-land-energy nexus poses a complex challenge intertwined with Integrated Flood Risk Management (IFRM). Balancing water resources for agriculture while managing flood risks requires a delicate equilibrium. The basin’s agricultural reliance demands water for irrigation, often leading to land-use practices that increase flood vulnerability [66b]. Effective IFRM must navigate this nexus by integrating strategies that promote sustainable agriculture, land-use planning, and flood mitigation. Collaboration among stakeholders is essential to develop holistic approaches that enhance resilience and ensure the long-term viability of water, food, and land resources in the Deduru Oya Basin.
The IPCC [67] has defined exposure as the presence of people, livelihoods, environmental services and resources, infrastructure, or economic, social, and cultural assets in places that could be adversely affected by any hazard. Considering the exposure as a main component of flood risk in the study area, the authors have studied the population growth in the study area as a variable in flood exposure. The population growth in the selected GNDs is presented in Table 2.
According to Table 2, the population of all the GNDs has increased with varying extents of growth rates that confirm flood risk in the study area is increasing.
Disaster risk management (mitigation and preparedness) is globally considered to be more important than post-disaster management (relief and response) [14,74]. JICA has conducted several comprehensive studies on the disaster management system in Sri Lanka [31,75,76], and has indicated [31] that the flood hazard is expected to increase in Sri Lanka in the future due to climate change. The exposure to flooding areas will also increase with time. Moreover, JICA has highlighted some existing issues in disaster risk reduction sectors in Sri Lanka which include the following. There is no unified database on disaster records, disaster damages, and losses maintained by the authorities. Because the early warning mechanism and evacuation mechanism are not clear, most of the people in vulnerable areas can’t receive warning messages from technical agencies before the flood begins. Although several projects have been identified by the Sri Lanka Comprehensive Disaster Management Programme (SLCDMP) [77], most of them have no funds to be implemented. In those that find implementation, proper monitoring and evaluation mechanisms do not exist. Even though it presents the highest national body in decision-making in disaster management, the National Council for Disaster Management has not properly functioned. There is a lack of a local administration line in the disaster risk reduction (DRR) strategy, instead, local DRR planning and disaster response depend on the national, district, and division administration line. Community awareness activities seem to be performed in an ad-hoc manner. There is no mid-to-long-term implementation plan and evaluation procedures for disasters. The absence of a proper database system, manuals and plans, and weaknesses in prompt disaster relief and subsequent resettlement have led to difficulties in responding to disasters. There is an urgent requirement to conduct a comprehensive assessment of flood and drought risks using the latest natural and social data. The roles and responsibilities of stakeholder agencies in flood management are not clearly described in the existing flood ordinance [78]. Furthermore, the prevailing land development law is not conducive to stopping the unregulated development of wetlands where flood risk is high. River basin level plans are required to promote further investment. Existing land use plans are not considered in flood protection planning and also the land use plans should be updated considering flood risk areas. A better flood warning system should be established at the basin level following an enhanced hydrological monitoring system. Based on such a warning system, local-level evacuation plans should be developed. In addition to the above-mentioned gaps, JICA has made several recommendations to implement the Sendai Framework of Actions in Sri Lanka. Some of those recommendations are: The existing Disaster Information Management System in Sri Lanka (Disaster Database) should be re-established and the disaster assessment mechanism should be developed to collect disaggregated data. Review and re-develop the National Disaster Management Plan [79] and the Sri Lanka Comprehensive Disaster Management Plan II in line with the Sendai Framework of Actions. The draft National Action Plan should be revisited and make amendments in line with global targets. Legislative arrangements should be made for the Community Resilience Framework [80] to be mandatory for all development initiatives.
4.4. Community Participation in Disaster Management and River Basin Management
Active community participation in river basin water management is crucial for ensuring the equitable and sustainable use of resources, yet it often faces challenges stemming from pre-existing power dynamics and social divisions within communities. By understanding and addressing these complexities, development interventions can promote genuine community ownership and inclusive decision-making processes, leading to more effective and resilient disaster and water management initiatives [80A]. According to the responses of community members interviewed in the study area, several issues in flood risk management were found. These issues are summarized below. There are shortcomings in the existing mechanism to disseminate flood-early warnings to the last mile. Training and awareness (T&A) programs to enhance the knowledge of both the community, as well as the stakeholders on flood risk management, are at a marginal level due to a lack of allocation of funds by authorities. NGOs operating in the study area are not capable of funding T&A programs.
Similarly, village-level disaster management committees are not properly operating in the study area, while the village-level disaster management plans and flood hazard maps have also not been prepared in almost all the GNDs up to date. This indicates a wide gap in the flood management mechanism in the local context. The community and the stakeholders have proposed even some alternatives to activate the village-level disaster management committees (VDMCs) in the area. Further, the community has not rejected these preparedness measures and they have agreed to operate these methods in the area for the benefit of the people. However, the divisional level disaster management committee is operating and the divisional level disaster preparedness plan has also been prepared, though there are several issues. The stakeholders have listed several needs of these flood preparedness measures at the local level. These included the fact that, although land-use planning and building codes are very important in flood risk management, they are not implemented in the area. Most of the lands in the inundation area have been encroached on and used for residential development and crop cultivation, both of which are vulnerable to floods. They have also pointed out the unavailability of flood risk insurance, local emergency funds, mitigation loans, and reconstruction loans in the area, though these have been identified as tools in disaster risk reduction [81]. The model used to assess the earthquake disaster risk by Bollin et al. [81], has been used by Wanninayake et al. [66] with some modifications to assess the flood risk in the Deduru Oya basin in Sri Lanka. According to the flood risk asessment in the Deduru Oya basin, Wanninayake et al. [66] have found that there is a big gap in applying flood risk management measures in the area. In the current study, the authors have tested the satisfaction of the people with the involvement of responsible government agencies in flood risk management activities at community-level (Figure 16).
As per Figure 16, over 17% of the respondents have mentioned that they are strongly dissatisfied with the involvement of the government agencies in local-level flood risk management activities and 52% of the respondents are not satisfied. About 21% of the respondents have mentioned that they don’t have an opinion on this matter. Only 10% of the respondents have indicated that they are satisfied with the government sector institutions’ involvement in local level flood management activities. Altogether, 69% of the respondents are not satisfied with the stakeholders’ contributions to local-level flood risk management. This result confirms that the performance of stakeholders engaged in local-level flood management is minimal. Accordingly, the results highlight the need for an integrated flood risk management mechanism to maintain the local level of flood resilience. Additionally, the authors have found that the people at the local level are interested in implementing integrated flood risk reduction mechanisms in the area.
5. Conclusion and Recommendations
The analysis of rainfall data from the Deduru Oya basin paints a concerning picture, revealing a consistent decreasing trend in monthly rainfall as indicated by both the MK-test and SS-test (MK tao = -0.06, MK p-value = 0.01). Over the period from 1960 to 2019, there has been an average decrease of 0.03 mm/year in rainfall, highlighting a notable shift in precipitation patterns over the decades. Monthly rainfall variations illustrate two distinct peaks, with the highest levels recorded during October and November, followed by another peak in April and May. Conversely, the lowest rainfall amounts are consistently observed in August, July, and February. These seasonal fluctuations underscore the complexity of the basin’s climate dynamics. Despite an annual average rainfall of 1680 mm and a monthly median rainfall of 110 mm, the decadal analysis reveals an overall declining trend, with significant variability noted in the 1980s decade, where the coefficient of variation (CV) stands at 20%. Although the variability decreases in subsequent decades (with CVs of 18% in the 2010s and 15% in the 2000s), the downward trend persists.
Further scrutiny of seasonal rainfall patterns confirms an overall declining trend, with statistically significant decreases observed in the Southwest Monsoon (SWM), Second Inter Monsoon (SIM), and North East Monsoon (NEM) seasons. Notably, only the SWM trend exhibits statistical significance, indicating the need for targeted interventions to address the impacts of diminishing rainfall during this critical period. In contrast, the First Inter Monsoon (FIM) season shows a slightly increasing trend, although it lacks statistical significance. Nonetheless, this finding underscores the importance of considering variations across different seasons when assessing flood risk and implementing mitigation strategies. Moreover, the analysis highlights significant shortcomings in data acquisition and management within Sri Lanka’s disaster management sector. Despite the identification of flood as a major disaster threat in the Deduru Oya basin, the absence of a proper integrated flood risk management (IFRM) mechanism poses significant challenges.
The analysis of rainfall data from the Deduru Oya basin reveals not only a concerning trend of decreasing precipitation but also highlights the intricate relationship between water, food, land, and energy systems within the region. By establishing a robust IFRM system in the Deduru Oya basin, valuable lessons can be learned and replicated across other river basins in Sri Lanka. Ultimately, this integrated approach enhances resilience and reduces the impacts of climate change-induced hazards on water, food, land, and energy systems, ensuring sustainable development and prosperity for the region. By integrating insights from this study into flood risk management strategies, policymakers, practitioners, and the community can develop more informed and coordinated approaches that address the interconnected challenges within the Water-Food-Land-Energy Nexus. This holistic approach not only enhances resilience to flooding but also promotes sustainable development and prosperity in flood-prone regions like Sri Lanka.
In response to these findings, authorities must take proactive measures to establish an IFRM mechanism tailored to the specific needs of the region. This includes the establishment and maintenance of a comprehensive flood disaster database, periodic analysis of rainfall trends to monitor climate change impacts, and regular assessments of flood risk. Furthermore, stakeholders must be actively engaged in the identification and implementation of flood mitigation and preparedness measures, with a focus on involving the local community. Promoting research studies on flood risk and management through academic and research institutions is also essential to inform evidence-based decision-making and policy development. To ensure the effectiveness of the IFRM mechanism, clear mandates and responsibilities for stakeholders must be specified and enforced through legislation and regulations. By establishing a robust IFRM system in the Deduru Oya basin, valuable lessons can be learned and replicated to manage flood risk in other river basins across Sri Lanka, ultimately enhancing resilience and reducing the impacts of climate change-induced hazards.
Acknowledgment
This study was done as a part of the collaborative research project conducted at the Postgraduate Institute of Humanities and Social Sciences (PGIHS), University of Peradeniya, Sri Lanka with the extension support from an international research team and Rajarata University. The continuous support given during the whole process of the degree program by the PGIHS is gratefully acknowledged. All co-others equally contributed to the development of this paper.
| 1 |
Yala is the growing season during the seasonal rains from late March to late April, 05 weeks and the Maha is the growing season during the seasonal rains from mid-October to late January, 14 weeks [30]. |
| 2 | JICA is the Japan International Cooperation Agency |
| 3 | Grama Niladari Division (GND) is the smallest administrative unit operating at village level in Sri Lanka. |
| 4 | Divisional Secretary Division (DSD) is the government administrative unit operating at local level in Sri Lanka. |
| 5 | District Disaster Management Coordinating Unit (DDMCU) operates in district level as the sub-national level unit of the Disaster Management Centre. |
References
- Cirella, G.; Iyalomhe, F. Flooding Conceptual Review: Sustainability-Focalized Best Practices in Nigeria. Applied Sciences 2018, 8(9), 1558. [Google Scholar] [CrossRef]
- Berchtold, C.; Vollmer, M.; Sendrowski, P.; Neisser, F.; Müller, L.; Grigoleit, S. Barriers and Facilitators in Interorgan-izational Disaster Response: Identifying Examples Across Europe. Int J Disaster Risk Sci. 2020, 11(1), 46–58. [Google Scholar] [CrossRef]
- Diagne, K. Governance and Natural Disasters: Addressing Flooding in Saint Louis, Senegal. Environment and Urban-ization. 2007, 19 (2), 552–562. [CrossRef]
- Dordi, T. , Henstra, D., & Thistlethwaite, J. Flood risk management and governance: A bibliometric review of the literature. Journal of Flood Risk Management. 2022, 15(3), e12797. [CrossRef]
- Morrison, A., Westbrook, C. J., & Noble, B. F. A review of the flood risk management governance and resilience literature. Journal of Flood Risk Management, 2018, 11(3), 291–304.
- Integrated Flood Management: Concept Paper; Associated Programme on Flood Management, Ed.; WMO; World Mete-orological Organization : Associated Programme on Flood Management: Geneva, Switzerland, 2009.
- Jonkman, S.; Dawson, R. Issues and Challenges in Flood Risk Management—Editorial for the Special Issue on Flood Risk Management. Water 2012, 4(4), 785–792. [Google Scholar] [CrossRef]
- Weerasinghe, K. M.; Gehrels, H.; Arambepola, N. M. S. I.; Vajja, H. P.; Herath, J. M. K.; Atapattu, K. B. Qualitative Flood Risk Assessment for the Western Province of Sri Lanka. Procedia Engineering 2018, 212, 503–510. [Google Scholar] [CrossRef]
- ADB. Philippines: Integrated Flood Resilience and Adaptation Project 1; Asian Development Bank, 2022.
- Adbheadhoncho. Integrated Flood Resilience and Adaptation Project 1. Asian Development Bank. https://www.adb.org/projects/51294-001/main (accessed 2023-03-16).
- Samuels, P.; Morris, M.; Sayers, P.; Creutin, J.; Kortenhaus, A.; Klijn, F.; Erik; Mosselman; Os, A. V.; Schanze, J. A FRAMEWORK FOR INTEGRATED FLOOD RISK MANAGEMENT; 2010.
- Douglas, I.; Alam, K.; Maghenda, M.; Mcdonnell, Y.; Mclean, L.; Campbell, J. Unjust Waters: Climate Change, Flood-ing and the Urban Poor in Africa. Environment and Urbanization 2008, 20(1), 187–205. [Google Scholar] [CrossRef]
- Applying the OECD Principles on Water Governance to Floods: A Checklist for Action | en | OECD. https://www.oecd.org/development/applying-the-oecd-principles-on-water-governance-to-floods-d5098392-en.htm (accessed 2023-03-30).
- UNISDR. Sendai Framework for Disaster Risk Reduction: 2015 - 2030; UNISDR.
- IFRC Annual report 2022. (n.d.). Retrieved from https://www.ifrc.org/document/annual-report-2022.
- Rahman, S., Shamrat, R. I., & Uddin, M. S. Flood and flood management in Bangladesh (Technical Report). 2017, Dept. of Disaster Science and Management, Faculty of Earth and Environmental Sciences, University of Dhaka.
- Mabawi, N. A., Nakamura, H., & Bhattacharya, Y. Flood risk management in Malaysia: The current hindrances for flood-related agencies. Asian Journal of Behavioural Studies, 2020, August.
- Helmi, A. H., & Zohny, O. Flash flood risk assessment in Egypt. Research Gate, 2020, July.
- Lumbroso, D., & Ramsbottom, D. Flood risk management in the United Kingdom. Research Gate, 2018, January.
- The Future of Quantitative Research in Social Science – Integrating Social Science and Computer Science Methods. http://www.smrconverge.org/ (accessed 2023-03-24).
- Wang, T.; Hamann, A.; Spittlehouse, D.; Carroll, C. Locally Downscaled and Spatially Customizable Climate Data for Historical and Future Periods for North America. PLoS ONE 2016, 11(6), e0156720. [Google Scholar] [CrossRef]
- Dinku, T.; Faniriantsoa, R.; Islam, S.; Nsengiyumva, G.; Grossi, A. The Climate Data Tool: Enhancing Climate Ser-vices Across Africa. Front. Clim. 2022, 3, 787519. [Google Scholar] [CrossRef]
- WMO. Climate Data Management System Specifications; World Meteorological Organization: Geneva, 2014.
- Cheng, C.-T.; Chau, K. W. Flood Control Management System for Reservoirs. Environmental Modelling & Software. 2004, 19 (12), 1141–1150. [CrossRef]
- Glas, H.; De Maeyer, P.; Merisier, S.; Deruyter, G. Development of a Low-cost Methodology for Data Acquisition and Flood Risk Assessment in the Floodplain of the River Moustiques in Haiti. J Flood Risk Management 2020, 13 (2). [CrossRef]
- Mughal, M. H.; Shaikh, Z. A.; Khand, Z. H.; Rajput, A.; Akhtar, F. A Systematic Review of Ontology-Based River Streamflow and Flood Data Management Challenges. QUEST Research Journal 2021, 19(1), 40–50. [Google Scholar] [CrossRef]
- Blicharska, M., Smithers, R. J., Kuchler, M., Munaretto, S., van den Heuvel, L., & Teutschbein, C. (2023). The water–energy–food–land–climate nexus: Policy coherence for sustainable resource management in Sweden. Environmental Policy and Governance.
- Pahl-Wostl C, Gorris P, Jager N, Koch L, Lebel L, Stein C, Venghaus S, Withanachchi S. Scale-related governance challenges in the water–energy–food nexus: Toward a diagnostic approach. Sustainability Science. 2021 Mar;16:615-29.
- UNDRR. Disaster Risk Reduction in Sri Lanka: Status Report 2019; United Nations Office for Disaster Risk Reduction (UNDRR): Bangkok, 2019.
- Ginige, K.; Mendis, K.; Thayaparan, M. An Assessment of Structural Measures for Risk Reduction of Hydrometeoro-logical Disasters in Sri Lanka. Progress in Disaster Science. 2022, 14, 100232. [Google Scholar] [CrossRef]
- LANKA, D. of B. E., University of Moratuwa, SRI; Dasandara, M.; Ernst, R.; Department of Building Economics, University of Moratuwa, SRI LANKA; Kulatunga, U.; Department of Building Economics, University of Moratuwa, SRI LANKA; Rathnasiri, P.; Division of Building Science and Technology, City University of Hong Kong, HONG KONG. Investigation of Issues in Structural Flood Management Measures in Sri Lanka. JCDC 2022, 27 (1), 65–78. [CrossRef]
- Disaster Management Centre; Asia Pacific Alliance for Disaster Management (A-PAD); People of Japan. Impacts of Disasters in Sri Lanka 2016; Consortium of Humanitarian Agencies (CHA): Colombo, 2016.
- JICA. Data Collection Survey on Disaster Risk Reduction Sector in Sri Lanka; Japan International Cooperation Agency: Colombo, 2017.
- Sivakumar, S. Flood Mitigation Strategies Adopted in Sri Lanka: A Review. International Journal of Scientific & Engi-neering Research 2015, 6 (2).
- HERATH, H. M. M.; WIJESEKERA, S.; MUNASINGHE, J. MANAGING OF URBAN FLOOD RISK IN COLOMBO WITH SPATIAL PLANNING. In Proceedings of the 9thInternational Conference of Faculty of Architecture Research Unit (FARU), University of Moratuwa, Sri Lanka; University of Moratuwa, Sri Lanka: Moratuwa.
- DMC. Risk Index for Sri Lanka; Disaster Management Centre: Colombo, 2019.
- Jayasena, H. A. H.; Kulasekera, P. B. Sustainable Rainwater Harvesting System for Rural Community: A Case Study from Deduru Oya Basin in Sri Lanka. Ceylon Journal of Science. 2015, 19(1), 1–15. [Google Scholar]
- Centre for Environmental Studies. Environmental Impact Assessment Report of Deduru Oya Reservoir; Irrigation De-partment: Colombo, 2002.
- Punyawardena, B. V. R. Identification of the Potential of Growing Seasons by the Onset of Seasonal Rains: A Study in the DL1 Region of the North Central Dry Zone. Journal of National Science Foundation of Sri Lanka 30, 13–21.
- Karunathilaka, N., Deduru Oya Bada Viththi (Stories along the Deduru Oya). Colombo: S. Godage and Broth-ers., N. Deduru Oya Bada Viththi (Stories along the Deduru Oya); S. Godage and Brothers: Colombo, 1989.
- Department of Meteorology. Rainfall Data; Unpublished; Department of Meteorology: Colombo, 2020.
- Nakagawa, K.; Edagawa, H.; Nandakumar, V.; Aoki, M. Longterm Hydrological Data in Sri Lanka; University of Tsu-kuba: Tsukuba, 1995.
- Mohanty, P. K.; Panigrahi, D.; Acharya, M. MissRF: A Visual Basic Application in MS Excel to Find out Missing Rainfall Data and Related Analysis. IIM. 2014, 06(02), 38–44. [Google Scholar] [CrossRef]
- Caldera, H. P. G. M.; Piyathisse, V. R. P. C.; Nandalal, K. D. W. A Comparison of Methods of Estimating Missing Daily Rainfall Data. Engineer 2016, 49(4), 1. [Google Scholar] [CrossRef]
- Barbalho, F. D.; Silva, G. F. N. da; Formiga, K. T. M. Average Rainfall Estimation: Methods Performance Comparison in the Brazilian Semi-Arid. JWARP 2014, 06(02), 97–103. [Google Scholar] [CrossRef]
- Chowdhury, Md. A. I.; Kabir, M. M.; Sayed, A. F.; Hossain, S. Estimation of Rainfall Patterns in Bangladesh Using Different Computational Methods (Arithmetic Average, Thiessen Polygon and Isohyet). Journal of Biodiversity and Environmental Sciences (JBES) 2016, 8(1), 43–51. [Google Scholar]
- Supriya, P.; Krishnaveni, M.; Subbulakshmi, M. Regression Analysis of Annual Maximum Daily Rainfall and Stream Flow for Flood Forecasting in Vellar River Basin. Aquatic Procedia. 2015, 4, 957–963. [Google Scholar] [CrossRef]
- Alahacoon, N.; Edirisinghe, M. Spatial Variability of Rainfall Trends in Sri Lanka from 1989 to 2019 as an Indica-tion of Climate Change. IJGI. 2021, 10(2), 84. [Google Scholar] [CrossRef]
- Amarasinghe, A. G. Analysis of Long-Term Rainfall Trends in Sri Lanka Using CHRIPS Estimates. American Journal of Multidisciplinary Research & Development (AJMRD). 2020, 2 (22), 34–44.
- Karunathilaka, K. L. A. A.; Dabare, H. K. V.; Nandalal, K. D. W. Changes in Rainfall in Sri Lanka during 1966 – 2015. ENGINEER, Institution of Engineers, Sri Lanka 2017, 2 (1), 39–48.
- Asfaw, A.; Simane, B.; Hassen, A.; Bantider, A. Variability and Time Series Trend Analysis of Rainfall and Tempera-ture in Northcentral Ethiopia: A Case Study in Woleka Sub-Basin. Weather and Climate Extremes. 2018, 19, 29–41. [Google Scholar] [CrossRef]
- Sridhar, S. I.; Raviraj, A. Statistical Trend Analysis of Rainfall in Amaravathi River Basin Using Mann-Kendall Test. Curr. World Environ. 2017, 12(1), 89–96. [Google Scholar] [CrossRef]
- Meegahakotuwa, U. S.; Nianthi, K. W. G. R. Variation of Annual and Seasonal Rainfall Patterns in Kandy District of Sri Lanka. IJSRP. 2018, 8 (9). [CrossRef]
- Wickramagamage, P. Spatial and Temporal Variation of Rainfall Trends of Sri Lanka. Theor Appl Climatol. 2016, 125 (3–4), 427–438. [CrossRef]
- Department of Meteorology. Climatic Seasons in Sri Lanka; Department of Meteorology: Colombo, 2021. https:// www.meteo.gov.lk (accessed 2021-05-07).
- Nianthi, R. Climatological Research Sri Lanka; Godage & Brothers (Pvt) Ltd.: Colombo, 2012.
- DMC. Disaster Information Management System – Sri Lanka; Disaster Management Centre: Colombo, 2020. www.desinventar.lk (accessed 2020-02-10).
- Hazard Profiles of Sri Lanka: December 2012; Disaster Management Centre (Colombo, Sri Lanka), United Nations De-velopment Programme, Eds.; Disaster Management Centre, Ministry of Disaster Management: Colombo, 2012.
- DMC. Disaster Operational Procedure for Puttalam District; Disaster Management Centre: Puttlam, 2019.
- DMC. Disaster Operational Procedure for Kurunegala District; Disaster Management Centre: Kurunegala, 2019.
- DMC. Risk Index for Sri Lanka; Disaster Management Centre: Colombo, 2019c.
- DDMCU Puttlam. Statistical Data Records; District Disaster Management Coordinating Unit, Puttlam: Puttlam, 2020.
- DDMCU Kurunegala. Statistical Data Records; District Disaster Management Coordinating Unit, Kurunegala: Kurunegala, 2020.
- Divisional Secretariat Arachchikattuwa. Statistical Data Records; Unpublished; Divisional Secretariat, Arachchikattuwa: Arachchikattuwa, 2020.
- Divisional Secretariat Bingiriya. Statistical Data Records; Unpublished; Divisional Secretariat, Bingiriya: Bingiriya, 2020.
- Divisional Secretariat Chilaw. Statistical Data Records; Unpublished; Divisional Secretariat, Chilaw: Chilaw, 2020.
- Divisional Secretariat Pallama. Statistical Data Records; Unpublished; Divisional Secretariat, Pallama: Pallama, 2020.
- Wanninayake, S. B.; Nianthi, R.; Dayarathne Banda, O. Development of Convenient Flood Risk Assessment Method to Community Level: The Case in the Deduru Oya Basin in Sri Lanka. IJDRBE. 2023. [Google Scholar] [CrossRef]
- Withanachchi, S.S., Houdret, A., Nergui, S., Gonzalez, E.E., Tsogtbayar, A. and Ploeger, A., 2014. (Re) configuration of Water Resources Management in Mongolia: A Critical Geopolitical Analysis (No. 13). University of Kassel, Fachbereich Gesellschaftswissenschaften (Social Sciences), Internatioanl Center for Development and Decent Work (ICDD).
- Gunawardena, D.L.K., Dayawansa, N.D.K. (2020). Assessment of Water Availability for Agriculture and Other Uses – Development of Indices for Deduru Oya River Basin in Sri Lanka. In: Haque, A., Chowdhury, A. (eds) Water, Flood Management and Water Security Under a Changing Climate. Springer, Cham. [CrossRef]
- Managing the Risks of Extreme Events and Disasters to Advance Climate Change Adaption: Special Report of the Intergov-ernmental Panel on Climate Change; Field, C. B., Intergovernmental Panel on Climate Change, Eds.; Cambridge Uni-versity Press: New York, NY, 2012.
- Department of Census and Statistics. Population and Housing Census; Department of Census and Statistics: Colombo, 2001.
- Department of Census and Statistics. Population and Housing Census; Department of Census and Statistics: Colombo, 2012.
- Divisional Secretariat Arachchikattuwa. Resource Profile; Unpublished; Arachchikattuwa, 2020.
- Divisional Secretariat Bingiriya. Resource Profile; Unpublished; Bingiriya, 2020.
- Divisional Secretariat Chilaw. Resource Profile; Unpublished; Chilaw, 2020.
- Divisional Secretariat Pallama. Resource Profile; Unpublished; Pallama, 2020.
- UNISDR. Hyogo Framework for Action: 2005 - 2015; UNISDR, 2005.
- JICA. Comprehensive Study on Disaster Management in Sri Lanka; Ministry of Disaster Management and Human Rights & Department of Irrigation.: Colombo, 2009.
- JICA. Data Collection Survey on Disaster Management Program in Sri Lanka; Government of Sri Lanka: Colombo, 2013.
- Ministry of Disaster Management. Sri Lanka Comprehensive Disaster Management Program 2014 - 2018; Ministry of Disaster Management: Colombo, 2014.
- Government of Sri Lanka. Flood Protection Ordinance of Sri Lanka, 1924.
- DMC. Sri Lanka National Disaster Management Plan 2013 - 2017; Disaster Management Centre: Colombo, 2014.
- DMC. Community Resilience Framework Sri Lanka; Disaster Management Centre, Ministry of Disaster Management: Colombo, 2015.
- Shunglu, R.; Köpke, S.; Kanoi, L.; Nissanka, T.S.; Withanachchi, C.R.; Gamage, D.U.; Dissanayake, H.R.; Kibaroglu, A.; Ünver, O.; Withanachchi, S.S. Barriers in Participative Water Governance: A Critical Analysis of Community Development Approaches. Water 2022, 14, 762. [CrossRef]
- Bollin, C.; Cárdenas, C.; Hahn, H.; Vatsa, K. S. Disaster Risk Management by Communities and Local Governments; Inter-American Development Bank: New York, 2003.
Figure 1.
Integrated Flood Risk Management (Based on the Asian Development Report, 2018).
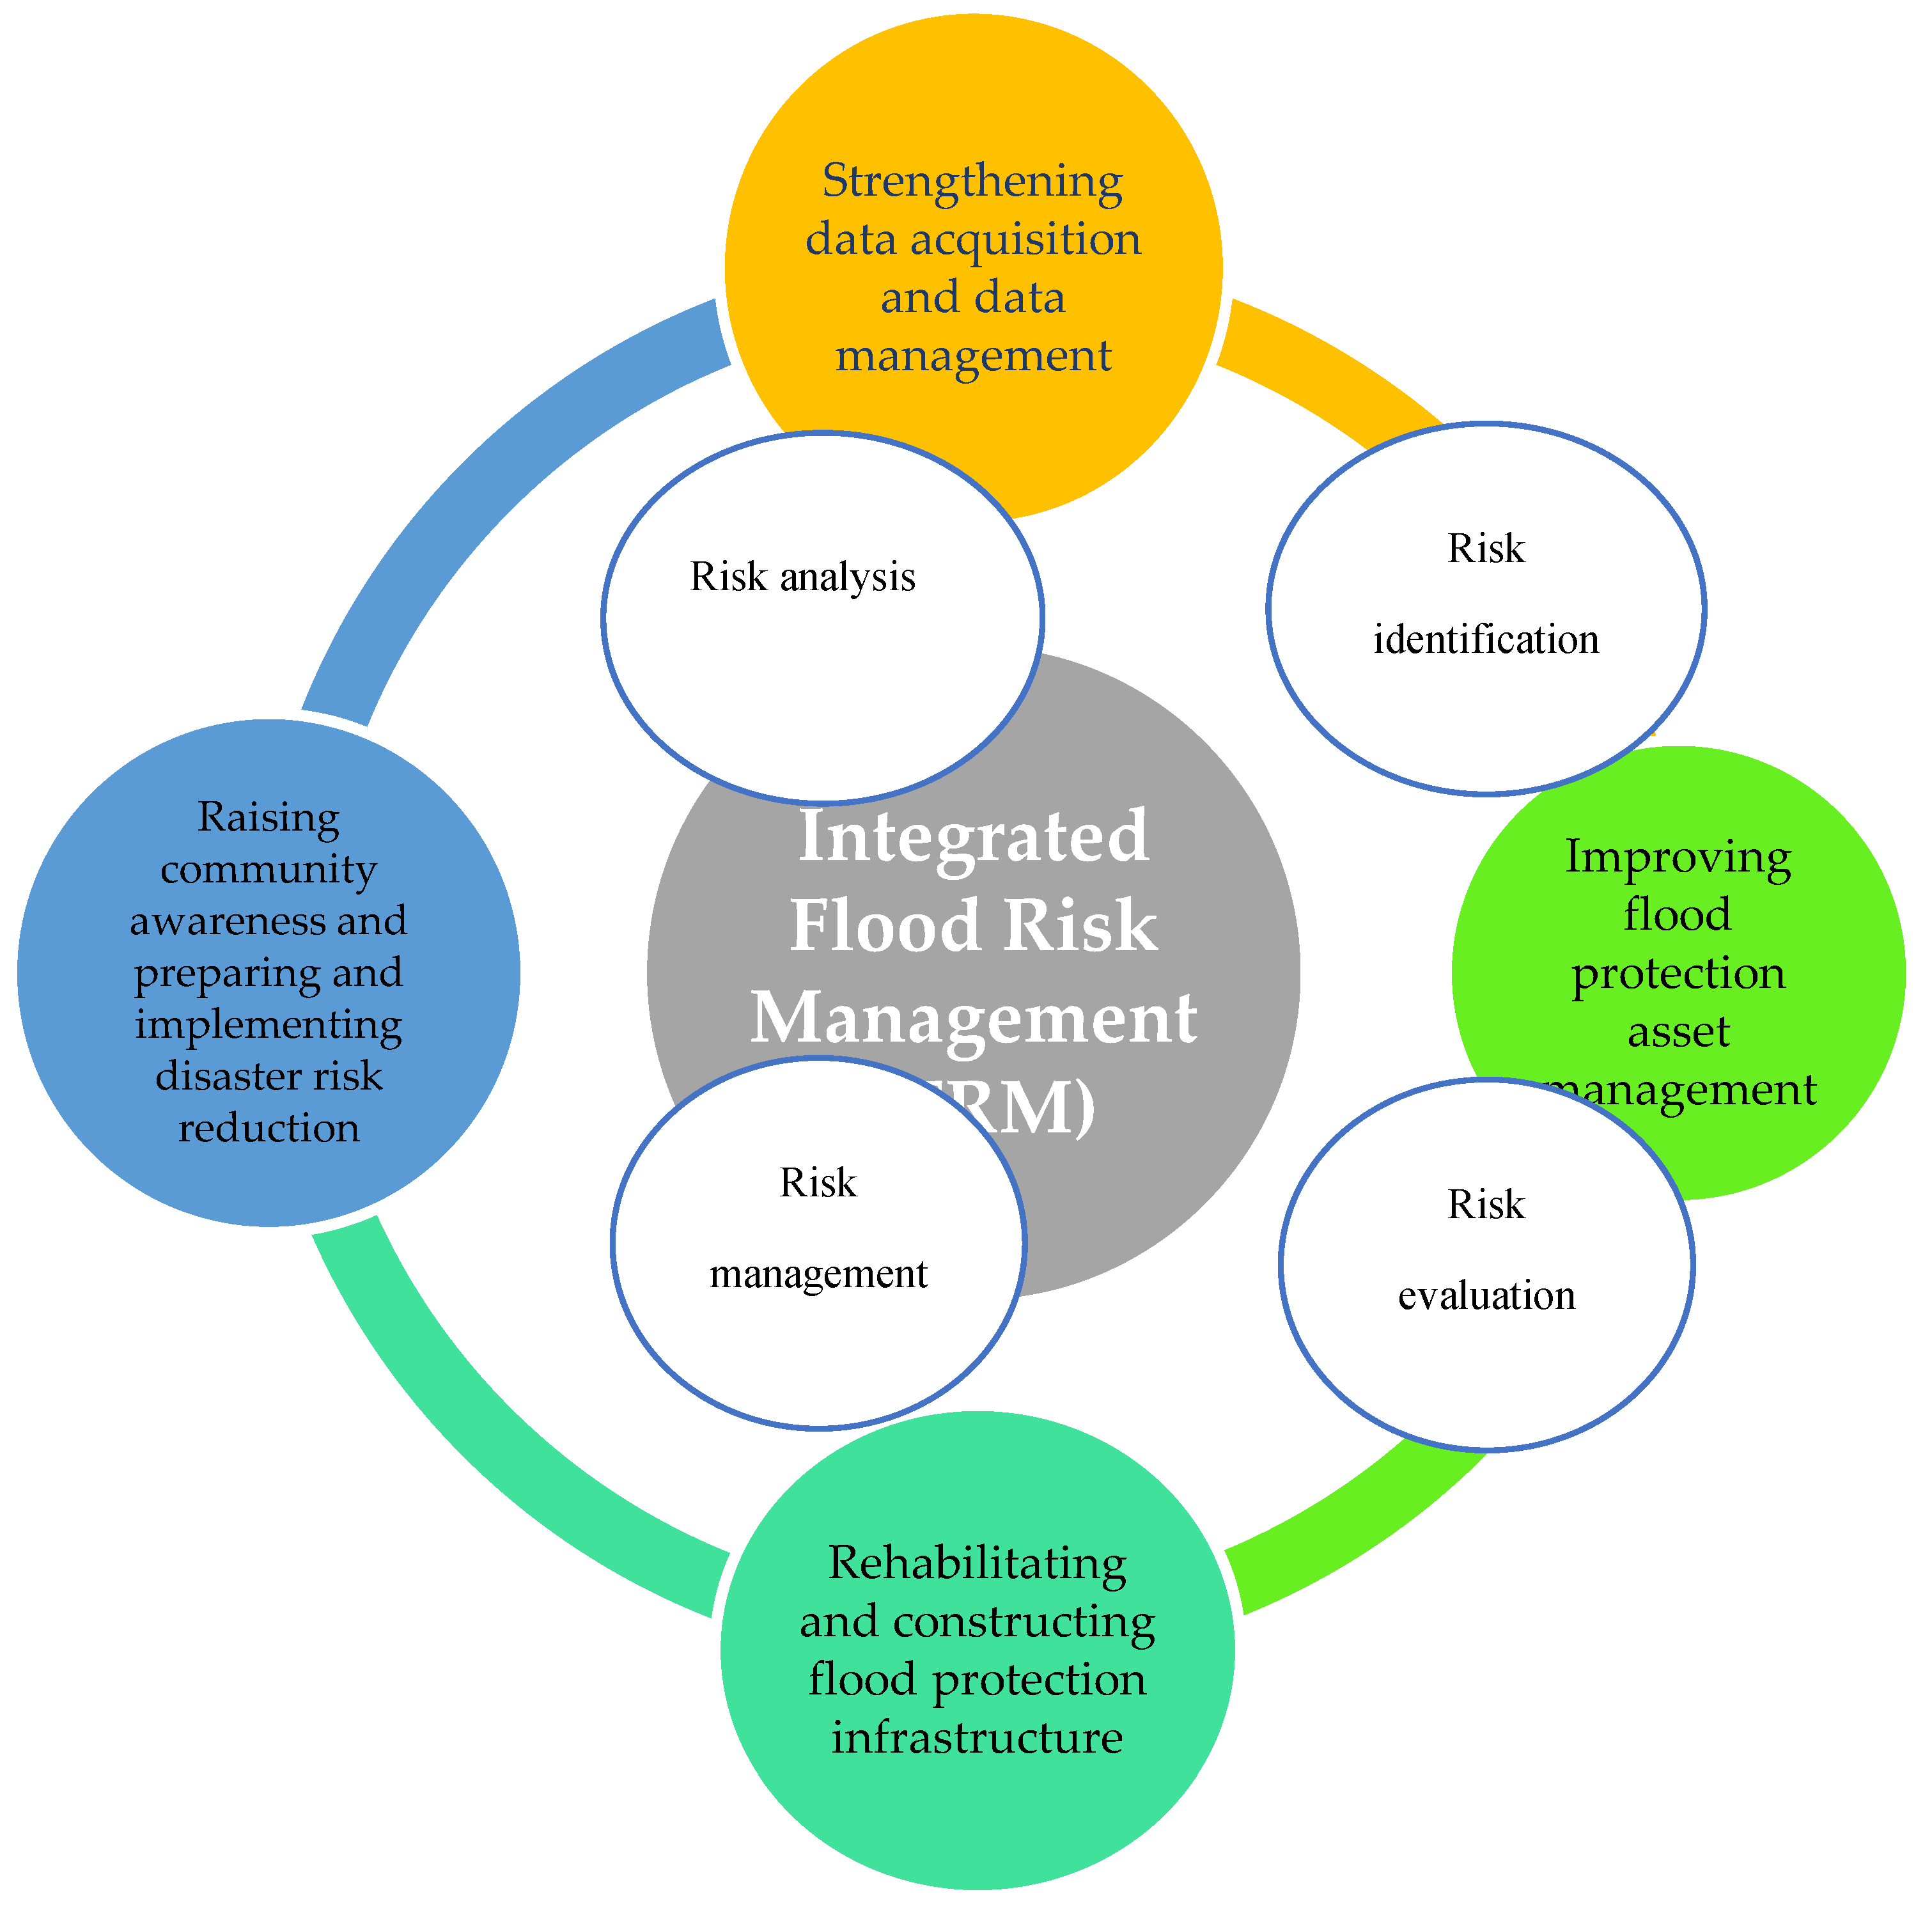
Figure 2.
Location map of the Deduru Oya basin (Source: Developed by the researcher).
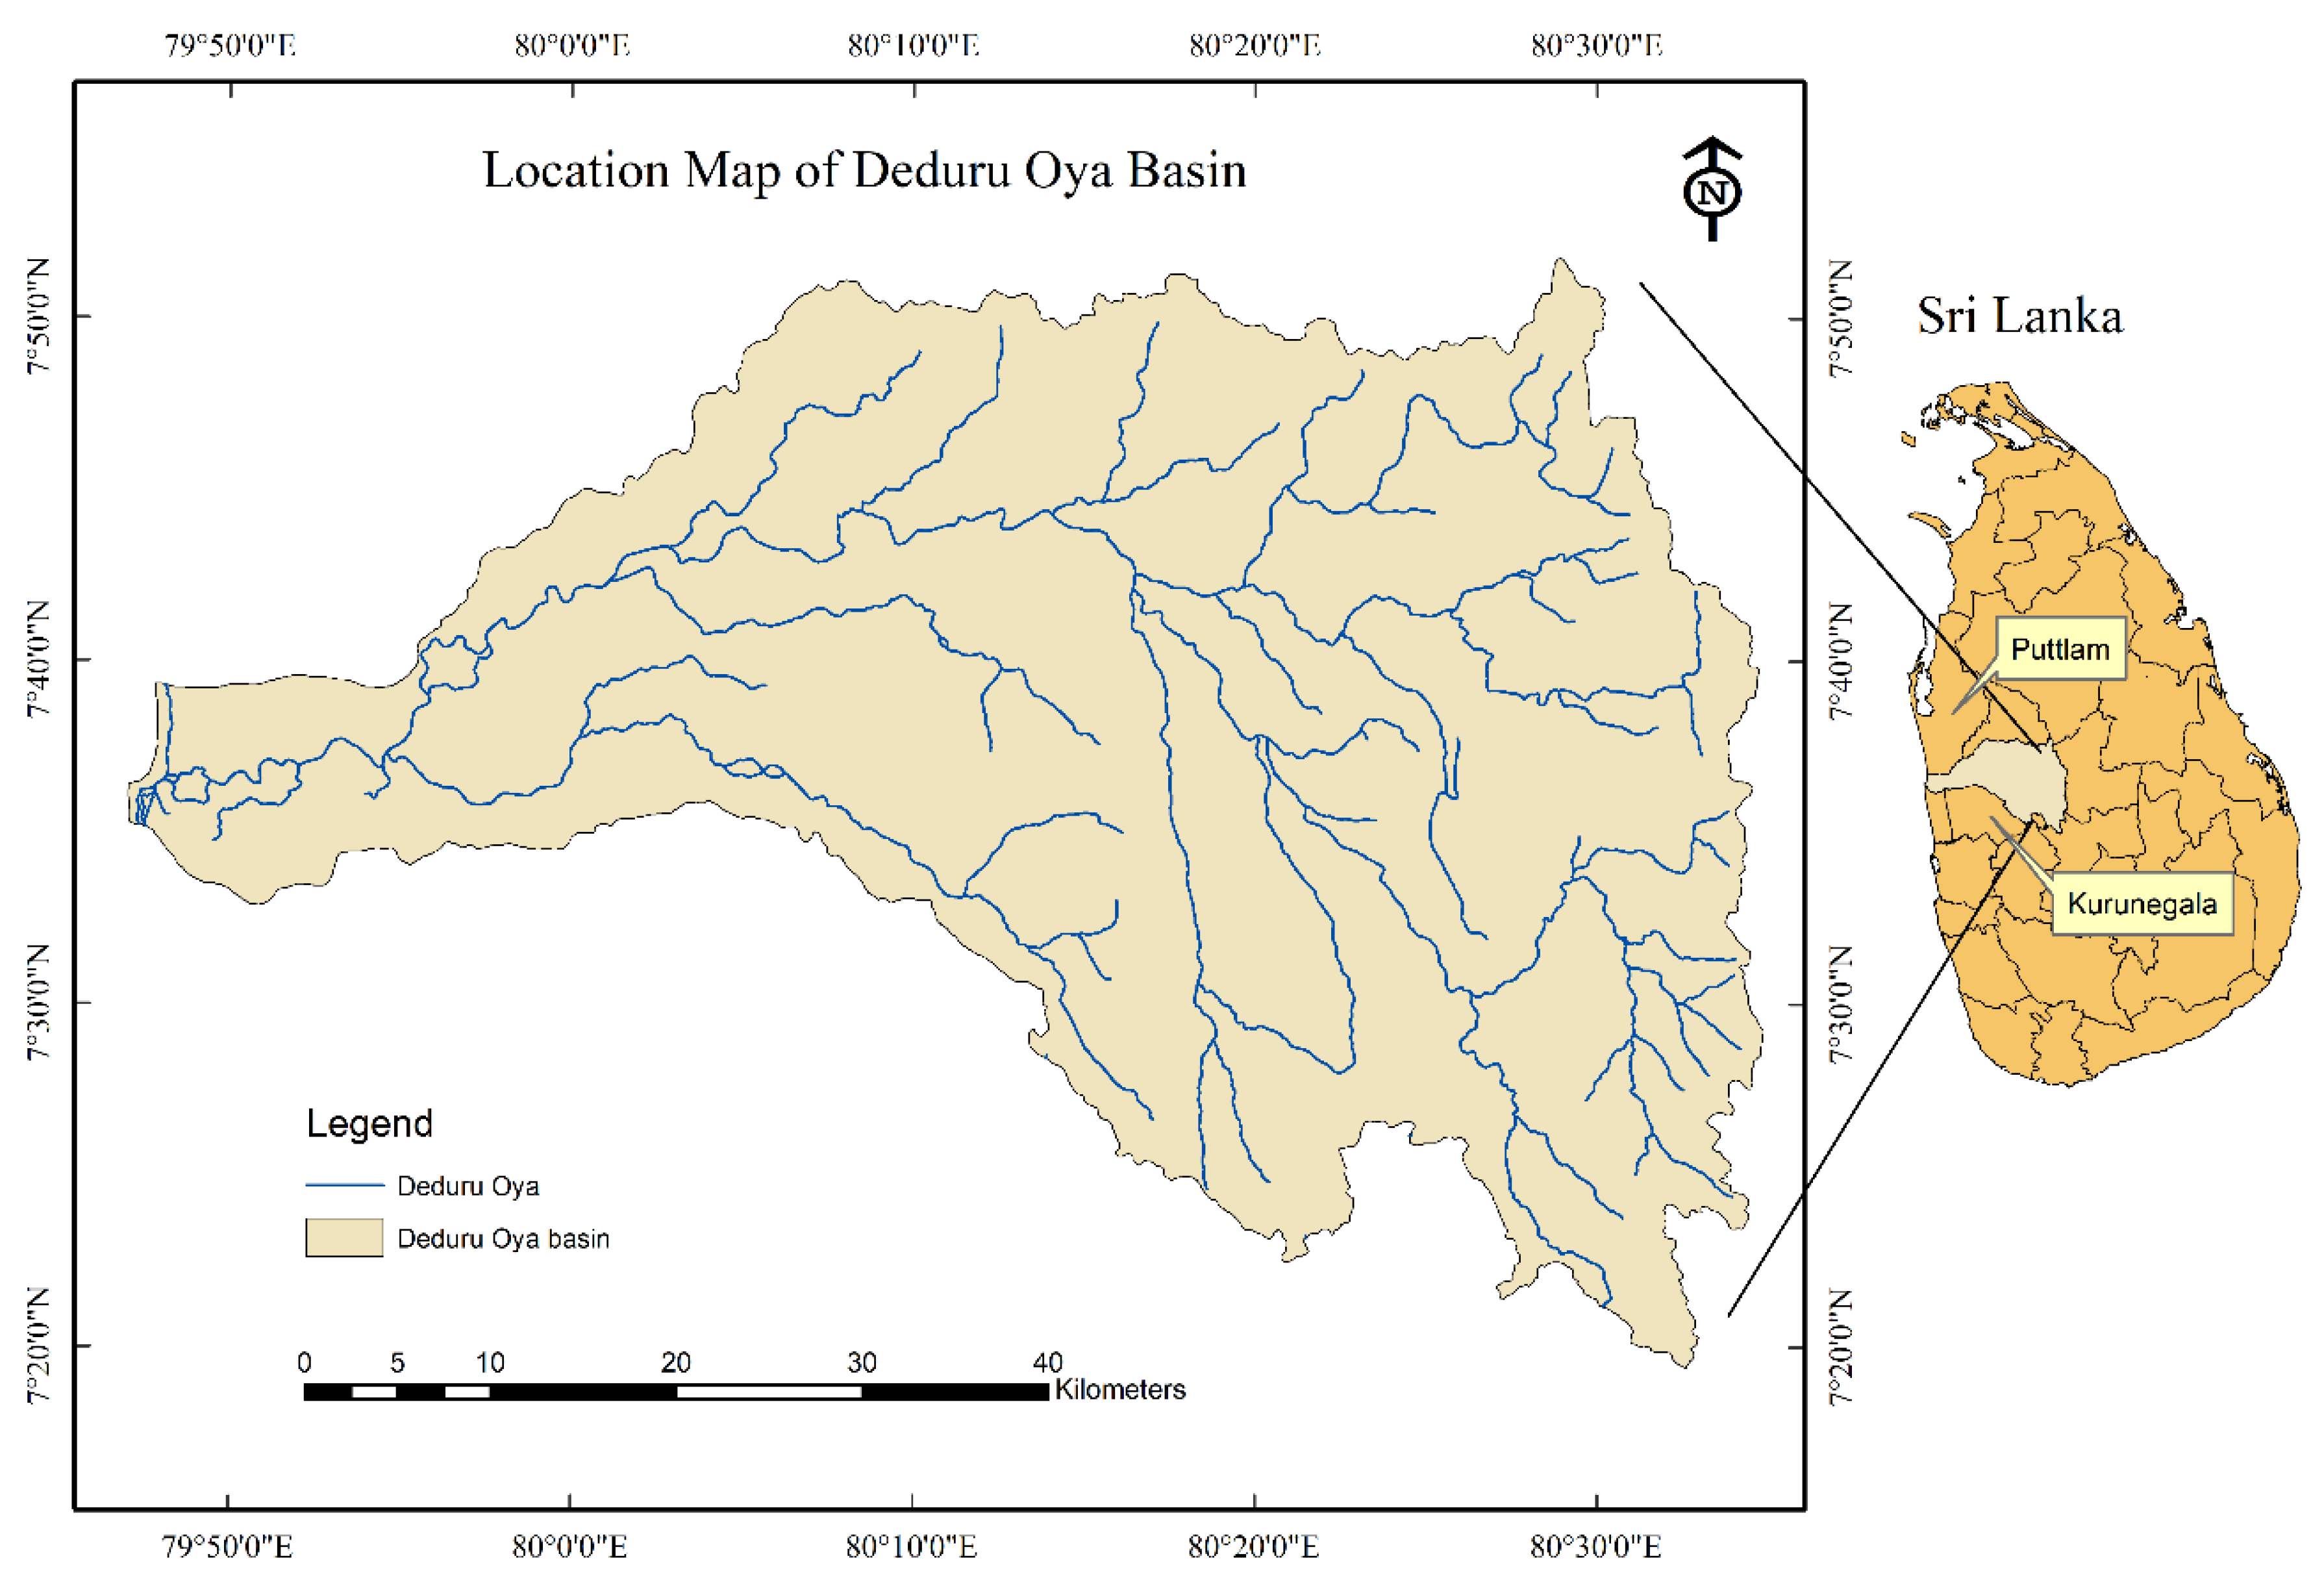
Figure 3.
Thiessen polygon map with rain gauge stations.
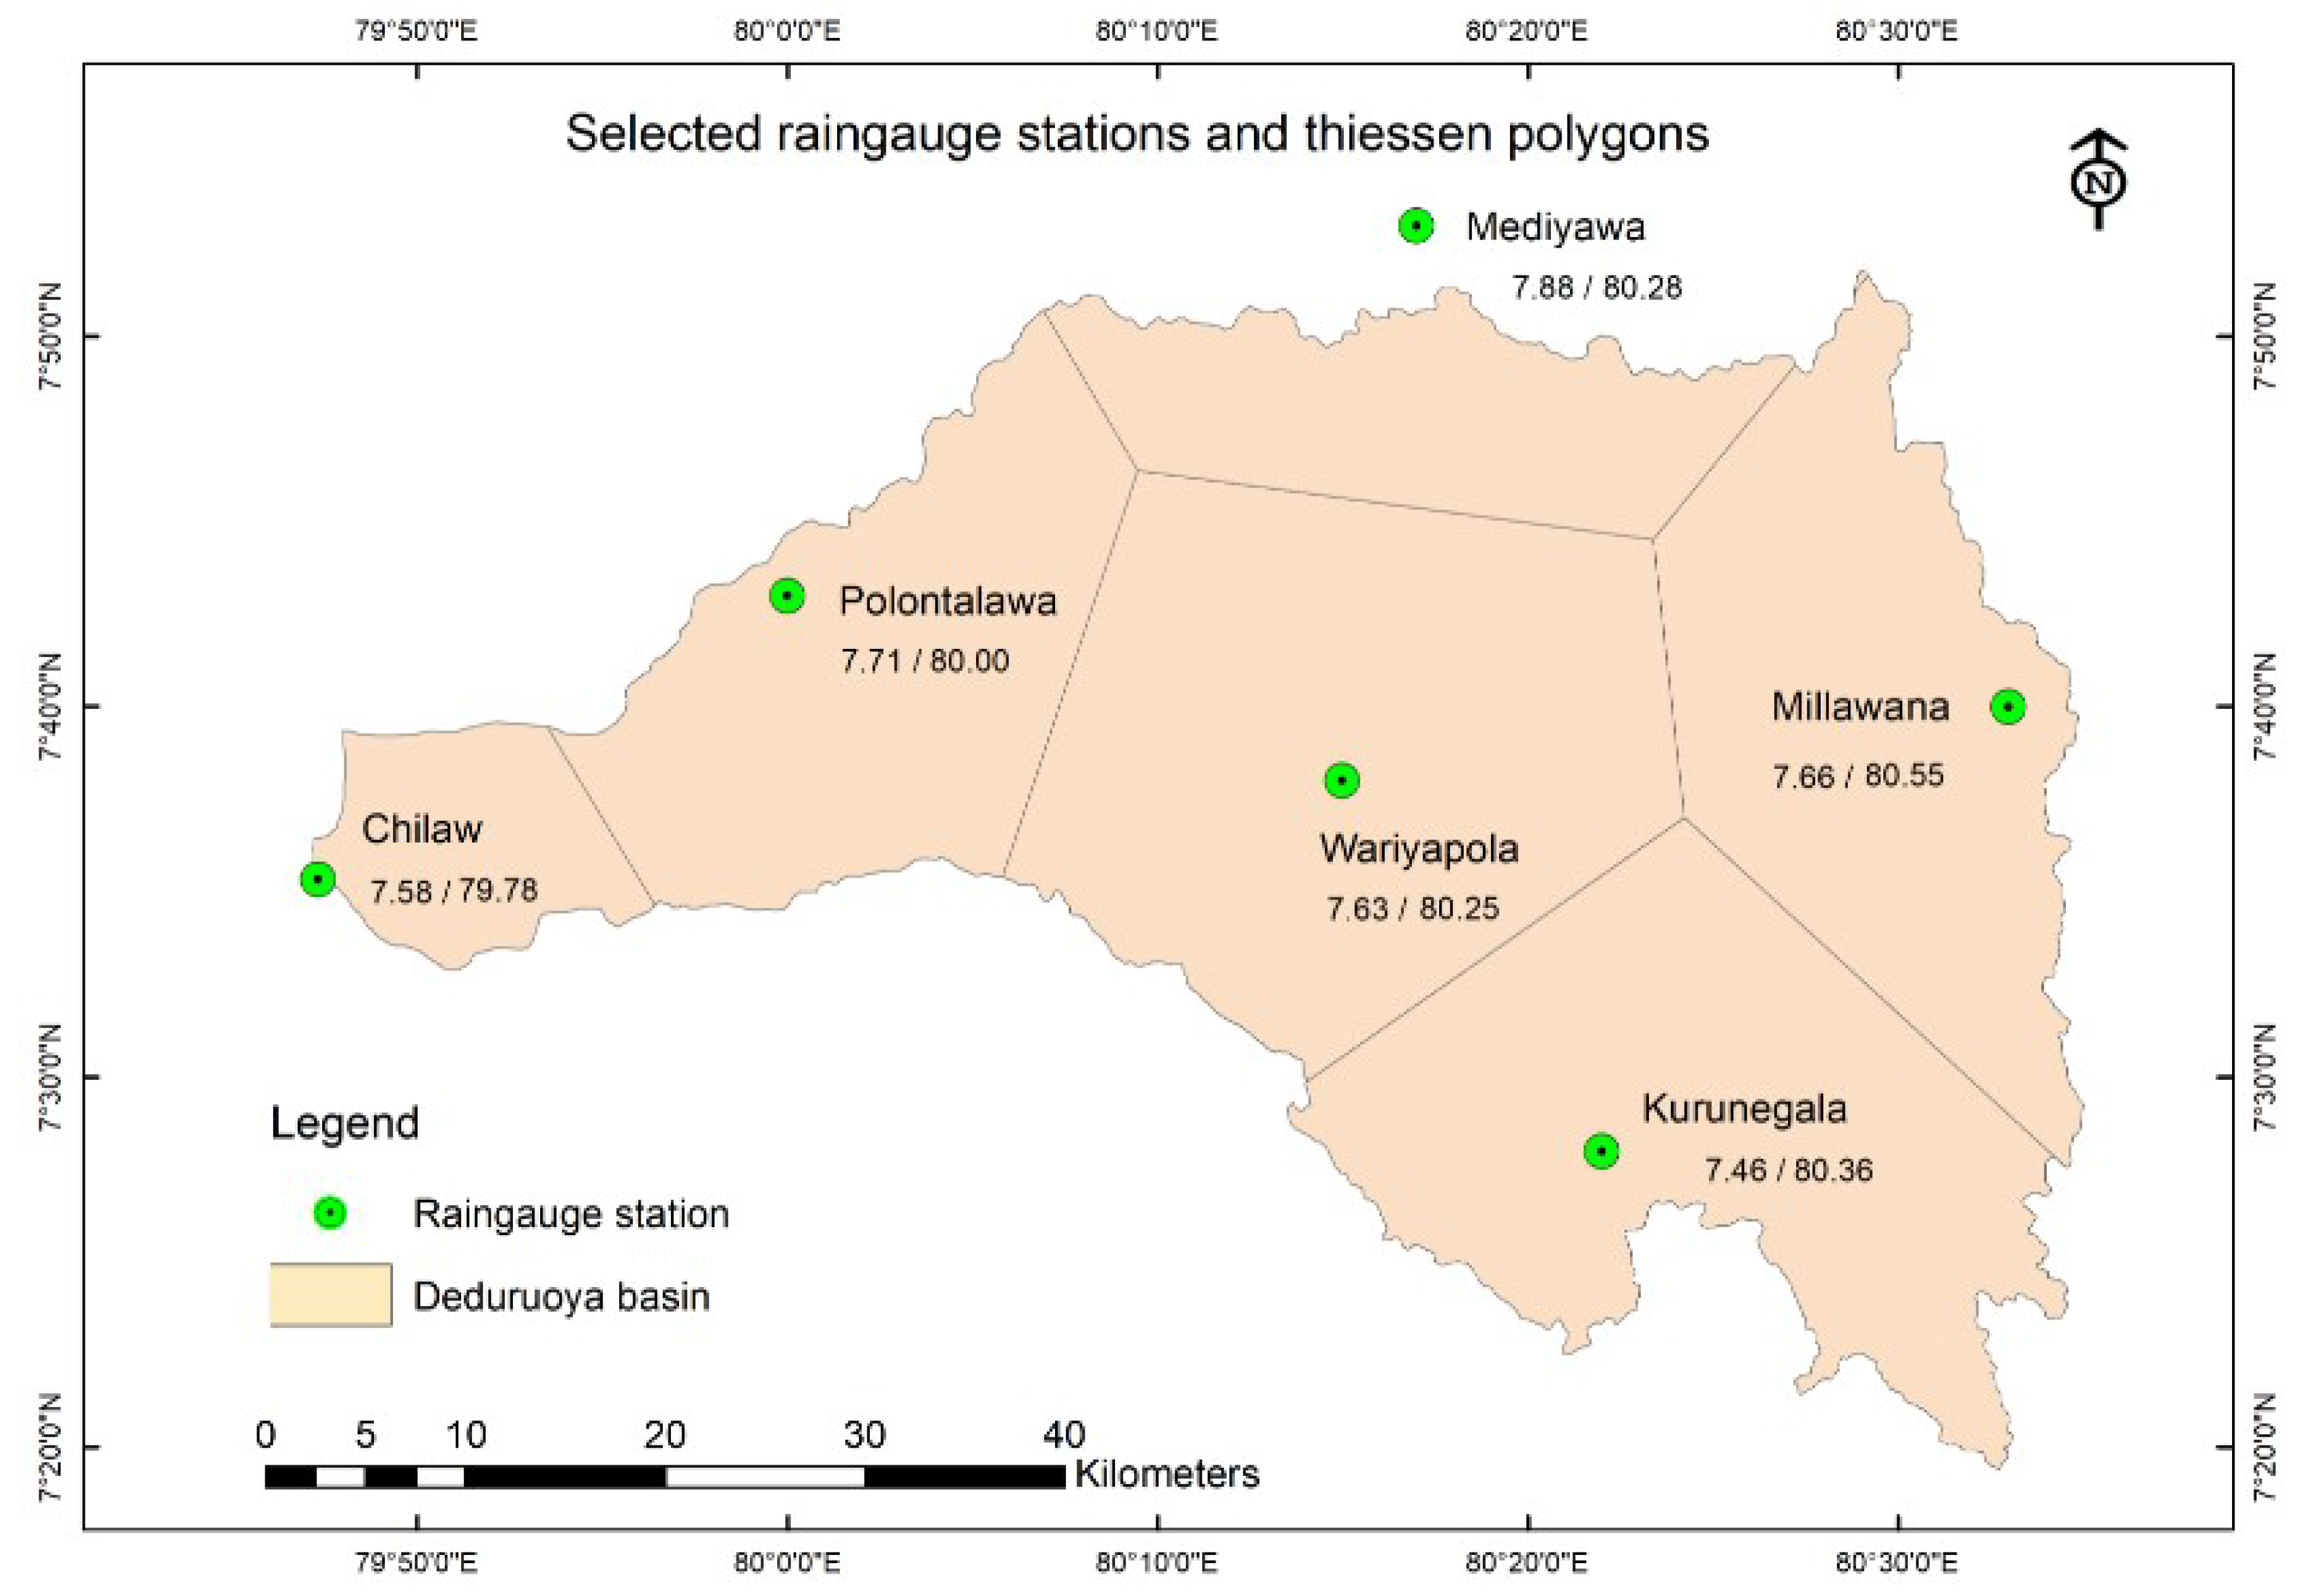
Figure 4.
Monthly rainfall trend in six stations.
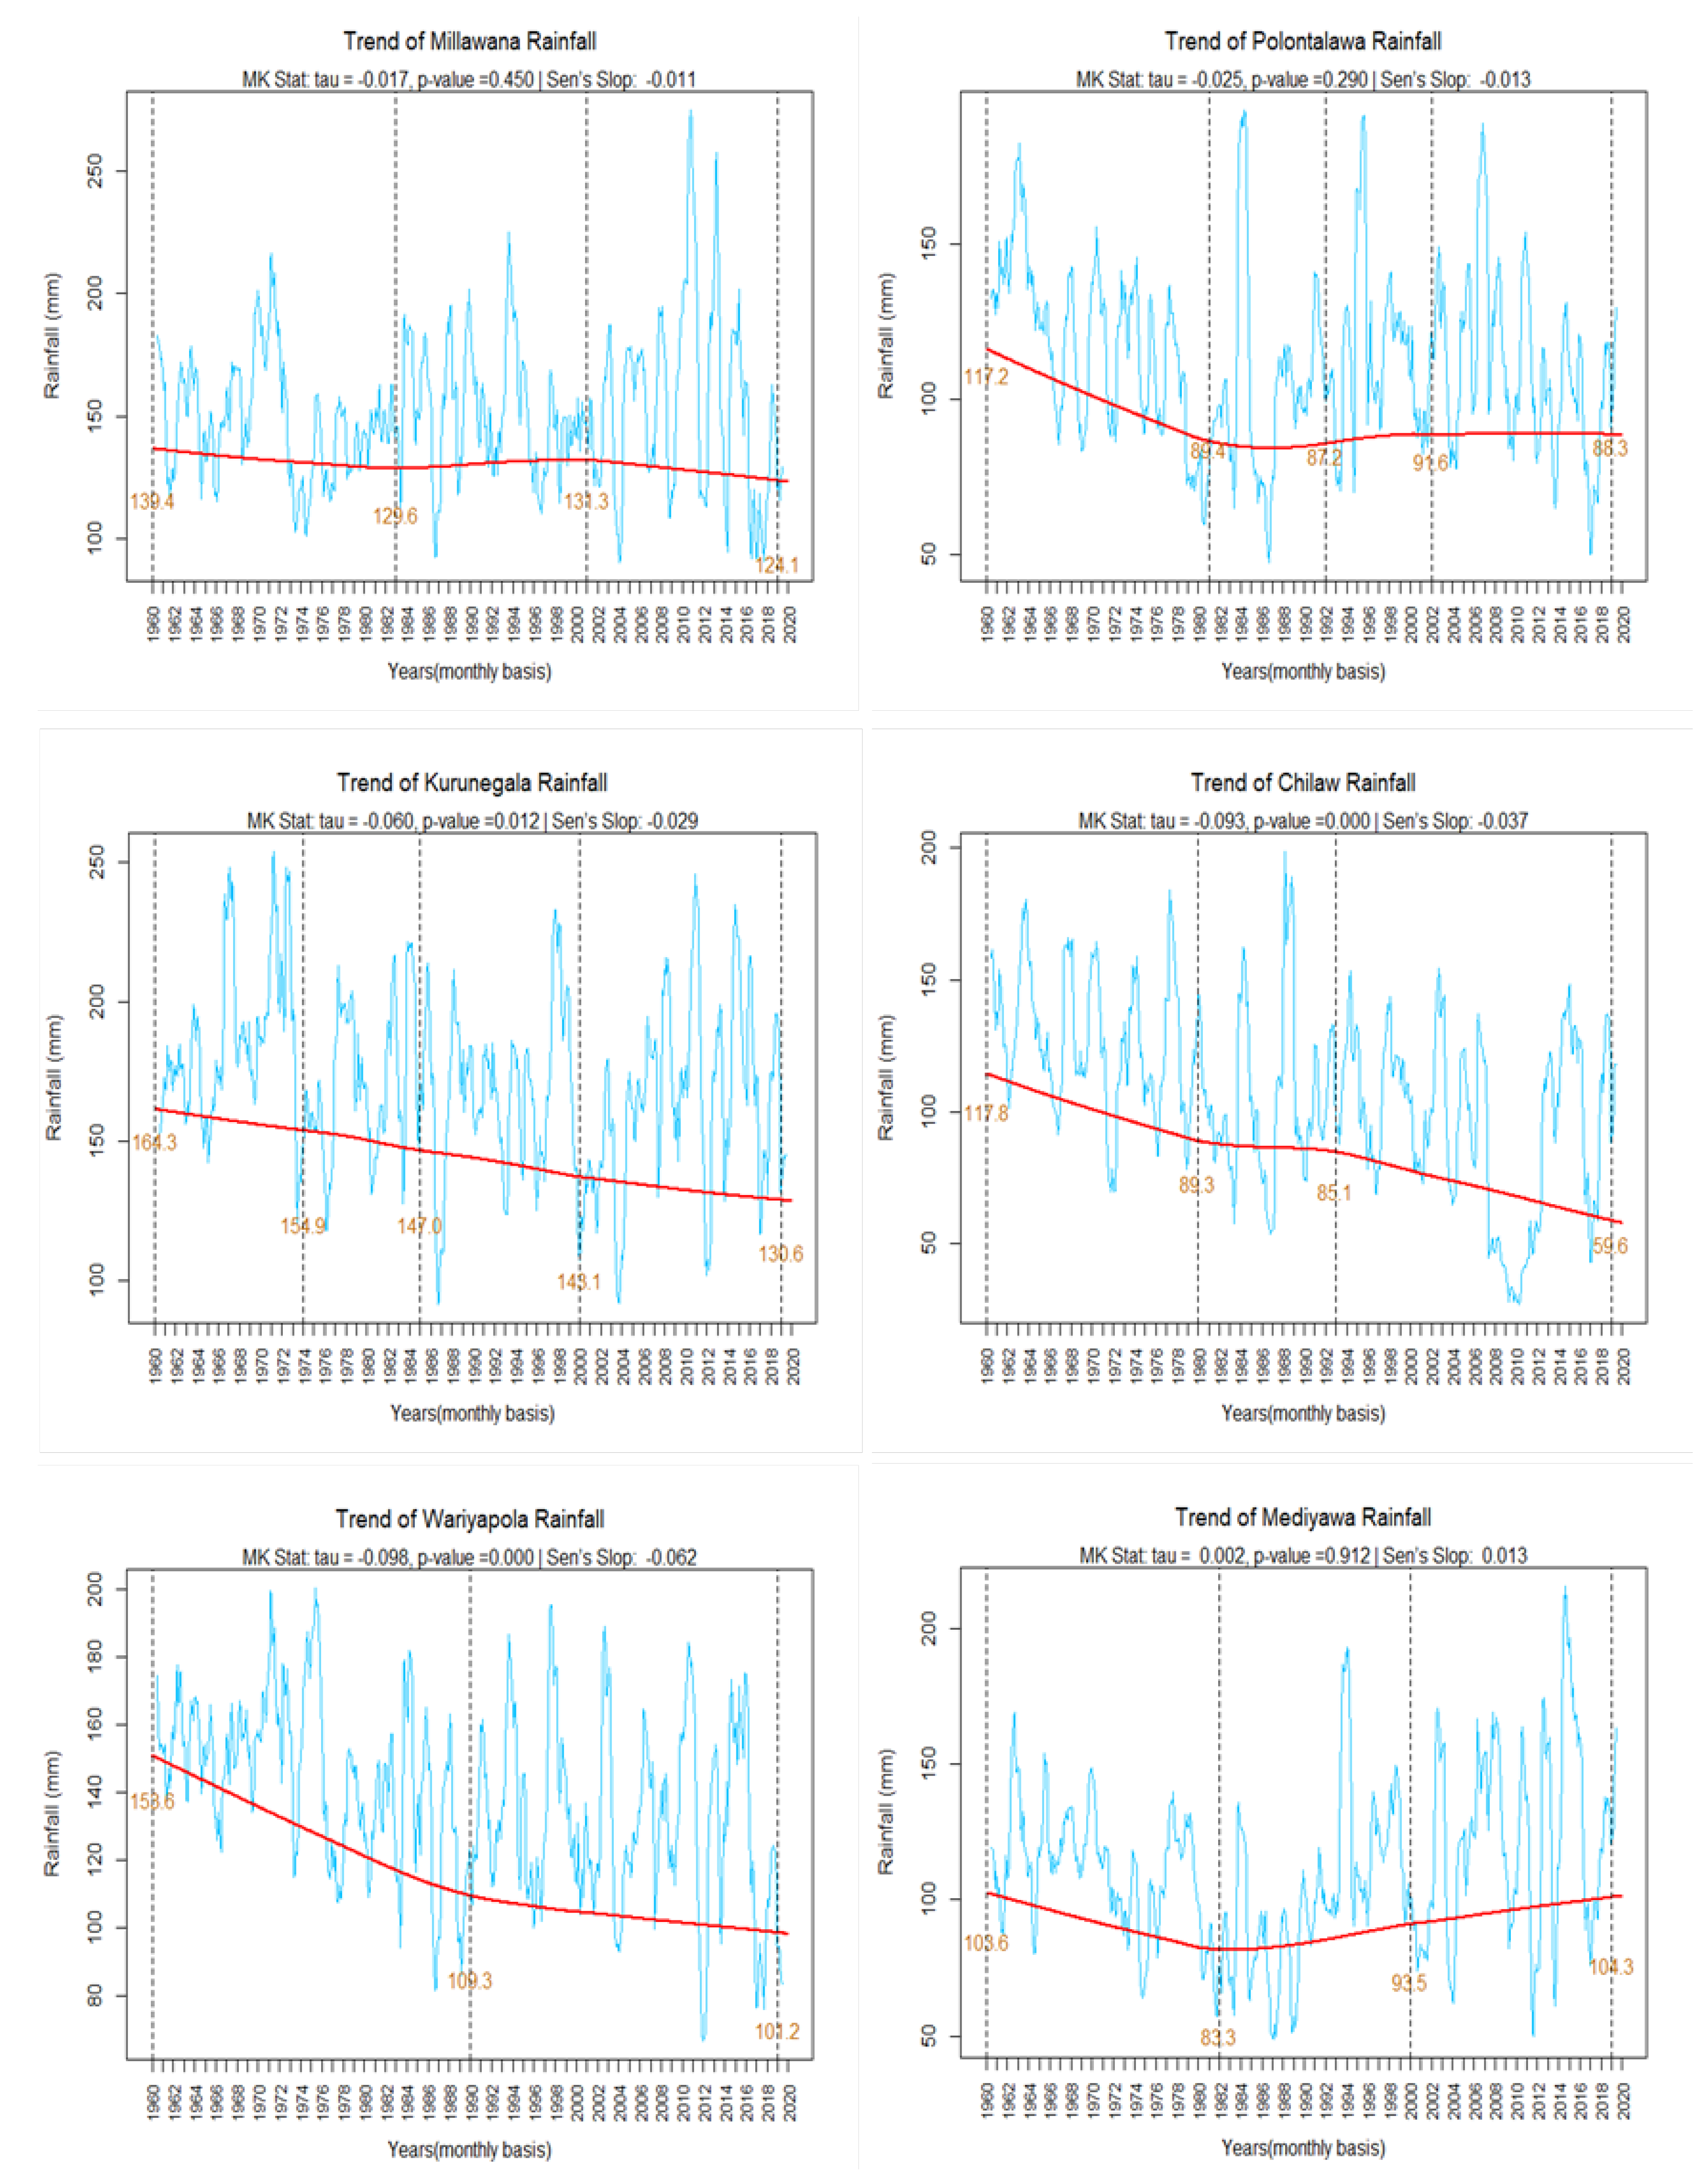
Figure 5.
Monthly rainfall trend in entire Deduru Oya basin.
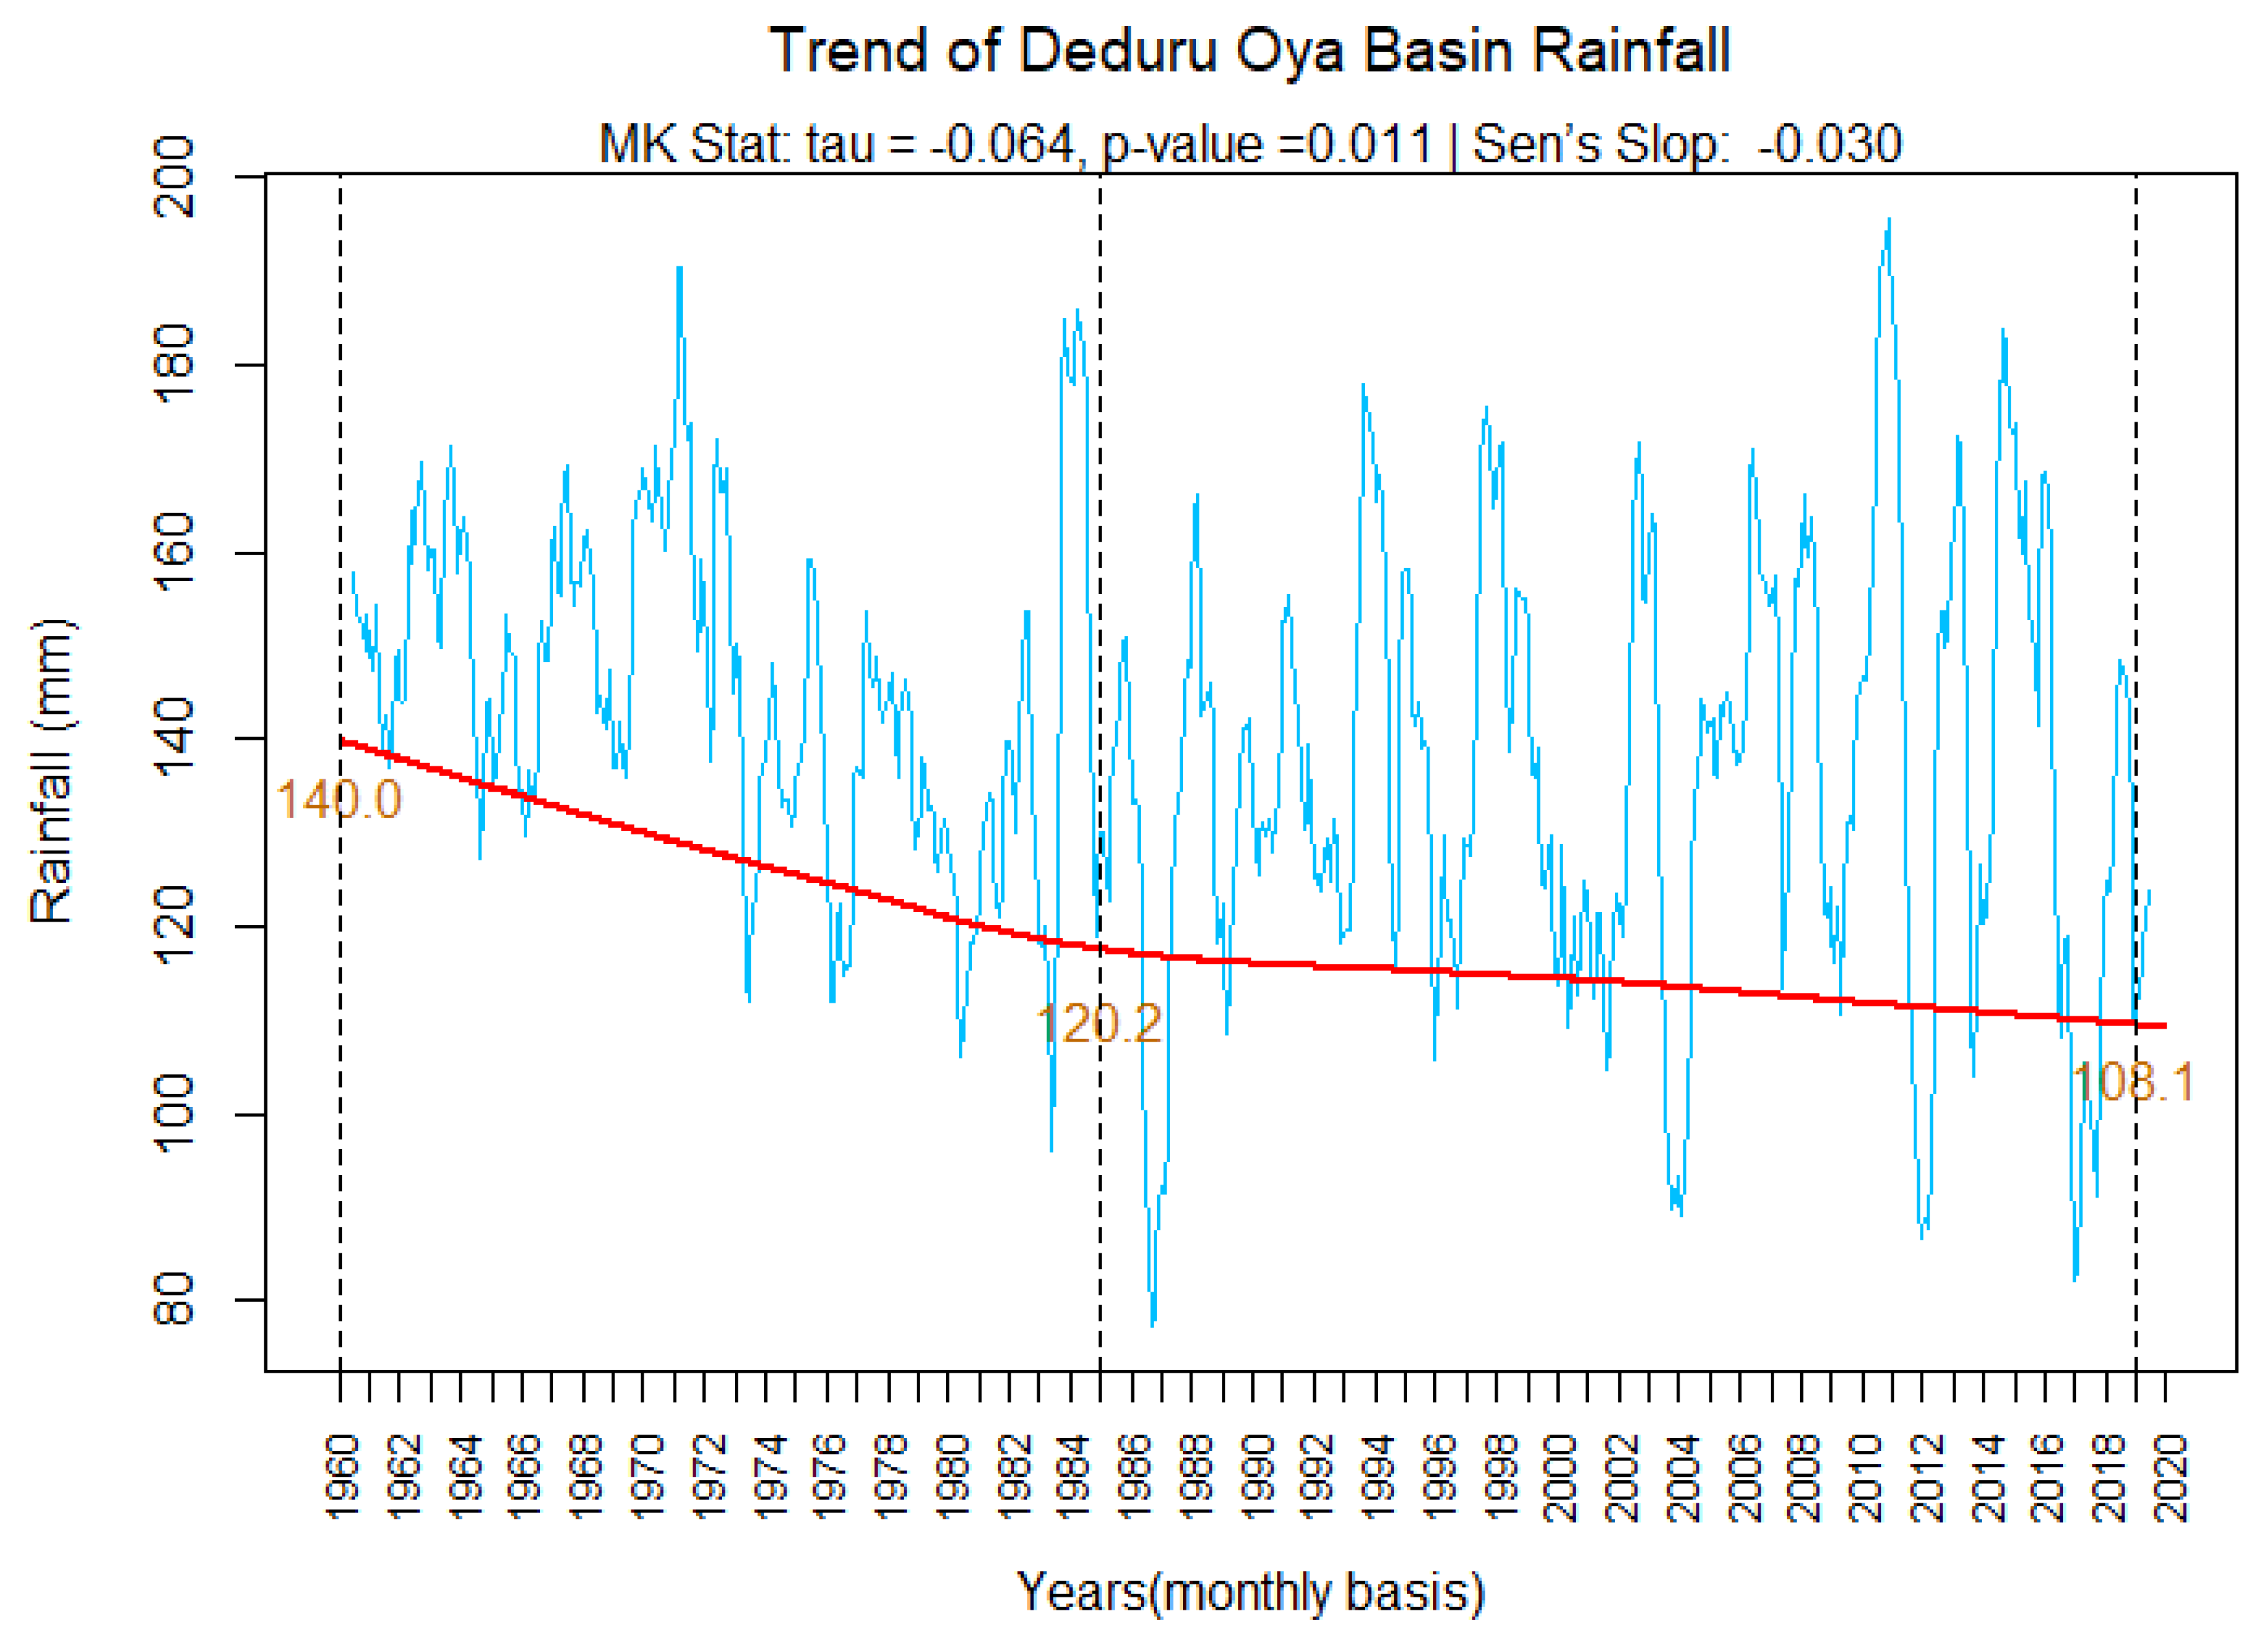
Figure 6.
Monthly rainfall variation in Deduru Oya basin.
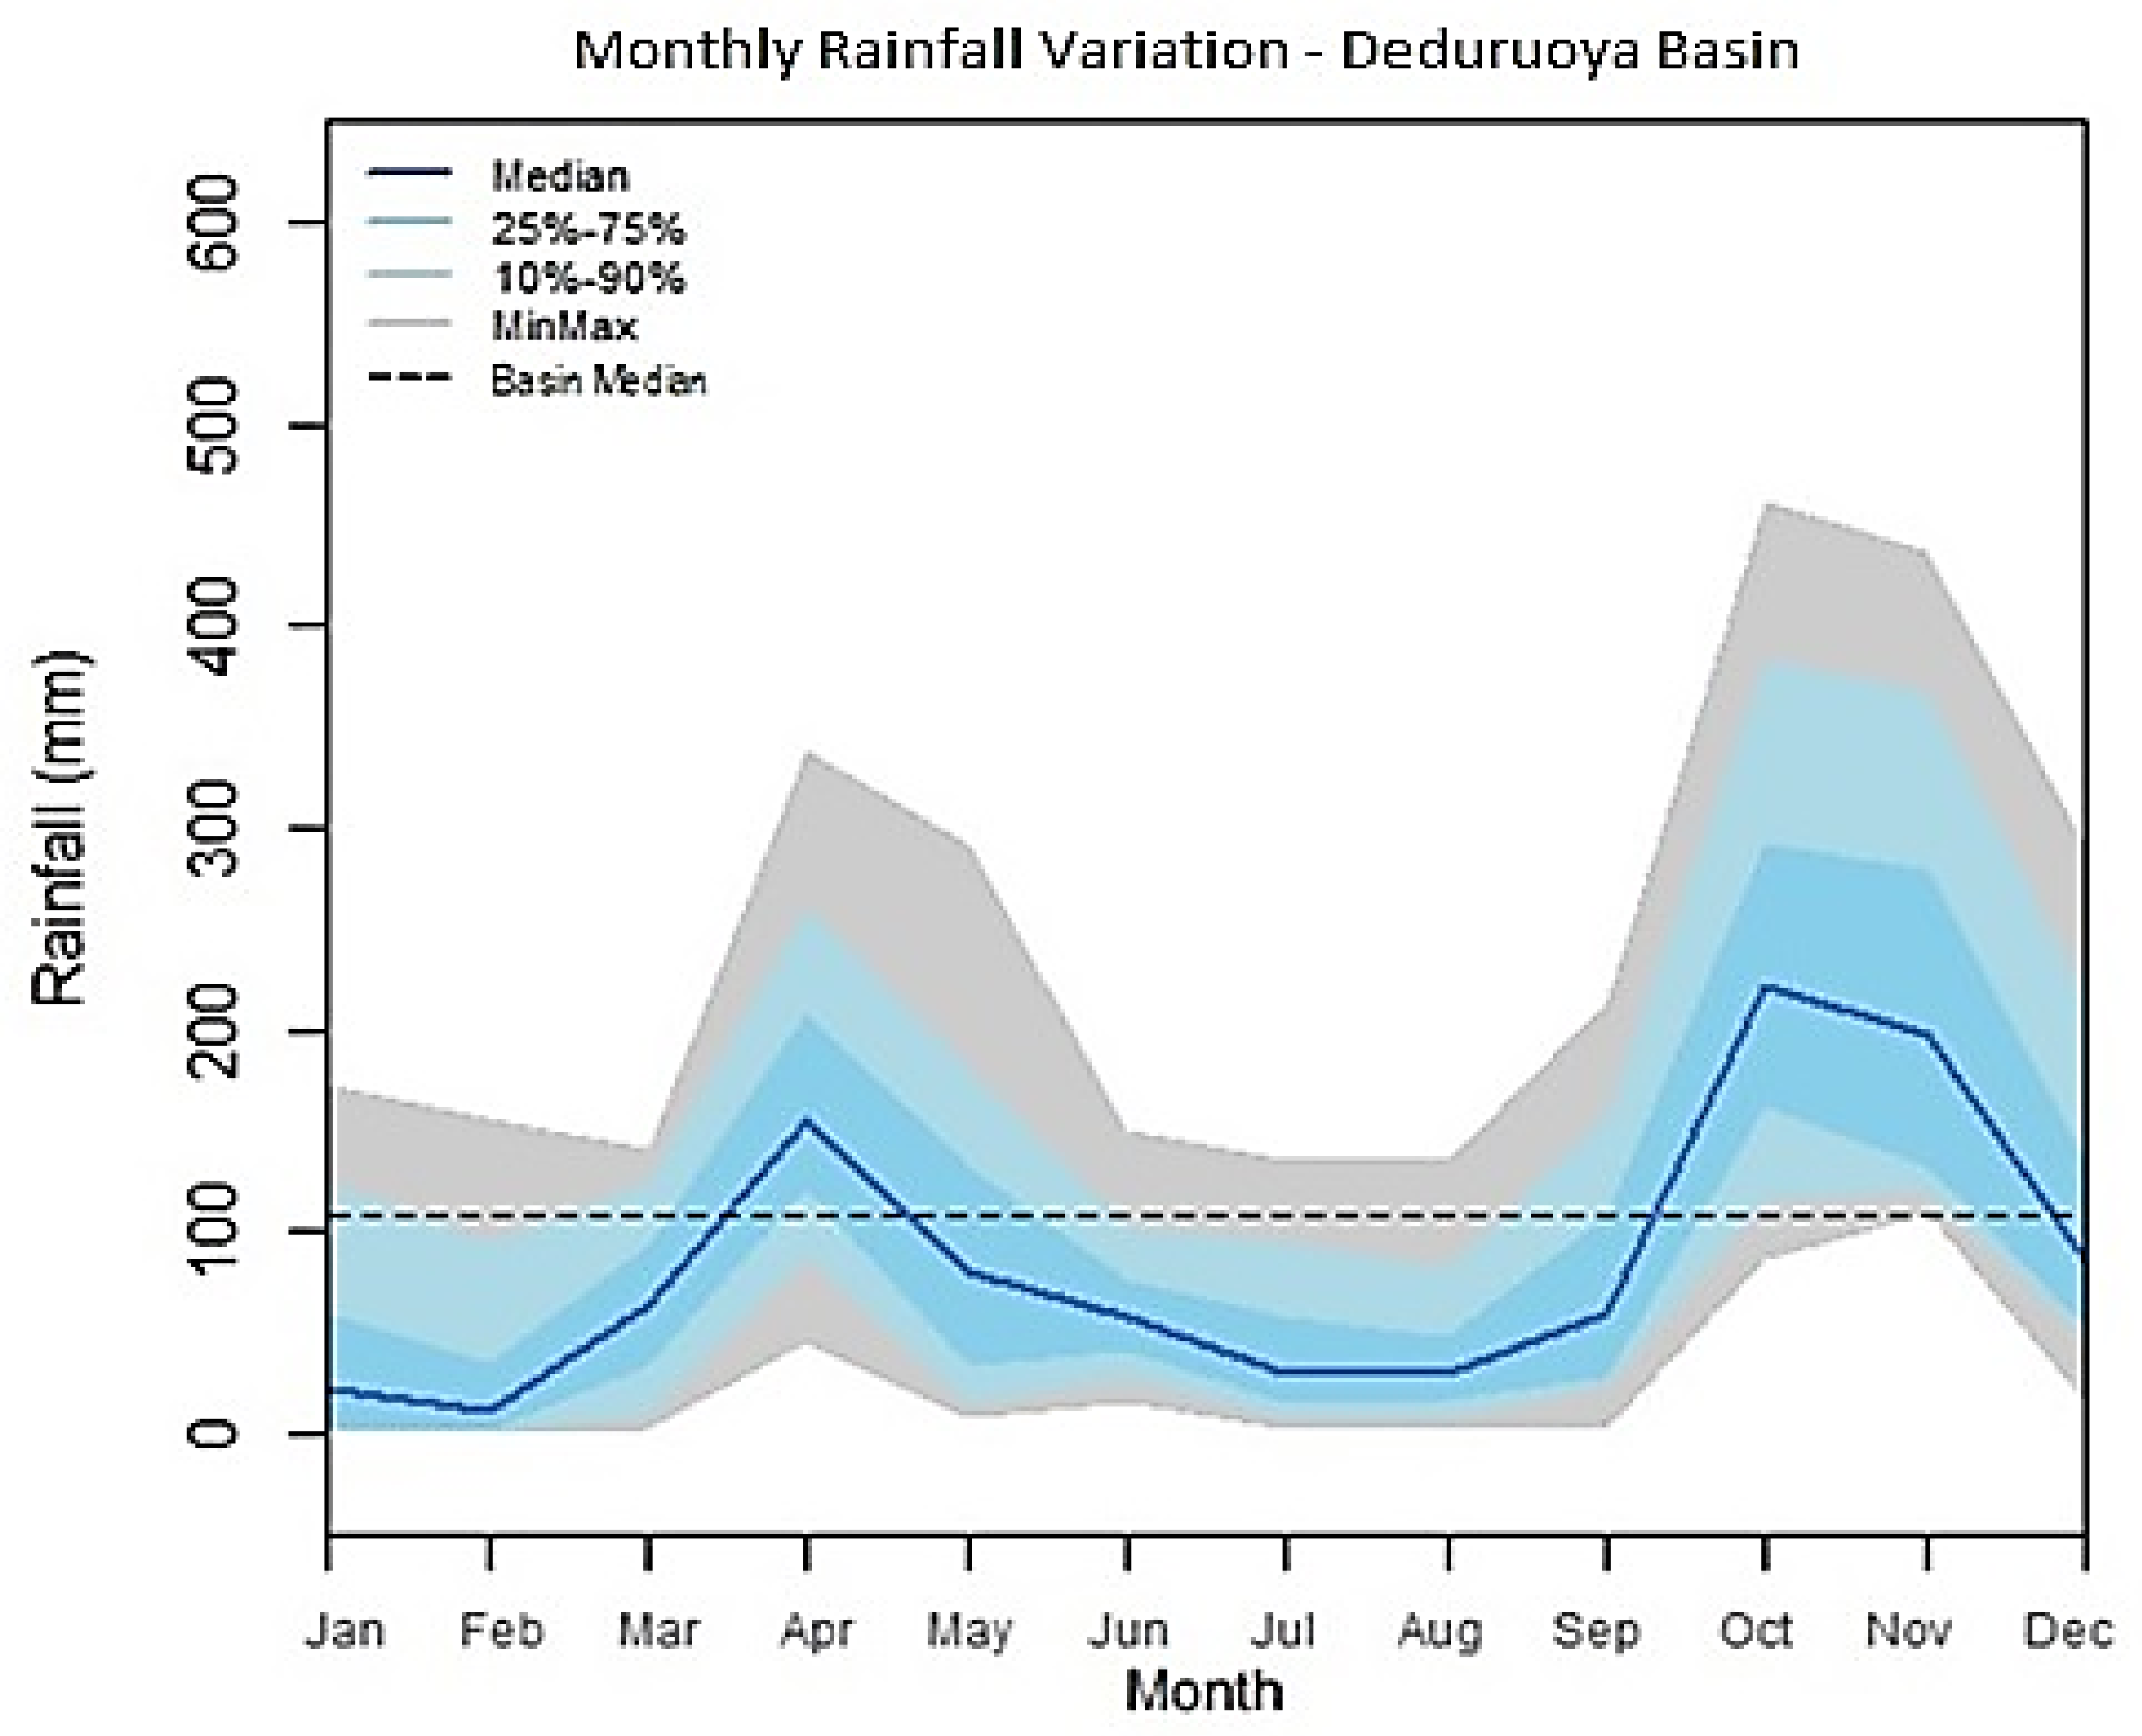
Figure 7.
Trend of annual rainfalls in the Deduru Oya basin.
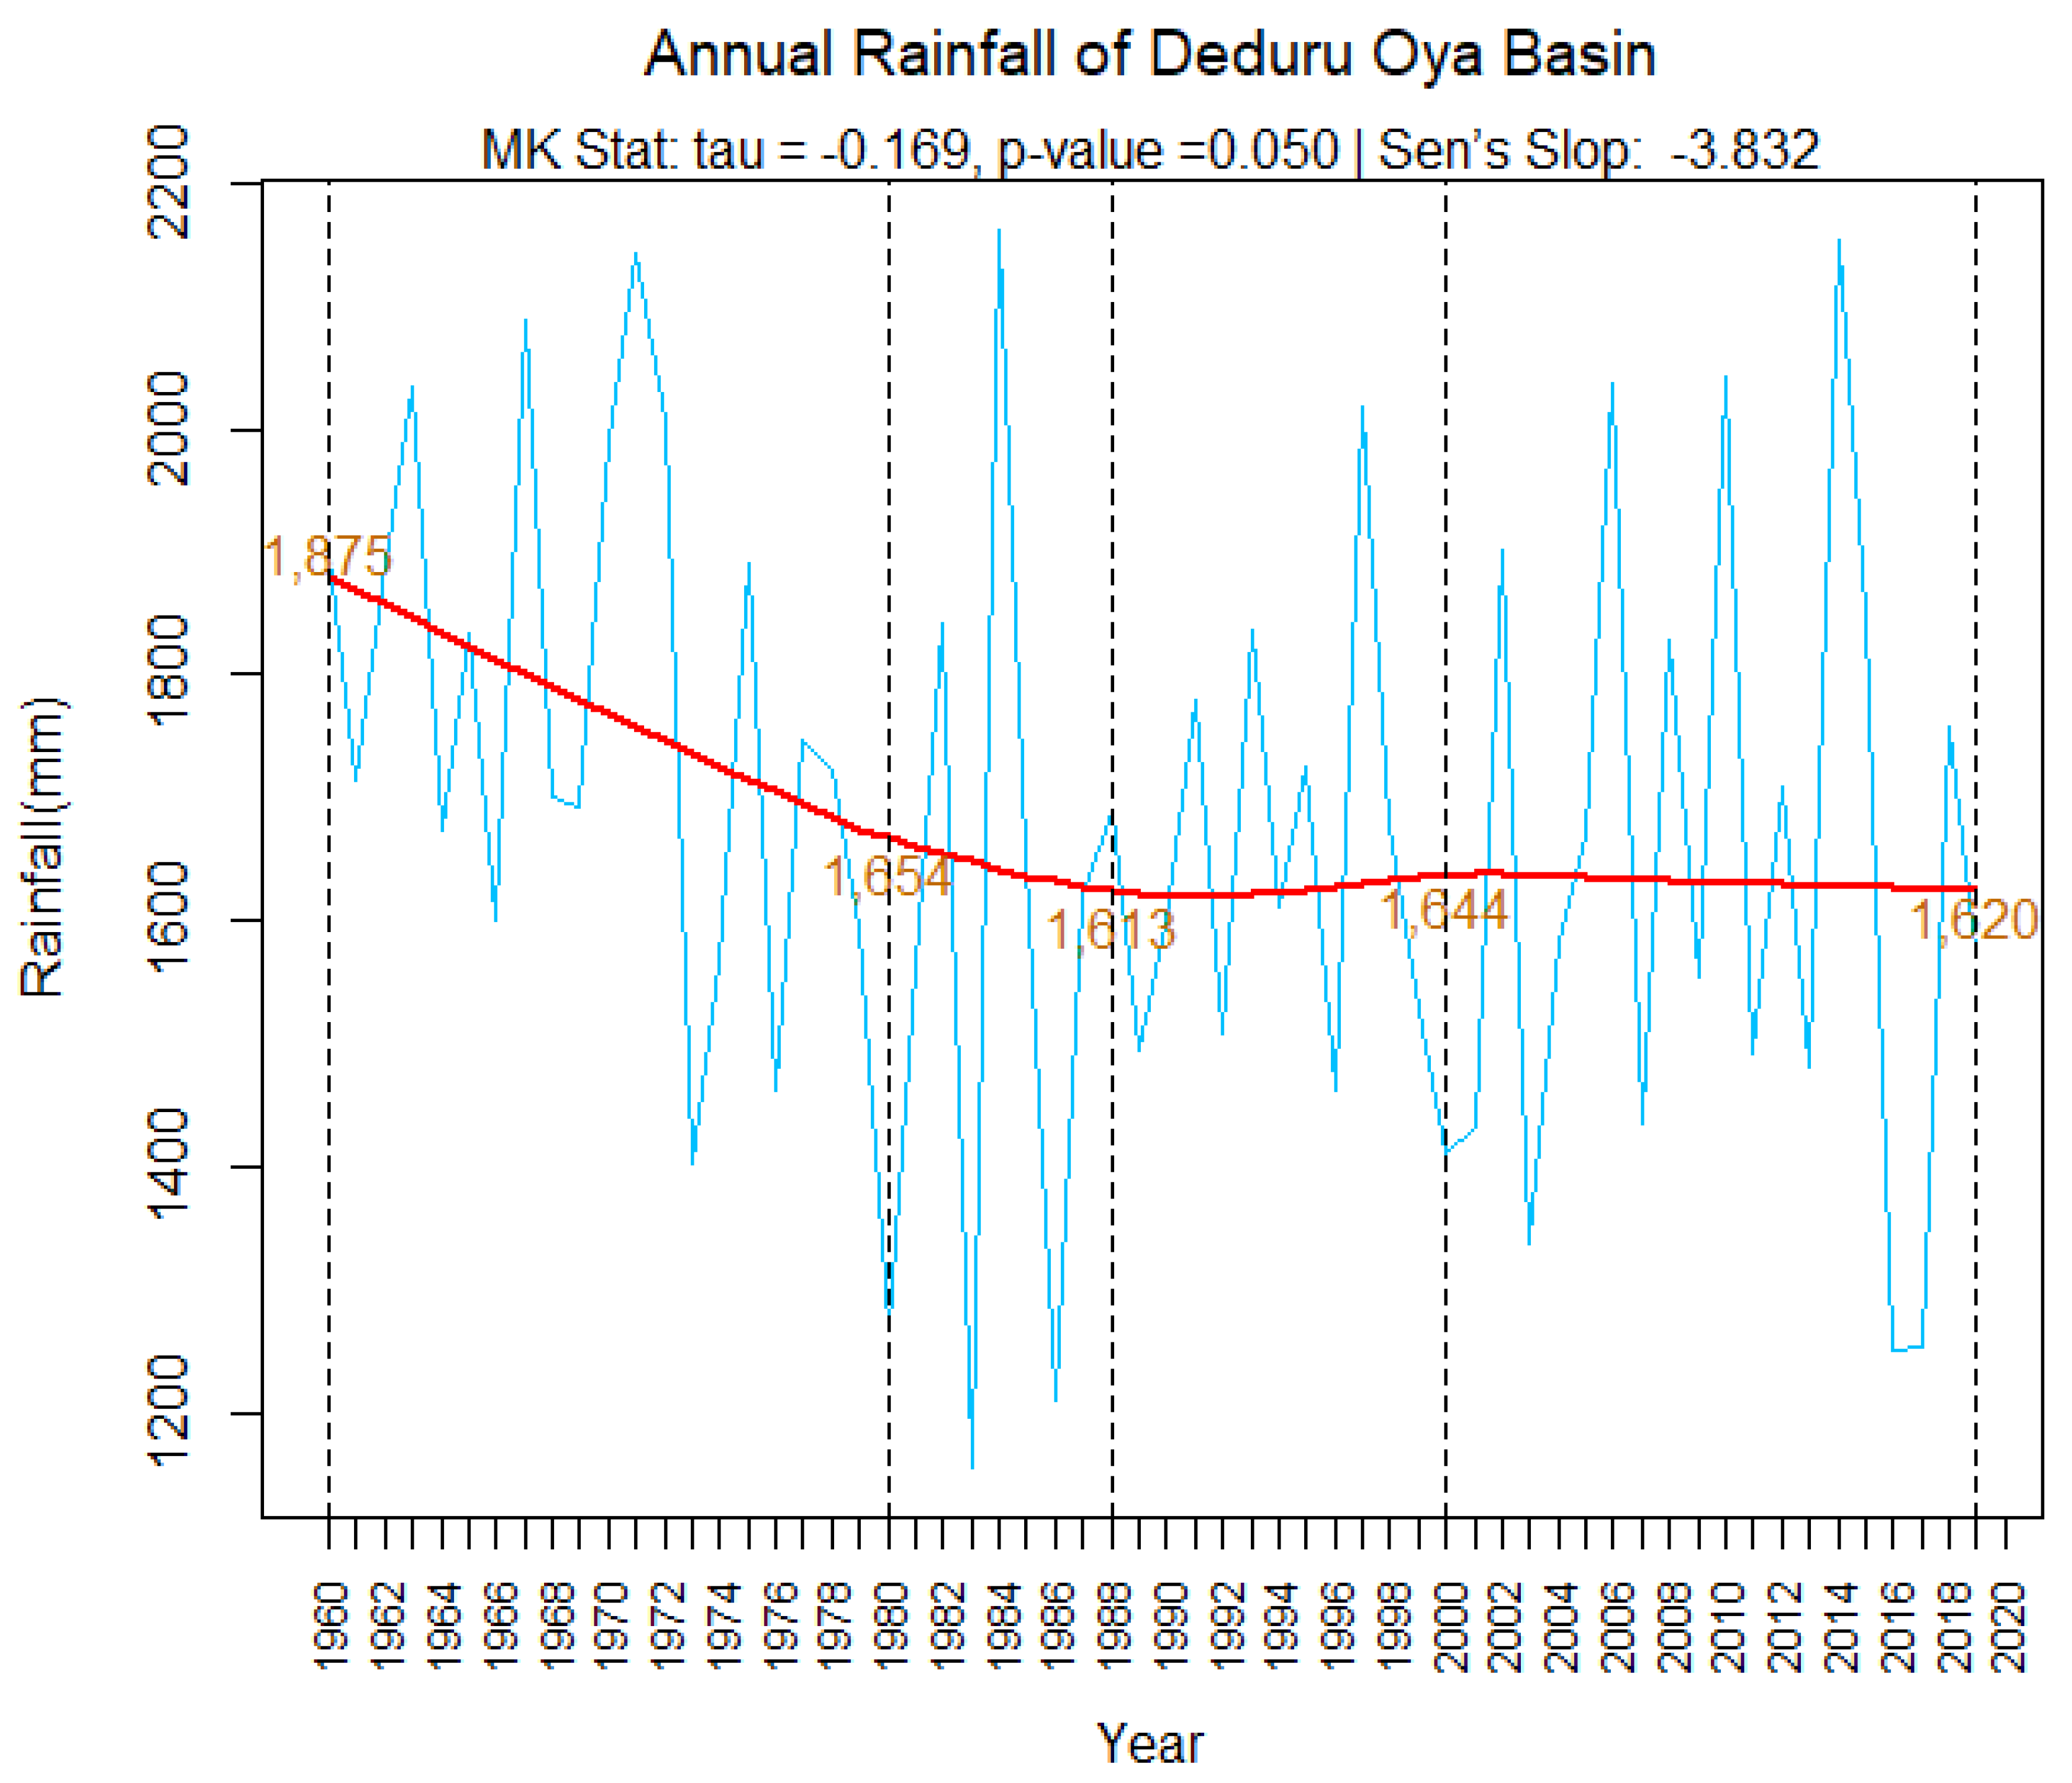
Figure 8.
Decadal variation of rainfall in Deduru Oya basin.
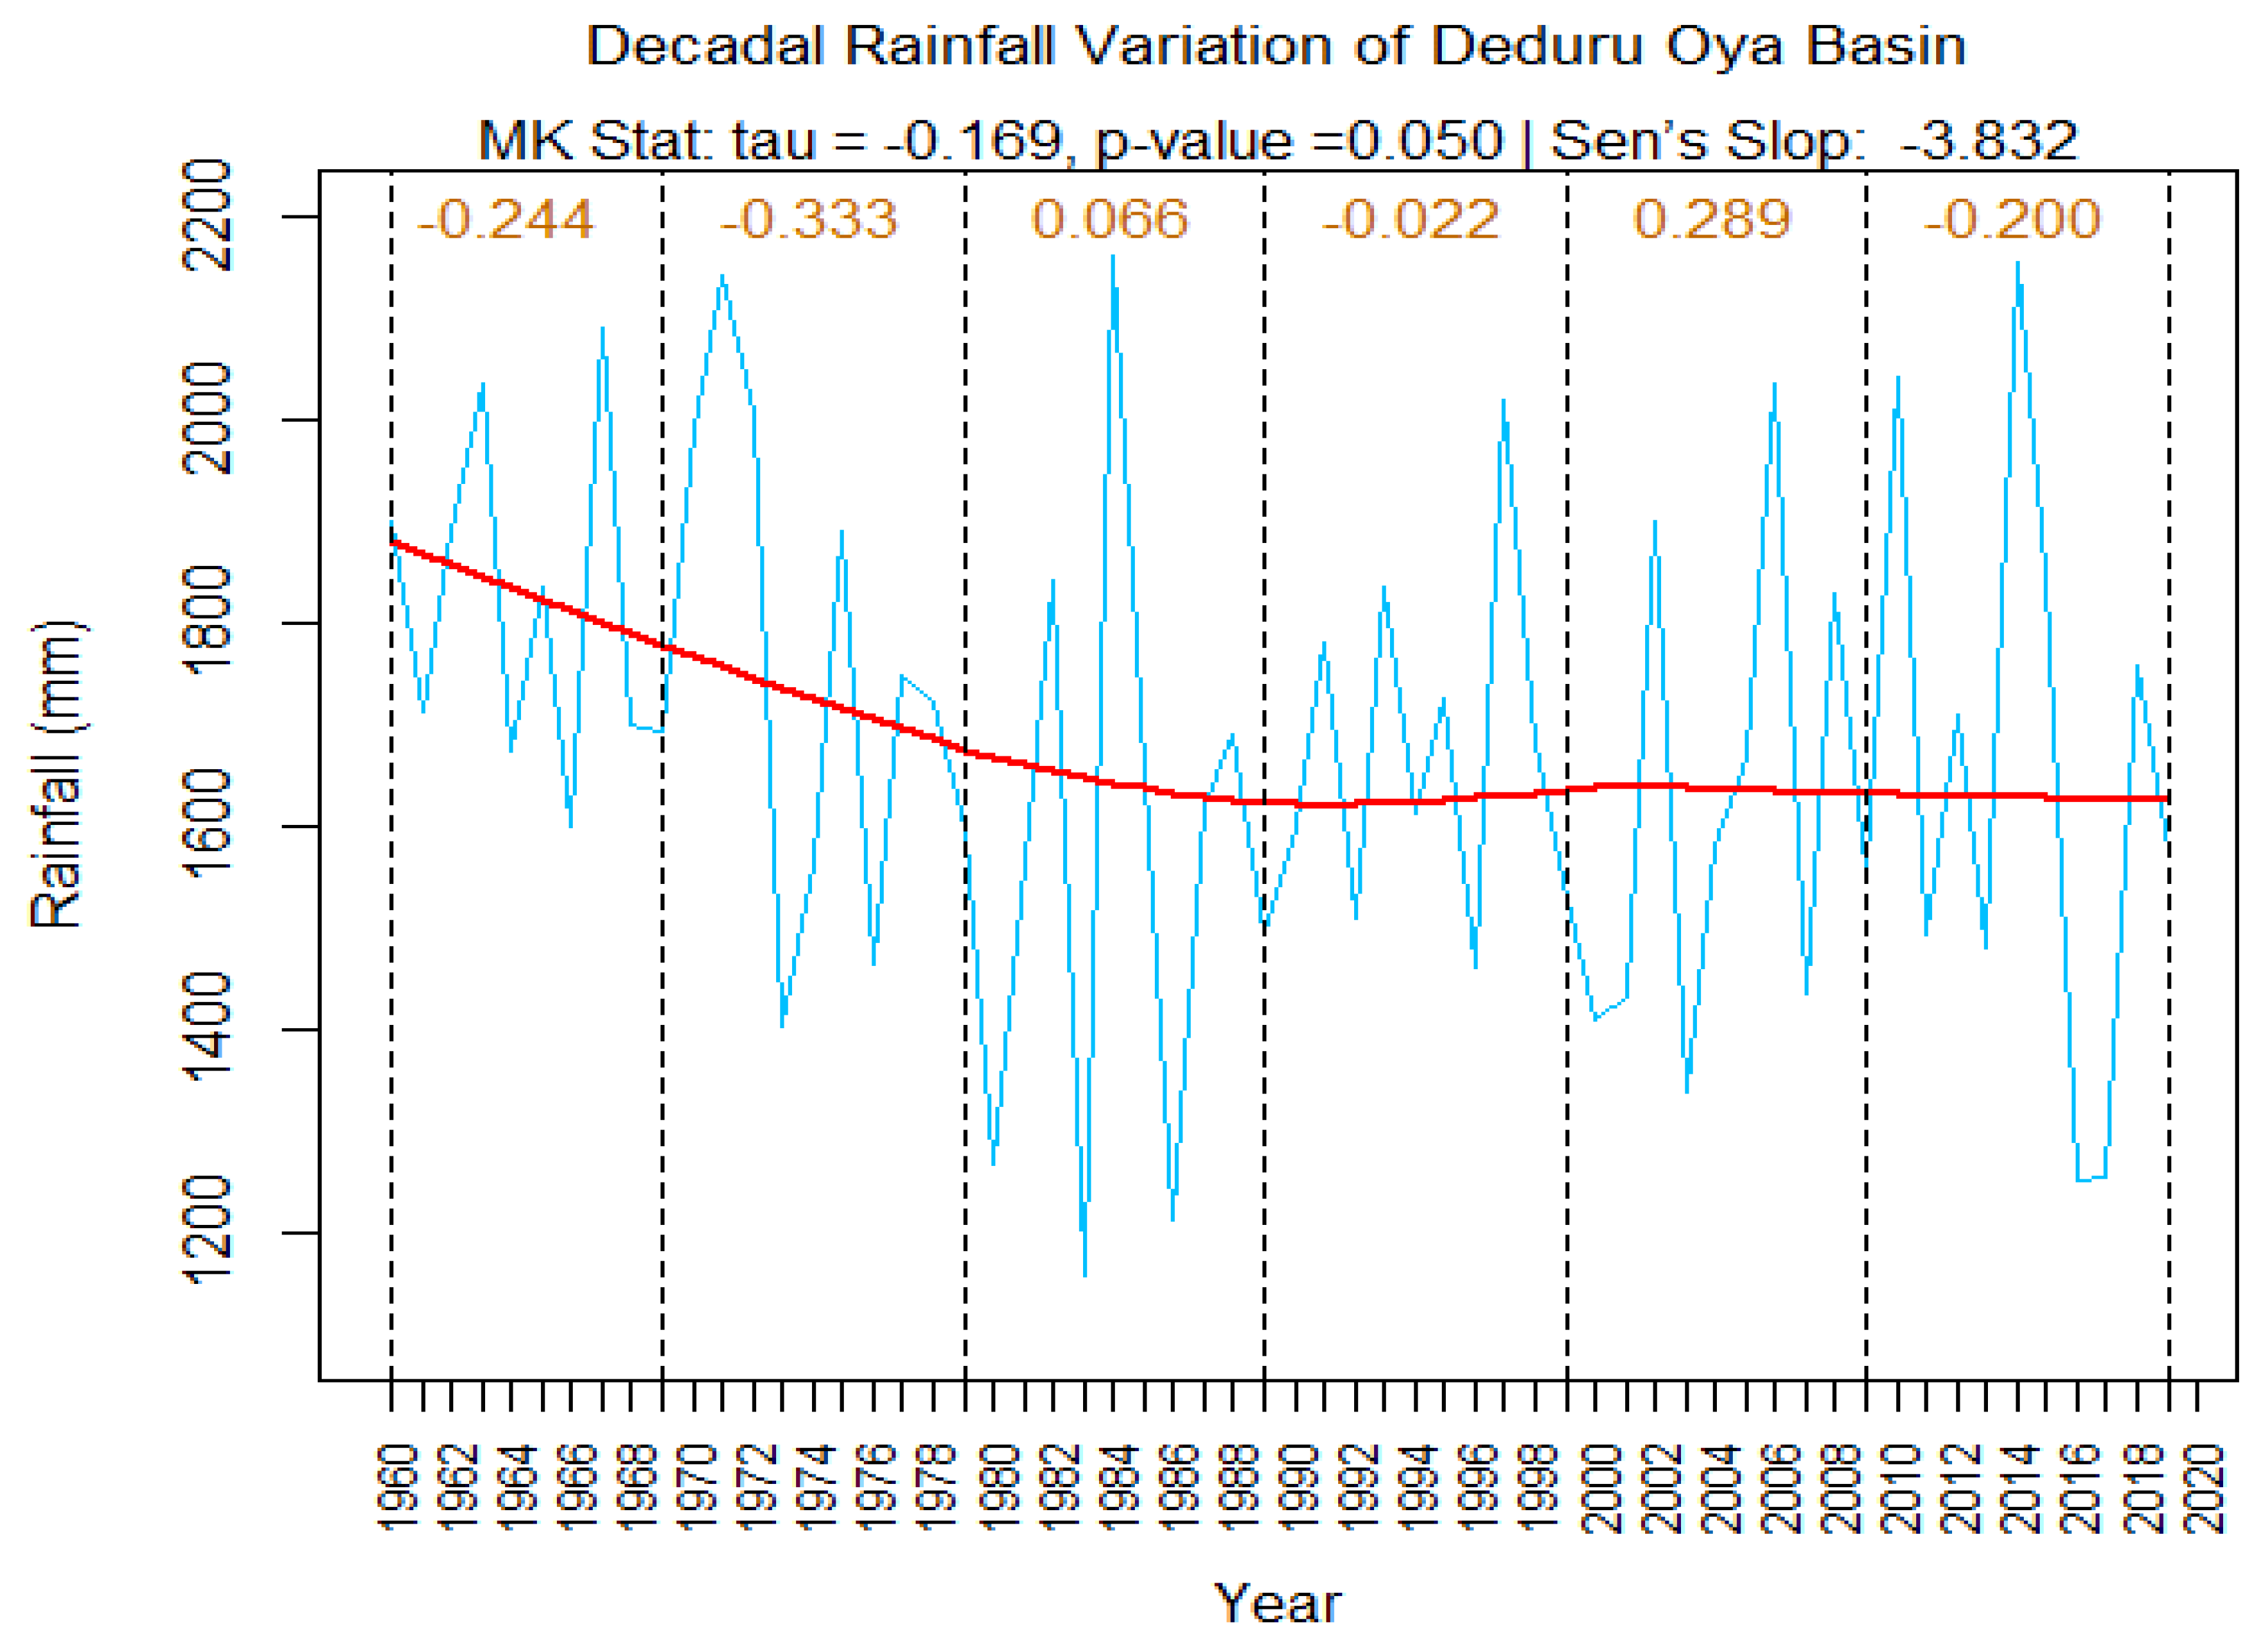
Figure 9.
Decadal Mean rainfall and Coefficient of Variance of rainfall.
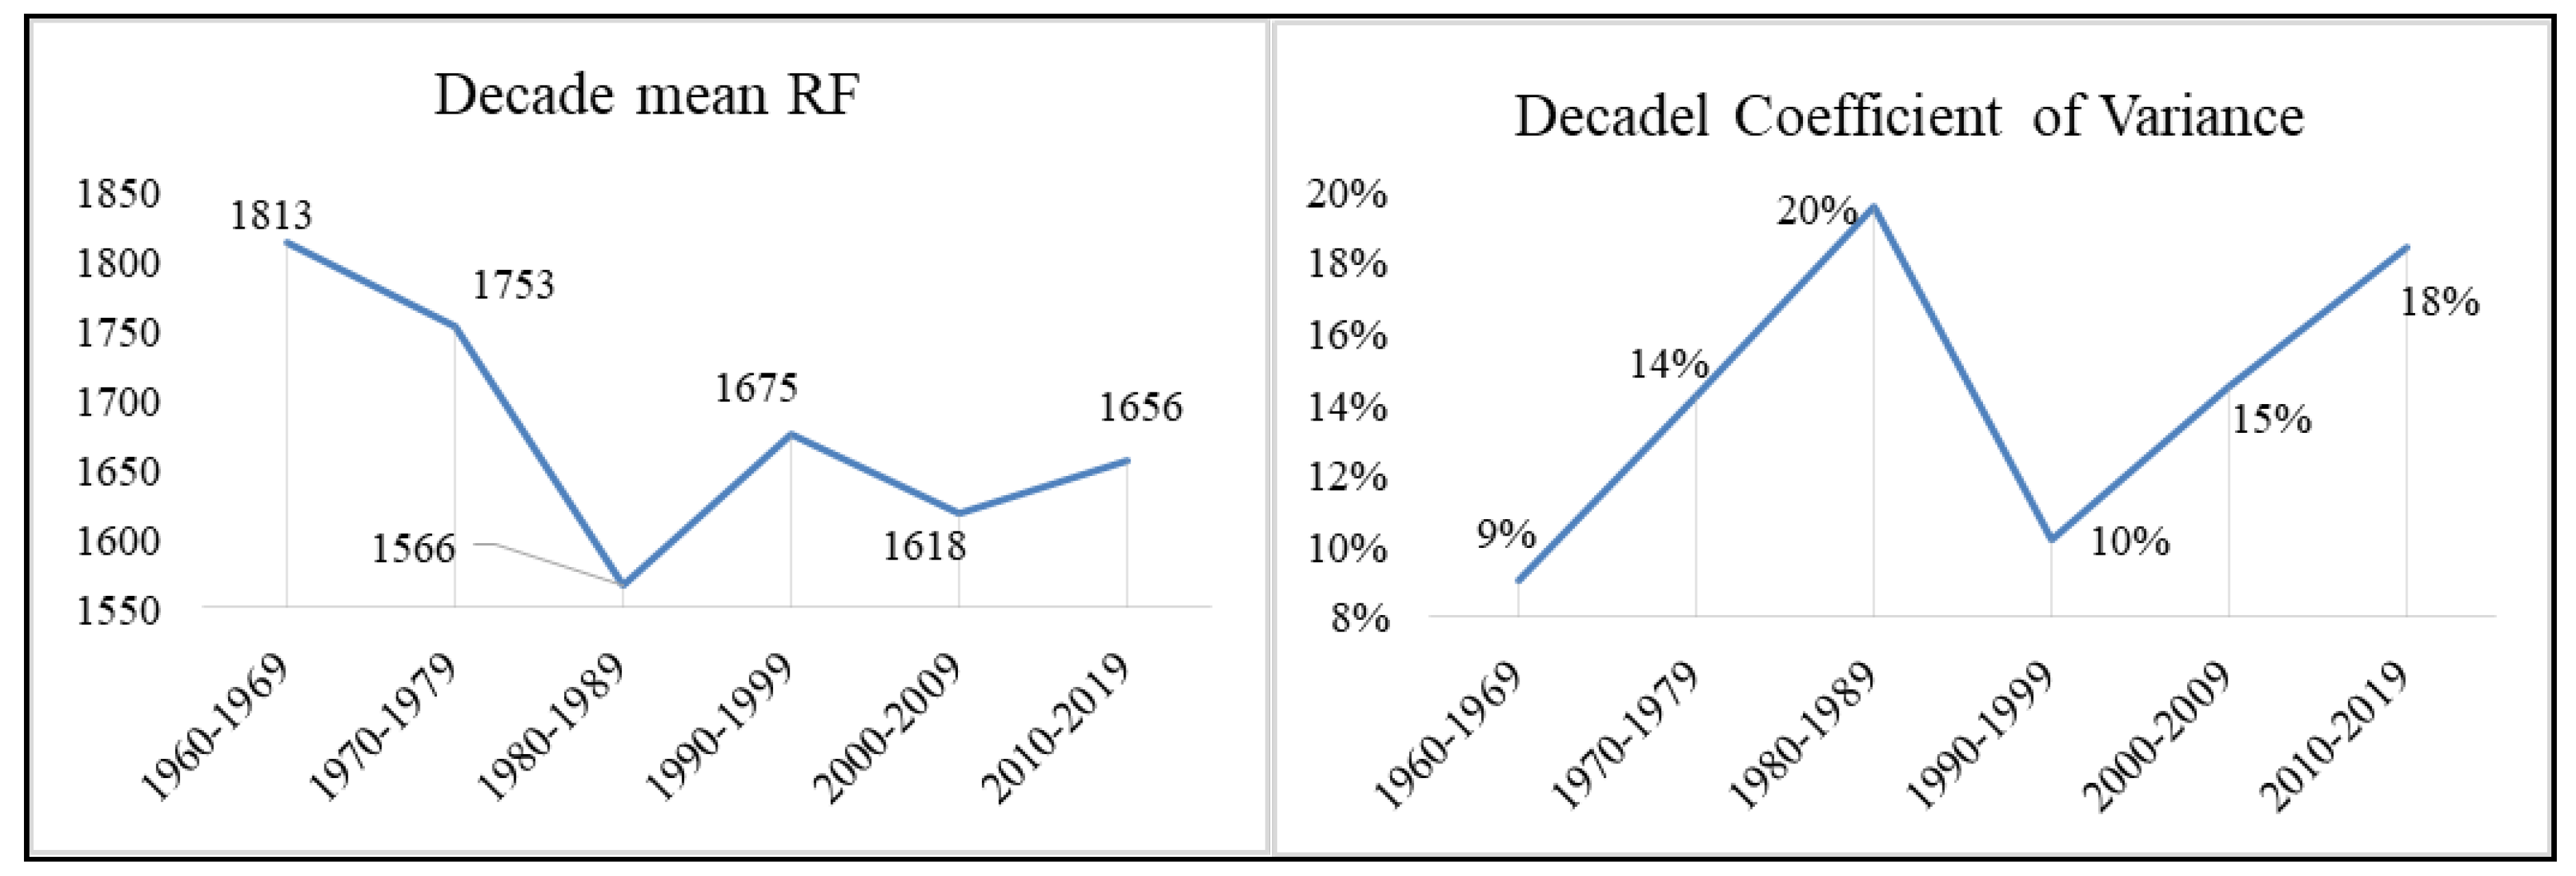
Figure 10.
Seasonal rainfall in Deduru Oya basin.
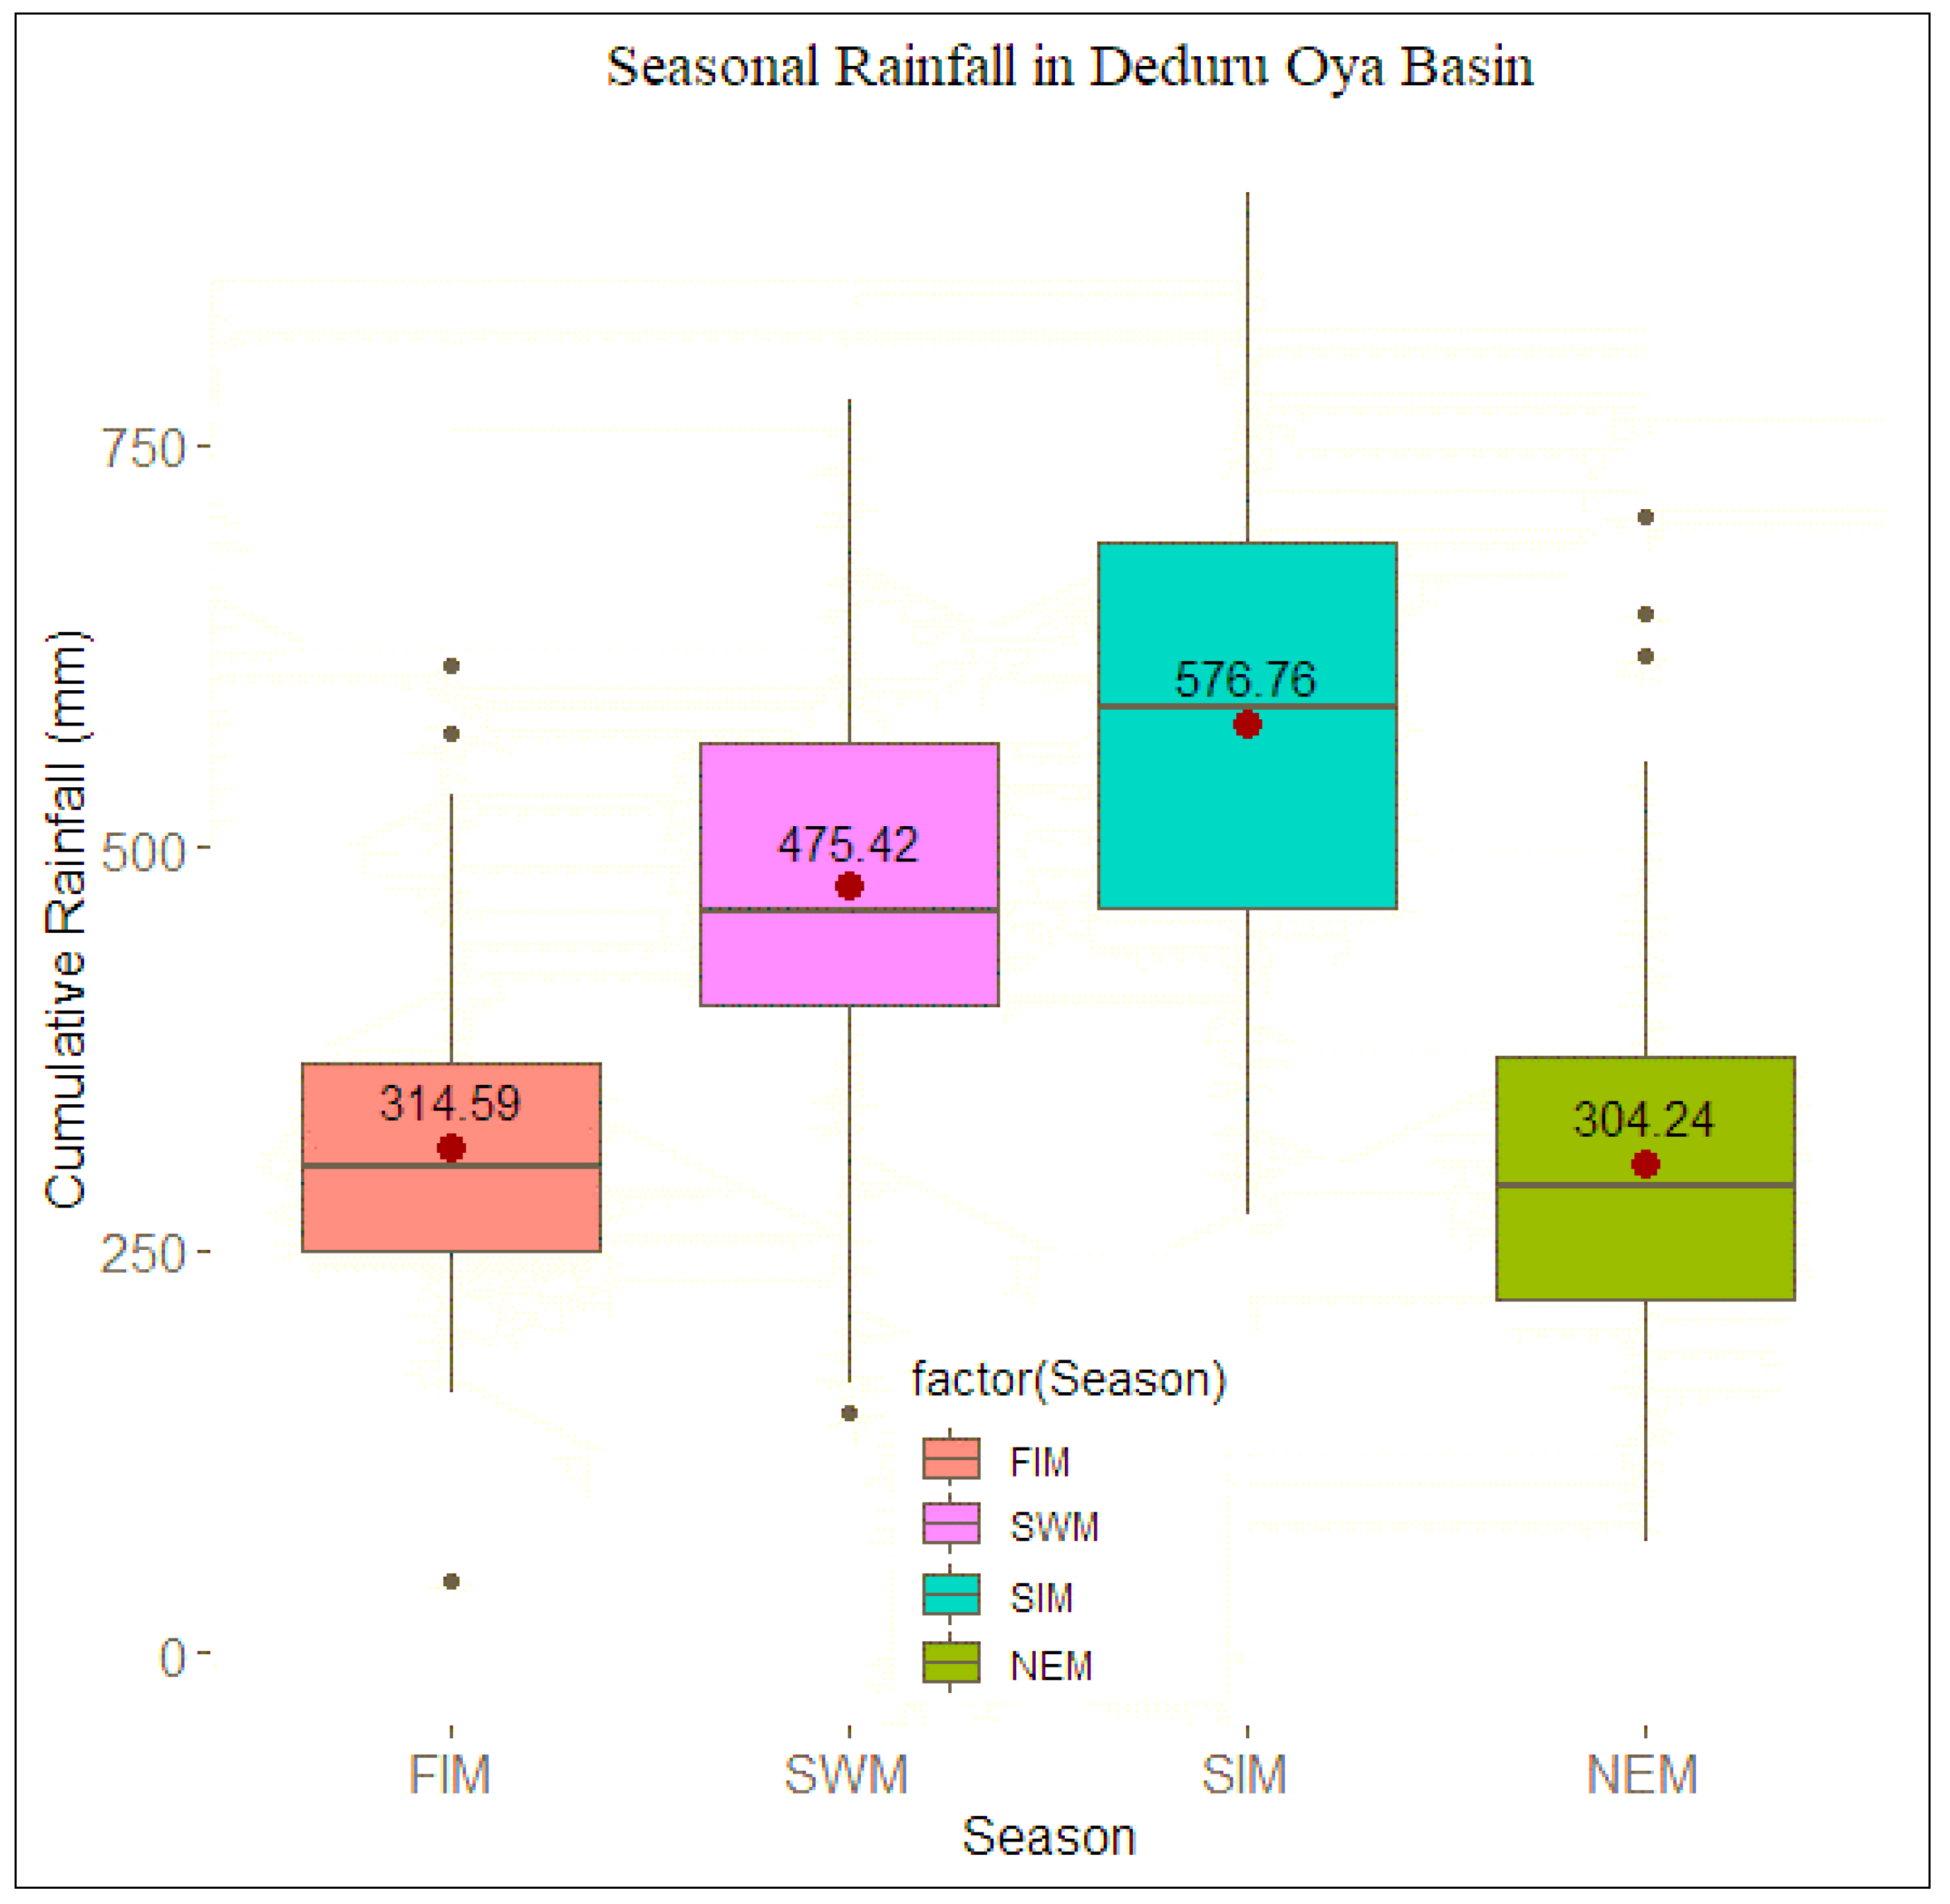
Figure 11.
Rainfall trend in FIM.
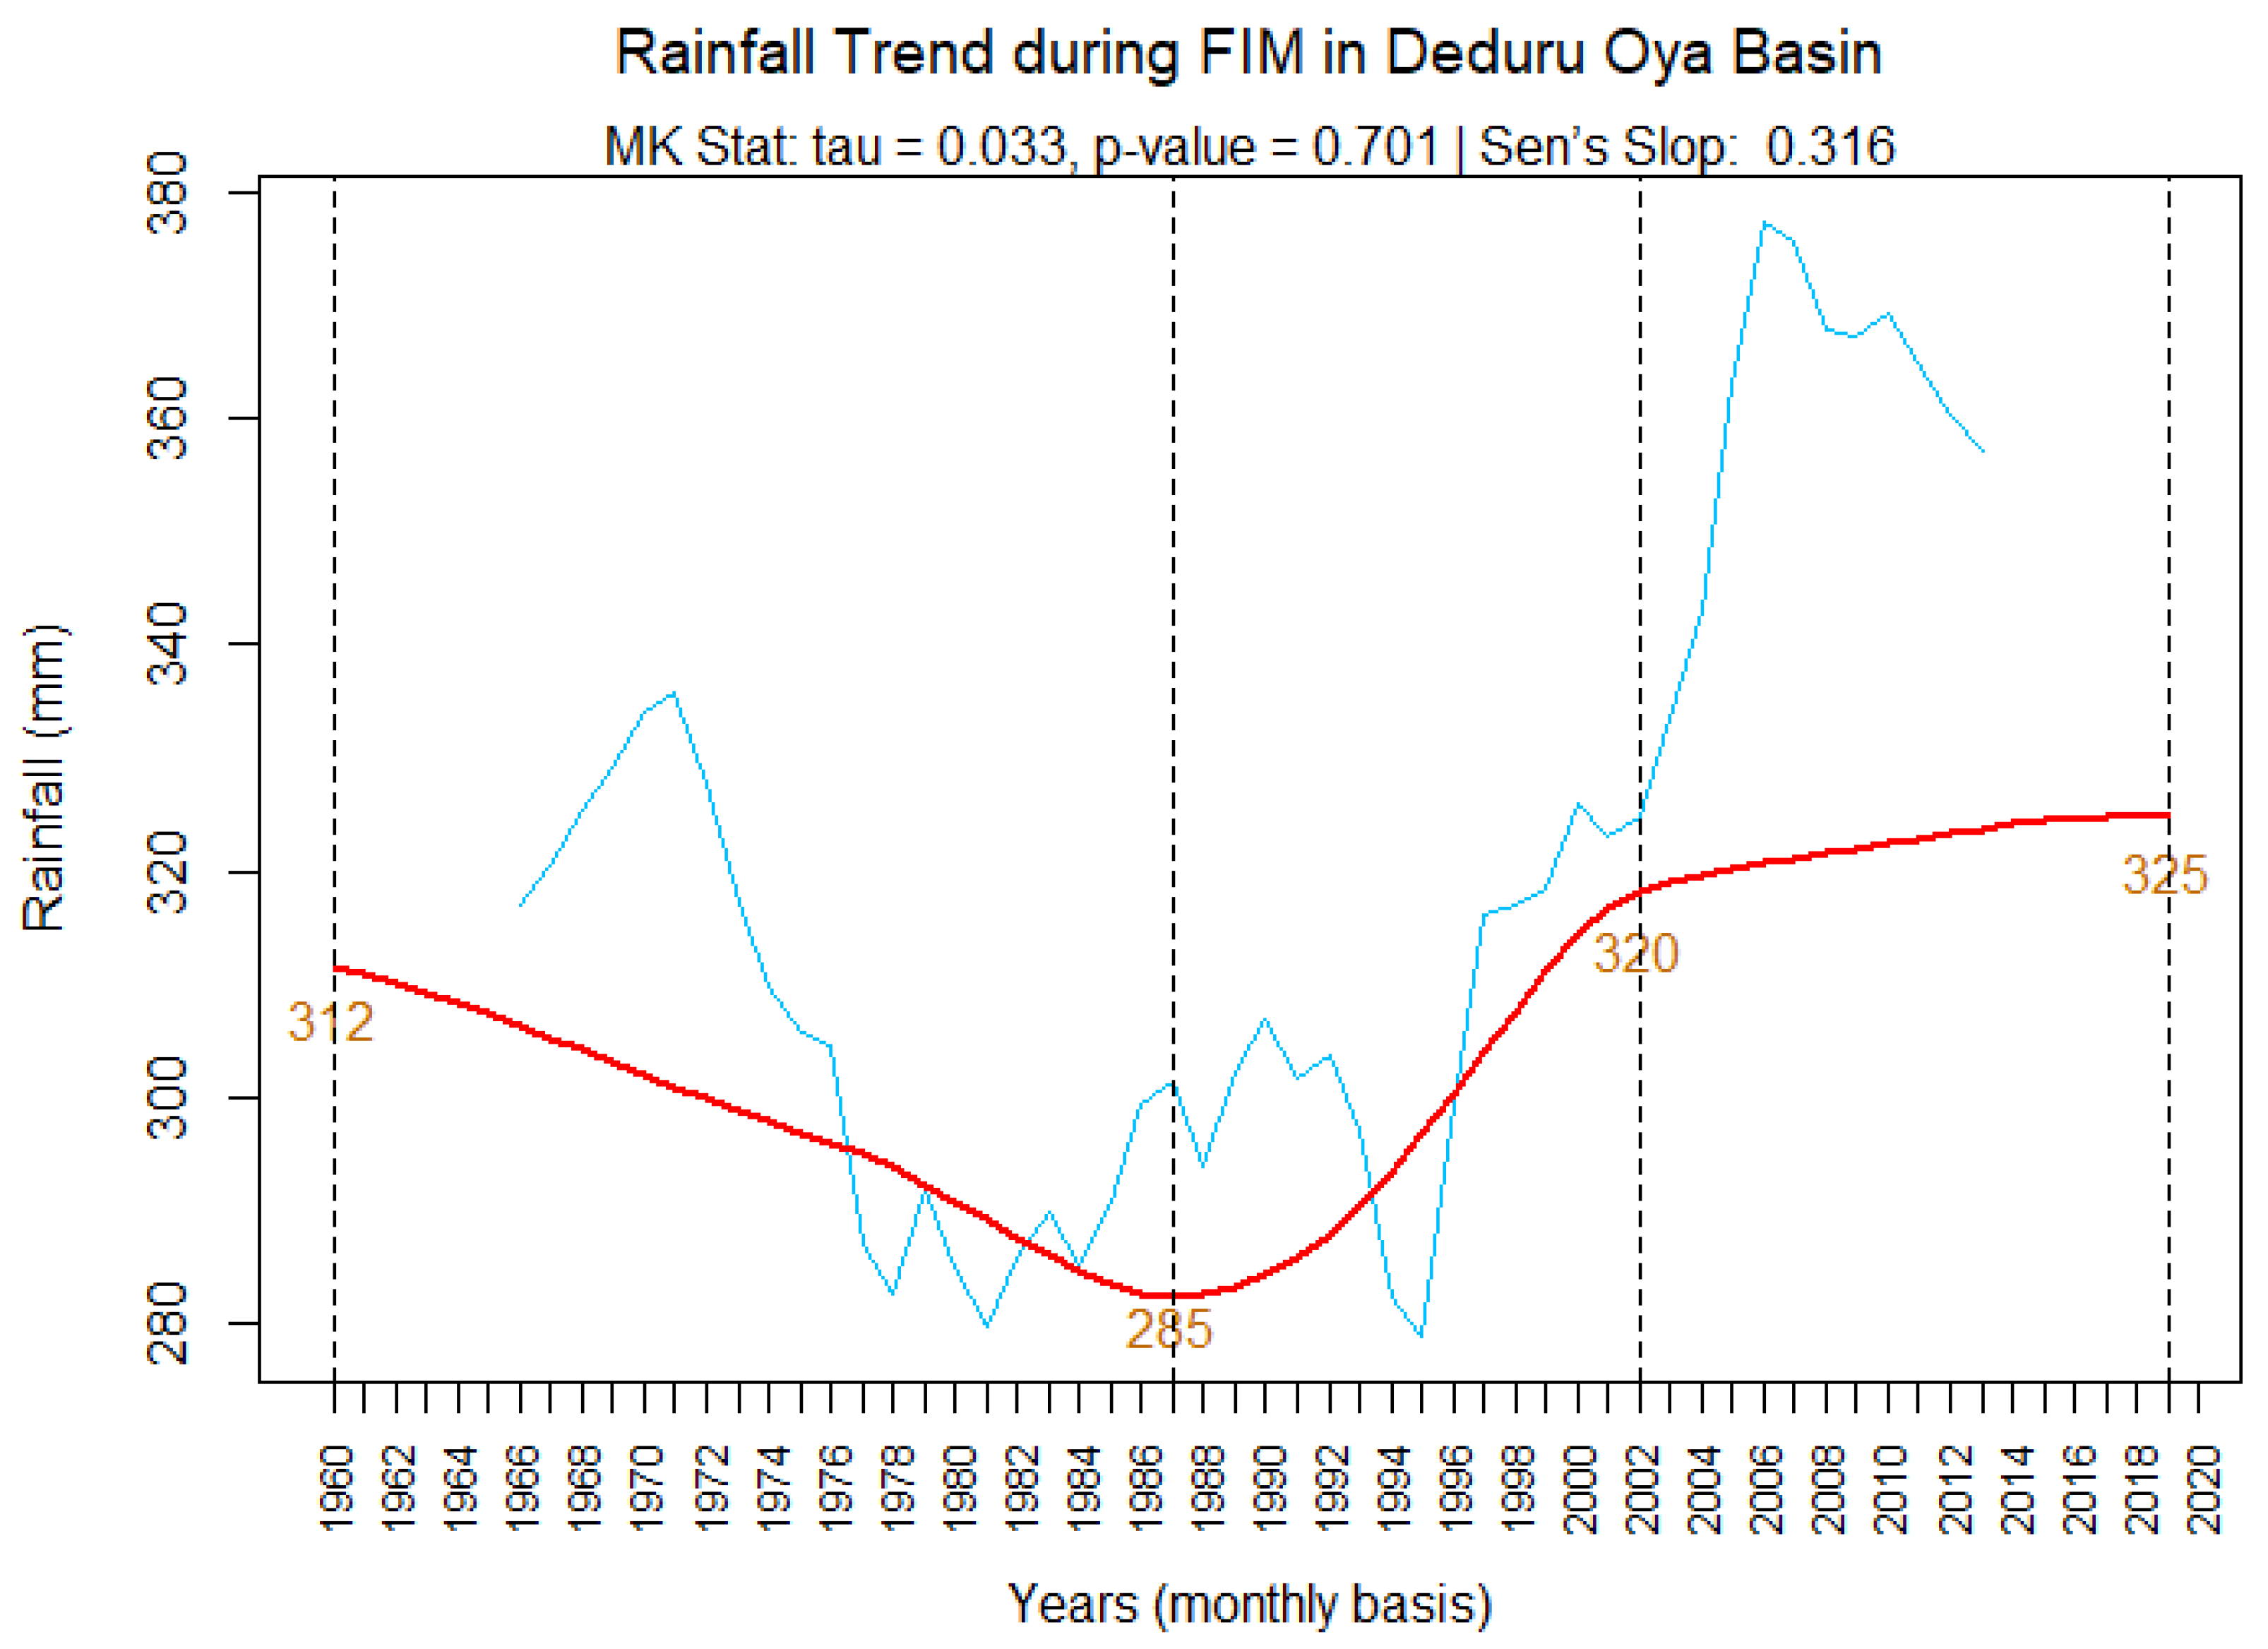
Figure 12.
Rainfall trend SWM.
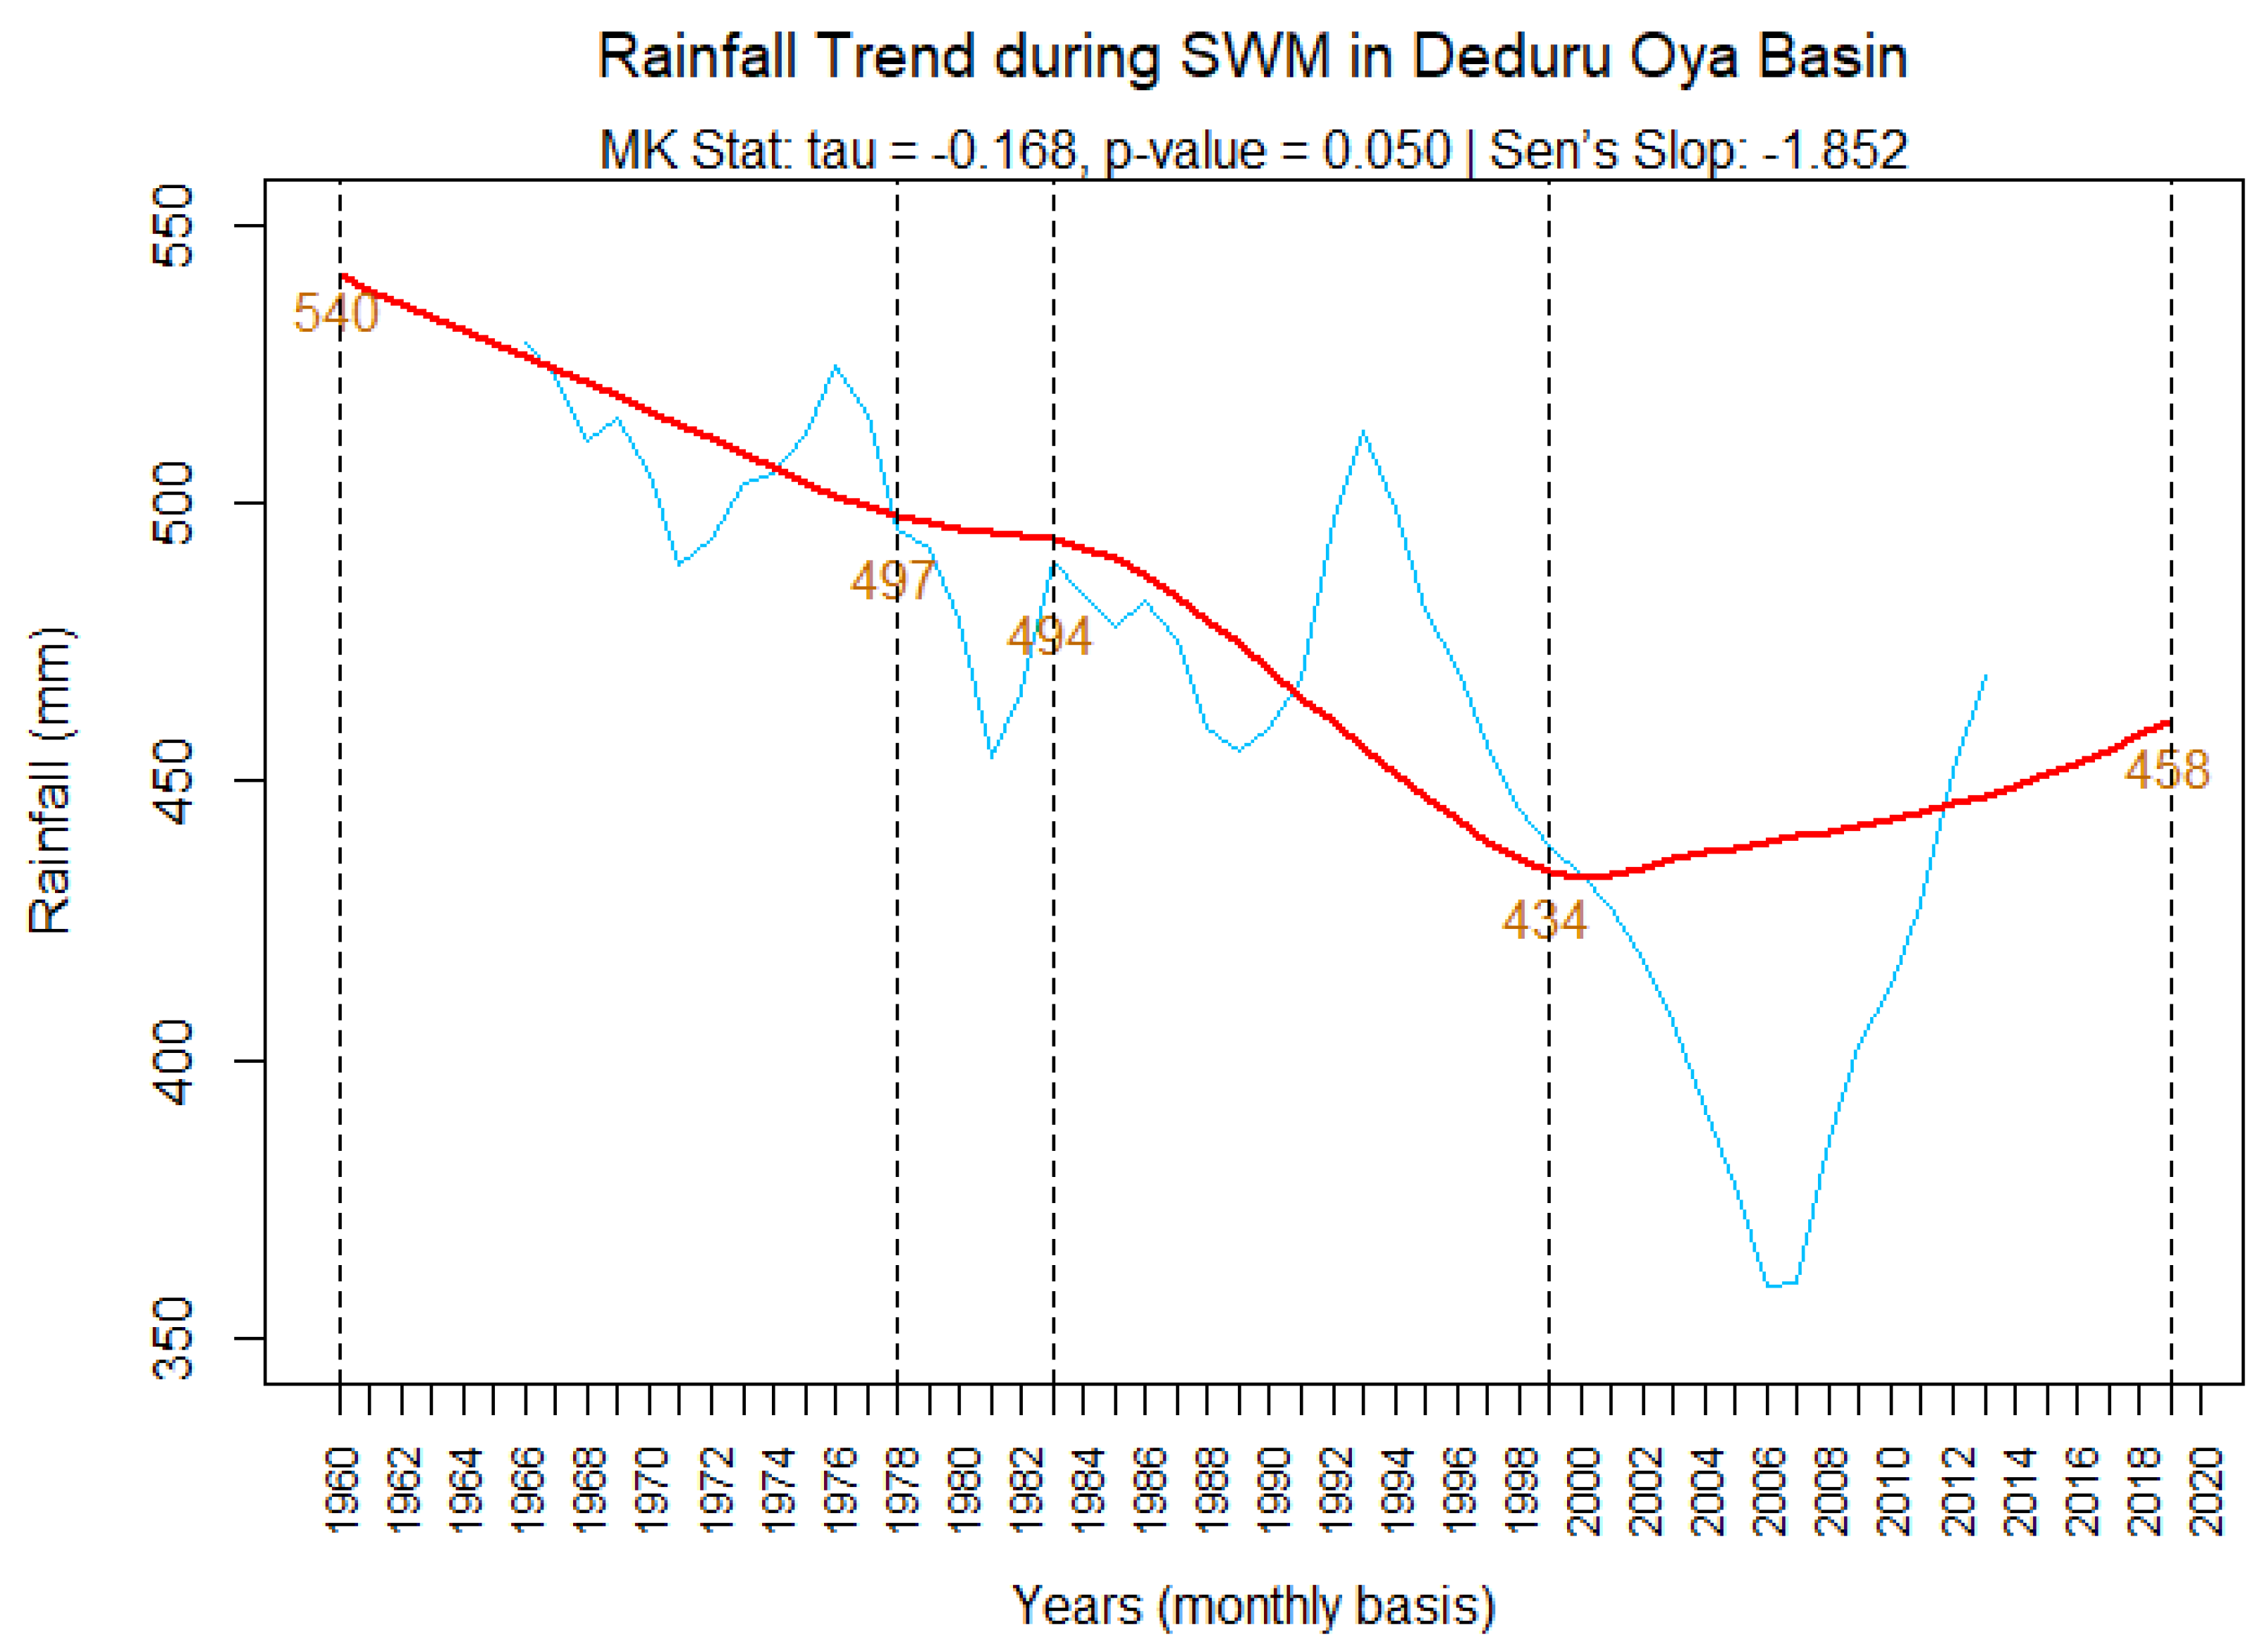
Figure 13.
Rainfall trend SIM.
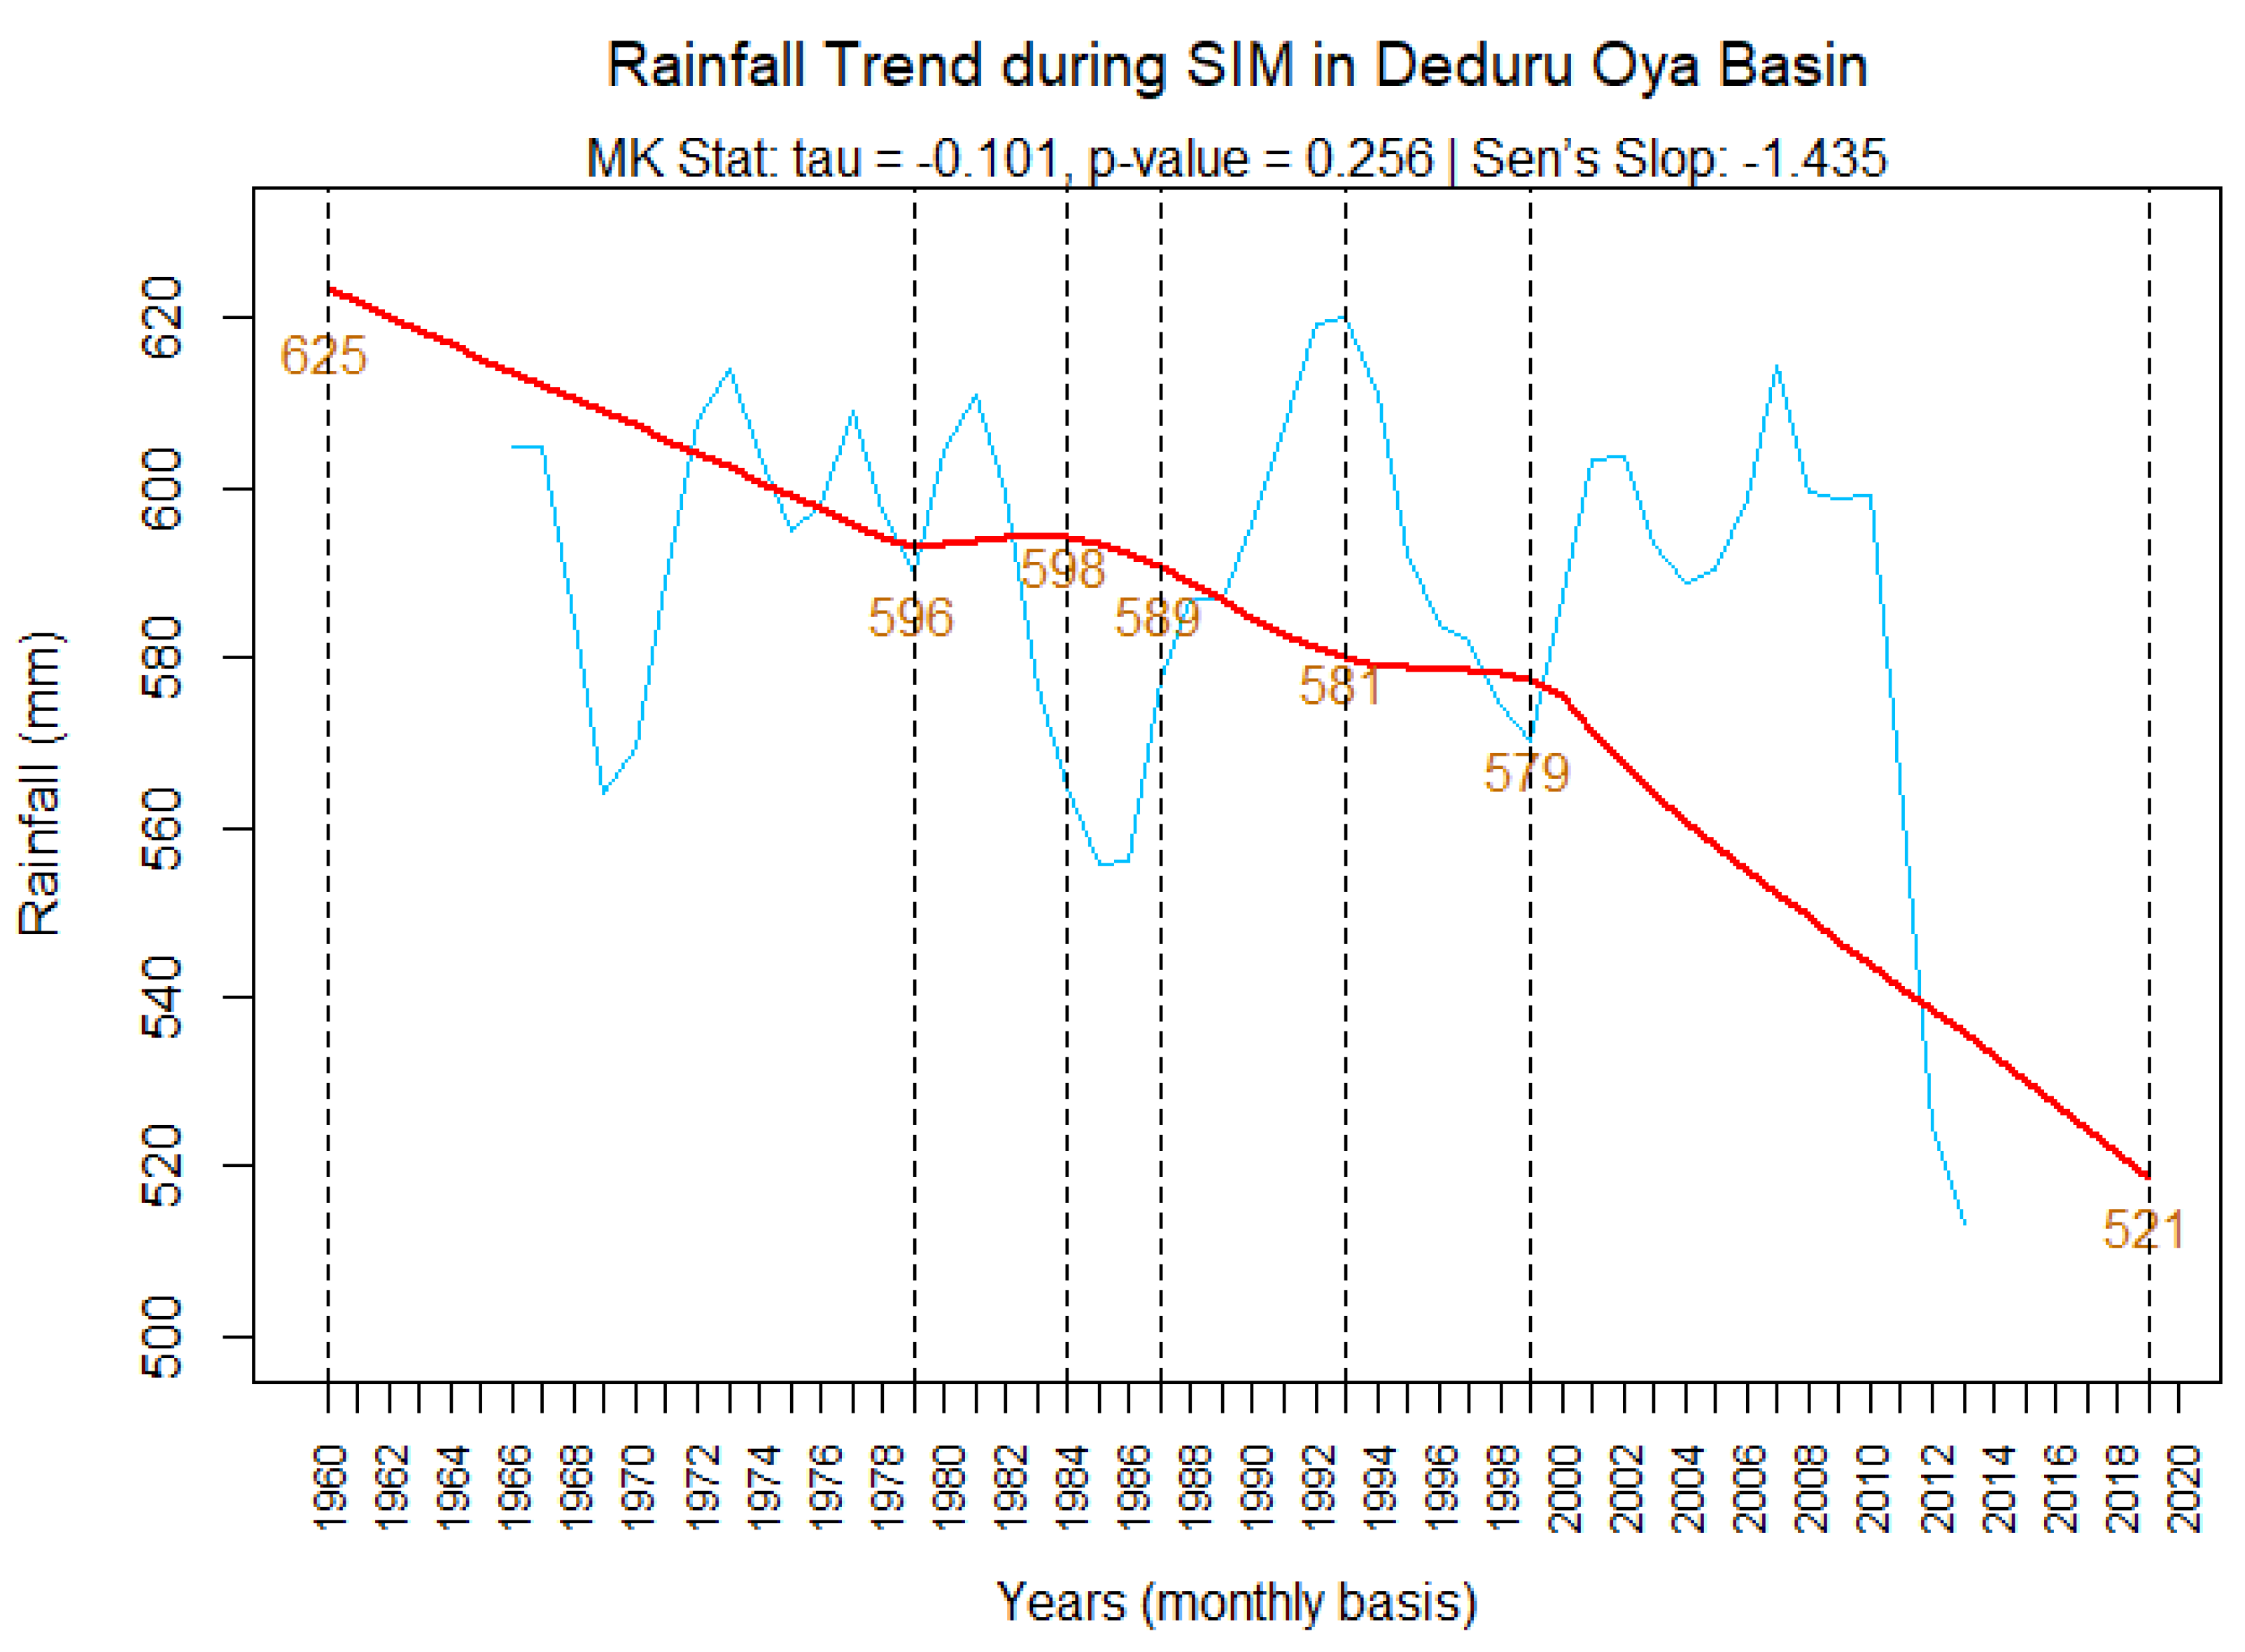
Figure 14.
Rainfall trend in NEM.
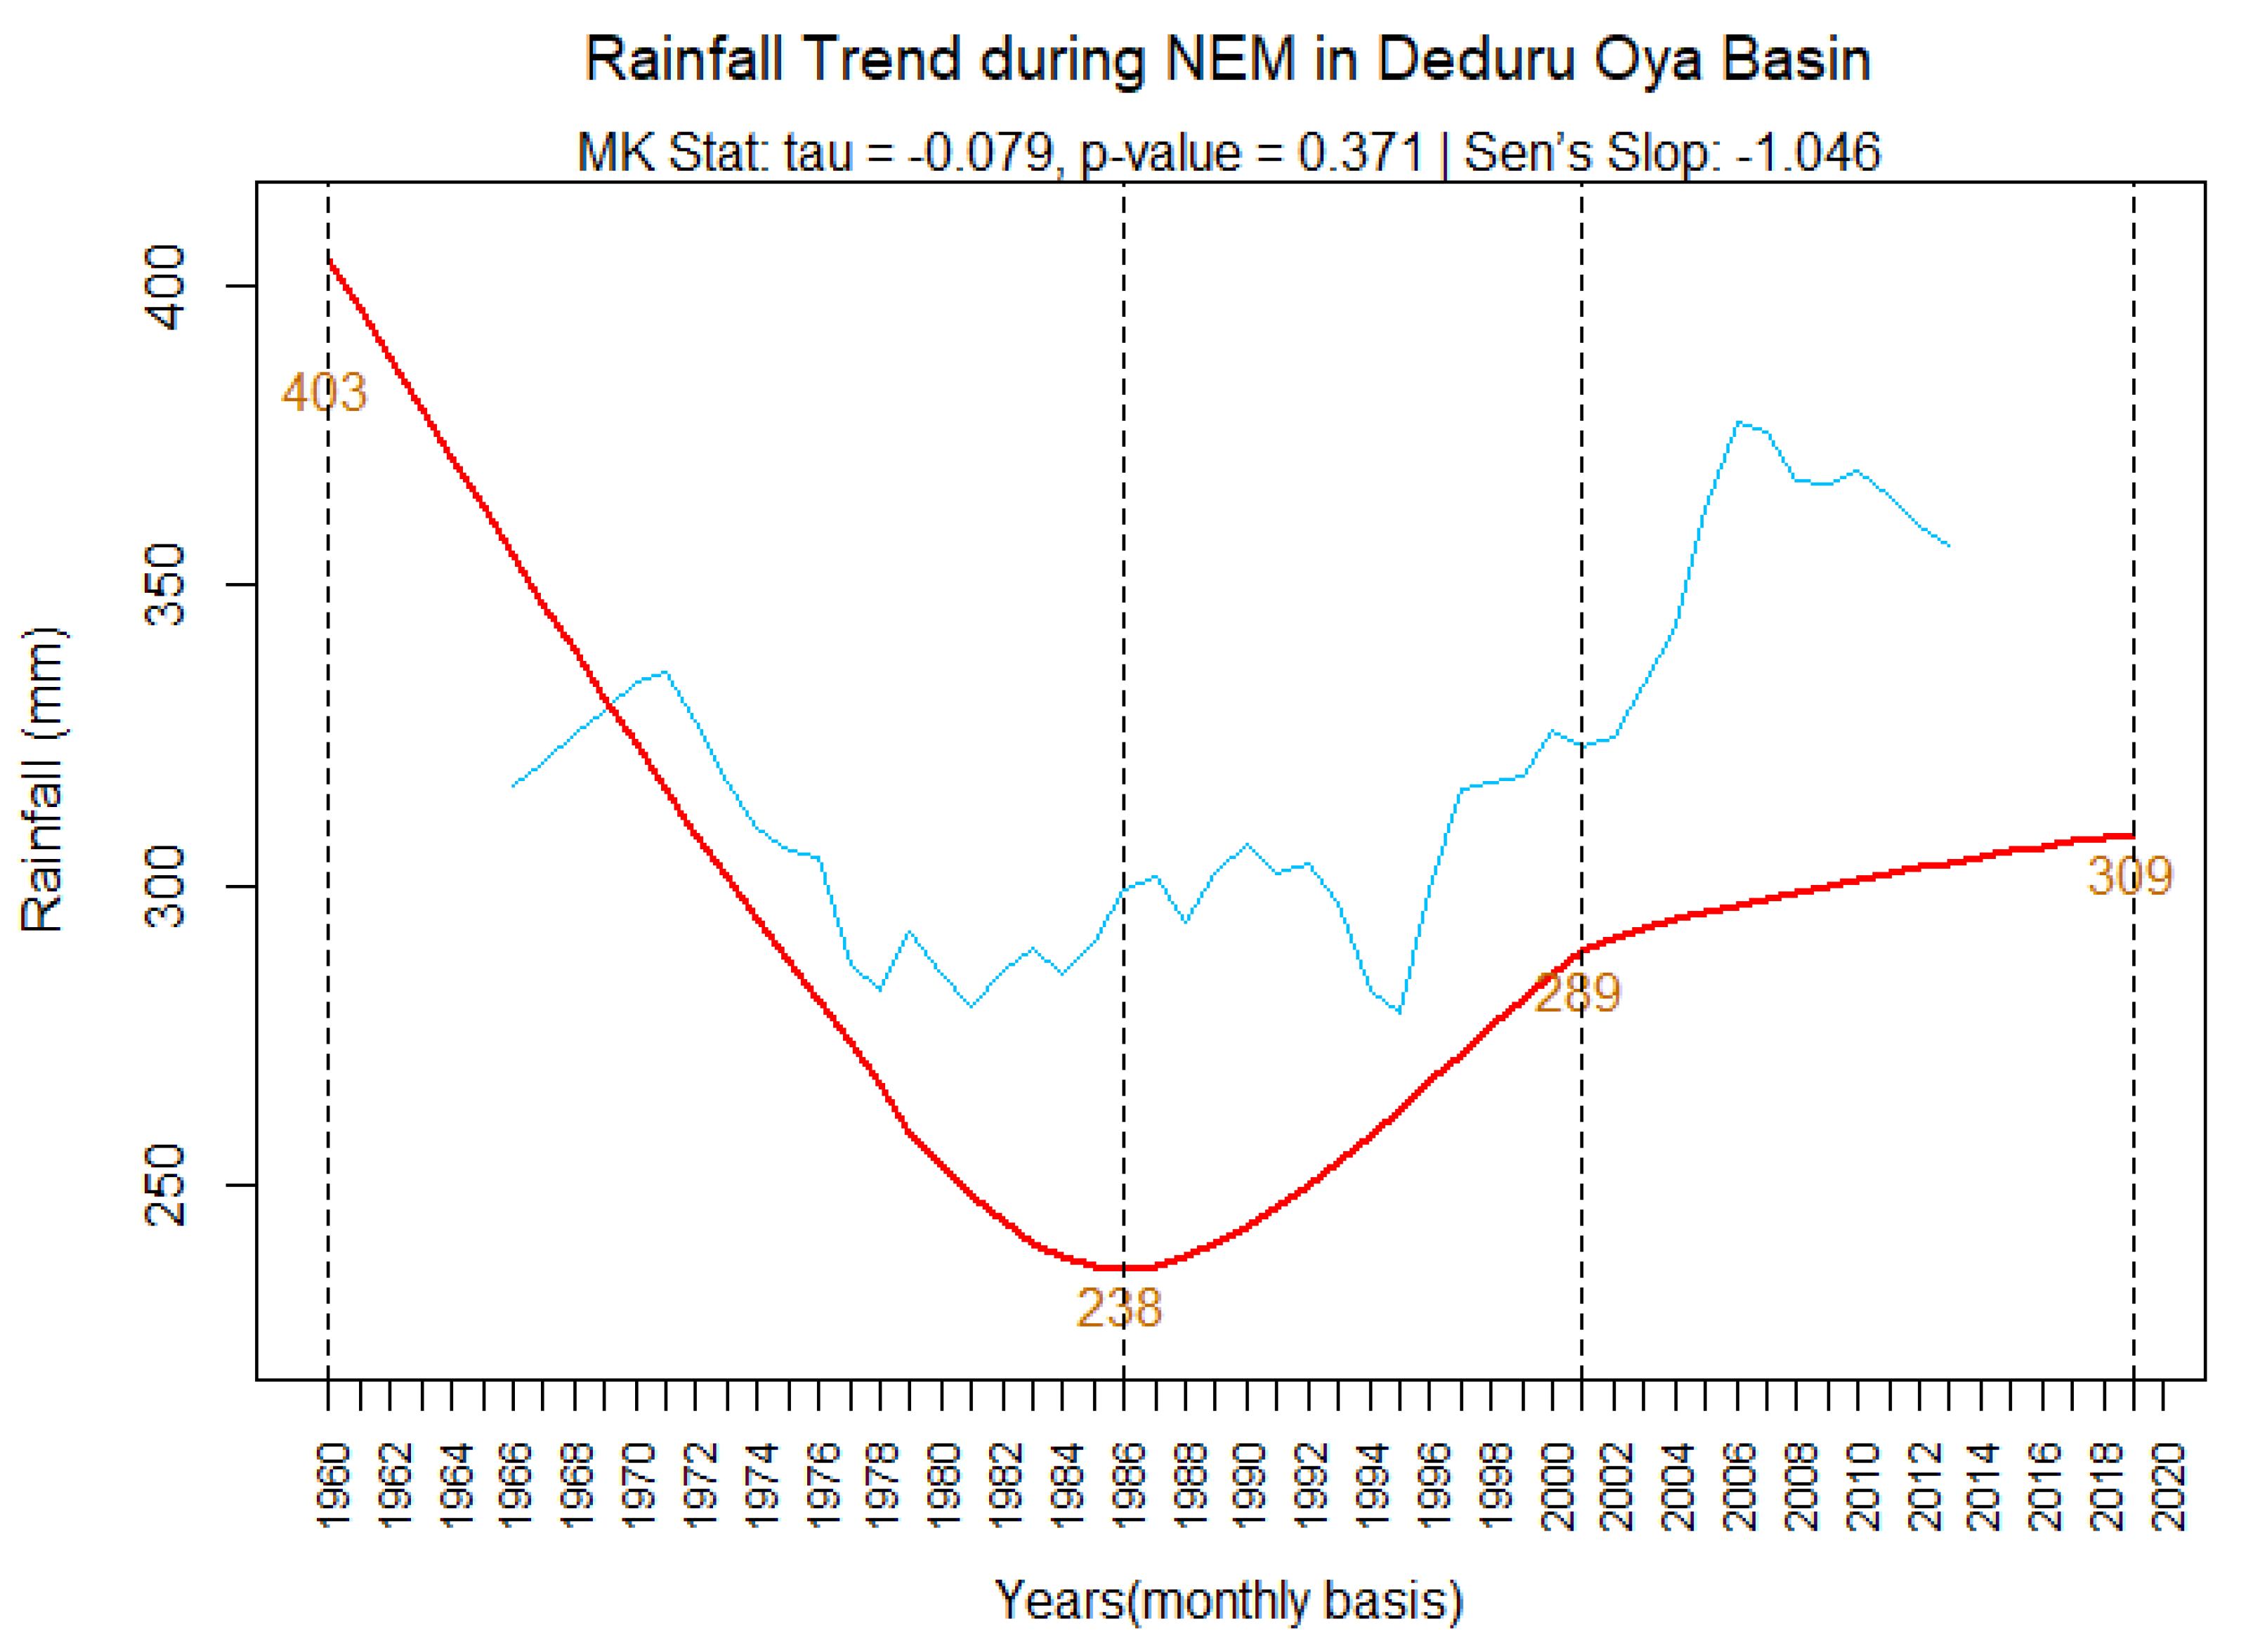
Figure 15.
Flood risk map of selected GNDs in the Deduru Oya basin. (Source: Wanninayake, et al., 2023).
Figure 15.
Flood risk map of selected GNDs in the Deduru Oya basin. (Source: Wanninayake, et al., 2023).
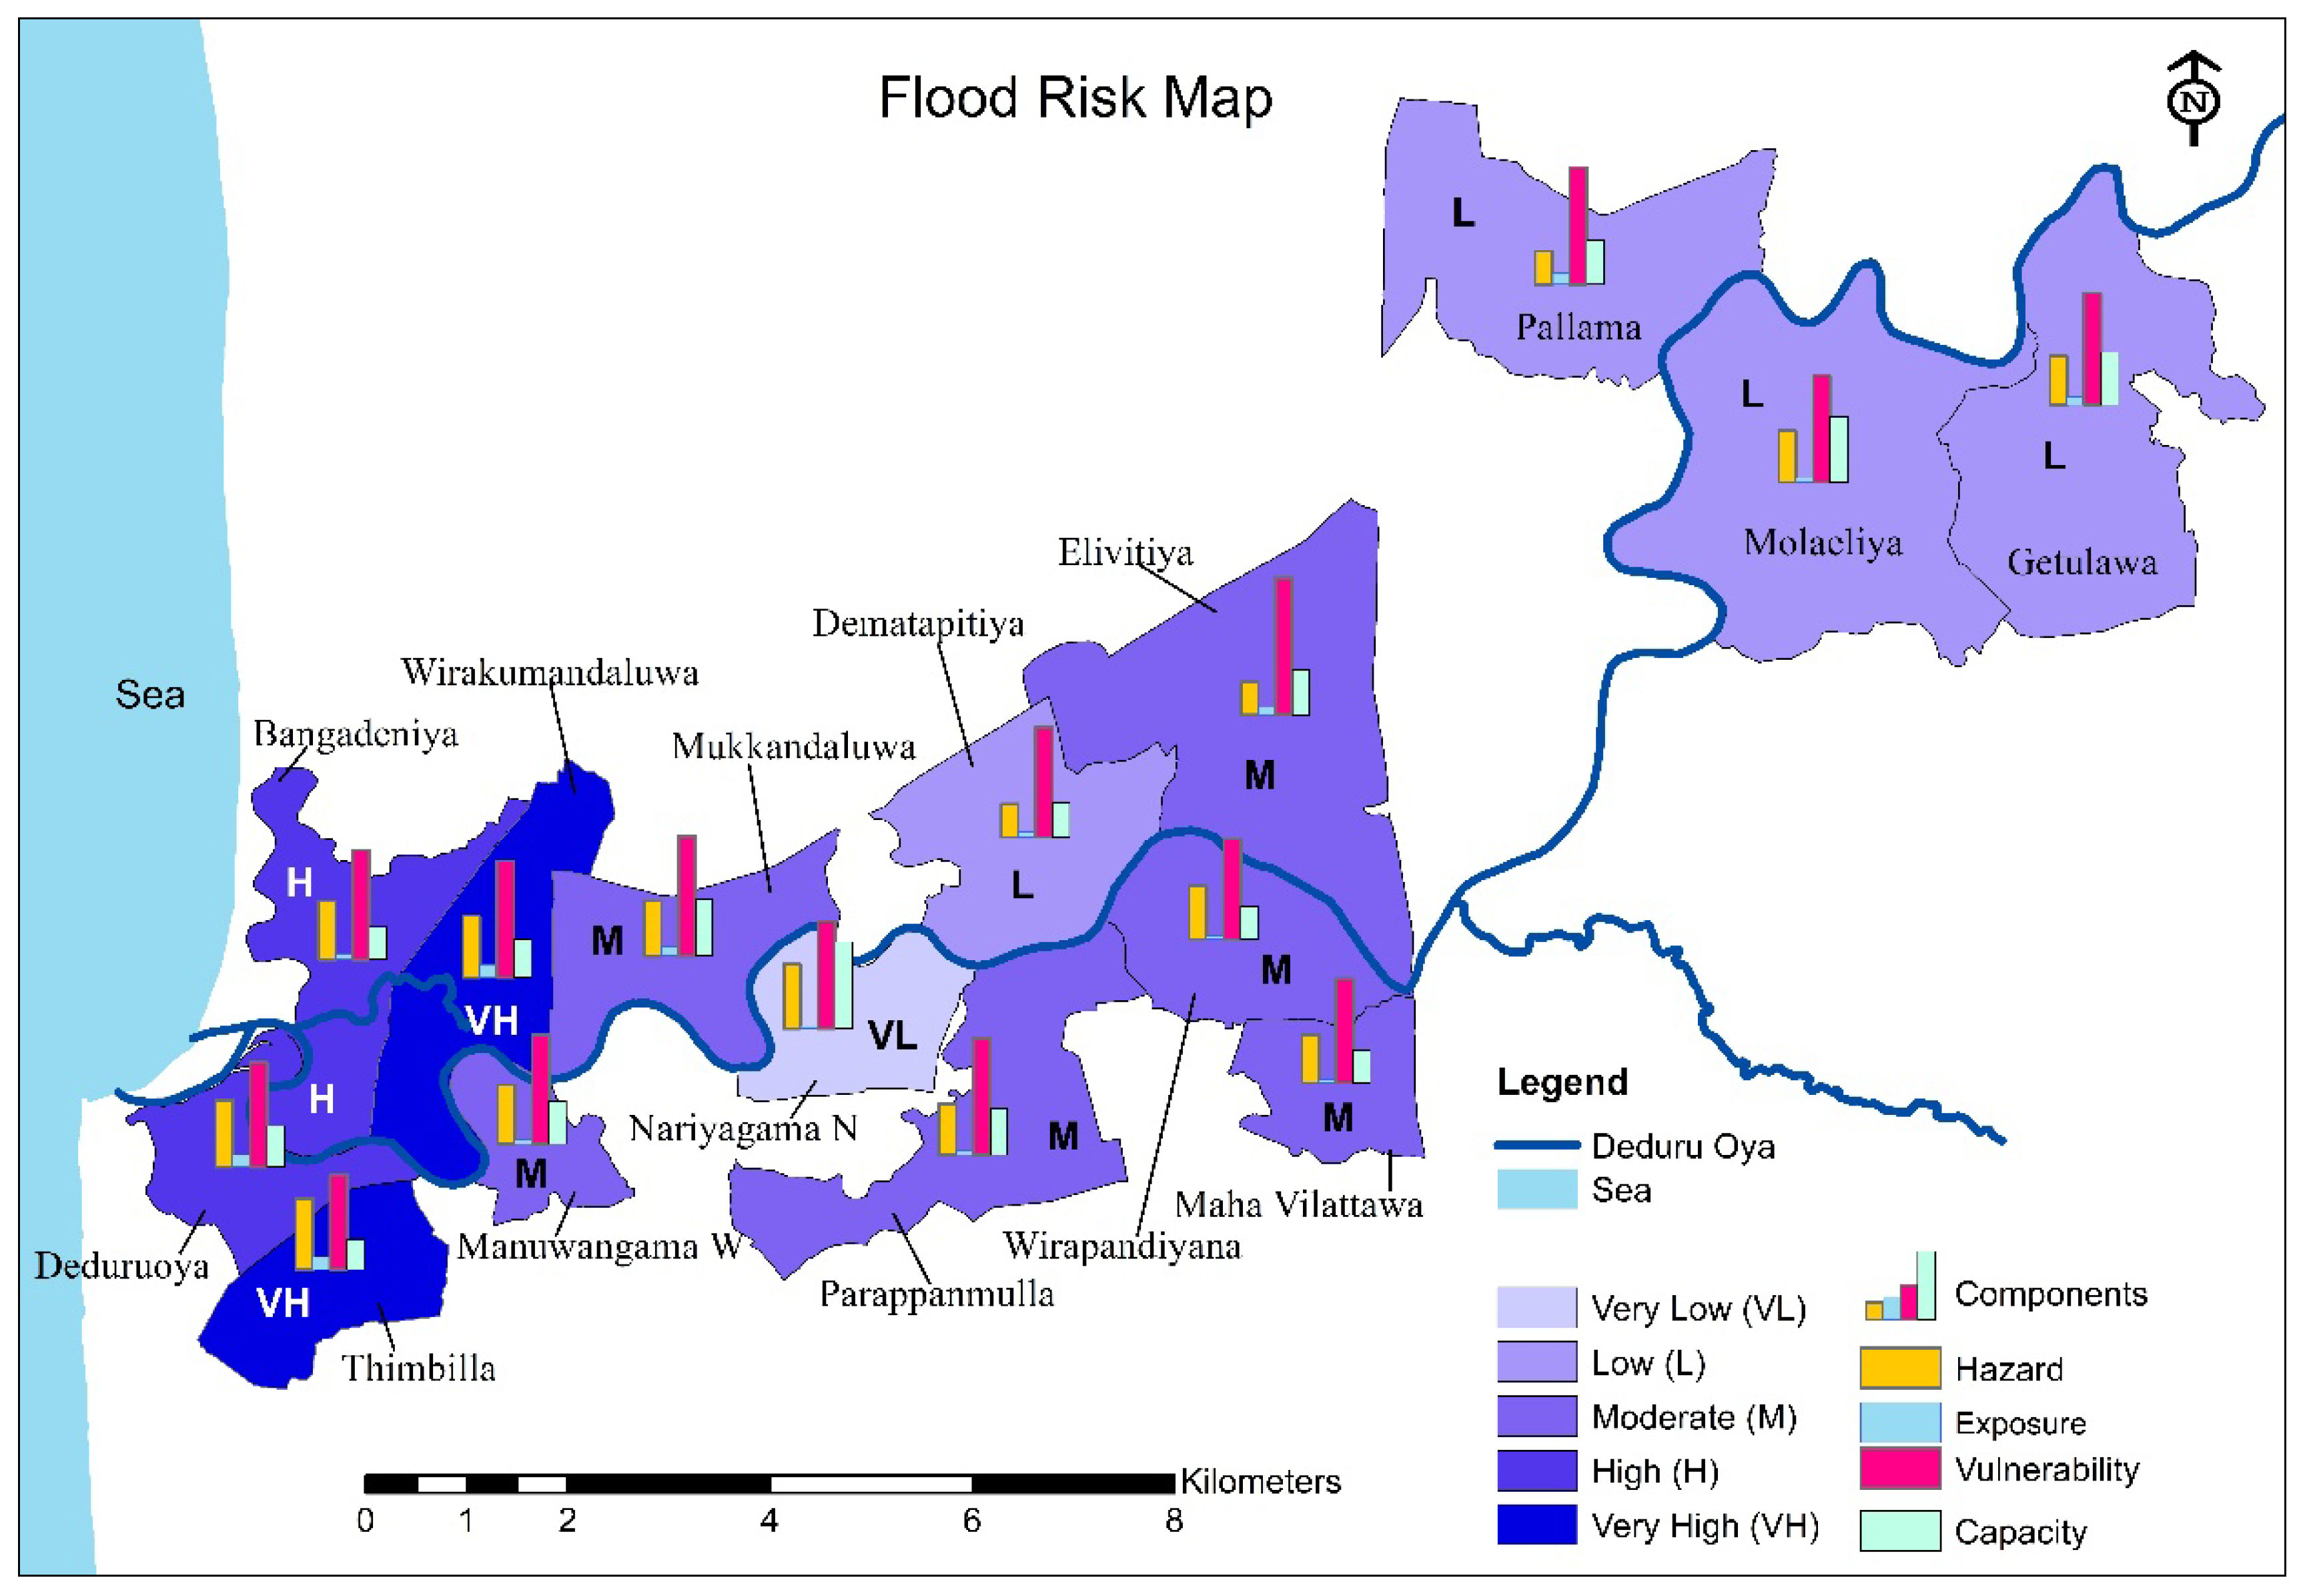
Figure 16.
Community satisfaction with government sector involvement in flood DRM. (Source: Created by the researcher based on primary data).
Figure 16.
Community satisfaction with government sector involvement in flood DRM. (Source: Created by the researcher based on primary data).
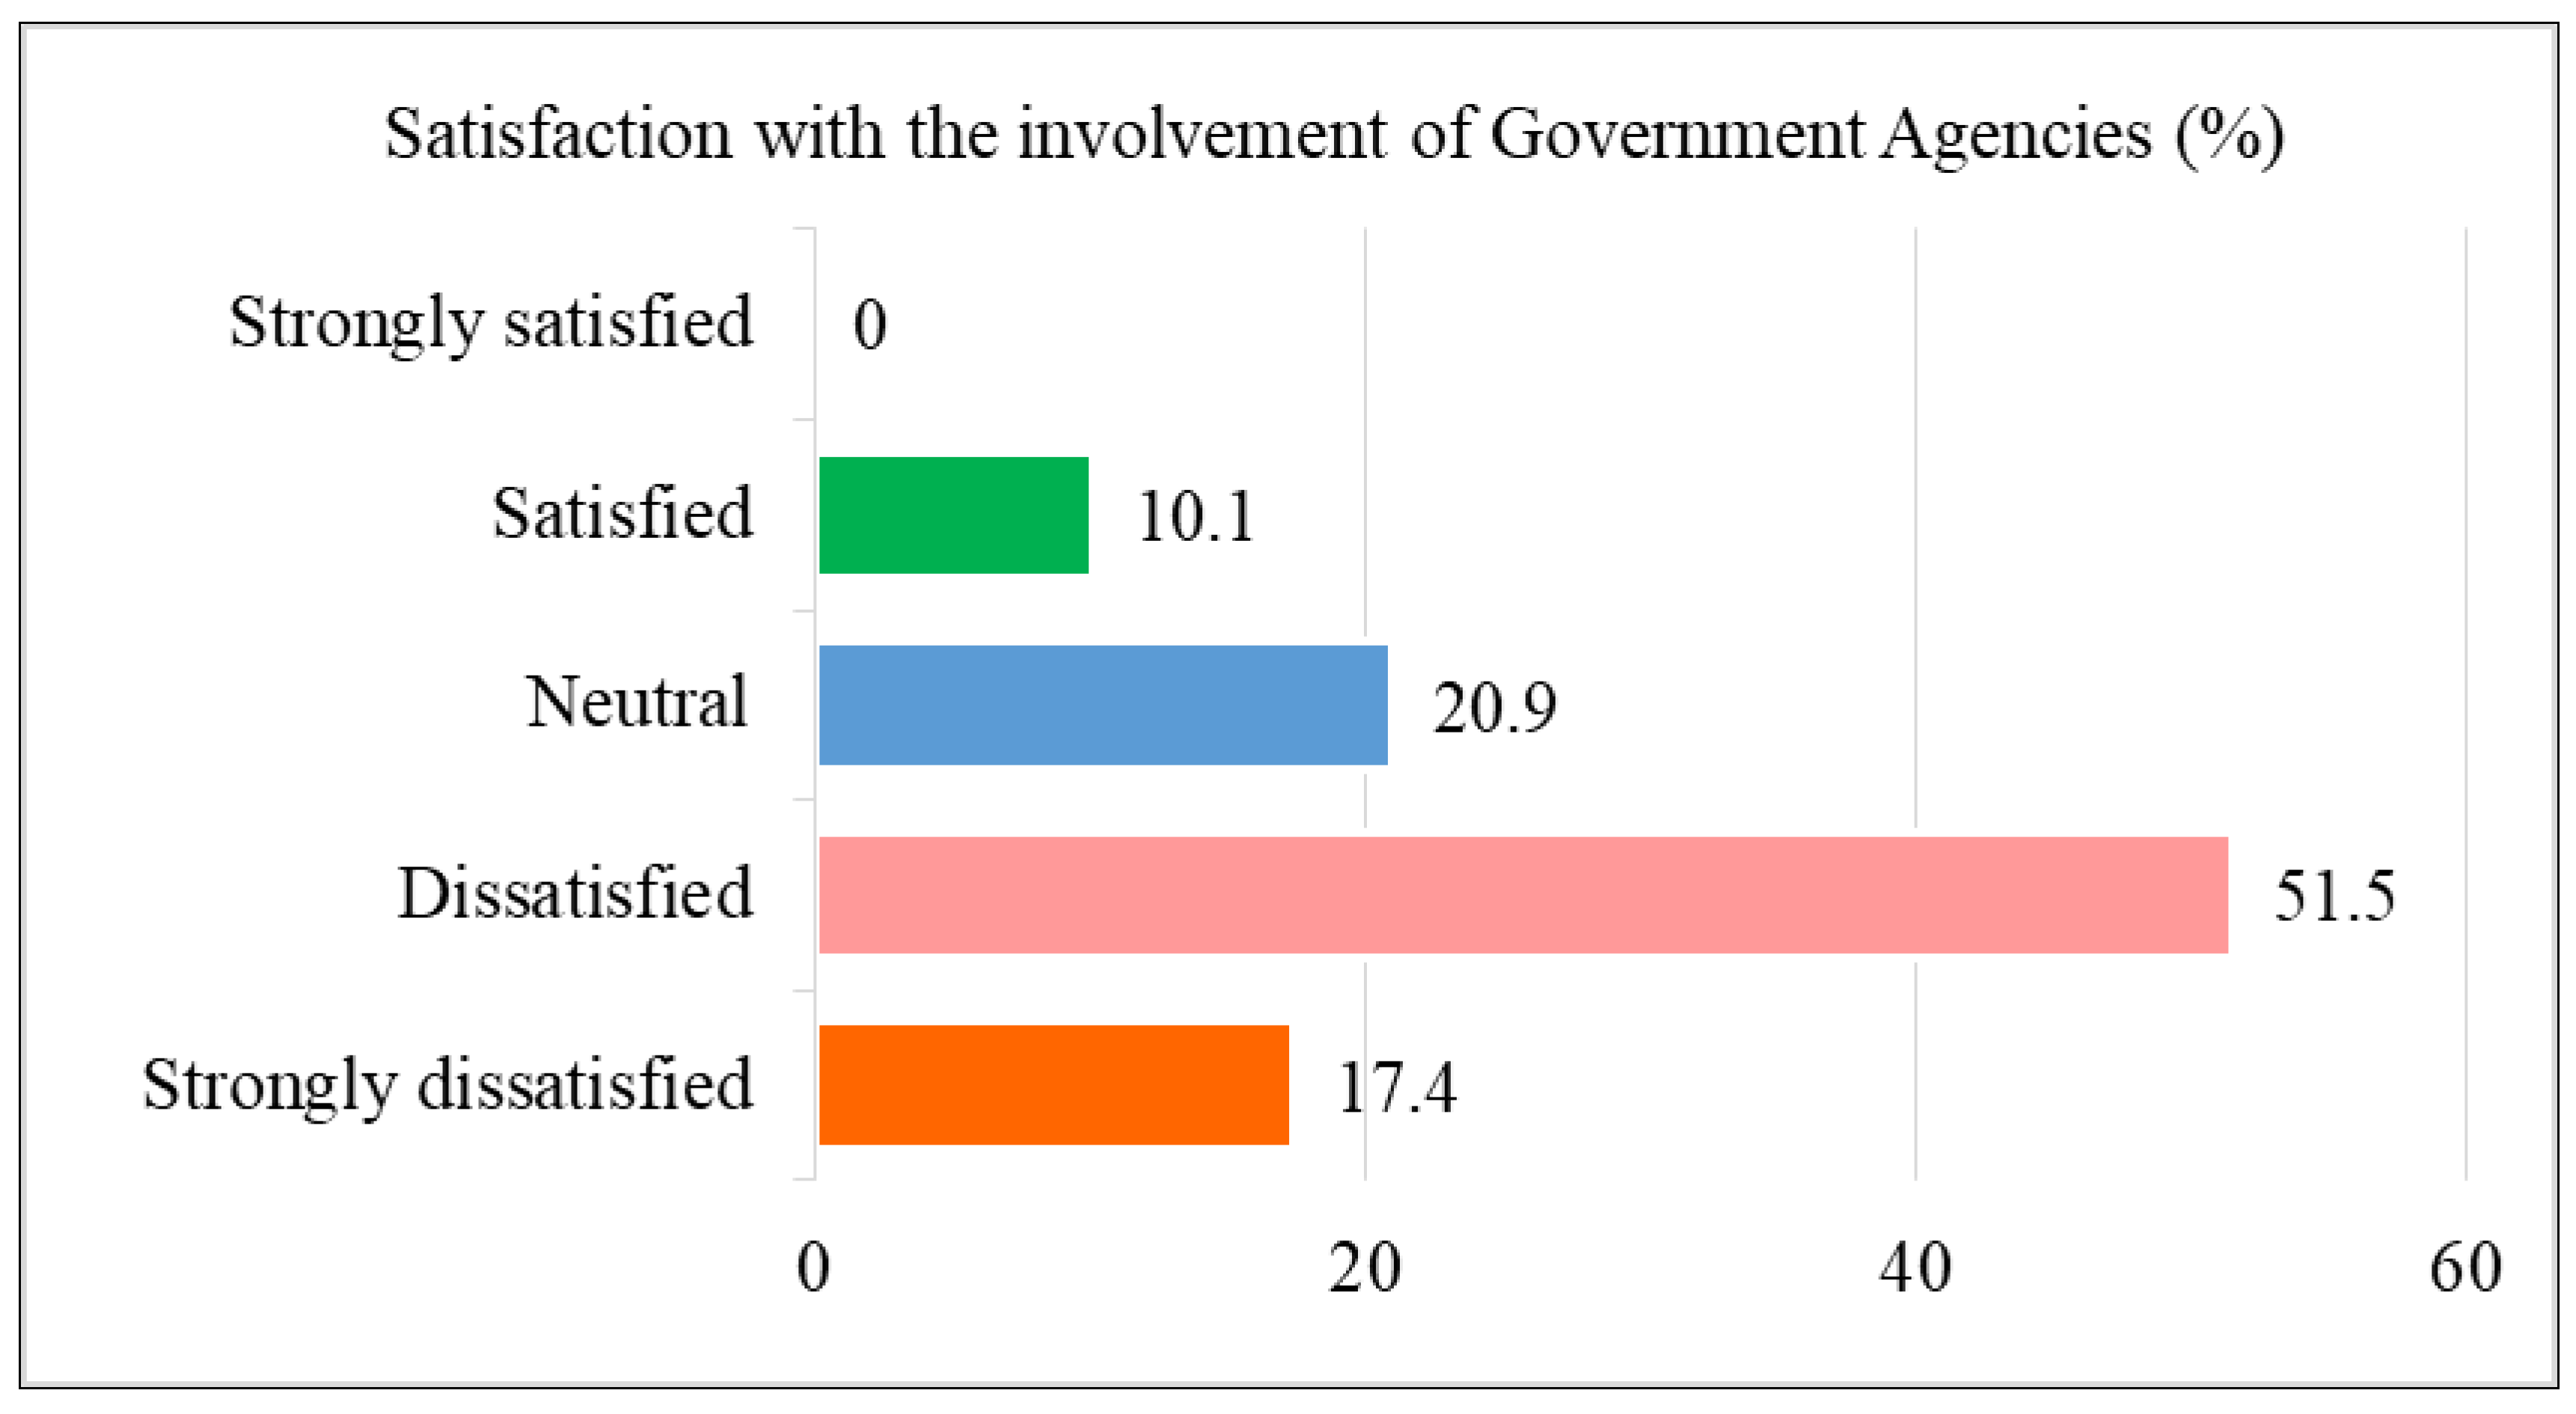

Table 1.
Mann-Kendall and Sen’s Slope statistics of average monthly rainfall.
| Station | MK Statistics | Sen’s Slope | |
| tau | p-value | ||
| Millawana | -0.01 | 0.45 | -0.01 |
| Polontalawa | -0.02 | 0.29 | -0.01 |
| Kurunegala | -0.06 | 0.01 | -0.02 |
| Chilaw | -0.09 | 0.00 | -0.03 |
| Wariyapola | -0.09 | 0.00 | -0.06 |
| Mediyawa | 0.00 | 0.91 | 0.01 |
| Deduru Oya Entire Basin | -0.06 | 0.01 | -0.03 |
Table 2.
Total population of selected GNDs.
| GN Divisions | 2001 | 2011 | 2020 | Population Growth Rate (2001-2020) |
| Thimbilla | 2359 | 2441 | 3416 | 55.63 |
| Deduruoya | 3025 | 3062 | 3219 | 10.21 |
| Wirakumandaluwa | 2328 | 2556 | 3113 | 41.32 |
| Pallama | 1670 | 1887 | 2977 | 68.79 |
| Mukkandaluwa | 1622 | 1839 | 2413 | 41.63 |
| Getulawa | 1570 | 1733 | 1947 | 19.84 |
| Elivitiya | 1301 | 1511 | 1788 | 25.63 |
| Dematapitiya | 1106 | 1133 | 1250 | 7.58 |
| Bangadeniya | 1174 | 1103 | 1238 | 3.37 |
| Molaeliya | 822 | 948 | 1080 | 13.58 |
| Mahawilattawa | 633 | 775 | 956 | 17.00 |
| Parappanmulla | 794 | 761 | 931 | 7.21 |
| Manuwangama West | 735 | 759 | 924 | 9.95 |
| Wirapandiyana | 699 | 750 | 864 | 8.68 |
| Nariyagama North | 610 | 664 | 771 | 8.47 |
| Total | 20448 | 21922 | 26887 |
Disclaimer/Publisher’s Note: The statements, opinions and data contained in all publications are solely those of the individual author(s) and contributor(s) and not of MDPI and/or the editor(s). MDPI and/or the editor(s) disclaim responsibility for any injury to people or property resulting from any ideas, methods, instructions or products referred to in the content. |
© 2024 by the authors. Licensee MDPI, Basel, Switzerland. This article is an open access article distributed under the terms and conditions of the Creative Commons Attribution (CC BY) license (http://creativecommons.org/licenses/by/4.0/).
Copyright: This open access article is published under a Creative Commons CC BY 4.0 license, which permit the free download, distribution, and reuse, provided that the author and preprint are cited in any reuse.


