
Submitted:
28 April 2024
Posted:
29 April 2024
You are already at the latest version
Abstract
This study investigates the effects of subclinical hypothyroidism and BDNF on telomere length in T1DM mothers and their neonates. Methods: In this prospective cohort study, 70 pregnant women with T1DM were enrolled. Subclinical hypothyroidism during the first trimester was characterized by elevated thyroid-stimulating hormone (TSH) levels ranging from 2.5 to 5.0mIU/L alongside normal free thyroxine (FT4) concentrations. Participants were stratified into two groups based on TSH levels: a maternal subclinical hypothyroid group (SHG, n=35) and a maternal euthyroid group (ETG, n=35). Leukocyte telomere length (LTL) measurements were conducted using whole blood samples from the mothers and umbilical veins. Results: The maternal LTL mean was 1.7 (SD=1.1), which was significantly shorter than the neonatal telomeres, with a mean of 2.3 SD (1.2). A significant correlation was observed between maternal and neonatal LTL (r=0.750, p<0.001). A positive association was found between neonatal LTL and BDNF levels in maternal circulation [β=0.421 (95% CI 0.536; 1.873; p=0.001)]. Neonatal LTL was negatively associated with gestational weight gain [β=-0.266 (95% CI-0.138; -0.009)], and with TSH in the first trimester [β=-0.237; (95% CI -0.493; - 0.010)]. Notably, neonates in the SHG exhibited shorter LTL, with a mean of 2.1 (1.0), compared to those in the ETG, who had a mean LTL of 2.7 (1.4). A positive association was found between maternal LTL and BDNF levels in maternal circulation [β=0.523 (95% CI 0.790; 1.950; P<0.001)]. Maternal LTL was negatively associated with gestational weight gain [β=-0.259 (95% CI -0.122; -0.010)], and with TSH in the first trimester [β=-0.231; (95% CI -0.422; - 0.015)]. Conclusions: Genetic factors affect neonatal LTL. Maternal subclinical hypothyroidism reduces neonatal LTL. The link between maternal and neonatal LTL and BDNF reveals the complex endocrine-neurotrophic interaction in T1DM telomere dynamics.
Keywords:
Brain-derived neurotrophic factor
; neonate
; pregnancy
; subclinical hypothyroidism
; type 1 diabetes mellitus
1. Introduction
Telomeres, essential for cellular integrity, protect chromosome ends and play a pivotal role in various human diseases [1]. Their length, influenced by genetics, environmental factors, diet, and ageing, is crucial for cellular ageing and disease susceptibility [2]. In this context, Type 1 diabetes mellitus (T1DM), an autoimmune disease marked by the destruction of β-cells and erratic insulin production, poses significant risk during pregnancy, affecting both maternal and neonatal health [3]. Emerging evidence suggests that diabetic pregnancies might predispose offspring to long-term disturbances, reinforcing the developmental origins of health and disease paradigm [4,5].
Thyroid hormones (THs) are vital for embryonic growth, with maternal thyroxine (T4) crucial during early gestation [6]. These hormones regulate key metabolic processes in both mother and fetus, supporting normal fetal growth. [7]. Pregnant women with subclinical hypothyroidism characterized by mildly elevated thyroid-stimulating hormone (TSH) levels but normal free thyroxine (T4), are susceptible to metabolic dysregulation, underscoring the importance of monitoring thyroid function in T1DM pregnancies [8].
Subclinical hypothyroidism during pregnancy is associated with increased risks of adverse outcomes and potential neurocognitive impairments in offspring [9]. Insufficient maternal T4 production early in pregnancy is linked to an elevated risk of neurological impairments in children [10].
Brain-derived neurotrophic factor (BDNF), plays a crucial role in neurogenesis, synaptic transmission regulation, and cognitive function [11,12]. Synthesized in the CNS during fetal development, BDNF significantly influences brain development, glucose and lipid metabolism, angiogenesis, placental development, and fetal growth [12]. In both the brain and periphery, BDNF also plays a crucial role in regulating glucose and energy metabolism [12,13].
This study hypothesizes a negative correlation between maternal subclinical hypothyroidism and neonatal telomere length, aiming to elucidate the impact of subclinical hypothyroidism and BDNF on telomere length in mothers with T1DM and their neonates. The study aimed to investigate the effects of subclinical hypothyroidism and BDNF on telomere length in T1DM mothers and their neonates.
2. Materials and Methods
Study design. In this prospective cohort study, we consecutively included 84 women with type-1 diabetes mellitus before completing ten gestational weeks and had a single living fetus. Among these, 14 were excluded due to various reasons: withdrawal of participation (n=2), delivery at another facility (n=3), miscarriage (n=3), and inability to accurately measure levels of thyroid hormones, BDNF, or telomeres (n=6). The remaining 70 participants were stratified based on thyroid-stimulating hormone (TSH) levels into the subclinical hypothyroid group (SHG, n=35) and the euthyroid group (ETG, n=35). All participants underwent cesarean section for delivery. This study started on 1 February 2019 and ended on 31 January 2021 and was conducted at the Referral Centre Ministry of Health, Department of Obstetrics and Gynaecology, Clinical Hospital Centre Zagreb, School of Medicine, University of Zagreb.
Participants
Inclusion Criteria. We included 70 pregnant women with T1DM and singleton pregnancies who received insulin therapy for at least two years. At pregnancy confirmation, the HbA1c was ≤8% (64 mmol/mol). All pregnant women received intensified insulin therapy with fast-acting insulin and long-acting insulin.
Exclusion Criteria. Pregnant women with T1DM who had proliferative retinopathy, nephropathy, and chronic hypertension were excluded from the study. Additionally, women under the age of 18 years and those with major fetal defects observed on the 11 to 13 weeks of gestation ultrasound scan were excluded.
Ethical Statements. The Ethics Committee at the School of Medicine, the University of Zagreb, approved the study (No. 380-59-10106-19-111/26). All women in the study provided informed consent for themselves and their neonates.
Role of the funding source. The funder of the study had no role in study design, data collection, data analyses, data interpretation, or writing of the report.
Data Collection. Pregnancy information, gestational weight gain expressed as the difference in weight before pregnancy (self-reported) and at the time of delivery, and pre-pregnancy body mass index (kg/m2) were calculated from pre-pregnancy values and collected for each participant. Neonatal macrosomia was defined as a birth weight of ≥4000 g. Large for gestational age (LGA) was defined if birth weight was ≥90th percentile for gestation weight and sex. Ponderal index was calculated according to the formula: PI=weight (g)/ height (cm)3. The prospective study included neonates of T1DM mothers who were evaluated for their clinical condition immediately after birth and monitored for somatic and neurological outcomes. The neonates were evaluated for their clinical condition immediately after birth and monitored for somatic and neurological outcomes. Anthropometric measurements (body mass and length) were taken upon birth. Maternal blood samples were collected during pregnancy and caesarean section, with analyses of glucose, BDNF, thyroid hormones (TSH, FT3, and FT4), and HbA1c percentage. Umbilical vein blood samples were obtained immediately after birth, but before removing the placenta, for glucose, BDNF, and thyroid hormones (TSH, FT3, FT4). Maternal venous blood samples were collected during delivery as well. At delivery, whole blood samples from the mother and umbilical vein were collected for telomere length.
Analysis of Blood Sample: The quantification of glucose was carried out using hexokinase method on a Cobas C301 analyser, utilizing from the same manufacturer, (Roche, Basel, Switzerland). Measurement of HbA1c levels in whole blood was conducted through turbimetric inhibition immunoassays on a Cobas C501 instrument, also from Roche (Basel, Switzerland). The serum C-peptide concentration was evaluated by electrochemiluminescence immunoassays (ECLIAs) with Elecsys immunoassays from Roche Diagnostics (Switzerland), with the lower detection limit of 0·003 nmol/L. Neonatal insulin resistance was calculated based on a homeostasis model available at https://homa-calculator.informer.com/2.2/, accessed on 23 January 2023. To determine subclinical hypothyroidism, we relied on TSH values. Euthyroidism was considered for the first trimester when the TSH value was less than 2.5 mIU/L. For the quantitative determination of human thyroid stimulating hormone (TSH), we used the Architect TSH, FT3, and FT4, employing a chemiluminescent microparticle immunoassay (CMIA) from Abbott Longford Co. (Longford Ireland). The definition of subclinical hypothyroidism was based on the TSH value.
Serum concentration of Brain-Derived-Neurotropic Factor (BDNF) was determined using a Sandwich ELISA Kit from ChemiKine, Merck KGaA, Darmstadt, Germany (No. Cyt306), with a test sensitivity of 15 pg/mL. The Leptin serum concentration was determined with a sandwich Kit from Tecan, IBL International, Hamburg, Germany (Cat. No. MD53001).
DNA isolation, quantification, and dilution: DNA isolation was performed from 3 ml of whole blood following the procedure outlined by Krasic et al. 2021 [14]. The obtained DNA was purified using NucleoSpin gDNA Clean-up kit from Machery-Nagel, Düren, Germany, in accordance with manufacturer’s instructions. The quality and concentration of DNA were assessed using a NanoDrop ND-2000 spectrophotometer from NanoDrop Technologies, Wilmington, DE, USA. Subsequently, each DNA sample was diluted to a concentration of 20 ng/µl and stored in 1,5 mL tubes from Eppendorf, Hamburg, Germany, at −20°C until further analysis.
qPCR analysis: For this study, human β-globin served as a single copy gene. The qPCR primers for telomere and human β-globin were adopted from Joglekar et. al., 2020 [15]. The annealing temperature was optimized at 58°C for both telomere and for β-globin analysis. qPCR reactions were performed in triplicates, using 1 µl of isolated DNA (concentration: 20 ng/µl), Fast SYBR Green master mix ThermoFisher Scientific, Waltham, MA, USA, and 10 µM forward and reverse primers. Each plate contained triplicate of no-template control (NTC), control DNA (Promega, Madison, WI, USA), and DNA samples with telomere primers and β-globin primers. Real-time PCR amplification and analysis were conducted using CFX96 Touch Real-Time PCR Detection System from Bio-Rad Laboratories, Hercules, CA, USA, and CFX Maestro Software from Bio-Rad Laboratories, Hercules, CA, USA, following the protocol established by Joglekar et al. in 2020 [15]. In telomere analysis, data obtained from quantitative PCR were expressed as the T/S ratio of the number of copies of gene. This T/S ratio is proportional to the average telomere length.
The sample size was determined using preliminary data, aiming for a minimum statistical power of 80%. The Wilcoxon sign rank test for matched pairs was utilized to calculate the power for comparing the means of maternal and neonatal telomere lengths. The analysis was carried out with a total sample of 28 participants, setting the significance level (α) at 0.05 and achieving a power (1-β error probability) of 80%.
Statistical Analysis.
The sample size was determined using preliminary data, aiming for a minimum statistical power of 80%. The Wilcoxon sign rank test for matched pairs was utilized to calculate the power for comparing the means of maternal and neonatal telomere lengths. The analysis was carried out with a total sample of 28 participants, setting the significance level (α) at 0.05 and achieving a power (1-β error probability) of 80%.
Participants with missing data for a specific outcome were excluded from the corresponding analyses. Statistical analyses were conducted using SPSS statistical package, version 26 from IBM, Armonk, NY, USA. Categorical data were represented using absolute and relative frequencies. Group differences between categorical variables were tested using the Pearson Chi-square test. Student’s t-test was used to assess group differences for normally distributed continuous variables, while differences for non-normally distributed continuous variables were evaluated using the Mann-Whitney U test. To assess the relationship between maternal and neonatal telomere lengths, Pearson’s correlation coefficient was used. For data not adhering to a normal distribution, a log transformation (using the natural logarithm) was applied before conducting the analysis. The connection between brain-derived neurotrophic factor (BDNF) levels and both maternal and neonatal telomere lengths was examined using regression analysis with Spearman correlation coefficient (rho). The Wilcoxon signed-rank test, a non-parametric method, was employed for analyzing repeated measurements of continuous data, specifically to compare maternal and neonatal telomere lengths. Finally, multiple linear regression analysis was applied to identify maternal and neonatal LTL associated with gestational weight gain (GWG), thyroid-stimulating hormone (TSH) levels, and BDNF. A p value of less than 0.05 for two-sided was considered statistically significant for all test.
3. Results
Based on TSH values, participants were categorized into the subclinical hypothyroid group (SHG, n=35) and euthyroid group (ETG, n=35). All pregnancies were terminated by caesarean section.
The euthyroid group (ETG) had significantly lower TSH concentration than the subclinical hypothyroid group (SHG) (p< 0.001). The two study groups had no notable differences in age, duration and onset of T1DM, BMI, gestational weight gain, HbA1c, FT3, FT4, BDNF or maternal glucose. Maternal telomere lengths significantly differ between the two groups. Further details are presented in Table 1.
The neonates to subclinical hypothyroid mothers exhibited greater birth weights and lengths compared to neonates born to euthyroid mothers (p=0.040, p=0.030, respectively). Neonatal telomere lengths were also longer in the euthyroid maternal group than in the group of maternal subclinical hypothyreosis (p=0.010, Wilcoxon sign-rank test). Additionally, the prevalence of Large for Gestational Age (LGA) and fetal macrosomia were significantly higher in the subclinical hypothyroid mothers (p=0.034 and p=0.029).
Significant differences were observed between maternal telomere lengths and neonatal telomere lengths (1.7±1.1 : 2.3±1.2), (p<0·0001; Wilcoxon sign test). Further details are presented in Table 2.
Figure 1 depicts the linear correlation between maternal and neonatal telomere lengths, demonstrating a strong positive relationship (r = 0.750, 95% Confidence Interval: 0.548 to 0.837) with a highly significant p-value (p< 0.0001), indicating a robust association between the telomere lengths of mothers and their neonates. Furthermore, a significant nonparametric correlation was identified between maternal telomere lengths and BDNF levels in maternal vein serum (rrho= 0.370, p=0.003). Neonatal telomere length exhibited a positive correlation with maternal BDNF (rrho= 0.510, p<0.001).
Furthermore, a significant nonparametric correlation was identified between maternal telomere lengths and BDNF levels in maternal vein serum (rrho=0.370, p=0.003). Neonatal telomere length exhibited a negative correlation with maternal glucose concentration (rrho=-0.411, p=0.006) and C-peptide levels in umbilical vein serum (rrho=- 0.275; p =0.045). BDNF levels in maternal vein serum during the first trimester also correlated with neonatal telomere length (rrho=0.510; p<0.001). Conversely, an inverse nonparametric correlation was observed between neonatal telomere lengths and maternal TSH concentration (rrho=-0.296, p=0.018). (Table 3)
4. Discussion
As expected, our study confirmed that maternal telomeres are generally shorter than neonatal telomeres, consistent with previous research findings [16]. We also found a strong positive correlation between maternal and neonatal telomere lengths, indicating that mothers with longer telomeres gave birth to offspring with longer TL, as reported by Daneels and colleagues [17]. This suggests a hereditary component influencing neonatal telomere length. Several other studies have also reported longer neonatal than maternal telomeres and demonstrated an association between maternal and neonatal telomere lengths [18,19]. It is important to note that telomere shortening is influenced not only by ageing but also by various genetic and environmental factors and diseases [20]. While our study focused on mothers with type 1 diabetes (T1DM), we did not directly compare maternal and neonatal telomere lengths between diabetic and non-diabetic pregnant women. Research, such as the meta-analysis conducted by Wang J at al. [12], has shown that diabetes can affect telomere length, with individuals with diabetes having shorter telomeres compared to healthy individuals. However, the exact impact of diabetes on telomere length concerning age remains unclear. Wang and colleagues suggested that diabetes might lead to senescence or apoptosis of islet β-cells, causing gradual telomere shortening, which could contribute to diabetes complications. Understanding how diabetes affects telomere length is crucial for diabetes prevention and treatment [21]. It is worth noting that other studies, like the one by Cross JA et al. [22], found no significant difference in cord blood telomere length between pregnancies of women with diabetes and control subjects. Similarly, Gilfillan C et al. [23]. did not find a difference in neonatal TL when comparing healthy pregnant women with gestational and pre-gestational diabetes. However, their sample sizes were relatively small.
In our study, we observed that neonates born to mothers with subclinical hypothyroidism had shorter telomeres compared to neonates born to euthyroid mothers. The diagnosis of subclinical hypothyroidism was based on TSH values (TSH < 2.5–5.0 mIU/L) during the first trimester of pregnancy. Thyroid hormones are essential in regulating glucose, lipids, and calcium metabolism in pregnant women and fetuses. Additionally, they are crucial for the proper growth and neurodevelopment of the fetus. The findings of a meta-analysis conducted by Liu Y et al. are compelling [24]. The study discovered a negative correlation between subclinical hypothyroidism (SCH) during pregnancy and offspring intelligence and motor development. This highlights the importance of monitoring thyroid hormone levels during pregnancy to ensure optimal cognitive and physical development for the offspring. Stier et al. conducted a study which revealed that high levels of thyroid hormones (TH) during pregnancy in birds can lead to longer telomeres [6]. This effect was observed both at birth and at the end of the growth period. The findings suggest that prenatal thyroid hormones may have an impact on biological age at birth and potentially affect lifespan.
It is noteworthy that in our study, approximately 50.8% of the participants were diagnosed with subclinical hypothyroidism during the first trimester of pregnancy, with 12 (18.2%) pregnant women having Hashimoto’s thyroiditis before pregnancy. These findings underscore the importance of thyroid hormone regulation during pregnancy, not only for the mother’s health but also for the development and well-being of the fetus.
We also observed a correlation between BDNF levels in maternal blood and maternal and neonatal telomere size. Neonates with telomeres shorter than 2.2 T/S (median) had significantly (p= 0.012) lower BDNF levels [median 691.4 (IQR 543.9 to 953.2)] compared to those with longer telomeres than 2.2 T/S [BDNF median 874.8 (IQR 662.7 to 1152.0)]. Additionally, higher maternal BDNF levels were associated with increased neonatal telomere length. This correlation aligns with numerous psychiatric studies that have reported a connection between BDNF levels and telomere length [25,26]. This finding suggests a potential link between neurodevelopment factors and telomere biology. Mothers who have hypothyroidism during the first trimester of pregnancy were found to have lower levels of BDNF (brain-derived neurotrophic factor) compared to those without the condition. However, the difference was not statistically significant. A study conducted on rats by Liu D et al. showed that subclinical hypothyroidism caused a decrease in the expression of BDNF in both genetic and protein levels [27]. The connection between brain-derived neurotrophic factor (BDNF) and telomere biology influences various cellular processes, such as cell proliferation, neuronal differentiation, and neuronal survival, as reported by Greenberg and colleagues [28].
This study is the first to investigate the dynamics of telomere length in pregnant women with subclinical hypothyroidism and type 1 diabetes, as well as in their neonates. The study’s primary objective was to examine how subclinical hypothyroidism and BDNF levels affect the length of telomeres in both mothers and neonates. To ensure the accuracy of the results, blood samples were collected from the mothers and umbilical veins of the neonates during labor, reducing the impact of the postpartum period. Additionally, the study was designed to eliminate any potential influence from the mode of delivery or the nutritional status of the women by ensuring that they had been fasting for at least 8 hours before the cesarean section. While the study offers valuable insights, it is important to acknowledge its limitations. The relatively small sample size and the lack of a healthy control group may impact the study’s findings.
5. Conclusions
This study reveals that hereditary factors and the intrauterine environment in mothers with T1DM can influence neonatal telomere lengths. We also found that subclinical hypothyroidism during pregnancy may contribute to shorter neonatal telomeres. Brain-derived neurotrophic factor plays a pivotal in mediating the relationship between subclinical hypothyroidism and telomere length. Understanding these relationships is essential for gaining insights into the factors that influence neonatal telomere length, which is considered a marker of biological ageing and could have implications for future health outcomes6. Patents
This section is not mandatory but may be added if there are patents resulting from the work reported in this manuscript.
Supplementary Materials
The following supporting information can be downloaded at the website of this paper posted on Preprints.org, Figure S1: title; Table S1: title; Video S1: title.
Author Contributions
Conceptualization, J.D and M.I.; methodology, M.I.; software, J.D.; validation, V.E-G., M.H. and M.I.; formal analysis, J.D.; investigation, M.I.; resources, M.I.; data curation, J.D.; writing—original draft preparation, J.D.; writing—review and editing, M.I.; visualization, M.H.; supervision, V.E-G.; project administration, M.I.; funding acquisition, M.I. All authors have read and agreed to the published version of the manuscript.
Funding
This research was supported by the Croatian Science Foundation under the grant PRE-HYPO No. IP2018-01-1284.
Institutional Review Board Statement
“Not applicable”
Informed Consent Statement
“Informed consent was obtained from all subjects involved in the study.”
Data Availability Statement
The data will be made available on request.
Acknowledgments
We thank all the patients who participated in this study.
Conflicts of Interest
“The authors declare no conflicts of interest.”
References
- Lu, W.; Zhang, Y.; Liu, D.; Songyang, Z.; Wan, M. Telomeres-structure, function, and regulation. Exp Cell Res. 2013, 319, 133–141. [Google Scholar] [CrossRef] [PubMed]
- Notterman, D.A.; Schneper, L. Telomere Time-Why We Should Treat Biological Age Cautiously. JAMA Netw Open. 2020, 3, e204352. [Google Scholar] [CrossRef] [PubMed]
- Holt, R.I.G.; DeVries, J.H.; Hess-Fischl, A.; Hirsch, I.B.; Kirkman, M.S.; Klupa, T.; Ludwig, B.; Nørgaard, K.; Pettus, J.; Renard, E.; et al. The Management of Type 1 Diabetes in Adults. A Consensus Report by the American Diabetes Association (ADA) and the European Association for the Study of Diabetes (EASD). Diabetes Care. 2021, 44, 2589–2625. [Google Scholar] [CrossRef] [PubMed]
- Garey, C.; Lynn, J.; Floreen Sabino, A.; Hughes, A.; McAuliffe-Fogarty, A. Preeclampsia and other pregnancy outcomes in nulliparous women with type 1 diabetes: a retrospective survey. Gynecol Endocrinol. 2020, 36, 982–985. [Google Scholar] [CrossRef]
- Simeoni, U.; Barker, D.J. Offspring of diabetic pregnancy: long-term outcomes. Semin Fetal Neonatal Med. 2009, 14, 119–124. [Google Scholar] [CrossRef] [PubMed]
- Stier, A.; Hsu, B.Y.; Marciau, C.; Doligez, B.; Gustafsson, L.; Bize, P.; Ruuskanen, S. Born to be young? Prenatal thyroid hormones increase early-life telomere length in wild collared flycatchers. Biol Lett. 2020, 16, 20200364. [Google Scholar] [CrossRef] [PubMed]
- Shields, B.M.; Knight, B.A.; Hill, A.; Hattersley, A.T.; Vaidya, B. Fetal thyroid hormone level at birth is associated with fetal growth. J Clin Endocrinol Metab. 2011, 96, E934–E938. [Google Scholar] [CrossRef] [PubMed]
- Eom, Y.S.; Wilson, J.R.; Bernet, V.J. Links between thyroid disorders and glucose homeostasis. Diabetes Metab J. 2022, 46, 239–256. [Google Scholar] [CrossRef]
- Haddow, J.E.; Palomaki, G.E.; Allan, W.C.; Williams, J.R.; Knight, G.J.; Gagnon, J.; O’Heir, C.E.; Mitchell, M.L.; Hermos, R.J.; Waisbren, S.E.; Faix, J.D.; Klein, R.Z. Maternal thyroid deficiency during pregnancy and subsequent neuropsychological development of the child. N Engl J Med. 1999, 341, 549–555. [Google Scholar] [CrossRef]
- de Escobar, G.M.; Obregón, M.J.; del Rey, F.E. Maternal thyroid hormones early in pregnancy and fetal brain development. Best Pract Res Clin Endocrinol Metab. 2004, 18, 225–248. [Google Scholar] [CrossRef]
- Binder, D.K.; Scharfman, H.E. Brain-derived neurotrophic factor. Growth Factors. 2020, 22, 123–131. [Google Scholar] [CrossRef] [PubMed]
- Briana, D.D.; Malamitsi-Puchne, R.A. Developmental origins of adult health and disease: The metabolic role of BDNF from early life to adulthood. Metabolism. 2018, 81, 45–51. [Google Scholar] [CrossRef] [PubMed]
- Guzzardi, M.A.; Sanguinetti, E.; Bartoli, A.; Kemeny, A.; Panetta, D.; Salvadori, P.A.; Burchielli, S.; Iozzo, P. Elevated glycemia and brain glucose utilization predict BDNF lowering since early life. J Cereb Blood Flow Metab. 2018, 38, 447–455. [Google Scholar] [CrossRef] [PubMed]
- Krasic, J.; Abramovic, I.; Vrtaric, A.; Nikolac Gabaj, N.; Kralik-Oguic, S.; Katusi Bojanac, A.; Jezek, D.; Sincic, N. Impact of Preanalytical and Analytical Methods on Cell-Free DNA Diagnostics. Front Cell Dev Biol. 2021, 9, 686149. [Google Scholar] [CrossRef] [PubMed]
- Joglekar, M.V.; Satoor, S.N.; Wong, W.K.M.; Cheng, F.; Ma, R.C.W.; Hardikar, A.A. An Optimised Step-by-Step Protocol for Measuring Relative Telomere Length. Methods Protoc. 2020, 3, 27. [Google Scholar] [CrossRef] [PubMed]
- Panelli, D.M; Bianco, K. Cellular aging and telomere dynamics in pregnancy. Curr Opin Obstet Gynecol. 2022, 34, 57–61. [Google Scholar] [CrossRef] [PubMed]
- Daneels, L.; Martens, D.S.; Arredouani, S.; Billen, J.; Koppen, G.; Devlieger, R.; Nawrot, T.S.; Ghosh, M.; Godderis, L.; Pauwels, S. Maternal Vitamin D and Newborn Telomere Length. Nutrients. 2021, 13, 2012. [Google Scholar] [CrossRef] [PubMed]
- Martens, D.S.; Van Der Stukken, C.; Derom, C.; Thiery, E.; Bijnens, E.M.; Nawrot, T.S. Newborn telomere length predicts later life telomere length: Tracking telomere length from birth to child- and adulthood. EBioMedicine. 2021, 63, 103164. [Google Scholar] [CrossRef] [PubMed]
- Send, T.S.; Gilles, M.; Codd, V.; Wolf, I.; Bardtke, S.; Streit, F.; Strohmaier, J.; Frank, J.; Schendel, D.; Sütterlin, M.W.; Denniff, M.; Laucht, M.; Samani, N.J.; Deuschle, M.; Rietschel, M.; Witt, S.H. Telomere Length in Newborns is Related to Maternal Stress During Pregnancy. Neuropsychopharmacology. 2017, 42, 2407–2413. [Google Scholar] [CrossRef]
- Schneider, C.V.; Schneider, K.M.; Teumer, A.; Rudolph, K.L.; Hartmann, D.; Rader, D.J.; Strnad, P. Association of Telomere Length with Risk of Disease and Mortality. JAMA Intern Med. 2022, 182, 291–300. [Google Scholar] [CrossRef]
- Wang, J.; Dong, X.; Cao, L.; Sun, Y.; Qiu, Y.; Zhang, Y.; Cao, R.; Covasa, M.; Zhong, L. Association between telomere length and diabetes mellitus: A meta-analysis. J Int Med Res. 2016, 44, 1156–1173. [Google Scholar] [CrossRef] [PubMed]
- Cross, J.A.; Temple, R.C.; Hughes, J.C.; Dozio, N.C.; Brennan, C.; Stanley, K.; Murphy, H.R.; Fowler, D.; Hughes, D.A.; Sampson, M.J. Cord blood telomere length, telomerase activity and inflammatory markers in pregnancies in women with diabetes or gestational diabetes. Diabet Med. 2010, 27, 1264–70. [Google Scholar] [CrossRef]
- Gilfillan, C.; Naidu, P.; Gunawan, F.; Hassan, F.; Tian, P.; Elwood, N. Leukocyte Telomere Length in the Neonatal Offspring of Mothers with Gestational and Pre- Gestational Diabetes. PLoS One. 2016, 11, e0163824. [Google Scholar] [CrossRef] [PubMed]
- Liu, Y.; Chen, H.; Jing, C.; Li, F. The Association Between Maternal Subclinical Hypothyroidism and Growth, Development, and Childhood Intelligence: A Meta-analysis. J Clin Res Pediatr Endocrinol. 2018, 10, 153–161. [Google Scholar] [CrossRef] [PubMed]
- Vasconcelos-Moreno, M.P.; Fries, G.R.; Gubert, C.; Dos Santos, B.T.M.Q.; Fijtman, A.; Sartori, J.; Ferrari, P.F.; Rosa, A.R.; Yatham, L.N.; Kauer-Sant, A.M. Telomere Length, Oxidative Stress, Inflammation and BDNF Levels in Siblings of Patients with Bipolar Disorder: Implications for Accelerated Cellular Aging. Int J Neuropsychopharmacol. 2017, 20, 445–454. [Google Scholar] [CrossRef] [PubMed]
- Delgado-Losada, M.L.; Bouhaben, J.; Arroyo-Pardo, E.; Aparicio, A.; López-Parra, A.M. Loneliness, Depression, and Genetics in the Elderly: Prognostic Factors of a Worse Health Condition? Int J Environ Res Public Health. 2022, 19, 15456. [Google Scholar] [CrossRef] [PubMed]
- Liu, D.; Teng, W.; Shan, Z.; Yu, X.; Gao, Y.; Wang, S.; Fan, C.; Wang, H.; Zhang, H. The effect of maternal subclinical hypothyroidism during pregnancy on brain development in rat offspring. Thyroid. 2010, 20, 909–15. [Google Scholar] [CrossRef]
- Greenberg, M.E.; Xu, B.; Lu, B.; Hempstead, B.L. New insights in the biology of BDNF synthesis and release: implications in CNS function. J Neurosci. 2009, 41, 12764–12767. [Google Scholar] [CrossRef]
Figure 1.
Linear correlation between maternal and neonatal telomere lengths (r=0.750, 95% CI 0.548 – 0.837).
Figure 1.
Linear correlation between maternal and neonatal telomere lengths (r=0.750, 95% CI 0.548 – 0.837).
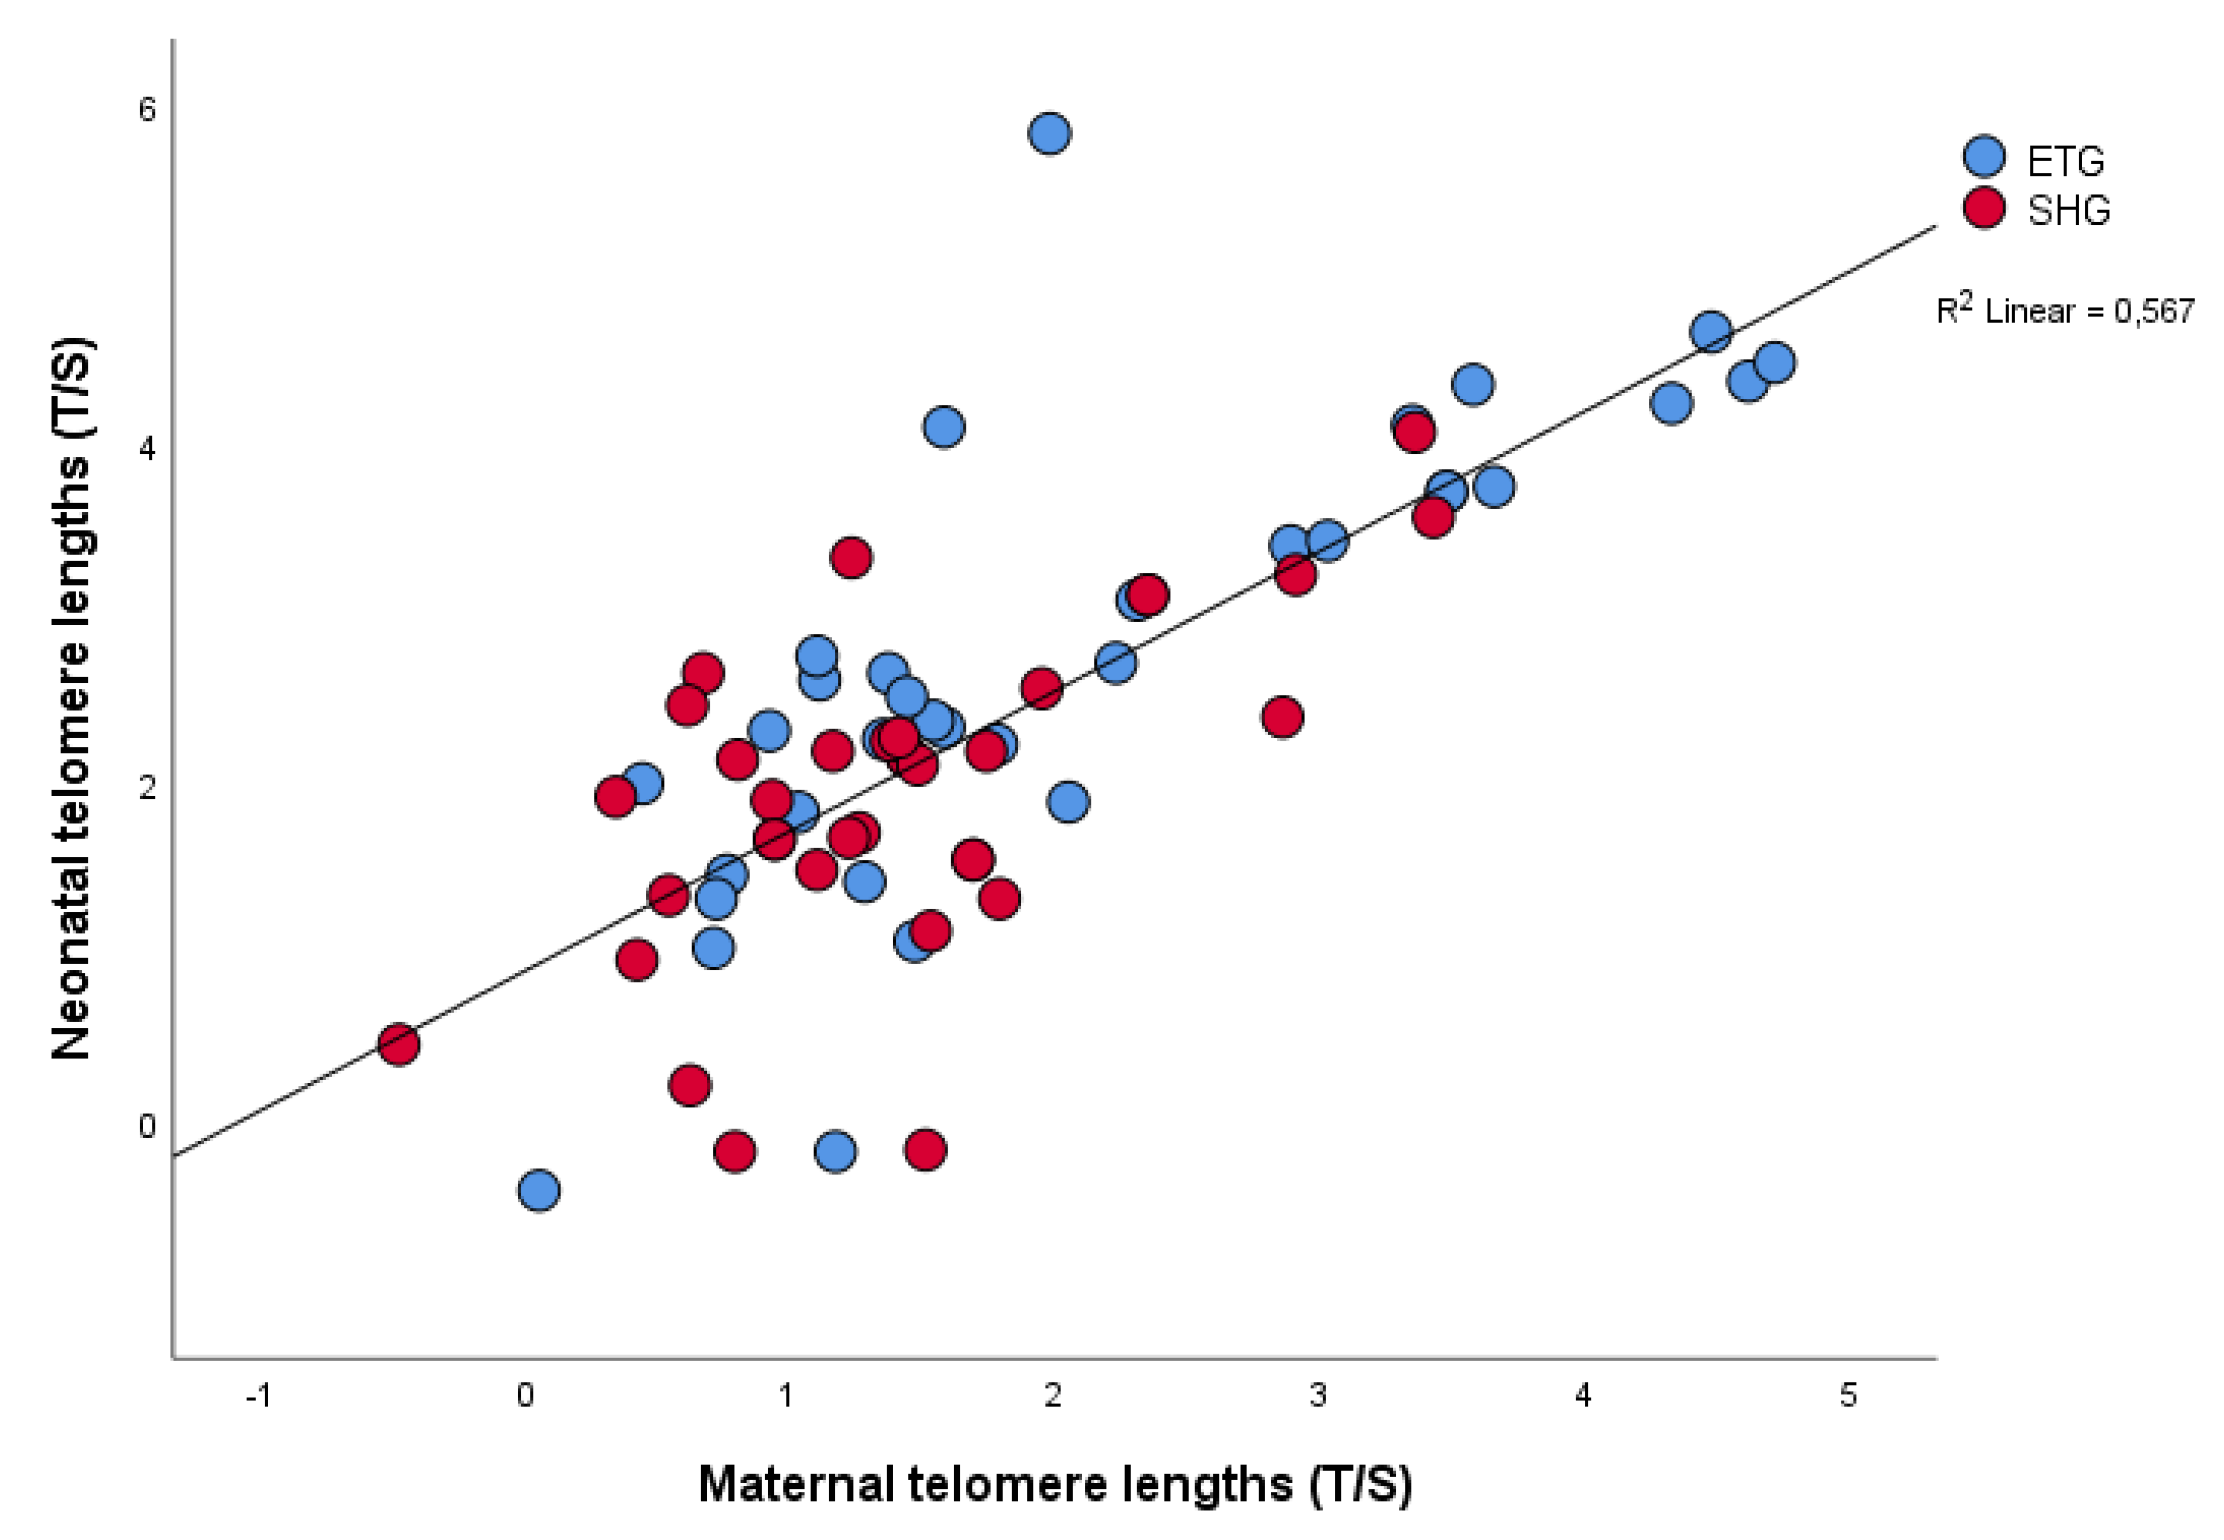

Table 1.
Table 1. Maternal demographics, obstetric, and laboratory data of two study groups.
| Variable | Maternal euthyroid group (ETG, n=35) Median IQR; Mean ± SD | Maternal subclinical hypothyroid group (SHG, n=35) Median IQR; Mean ± SD |
p |
| Age (years) | 31 (27-34) 30.8±5.0 |
31 (26-35) 30.1±6.1 |
0.908 0.609 |
| Duration of T1DM (y) | 15.0 (6.0-21.0) 14.8±9.5 |
14.0 (8.0-21.5) 14.1±8.0 |
0.854 0.798 |
| Less than 8 years n (%) | 11 (31.4) | 12 (34.3) | |
| More than 8 years n (%) | 24 (68.6) | 23 (65.7) | >0.9 |
| Years of onset T1DM (years) | 14.0 (9.0-25.0) 16.3±9.8 |
14.5 (9.0-23.0) 16.1±8.8 |
0.991 0.908 |
| Before 10 years n (%) | 13 (37.1) | 14 (40.0) | |
| After 10 years n (%) | 22 (62.9) | 21 (60.0) | >0.9 |
| Height (cm) | 166.6±5.7 | 165.2±4.9 | 0.610 |
| BMI before pregnancy (kg/m2) | 24.7±5.3 | 23.0±4.3 | 0.158 |
| BMI < 25 n (%) | 21 (60.0) | 26 (72.2) | |
| BMI 25–29.9 n (%) | 9 (25.7) | 5 (13.9) | |
| BMI ≥ 30 n (%) | 5 (14.3) | 5 (13.9) | 0.640 |
| Gestational weight gain (kg) |
13.6±5.2 |
12.3±3.9 |
0.158 |
| BMI at the time of CS (kg/m2) | 29.2±5.0 | 27.6±4.5 | 0.160 |
| BMI < 25 n (%) | 7 (20) | 11 (31.4) | |
| BMI 25–29.9 n (%) | 14 (40) | 16 (45.7) | |
| BMI ≥ 30 n (%) | 14 (40) | 8 (22.9) | 0.265 |
| Primiparous n (%) | 21 (60.0) | 20 (57.1) | |
| Multiparous n (%) | 14 (40.0) | 15 (42.9) | >0.9 |
| HbA1c in the first trimester (%) | 7.1±1.7 | 6.7±0.9 | 0.238 |
| HbA1c in the second trimester (%) | 6.5±1.4 | 6.2±0.8 | 0.349 |
| HbA1c in the third trimester (%) | 6.1±1.1 | 6.1±0.7 | 0.958 |
| TSH in first trimester (mIU/L) | 1.7 (1.1-2.0) | 3.2 (2.8-4.2) | <0.001 |
| FT3 in the first trimester (pmol/L) | 3.9 (3.6-4.3) | 3.6 (3.4-4.1) | 0.132 |
| FT4 in the first trimester (pmol/L) | 11.6 (11.0-12.2) | 11.7 (11.0-12.8) | 0.327 |
| BDNF in the first trimester (ng/L) | 861.8 (571.9-1152) | 736.6 (569.7-915.3) | 0.220 |
| BDNF at the time of CS (ng/L) | 613.8 (403.5-1031.0) | 586.1 (459.1-819.5) | 0.831 |
| Maternal serum glucose conc. at the time of CS (mmol/L) |
5.4 (4.3-7.0) |
5.2 (3.9-6.0) |
0.184 |
| Maternal telomere length (T/S) | 2.1±1.3 |
1.4±0.9 | 0.015 |
Data are n (%), median (IQR), and mean (SD). BMI= body mass index, BDNF= Brain-derived neurotrophic factor. TSH=Thyroid-stimulating hormone. CS=caesarean section. FT3 =Triiodthyronine. FT4 =thyroxine.
Table 2.
Neonatal and laboratory data of two study groups.
| Variable | Maternal euthyroid group (ETG, n=35) Median IQR; Mean ± SD | Maternal subclinical hypothyroid group (SHG, n=35) Median IQR; Mean ± SD |
p |
| Male n (%) | 15 (42.9) | 16 (45.7) | |
| Female n (%) | 20 (57.1) | 19 (54.3) | 0.500 |
| Term birth n (%) | 31 (88.6) | 32 (91.4) | |
| Preterm birth n (%) | 4 (11.4) | 3 (8.2%) | 0.500 |
| Birthweight (g) | 3456.6±624.7 | 3763.1±601.2 | 0.040 |
| Length (cm) | 48.8±2.5 | 50.1±2.3 | 0.030 |
| Ponderal index | 2.9±0.3 | 3.0±0.2 | 0.572 |
| Macrosomic newborn n (%) | 5 (14.3) | 13 (37.1) | |
| Euthrophic new-born n (%) | 30 (85.7) | 22 (62.9) | 0.029 |
| LGA n (%) | 6 (17.2) | 14 (40) | |
| AGA n (%) | 29 (82.8) | 21 (60) | 0.034 |
| Apgar index at 1 min | 9.8±0.5 | 9.9±0.4 | 0.597 |
| Apgar index at 5 min | 9.8±0.8 | 9.9±0.2 | 0.418 |
| Umbilical vein serum glucose conc. (mmol/L) | 4.4 (3.1-6.2) | 4.5 (3.2-5.3) | 0.509 |
| Umbilical vein serum C-peptide conc. | 0.75 (0.56-1.95) | 0.84 (0.51-1.55) | 0.767 |
| Umbilical vein serum BDNF conc. | 299.8 (185.7-450.4) | 303.6 (253.2-433.0) | 0.505 |
| Neonatal telomere lengths (T/S) | 2.7±1.4 | 2.0±0.9 | 0.010 |
Data are n (%), median (IQR), and mean (SD). BMI= body mass index, BDNF= Brain-derived neurotrophic factor. TSH=Thyroid-stimulating hormone. CS=caesarean section. FT3 =Triiodthyronine.
Table 3.
This is a table. Tables should be placed in the main text near to the first time they are cited.
Table 3.
This is a table. Tables should be placed in the main text near to the first time they are cited.
| rrho | p | |
| Maternal LTL: Neonatal LTL | 0.719 | <0.001 |
| Maternal LTL: BDNF conc. in 1 st trimester in maternal vein serum | 0.370 | 0.003 |
| Neonatal LTL: TSH in 1st trimester in maternal serum | - 0.296 | 0.018 |
| Neonatal LTL: Glucose conc. in maternal vein serum at Caesarean Section | - 0.411 | 0.006 |
| Neonatal LTL: BDNF conc. in 1st trimester in maternal vein serum | 0.510 | <0.001 |
| Neonatal LTL: C-peptide concentration in umbilical vein serum at birth | -0.275 | 0.045 |
LTL, Leukocyte telomere length; BDNF, Brain-derived neurotrophic factor; TSH, Thyroid-stimulating hormone.
Table 4.
Association between maternal and neonatal telomere lengths and pre-pregnancy BMI, GWG, TSH and BDNF in the first trimester of pregnancy.
Table 4.
Association between maternal and neonatal telomere lengths and pre-pregnancy BMI, GWG, TSH and BDNF in the first trimester of pregnancy.
| Maternal telomere length | Neonatal telomere length | |||
| Variable | β Coefficient (95% CI) | p | β Coefficient (95% CI) | p |
| Gestational weight gain (kg) | -0.259 (-0.122; -0.010) | 0.022 | -0.266 (-0.138; -0.009) | 0.026 |
| TSH in the first trimester (mIU/L) | -0.231 (-0.422; -0.015) | 0.036 | -0.237 (-0.493; - 0.010) | 0.041 |
| BDNF in the first trimester (ng/L) | 0.523 (0.790; 1.950) | <0.001 | 0.421 (0.536; 1.873) | 0.001 |
Adjusted with age and years of onset T1DM.
Disclaimer/Publisher’s Note: The statements, opinions and data contained in all publications are solely those of the individual author(s) and contributor(s) and not of MDPI and/or the editor(s). MDPI and/or the editor(s) disclaim responsibility for any injury to people or property resulting from any ideas, methods, instructions or products referred to in the content. |
© 2024 by the authors. Licensee MDPI, Basel, Switzerland. This article is an open access article distributed under the terms and conditions of the Creative Commons Attribution (CC BY) license (http://creativecommons.org/licenses/by/4.0/).
Copyright: This open access article is published under a Creative Commons CC BY 4.0 license, which permit the free download, distribution, and reuse, provided that the author and preprint are cited in any reuse.


