Submitted:
28 April 2024
Posted:
29 April 2024
Read the latest preprint version here
Abstract
Determining precise boundaries and protective zones for historical and cultural objects enables their effective preservation. This is particularly crucial in the face of increasing tourism, urbanization, and natural disasters. Accurately defining boundaries and protective zones can aid in the planning of scientific research, archaeological excavations, and other studies aimed at exploring the history and cultural significance of these objects. The article presents the framework for establishing protective zones around historical and cultural heritage sites existing in Ukraine, using the example of the Citadel defensive complex located in Lviv (Ukraine). It proposes general and detailed conceptual models for the combined application of remote and non-invasive methods for investigating historical and cultural heritage sites. This conceptual article introduces the theory of integrating radar satellite imaging with ground-based georadar imaging. Additionally, it presents a software module that has been developed to analyze collected data on two-dimensional historical and cultural heritage objects, refine their boundaries, and establish protective zones around them.
Keywords:
Remote Sensing
; GPR
; non-invasive methods
; historical and cultural heritage object
; protective zone
; boundary refinement
; software module
1. Introduction
The preservation of historical and cultural heritage immovable objects is imperative for maintaining a connection with our past, fostering cultural identity, and enriching the collective human experience. However, the challenges associated with demarcating accurate boundaries and establishing protective zones demand innovative solutions. Traditional methods often fall short of providing the necessary precision and comprehensive understanding of the site's dynamics. Remote investigation methods, such as satellite imaging and aerial surveys, present a promising avenue for overcoming these challenges. The contemporary relevance of refining boundaries and determining protective zones lies in the potential to harmonize cultural conservation with technological advancements, ensuring the sustainable protection of our invaluable heritage for future generations [1,2,3,4,5].
The issue of refining boundaries and determining protective zones for historical and cultural heritage sites using remote sensing methods has several aspects. The use of remote methods, such as satellite imaging or aerial photography, may be limited in the accuracy of geospatial data. This can lead to inaccuracies in refining object boundaries and determining protective zones. Collecting and analyzing data from various sources, such as geodetic measurements, historical documents, archaeological research, etc., requires the integration of diverse information [6,7]. The complexity of coordinating and analyzing this data can be a challenge. Determining protective zones and refining boundaries are subject to regulation and legislation. Problems may arise due to ambiguity in legislation, discrepancies in interpretation, or insufficient clarity regarding specific rules and standards [8,9,10,11,12,13,14,15]. The processes of refining boundaries and determining protective zones may provoke public dissatisfaction, especially when it concerns residential buildings or businesses. The degree of community involvement in decision-making and discussion of heritage conservation measures plays a significant role. The use of geographic information systems and new technologies, such as artificial intelligence may pose technical challenges, such as staff training, maintaining technical infrastructure, and ensuring data security. Historical and cultural objects may change over time. Management systems must be flexible and adaptable to changes in the environment and conditions. Addressing these issues requires a comprehensive approach, including close collaboration among surveying specialists, historians, archaeologists, community representatives, and legislators [16,17,18,19,20,21].
In recent years, Ukraine has faced challenges in accounting for planar immovable objects of historical and cultural heritage, especially those with partially or fully destroyed above-ground parts. Many such objects are privately owned or partially border private parcel. As a result, many of these objects have been subject to legal proceedings over boundaries and protective zones. In response, authorities have decided to temporarily register objects in point form as centroids of polygons, with protective zones measured from the centroid rather than the historical boundaries of the object. This approach allows for the registration of all historical and cultural heritage objects, followed by the establishment and adjustment of historical boundaries. This approach has both positive aspects and drawbacks, as the protective zone from the centroid may not always cover the entire territory of the object, especially if it has an irregular shape (Figure 1). The protective zone of a historical and cultural heritage object is set at 300 meters from the polygon centroid in undeveloped areas and may be reduced depending on the surrounding development through contractual agreements.
2. Materials and Methods
The aim of the study is to propose a conceptual model for refining the boundaries of historical and cultural heritage objects using remote and non-invasive methods. To achieve this goal, the Citadel defensive complex located in Lviv, Ukraine, and listed among the objects of national significance in terms of historical and cultural heritage, was chosen as the research polygon. The primary focus of the research was on spaceborne synthetic aperture radar (SAR) and ground-penetrating radar (GPR) imaging methods [22,23,24,25,26,27].
As input data for SAR analysis, 36 satellite images obtained from the Sentinel-1 satellite over two years from 2020 to 2022 were utilized. Ground-penetrating radar imaging was conducted at points of extreme vertical displacements of the Earth's surface, obtained from interferograms. Ground-penetrating radar imaging was performed using the UTSI GV3_1 GPR system (Figure 2). The main characteristics of this system are provided in Table 1.
We have developed and proposed a generalized and detailed conceptual model for conducting our research (Figure 3,4).
The generalized conceptual model comprises six main blocks, ranging from data collection from remote sensing and ground-penetrating radar imaging to the final analysis and interpretation of the acquired data. Additionally, the generalized conceptual model includes data processing and visualization, preliminary analysis and interpretation, data validation, ground investigations, and mapping of historical and cultural heritage objects [28,29,30].
The detailed conceptual model provides a thorough description of each research stage. It includes the collection, analysis, and interpretation of cartographic materials and remote sensing data, followed by branching into parallel processes of processing spaceborne radar images and obtaining interferograms, as well as obtaining orthophotos and point clouds from aerial imagery and UAV Lidar data (although in this research example, we focus only on radar interferometry and ground-penetrating radar imaging, the conceptual model describes the application of various remote and non-invasive research methods for a comprehensive study of historical and cultural heritage objects). The block of processing spaceborne radar images and obtaining interferograms is further divided into manual and semi-automatic result retrieval. Subsequently, a software module is developed for loading resulting data and constructing overall 3D models of surface and subsurface elements of historical and cultural heritage objects. After analyzing the acquired data, the overall research model of immovable historical and cultural heritage objects is constructed, followed by the semi-automatic establishment of protective zones for historical and cultural heritage objects based on the obtained data. Figure 5 also presents a technological scheme for implementing the conceptual model [31,32,33,34].
3. Results
The implementation of the set goal is demonstrated through the study of the historical and cultural heritage object, the Citadel defensive complex located in Lviv, where the Stalag-328 prisoner-of-war concentration camp was situated during World War II.
Using the obtained interferograms generated from 36 satellite images acquired from the Sentinel-1 satellite over three years from 2020 to 2022, we were able to identify the extremes of vertical ground displacements in the research area. By discarding the indicators of minimal displacements, only the maximum displacements were considered. There were 24 points identified with such displacements. The range of vertical ground displacements at these points varies from 17 to 36 centimeters. Additional investigations led to the exclusion of 5 points located within the object's territory in the built-up area. It was hypothesized that the vertical displacements in the built-up area may have occurred due to specific repair works.
Furthermore, based on previous research [35], the territory of prisoner shootings and fraternal burials was overlaid onto the modern topographic plan of 2007 at a scale of 1:5000. Therefore, the points of extreme vertical displacements were color-coded: green for those falling within the areas of shootings and burials, yellow for those falling on the paved infrastructure likely formed by repair works, and red for those falling on the undeveloped territory. Additionally, the current boundary of the historical and cultural heritage object, represented by a thick black line, is delineated on the plan (Figure 6).
The analysis of vertical displacements can reveal potential threats to historical structures, such as precipitation, erosion, soil subsidence, or geodynamic processes. This allows appropriate measures to be taken to prevent potential damage or destruction. Information about vertical displacements can be used for planning restoration work and preserving historical structures. This enables effective restoration measures that take into account the potential impacts of geodynamic processes [36,37]. Maps of vertical displacements serve as documentation of the state of historical structures at a certain period in time. This is important for archiving and monitoring changes over time, as well as for further scientific research. Smoothed maps of maximum vertical displacements of the Earth's surface in the territory of the Citadel for the years 2020-2022 are presented in Figure 7.
After determining the points of maximum surface displacements using radar interferometry, we proceeded with ground-based non-invasive investigations using ground-penetrating radar (GPR). Seven points were processed, that raised the most questions, and were located either on the boundary of the historical and cultural heritage object or beyond it. Anomalies of artifacts were deciphered on the radargrams at two points, one located on the current territory of the tennis court, and the other beyond the boundary of the current object.
Figure 8 illustrates the interval of object AOI1 at a depth of approximately 0.68 meters (t=13.75 ns). Attention should be drawn to the darker visualization parts (higher amplitude) on the left side in the center of the object, indicating a possible disturbance that may have occurred during the construction of the tennis courts.
Figure 9 illustrates the interval of the object at a depth of approximately 0.78 meters (t=15.63 ns). The termination of this object can be observed at AOI2. A rectangular object can be seen below the center of the image. The soil outside the 1944 fence is located on the right side.
Using the newly acquired data from radar and ground-penetrating radar surveys, the boundaries of the historical and cultural heritage site, as established by the Ministry of Culture of Ukraine to date, were overlaid onto the modern topographic map from 2007, at a scale of 1:1000. Additionally, adjustments were made to the boundaries in light of the newly discovered underground artifacts (Figure 10).
For the validation of the conceptual model for refining the boundaries of historical and cultural heritage sites and establishing protection zones around these sites, a software module has been developed and programmed. This module processes the synthetic aperture radar (SAR) data of the surface part and the ground-penetrating radar (GPR) profiles of the underground part of the object [38,39]. The main challenge in developing this software module was to mathematically integrate the results obtained from SAR and GPR.
Mathematical reconciliation of radar and ground-penetrating radar (GPR) data can be achieved using various data processing methods, including filtering and signal processing techniques. One approach to reconciling the results involves utilizing filtering algorithms such as the Kalman filter. This method relies on computing the system state estimation based on processed information from all sources and modeling the system using stochastic differential equations. Another approach to reconciling the data involves using signal processing algorithms like correlation analysis. This method is based on comparing signals obtained from different sources and determining the degree of their correspondence. Additionally, other mathematical methods such as principal component analysis, classification methods, and pattern recognition can be employed to reconcile the data processing results.
Regardless of the approach, when reconciling the results of radar and GPR data processing, it is essential to consider the characteristics of each method and data source and ensure the quality and accuracy of data processing.
To combine the results of spaceborne radar interferometry from the Sentinel-1 satellite and GPR imaging at a specific point, a weighted approach can be utilized (1).
where:
R= α∙C_i+β∙C_g
R - the result of combining the two methods for a specific point on the surface;
α and β - weights that determine the importance of each data source in the combined result. These weights can be determined by experts or through optimization depending on the specific application;
Ci - the measurement result obtained from spaceborne radar interferometry at a specific point;
Cg - the result of ground-penetrating radar imaging at the same point;
This approach allows combining information from both sources to obtain a more complete and reliable representation of a specific point.
The formula for combining InSAR (Interferometric Synthetic Aperture Radar) and GPR (Ground Penetrating Radar) can be complex and depend on specific use cases. However, the general idea is to integrate information obtained from both sources to improve the accuracy of interpreting and analyzing geological structures or soil properties.
A possible general formula (2) could be:
Here, f is a function that may include various data processing operations, filtering, and other analysis methods to achieve a more accurate result.
For the creation of the software module, a technological scheme was proposed, as shown in Figure 11.
To automate the described processes, a software module was developed in the VisualBasic programming language for refining the boundaries of historical and cultural heritage sites. Although VisualBasic is less suitable for programming cartographic elements compared to, for example, Python, its advantage lies in its object-oriented nature and full integration with the Windows operating system. By using additional modules available for VisualBasic, we were able to implement the assigned task.
For testing and validation of the created software module, graphical materials on the Lviv Citadel were used in raster and vector formats, namely: Citadel's Cadastral Map in GeoTIFF format, radarogram of radar scanning of individual areas of interest of the Citadel in GeoTIFF format, vector layer of digitized radarogram anomalies in DXF vector format, and the boundary of the historical and cultural heritage site in DXF vector format.
The program execution started with testing the first functional block "Data Loading." When the command "Load 3D Model" is executed, the GeoTIFF format CAD model of the Citadel is loaded.
Next, we proceed to the next step - loading the radiogram obtained from the ground-penetrating radar survey in GeoTIFF format. Then, commands to load vectorized anomalies based on the radiograms of ground-penetrating radar survey are executed in DXF vector exchange format.
In fact, the dataset loaded in the window in Figure 12 is final for analysis, and we can proceed to the next functional block. The first command executed in the second block is "Boundary Analysis," and its execution is hidden, with the result being loaded into the computer's memory. That is, after executing this command, the picture inside the window remains unchanged. This command performs an overlay analysis of the loaded data, after which the module determines whether all additional elements fit within the existing object boundary. If so, the next commands are unnecessary. If not, the software rebuilds the boundary according to the newly identified elements.
The next step is executing the command for boundary reconstruction (Figure 13), as a result of which the program visualizes the outcome of the previous step from its memory in the data field. After the reconstruction of the object's boundaries according to the new elements, the protective zone of the cultural heritage object is constructed (Figure 14).
The result of the module execution is the reconstructed updated boundary of the object of historical and cultural heritage with an automatically generated protective zone (Figure 14). This result can then be exported to the exchange vector format DXF and opened in any geographic information system or CAD system for further work.
It is worth noting that this module is advisable to apply to already registered objects of cultural heritage based on the centroids of polygons when there is a need for directly refining the boundaries of the object itself.
4. Discussion
Many Non-Destructive Techniques (NDT) can be fused into monitoring selected infrastructure [40] or searching objects of interest. In our approach, InSAR data are used initially to detect locations for more detailed analyses with more detailed technology (GPR). Such an approach was presented in [41] where a large dataset of SAR images from both the Sentinel 1A and COSMO-SkyMed and GPR data was tested for long railway line inventory. In this case data sets were collected with both techniques for whole corridor mapping but similarly to our approach spots detected to subsidence were deeply analysed with GPR observations. In some approaches, those two radar techniques can be complementary to each other. In some examples, SAR and GPR can be used in one investigation but they are used and analyzed separately [42] in a common investigation which can provide additive benefits. An example of such methodology was presented in [43] where it was stated that despite GPR and PS-InSAR methodologies can both collect a considerable amount of data, outcomes are incomplete if considered singularly. The last example of an approach was the integration of these two radar technologies can be related somehow is using one technology in the verification of another. In some examples, SAR as technology providing lower-resolution data can be verified with GPR that is collected onsite with remote sensing techniques [45]. Considering cultural heritage, the role of radar techniques and their integration has grown rapidly last years [44]. Such integration always requires, first of all, appropriate georeferencing in the common reference frame, which gives the possibility of integrating layers in the geographic information system.
5. Conclusions
The refinement of boundaries for historical and cultural heritage immovable objects and the determination of their protective zones using remote sensing methods represent crucial steps in preserving and safeguarding these invaluable assets. Through the application of remote sensing techniques, such as satellite imagery and ground-penetrating radar, precise boundaries can be delineated, allowing for effective management and conservation efforts. This conceptual approach not only aids in the identification of potential threats to heritage sites but also facilitates the planning of archaeological excavations and scientific research initiatives aimed at further understanding the historical and cultural significance of these objects. By integrating remote sensing data into the geographical information system, comprehensive models can be developed to guide conservation strategies and mitigate risks associated with urbanization, tourism, and natural disasters. Overall, the utilization of remote sensing methods offers a valuable toolset for enhancing the protection and preservation of historical and cultural heritage immovable objects for future generations.
The conceptual and detailed models are proposed for the study of cultural heritage objects using remote and non-invasive methods, and a technological scheme for their implementation has been developed. Extremes of vertical displacements of the Earth's surface within the territory of the Citadel, an object of cultural heritage in Lviv, were determined based on interferograms created using the radar interferometry method from 36 Sentinel-1 satellite images spanning from 2020 to 2022. A total of 24 such points were identified.
The obtained extremes of vertical displacements were investigated using ground-penetrating radar imaging. Special attention was paid to two areas where anomalies were observed, one of which lies beyond the currently established boundary of the object.
A software module for refining the boundaries of cultural heritage objects and determining their protective zones has been developed and programmed. Additionally, a technological scheme for implementing the module development process has been provided.
Author Contributions
Methodology development: B.Ch.; writing – original draft: V.H..; writing – review and editing: K.B.
Funding
Research financed from own sources. The APC was funded by the Polish National Agency for Academic Exchange within the project “Development of strategic cooperation between Warsaw University of Technology and Lviv Polytechnic National University in the field of geomatics” agreement number BPI/PST/2021/1/00044/U/00001.
Data Availability Statement
Data are unavailable due to privacy and ethical restrictions.
Conflicts of Interest
The authors declare no conflict of interest. The funders had no role in the design of the study; in the collection, analyses, or interpretation of data; in the writing of the manuscript; or in the decision to publish the results.
References
- Liu Y, Tang Y, Jing L, Chen F, Wang P. Remote Sensing-Based Dynamic Monitoring of Immovable Cultural Relics, from Environmental Factors to the Protected Cultural Site: A Case Study of the Shunji Bridge. Sustainability. 2021; 13(11):6042. [CrossRef]
- Koeva M, Luleva M, Maldjanski P. Integrating Spherical Panoramas and Maps for Visualization of Cultural Heritage Objects Using Virtual Reality Technology. Sensors. 2017; 17(4):829. [CrossRef]
- Moise C, Dana Negula I, Mihalache CE, Lazar AM, Dedulescu AL, Rustoiu GT, Inel IC, Badea A. Remote Sensing for Cultural Heritage Assessment and Monitoring: The Case Study of Alba Iulia. Sustainability. 2021; 13(3):1406. [CrossRef]
- Megarry, W.P.; Cooney, G.; Comer, D.C.; Priebe, C.E. Posterior Probability Modeling and Image Classification for Archaeological Site Prospection: Building a Survey Efficacy Model for Identifying Neolithic Felsite Workshops in the Shetland Islands. Remote Sens. 2016, 8, 529. [Google Scholar] [CrossRef]
- Borie, C.; Parcero-Oubiña, C.; Kwon, Y.; Salazar, D.; Flores, C.; Olguín, L.; Andrade, P. Beyond Site Detection: The Role of Satellite Remote Sensing in Analysing Archaeological Problems. A Case Study in Lithic Resource Procurement in the Atacama Desert, Northern Chile. Remote Sens. 2019, 11, 869. [Google Scholar]
- Tapete, D.; Cigna, F. Appraisal of Opportunities and Perspectives for the Systematic Condition Assessment of Heritage Sites with Copernicus Sentinel-2 High-Resolution Multispectral Imagery. Remote Sens. 2018, 10, 561. [Google Scholar] [CrossRef]
- Bai, X.; Du, P.; Guo, S.; Zhang, P.; Lin, C.; Tang, P.; Zhang, C. Monitoring Land Cover Change and Disturbance of the Mount Wutai World Cultural Landscape Heritage Protected Area, Based on Remote Sensing Time-Series Images from 1987 to 2018. Remote Sens. 2019, 11, 1332. [Google Scholar] [CrossRef]
- Elfadaly, A.; Shamseldein, A.; Lasaponara, R. Cultural Heritage Management Using Remote Sensing Data and GIS Techniques around the Archaeological Area of Ancient Jeddah in Jeddah City, Saudi Arabia. Sustainability 2020, 12, 240. [Google Scholar] [CrossRef]
- Tang, P.; Chen, F.; Zhu, X.; Zhou, W. Monitoring Cultural Heritage Sites with Advanced Multi-Temporal InSAR Technique: The Case Study of the Summer Palace. Remote Sens. 2016, 8, 432. [Google Scholar] [CrossRef]
- Zhou, W.; Chen, F.; Guo, H. Differential Radar Interferometry for Structural and Ground Deformation Monitoring: A New Tool for the Conservation and Sustainability of Cultural Heritage Sites. Sustainability 2015, 7, 1712–1729. [Google Scholar] [CrossRef]
- Cigna, F.; Lasaponara, R.; Masini, N.; Milillo, P.; Tapete, D. Persistent Scatterer Interferometry Processing of COSMO-SkyMed StripMap HIMAGE Time Series to Depict Deformation of the Historic Centre of Rome, Italy. Remote Sens. 2014, 6, 12593–12618. [Google Scholar] [CrossRef]
- Lasaponara, R.; Elfadaly, A.; Attia, W. Low cost space technologies for operational change detection monitoring around the archaeological area of Esna‐Egypt. In Lecture Notes in Computer Science, Proceedings of the Computational Science and Its Applications–ICCSA 2016, Beijing, China, 4–7 July 2016; Gervasi, O., Murgante, B., Misra, S., Rocha, A.M.A.C., Torre, C.M., Taniar, D., Apduhan,B.O., Stankova, E., Wang, S., Eds.; Springer: Cham, Germany, 2016; Volume 9787.
- Tofani, V.; Raspini, F.; Catani, F.; Casagli, N. Persistent Scatterer Interferometry (PSI) Technique for Landslide Characterization and Monitoring. Remote Sens. 2013, 5, 1045–1065. [Google Scholar] [CrossRef]
- Drahor, M.G. A review of integrated geophysical investigations from archaeological and cultural sites under encroaching urbanisation in ˙Izmir, Turkey. Phys. Chem. Earth 2011, 36, 1294–1309. [Google Scholar] [CrossRef]
- Elfadaly, A.; Attia, W.; Qelichi, M.M.; Murgante, B.; Lasaponara, R. Management of Cultural Heritage Sites Using Remote Sensing Indices and Spatial Analysis Techniques. Surv. Geophys. 2018, 39, 1347–1377. [Google Scholar] [CrossRef]
- Beraldin, J.A.; Picard, M.; El-Hakim, S.F.; Godin, G.; Valzano, V.; Bandiera, A. Combining 3D technologies for cultural heritage interpretation and entertainment. In Electronic Imaging; International Society for Optics and Photonics: Bellingham, WA, USA, 2005; pp. 108–118. [Google Scholar]
- Remondino, F.; Girardi, S.; Gonzo, L.; Rizzi, A. Multiresolution modeling of complex and detailed cultural heritage. In Proceedings of the 9th International Symposium on Virtual Reality, Archaeology and Cultural Heritage (VAST 2008), Braga, Portugal, 2–5 December 2008; pp. 1–8. [Google Scholar]
- Remondino, F.; Rizzi, A.; Agugiaro, G.; Girardi, S.; De Amicis, R.; Magliocchetti, D.; Girardi, G.; Baratti, G. Geomatics and geoinformatics for digital 3D documentation, fruition and valorization of cultural heritage. In Proceedings of the EUROMED 2010 Workshop on Museum Futures: Emerging Technological and Social Paradigms, Lemessos, Cyprus, 8–13 November 2010; pp. 8–13. [Google Scholar]
- Meyer, D.; Fraijo, E.; Lo, E.; Rissolo, D.; Kuester, F. Optimizing UAV systems for rapid survey and reconstruction of large scale cultural heritage sites. In Proceedings of Digital Heritage, Granada, Spain, 28 September–2 October 2015. [Google Scholar]
- Themistocleous, K.; Ioannides, M.; Agapiou, A.; Hadjimitsis, D.G. The methodology of documenting cultural heritage sites using photogrammetry, UAV, and 3D printing techniques: The case study of Asinou church in Cyprus. In Proceedings of the Third International Conference on Remote Sensing and Geoinformation of the Environment, Paphos, Cyprus, 16–19 March 2015. [Google Scholar]
- Rinaudo, F.; Chiabrando, F.; Nex, F.; Piatti, D. New instruments and technologies for cultural heritage survey: Full integration between point clouds and digital photogrammetry. In Digital Heritage; Springer: Berlin/Heidelberg, Germany. pp. 56–70, 2010. [Google Scholar]
- Lisini, G.; Tison, C.; Tupin, F.; Gamba, P. Feature fusion to improve road network extraction in high-resolution SAR images. IEEE Geosci. Remote Sens. Lett. 2006, 3, 217–221. [Google Scholar] [CrossRef]
- Roenholm, P.; Honkavaara, E.; Litkey, P.; Hyyppä, H.; Hyyppä, J. Integration of laser scanning and photogrammetry. In Proceedings of the ISPRS Workshop on Laser Scanning 2007 and SilviLaser 2007, Espoo, Finland, 12–14 September 2007; pp. 355–362. [Google Scholar]
- Fangi, G.; Clini, P.; Fiori, F. Simple and quick digital technique for the safeguard of Cultural Heritage. In The Rustem Pasha Mosque in Istanbul. In Proceedings of the Digital Media and its Application in Cultural Heritage, Amman, Jordan, 5–6 November 2008; pp. 209–217. [Google Scholar]
- Kersten, T.P.; Lindstaedt, M. Image-based low-cost systems for automatic 3D recording and modelling of archaeological finds and objects. In Progress in Cultural Heritage Preservation; Springer: Berlin/Heidelberg, Germany, 2012; pp. 1–10. [Google Scholar]
- García-Gago, J.; González-Aguilera, D.; Gómez-Lahoz, J.; San José-Alonso, J.I. A photogrammetric and computer vision-based approach for automated 3D architectural modeling and its typological analysis. Remote Sens. 2014, 6, 5671–5691. [Google Scholar] [CrossRef]
- Andretta, M.; Coppola, F.; Modelli, A.; Santopuoli, N.; Seccia, L. Proposal for a new environmental risk assessment methodology in cultural heritage protection. J. Cult. Herit. 2017, 23, 22–32. [Google Scholar] [CrossRef]
- Figueiredo, R.; Romo, X.; Paupério, E. Flood risk assessment of cultural heritage at large spatial scales: Framework and application to mainland Portugal. J. Cult. Herit. 2020, 43, 163–174. [Google Scholar] [CrossRef]
- Luo, L.; Wang, X.; Guo, H.; Lasaponara, R.; Zong, X.; Masini, N.; Wang, G.; Shi, P.; Khatteli, H.; Chen, F.; et al. Airborne and spaceborne remote sensing for archaeological and cultural heritage applications: A review of the century (1907–2017). Remote Sens. Environ. 2019, 232, 232. [Google Scholar] [CrossRef]
- Luo, L.; Wang, X.; Lasaponara, R.; Xiang, B.; Zhen, J.; Zhu, L.; Yang, R.; Liu, D.; Liu, C. Auto-extraction of linear archaeological traces of Tuntian Irrigation Canals in Miran Site (China) from Gaofen-1 satellite imagery. Remote Sens. 2018, 10, 718. [Google Scholar] [CrossRef]
- Lopes, A.S.; Macedo, D.V.; Brito, A.; Furtado, V. Assessment of urban cultural-heritage protection zones using a co-visibilityanalysis tool. Comput. Environ. Urban Syst. 2019, 76, 139–149. [Google Scholar] [CrossRef]
- Choi, Y.; Yang, Y.J.; Sohn, H.G. Resilient cultural heritage through digital cultural heritage cube: Two cases in South Korea. J. Cult. Herit. 2021, 48, 36–44. [Google Scholar] [CrossRef]
- Banerjee, R.; Srivastava, P.K. Reconstruction of contested landscape: Detecting land cover transformation hosting cultural heritage sites from Central India using remote sensing. Land Use Policy 2013, 34, 193–203. [Google Scholar] [CrossRef]
- Elfadaly, A.; Eldein, A.S.; Lasaponara, R. Cultural heritage management using remote sensing data and GIS techniques around the archaeological area of Ancient Jeddah in Jeddah City, Saudi Arabia. Sustainability 2019, 12, 240. [Google Scholar] [CrossRef]
- Chetverikov, B. , Babiy L. Determination of boundaries of ancient burial places using the archived aerial and cartographic materials// Modern achievements of geodesic science and industry. – Vol.І(31). – 2016. – P. 111‐114.
- Agapiou, A.; Lysandrou, V.; Alexakis, D.D.; Themistocleous, K.; Cuca, B.; Argyriou, A.; Sarris, A.; Hadjimitsis, D.G. Cultural heritage management and monitoring using remote sensing data and GIS: The case study of Paphos area, Cyprus. Comput. Environ. Urban Syst. 2015, 54, 230–239. [Google Scholar] [CrossRef]
- Aminzadeh, B.; Samani, F. Identifying the boundaries of the historical site of Persepolis using remote sensing. Remote Sens. Environ. 2006, 102, 52–62. [Google Scholar] [CrossRef]
- Tsiafaki, D.; Michailidou, N. Benefits and problems through the application of 3d technologies in archaeology: Recording, visualisation, representation and reconstruction. Sci. Cult. 2015, 1, 37–45. [Google Scholar]
- Hatzopoulos, J.N.; Stefanakis, D.; Georgopoulos, A.; Tapinaki, S.; Pantelis, V.; Liritzis, I. Use of various surveying technologies to 3d digital mapping and modelling of cultural heritage structures for maintenance and restoration purposes: The tholos in DELPHI, GREECE. Mediterr. Archaeol. Archaeom. 2017, 17, 311–336. [Google Scholar]
- Koohmishi, M. , Kaewunruen, S., Chang, L., & Guo, Y. (2024). Advancing railway track health monitoring: Integrating GPR, InSAR and machine learning for enhanced asset management. Automation in Construction, 162, 105378.
- Bianchini Ciampoli, L., Gagliardi, V., Clementini, C., Latini, D., Del Frate, F., & Benedetto, A. (2020). Transport infrastructure monitoring by InSAR and GPR data fusion. Surveys in Geophysics, 41, 371‐394.
- D'Amico, F. , Gagliardi, V., Ciampoli, L. B., & Tosti, F. (2020). Integration of InSAR and GPR techniques for monitoring transition areas in railway bridges. NDT & E International, 115, 102291.
- Chen, F., Guo, H., Tapete, D., Cigna, F., Piro, S., Lasaponara, R., & Masini, N. (2022). The role of imaging radar in cultural heritage: From technologies to applications. International Journal of Applied Earth Observation and Geoinformation, 112, 102907.
- Jiang, A. H. , Chen, F. L., Tang, P. P., Liu, G. L., Liu, W. K., Wang, H. C.,... & Zhao, X. L. (2017, February). Radar remote sensing for archaeology in Hangu Frontier Pass in Xin’an, China. In IOP Conference Series: Earth and Environmental Science (Vol. 57, No. 1, p. 012031). IOP Publishing.
- Chetverikov, B. , Protsyk M. (2023) Analysis of vertical ground displacements of the Lviv Citadel territory based on radar survey data// International Conference of Young Professionals “GeoTerrace-2023” 2-, Lviv, Ukraine. 4 October.
Figure 1.
Buffer zones constructed around the centroid of the object and around the centroid of irregularly shaped polygons.
Figure 1.
Buffer zones constructed around the centroid of the object and around the centroid of irregularly shaped polygons.
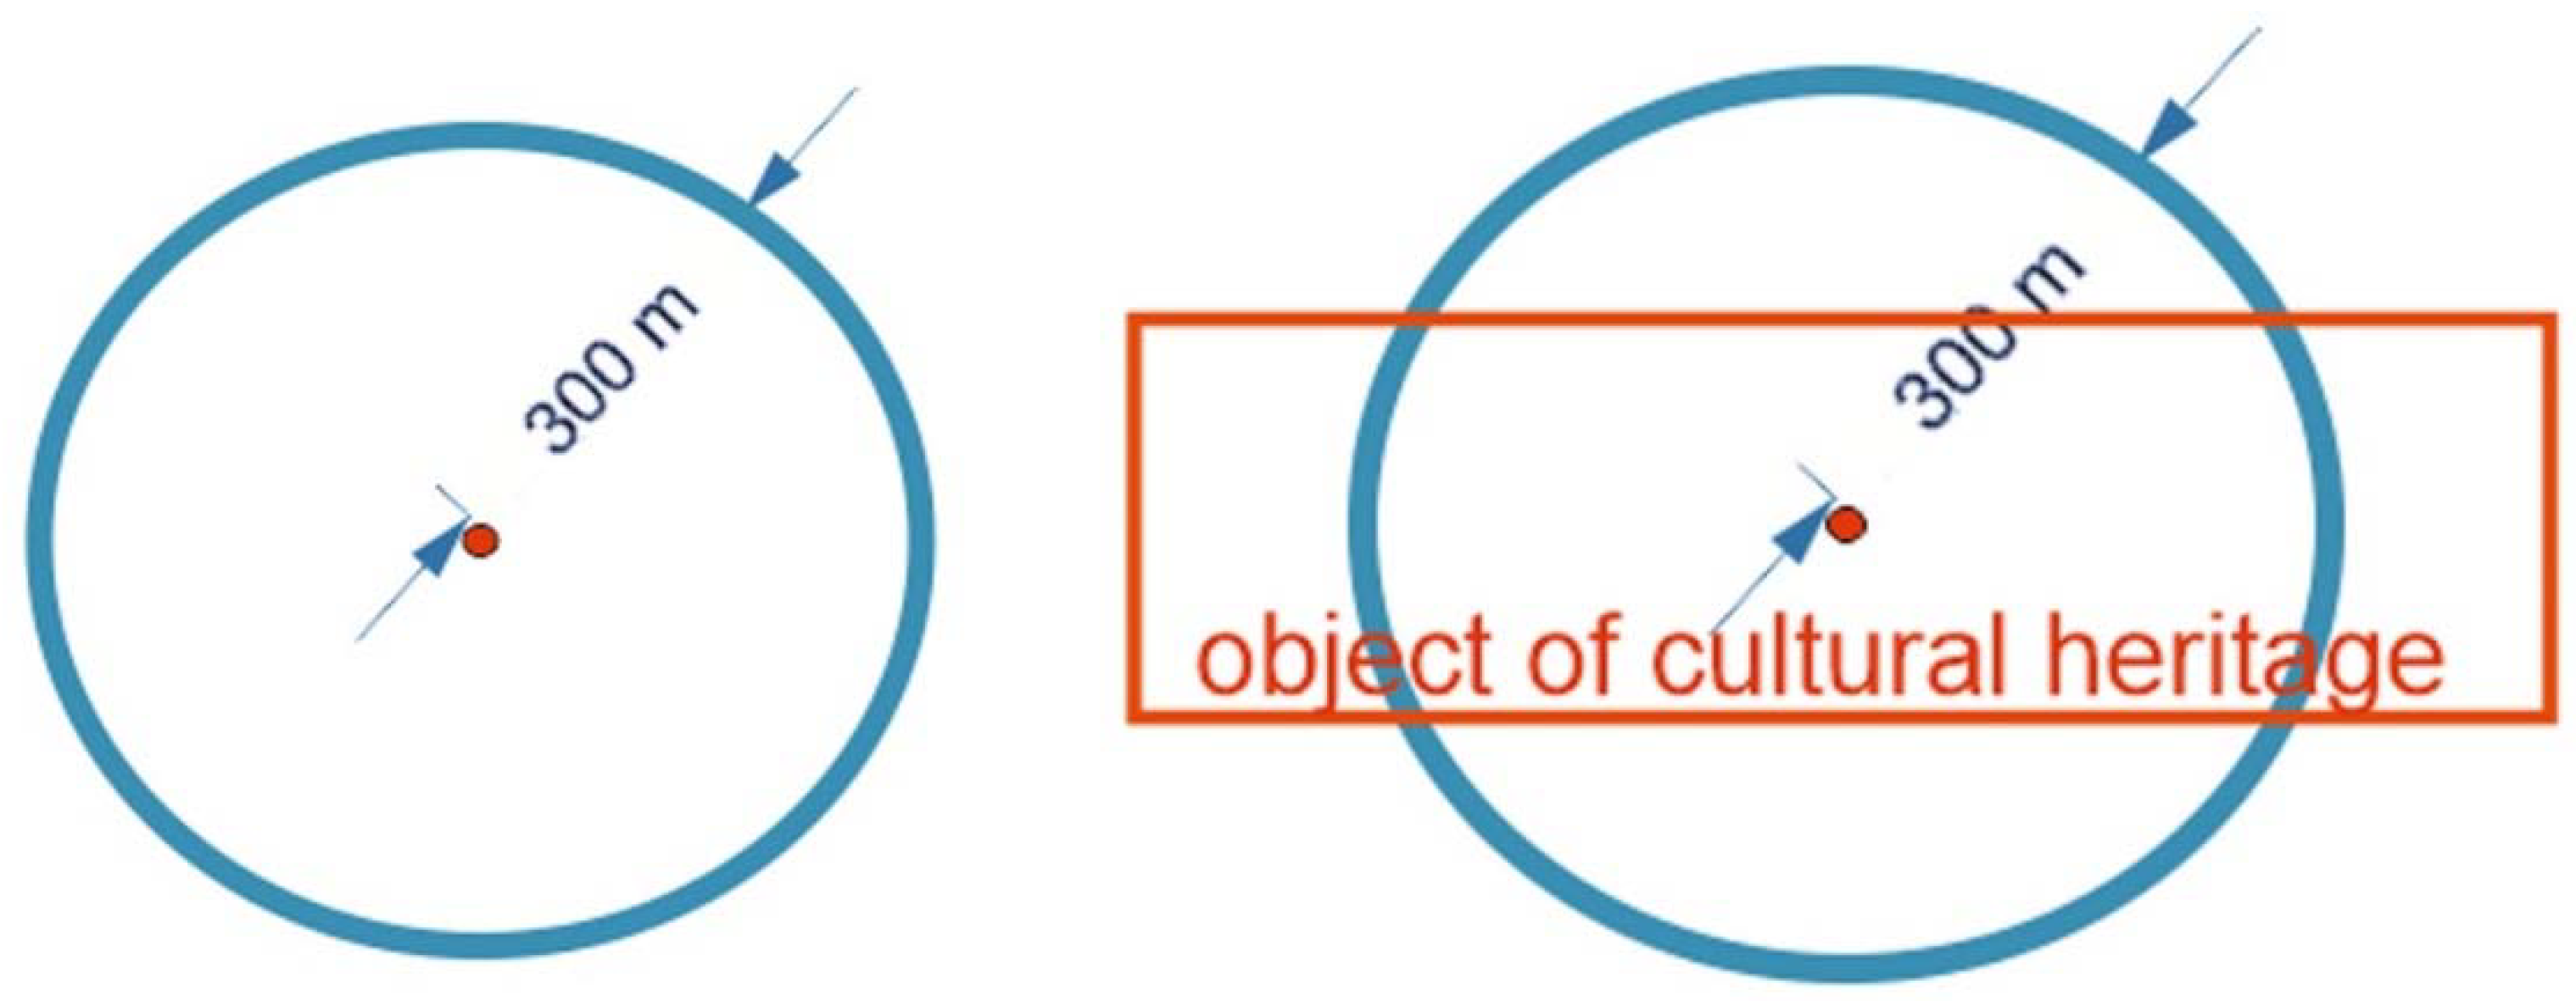
Figure 2.
Sensor used - UTSI GV3_1 GPR
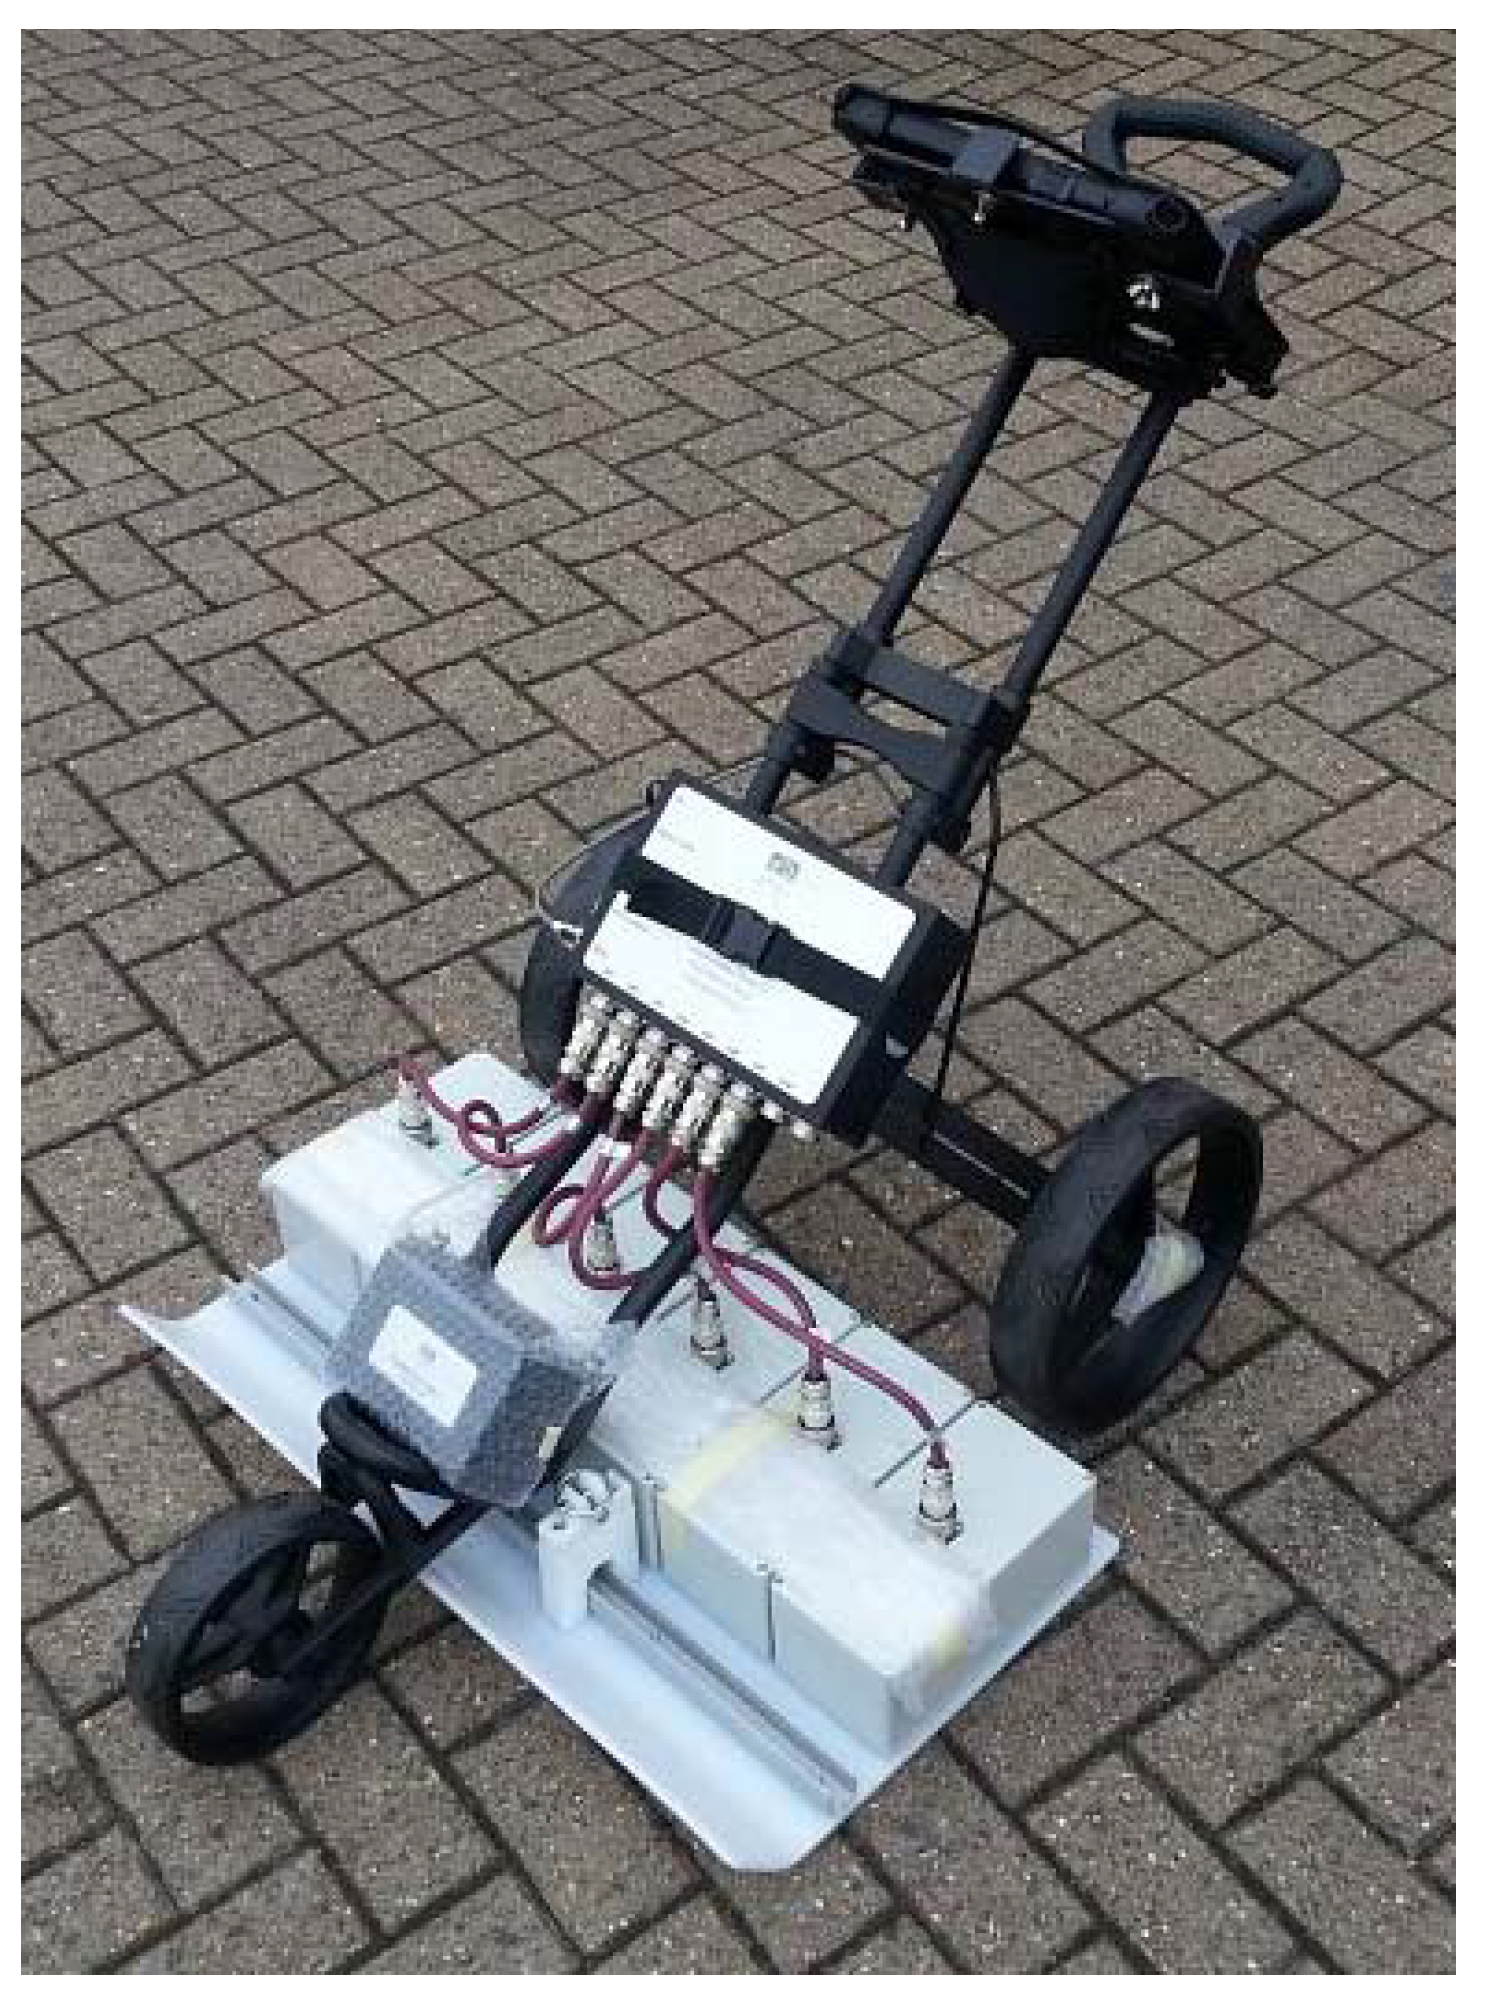
Figure 3.
The conceptual model for using remote sensing and ground-penetrating radar data to study historical and cultural heritage land.
Figure 3.
The conceptual model for using remote sensing and ground-penetrating radar data to study historical and cultural heritage land.
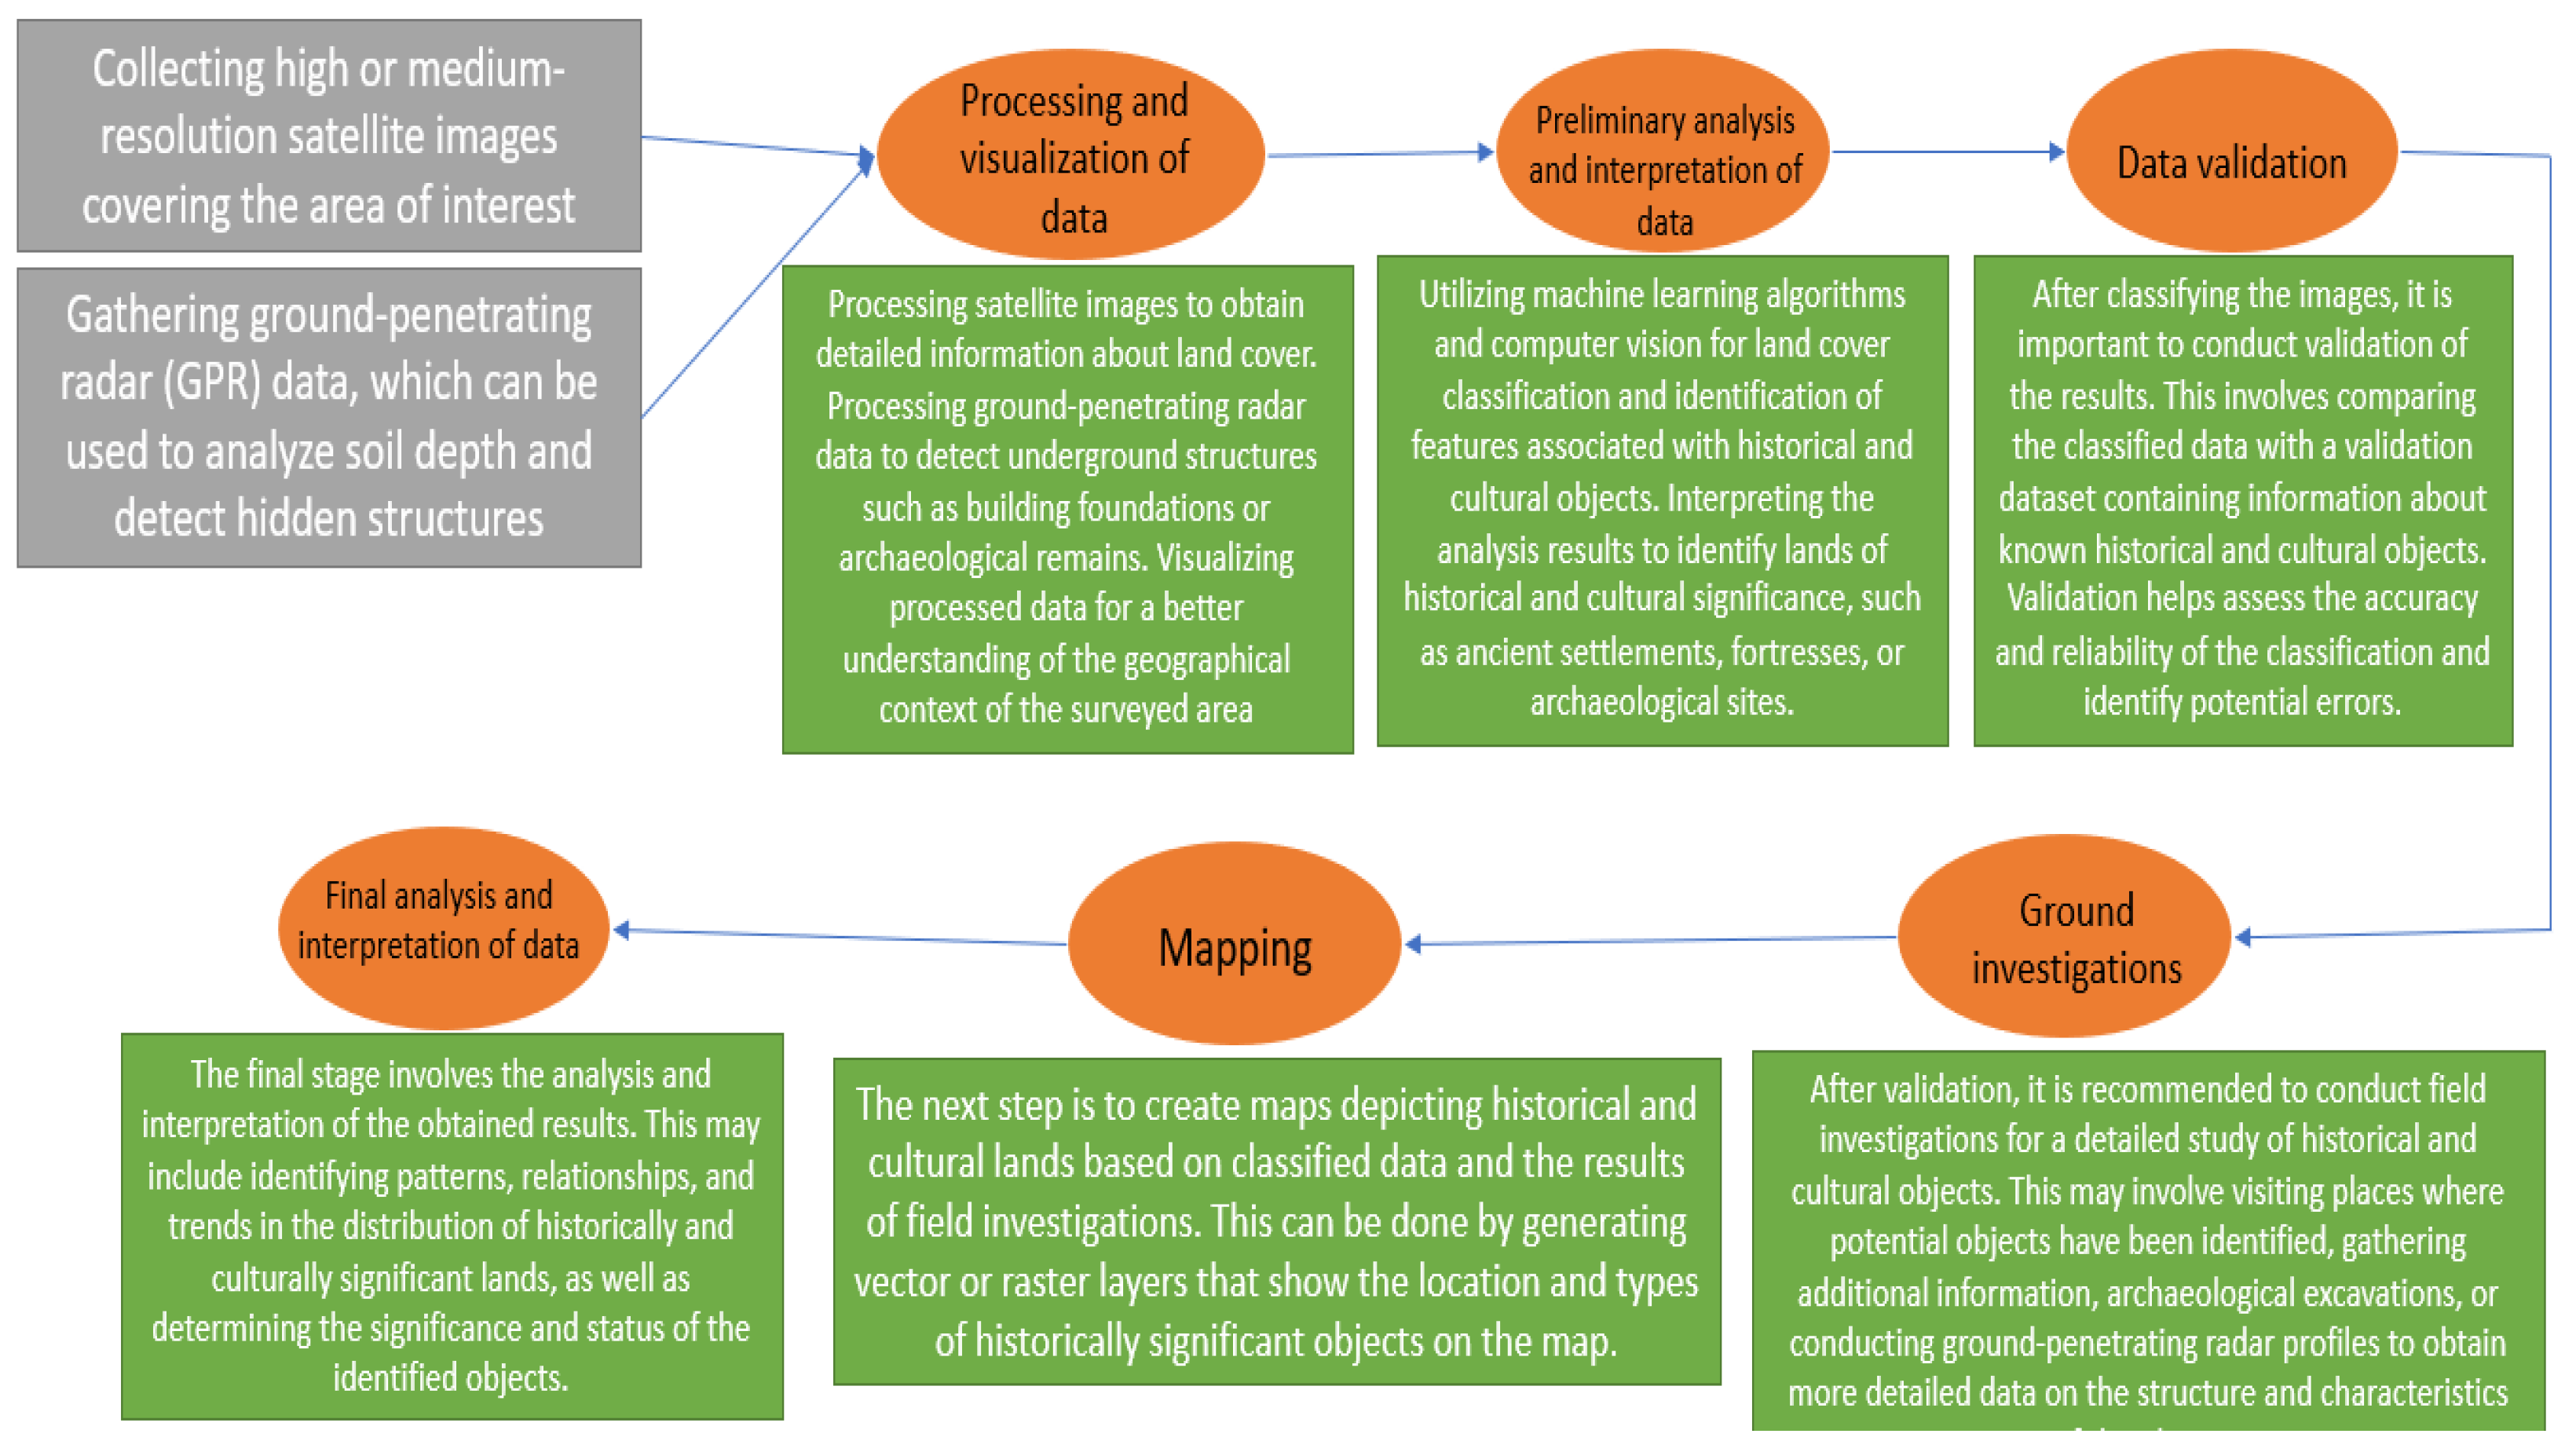
Figure 4.
Detailed conceptual model for using remote sensing and ground-penetrating radar data to study historical and cultural heritage land.
Figure 4.
Detailed conceptual model for using remote sensing and ground-penetrating radar data to study historical and cultural heritage land.
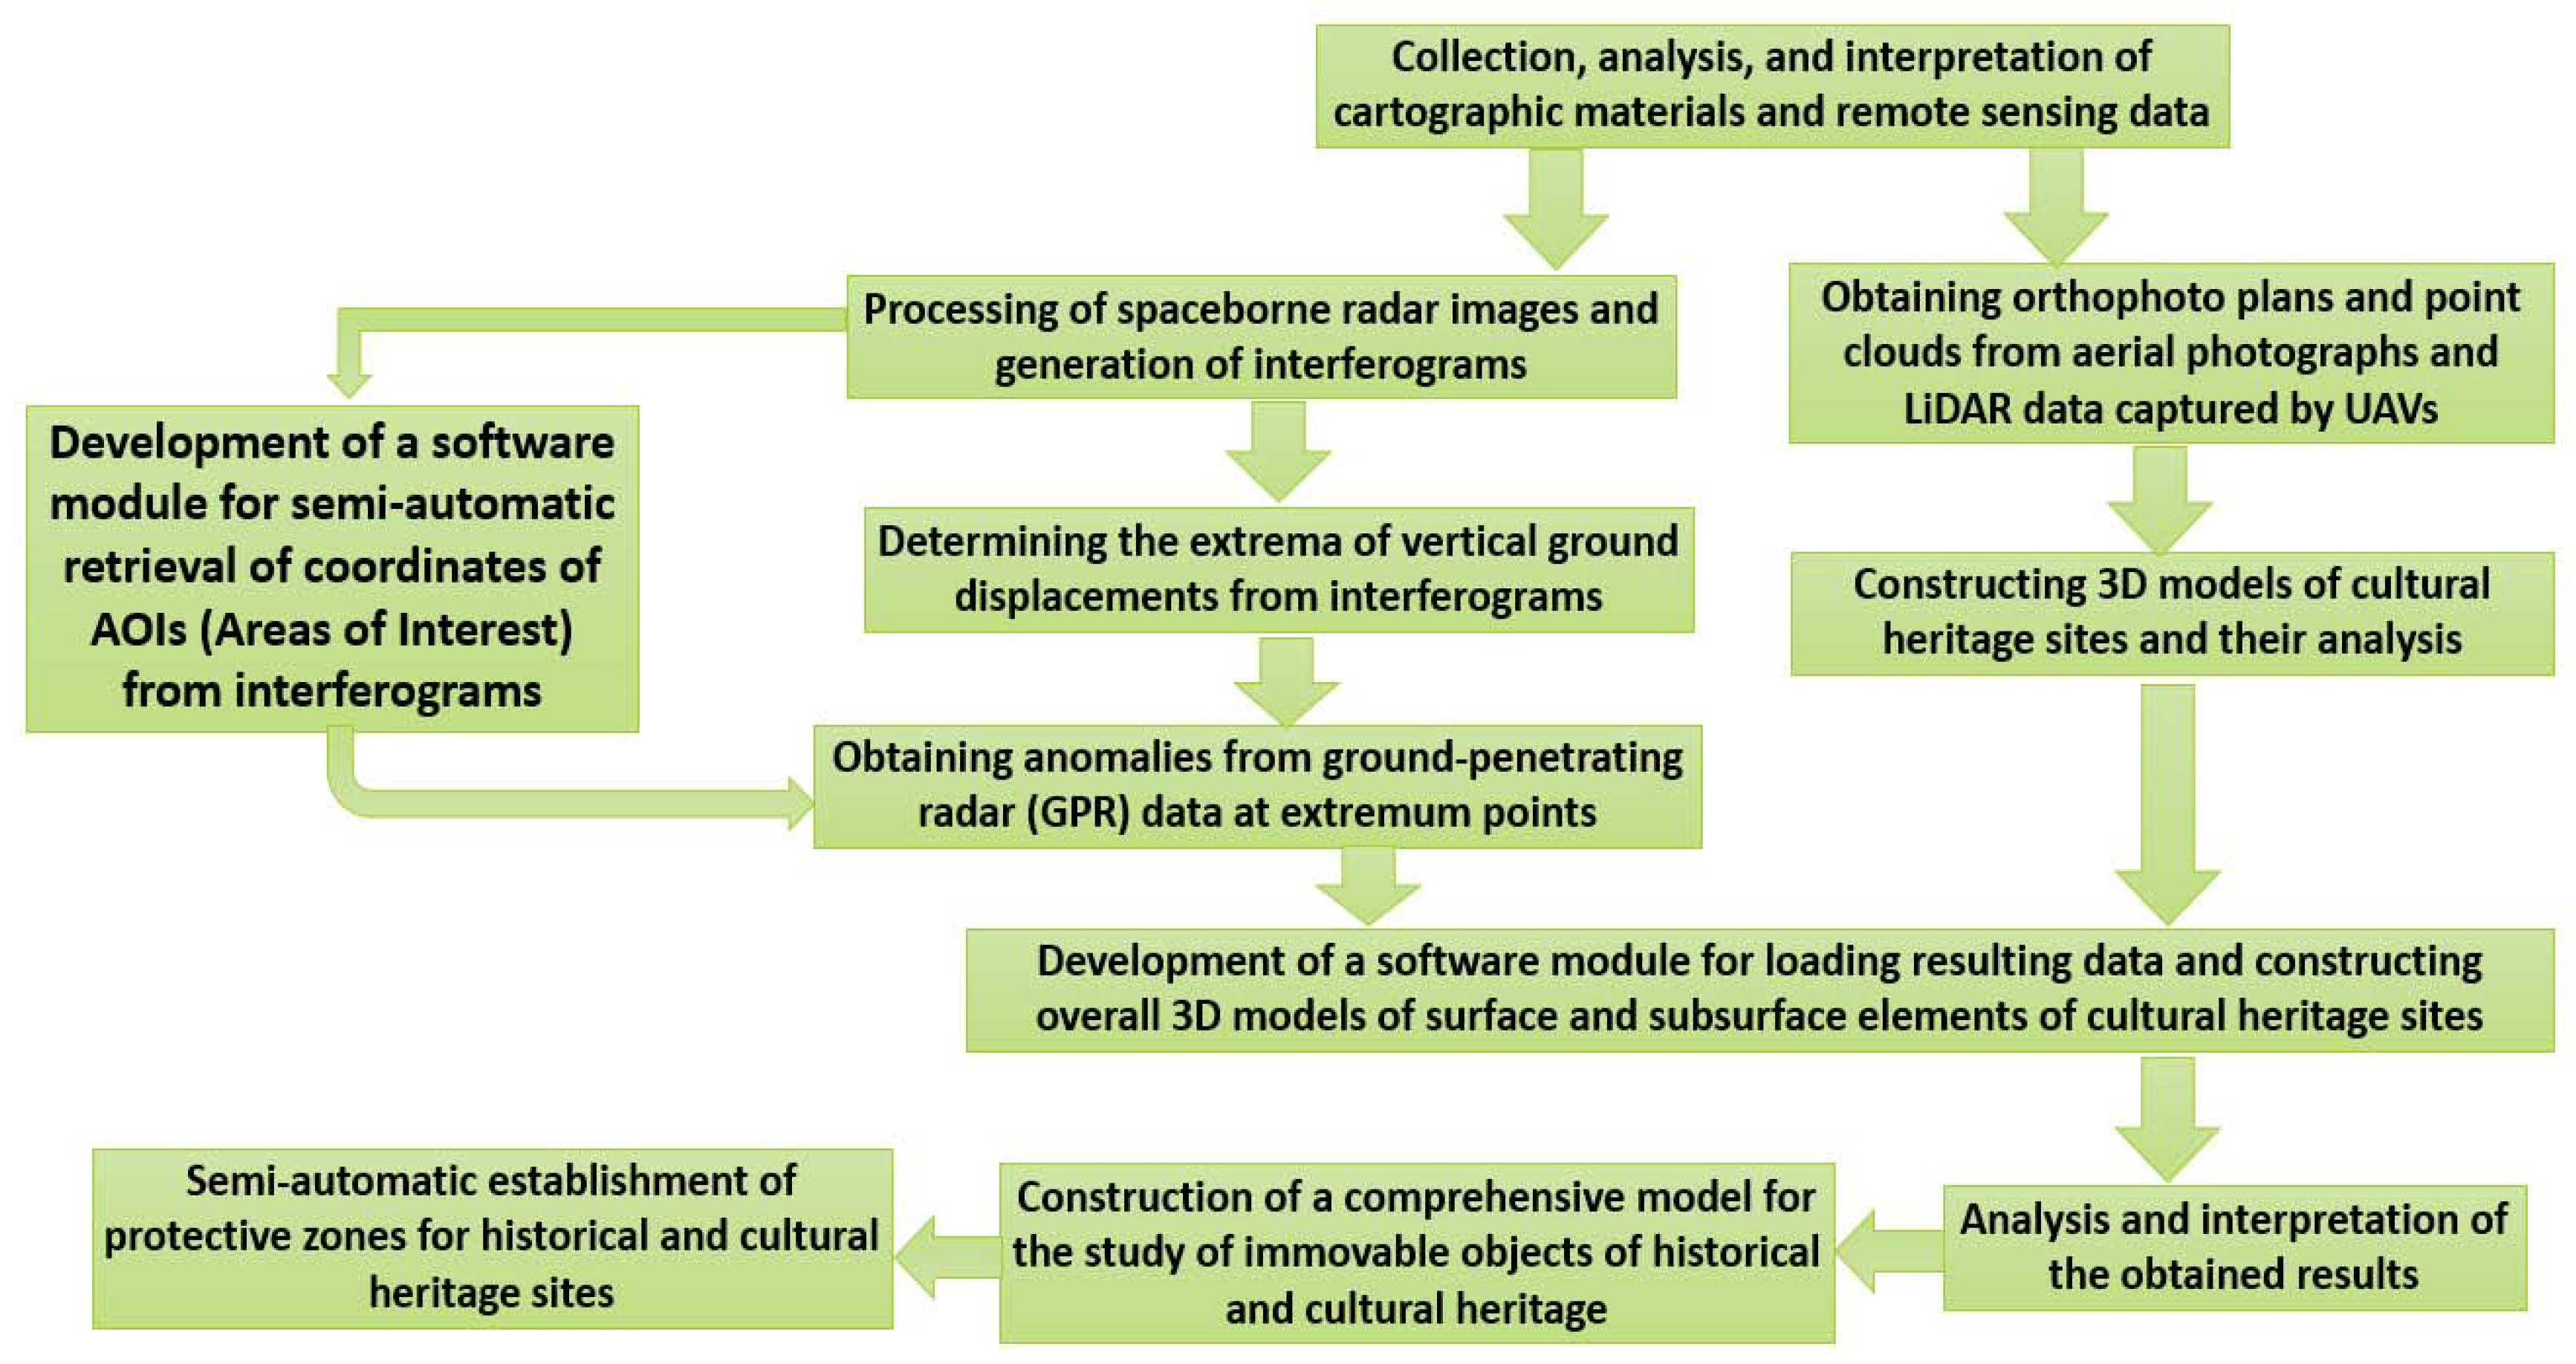
Figure 5.
Technological scheme for implementing the conceptual model
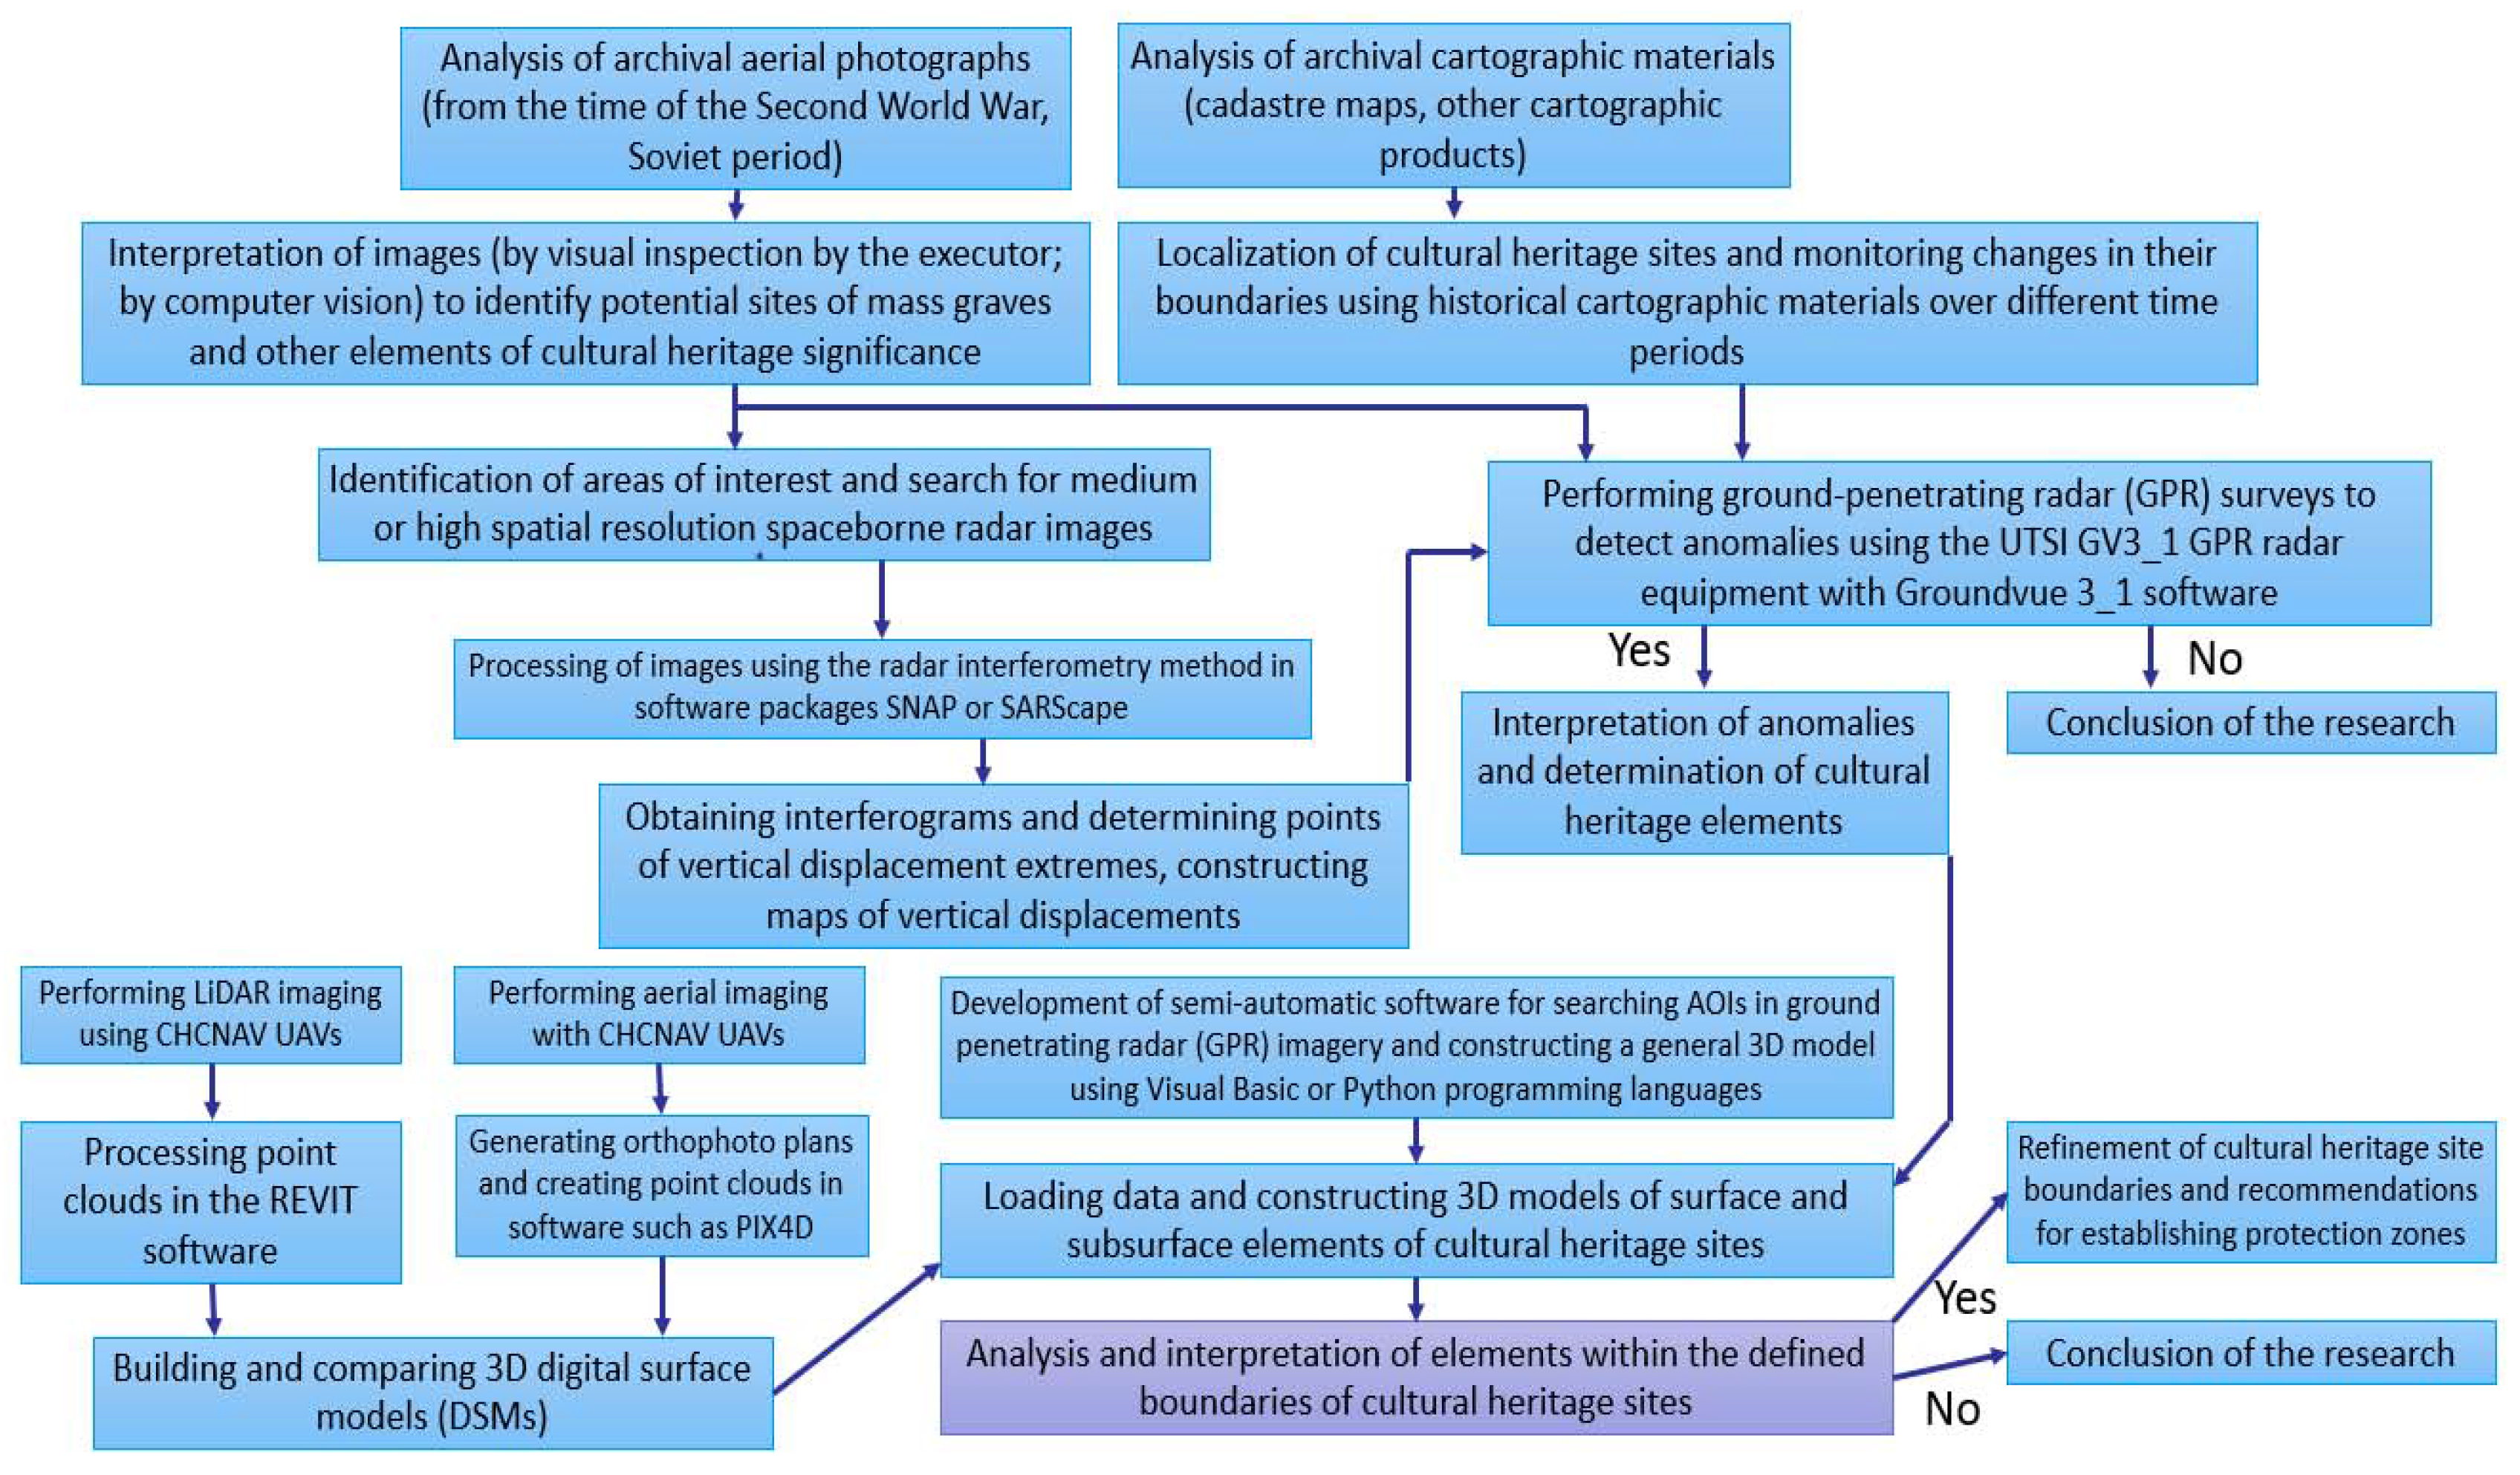
Figure 6.
Topographic plan with marked polygonal objects of potential fraternal burials (pink background outlined by red lines) with overlaid points of maximum vertical displacements [45].
Figure 6.
Topographic plan with marked polygonal objects of potential fraternal burials (pink background outlined by red lines) with overlaid points of maximum vertical displacements [45].
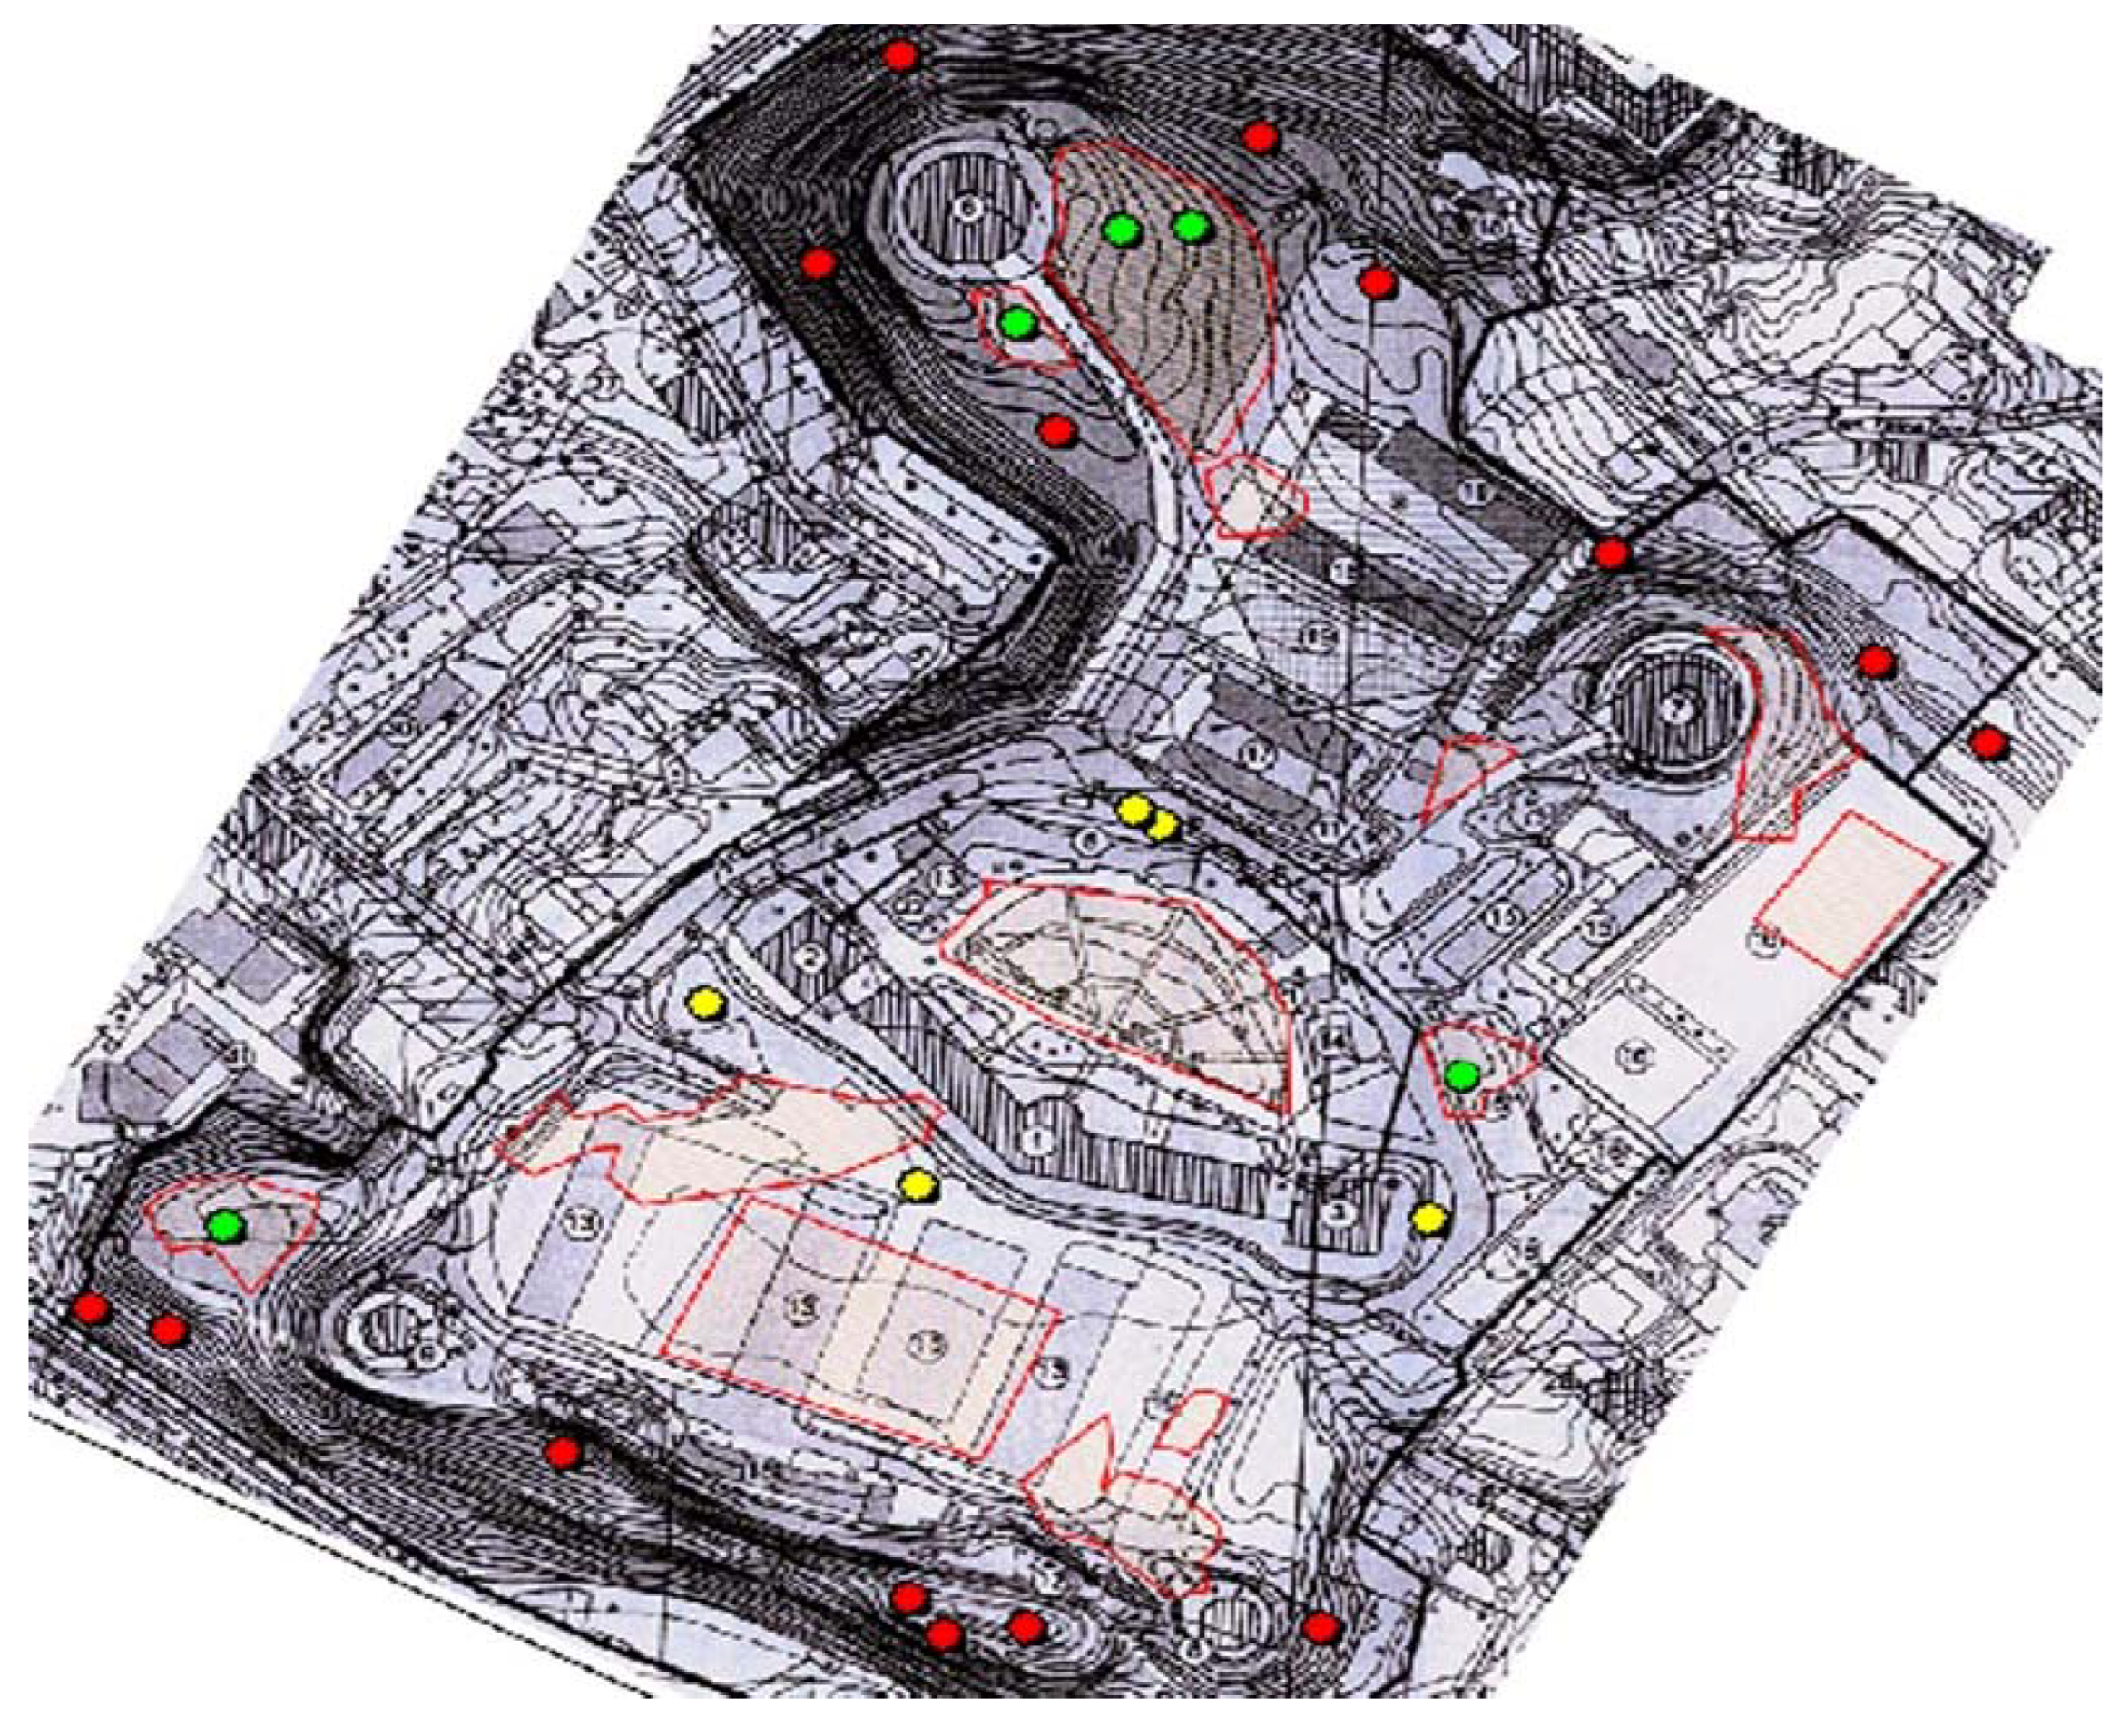
Figure 7.
Smoothed map of vertical displacements, mm
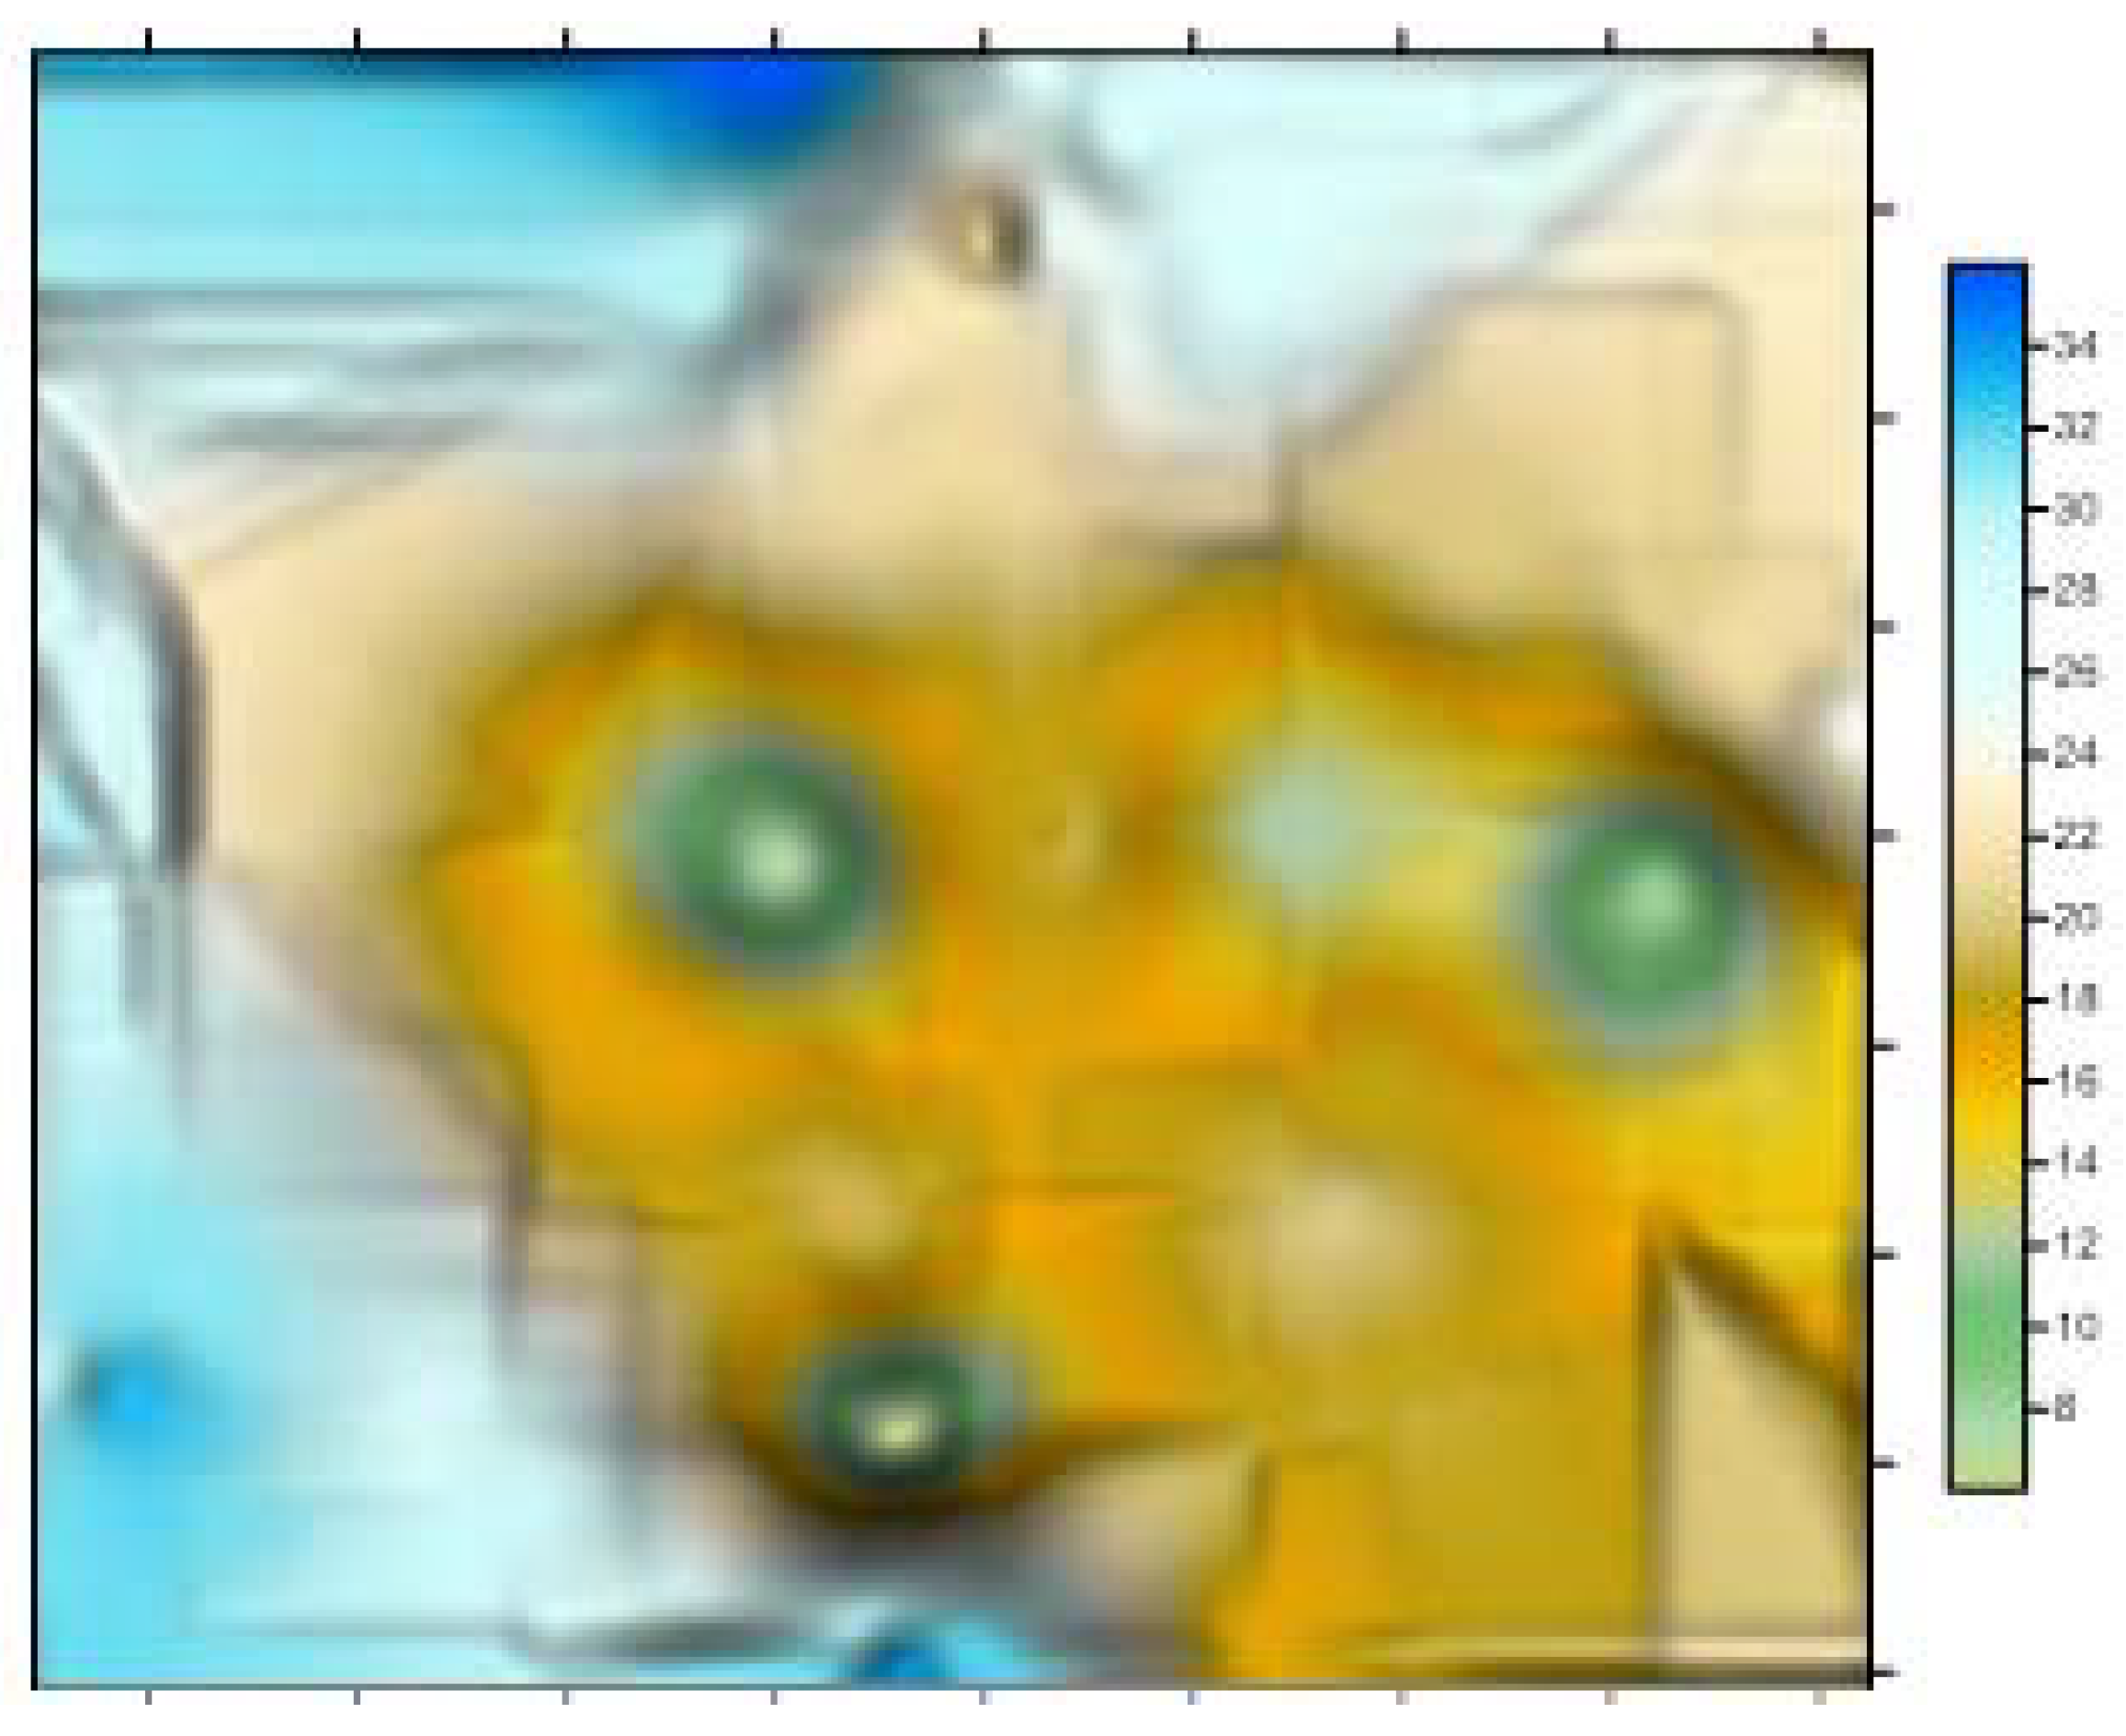
Figure 8.
Citadel - an overlay of radargram on modern locality
Figure 9.
Citadel - scanogram of the ground-penetrating radar at t=15.63 ns.
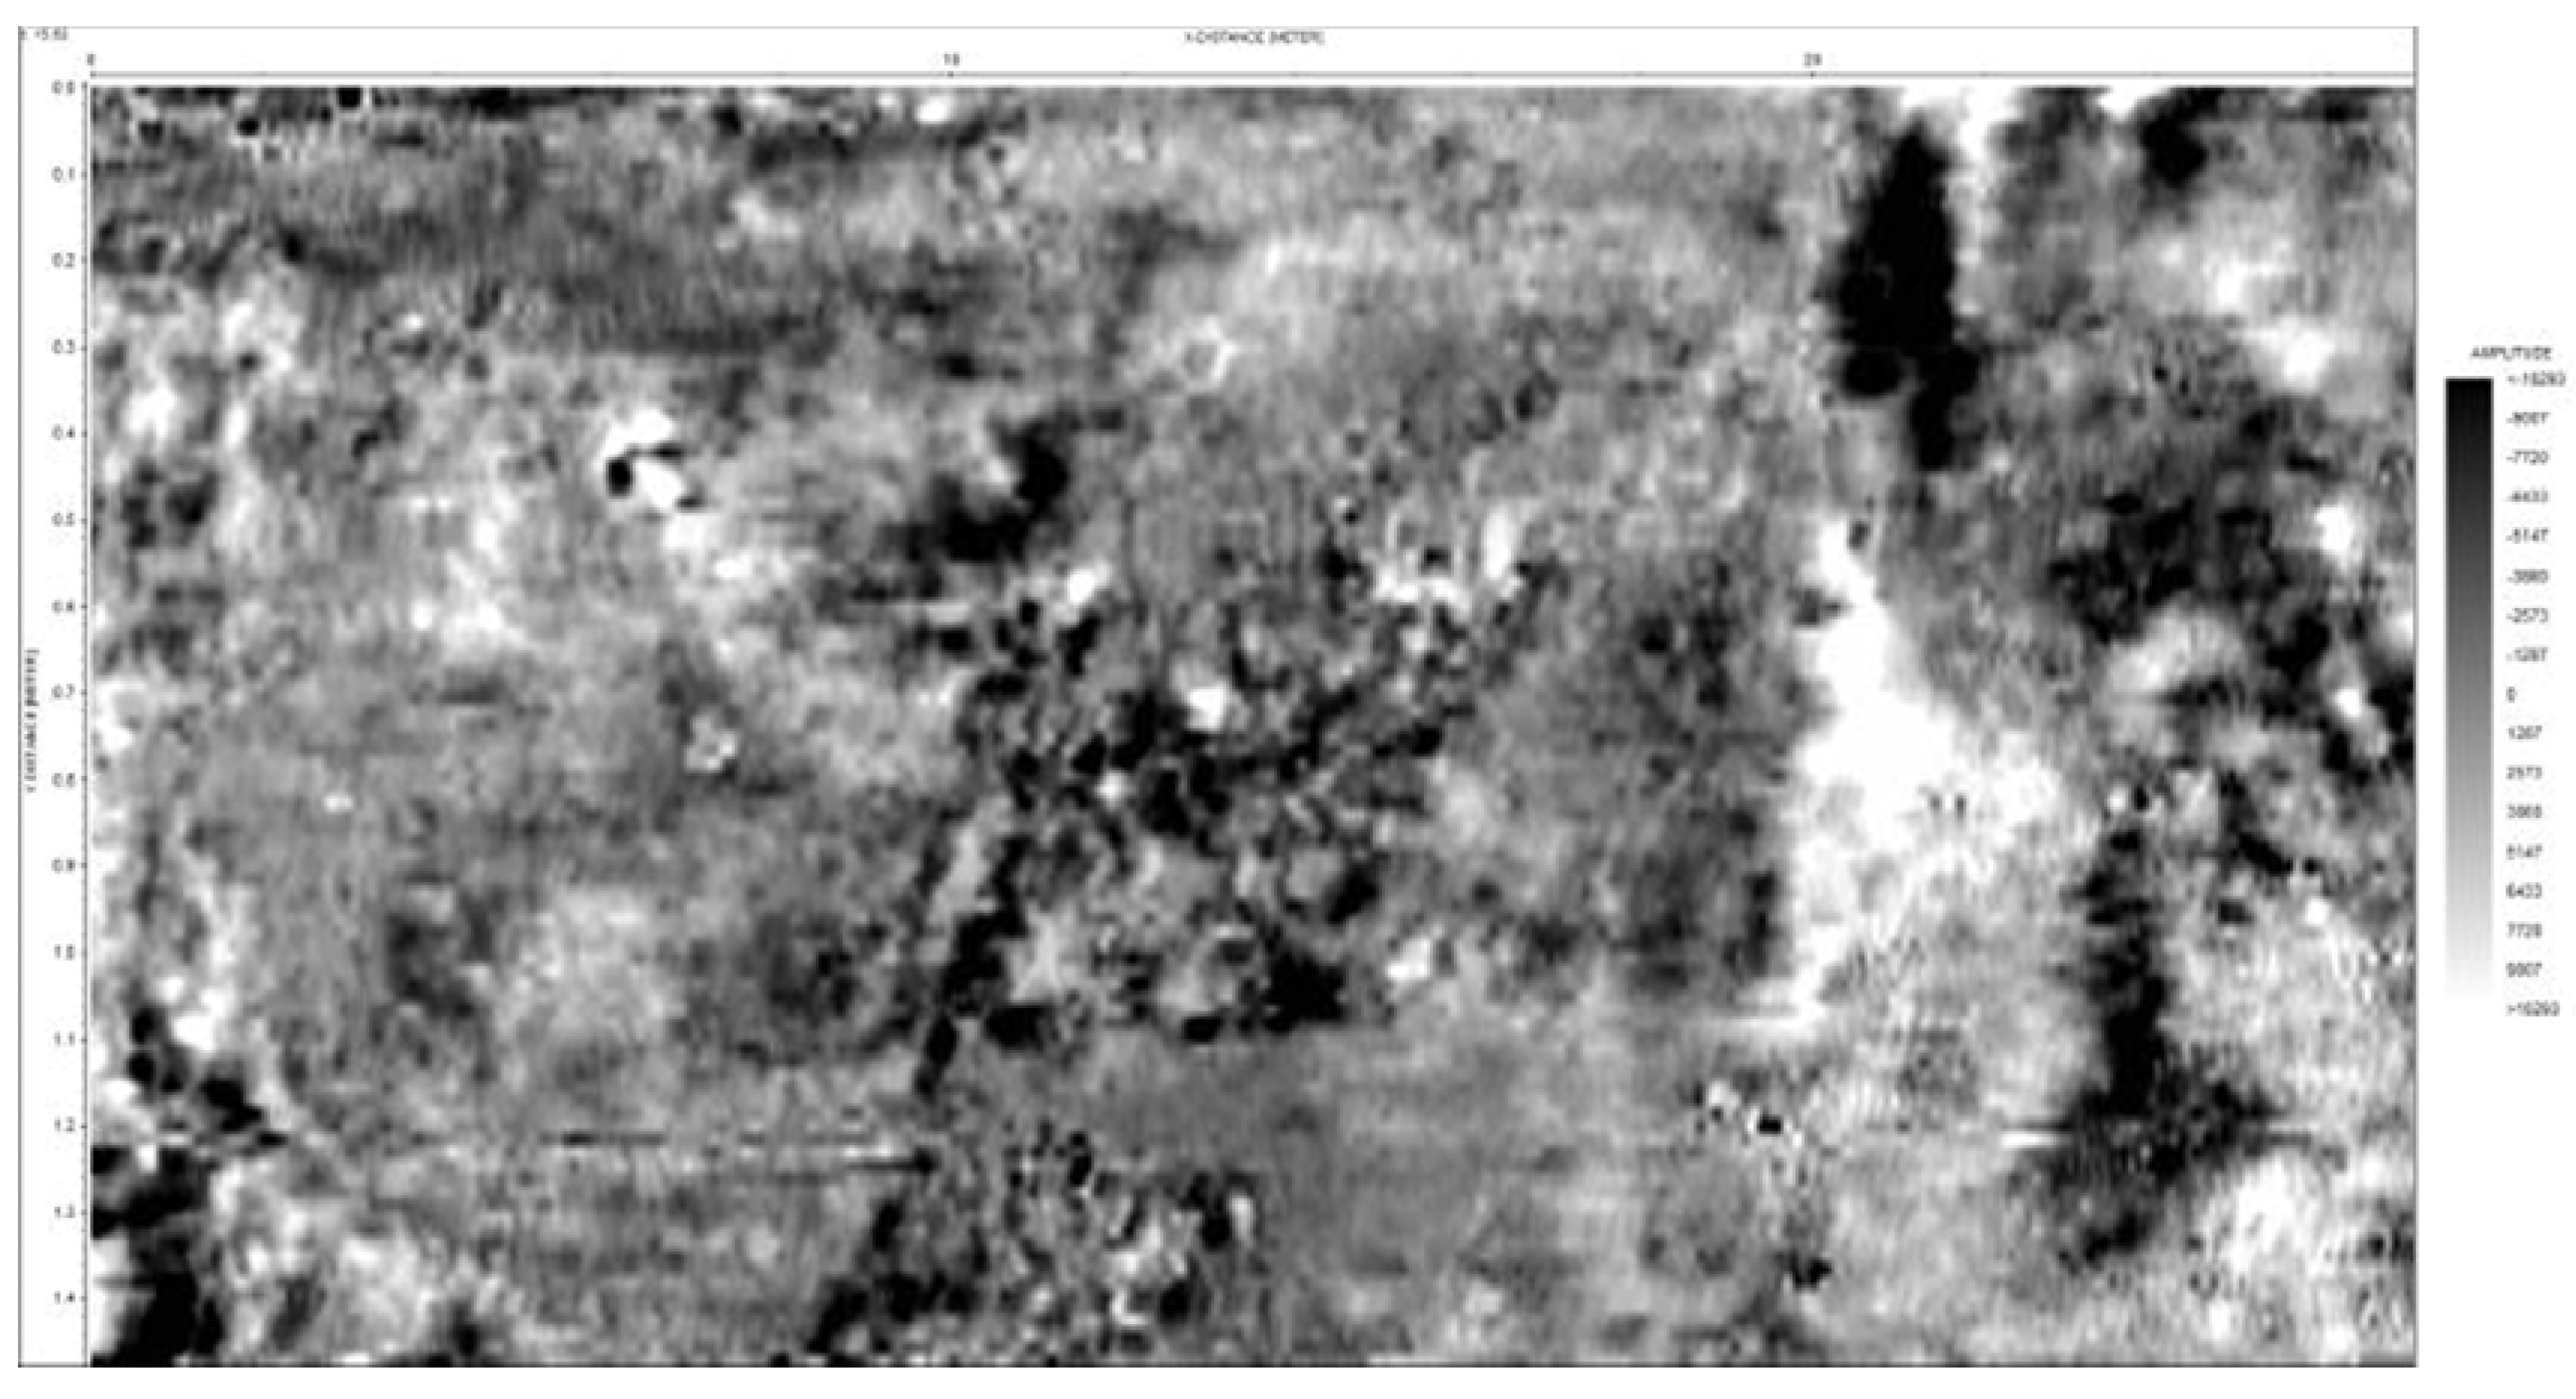
Figure 10.
The boundary of the historical and cultural heritage site established by the Ministry of Culture of Ukraine based on archival cartographic and aerial materials (red color), and the adjusted boundary considering radar and ground-penetrating radar surveys (blue color).
Figure 10.
The boundary of the historical and cultural heritage site established by the Ministry of Culture of Ukraine based on archival cartographic and aerial materials (red color), and the adjusted boundary considering radar and ground-penetrating radar surveys (blue color).
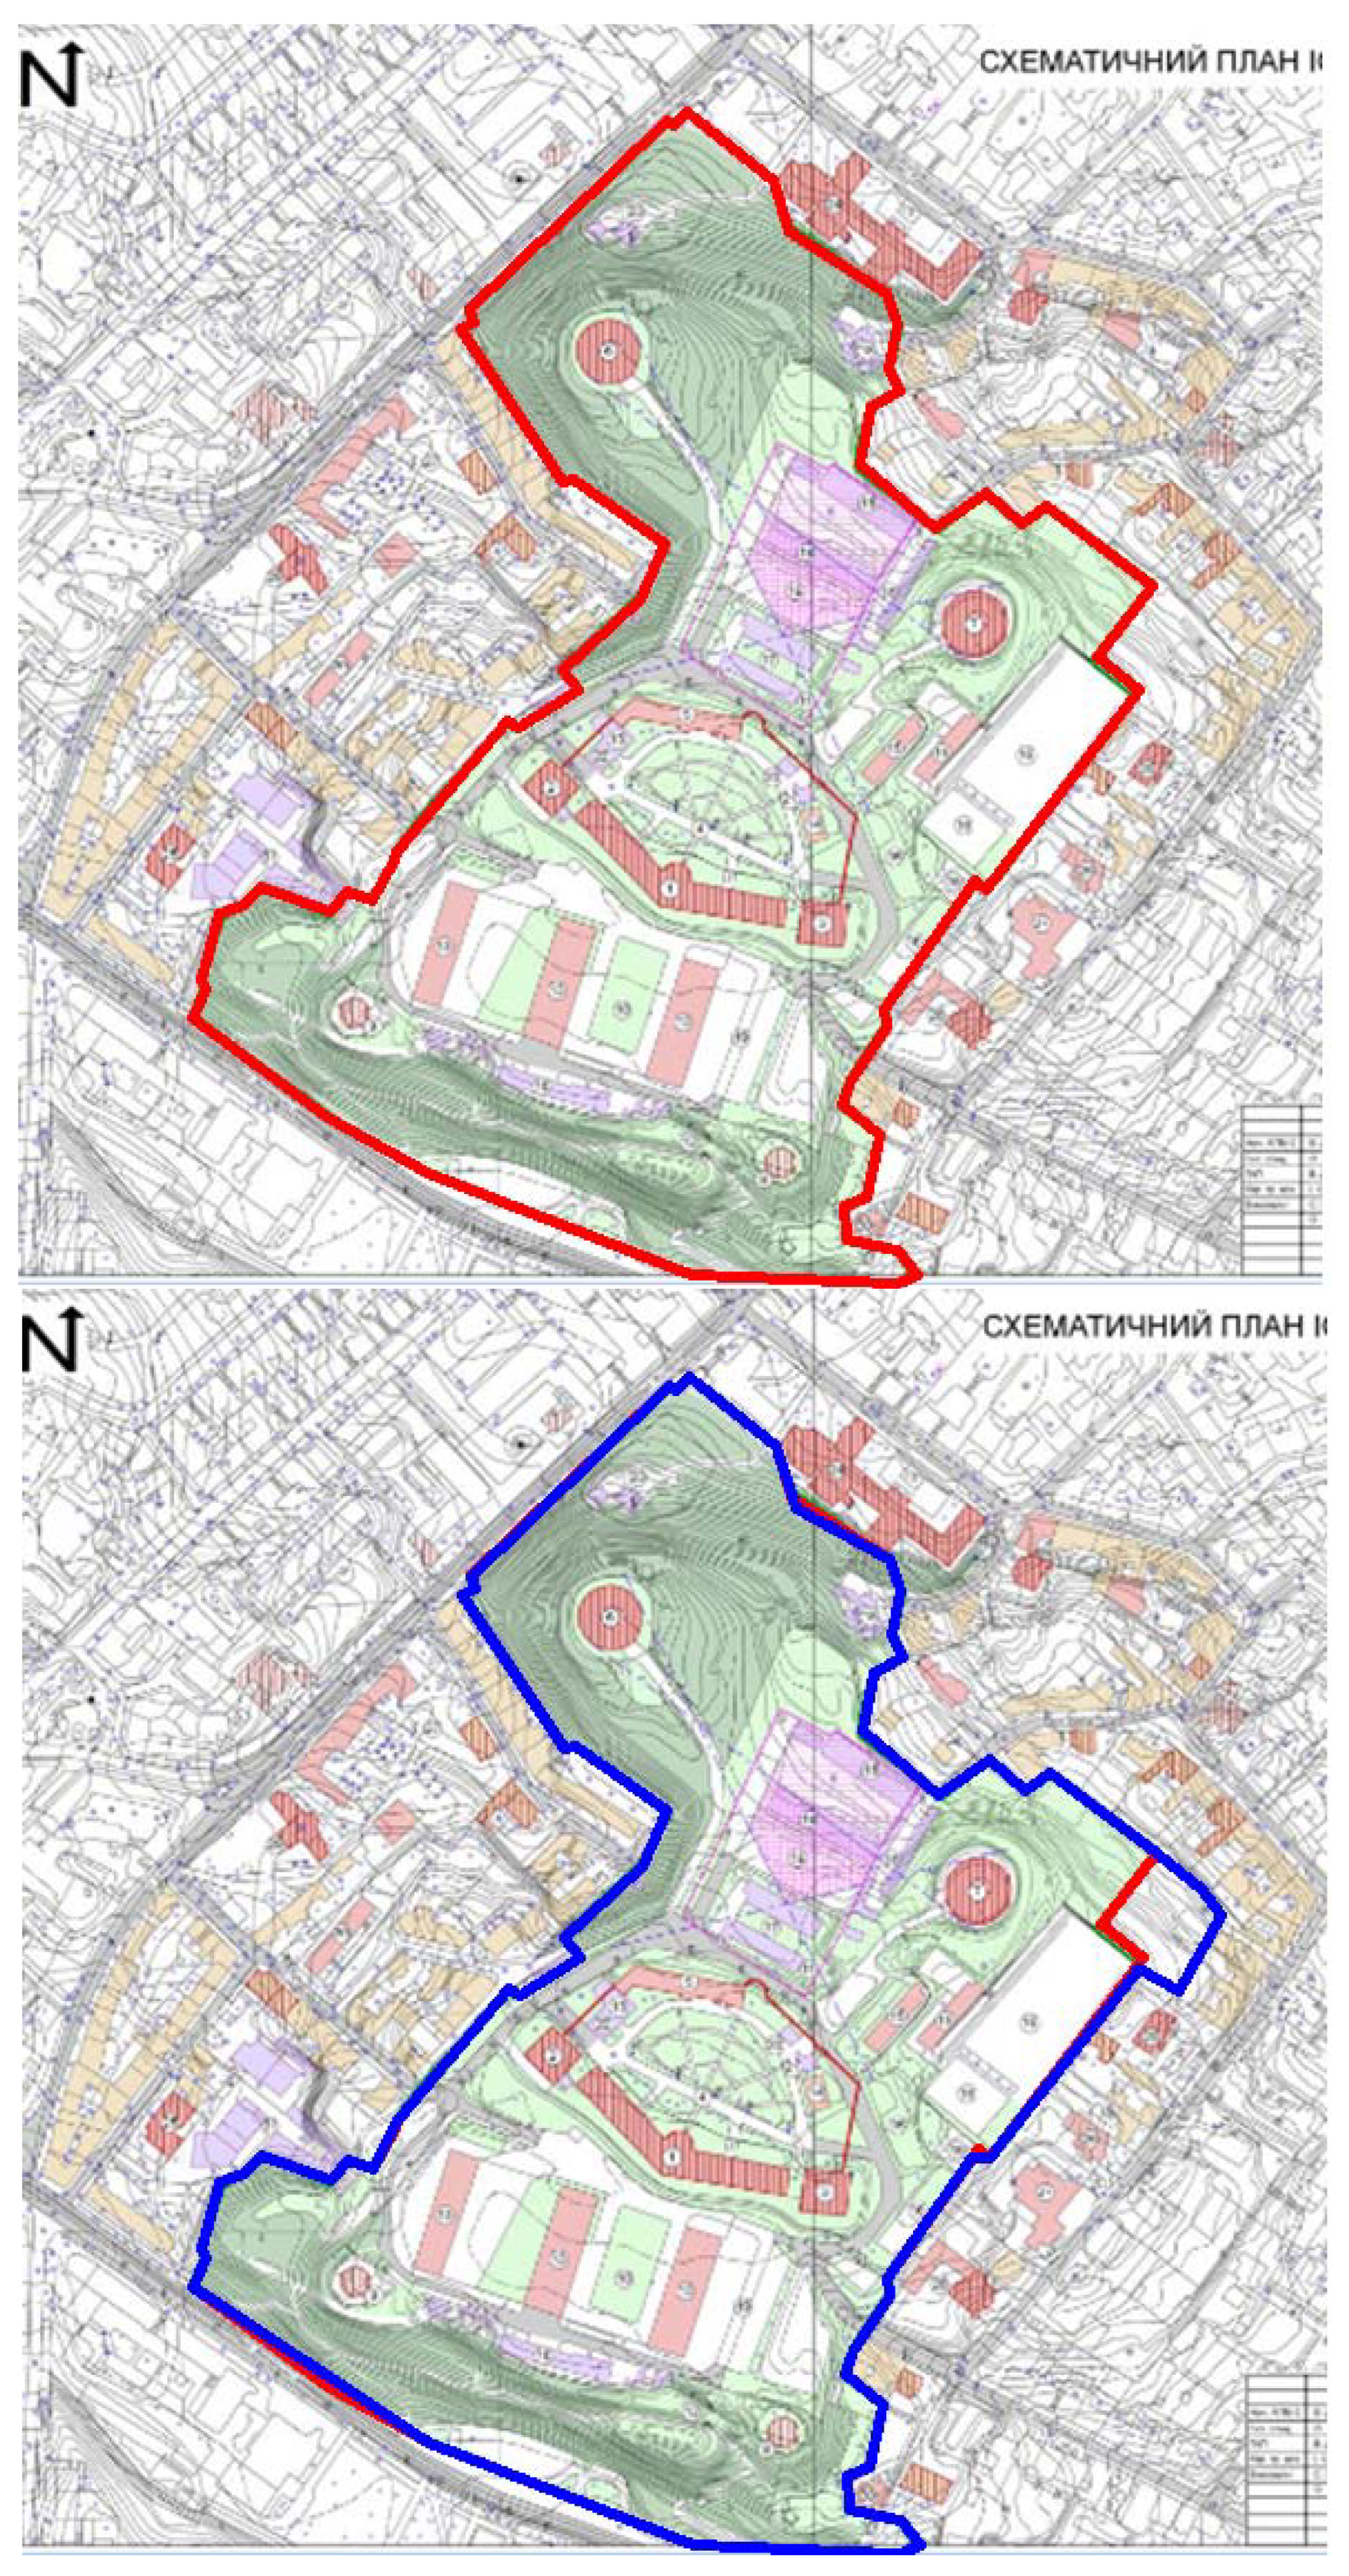
Figure 11.
Technological scheme of creating a software module for refining the boundaries of an object and its protective zone.
Figure 11.
Technological scheme of creating a software module for refining the boundaries of an object and its protective zone.
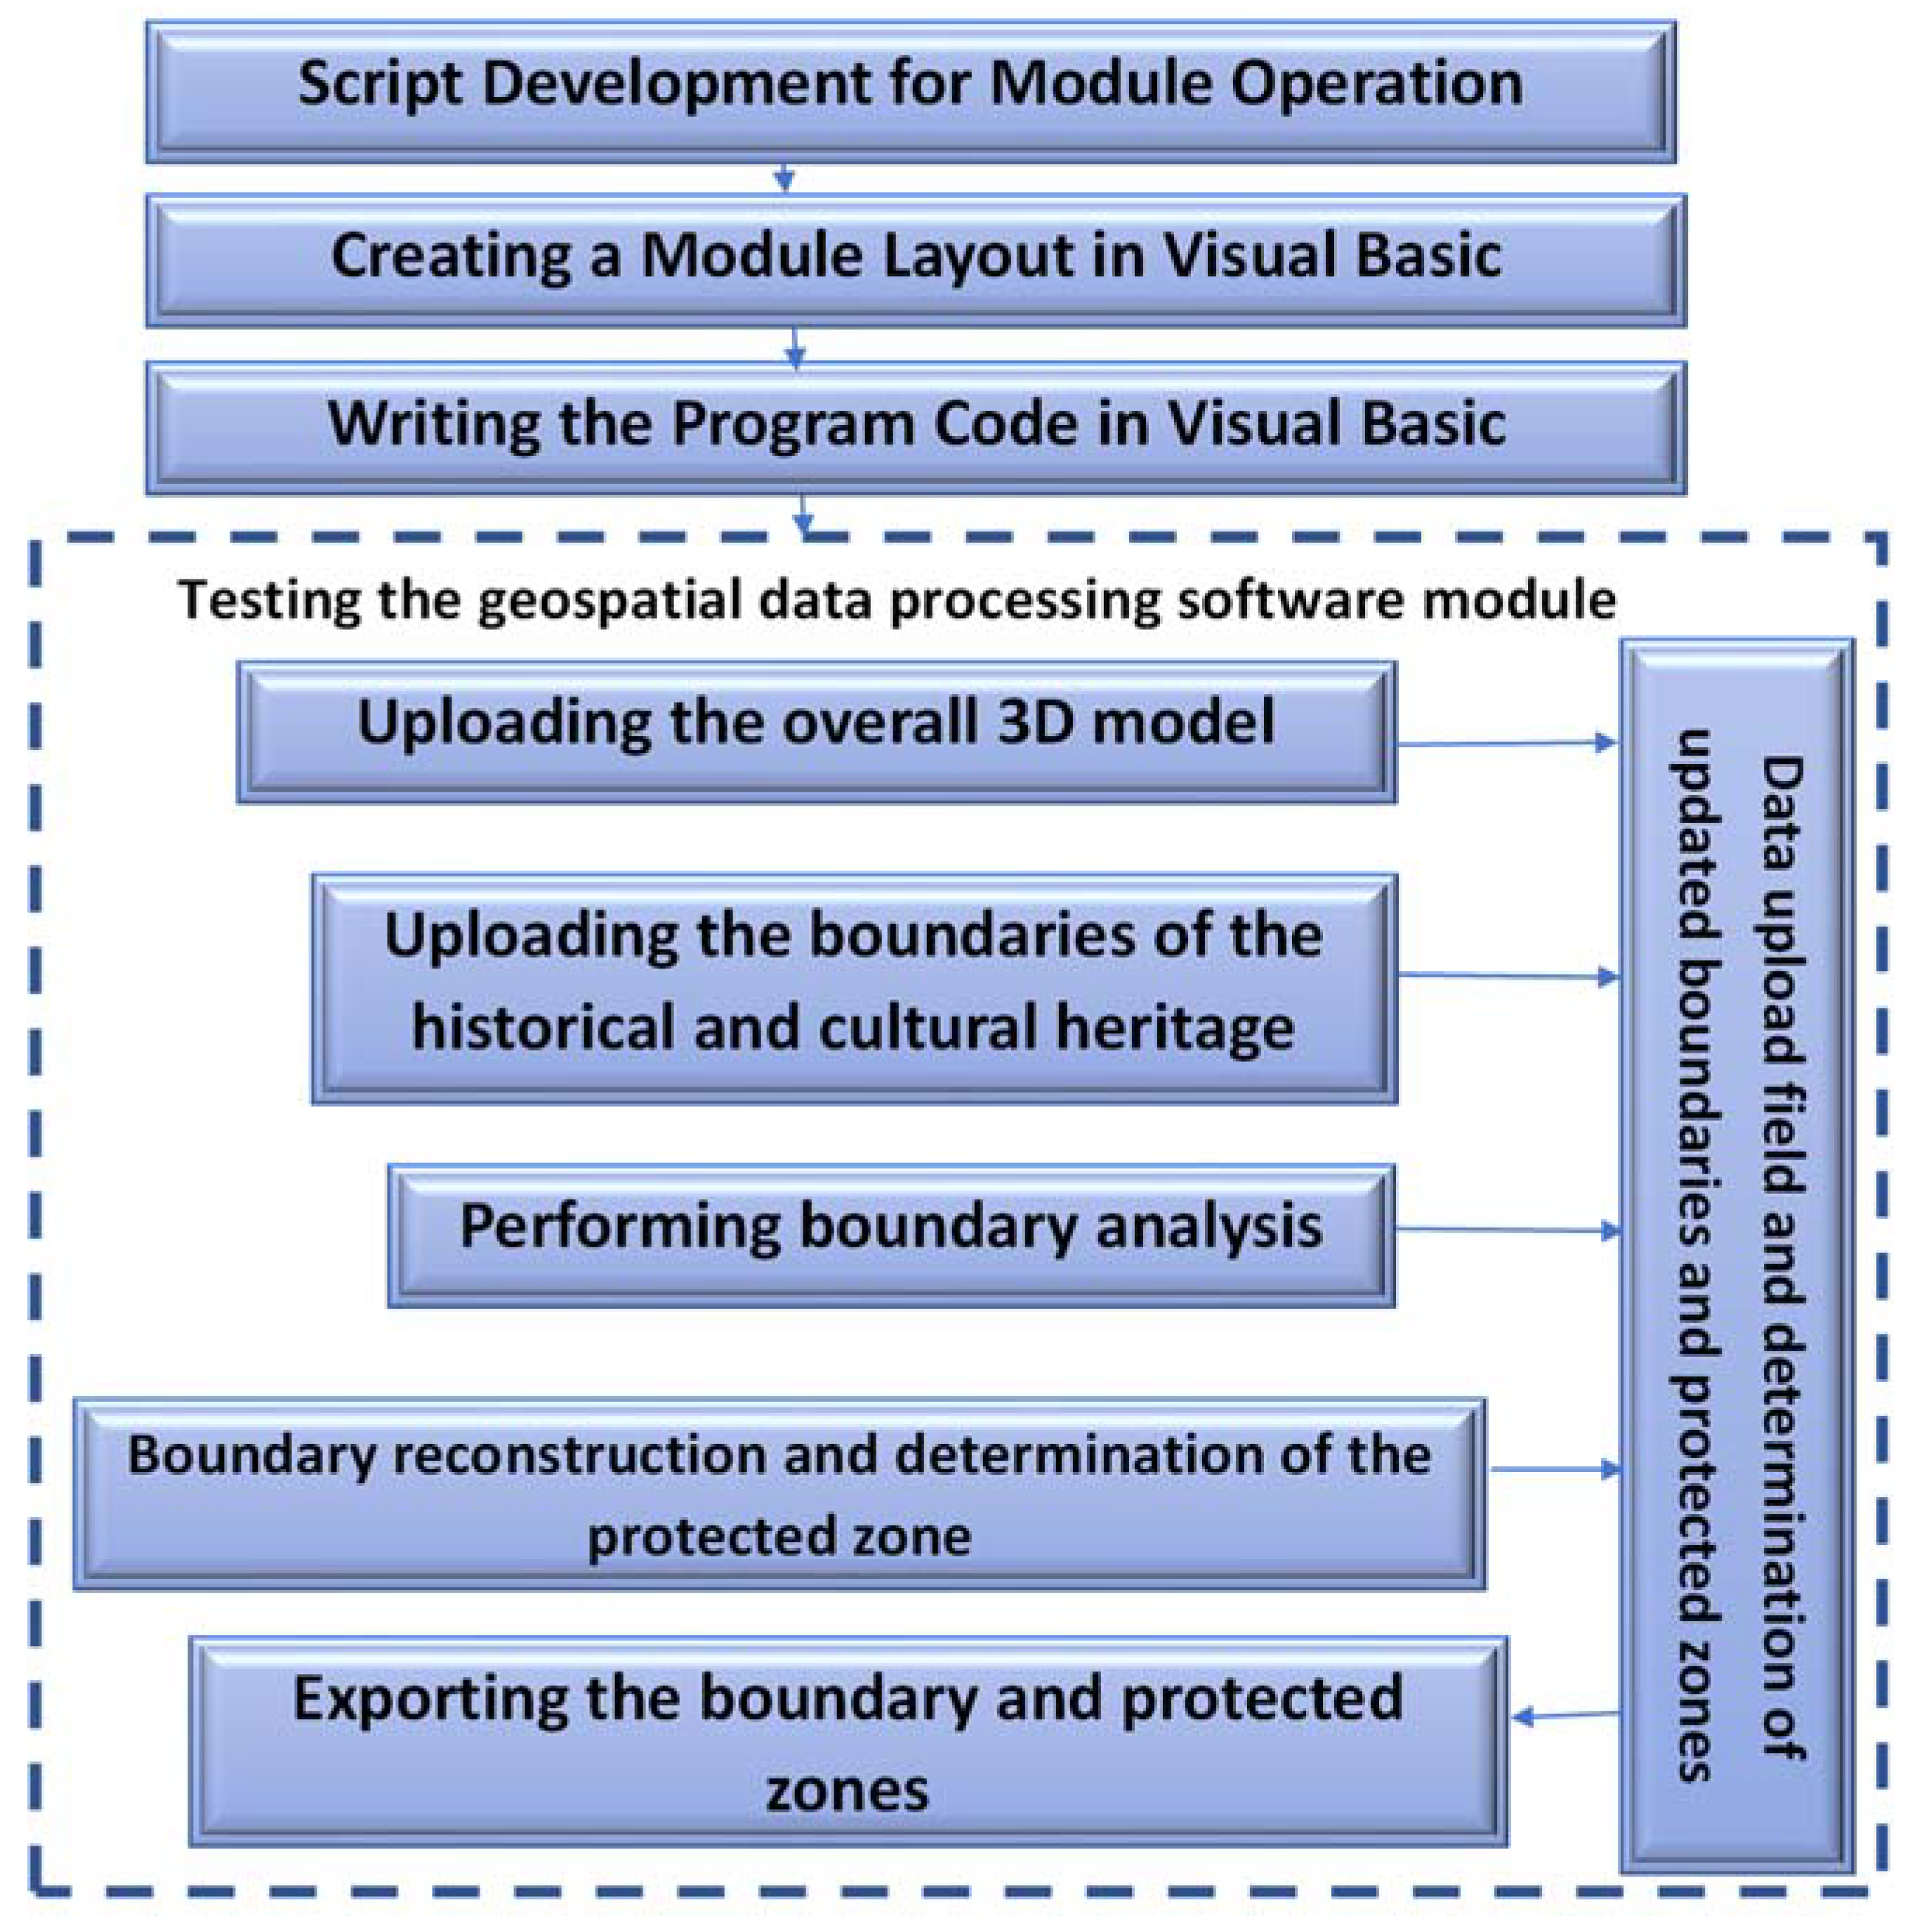
Figure 12.
Loading all input data into the module's workspace
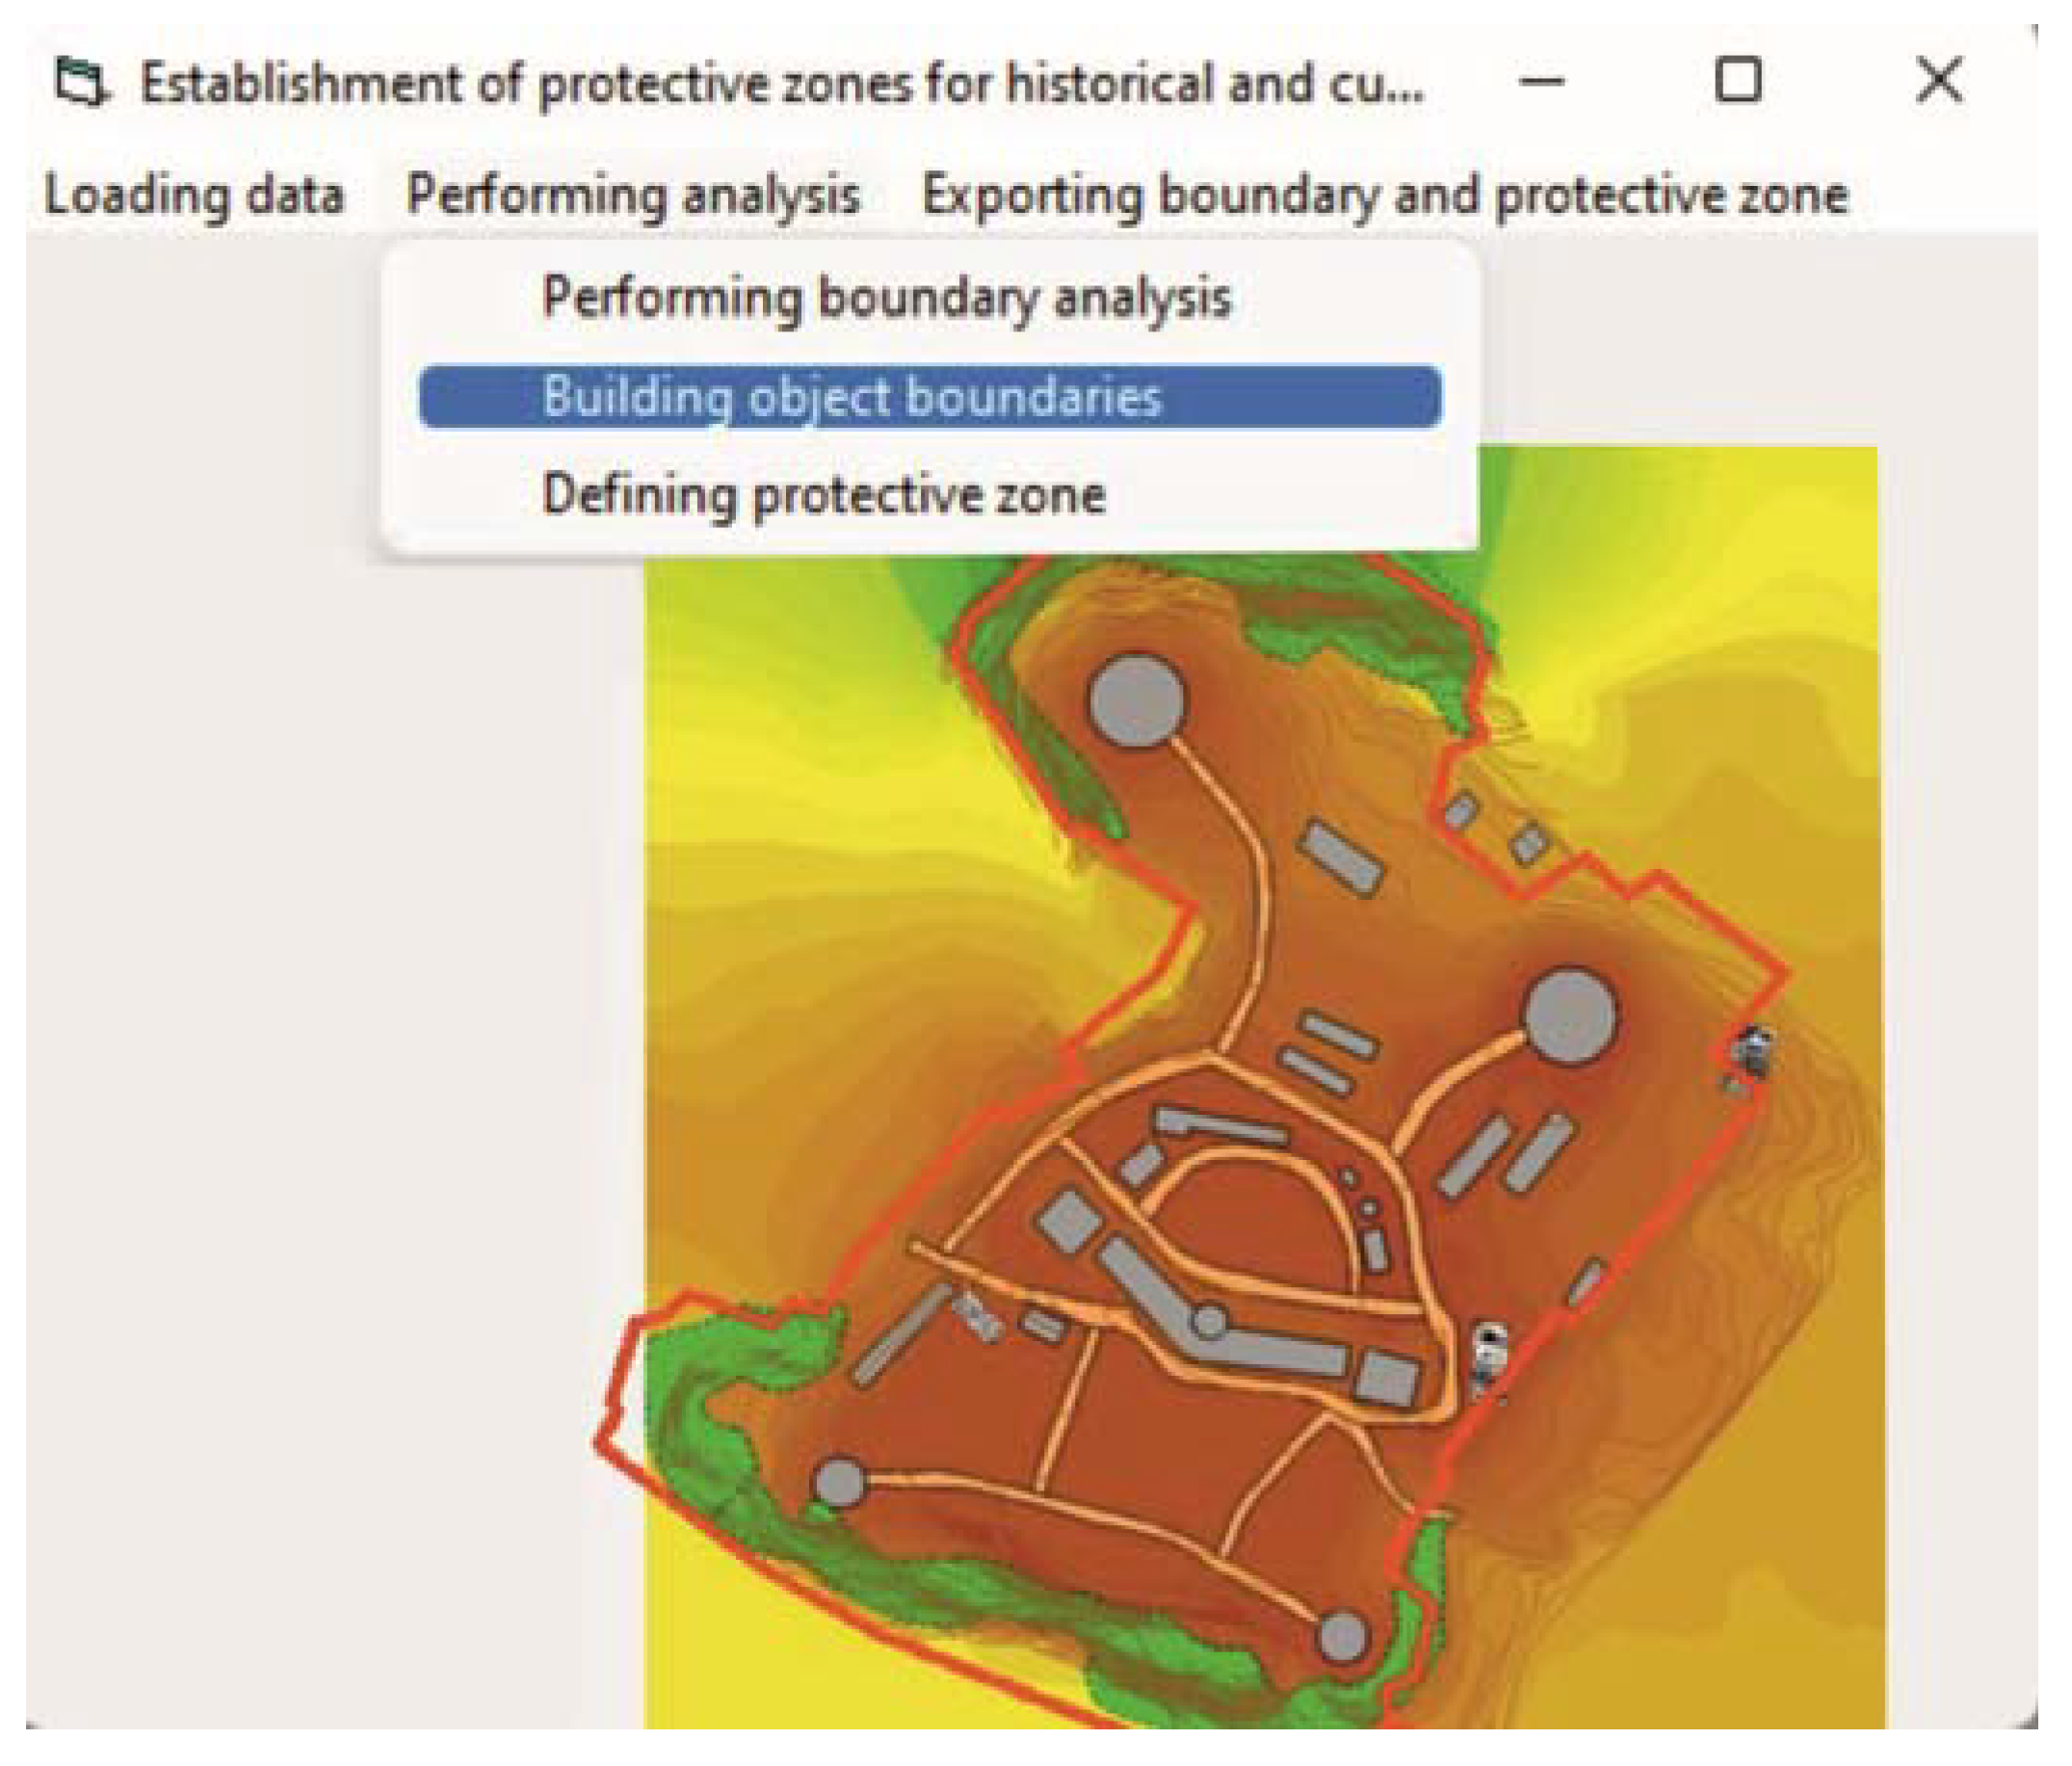
Figure 13.
Reconstruction of the object's boundary according to newly discovered data
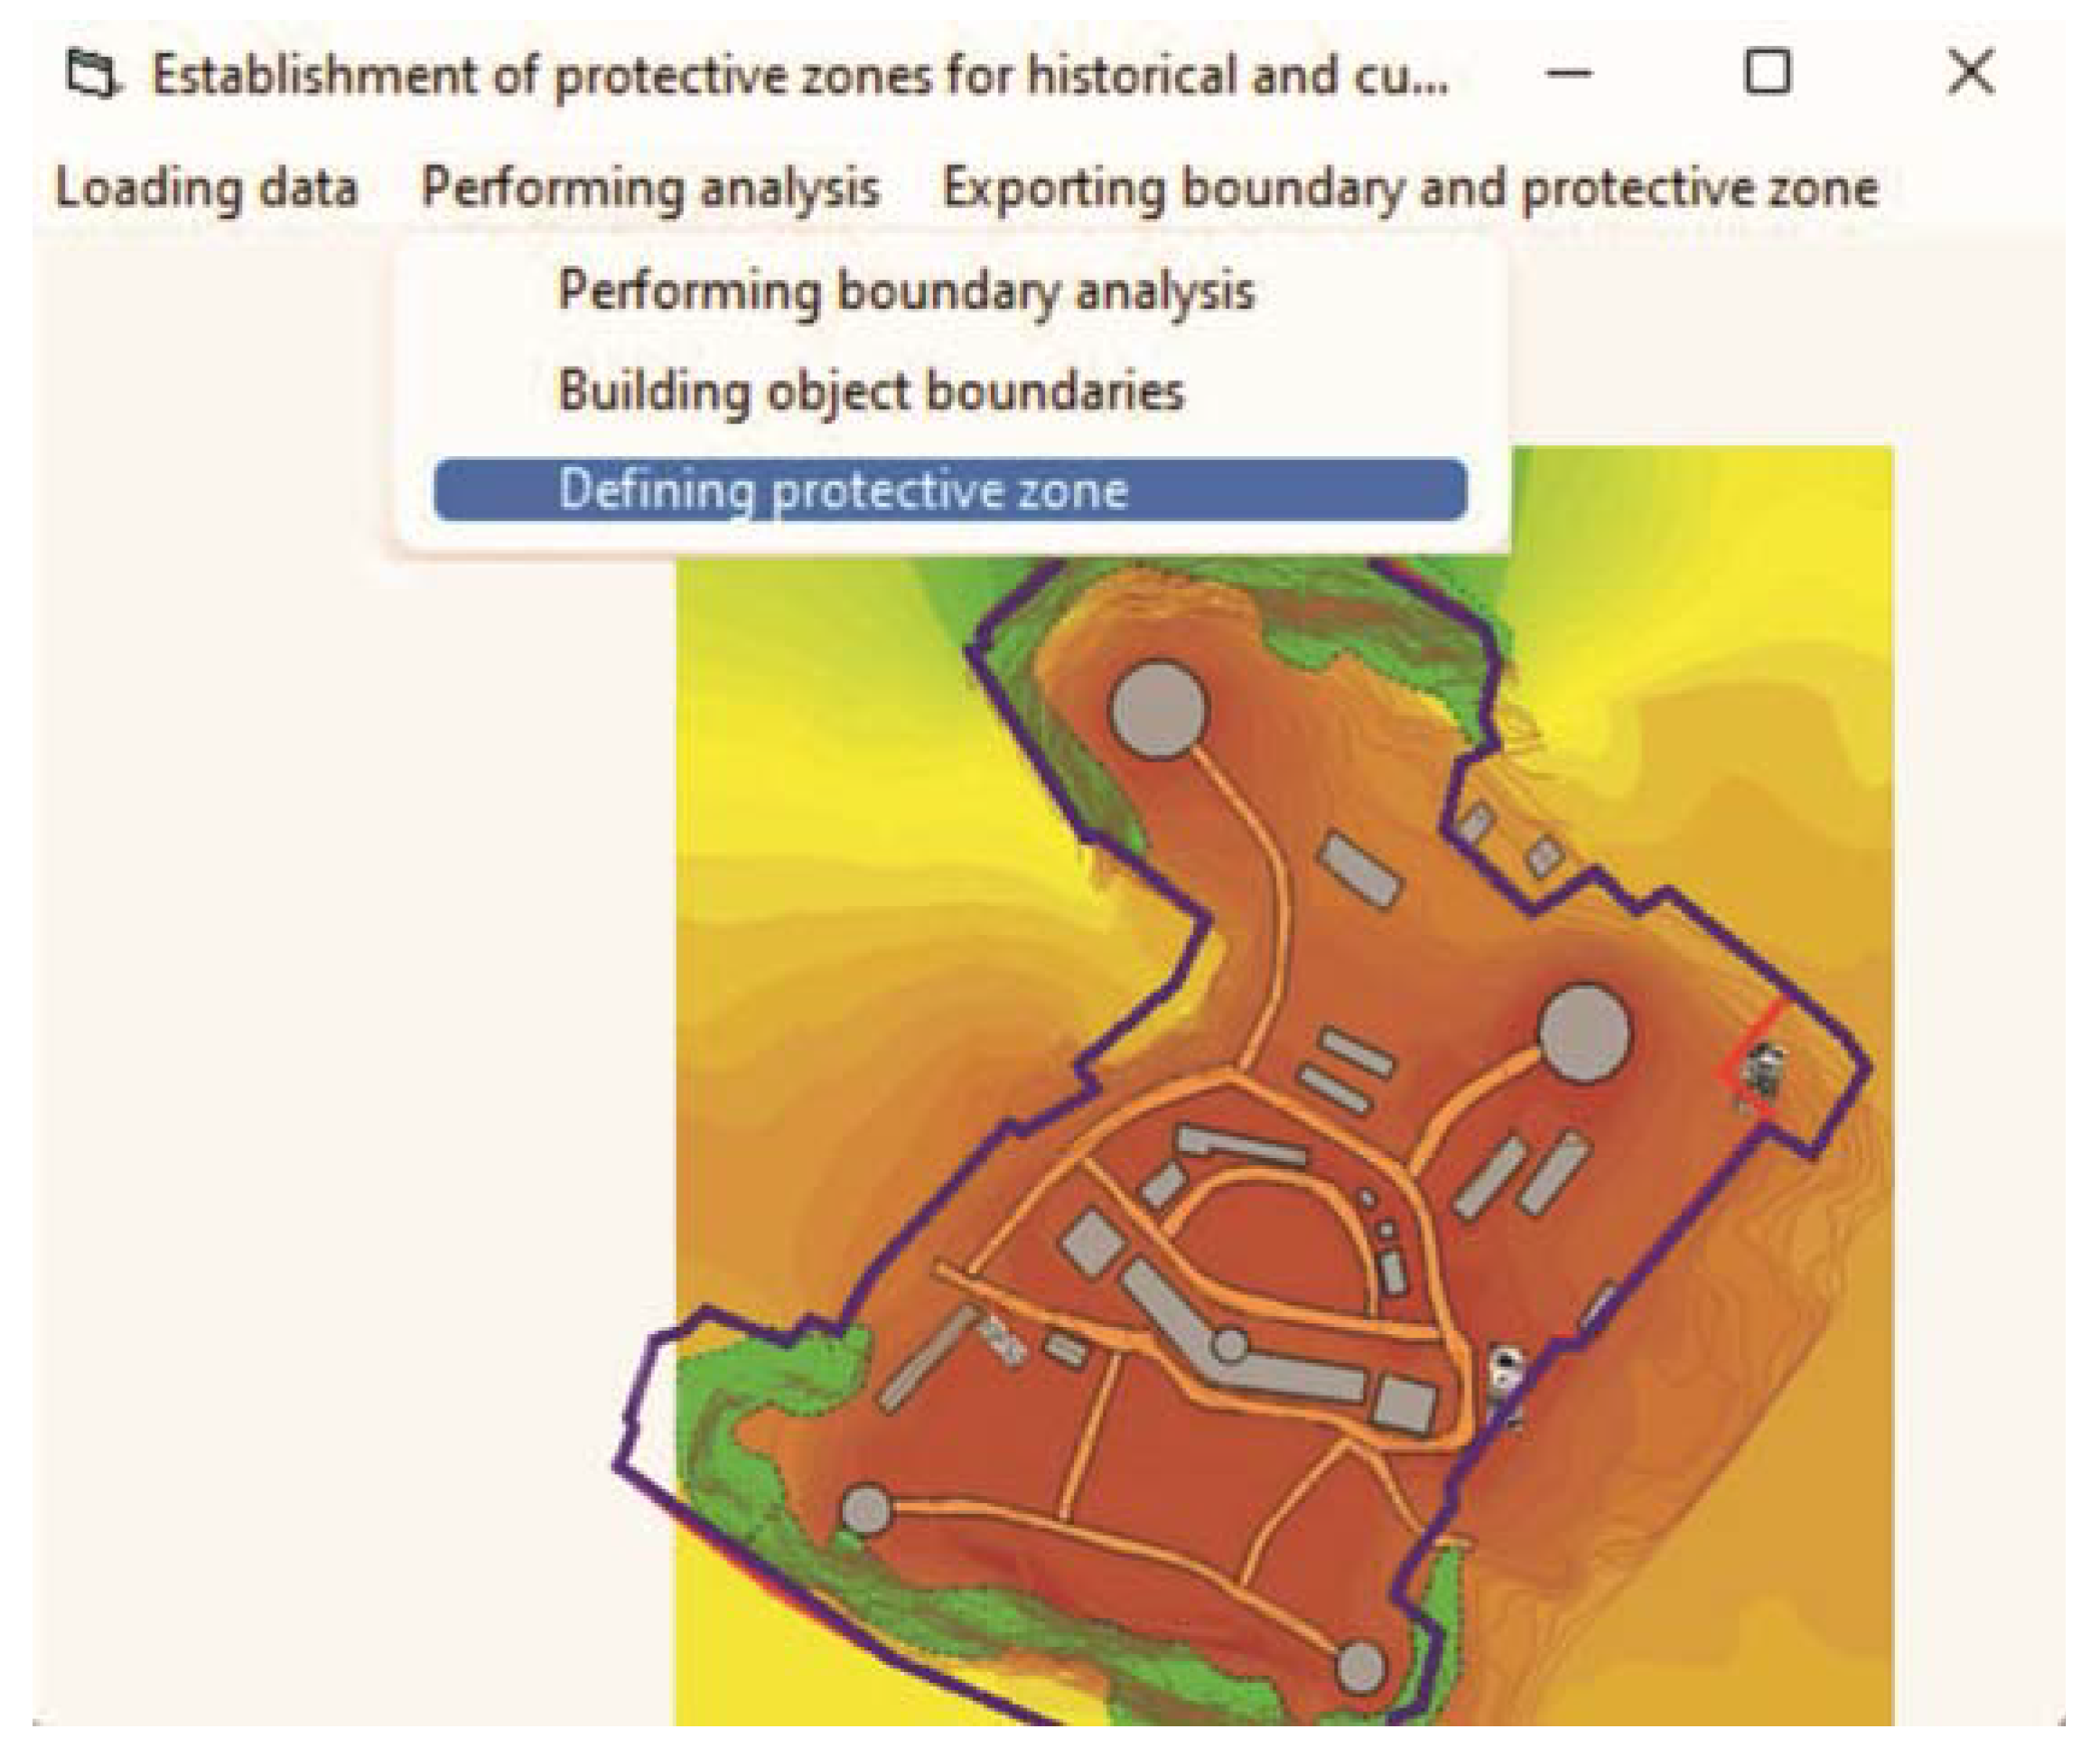
Figure 14.
Construction of the protective zone around the corrected boundary of the object
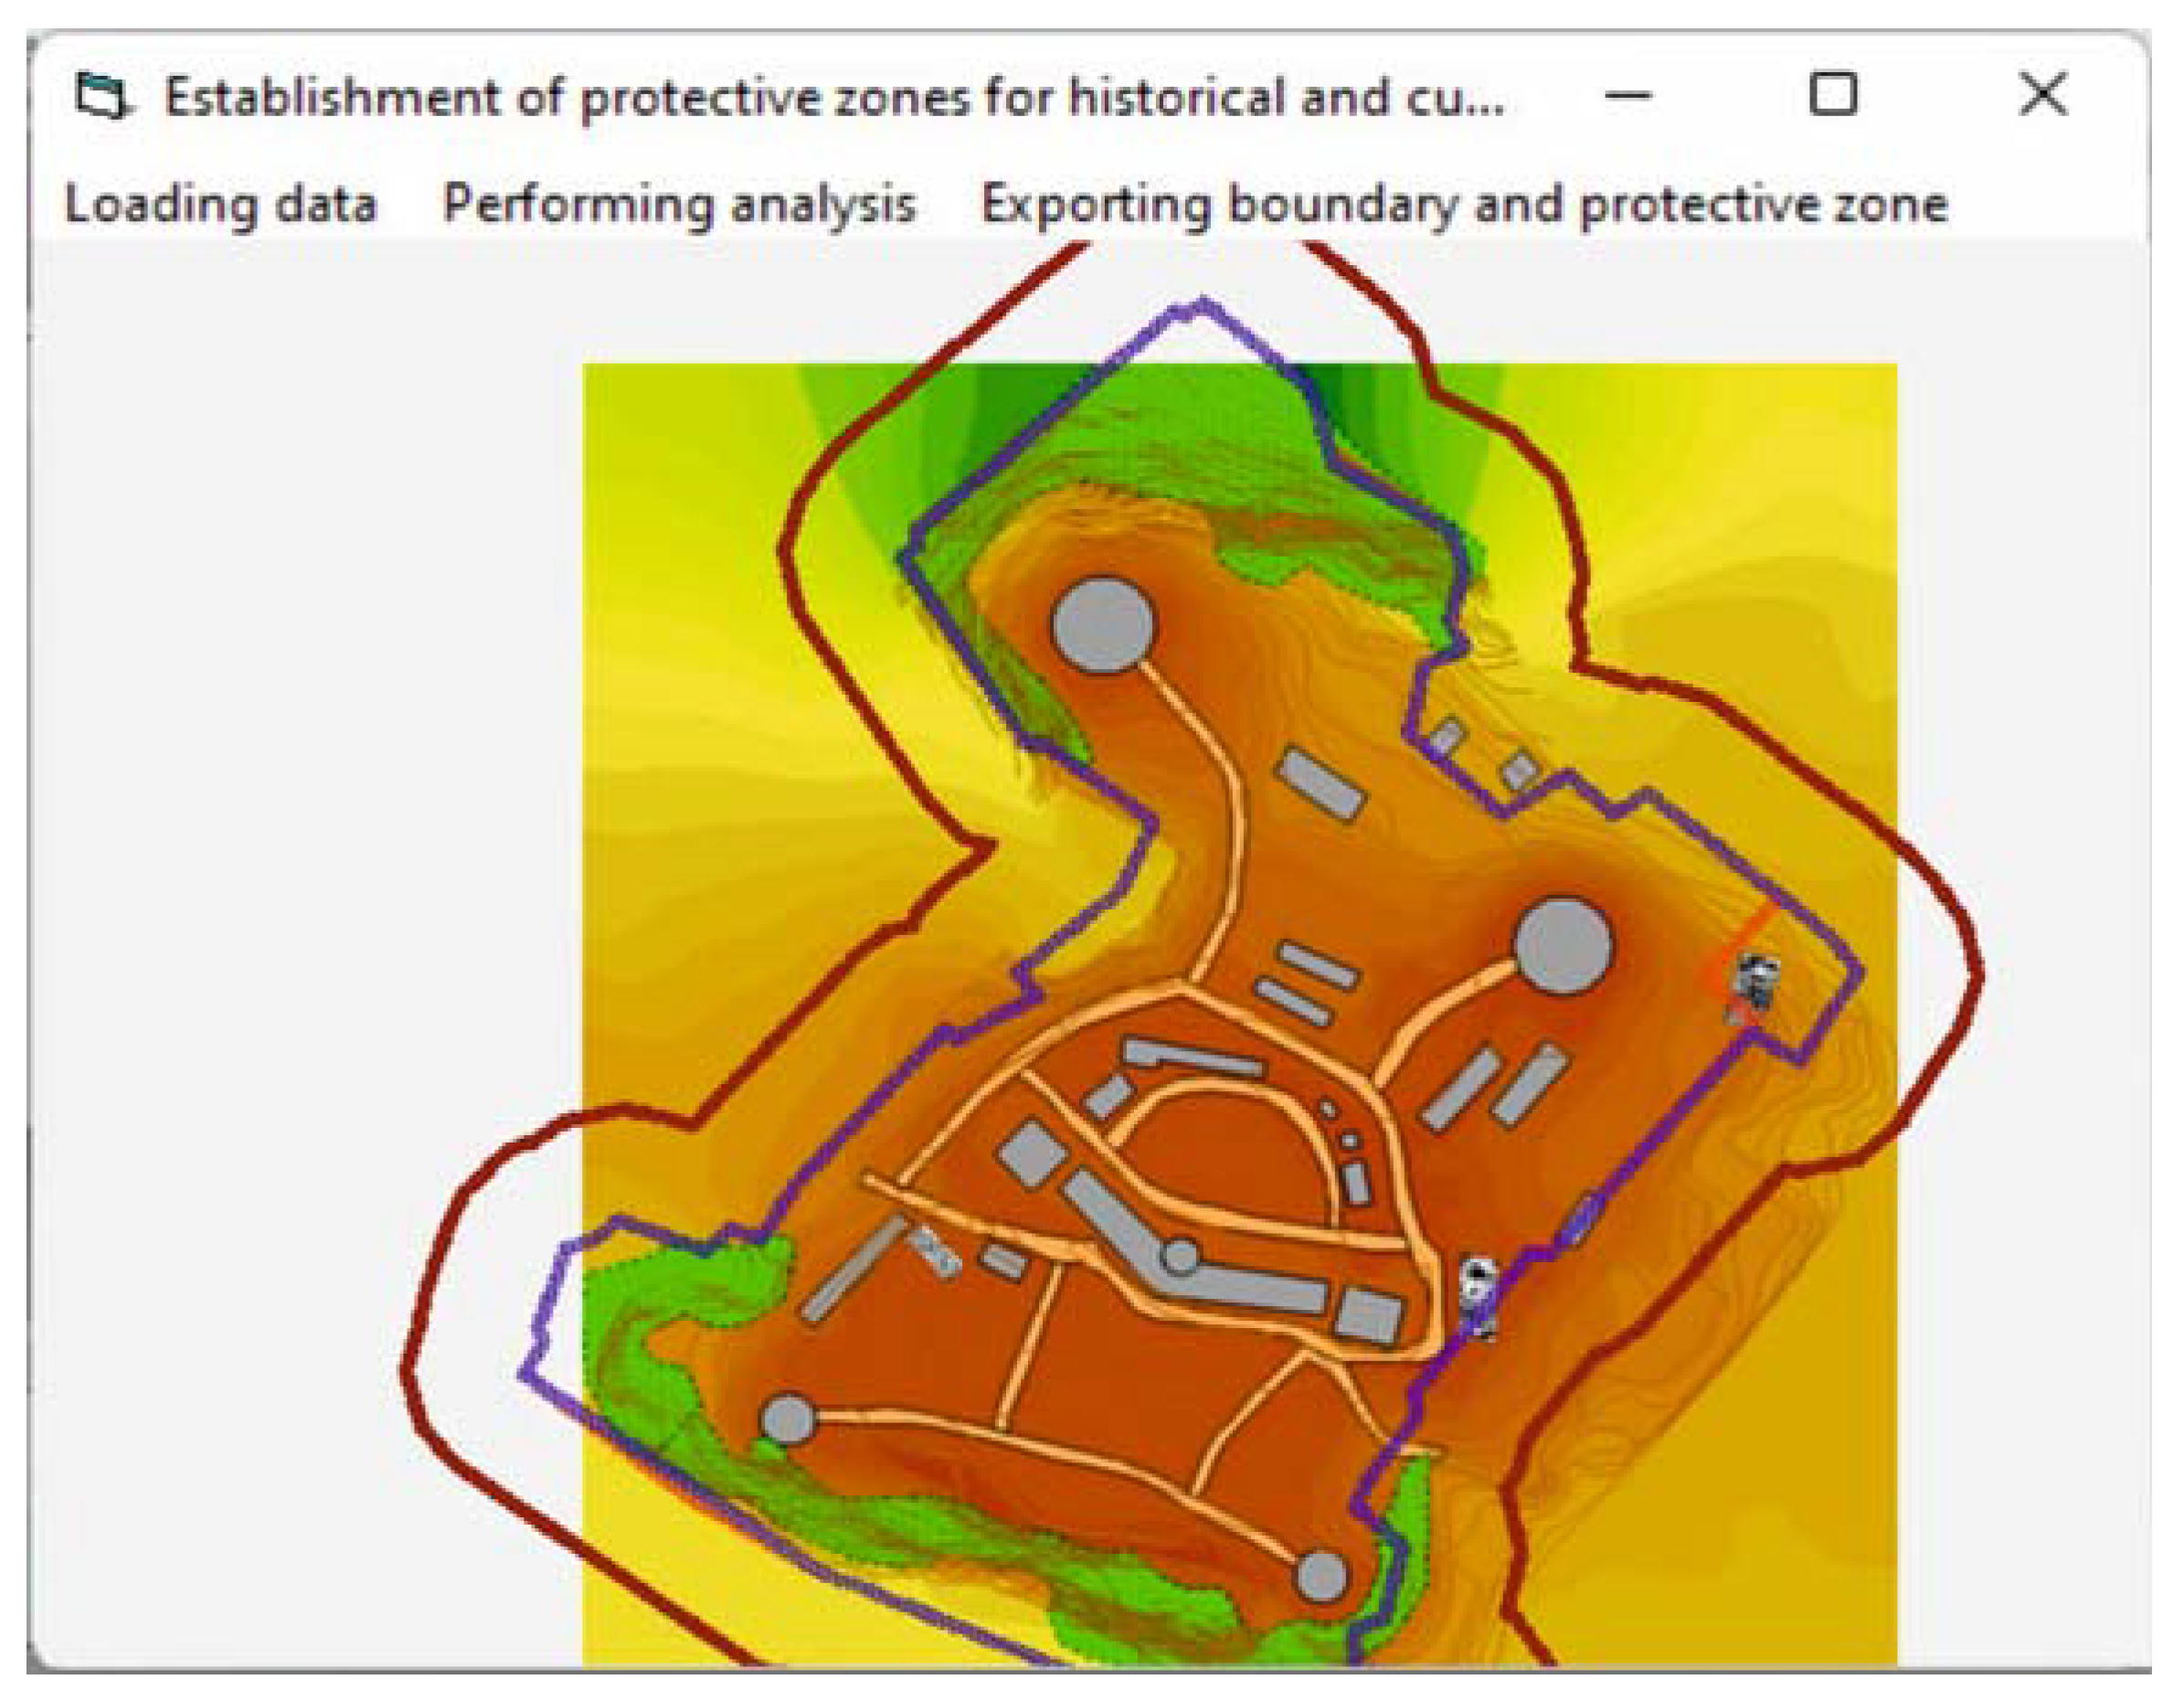

Table 1.
The main technical specifications of the UTSI GV3_1 GPR (Ground Penetrating Radar)
| The name of the characteristic | Parameter |
|---|---|
| Antenna frequency | 400 Hz |
| Data reading interval | 0.15 |
| Transverse step | 0.15 m. |
Disclaimer/Publisher’s Note: The statements, opinions and data contained in all publications are solely those of the individual author(s) and contributor(s) and not of MDPI and/or the editor(s). MDPI and/or the editor(s) disclaim responsibility for any injury to people or property resulting from any ideas, methods, instructions or products referred to in the content. |
© 2024 by the authors. Licensee MDPI, Basel, Switzerland. This article is an open access article distributed under the terms and conditions of the Creative Commons Attribution (CC BY) license (http://creativecommons.org/licenses/by/4.0/).
Copyright: This open access article is published under a Creative Commons CC BY 4.0 license, which permit the free download, distribution, and reuse, provided that the author and preprint are cited in any reuse.


