

Submitted:
25 April 2024
Posted:
28 April 2024
You are already at the latest version
Abstract
In the contemporary world of science, continuous observation of specific fixed regions is required, awaiting the emergence of targets or phenomena within those areas to locate and identify them. Astronomy requires continuous monitoring of stars, swiftly pinpointing occurrences, such as flares, and acquiring their spectral data to aid identification. In military contexts, continuous observation of specific areas is essential for promptly locating enemy movements and obtaining target spectral data for deciphering enemy disguises. Additionally, continuous observation of experimental samples in biochemistry is mandatory to pinpoint localized changes and acquire spectral data from those areas. Hence, this paper develops a novel imaging spectrometer solution to monitor localized regions continuously. Specifically, this paper first elaborates on the developed instrument’s characteristics and optical structure, followed by optical design software simulations. The instrument has an F-number of 5, a focal length of 100mm, and a field of view covering the wavelength range from 400nm to 600nm. The optical path diagram indicates that the system’s dispersion and imaging images can be separated, meeting the system’s requirements. Besides, the Modulation Transfer Function (MTF) graph confirms that the image quality meets the requirements. Furthermore, a region-monitoring type imaging spectrometer was constructed to assess the instrument’s capability for spectral observation of fixed regions. The instrument can detect a fixed area, with the target placed within the detection area. Spectral data were successfully obtained by conducting image processing on the acquired images. The correlation coefficient between this data and reference data was as high as 0.9226, indicating the instrument’s successful measurement of the target’s spectrum. Thus, the developed instrument demonstrated that it can image the observed areas and acquire spectral data from targets within those regions.
Keywords:
spectrometer
; imaging
; region monitoring
Introduction
In the modern world, continuous monitoring of a particular area and the rapid and accurate identification of targets or phenomena are common requirements. For instance, in astronomy, sustained observations of a specific region allow for detecting rapid changes in certain parameters over short periods, thereby enabling inferences about the area’s deeper structures. Similarly, in military contexts, surveillance of a designated area aims to detect enemy movements promptly, especially those concealed.
Researchers have proposed numerous optical identification schemes in pursuit of more precise target identification by scrutinizing various parameters within a given area. Among them, Spectrometers stand out as critical instruments in analytical applications and have demonstrated extensive usage across diverse fields[1], such as chemistry [2], biology [3], food science [4], and agriculture [5]. This instrument offers a continuous and high-resolution spectral dataset, which allows for a more comprehensive analysis of the optical reflectance spectrum, enabling the precise identification and characterization of various materials. Leveraging the frequencies and intensities of the emitted and absorbed light radiation by substances, spectral analysis facilitates qualitative, quantitative, and structural analyses, finding wide-ranging applications.
Currently, two primary approaches exist for continuous observation and spectral acquisition of targets within a specific region. One method involves coating telescopes to capture data across several discrete wavelength bands. At the same time, the other method utilizes traditional dispersing imaging spectroscopy to scan and acquire spectral data from the target area. Here, we discuss these approaches using astronomy as an example.
The telescope coating method stands out as the predominant solution. In the Solar Dynamics Observatory (SDO) project announced in 2011, the Atmospheric Imaging Assembly (AIA) system extensively observed the sun in discrete wavelength bands at 450nm, 170nm, 304nm, 160nm, 17.1nm, 19.3nm, 21.1nm, 33.5nm, 9.4nm, and 13.1nm. Manufacturers opt for telescope coating to facilitate target observation. As illustrated in Figure 1, by applying different coatings to the mirrors of four telescopes, three telescopes can achieve imaging in six extreme ultraviolet bands. In contrast, one telescope can perform spectral imaging in four ultraviolet bands[7].
The telescope coating approach exemplifies significant advancements. For instance, in the AIA system, the coated mirrors enable imaging across multiple UV bands, enhancing observational capabilities. This method facilitates spatially locating and studying specific phenomena or targets within a region of interest. Similar to the AIA, numerous instruments have been designed to continuously image specific regions using coating telescopes, allowing these instruments to capture data across several discrete wavelength bands. The advantage of such instruments lies in their ability to rapidly locate the spatial positions of targets of interest within a region and acquire spectral data across multiple bands. However, they cannot obtain continuous spectra of the targets of interest and often suffer from lower spectral resolution. For instance, the spectral resolution achieved through coating in AIA is merely 0.5nm.
As an illustration of the dispersing imaging spectroscopy approach, we examine the Extreme Ultraviolet Imaging Spectrometer (EIS) onboard the Hinode sunrise satellite. Developed collaboratively by Japan, the United Kingdom, and the United States, the Hinode satellite, launched in 2007, carries the EIS to observe the solar corona and transition region emission lines. The EIS covers two continuous spectral ranges, 17nm-21nm and 25nm-29nm. The instrument employs a highly specialized design where incident light enters the system through an aperture, undergoes filtering, is then focused by a primary mirror onto a slit, and is further filtered before entering a concave diffraction grating. The diffracted light is then focused onto two detectors. The primary mirror and the grating are divided into two sections, each coated with an optimized layer of Mo/Si film, ensuring mutual alignment of the mirror, grating, and detectors [8]. The instrument’s aperture is divided into two bands, which provide images for each band. The two spectral bands (SW: 166–212 Å; LW: 245–291Å) provide detailed electron density measurements, temperature, emission measures, and elemental abundances [9]. The optical path is illustrated in Figure 2[10].
Instruments similar to EIS can obtain spectral data with very high spectral resolution. However, they have limitations due to the presence of a slit within the instrument, which severely restricts the field of view and prevents full-frame observations. This can lead to missing targets.
In summary, both the coated telescope approach and the dispersion-type imaging spectrometer approach have limitations when observing a fixed region, locating targets of interest, and obtaining target spectra. The coated telescope approach cannot capture continuous spectra, while the dispersion-type imaging spectrometer cannot simultaneously observe across the full frame.
In pursuit of enhanced capabilities for continuous observation, target discovery, and identification within specific regions, this study introduces an instrument designed to provide spectral imaging capabilities for a given area. Tailored for spectral imaging of designated regions, the instrument facilitates rapid localization of targets or phenomena within the area of interest while concurrently capturing their spectral signatures.
1. Principle of the Regional Monitoring Imaging Spectrometer
The developed instrument produces two images of the observed area: conventional imaging and dispersion graphs. The dispersion graph depicts the dispersion of the conventional graph along a certain direction. For simplicity, let us assume a series of object points , each characterized by wavelengths , where i ranges from 1 to s, and j ranges from 1 to n. Figure 3 depicts the schematic of the conventional imaging graph, while Figure 4 presents the schematic of the dispersion graph, with each grid representing a pixel.
When a phenomenon occurs at point , it can be inferred that the brightness at this point changes, and simultaneously, the spectral range - at this point alters. The regions of change in the two system images are illustrated by the red boxes in Figure 5 and Figure 6. Assuming the brightness change is , and the spectral change in each band is -, as depicted in Figure 5, the difference between the pre-phenomenon and post-phenomenon imaging graph represents the brightness change. Similarly, the difference between the dispersion graph before and after the phenomenon indicates the variations in each spectral band, denoted as .
By subtracting the images captured before and after the occurrence of the phenomenon, two new images can be obtained, as displayed in Figure 7 and Figure 8.
We hypothesize that a flare occurs within the designated region. Based on empirical knowledge, flares exhibit significant spectral variations across certain bands. Thus, from Figure 7, we can pinpoint the spatial location of the flare, as all variations are concentrated within a single pixel. Additionally, Figure 8 allows us to quantify the spectral changes at that point, as these variations are distributed across a series of pixels.
2. Optical Design of Regional Monitoring Imaging Spectrometer
Given the discrepancies between the developed instrument and traditional imaging spectrometers, this study delves into our instrument’s optical design process. As outlined earlier, the developed instrument requires a conventional imaging image and a dispersion image, both at the same wavelength. Thus, a grating-based approach is considered, where the 0th order of the grating produces the conventional imaging image, and the ±1st orders produce the dispersion image. The instrument should be designed to facilitate the placement of a field stop and maintain good image quality.
The optical design requirements for such an instrument are proposed as follows:
- The instrument must simultaneously produce both images without overlap.
- Image quality must meet the specified standards. Assuming a 5-micrometer CMOS, the point spread function at 600nm wavelength must be within 5 micrometers. Consequently, the system’s F-number must be less than 5.
- The system requires an intermediate image plane to accommodate a square field stop, thus isolating the dispersion and imaging images without significantly increasing the overall system length.
- Image quality must meet specified standards.
- Avoid overlapping of spectra of different orders.
Based on these requirements, we design the structure illustrated in Figure 9, Figure 10 and Figure 11.
Figure 9 depicts the 0th order spectrum image produced by the grating, while Figure 10 illustrates the -1st order spectrum image. According to the grating equation, when the grating order is 0, the system exhibits no dispersion, and the incident angle equals the reflection angle, resulting in normal imaging. Conversely, the -1st order spectrum introduces dispersion, forming a dispersion image. Figure 11 depicts the system’s imaging, where the 0th and -1st order spectra are simultaneously captured. The lens portion of the system can be custom-designed or purchased to suit specific requirements.
3. Experimentation and Data Processing
3.1. Experimentation
A regional monitoring imaging spectrometer was constructed and tested to validate our instrument’s performance. Figure 12 to Figure 13 depict the physical layout of the optical system. The components presented in Figure 12 include the instrument’s entrance pupil, filter, parabolic mirror, reflectors, grating, imaging lens, and CMOS detector.
The experimental observations, as depicted in Figure 14, Figure 15 and Figure 16, involve continuous monitoring of a specific region, as displayed in Figure 14. Subsequently, the appearance of a target is illustrated in Figure 15. Following the emergence of the target, variations in the spectral region are observed, and the disparity before and after the target’s appearance is illustrated in Figure 16.
3.2. Data Processing
The spectral data of the target were obtained under identical brightness conditions using a specialized spectrometer, as shown in Figure 17.
Applying a denoising strategy involving wavelet transformation and moving averages to Figure 18 results in obtaining Figure 19.
The Pearson correlation coefficient is a statistical measure to assess the linear relationship between two variables. Ranging from -1 to 1, it quantifies their linear association by computing the covariance of the two variables. A coefficient of 1 indicates a perfect positive correlation, -1 indicates a perfect negative correlation, and 0 indicates no linear relationship between the variables. Usually, a value greater than 0.8 indicates a strong correlation between the two data. The calculated Pearson correlation coefficient between the comparison item and denoised data is 0.9226, indicating that the instrument successfully measured the target’s spectral data.
4. Results
We developed a region-monitoring imaging spectrometer with instrument parameters reported in Table 1. The instrument continuously images a specific area, where the appearance of a target changes in the conventional image and dispersion graph. Thus, we acquired a segment of target spectral data by utilizing the altered dispersion spectrum. Furthermore, we obtained the denoised data using a denoising method involving wavelet transformation and moving averages. The Pearson correlation coefficient between the denoised and reference data was 0.9226, indicating a highly significant correlation. Hence, the instrument successfully measured the target’s spectral data.
5. Discussion
This study investigates a region-monitoring imaging spectrometer. We discuss the results concerning three aspects.
5.1. Discussion of Measurement Results
Firstly, regarding the measurement of target spectral data, although the calculated Pearson coefficient shows a strong correlation with the denoised and the reference data, there are visual discrepancies. We attribute these differences to several factors:
- Vignetting, which affects measurement outcome.
- Random noise from the CMOS camera in both measurements, which affects measurement accuracy.
- The instrument’s spectral resolution is related to the target’s width in the dispersion dimension. Due to the broader width of the target in the dispersion dimension, the spectral resolution is lower than that of the reference, resulting in less distinct peaks in the denoised data.
5.2. Discussion of Instrument Advantages
Subsequently, we discuss the advantages of the developed instrument over traditional slit-based imaging spectrometers:
- Higher energy utilization efficiency of the dispersion element. A significant portion of energy (approximately 60%) resides in the zero-order spectrum for gratings. Traditional slit-based imaging spectrometers do not utilize the zero-order spectrum for imaging, while the region-monitoring imaging spectrometer fully utilizes it.
- Higher energy utilization efficiency over the full field of view. Traditional slit-based imaging spectrometers can only utilize energy within the slit area due to the presence of the slit. In contrast, the region-monitoring imaging spectrometer can utilize energy across the entire field of view.
- Lower manufacturing and tuning complexity. Traditional slit-based imaging spectrometers often employ a structure comprising a front telescope and a rear spectrometer. For instance, an off-axis three-mirror telescope commonly used in astronomy requires three large-aperture non-spherical mirrors. The telescope and spectrometer independently correct aberrations, leading to a complex structure. In contrast, the region-monitoring imaging spectrometer can independently image, and the collimation structure of the telescope and spectrometer comprises two symmetrical parts of a parabolic mirror, simplifying the structure. Only a small-aperture transmission imaging system must be manufactured, significantly reducing manufacturing costs and tuning complexity.
5.3. Discussion of Instrument Disadvantages
We also aim to discuss the disadvantages of the proposed instrument compared to traditional slit-based imaging spectrometers:
- The instrument’s spectral resolution depends on the target width in the dispersion dimension; thus, there is no stable spectral resolution. The instrument’s spectral resolution may be relatively low when faced with larger targets.
- There are mutual constraints between the instrument’s field of view and wavelength range.
- The instrument cannot obtain spectral data for every point in the image but rather captures spectral data for points where changes occur within the monitoring range.
6. Conclusions
In contemporary society, sustained observation of specific regions is necessary. In the realm of astronomy, continual monitoring is imperative, awaiting the occurrence of certain phenomena. Similarly, military operations require ongoing surveillance of particular areas to track enemy movements. In the field of biochemistry, continuous observation of experimental samples is indispensable. Addressing these requisites, this study investigates a siltless-region monitoring imaging spectrometer. Firstly, the principles underlying this instrument’s siltless-region monitoring imaging spectrometer are elucidated. The optical design of this system is scrutinized, culminating in the development of a seamless-region monitoring imaging spectrometer. Operating within the wavelength range of 400-600nm, with a focal length of 100mm and employing 150 lines per millimeter transmission grating, it boasts a field of view of 3°×7°. A siltless-region monitoring imaging spectrometer is assembled to validate the instrument’s performance. Utilizing this apparatus enables sustained observation of a designated area, detecting spectral data corresponding to the emergence of targets within the region. The Pearson correlation coefficient between the denoised data and the comparison item is 0.9226, surpassing the threshold of 0.8, affirming the successful detection of target spectra. Thus, the instrument demonstrates its capability to monitor designated regions and acquire spectral data therein continuously.
Author Contributions
Conceptualization, R.O. and X.Z.; methodology, R.O. and X.Z.; software, R.O.; validation, X.Z.and L.J.; formal analysis, R.O. and T.F.; investigation, X.Z. and D.W.; resources, X.Z. Z.Z and D.W.; data curation, F.T and R.O.; writing—original draft preparation, R.O.; writing—review and editing, F.T and X.Z.; visualization, R.O and Z.Z.; supervision, X.Z. and L.J.; project administration, X.Z. and L.J.; funding acquisition, X.Z. and D.W. All authors have read and agreed to the published version of the manuscript.
Funding
This research received no external funding.
Institutional Review Board Statement
Not applicable.
Conflicts of Interest
The authors declare no conflicts of interest..
References
- Guan, Qingze and Lim, Zi Heng and Sun, Haoyang and Chew, Jeremy Xuan Yu and Zhou, Guangya 1, T. Review of Miniaturized Computational Spectrometers. Sensors 2023, 23, 8768. [Google Scholar] [CrossRef] [PubMed]
- Schliesser A, Brehm M, Keilmann F, van der Weide D 1, T. Frequency-comb infrared spectrometer for rapid, remote chemical sensing. Opt Express, 9029. [CrossRef]
- Szkoda J, Zmudzki J 1, T. Determination of lead and cadmium in biological material by graphite furnace atomic absorption spectrometry method. Bull Vet Inst Pulawy 2005, 49, 89–92. [Google Scholar]
- Ozbek, Nil and Akman, Suleyman 1, T. Determination of fluorine in Turkish wines by molecular absorbance of CaF using a high resolution continuum source atomic absorption spectrometer. LWT-Food Science and Technology. [CrossRef]
- Fara, Patricia 1, T. Newton shows the light: a commentary on Newton (1672)‘A letter… containing his new theory about light and colours…’. Philosophical Transactions of the Royal Society A: Mathematical, Physical and Engineering Sciences, 2039. [CrossRef]
- Neri, I.; Caponi, S.; Bonacci, F.; Clementi, G.; Cottone, F.; Gammaitoni, L.; Figorilli, S.; Ortenzi, L.; Aisa, S.; Pallottino, F.; et al 1, T.; et al. Real-Time AI-Assisted Push-Broom Hyperspectral System for Precision Agriculture. Sensors 2024, 24, 344. [Google Scholar] [CrossRef] [PubMed]
- Lemen, James R and Title, Alan M and Akin, David J and Boerner, Paul F and Chou, Catherine and Drake, Jerry F and Duncan, Dexter W and Edwards, Christopher G and Friedlaender, Frank M and Heyman, Gary F and others 1, T. The atmospheric imaging assembly (AIA) on the solar dynamics observatory (SDO). Solar Physics 2012, 275, 17–40. [Google Scholar] [CrossRef]
- Kosugi, Takeo and Matsuzaki, Keiichi and Sakao, Taro and Shimizu, Toshifumi and Sone, Yoshitsugu and Tachikawa, Sumitaka and Hashimoto, Tatsuaki and Minesugi, Kenji and Ohnishi, Akira and Yamada, Takahiro and others 1, T. The Hinode (Solar-B) mission: an overview. The Hinode Mission. [CrossRef]
- Del Zanna, G 1, T. The multi-thermal emission in solar active regions. Astronomy & Astrophysics 2013, 558, A73. [Google Scholar] [CrossRef]
- Culhane, JL and Harra, LK and James, AM and Al-Janabi, K and Bradley, LJ and Chaudry, RA and Rees, K and Tandy, JA and Thomas, P and Whillock, MCR and others 1, T. The EUV imaging spectrometer for Hinode). Solar Physics 2007, 243, 19–61. [Google Scholar] [CrossRef]
Figure 1.
SDO project setup. All four telescopes adopt mirror coating.
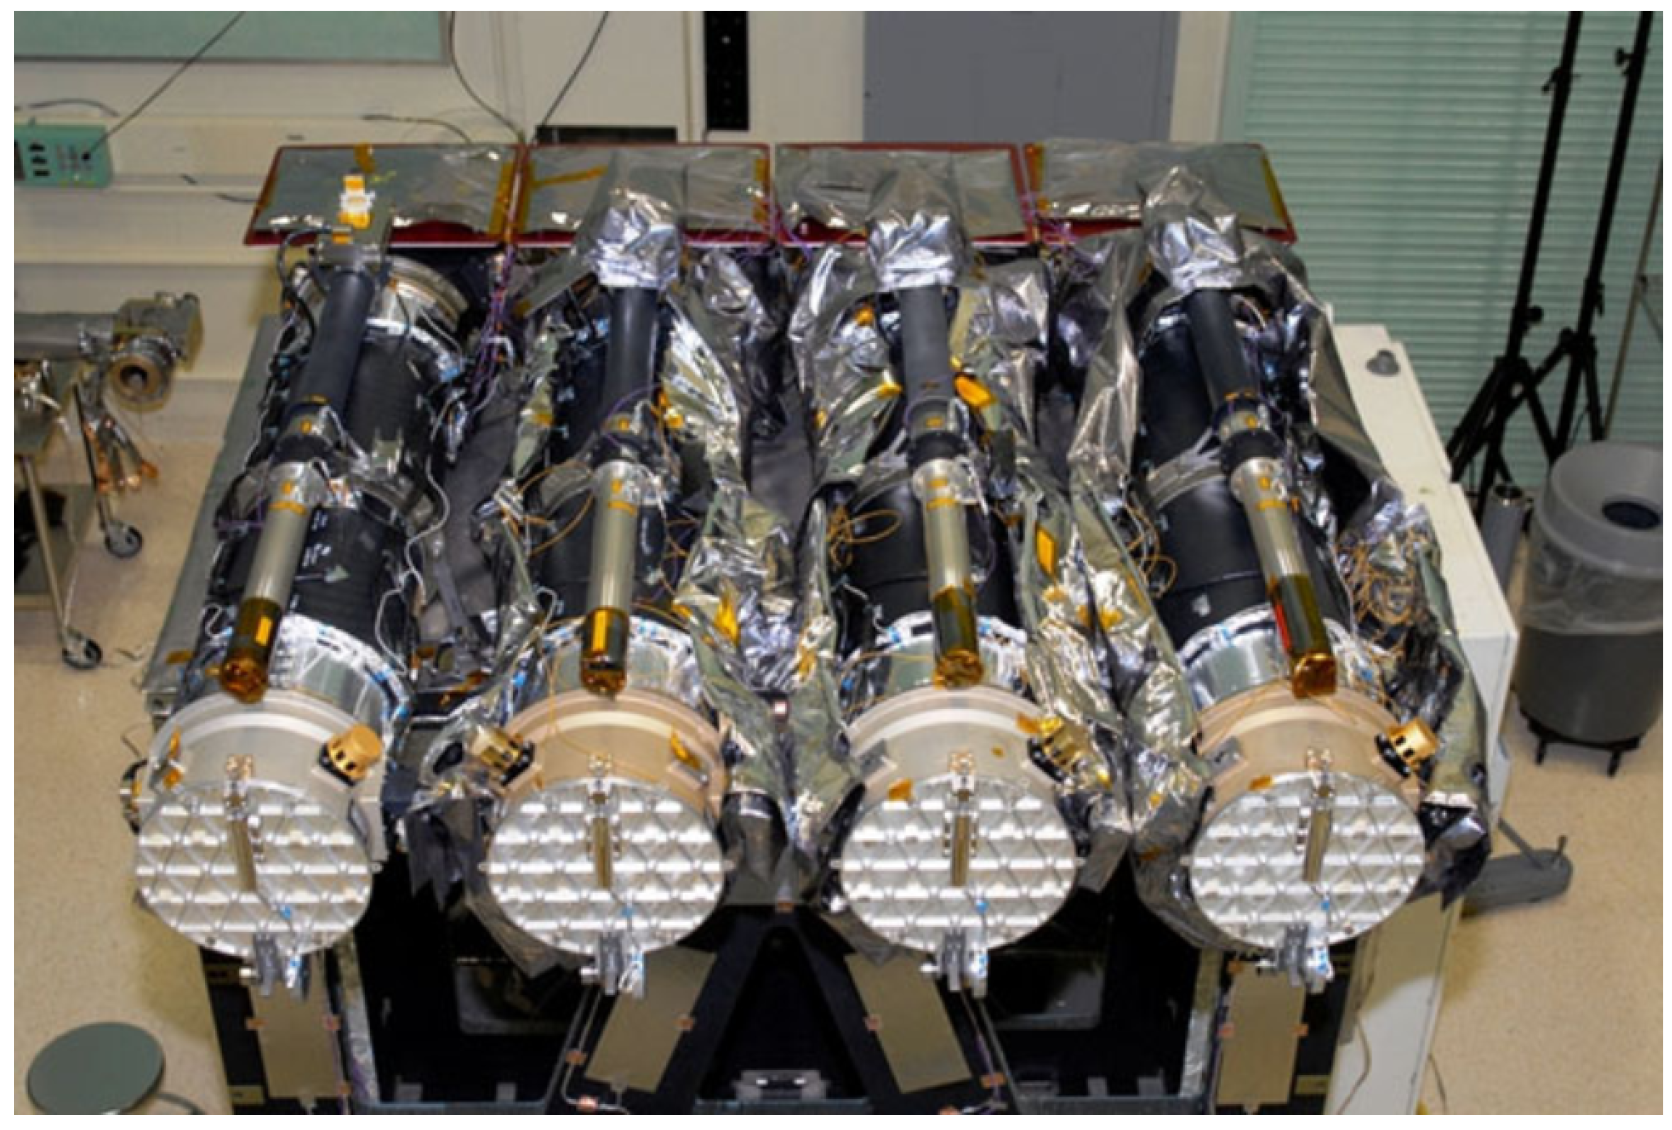
Figure 2.
Optical schematic diagram of extreme ultraviolet imaging spectrometer EIS.
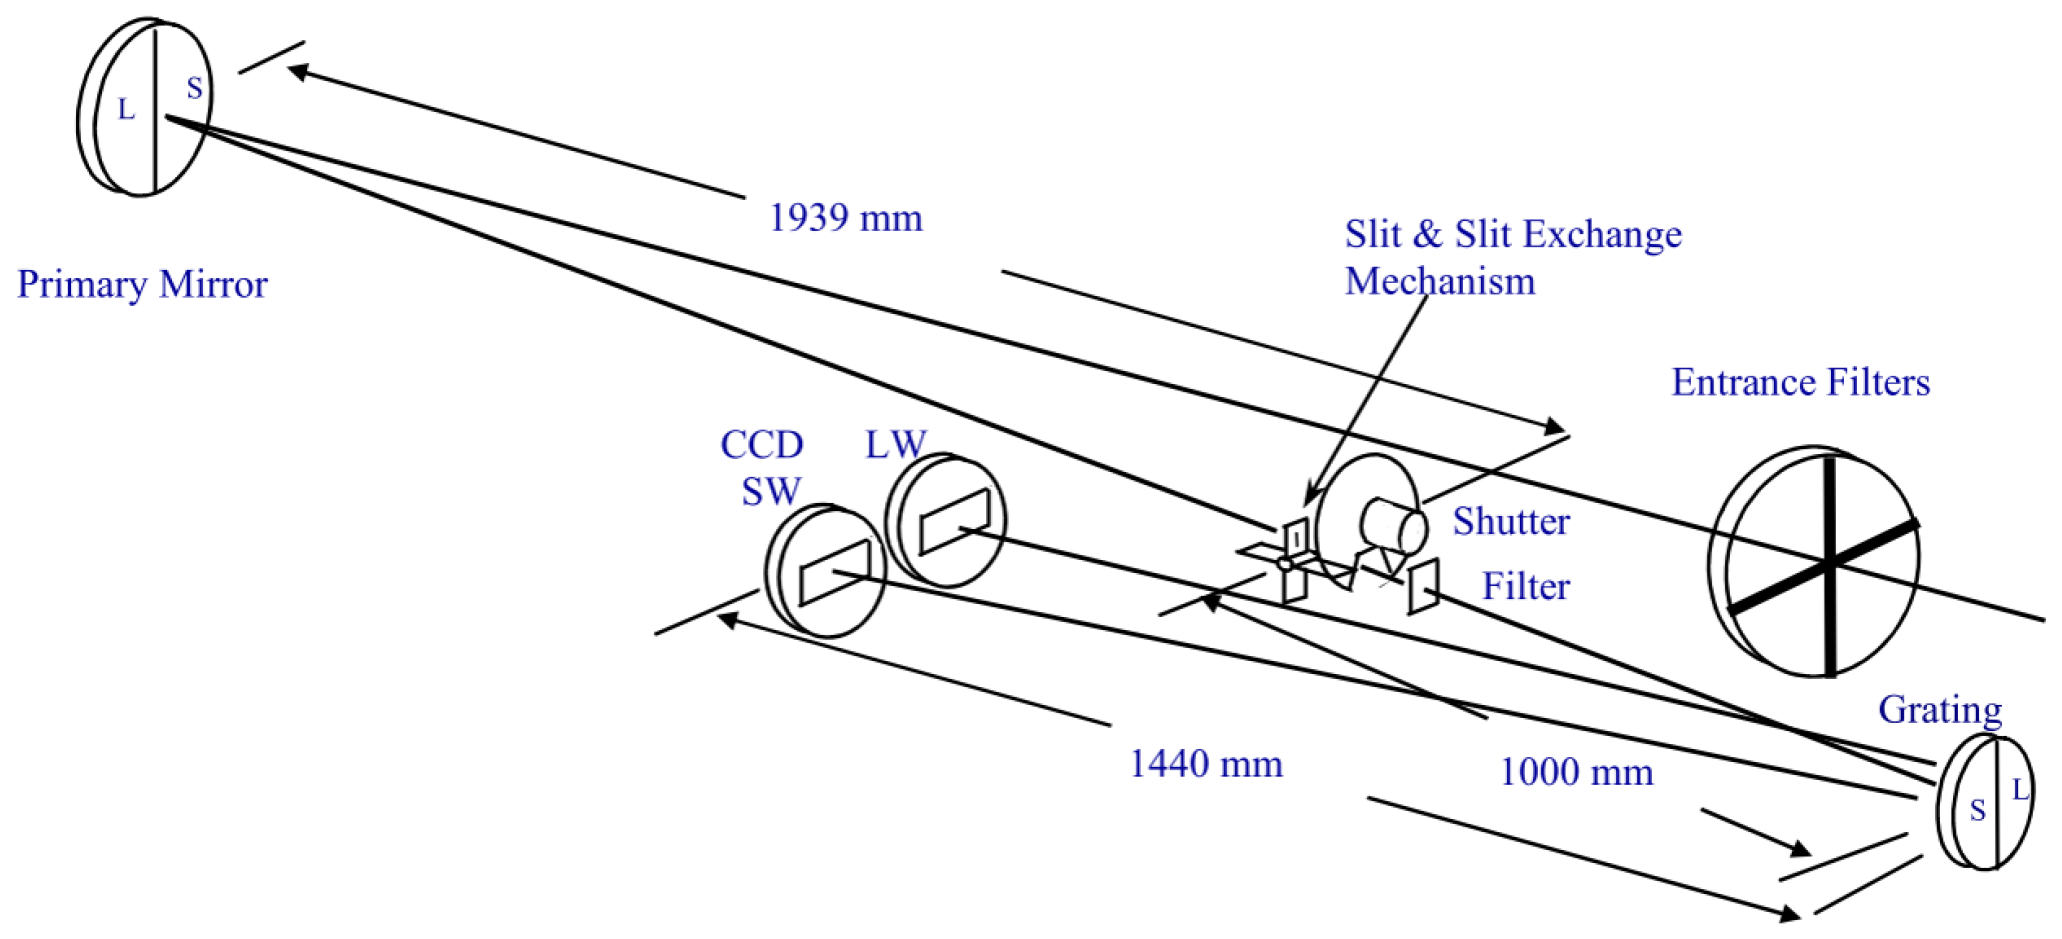
Figure 3.
Schematic diagram of imaging graph.
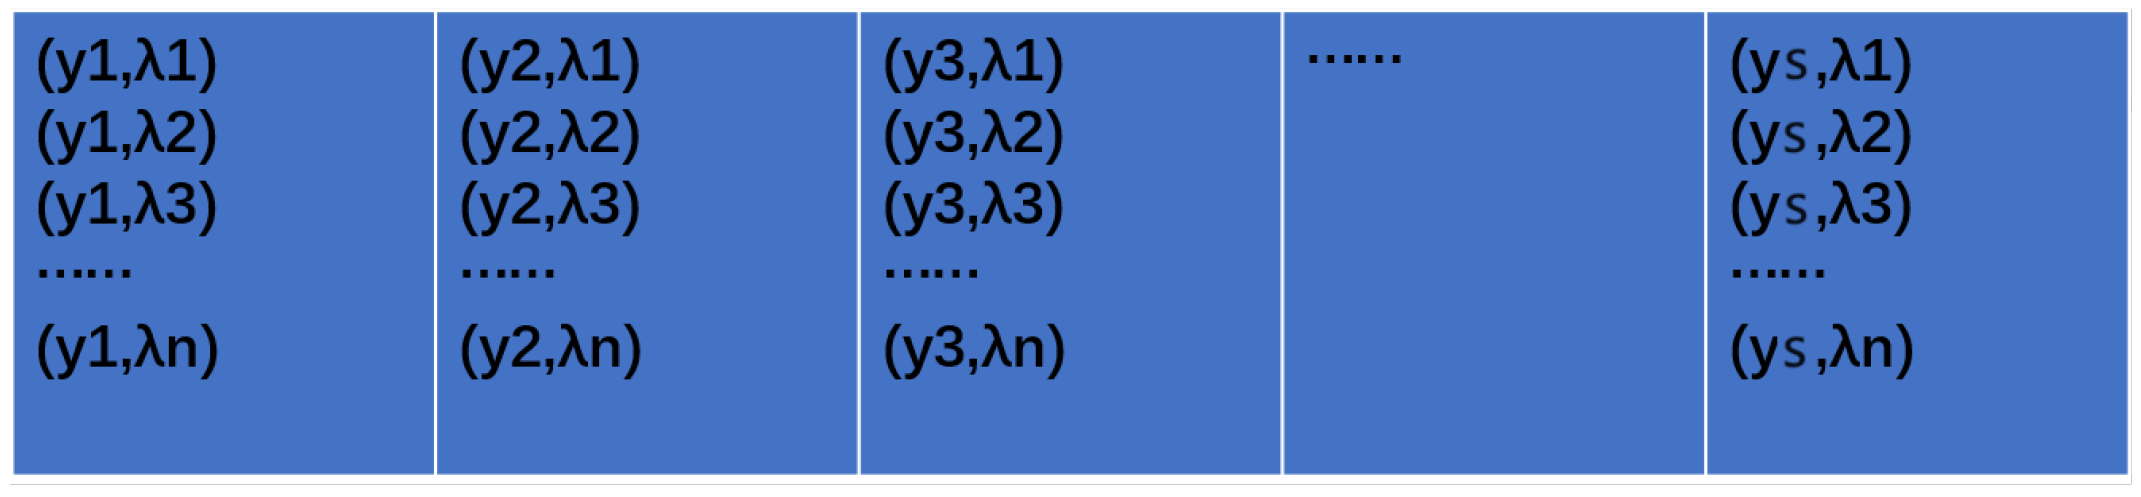
Figure 4.
Schematic diagram of dispersion graph.
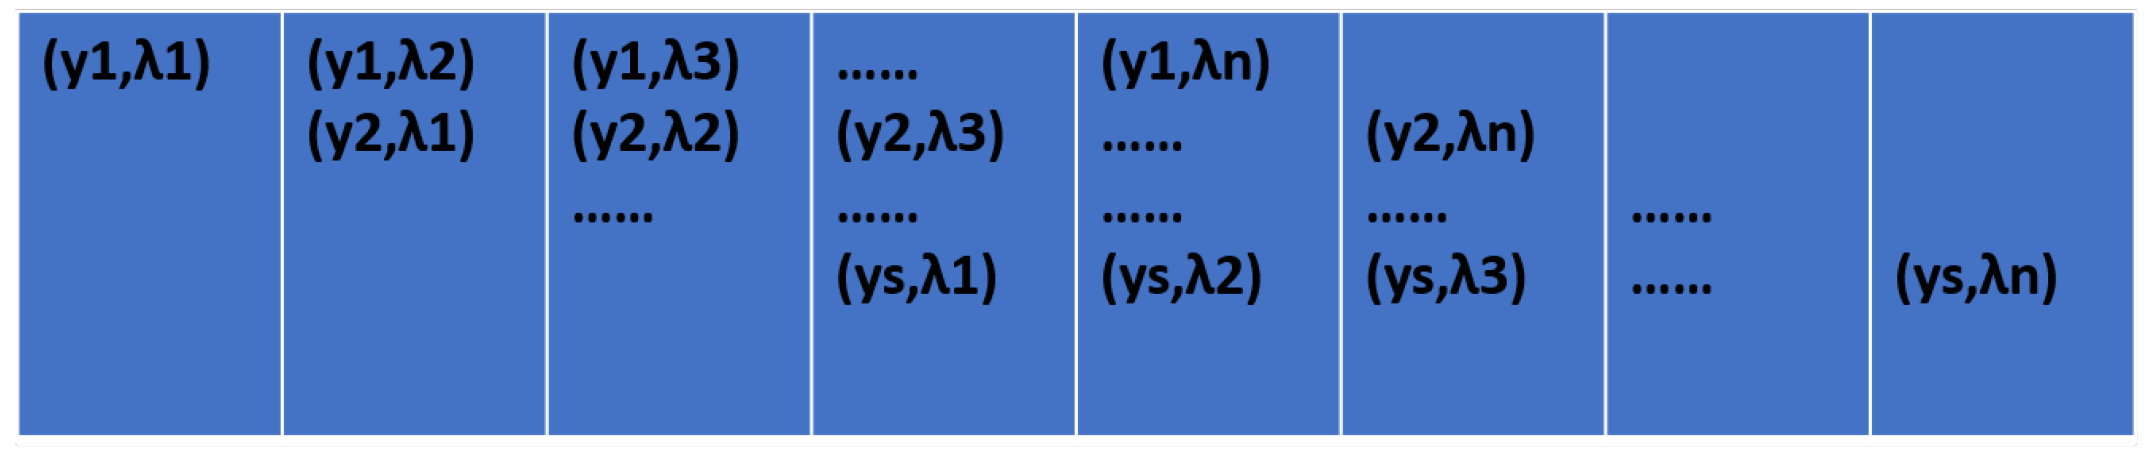
Figure 5.
Schematic Diagram of variable imaging graph.
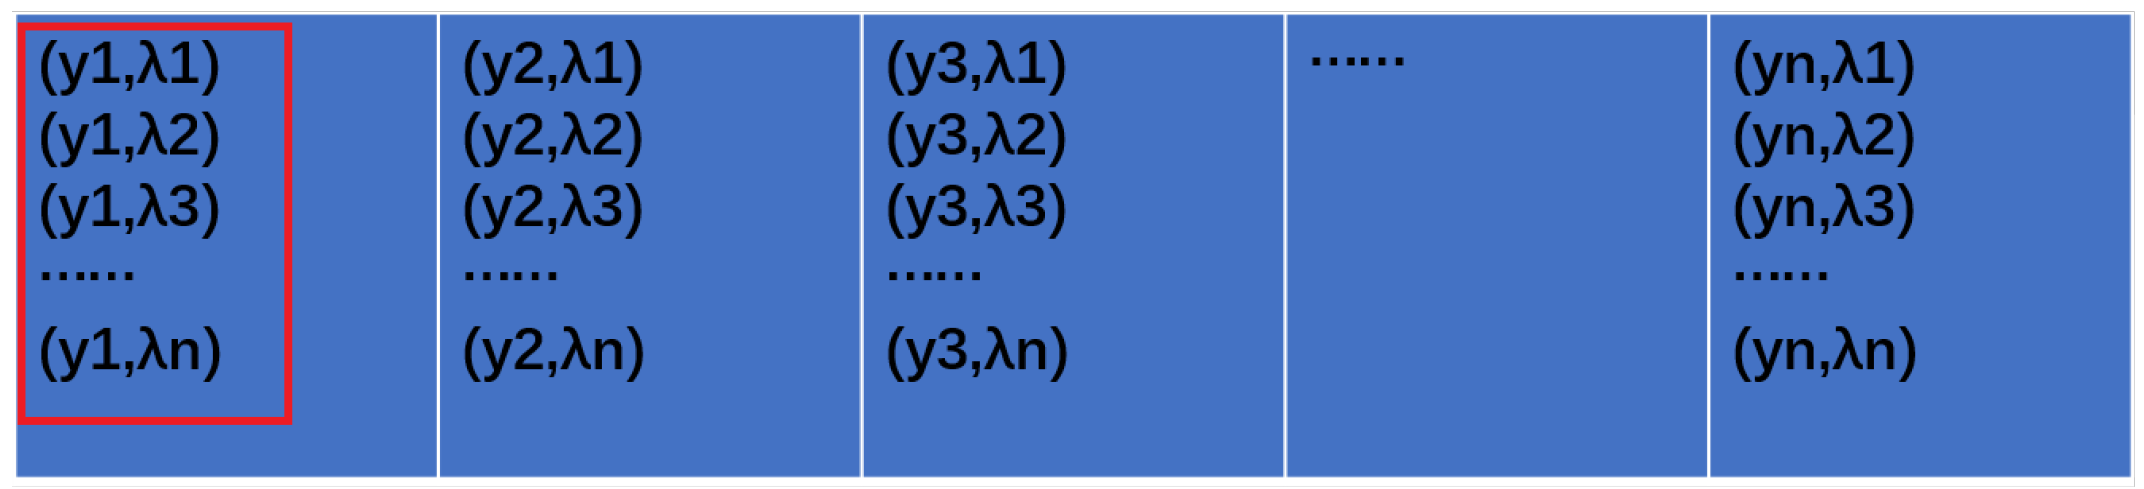
Figure 6.
Schematic diagram of dispersion graph.
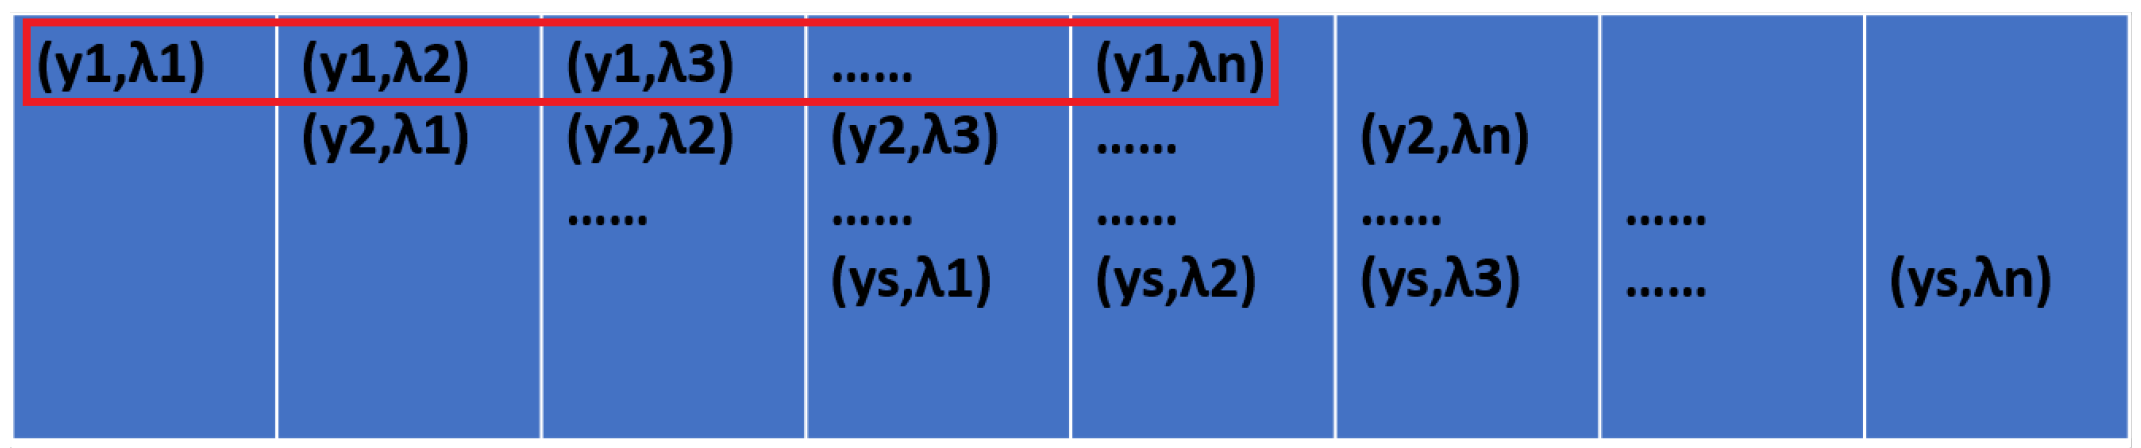
Figure 7.
Changes in Imaging Graph.
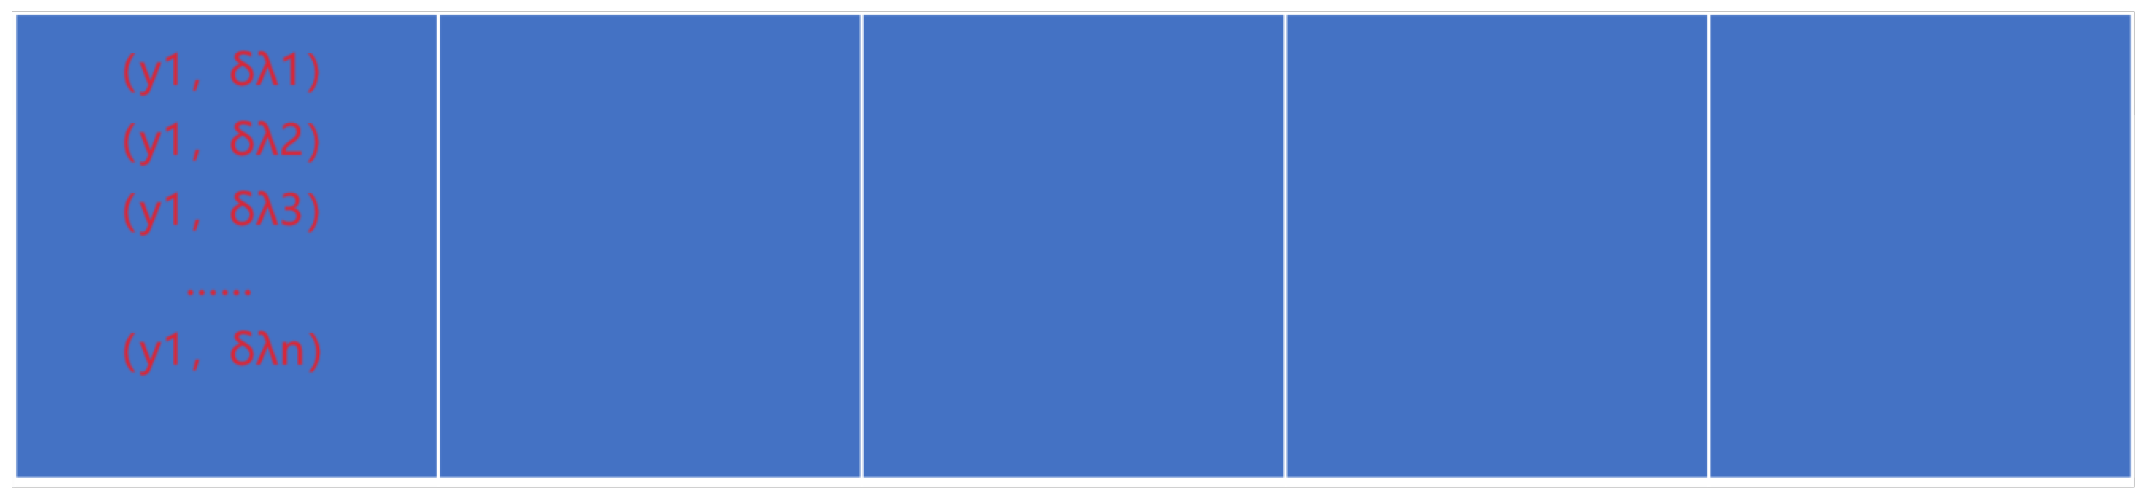
Figure 8.
Changes in Dispersion Graph.

Figure 9.
Zeroth-order Spectral Imaging Optical Path.
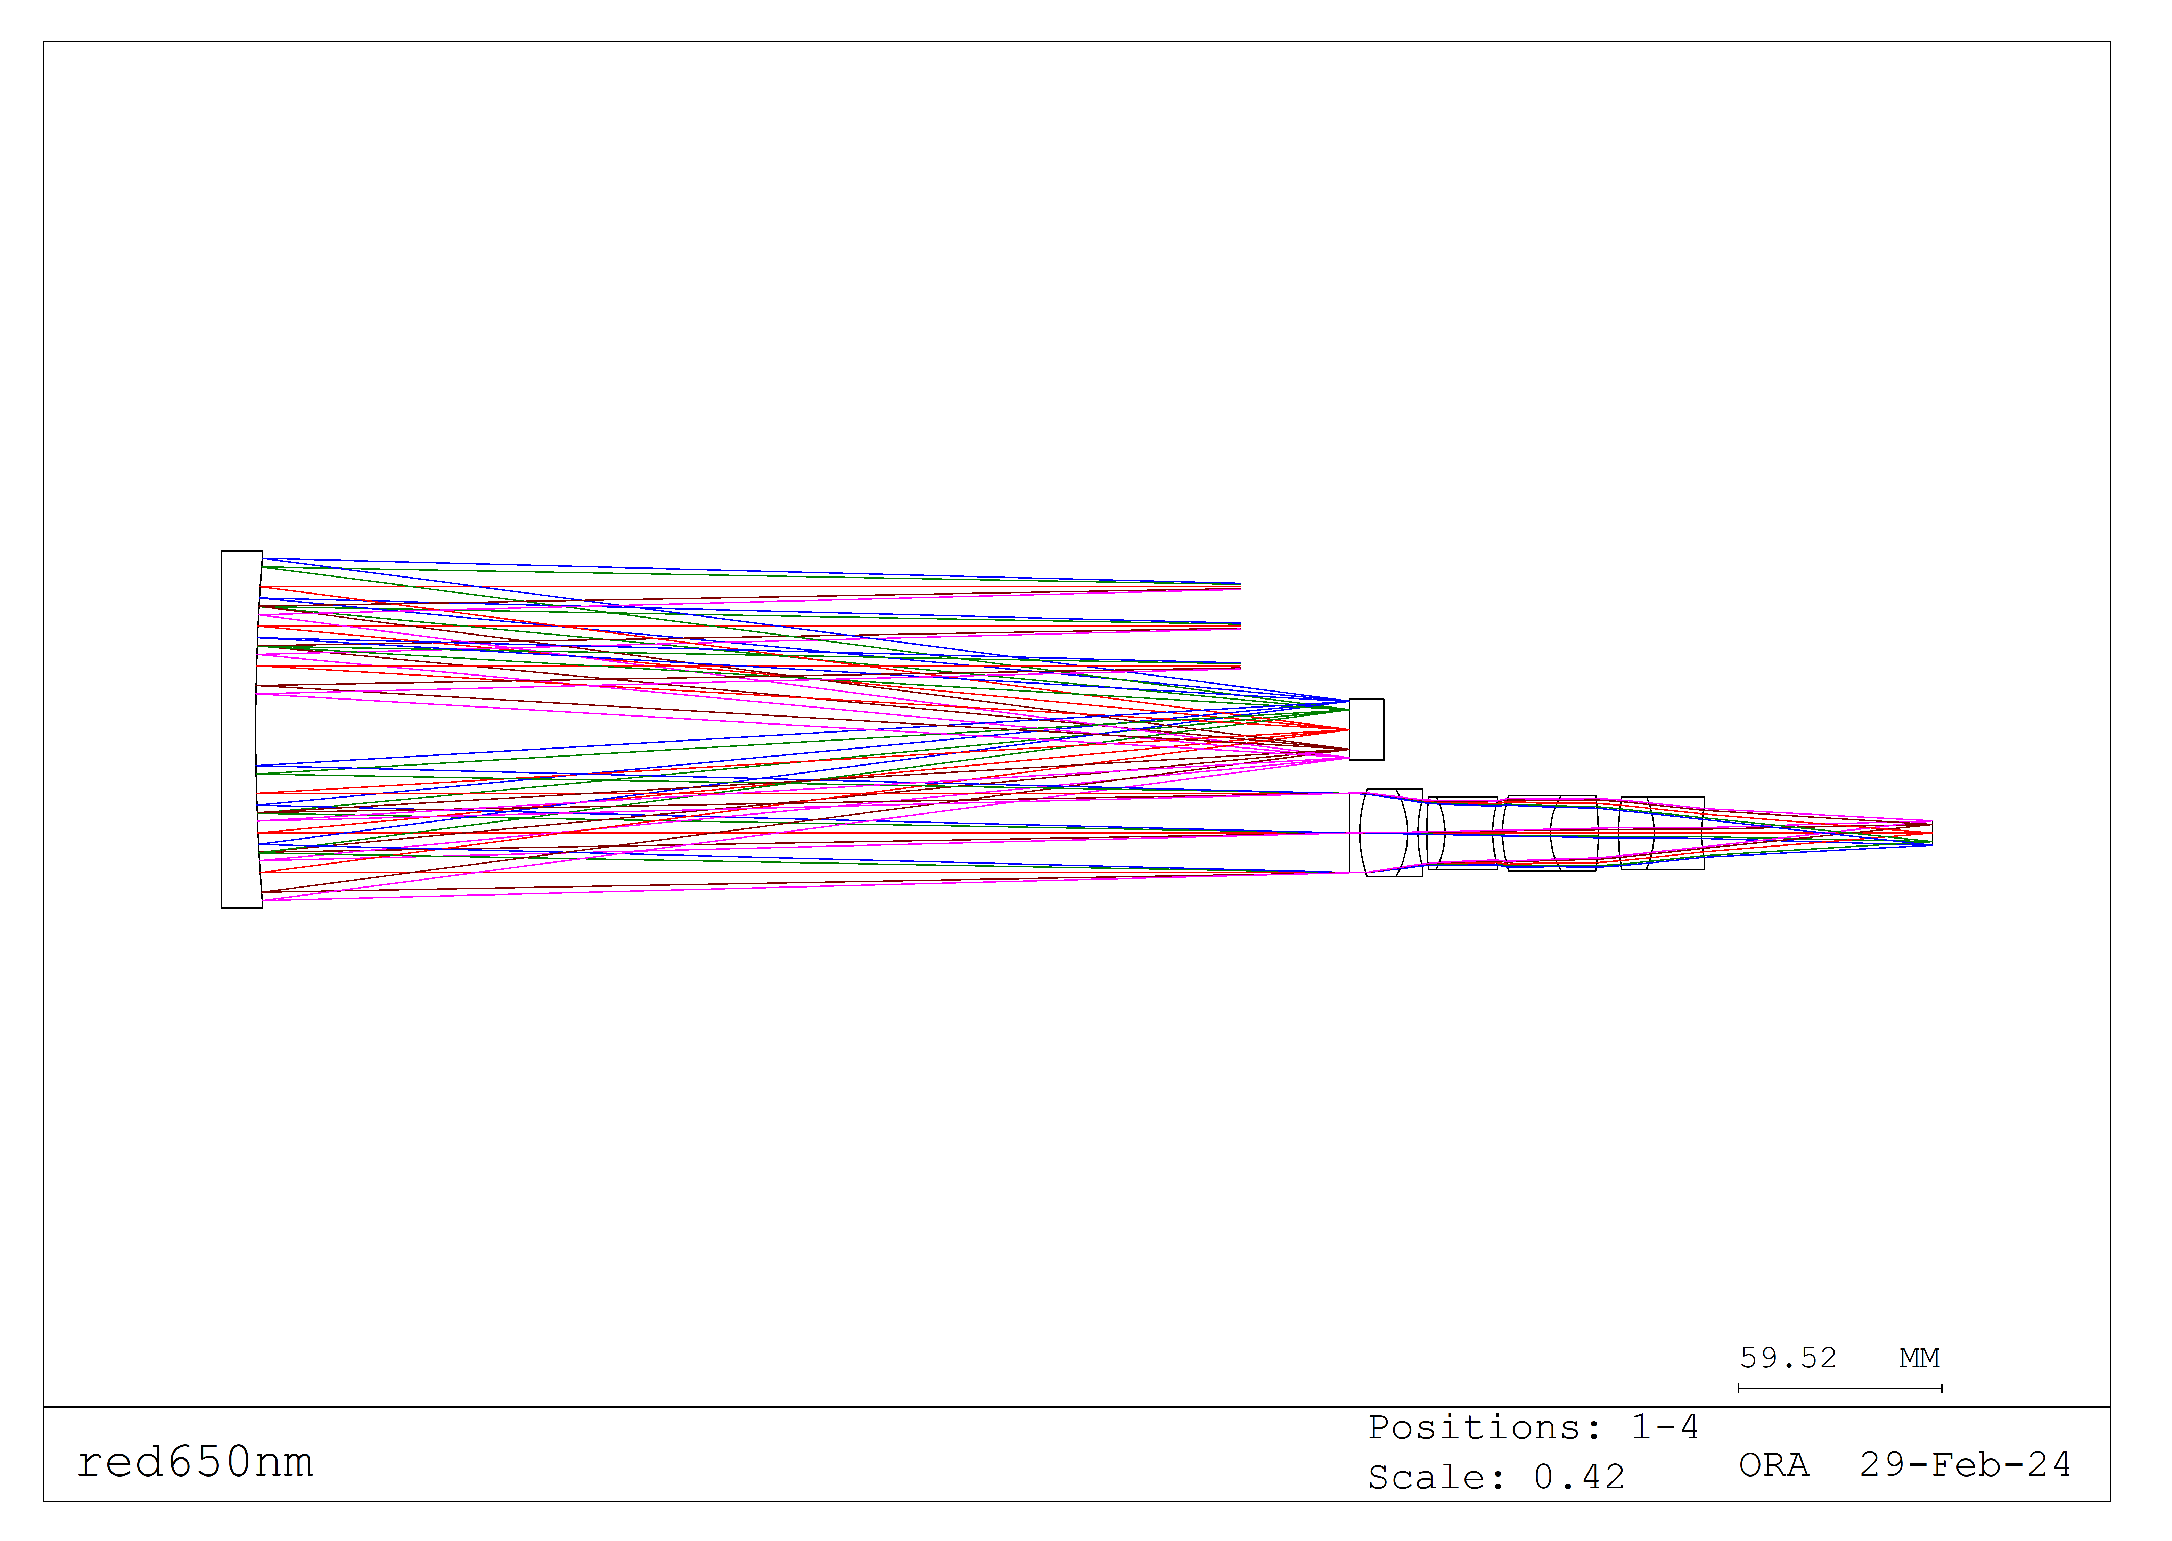
Figure 10.
Minus One Order Spectral Dispersion Optical Path.
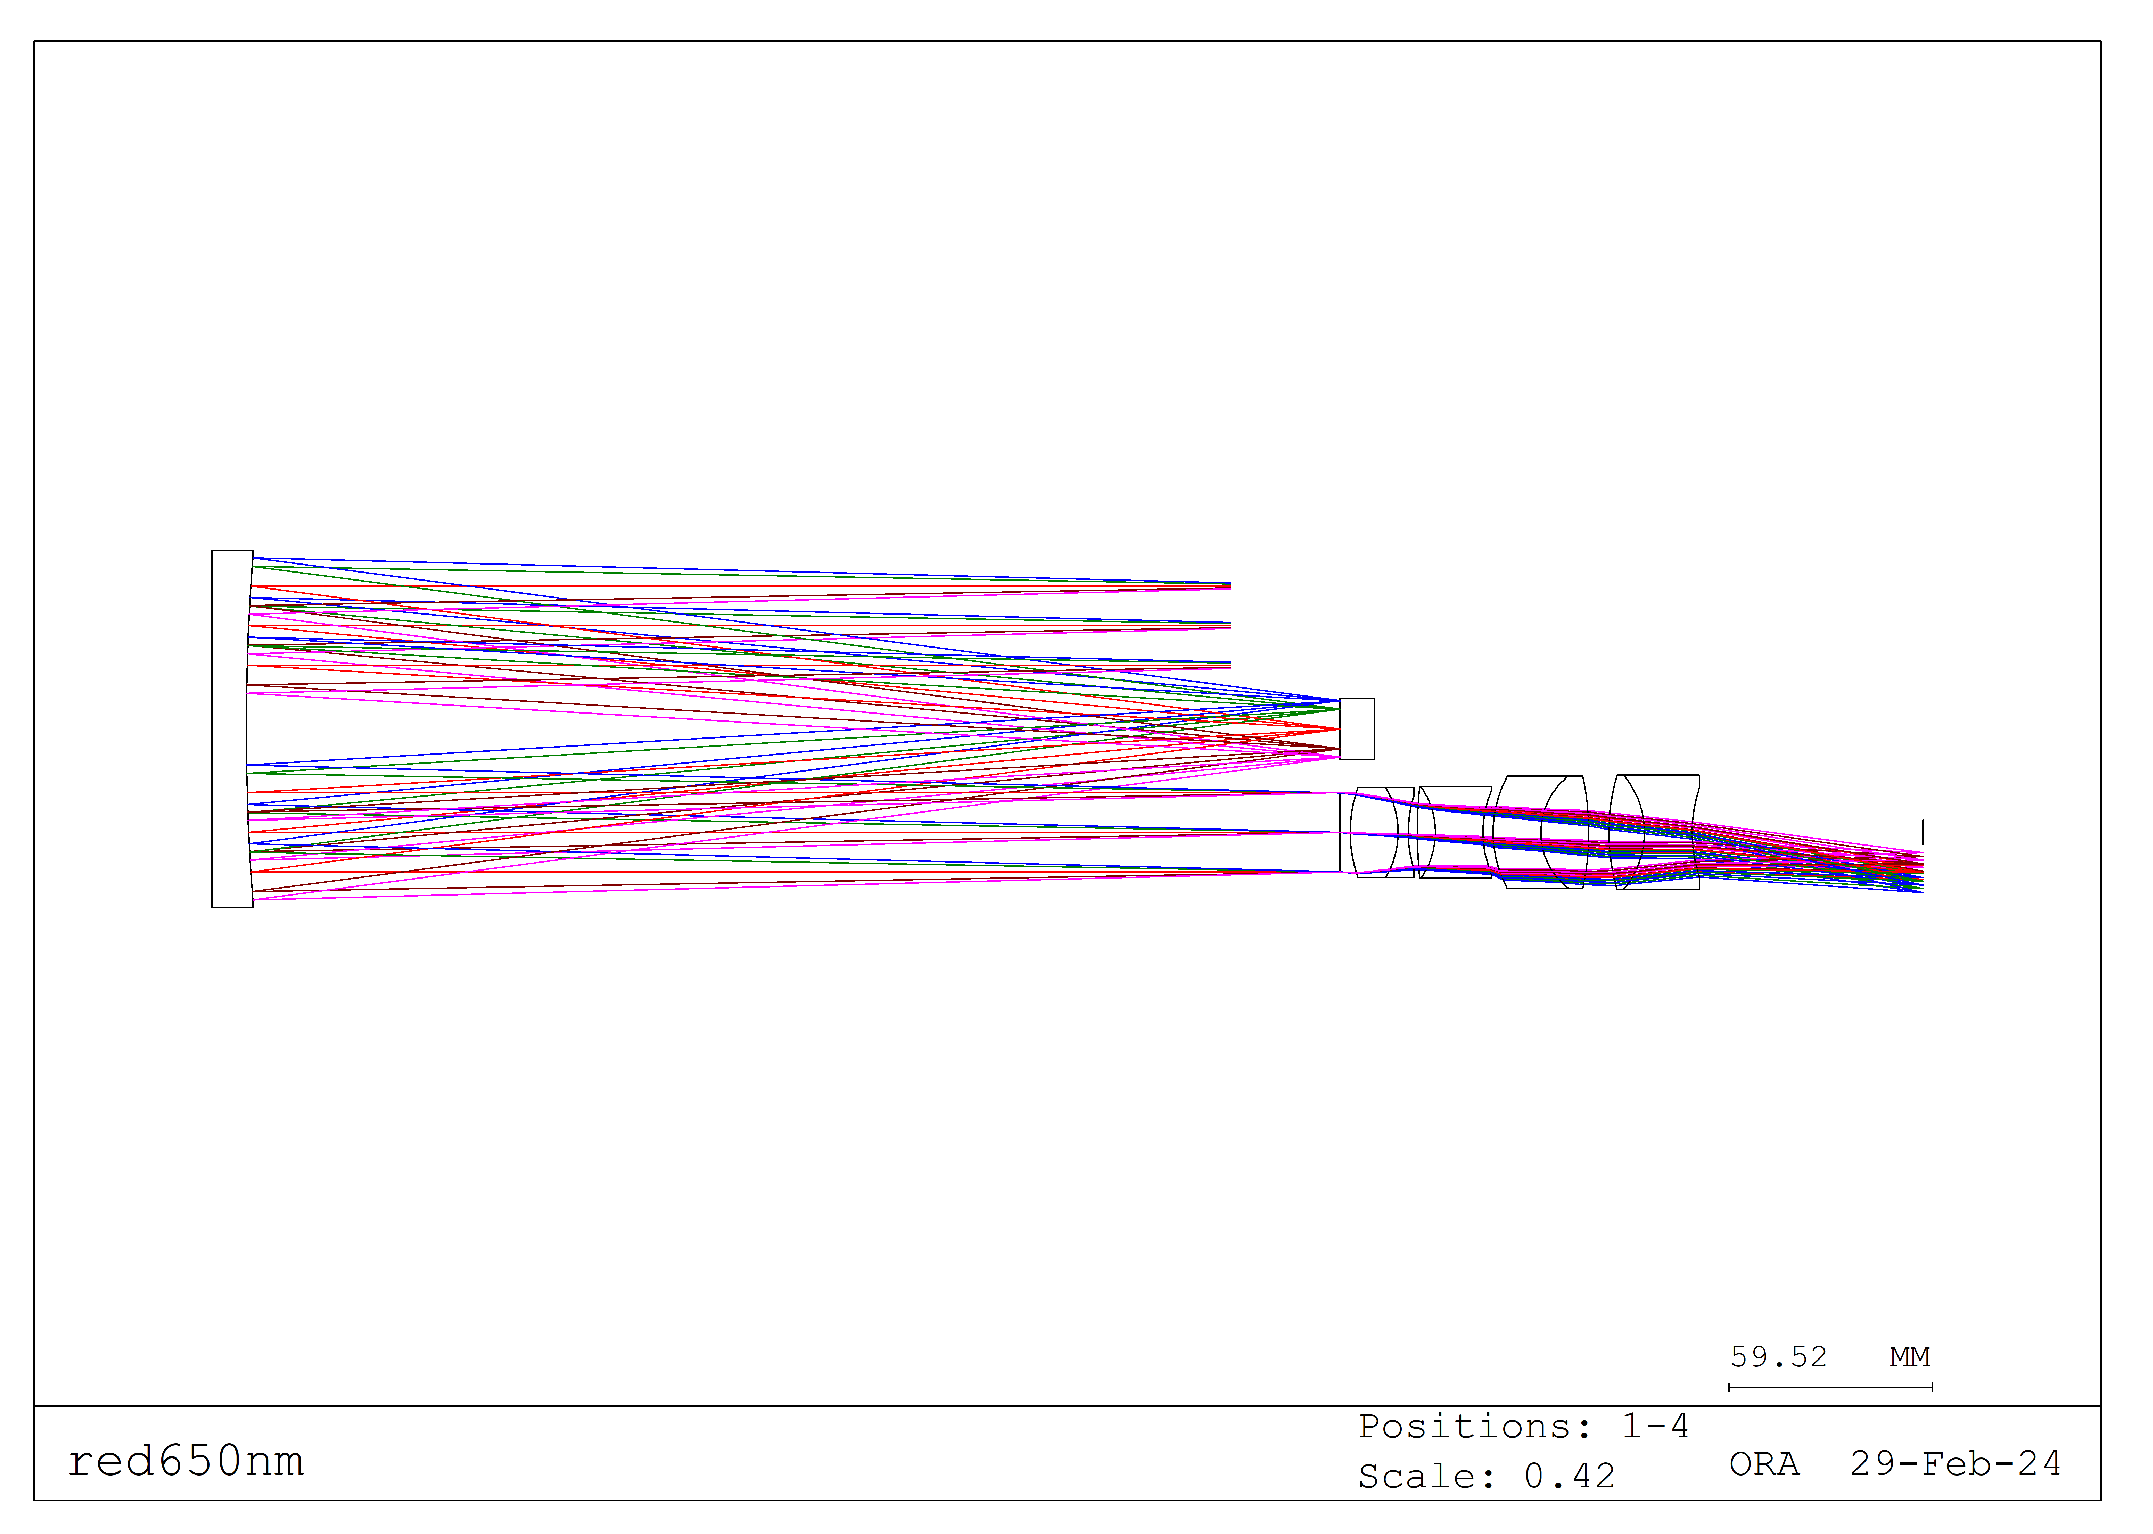
Figure 11.
System Optical Diagram.
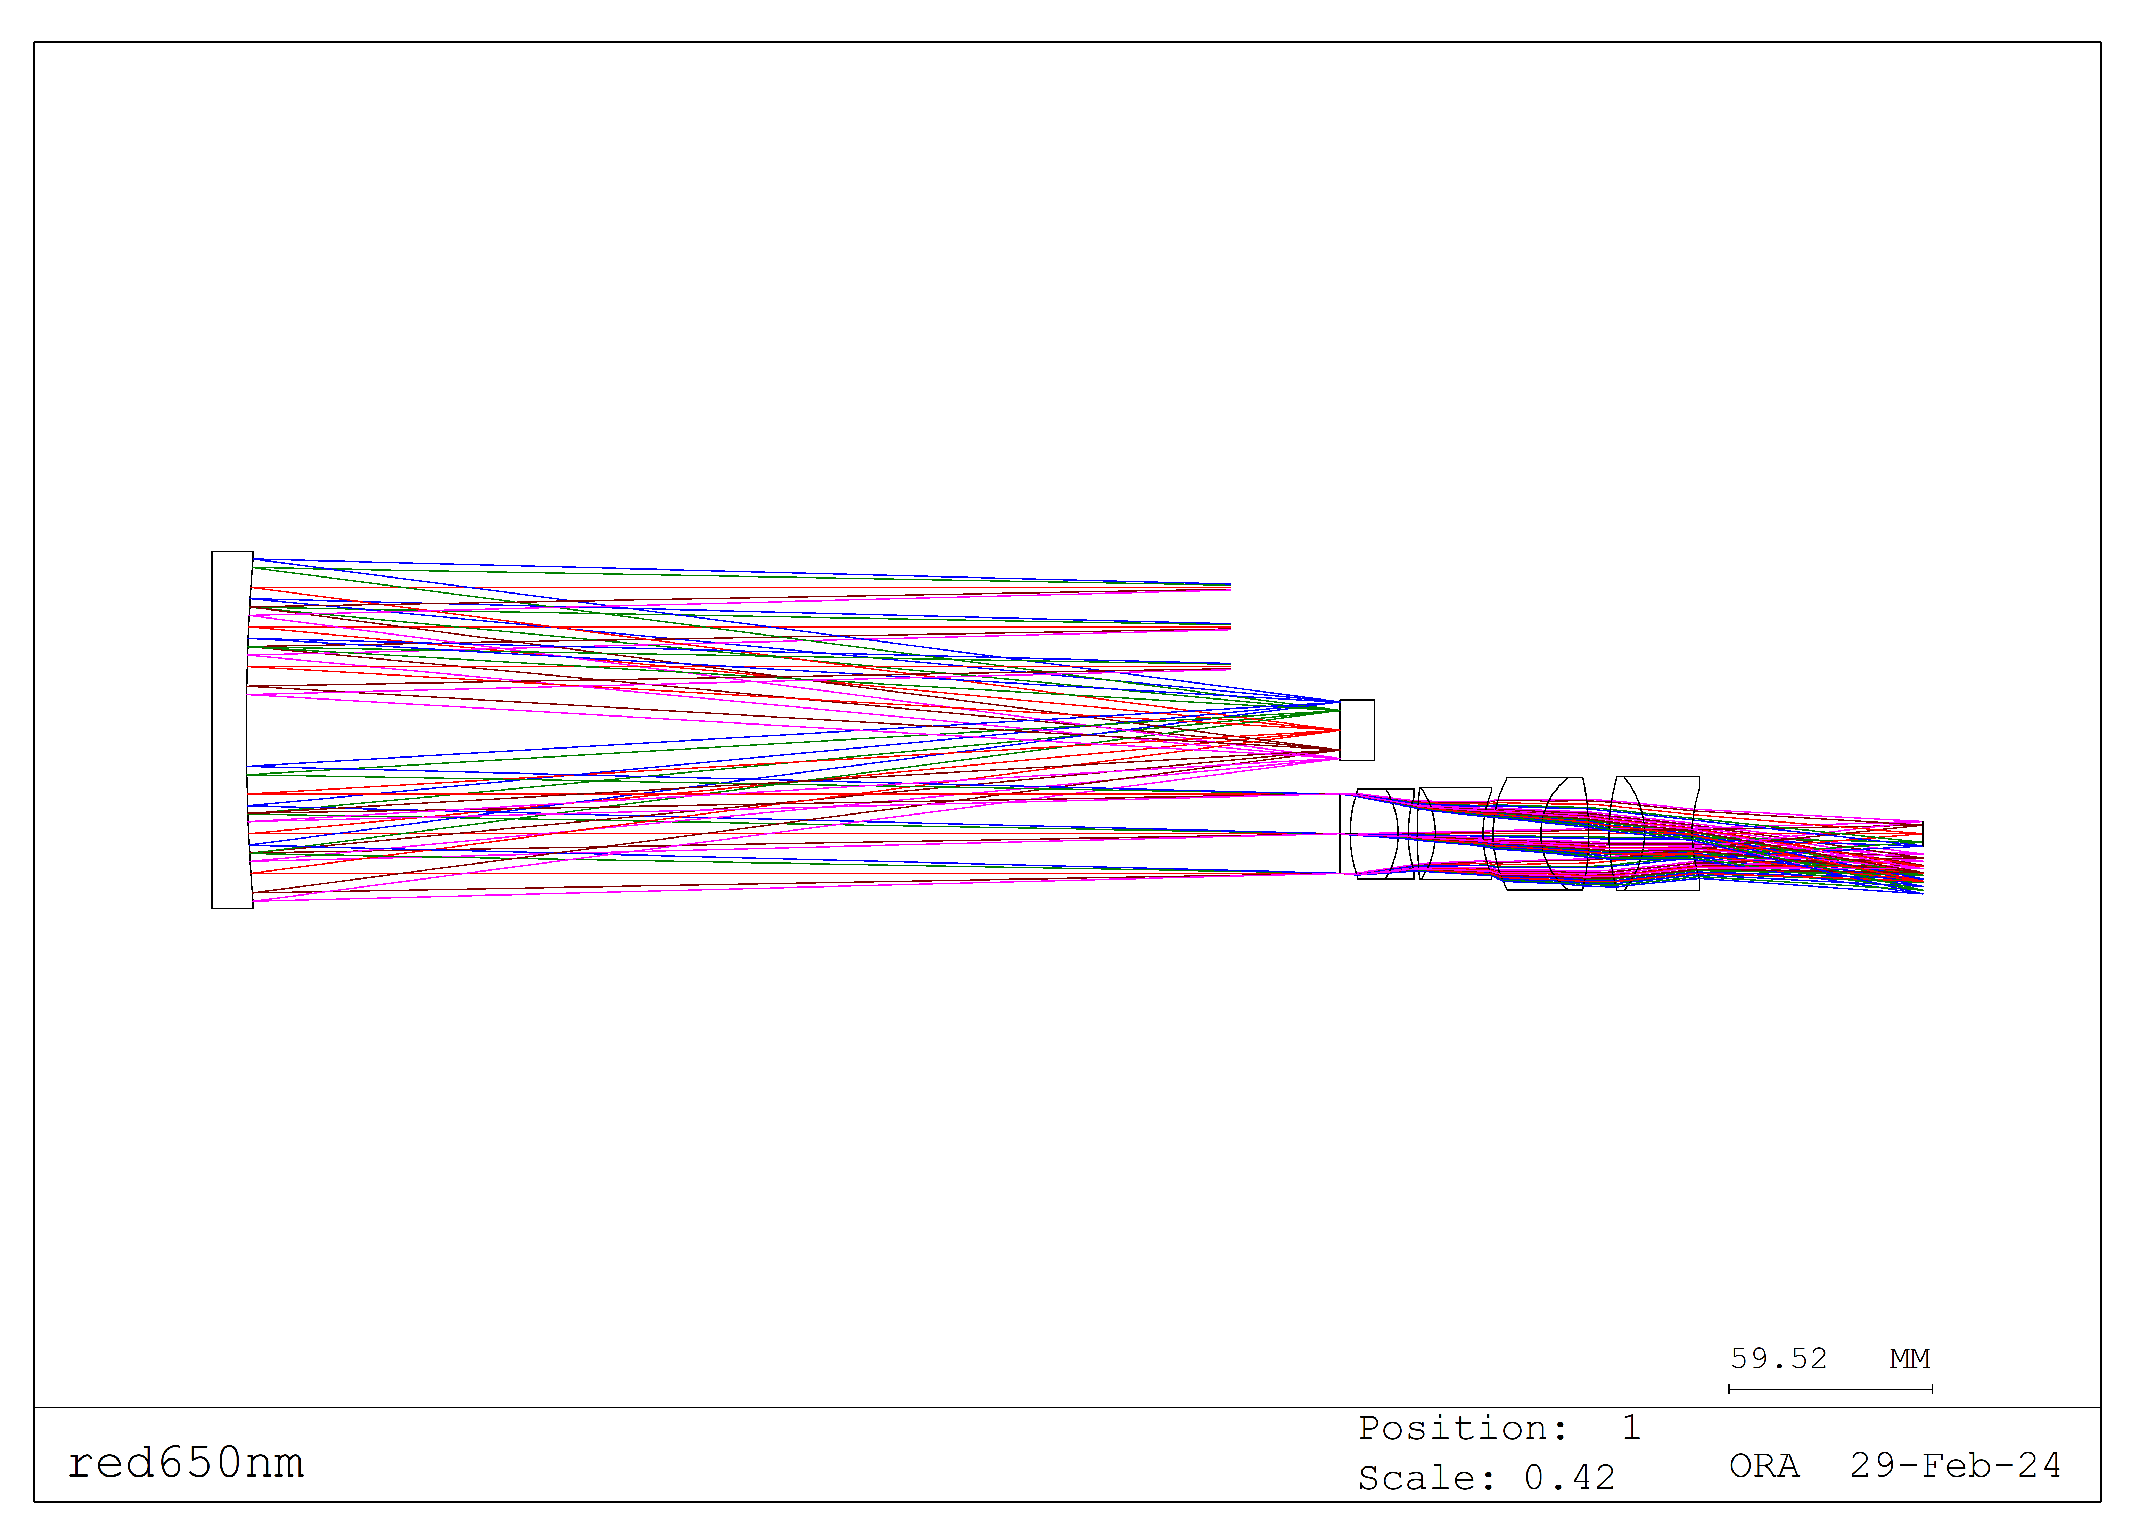
Figure 12.
Optical imaging system.
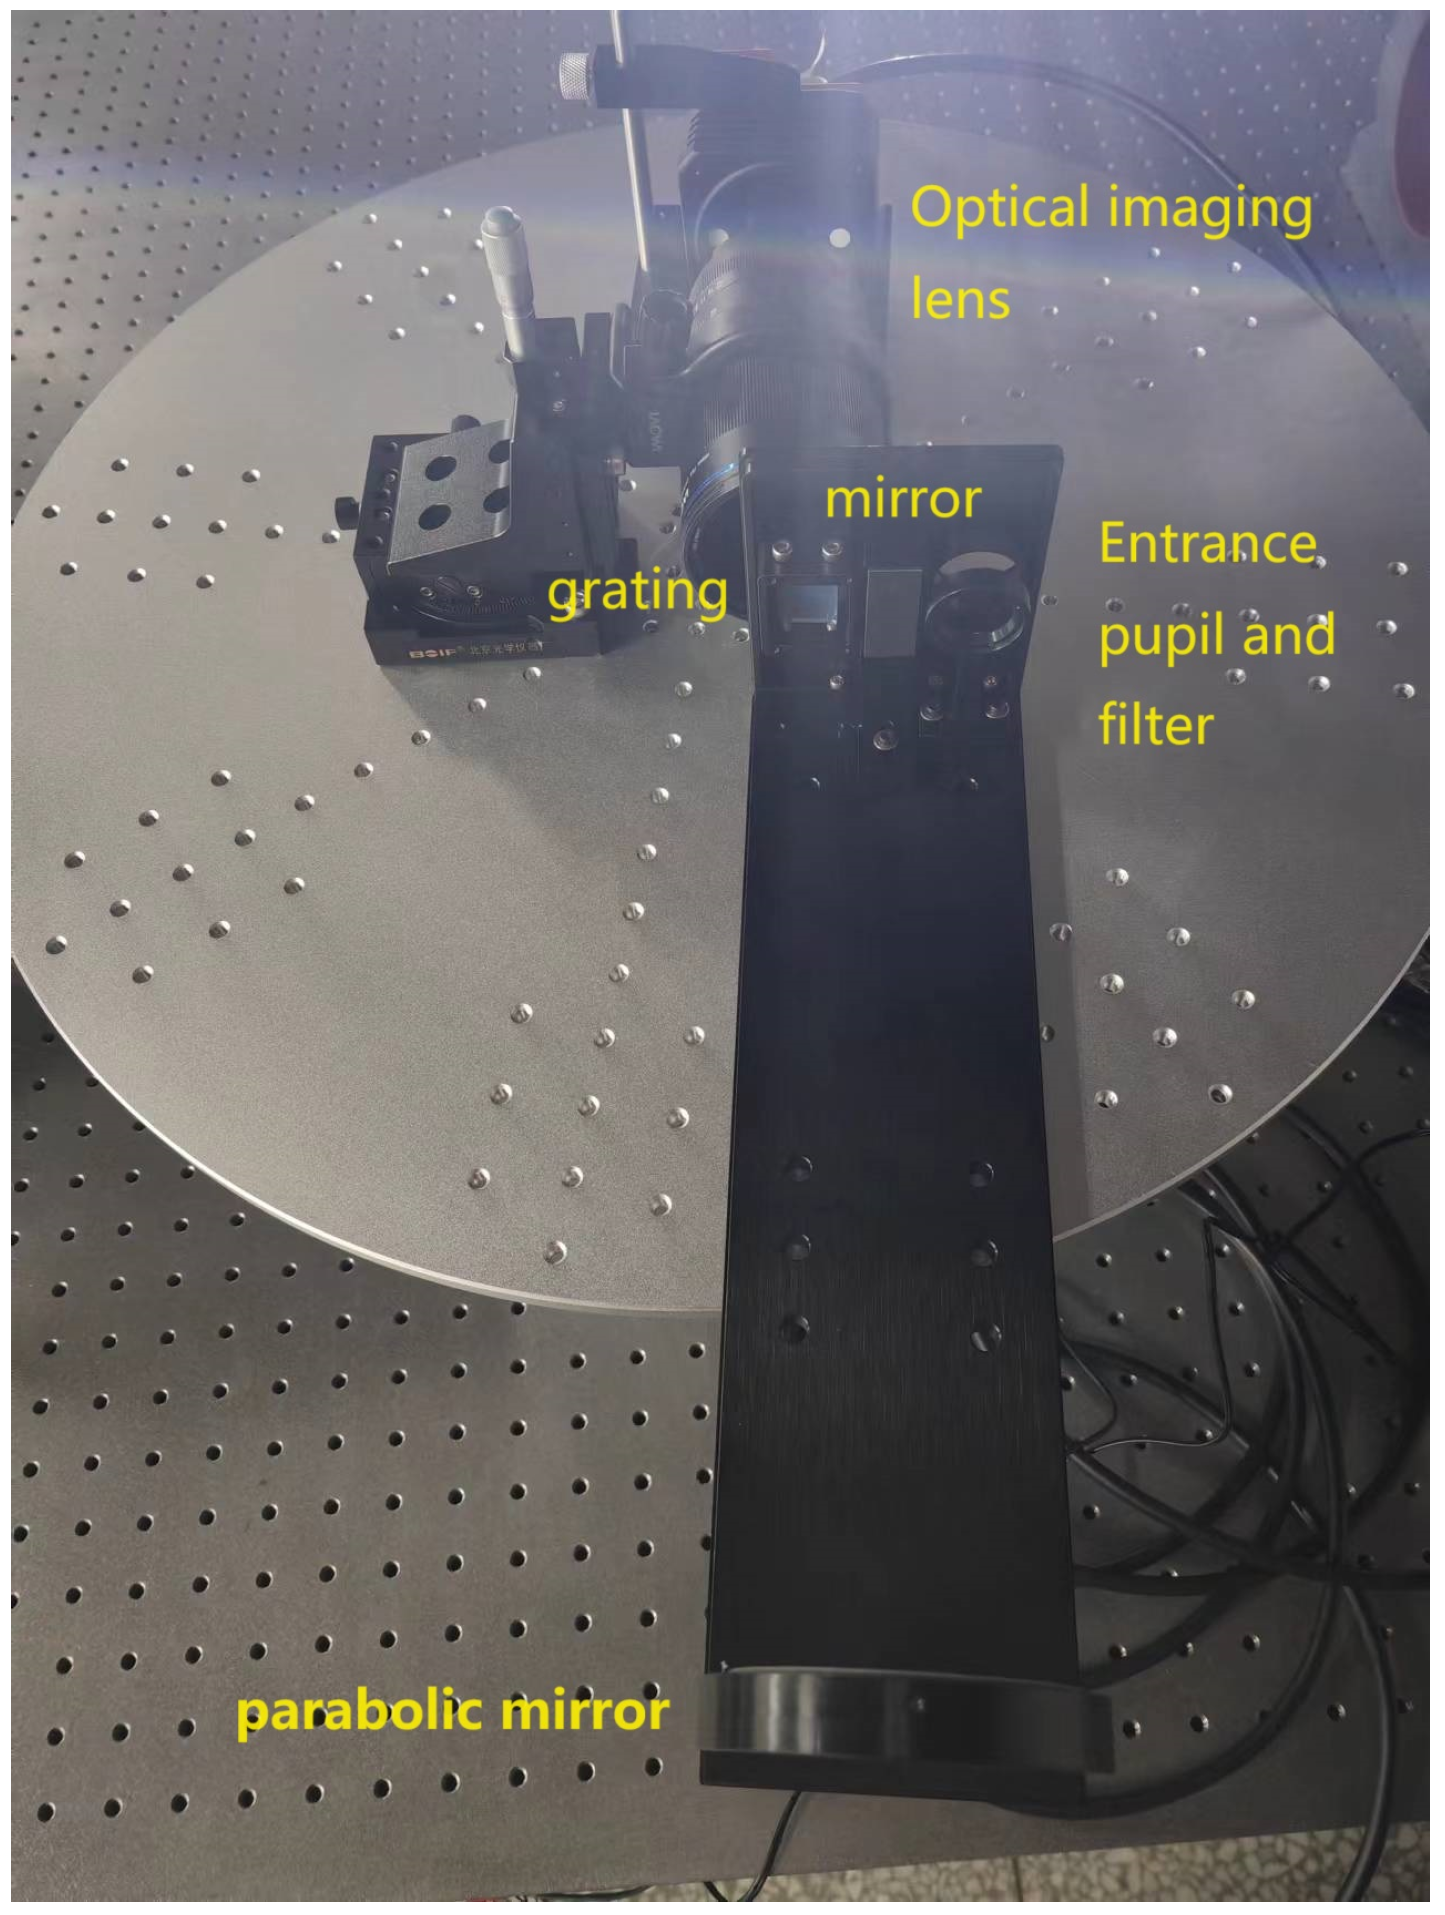
Figure 13.
CMOS.
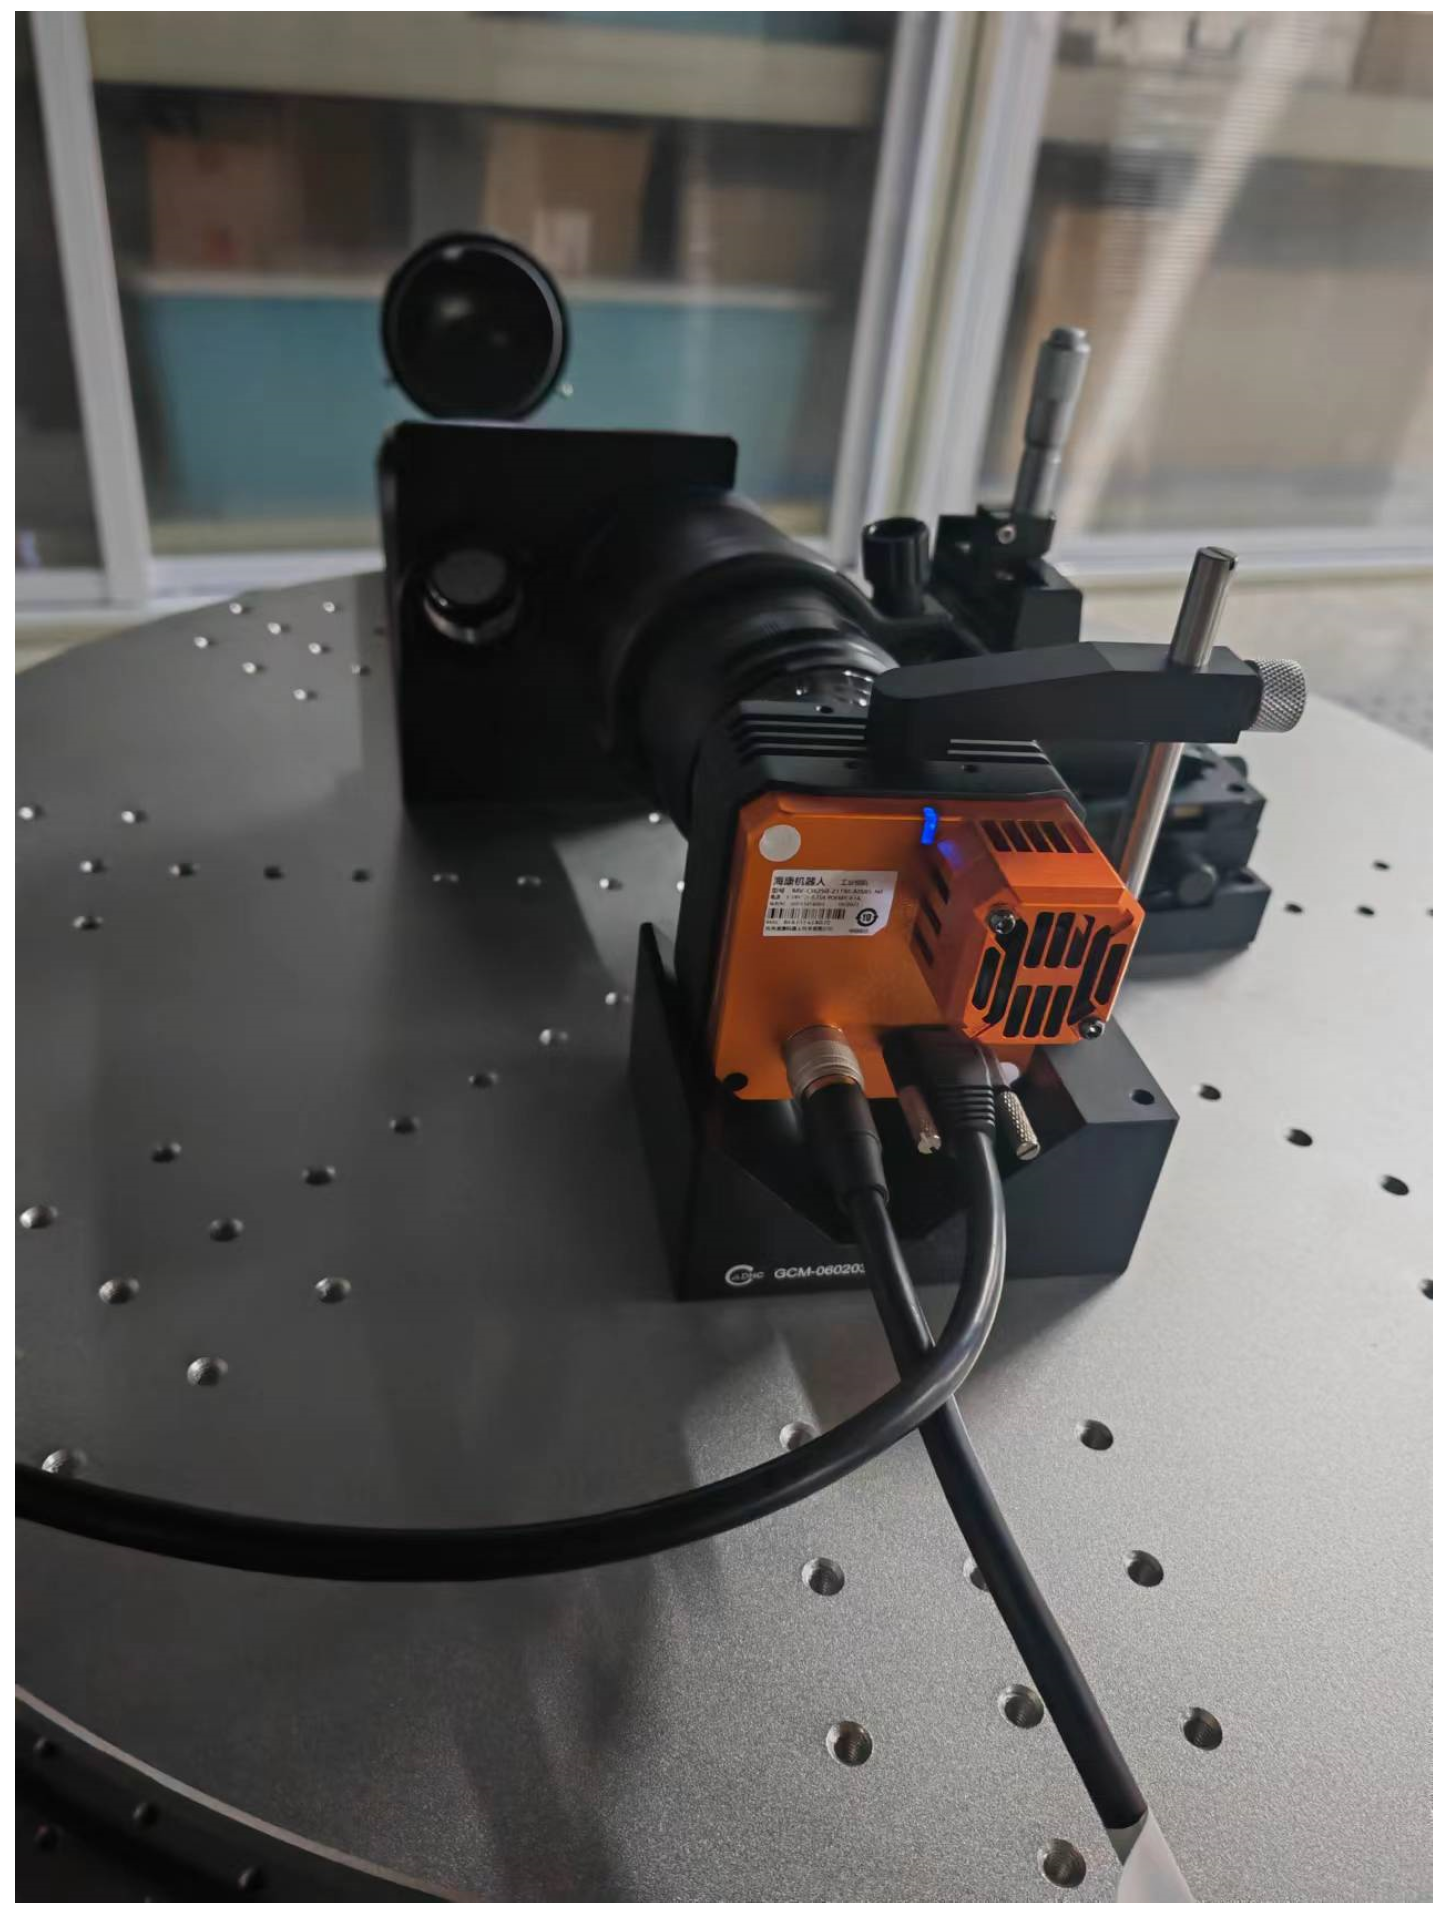
Figure 14.
Observation area.
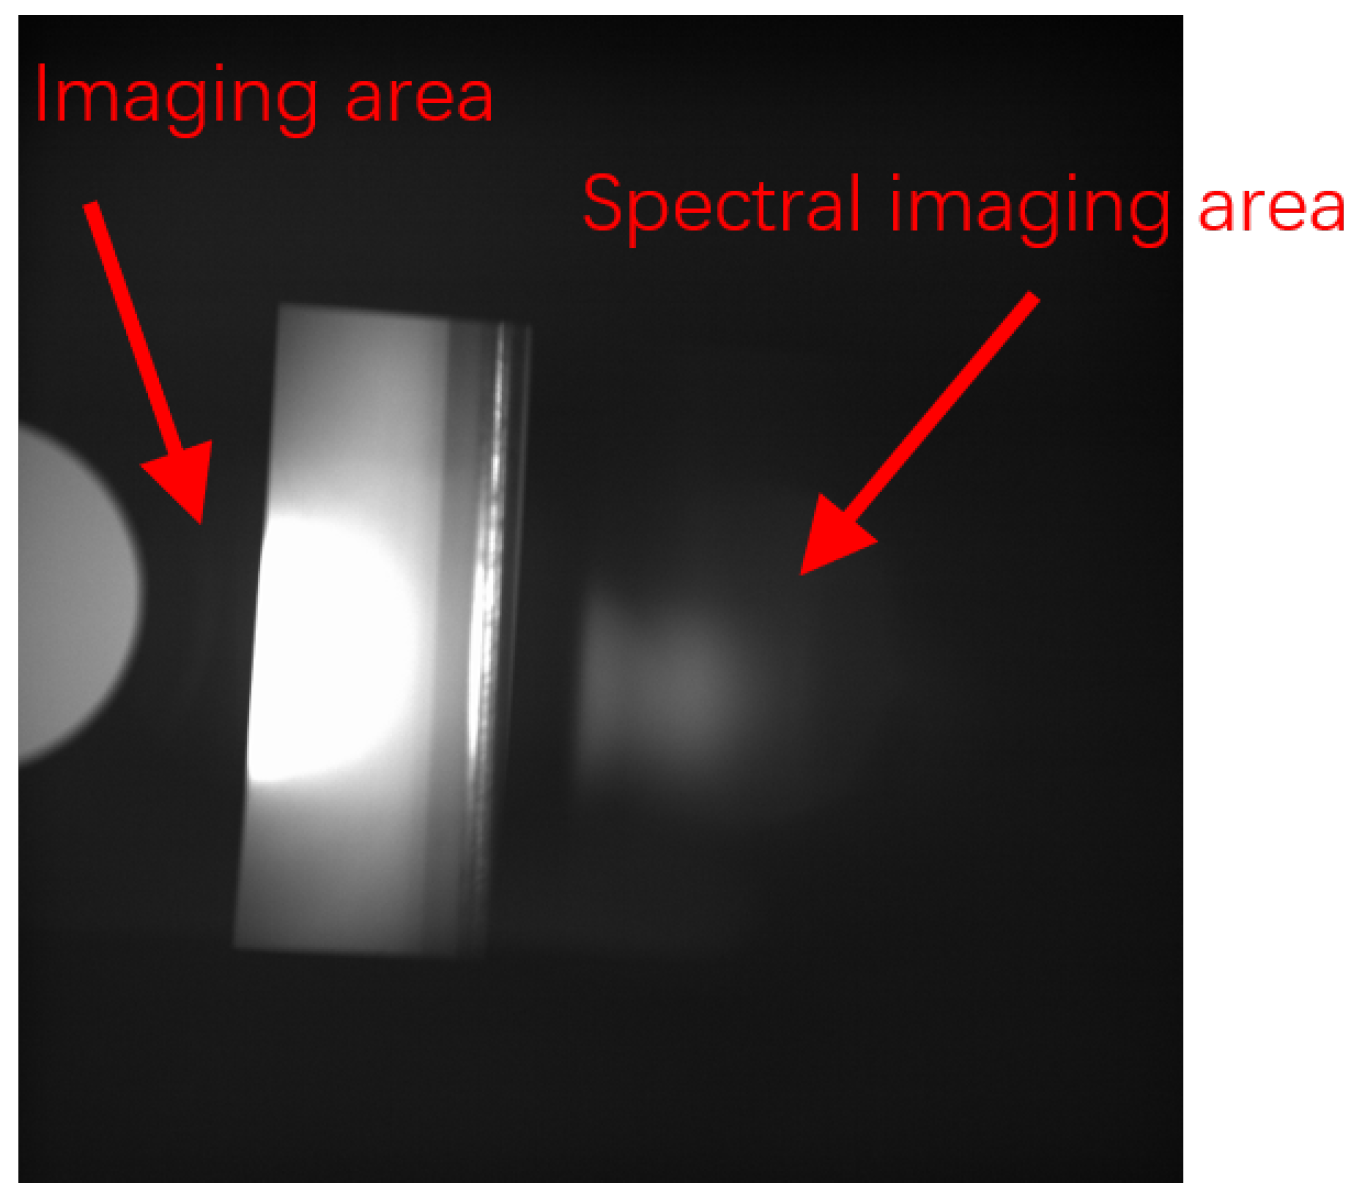
Figure 15.
After the target appearance.
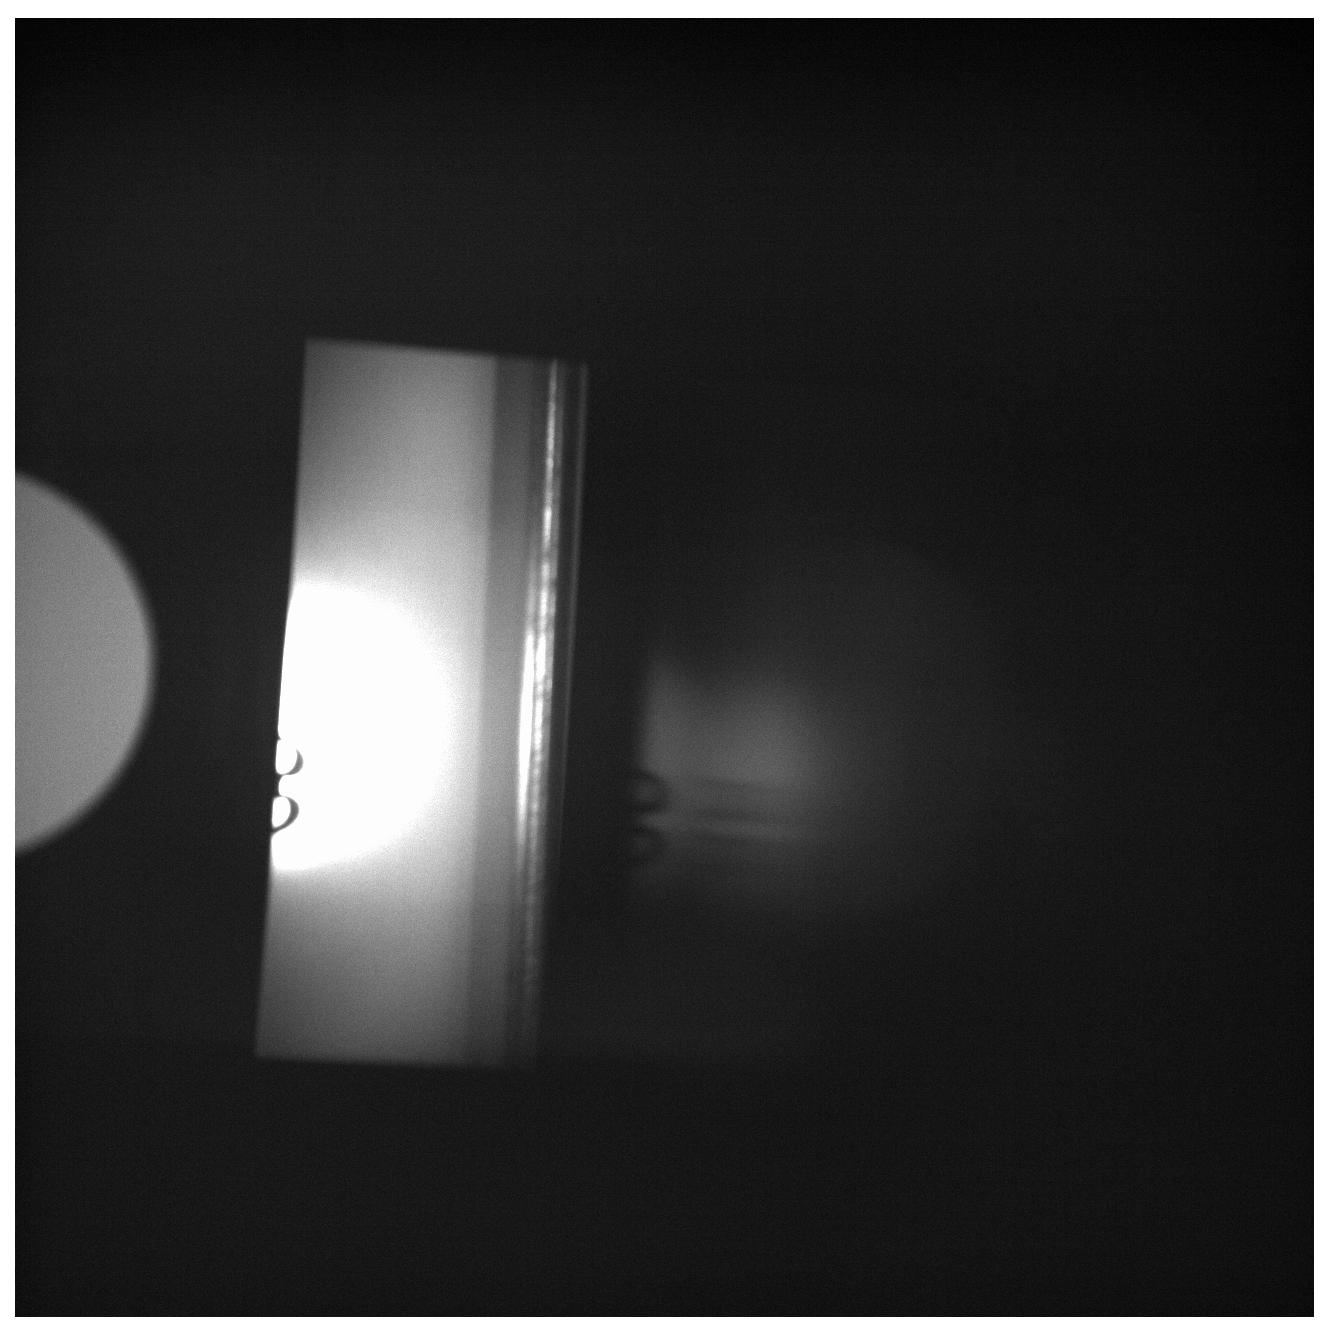
Figure 16.
Difference between the two pictures.
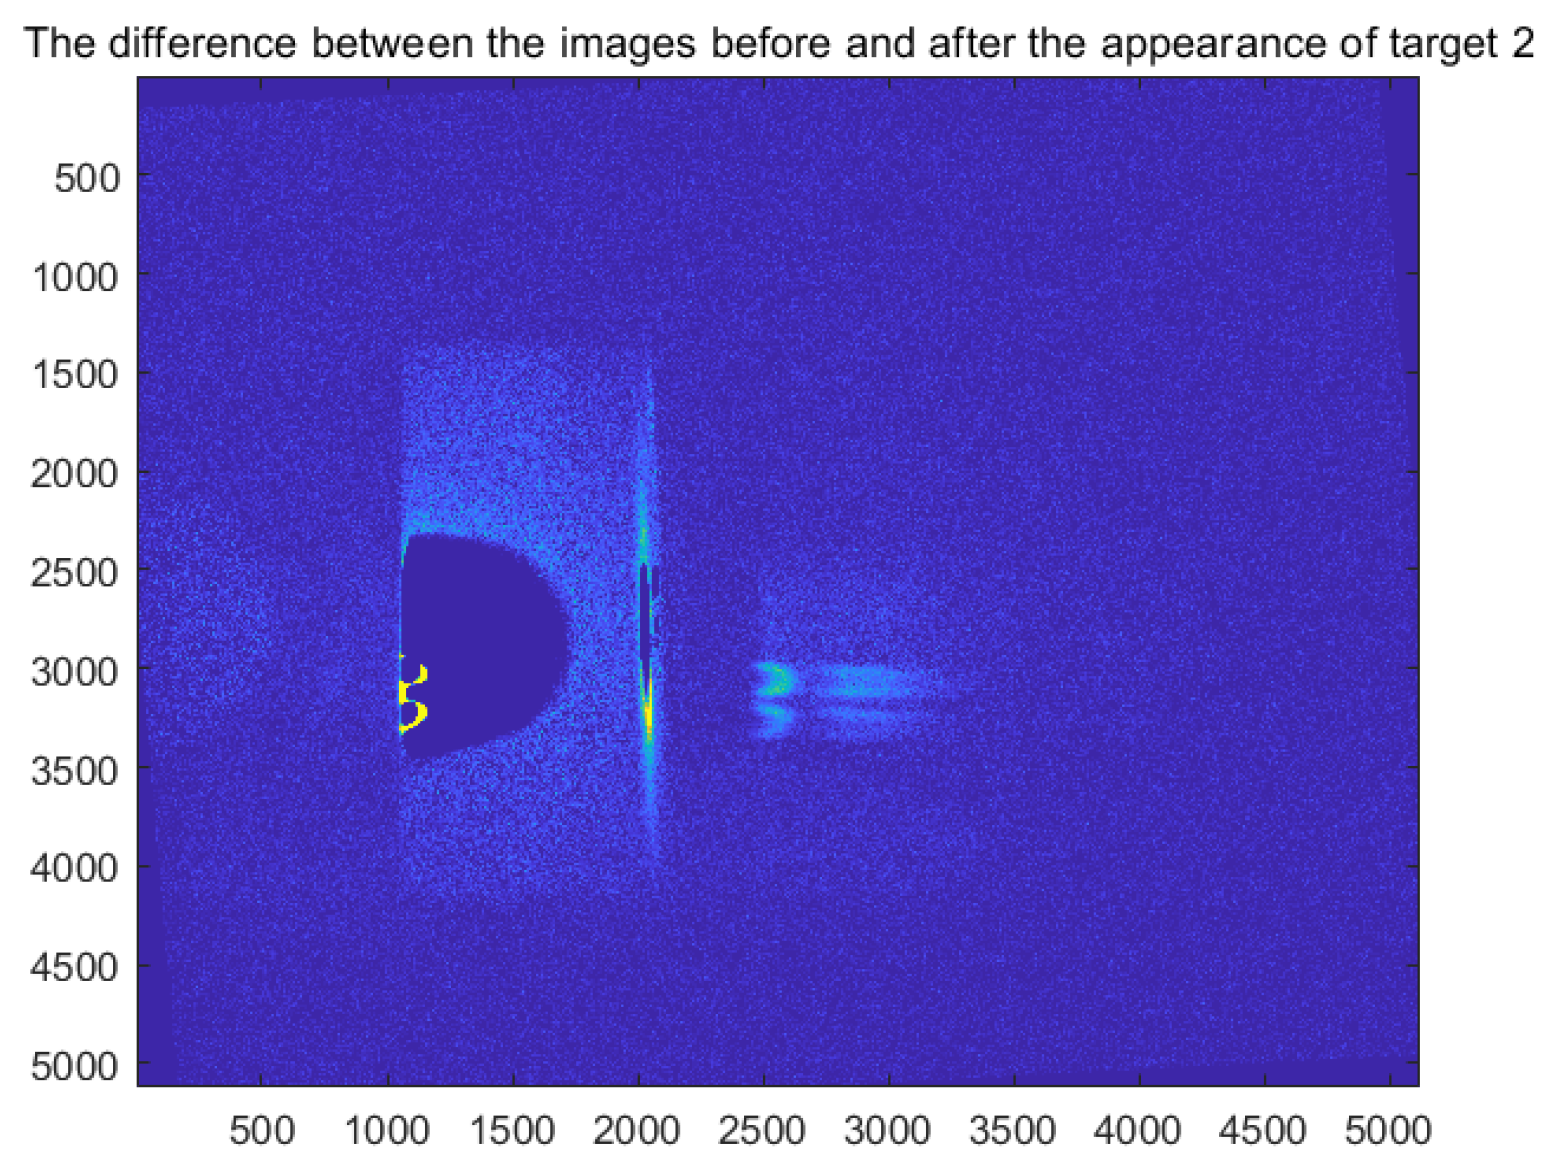
Figure 17.
Spectrum of the target (Comparison items).
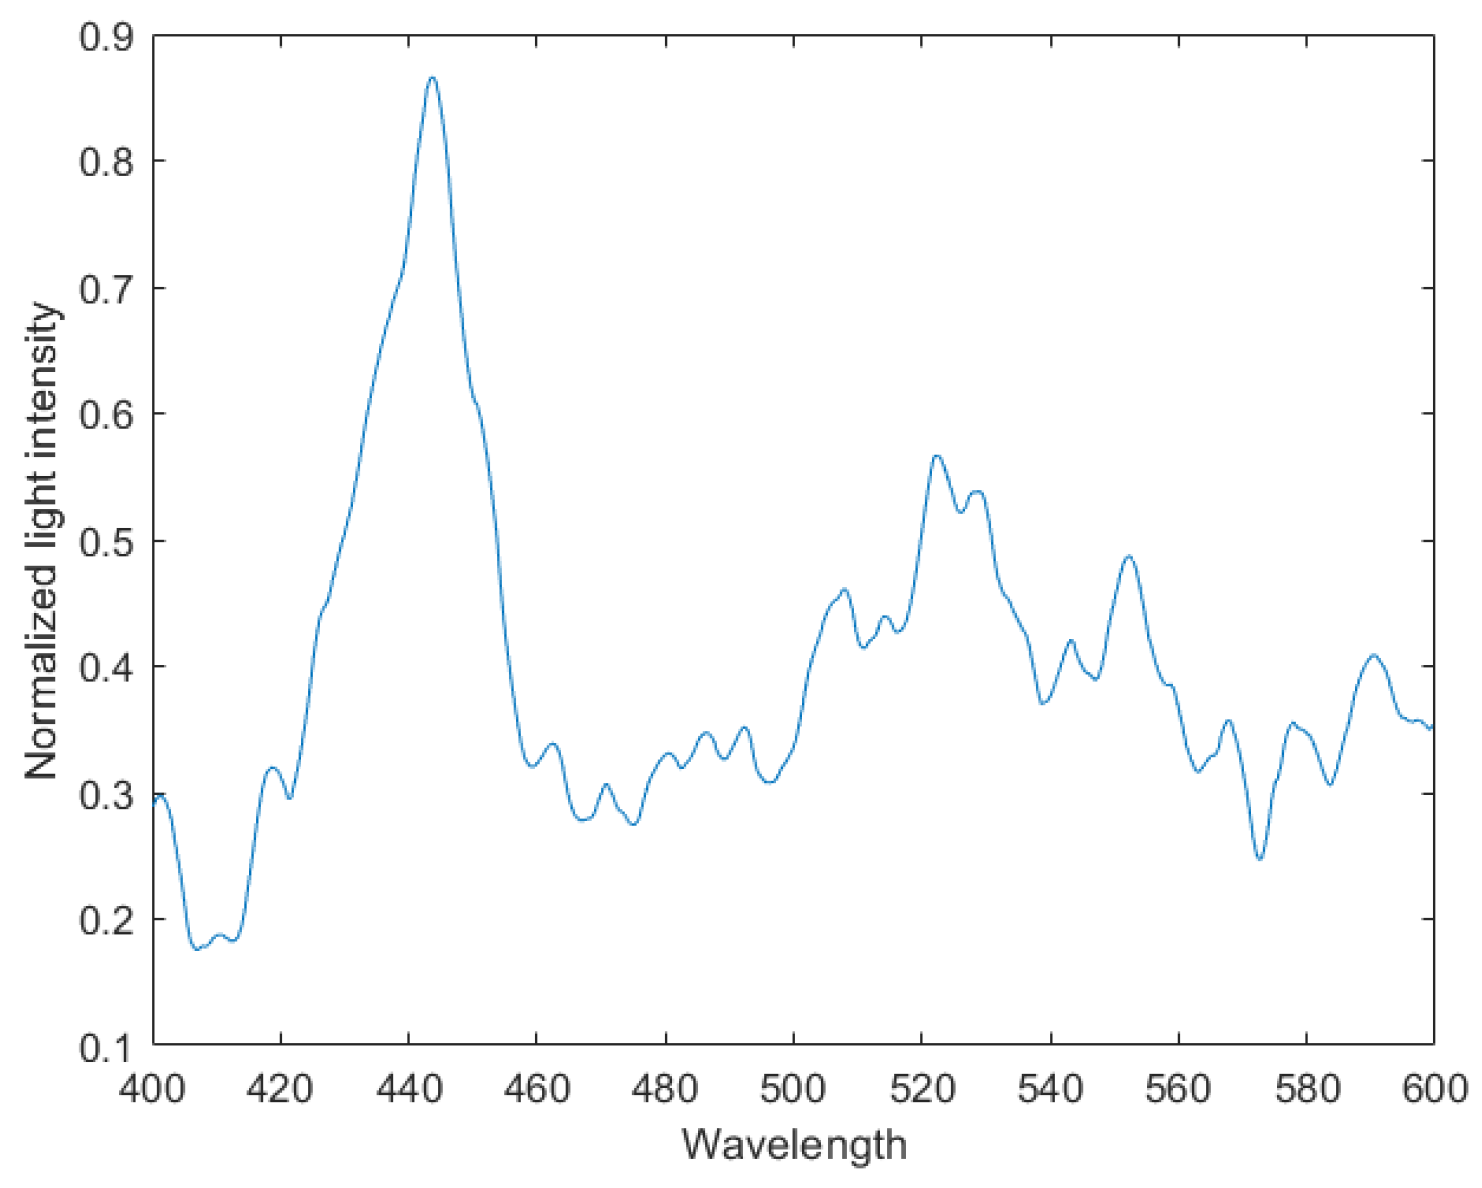
Figure 18.
Extracting raw spectral data from Figure 16.
Figure 18.
Extracting raw spectral data from Figure 16.
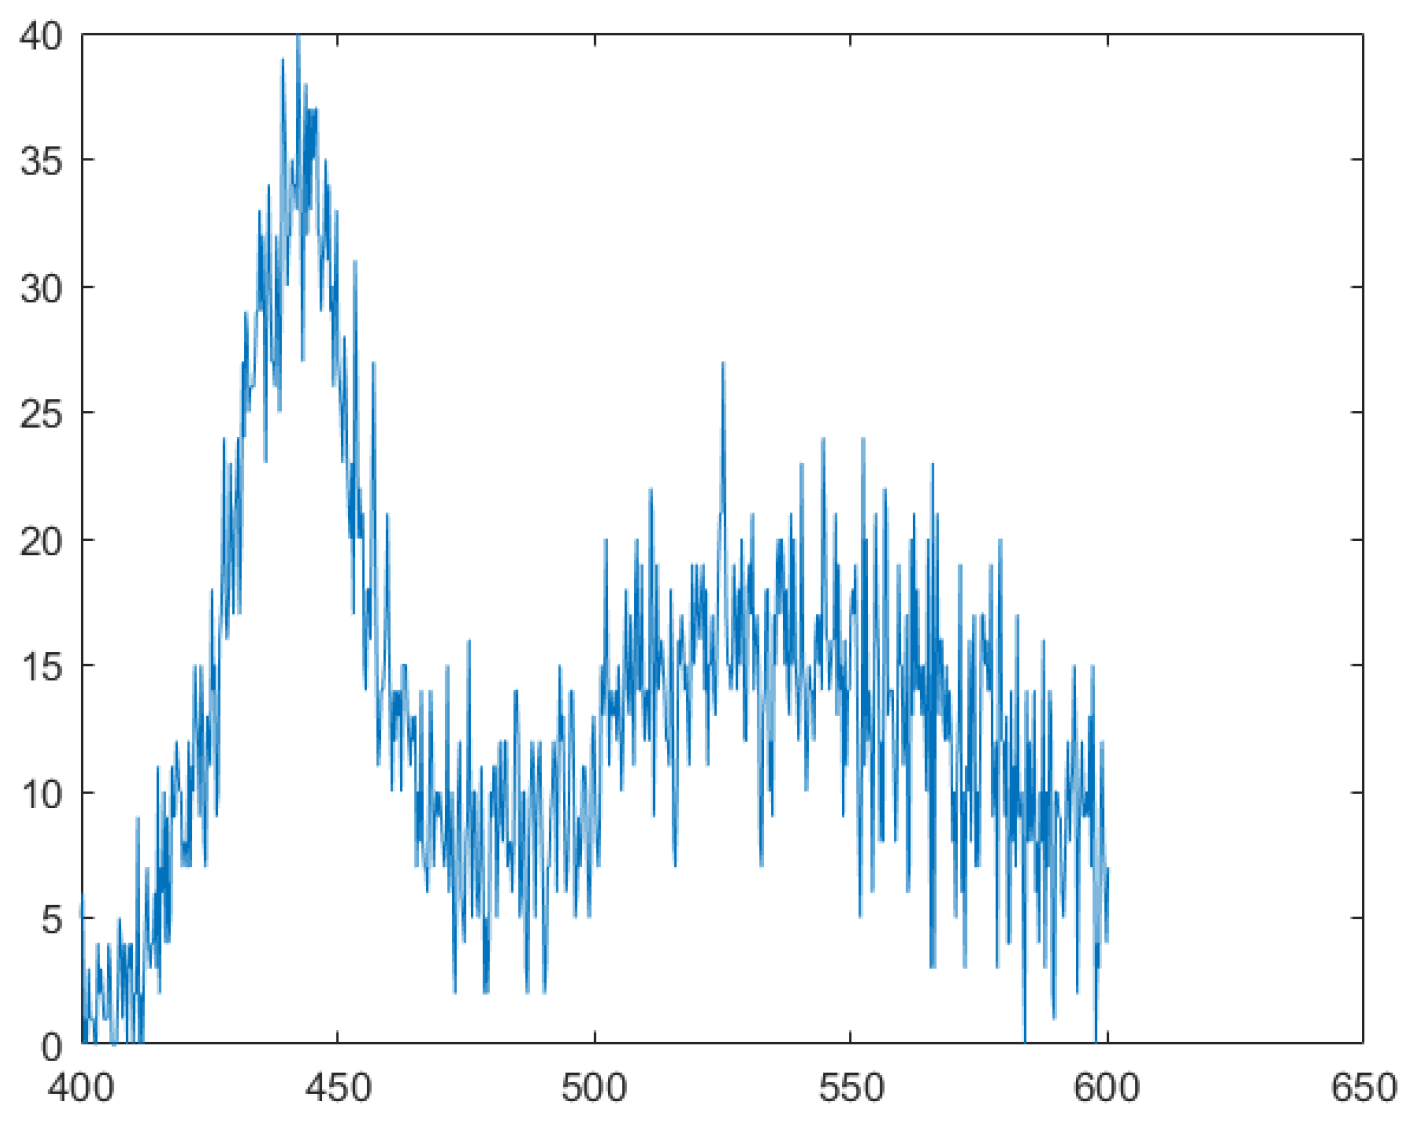
Figure 19.
Denoised data.
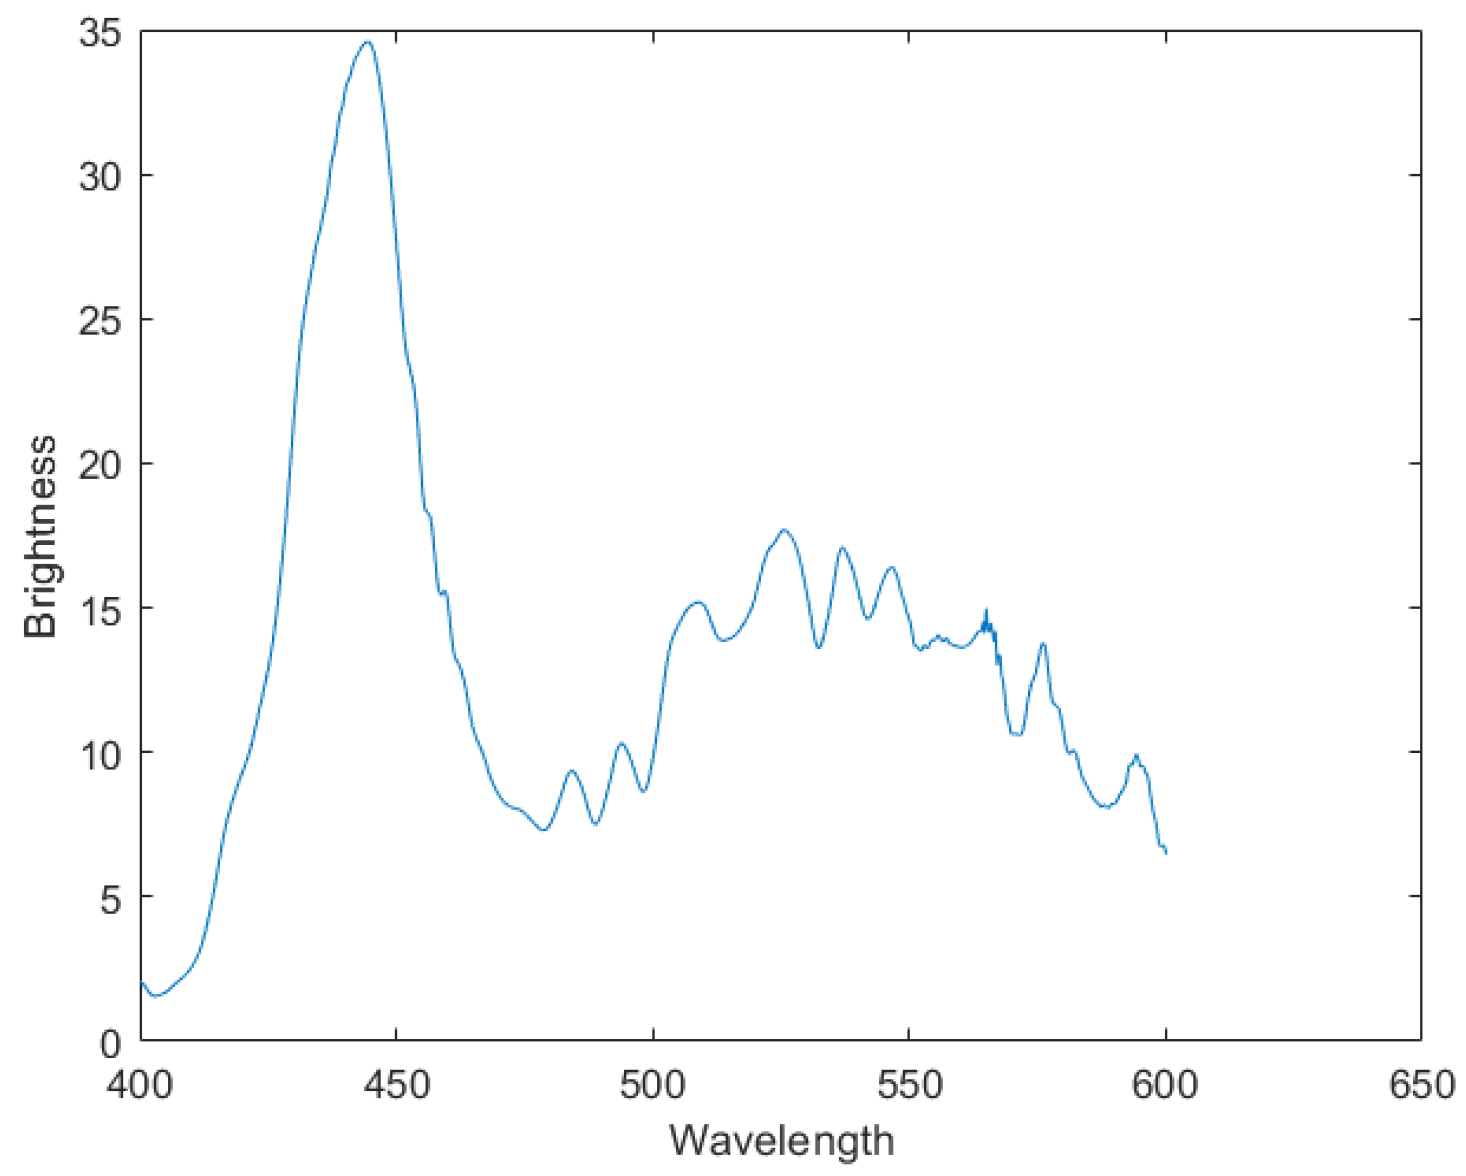

Table 1.
System Parameters of Regional Monitoring Imaging Spectrometer.
| Parameters | Number |
|---|---|
| Focal | 100mm |
| Bandwidth | 400nm-600nm |
| F | 5 |
| Grating type | Transmission |
| Number of grating line pairs | 150l/mm |
| FOV | 3°×7° |
Disclaimer/Publisher’s Note: The statements, opinions and data contained in all publications are solely those of the individual author(s) and contributor(s) and not of MDPI and/or the editor(s). MDPI and/or the editor(s) disclaim responsibility for any injury to people or property resulting from any ideas, methods, instructions or products referred to in the content. |
© 2024 by the authors. Licensee MDPI, Basel, Switzerland. This article is an open access article distributed under the terms and conditions of the Creative Commons Attribution (CC BY) license (https://creativecommons.org/licenses/by/4.0/).
Copyright: This open access article is published under a Creative Commons CC BY 4.0 license, which permit the free download, distribution, and reuse, provided that the author and preprint are cited in any reuse.