Submitted:
25 April 2024
Posted:
26 April 2024
You are already at the latest version
Abstract
The objective of this paper was to verify the applicability of statistical learning (SL) compared to human reasoning with respect to the Universal Thermal Climate Index (UTCI), a complex tool for the assessment of outdoor thermal stress. UTCI is an equivalent temperature index based on the 48-dimensional output of an advanced model of human thermoregulation formed by 12 variables at four consecutive 30-minute intervals, which were calculated for 105642 thermal conditions from extreme cold to extreme heat. Comparing the performance of SL algorithms to the results accomplished by an international endeavor involving more than 40 experts from 23 countries, we found that random forests and k-nearest neighbors closely predicted UTCI values, but that clustering applied after dimension reduction algorithms (principal component analysis and t-distributed stochastic neighbor embedding) were inadequate for risk assessment in relation to the UTCI stress categories. This indicates a potential supportive role for SL, as it will not (yet) fully replace the bio-meteorological expert knowledge.
Keywords:
bio-meteorological index
; heat stress
; cold stress
; high dimensional data
; artificial intelligence
; machine learning
; UTCI
1. Introduction
Statistical or machine learning (SL) is central to artificial intelligence (AI) applications [1,2,3] with potential relevance to environmental risk assessment, especially in settings with high dimensional input as for thermal stress indices [4]. There, they may assist or even attempt replacing the bio-meteorological expert judgement, as indicated by the increasing number of recent application studies in this field [5,6,7,8,9,10,11].
The objective of this paper was to verify the applicability of SL compared to human reasoning with respect to the Universal Thermal Climate Index (UTCI), a complex assessment tool for the physiological strain related to the outdoor thermal environment [12], which soon after its release had been widely adopted and applied in biometeorological research [13,14,15,16,17,18,19,20,21,22,23,24].
The development of UTCI was accomplished by an international inter-disciplinary endeavor [25] involving more than 40 experts from 23 countries [12]. Figure 1 visualizes the concept and the major stages of UTCI development [26] as an equivalent temperature (in °C) defined as air temperature of the reference condition with the same dynamic physiological response as the actual condition. The physiological response to thermal stress was derived at stage 1 from the output of an advanced human model of thermoregulation [27], which had been coupled with an adaptive clothing model with clothing insulation changing depending on air temperature [28]. Extensive simulation runs were performed at stage 2, which also included the validation of predicted physiological responses against experimental laboratory and field data [29,30,31,32]. After the definition of reference conditions in stage 3, stage 4 derived UTCI on an equivalent temperature scale. This involved a multivariate approach [26,33] including a dimension reduction step of the multidimensional model output to a one-dimensional strain indicator followed by searching the reference condition with the same indicator value (Figure 1). At stage 5, for assessment purposes, a scale classifying the UTCI values into ten categories of thermal stress was added to the operational procedure [26]. The assessment scale was developed from comparing the values of variables describing the thermal state including temperature sensation and effectors of thermoregulation of the human body to established ergonomic limit criteria [26,34].
2. Materials and Methods
Our approach was to apply selected SL algorithms deeming representative for recent applications [5,6,7,8,9,10,11,35,36,37,38,39,40,41] to the data simulated by the UTCI-Fiala model [27] at stage 2 of the UTCI development (Figure 1).
2.1. UTCI Data
The operational procedure was based on the dynamic physiological response characterized by the 48-dimensional model output formed by 12 variables at 4 consecutive 30-minute intervals (Table 1). This output was generated for 1051 reference conditions covering the whole relevant climatic range with known UTCI values set equal to air temperature.
Another set of 104591 non-reference conditions with varying levels of wind speed, humidity and solar radiation had to be valued in UTCI °C and classified in 10 stress categories ranging from extreme cold to extreme heat as indicated by Figure 1.
2.2. Data Analysis
Splitting the reference conditions in sets of 840 training and 211 test data and using the external 1,000 non-reference conditions as additional non-reference test data, we compared the results of the UTCI expert group to diverse SL algorithms in predicting UTCI equivalent temperature values from the 48 predictors, using the root-mean squared error (RMSE) as performance metric. The supervised learning techniques comprised linear regression (MLR: multiple linear regression; LASSO: least absolute shrinkage and selection operator), tree-based and ensemble methods (CART: classification and regression trees; RF: random forests; XGBoost: extreme gradient boosting) as well as support vector machines (SVN), and the non-parametric k-nearest neighbors (KNN) [1,2,3,45,46,47]. More specifically, because UTCI equivalent temperature equals air temperature for reference conditions, we could label UTCI equivalent temperatures for the reference training data set and did utilize the above-mentioned regression algorithms for predicting equivalent temperature by the 48 predictors (12 variables at 4 points in time) listed in Table 1.
For comparison to the UTCI assessment scale, UTCI values were then categorized by hierarchical and k-means clustering [48] after applying principal component analysis (PCA) and t-distributed stochastic neighbor embedding t-SNE [49], respectively, to the high-dimensional UTCI model output for dimensionality reduction. In accordance with the UTCI approach [26], we searched for ten categories using the UTCI reference data set. This enabled ranking the obtained clusters by the intra-cluster mean air temperatures, which were equal to UTCI values for the reference conditions according to the equivalent temperature definition (Figure 1). Metrics of agreement between the UTCI stress categories and the classification found by clustering were derived from the confusion matrix by calculating the overall accuracy, defined as proportion of the UTCI stress categories that were classified correctly, and by Cohen’s kappa, defined as (po-pe)/(1-pe), with po denoting the observed proportion of agreement and pe the hypothetical proportion of agreement due to chance [50].
3. Results
Figure 2 illustrates the 48-dimensional set of twelve physiological output variables at four points in time predicted for the UTCI reference conditions with air temperature ranging from -55 °C to +55 °C. While several parameters, like rectal, mean skin, and facial temperatures, as well as skin blood flow showed a time-dependent pattern of values increasing from cold to heat stress, other parameters showed non-monotonous relationships, e.g., metabolic heat production increasing both in the cold due to shivering, and in the heat due to the Q10-effect [27,56]. These patterns, as well as the shivering response only occurring in cold conditions, posed a particular challenge to the learning algorithms.
3.1. UTCI Equivalent Temperature Calculation
UTCI and the equivalent temperatures predicted by the diverse algorithms were highly correlated with squared correlation (R2) exceeding 0.95 for any dataset and with any method.
However, performance differences became obvious in Figure 3A showing the typical prediction error RMSE obtained from the separate algorithms for the three sets of training and test data, respectively. While multiple linear regression and LASSO worked well for UTCI reference conditions, RMSE increased to more than 7 °C for the non-reference data, approximately corresponding to one heat stress category deviation (Figure 1). RMSE values of similar magnitude for the non-reference test data occurred with CART and SVM, whereas gradient boosting lowered the prediction error. The best performance was observed with RF and KNN, both showing an excellent fit for the reference data with RMSE<0.2 °C, and a good agreement with RMSE of about 3 °C for non-reference UTCI, where RMSE for KNN was below the prediction error obtained for calculating UTCI from meteorological input by the polynomial regression function provided by the operational procedure (Figure 1) [26]. Among the tree-based algorithms, CART performance was inferior to RF and gradient boosting (XGBoost) in all cases in accordance with earlier observations [46].
As identical index values indicating equivalent thermal strain constitutes an essential requirement to thermal stress indicators, Figure 3B evaluates this criterion for the equivalent temperatures determined by the diverse SL algorithms in comparison to the original UTCI concerning the dynamic thermal sensation (DTS) from the non-reference test data averaged over the four simulated points in time (30, 60, 90, and 120 min). The resulting pattern for the best performing algorithms RF and KNN was like the original UTCI showing a small variation around the reference values, whereas the other algorithms, especially CART, showed larger and partly systematic deviations (Figure 3B).
3.2. UTCI Assessment Scale and Thermal Stress Categories
As illustrated by Figure 4A, the UTCI-Fiala model output projected to the first two dimensions by PCA, which explained 90% of total variance, exhibited a one-dimensional structure along the UTCI categories from extreme cold to extreme heat, which followed an increasing course concerning the first principal component (dim1) in accordance with the original analysis [26]. Similarly, a one-dimensional structure also emerged with t-SNE, however, the resulting curve was described by both dimensions (dim1 and dim2).
Figure 4B shows the confusion matrices comparing the groups formed by hierarchical or k-means clustering following dimensionality PCA and t-SNE, respectively to the categories of UTCI assessment scale. Although correct classifications followed a trend from extreme cold to heat, discrepancies concerning the intermediate UTCI categories were obvious.
Consequently, the quantification of agreement in Figure 4C resulted in low to fair levels of agreement according Cohen’s kappa varying between 0.1 and 0.4 [50]. The different methods performed similarly with k-means clustering following t-SNE yielding the highest scores for accuracy (0.395) and kappa (0.33).
4. Discussion
4.1. UTCI Approach Compared to SL Algorithms
Our results concerning the thermal stress assessment index UTCI indicate that recent machine learning algorithms like random forests or k-nearest neighbors may be helpful tools to derive summarizing metrics for complex occupational hazards characterized by high dimensional input describing stress and strain. The non-parametric k-nearest neighbor regression might better capture non-monotonous stress-strain relationships like metabolic rate increasing under both cold and heat stress conditions (Figure 2), which could explain the superior KNN performance compared to the other SL algorithms.
Notably, these useful features concerned a narrow, but important data-analytical task within the UTCI development (stage 4 in Figure 1), which had been based on multivariate statistical methods [26] bearing some similarities with the SL algorithms applied in this study. However, the best performing algorithms had already been suggested and successfully applied in other fields concerning climatic change and thermal stress [35,36,37,38,39,40,41].
Though clustering algorithms were able to identify a trend from extreme heat to extreme cold, they did not reliably discriminate between the intermediate categories, with only marginal differences between the diverse algorithms. This demonstrates the discrepancy between clustering algorithms searching for patterns in the data and forming groups of data of comparable size on one hand [57] and the definition of UTCI stress categories based on thermo-physiological knowledge and ergonomic reasoning on the other hand [26,34]. Future enhancements at this stage may be possible by including further artificial intelligence tools such as expert systems or large language models working with knowledge databases [58,59].
4.2. Extended Application by Ensemble Modelling
Ensemble modelling techniques like random forests and gradient boosting aim at enhancing predictive performance by averaging single predictions of numerous models and have been successfully applied to the assessment of biological features changing with aging by a single quantity termed ‘biological age’ [60,61]. The concept of biological age bears close similarities with equivalent temperature indices with age taking the role of temperature [62]. Therefore, as additional analysis, we applied the widely applied Klemera-Doubal method (KDM) [61], which predicts the outcome of interest, here air temperature replacing age, as weighted average of the individual regression lines shown in Figure A1 for the predicted 48 physiological responses from combined reference and non-reference datasets, where the weights are proportional to the squared correlation coefficients. Using the R package BioAge [60], we calculated KDM equivalent temperatures and compared them in Figure 5 to the UTCI values determined for the external test data [42]. Both types of equivalent temperatures were highly correlated with higher KDM in the heat and lower UTCI values in the cold. It is important to note that the KDM equivalent temperatures were determined without defining reference conditions (stage 3 in Figure 1). This simplifies the development, but renders the resulting equivalent temperature less interpretable due to the unspecified reference conditions. Thus, the application of the KDM approach to the development of an equivalent temperature index will require the most careful design of the underlying database, which will implicitly also define the (unknown) reference to which all conditions will be compared. Therefore, we believe that the UTCI approach with a specified reference will promote results that are more interpretable in terms of thermal stress and physiological strain [63].
5. Conclusions
In summary, our results indicate the potential supportive role for AI when analyzing high dimensional input in thermal stress assessment and index development, although it will not (yet) fully replace the knowledgeable expert in biometeorological and inter-disciplinary research.
Author Contributions
Conceptualization, P.B.; D.F. and B.K.; methodology, P.B.; software, D.F.; validation, P.B.; formal analysis, P.B.; investigation, P.B.; D.F. and B.K.; data curation, P.B.; writing—original draft preparation, P.B.; writing—review and editing, D.F. and B.K.; visualization, P.B.; funding acquisition, B.K. All authors have read and agreed to the published version of the manuscript.
Funding
UTCI was developed within COST Action 730; the COST office is supported by the EU framework program Horizon Europe.
Institutional Review Board Statement
Not applicable for this study not involving humans or animals.
Informed Consent Statement
Not applicable.
Data Availability Statement
The raw data supporting the conclusions of this article will be made available by the authors on request.
Acknowledgments
The authors acknowledge and thank all members of the former COST Action 730 for support and contributions to fruitful discussions.
Conflicts of Interest
The authors declare no conflicts of interest.
Appendix A
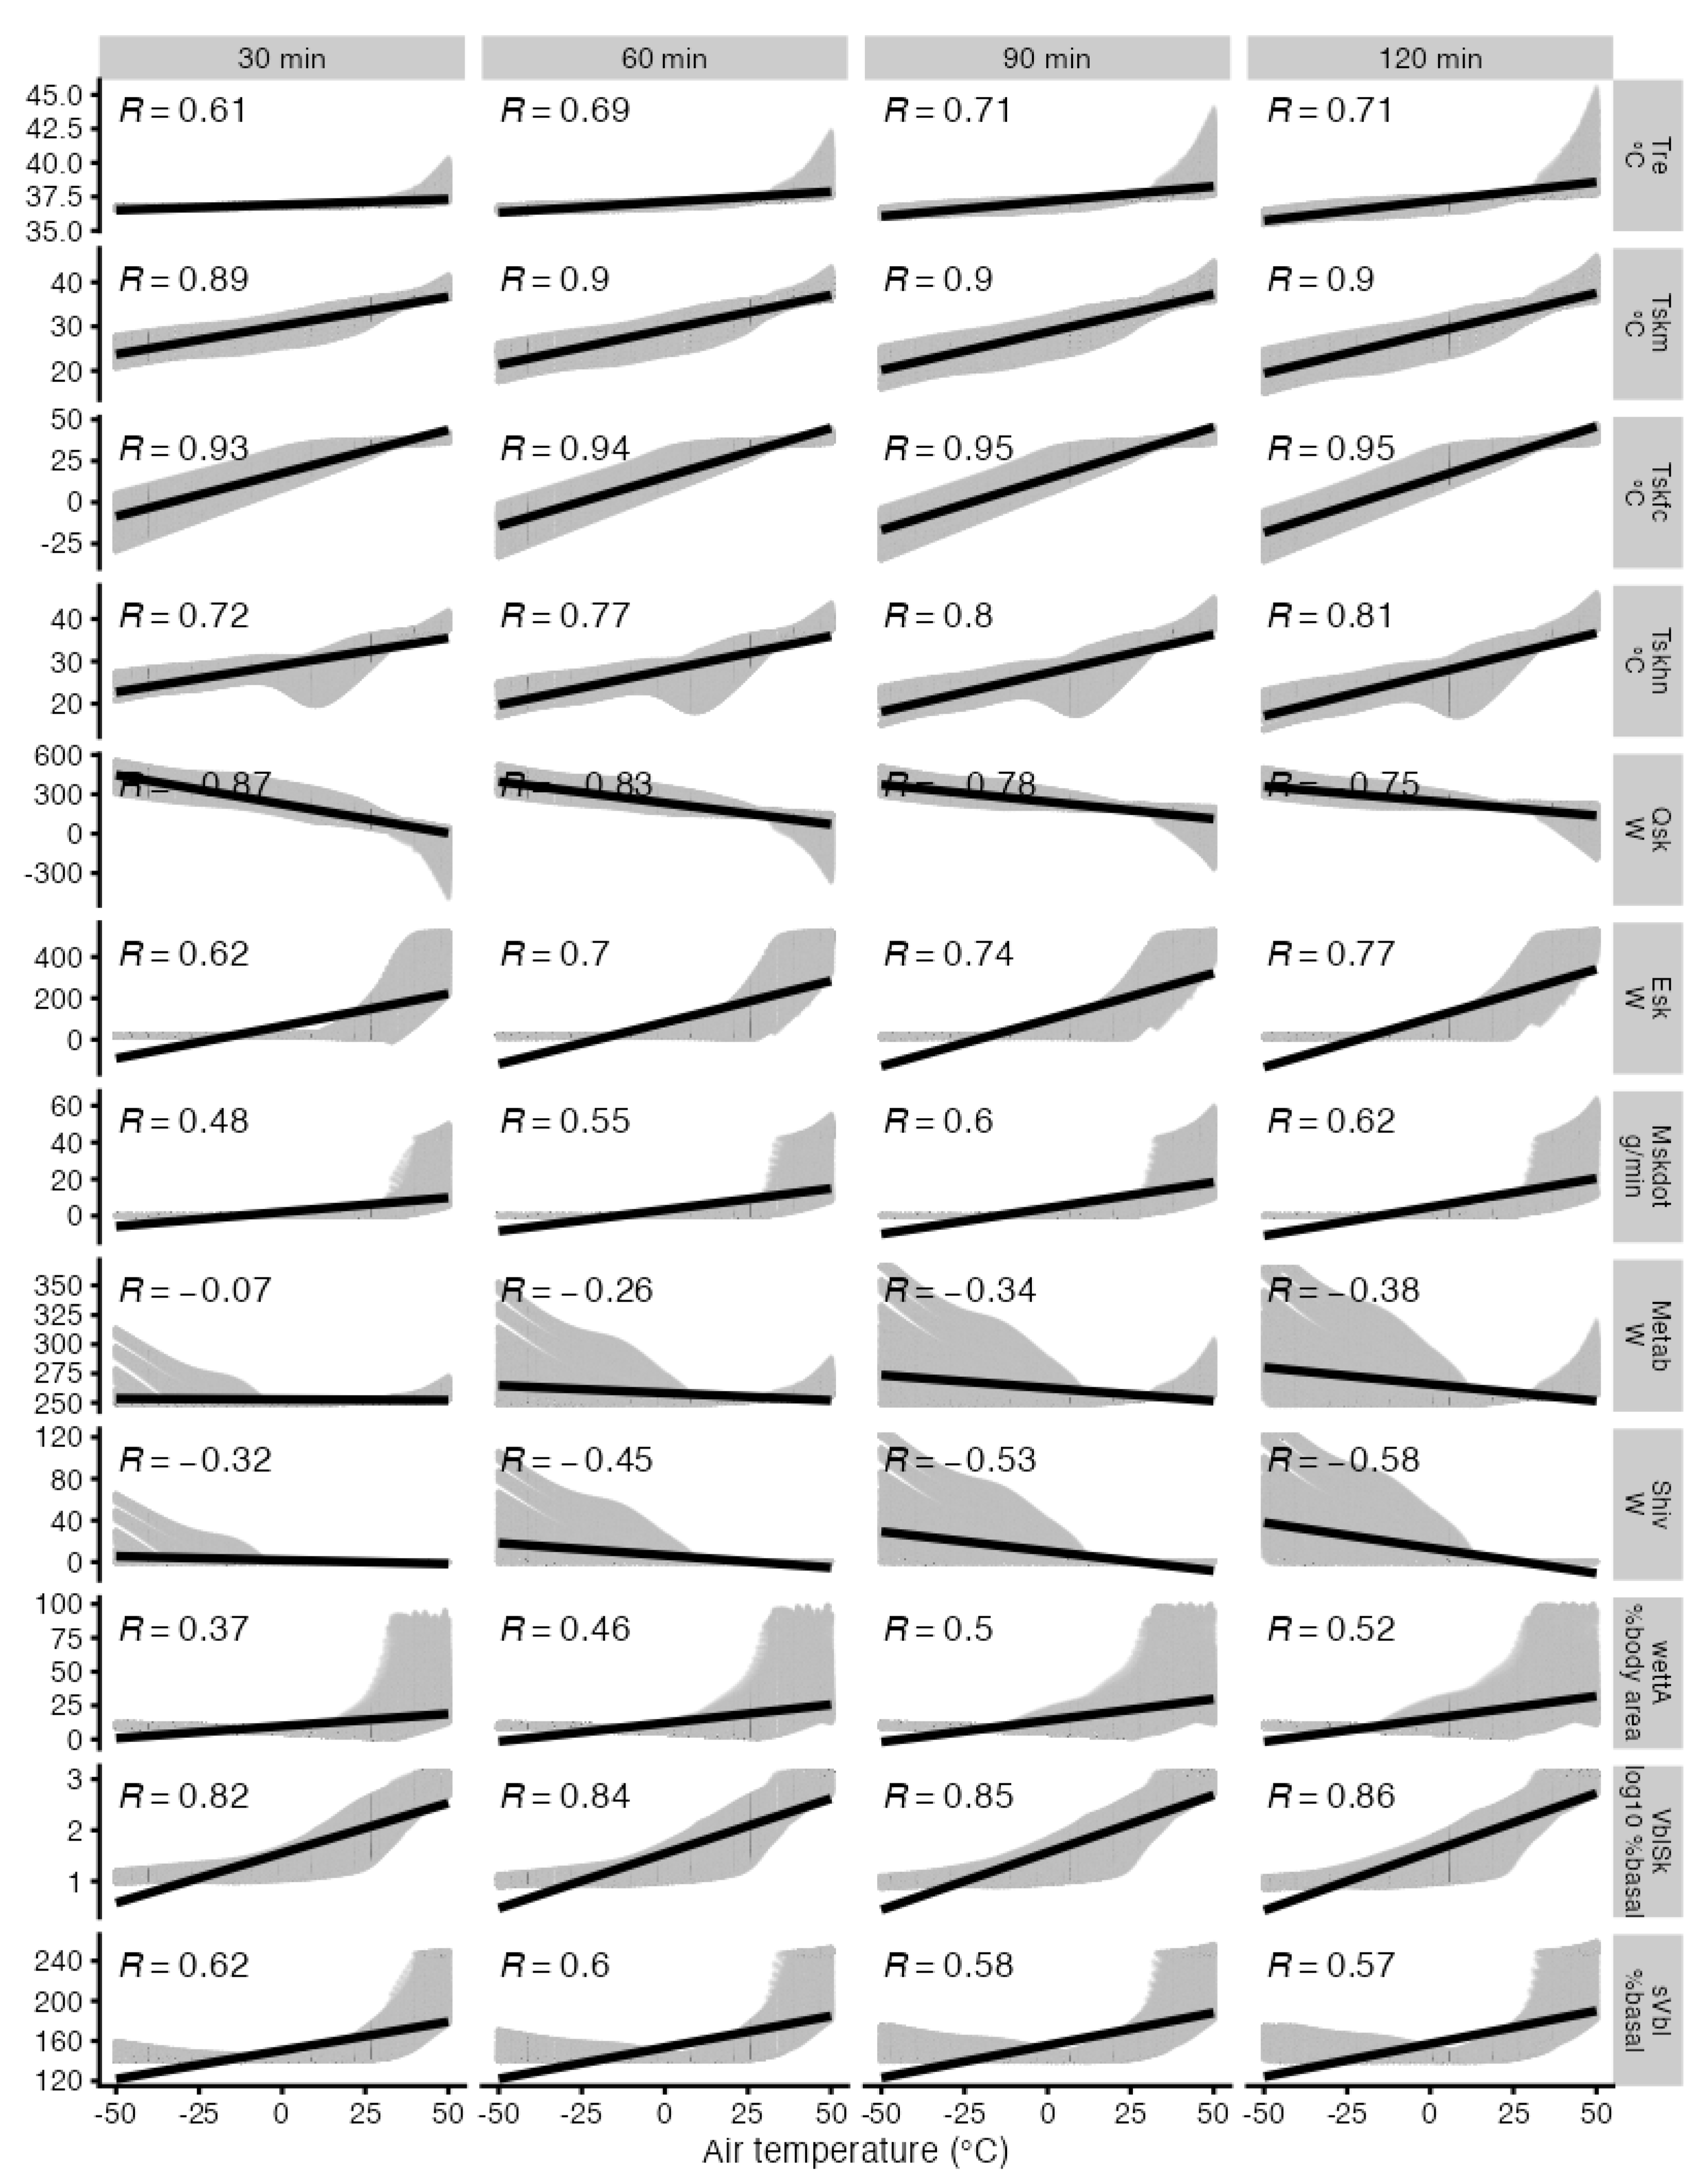
This appendix contains a supplemental Figure A1 showing the correlation of the predicted physiological responses with air temperature.
Figure A1.
Set of twelve physiological output variables (abbreviations in Table 1) at four exposure times from the combined reference and non-reference conditions plotted related to air temperatures ranging from -50°C to +50 °C with correlation coefficients and linear regression lines.
Figure A1.
Set of twelve physiological output variables (abbreviations in Table 1) at four exposure times from the combined reference and non-reference conditions plotted related to air temperatures ranging from -50°C to +50 °C with correlation coefficients and linear regression lines.
References
- Berk, R.A. Statistical Learning from a Regression Perspective; Springer International Publishing: Cham, 2020.
- Hastie, T.; Tibshirani, R.; Friedman, J. The Elements of Statistical Learning: Data Mining, Inference, and Prediction; Springer New York: New York, NY, 2009. [Google Scholar]
- James, G.; Witten, D.; Hastie, T.; Tibshirani, R. An Introduction to Statistical Learning: with Applications in R.; Springer New York: New York, NY, 2013. [Google Scholar]
- Matzarakis, A. Curiosities about Thermal Indices Estimation and Application. Atmosphere 2021, 12, 721. [Google Scholar] [CrossRef]
- Ali, A.; Jayaraman, R.; Azar, E.; Maalouf, M. A comparative analysis of machine learning and statistical methods for evaluating building performance: A systematic review and future benchmarking framework. Building and Environment 2024, 252, 111268. [Google Scholar] [CrossRef]
- Aparicio-Ruiz, P.; Barbadilla-Martín, E.; Guadix, J.; Muñuzuri, J. Predicting the clothing insulation through machine learning algorithms: A comparative analysis and a practical approach. Building Simulation 2024. [Google Scholar] [CrossRef]
- Hamed, M.M.; Al-Hasani, A.A.J.; Nashwan, M.S.; Sa’adi, Z.; Shahid, S. Assessing the growing threat of heat stress in the North Africa and Arabian Peninsula region connected to climate change. Journal of Cleaner Production 2024, 447, 141639. [Google Scholar] [CrossRef]
- Guo, R.; Yang, B.; Guo, Y.; Li, H.; Li, Z.; Zhou, B.; Hong, B.; Wang, F. Machine learning-based prediction of outdoor thermal comfort: Combining Bayesian optimization and the SHAP model. Building and Environment 2024, 254, 111301. [Google Scholar] [CrossRef]
- Wang, J.; Li, Q.; Zhu, G.; Kong, W.; Peng, H.; Wei, M. Recognition and prediction of elderly thermal sensation based on outdoor facial skin temperature. Building and Environment 2024, 253, 111326. [Google Scholar] [CrossRef]
- Wang, M.; Gou, Z. Gaussian Mixture Model based classification for analyzing longitudinal outdoor thermal environment data to evaluate comfort conditions in urban open spaces. Urban Climate 2024, 53, 101792. [Google Scholar] [CrossRef]
- Choi, Y.; Seo, S.; Lee, J.; Kim, T.W.; Koo, C. A machine learning-based forecasting model for personal maximum allowable exposure time under extremely hot environments. Sustainable Cities and Society 2024, 101, 105140. [Google Scholar] [CrossRef]
- Jendritzky, G.; de Dear, R.; Havenith, G. UTCI - Why another thermal index? International Journal of Biometeorology 2012, 56, 421–428. [Google Scholar] [CrossRef]
- Geletič, J.; Lehnert, M.; Krč, P.; Resler, J.; Krayenhoff, E.S. High-Resolution Modelling of Thermal Exposure during a Hot Spell: A Case Study Using PALM-4U in Prague, Czech Republic. Atmosphere 2021, 12, 175. [Google Scholar] [CrossRef]
- Dimitriadou, L.; Nastos, P.; Zerefos, C. Defining Heatwaves with Respect to Human Biometeorology. The Case of Attica Region, Greece. Atmosphere 2021, 12, 1100. [Google Scholar] [CrossRef]
- Zeng, D.; Wu, J.; Mu, Y.; Deng, M.; Wei, Y.; Sun, W. Spatial-Temporal Pattern Changes of UTCI in the China–Pakistan Economic Corridor in Recent 40 Years. Atmosphere 2020, 11, 858. [Google Scholar] [CrossRef]
- Basarin, B.; Lukić, T.; Matzarakis, A. Review of Biometeorology of Heatwaves and Warm Extremes in Europe. Atmosphere 2020, 11, 1276. [Google Scholar] [CrossRef]
- Staiger, H.; Laschewski, G.; Matzarakis, A. Selection of Appropriate Thermal Indices for Applications in Human Biometeorological Studies. Atmosphere 2019, 10, 18. [Google Scholar] [CrossRef]
- Di Napoli, C.; Pappenberger, F.; Cloke, H.L. Verification of Heat Stress Thresholds for a Health-Based Heat-Wave Definition. Journal of Applied Meteorology and Climatology 2019, 58, 1177–1194. [Google Scholar] [CrossRef]
- Potchter, O.; Cohen, P.; Lin, T.-P.; Matzarakis, A. A systematic review advocating a framework and benchmarks for assessing outdoor human thermal perception. Science of The Total Environment 2022, 833, 155128. [Google Scholar] [CrossRef] [PubMed]
- Urban, A.; Di Napoli, C.; Cloke, H.L.; Kyselý, J.; Pappenberger, F.; Sera, F.; Schneider, R.; Vicedo-Cabrera, A.M.; Acquaotta, F.; Ragettli, M.S.; et al. Evaluation of the ERA5 reanalysis-based Universal Thermal Climate Index on mortality data in Europe. Environmental Research 2021, 198, 111227. [Google Scholar] [CrossRef] [PubMed]
- Di Napoli, C.; Barnard, C.; Prudhomme, C.; Cloke, H.L.; Pappenberger, F. ERA5-HEAT: A global gridded historical dataset of human thermal comfort indices from climate reanalysis. Geoscience Data Journal 2020, 8, 2–10. [Google Scholar] [CrossRef]
- Di Napoli, C.; Pappenberger, F.; Cloke, H.L. Assessing heat-related health risk in Europe via the Universal Thermal Climate Index (UTCI). International Journal of Biometeorology 2018, 62, 1155–1165. [Google Scholar] [CrossRef]
- Ioannou, L.G.; Tsoutsoubi, L.; Mantzios, K.; Vliora, M.; Nintou, E.; Piil, J.F.; Notley, S.R.; Dinas, P.C.; Gourzoulidis, G.A.; Havenith, G.; et al. Indicators to assess physiological heat strain – Part 3: Multi-country field evaluation and consensus recommendations. Temperature 2022, 9, 274–291. [Google Scholar] [CrossRef]
- Brimicombe, C.; Di Napoli, C.; Cornforth, R.; Pappenberger, F.; Petty, C.; Cloke, H.L. Borderless Heat Hazards With Bordered Impacts. Earth’s Future 2021, 9, e2021EF002064. [Google Scholar] [CrossRef]
- McGregor, G.R. Special issue: Universal Thermal Climate Index (UTCI). International Journal of Biometeorology 2012, 56, 419–419. [Google Scholar] [CrossRef]
- Bröde, P.; Fiala, D.; Blazejczyk, K.; Holmér, I.; Jendritzky, G.; Kampmann, B.; Tinz, B.; Havenith, G. Deriving the operational procedure for the Universal Thermal Climate Index (UTCI). International Journal of Biometeorology 2012, 56, 481–494. [Google Scholar] [CrossRef] [PubMed]
- Fiala, D.; Havenith, G.; Bröde, P.; Kampmann, B.; Jendritzky, G. UTCI-Fiala multi-node model of human heat transfer and temperature regulation. International Journal of Biometeorology 2012, 56, 429–441. [Google Scholar] [CrossRef] [PubMed]
- Havenith, G.; Fiala, D.; Blazejczyk, K.; Richards, M.; Bröde, P.; Holmér, I.; Rintamaki, H.; Ben Shabat, Y.; Jendritzky, G. The UTCI-clothing model. International Journal of Biometeorology 2012, 56, 461–470. [Google Scholar] [CrossRef]
- Psikuta, A.; Fiala, D.; Laschewski, G.; Jendritzky, G.; Richards, M.; Blazejczyk, K.; Mekjavic, I.B.; Rintamäki, H.; de Dear, R.; Havenith, G. Validation of the Fiala multi-node thermophysiological model for UTCI application. International Journal of Biometeorology 2012, 56, 443–460. [Google Scholar] [CrossRef]
- Kampmann, B.; Bröde, P.; Fiala, D. Physiological responses to temperature and humidity compared to the assessment by UTCI, WGBT and PHS. International Journal of Biometeorology 2012, 56, 505–513. [Google Scholar] [CrossRef]
- Bröde, P.; Krüger, E.L.; Rossi, F.A.; Fiala, D. Predicting urban outdoor thermal comfort by the Universal Thermal Climate Index UTCI - a case study in Southern Brazil. International Journal of Biometeorology 2012, 56, 471–480. [Google Scholar] [CrossRef]
- Bröde, P.; Kampmann, B. Temperature–Humidity-Dependent Wind Effects on Physiological Heat Strain of Moderately Exercising Individuals Reproduced by the Universal Thermal Climate Index (UTCI). Biology 2023, 12, 802. [Google Scholar] [CrossRef]
- Bröde, P.; Fiala, D.; Kampmann, B.; Havenith, G.; Jendritzky, G. Der Klimaindex UTCI - Multivariate Analyse der Reaktion eines thermophysiologischen Simulationsmodells. In Proceedings of the 55. Kongress der Gesellschaft für Arbeitswissenschaft, Dortmund, 2009 04.-06.03; 2009; pp. 705–708. [Google Scholar]
- Bröde, P.; Blazejczyk, K.; Fiala, D.; Havenith, G.; Holmér, I.; Jendritzky, G.; Kuklane, K.; Kampmann, B. The Universal Thermal Climate Index UTCI Compared to Ergonomics Standards for Assessing the Thermal Environment. Industrial Health 2013, 51, 16–24. [Google Scholar] [CrossRef]
- Aguilera, J.J.; Korsholm Andersen, R.; Toftum, J. Prediction of Indoor Air Temperature Using Weather Data and Simple Building Descriptors. International Journal of Environmental Research and Public Health 2019, 16, 4349. [Google Scholar] [CrossRef] [PubMed]
- Benita, F.; Tunçer, B. Exploring the effect of urban features and immediate environment on body responses. Urban Forestry & Urban Greening 2019, 43, 126365. [Google Scholar] [CrossRef]
- Berrang-Ford, L.; Sietsma, A.J.; Callaghan, M.; Minx, J.C.; Scheelbeek, P.F.D.; Haddaway, N.R.; Haines, A.; Dangour, A.D. Systematic mapping of global research on climate and health: a machine learning review. The Lancet Planetary Health 2021, 5, e514–e525. [Google Scholar] [CrossRef] [PubMed]
- Kim, J.; Schiavon, S.; Brager, G. Personal comfort models – A new paradigm in thermal comfort for occupant-centric environmental control. Building and Environment 2018, 132, 114–124. [Google Scholar] [CrossRef]
- Liu, K.; Nie, T.; Liu, W.; Liu, Y.; Lai, D. A machine learning approach to predict outdoor thermal comfort using local skin temperatures. Sustainable Cities and Society 2020, 59, 102216. [Google Scholar] [CrossRef]
- Mantzios, K.; Ioannou, L.G.; Panagiotaki, Z.; Ziaka, S.; Périard, J.D.; Racinais, S.; Nybo, L.; Flouris, A.D. Effects of Weather Parameters on Endurance Running Performance: Discipline Specific Analysis of 1258 Races. Medicine & Science in Sports & Exercise 2021, 54, 153–161. [Google Scholar] [CrossRef] [PubMed]
- Shin, J.-Y.; Min, B.; Kim, K.R. High-resolution wind speed forecast system coupling numerical weather prediction and machine learning for agricultural studies — a case study from South Korea. International Journal of Biometeorology 2022, 66, 1429–1443. [Google Scholar] [CrossRef] [PubMed]
- Bröde, P. UTCI-Test-Data. 2021. [CrossRef]
- ASHRAE. Standard 55 - Thermal Environmental Conditions for Human Occupancy; ASHRAE Inc.: Atlanta, 2004. [Google Scholar]
- Fiala, D.; Lomas, K.J.; Stohrer, M. First principles modeling of thermal sensation responses in steady-state and transient conditions. ASHRAE Transactions 2003, 109, 179–186. [Google Scholar]
- Breiman, L. Random Forests. Machine Learning 2001, 45, 5–32. [Google Scholar] [CrossRef]
- Genuer, R.; Poggi, J.-M. Random Forests with R.; Springer International Publishing: Cham, 2020. [Google Scholar]
- Chen, T.; Guestrin, C. XGBoost: A Scalable Tree Boosting System. In Proceedings of the Proceedings of the 22nd ACM SIGKDD International Conference on Knowledge Discovery and Data Mining, San Francisco, California, USA, 2016; pp. 785–794.
- Berk, R.A. Statistical Learning from a Regression Perspective; Springer International Publishing: Cham, 2020. [Google Scholar]
- van der Maaten, L.; Hinton, G. Visualizing Data using t-SNE. Journal of Machine Learning Research 2008, 9, 2579–2605. [Google Scholar]
- Cohen, J. A Coefficient of Agreement for Nominal Scales. Educational and Psychological Measurement 1960, 20, 37–46. [Google Scholar] [CrossRef]
- R Core Team. R: A Language and Environment for Statistical Computing. 2024.
- Kuhn, M. Building Predictive Models in R Using the caret Package. Journal of Statistical Software 2008, 28, 1–26. [Google Scholar] [CrossRef]
- Kuhn, M.; Vaughan, D.; Hvitfeldt, E. yardstick: Tidy Characterizations of Model Performance – R package version 1.3.1. 2024.
- Wickham, H.; Averick, M.; Bryan, J.; Chang, W.; McGowan, L.D.A.; François, R.; Grolemund, G.; Hayes, A.; Henry, L.; Hester, J.; et al. Welcome to the Tidyverse. Journal of Open Source Software 2019, 4, 1686. [Google Scholar] [CrossRef]
- Wilke, C.O. cowplot: Streamlined Plot Theme and Plot Annotations for ‘ggplot2’ – R package version 1.1.3. 2024.
- Kampmann, B.; Bröde, P. Heat Acclimation Does Not Modify Q10 and Thermal Cardiac Reactivity. Frontiers in Physiology 2019, 10, 1524. [Google Scholar] [CrossRef]
- Härdle, W.; Simar, L. Applied Multivariate Statistical Analysis, 2nd ed.; Springer-Verlag: Berlin, 2007. [Google Scholar]
- Chang, Y.; Wang, X.; Wang, J.; Wu, Y.; Yang, L.; Zhu, K.; Chen, H.; Yi, X.; Wang, C.; Wang, Y.; et al. A Survey on Evaluation of Large Language Models. ACM Trans. Intell. Syst. Technol. 2024, 15, Article–39. [Google Scholar] [CrossRef]
- Asemi, A.; Ko, A.; Nowkarizi, M. Intelligent libraries: a review on expert systems, artificial intelligence, and robot. Library Hi Tech 2021, 39, 412–434. [Google Scholar] [CrossRef]
- Kwon, D.; Belsky, D.W. A toolkit for quantification of biological age from blood chemistry and organ function test data: BioAge. GeroScience 2021, 43, 2795–2808. [Google Scholar] [CrossRef] [PubMed]
- Klemera, P.; Doubal, S. A new approach to the concept and computation of biological age. Mechanisms of Ageing and Development 2006, 127, 240–248. [Google Scholar] [CrossRef]
- Bröde, P.; Claus, M.; Gajewski, P.D.; Getzmann, S.; Wascher, E.; Watzl, C. From Immunosenescence to Aging Types–Establishing Reference Intervals for Immune Age Biomarkers by Centile Estimation. International Journal of Molecular Sciences 2023, 24, 13186. [Google Scholar] [CrossRef] [PubMed]
- Notley, S.R.; Mitchell, D.; Taylor, N.A.S. A century of exercise physiology: concepts that ignited the study of human thermoregulation. Part 3: Heat and cold tolerance during exercise. European Journal of Applied Physiology 2024, 124, 1–145. [Google Scholar] [CrossRef] [PubMed]
Figure 1.
Stages of developing the elements of the operational procedure for calculating UTCI equivalent temperatures with thermal stress categories, modified from [26], where. the highlighted stages 4 and 5 are of major concern in this study.
Figure 1.
Stages of developing the elements of the operational procedure for calculating UTCI equivalent temperatures with thermal stress categories, modified from [26], where. the highlighted stages 4 and 5 are of major concern in this study.
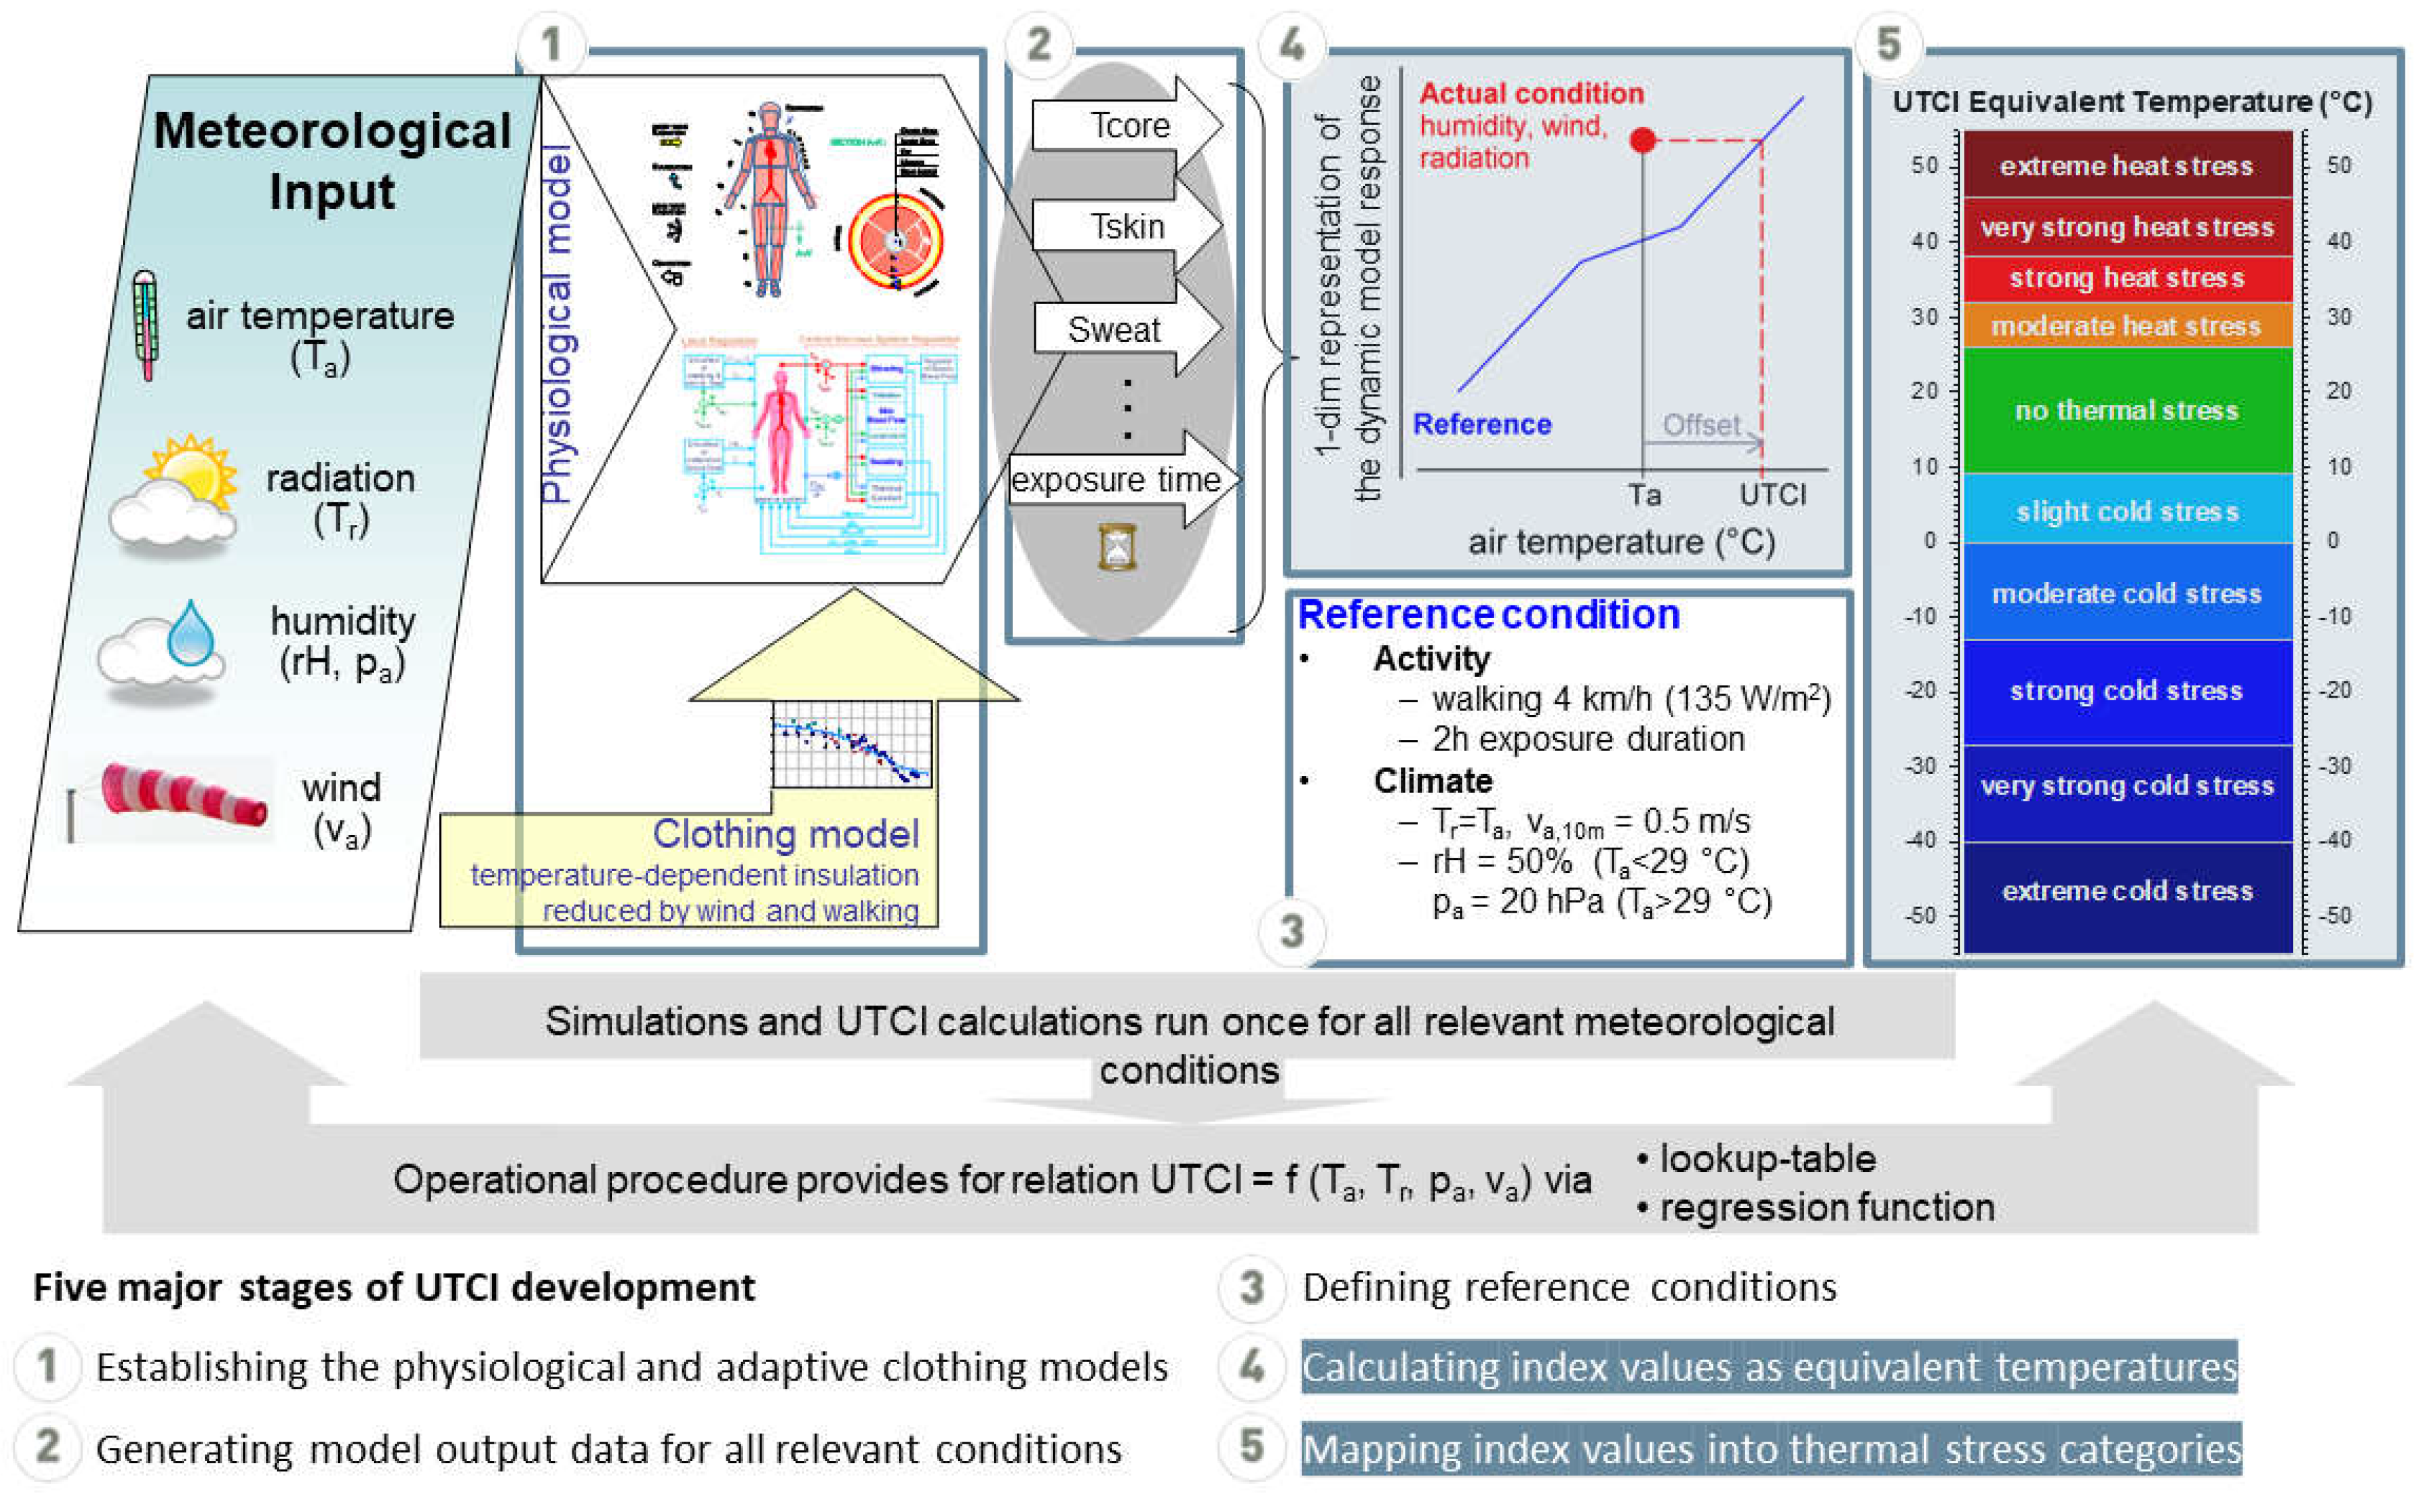
Figure 2.
Set of twelve physiological output variables (abbreviations in Table 1) at four points in time from the simulated reference conditions plotted with UTCI ranging from -55 °C to +55 °C.
Figure 2.
Set of twelve physiological output variables (abbreviations in Table 1) at four points in time from the simulated reference conditions plotted with UTCI ranging from -55 °C to +55 °C.
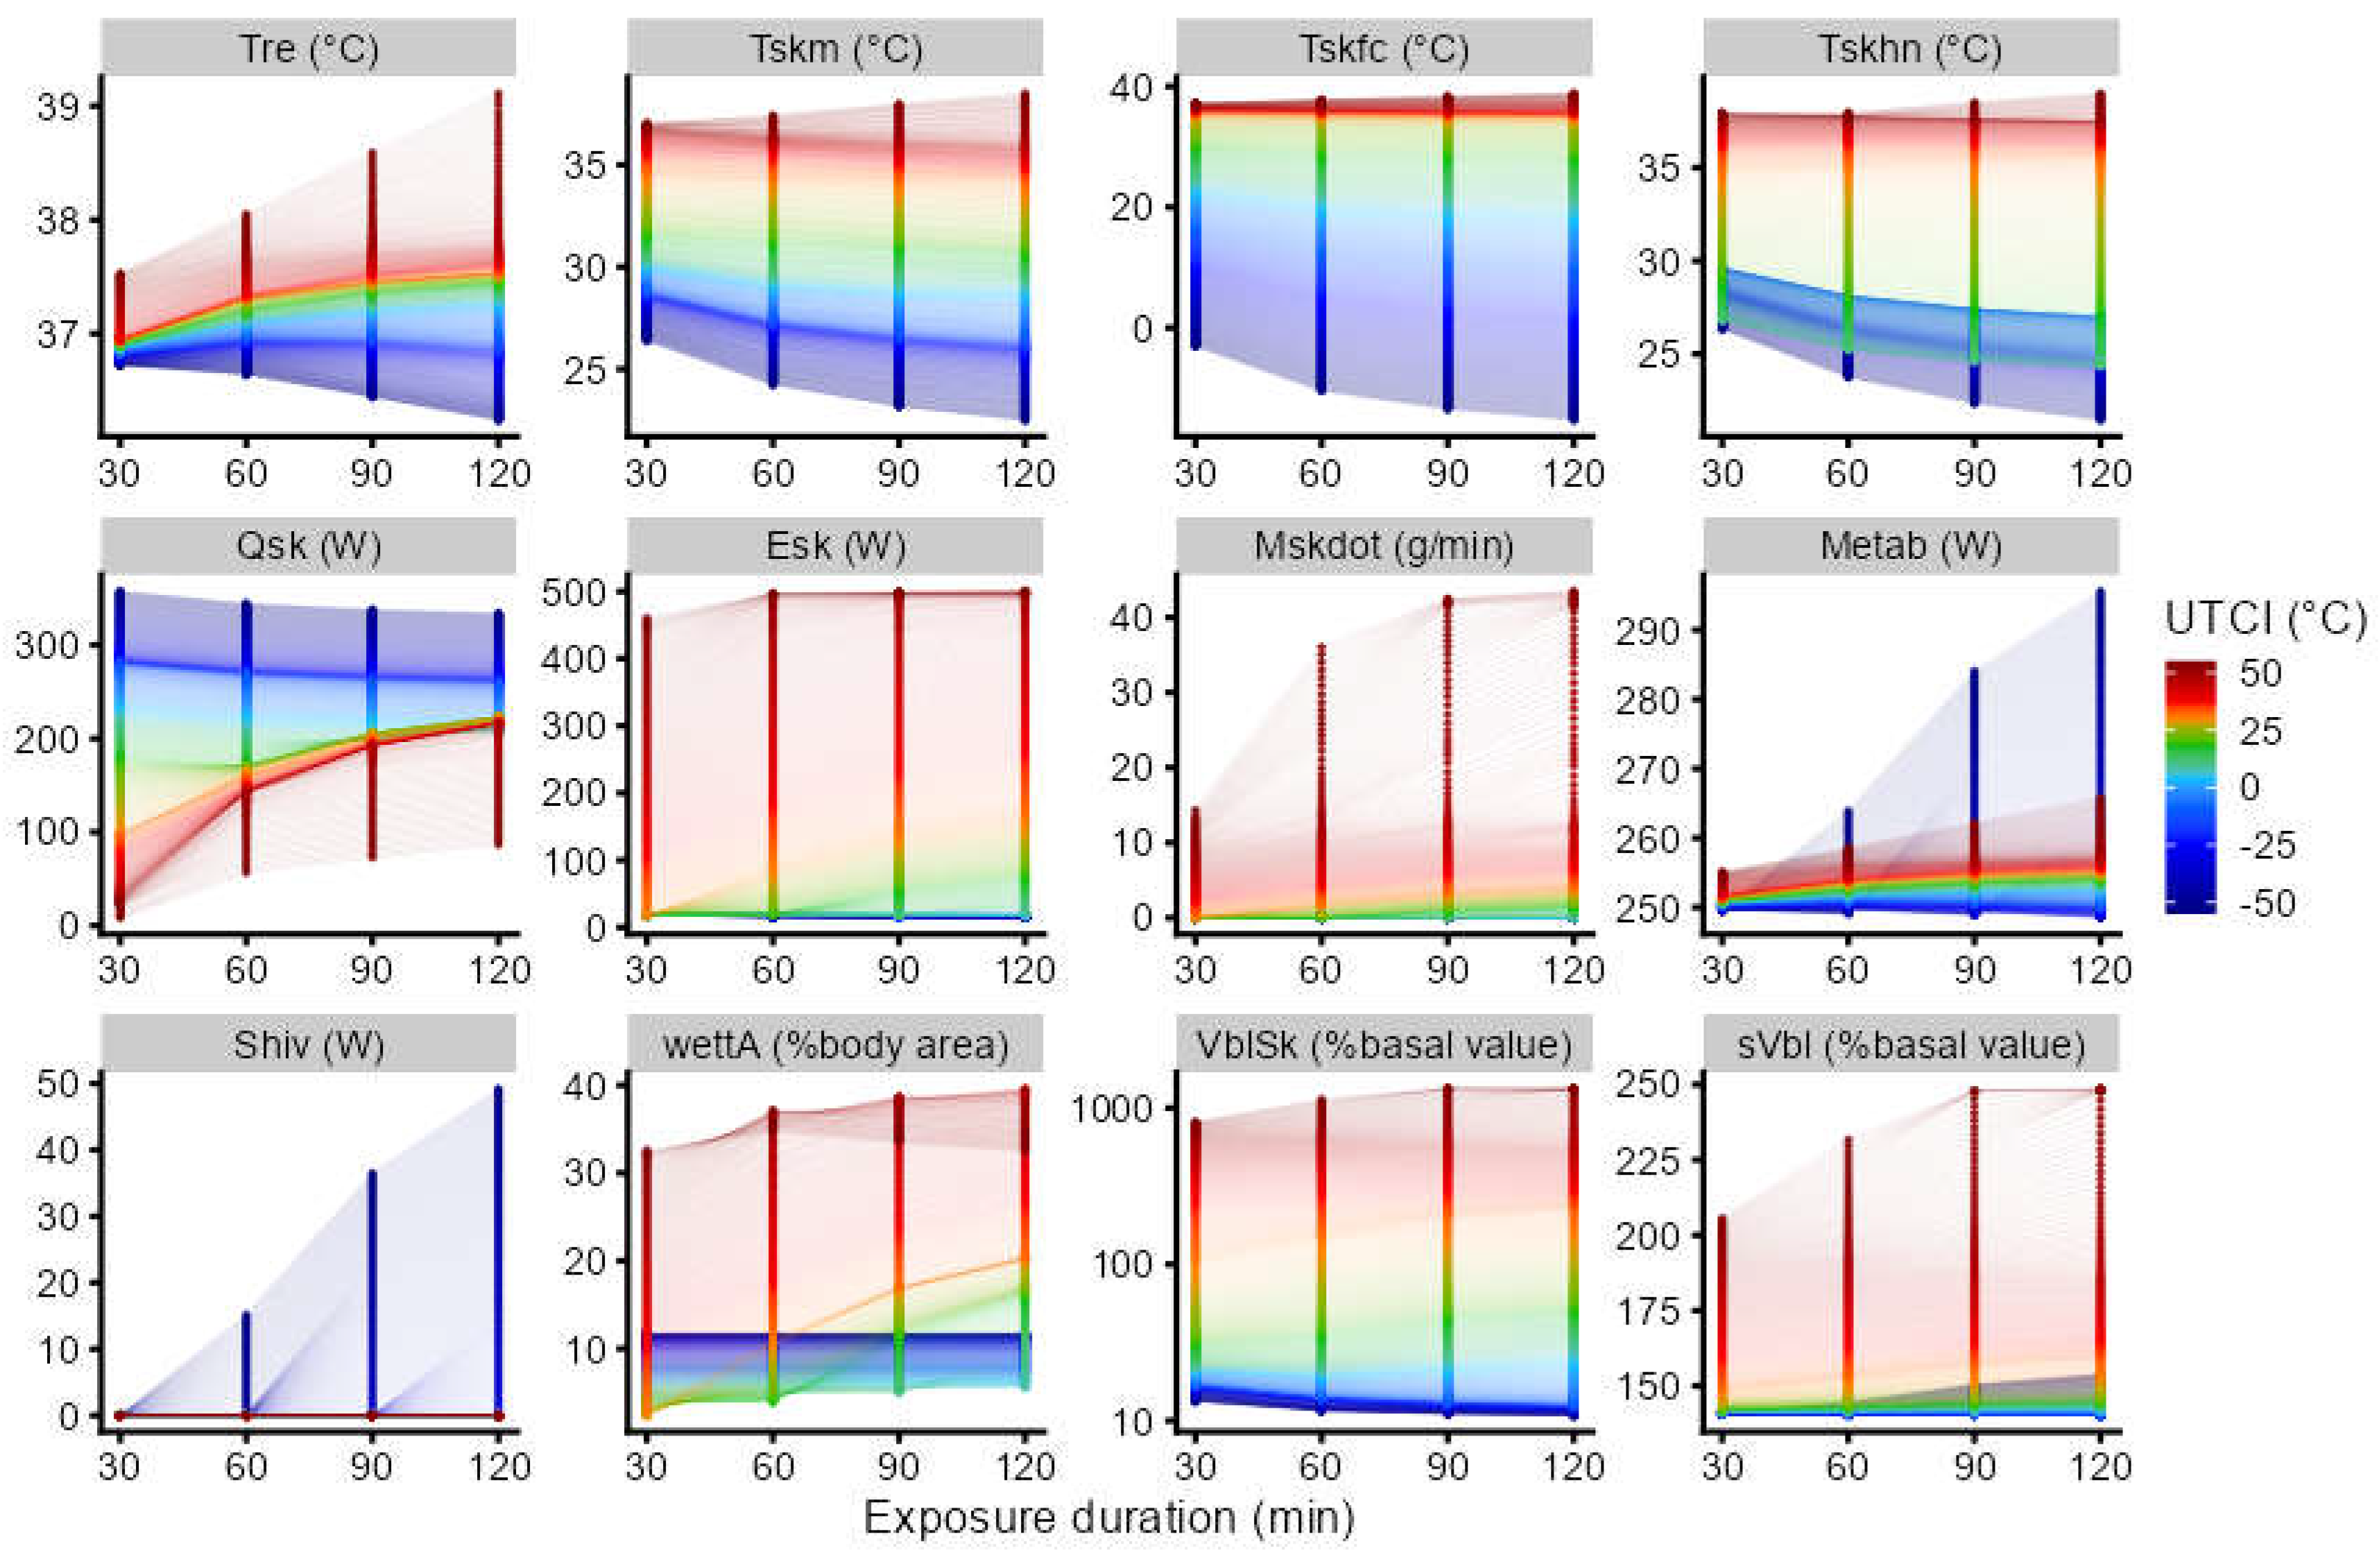
Figure 3.
(A) Root-mean squared error (RMSE) for predicting UTCI equivalent temperatures from 48 physiological variables by different supervised SL algorithms (MLR: multiple linear regression; LASSO: least absolute shrinkage and selection operator; CART: classification and regression trees; SVM: support vector machines; XGBoost: extreme gradient boosting; RF: random forests; KNN: k-nearest neighbors) for the training reference (train ref) data and two test datasets for reference (ref) and non-reference (non-ref) UTCI conditions. For comparison, horizontal reference lines indicate the RMSE for calculating UTCI from meteorological input using the polynomial regression function or the lookup table provided by the operational procedure [26]. (B) Dynamic thermal sensation votes from the non-reference test data depending on equivalent temperature predicted by the SL algorithms from (A) in comparison to the original UTCI (lower right panel), with lines indicating the values for the reference conditions.
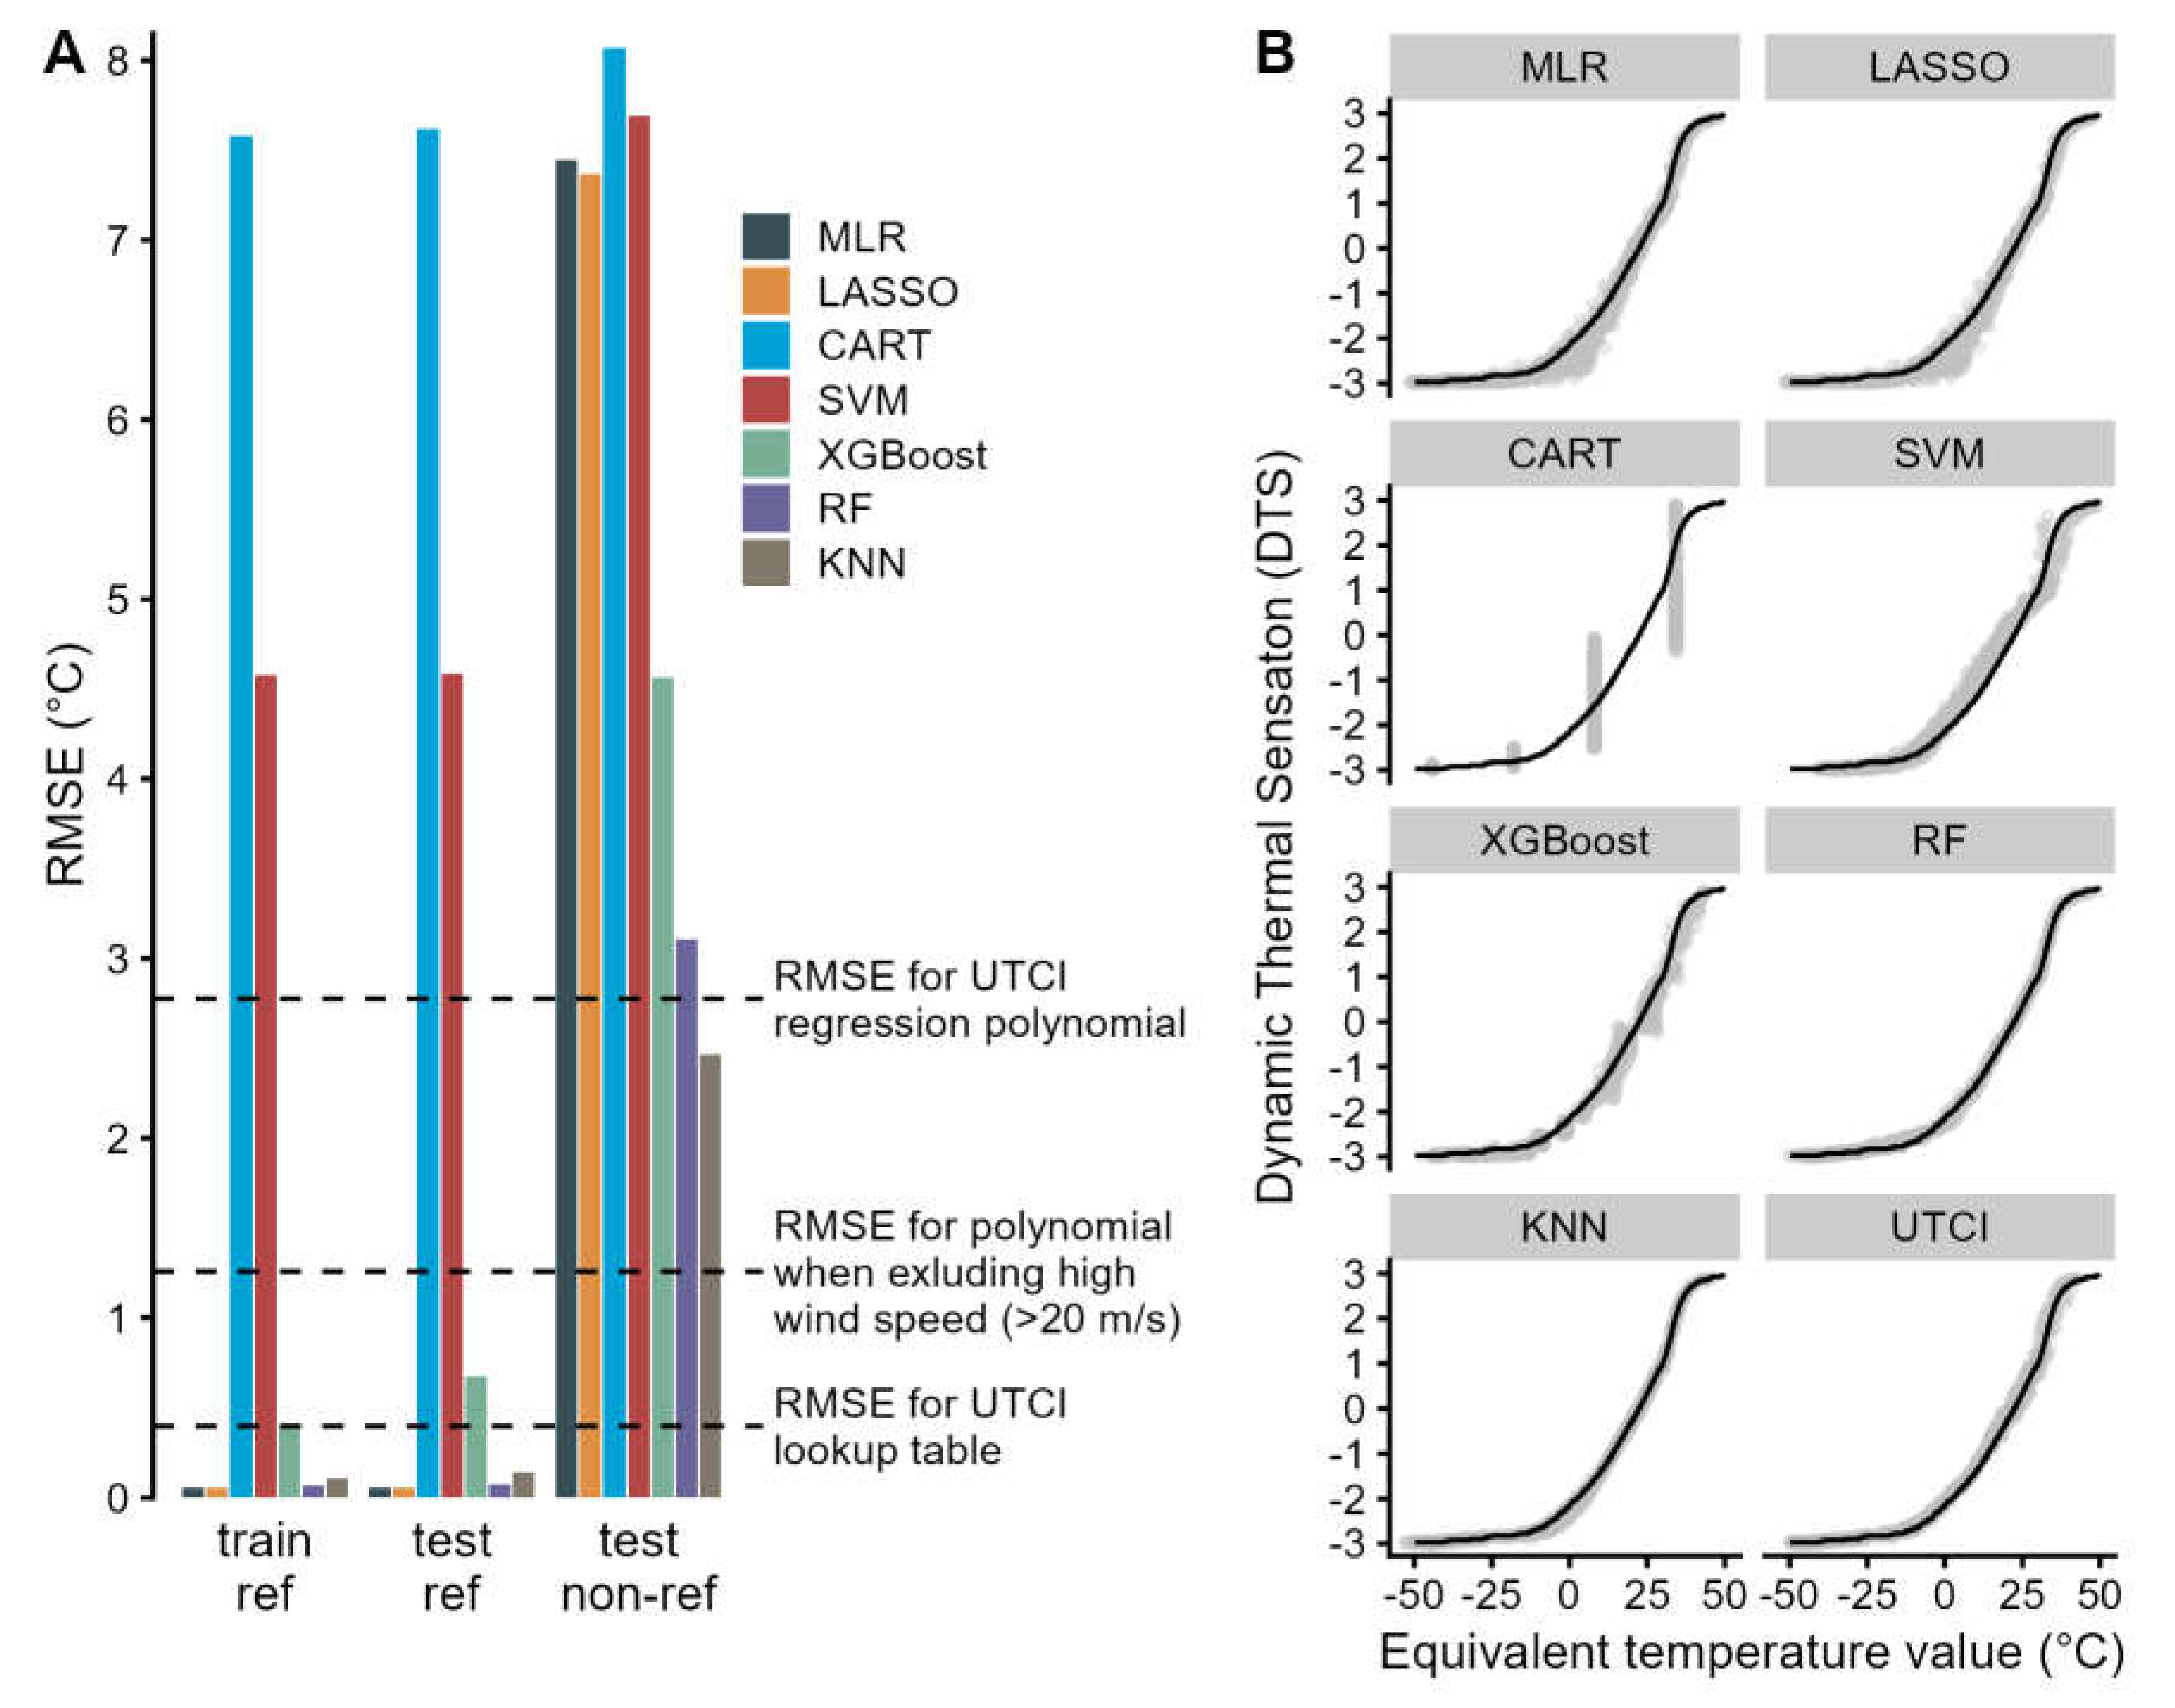
Figure 4.
(A) Two-dimensional projections from principal component analysis (PCA), and t-distributed stochastic neighbor embedding (t-SNE), respectively, of the reference data (48 physiological variables plus 4 calculated dynamic thermal sensations) colored by the ten UTCI categories. (B) Confusion matrices showing the proportion (Prop) of conditions in the original ten UTCI stress categories (y-axis) assigned to the corresponding number of groups by hierarchical (upper panels) and k-means-clustering (lower panels) applied to the projections from PCA and t-SNE, respectively. (C) Metrics (accuracy and Cohen’s kappa) on the agreement of the UTCI stress categories with the classifications by the different clustering algorithms applied to PCA and t-SNE projections.

Figure 5.
UTCI values and KDM equivalent temperatures for the external test data comprising 1,000 non-reference conditions with squared correlation coefficient (R2) and dashed line of identity (y=x).
Figure 5.
UTCI values and KDM equivalent temperatures for the external test data comprising 1,000 non-reference conditions with squared correlation coefficient (R2) and dashed line of identity (y=x).
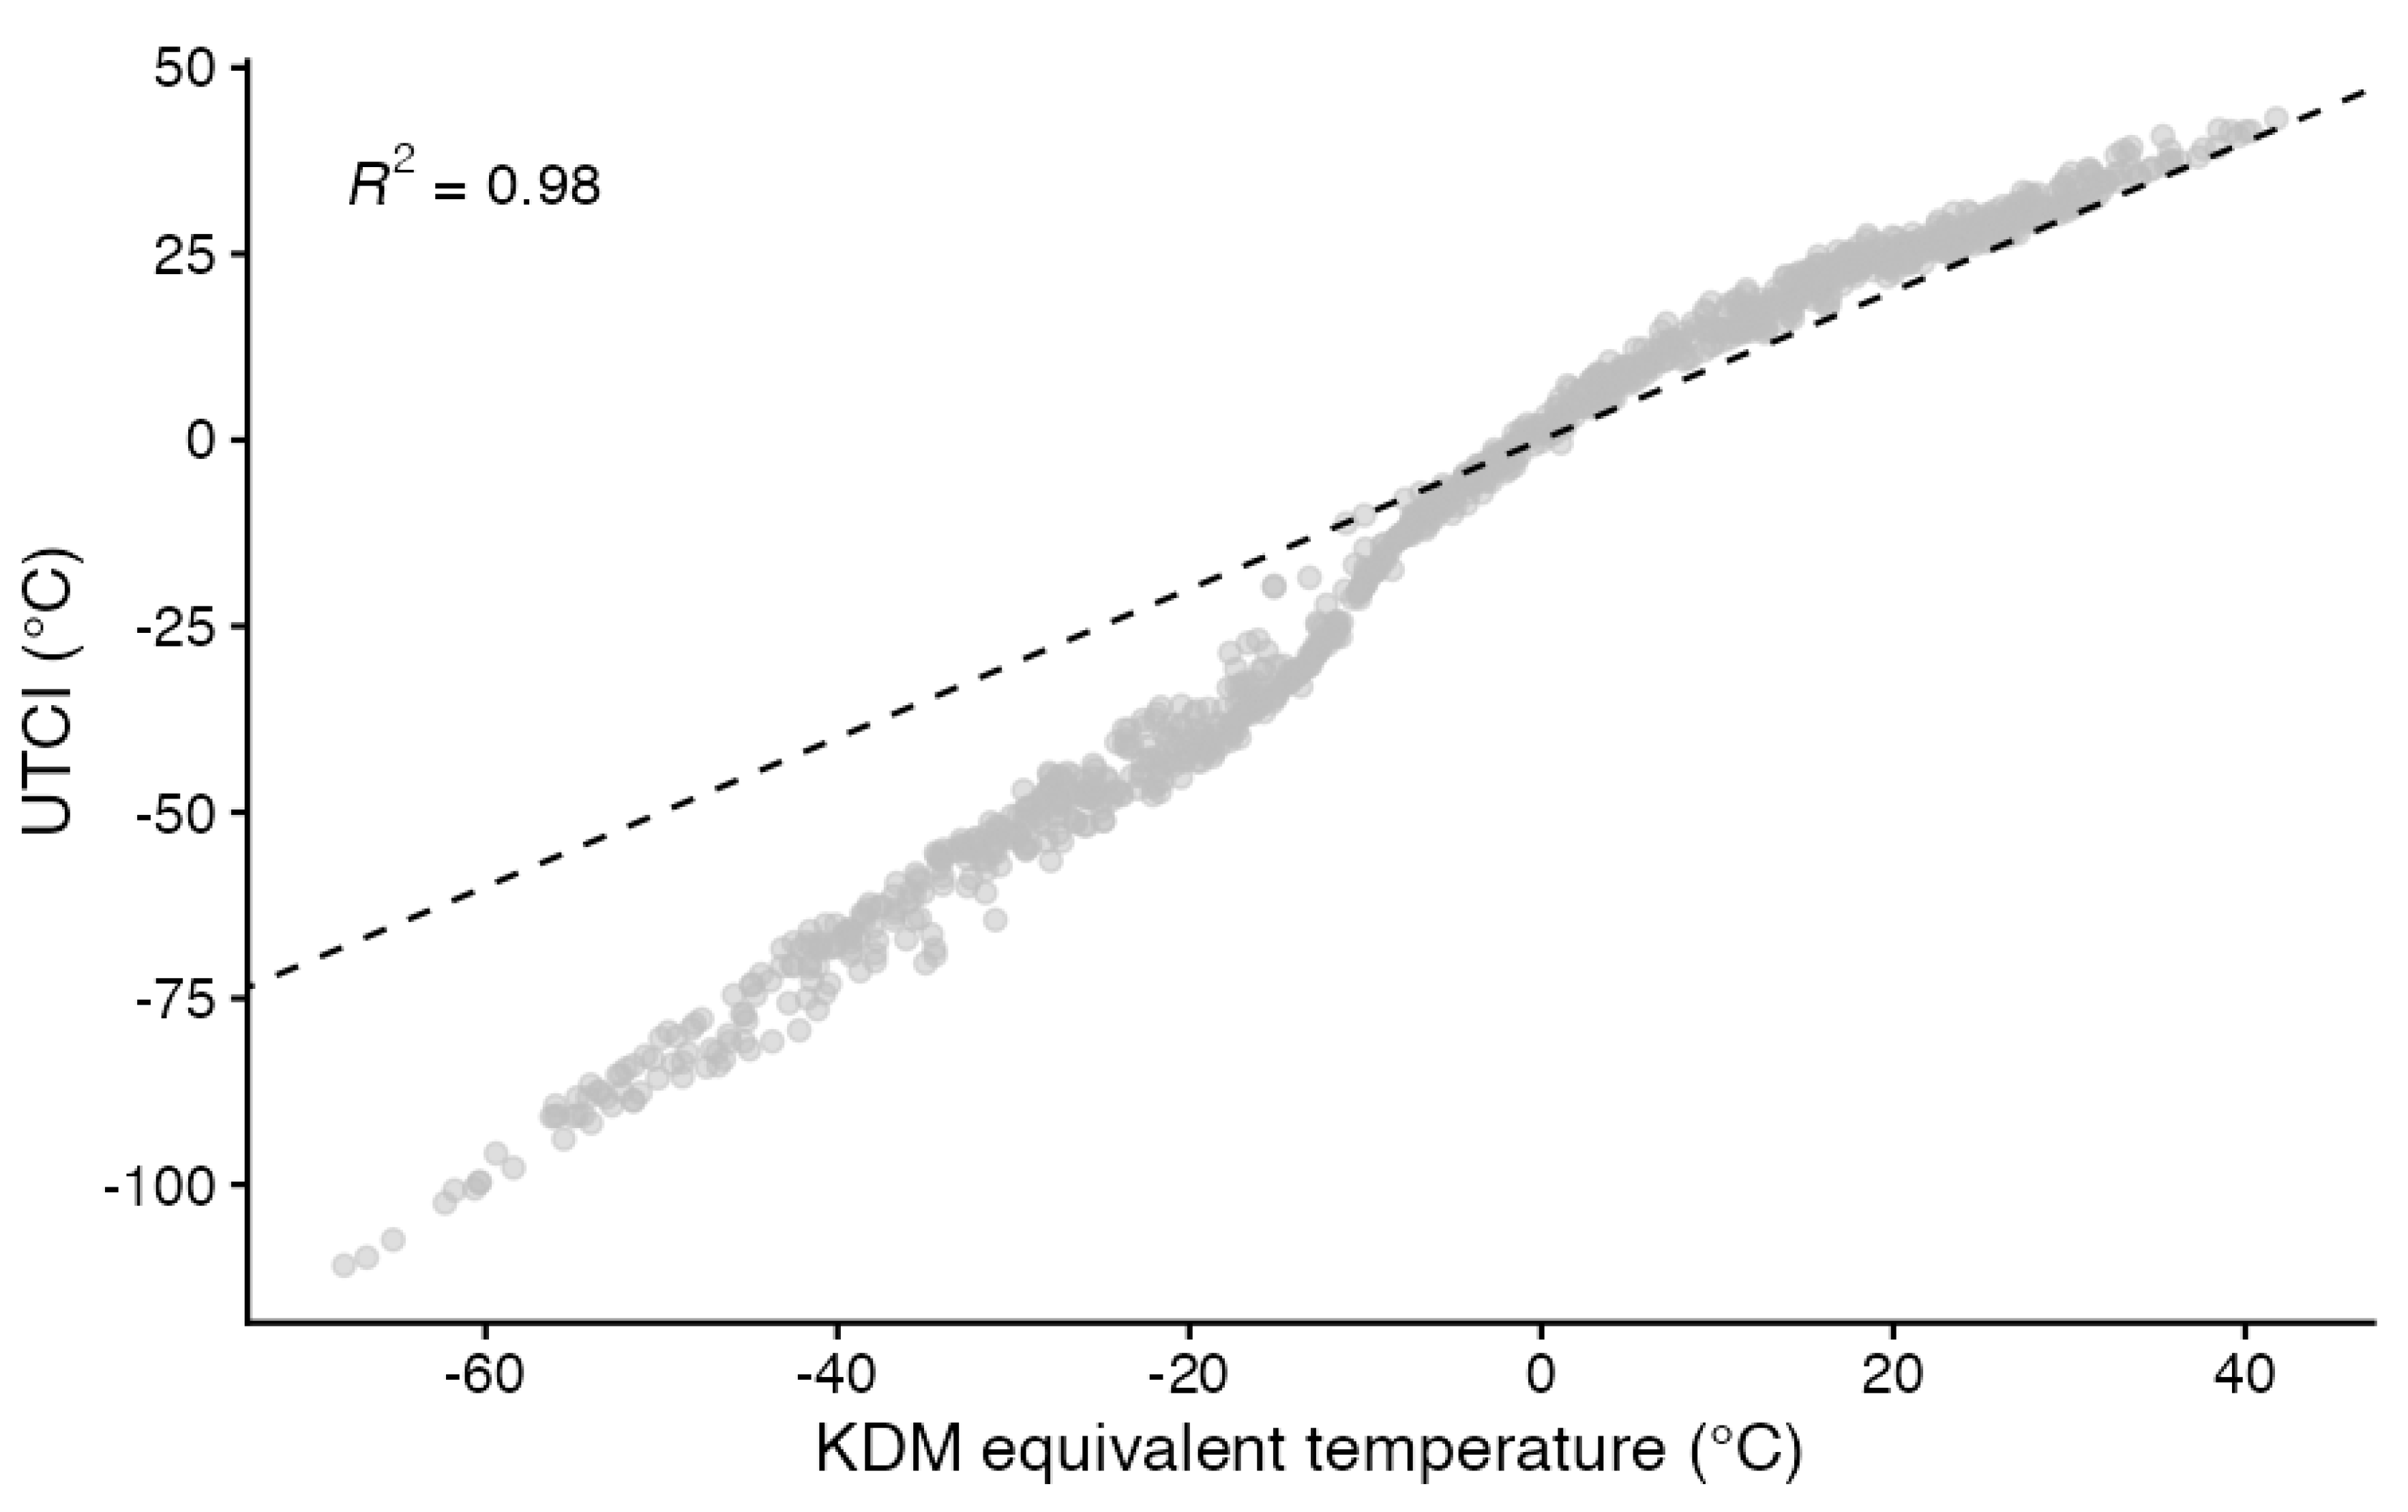

Table 1.
Physiological output variables obtained from the UTCI-Fiala model [27].
Table 1.
Physiological output variables obtained from the UTCI-Fiala model [27].
| Physiological Variable1 | Abbreviation2 | Unit |
| rectal temperature | Tre | °C |
| mean skin temperature | Tskm | °C |
| facial skin temperature | Tskfc | °C |
| hand skin temperature | Tskhn | °C |
| total net heat loss | Qsk | W |
| evaporative (latent) heat loss | Esk | W |
| sweat rate | Mskdot | g/min |
| metabolic heat production | Metab | W |
| heat generated by shivering | Shiv | W |
| skin wettedness | wettA | % of body area |
| skin blood flow | VblSk | % of basal value |
| cardiac output | sVbl | % of basal value |
1 In addition, scores of the dynamic thermal sensation (DTS) on the 7-unit ASHRAE [43] scale (-3:cold; -2:cool; -1:slightly cool; 0:neutral; +1:slightly warm; +2:warm; +3:hot) were estimated from the physiological output [44]. 2 Each output variable was calculated for 30, 60, 90 and 120 min of simulated exposure duration.
Disclaimer/Publisher’s Note: The statements, opinions and data contained in all publications are solely those of the individual author(s) and contributor(s) and not of MDPI and/or the editor(s). MDPI and/or the editor(s) disclaim responsibility for any injury to people or property resulting from any ideas, methods, instructions or products referred to in the content. |
© 2024 by the authors. Licensee MDPI, Basel, Switzerland. This article is an open access article distributed under the terms and conditions of the Creative Commons Attribution (CC BY) license (http://creativecommons.org/licenses/by/4.0/).
Copyright: This open access article is published under a Creative Commons CC BY 4.0 license, which permit the free download, distribution, and reuse, provided that the author and preprint are cited in any reuse.


