Submitted:
24 April 2024
Posted:
25 April 2024
You are already at the latest version
Abstract
Present study on land use land cover analysis and taluka wise combination of cropped area, carried out in Beed district of Maharashtra state in India and studied 11 talukas of the district. Secondary data on land use land cover and area in various crops has been collected, compiled and analyzed from various secondary sources. Simple descriptive statistics used to examine the agricultural land use land cover and J.C. Weaver’s crop combination technique was used for taluka wise analysis of crop combinations and on the basis of highest to smallest area engaged in particular crop, crops have been ranked. The study showed that, in the district as a whole, percentage of uncultivated land other than fallow was about 46 percent as compare to net sown area is only 35 percent in total geographical area (1063855ha) of Beed district. The study further revealed that about 42 percent area engaged in food crops and about 58 percent area occupied by nonfood crops, which includes cereals (25%), cotton (19%), pulses (13%), oilseed (12%), sugarcane (5%) and fruits and vegetables (3%). Results of Weaver’s crop combination technique showed that the Wadwani taluka demarcated as most diversified taluka by means of maximum number (sixteen) of crops combinations with the lowest variance value (14) found in the present investigation. Further, the study revealed that the high crop diversity found in Dharur taluka with eighteen crop combinations and the taluka has given first rank amongst others. To derive the crop diversity ranking, taluka wise maximum to minimum number of crop combinations derived in different talukas and given ranks accordingly. The study concluded that, agricultural land use analysis is essential for solving and optimizing the land use problem, maintaining socio-ecological balance, best utilization of scarce resources. The authors enlightened that the rational use of agricultural land has important for food security and biodiversity which increase the productivity and profitability of the agriculture sector and it indicates the decision making ability of farmers in study area.
Keywords:
Agriculture
; Beed
; crop combination
; land use pattern
Introduction
Demographically, Indian agriculture sector employed more than 50℅ of the Indian work force and contributes about 17–18% to country's GDP (India economic survey, 2018). On the other hand, the sector is the broadest economic segment which plays a significant role in overall socio-economic framework of India. As per the global land use statistics, the world population expanding rapidly and the agrarian ecosystem covers nearly 40% of the land, because of that, the sector is a dominant sector for land management scenario (Kanianska, 29016). World scenario of land use land cover shows that, globally in India, about 35% (4.6 billion ha) of land comprises by grass-land and woodland ecosystems followed by 28% (3.7 billion ha) of land is under forest and 12% (1.6 billion ha) is under cultivation of the worldwide land area (13.2 billion ha.) (Kanianska, 2016). From past 140 years, India has experienced significant changes in land use land cover with deforestation, agriculture and urbanization (Roy et al., 2015; Tian et al., 2014). India is one of the largest producers of agricultural commodities with the worldwide coverage of half of the land area under cultivation (FAO, 2017a; Teluguntla et al., 2015). On the other hand, with only 2.4% of the world's total land area, India provides food to 18% of the world's population (Bhattacharyya et al., 2015; Teluguntla et al., 2015). In order to fulfill the food demand of expected population growth (more than 1.6 billion) in 2050, India's food production needs to be increased in the coming decade (UN Pop, 2017).
Due to the limitations of farmland availability, farmers growing number of crops instead of single crop on their fields and such land use distribution pattern is a result of certain cropping pattern, crop combinations or/ and high proportion of convinced crop in particular area. Area specific characters like technological improvement, soil types, water availability, environmental and socioeconomic factors (Figueiredo & Pereira, 2011; Rudel, 2009) has influence the land use pattern and it indicates the decision making ability of farmers. Land use pattern has important impacts on the consumption pattern, health and nutritional status, market sustainability, food security, biodiversity and the vulnerability of the people (Lesschen et al. 2005). Simultaneously, the policies of land use management plays a crucial role in identifying, quantifying and monitoring the changes in landscape dynamics for mitigating soil degradation (Gerlak, 2014; Zhang et al., 2014) as well as for the suitable land use planning. Agricultural land use analysis is also essential for solving and optimizing the land use problem, maintaining socio-ecological balance, best utilization of scarce resources, and to increase the productivity and profitability of the agriculture sector (Sunatkar, 2016). On this background, the present study “Optimization of agricultural land use pattern and crop combination” has been formulated in the Beed district of Maharashtra state in India
Materials and methods:
The study area:
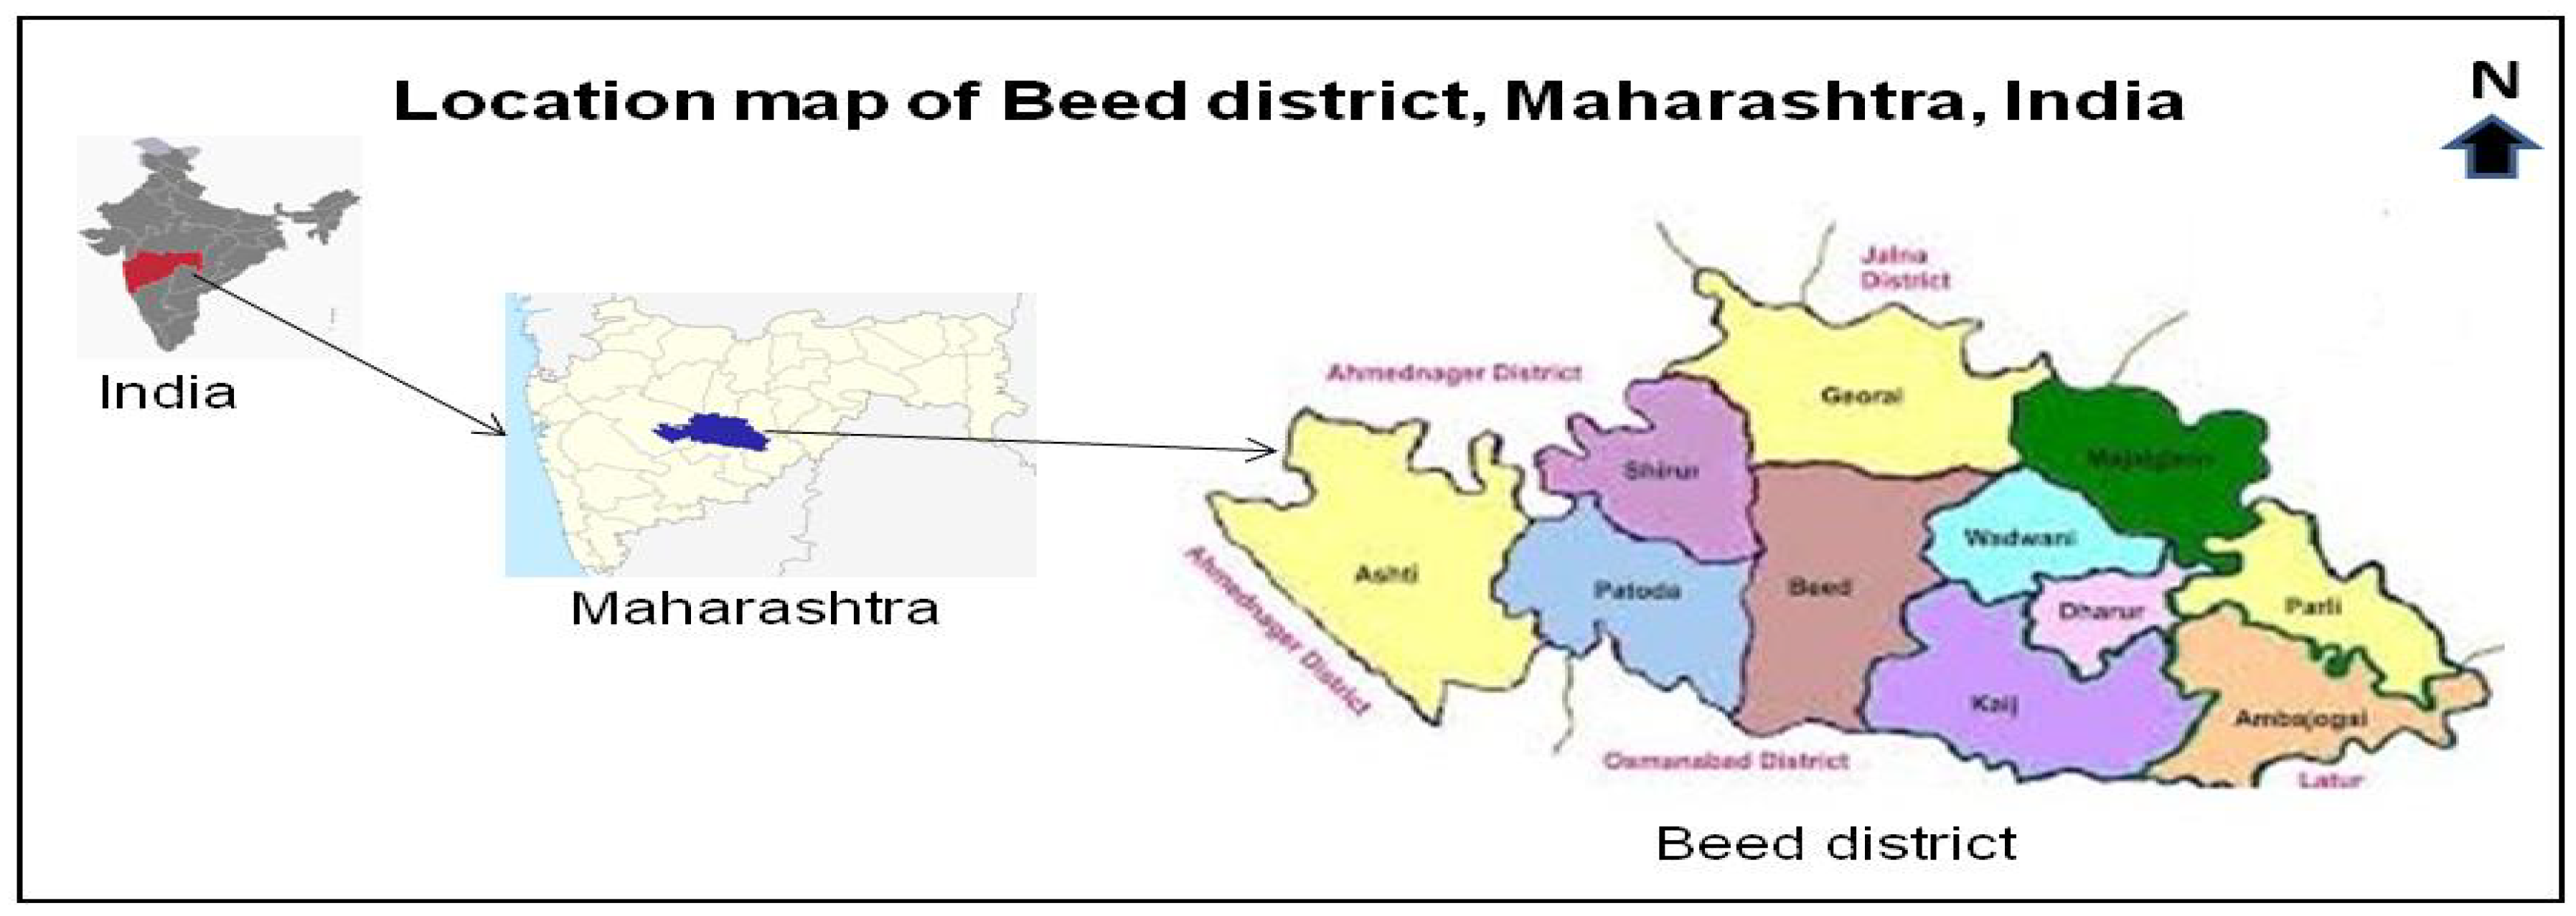
Beed district is located at the GPS coordinates of 18° 59’ 31.2432” north latitude and 75° 46’ 34.0968” east longitude (Figure 1) in Maharashtra state of India. District comprises with 11 tahsils, 9 towns and1368 villages. The Godavari River forms the boundary of the district throughout the northern border. The average annual rainfall is 750.1 mm. The period of major rainfall occurrence (about 80%) is the south-west monsoon period and the month of September is the major rainfall month. As per the census of India, 2011, in total workforce there were 50.33% people engaged in agriculture and about 28.39% people are farm labors in district. Land holding capacity of farmers shows that majority of farmers (about 81.56%) are marginal farmers having only 0.02 to 2 hectare of lands whereas 18.31% of farmers having 2 to 10 ha of land moreover 0.45% of farmers having more than 10 ha of lands. As per the report of district disaster management plan, 2018-19, drought and flood are the major natural hazards of the district.
Geomorphology of Beed district:
The district is situated under the agro ecological sub region of Deccan plateau, hot semi-arid eco region and it is a part of Western Maharashtra scarcity agro climatic zone. (nicra.icar.in). The district broadly divided into 3 geomorphologic units namely; Lowland Beed is the part of Godavari valley, Highland Beed is the part of Balaghat Plateau and Sina basin. Major soil types are rocky and thin layered soils. whereas on the banks of Godavari and Sindphana Rivers, dark brown to black and clayey loamy to loamy soils were found with low level of nutritional status. Godavari, Manjra and Sindphana rivers are the major source of drainage in the district. (Central ground water board, 2014)
Database and Methodology:
In order to explore the land use land cover analysis, secondary data has been collected and compiled from various sources, includes Directorate of economics and statistics, India economic survey, Maharashtra state agriculture department etc. For the present study, Beed district is selected as in general and studied 11 talukas of the district. Simple descriptive statistics has been used to find out the land occupied by particular crop and on the basis of highest to smallest area engaged, crops has been ranked accordingly. For taluka wise combination of cropped area, J.C. Weavers crop combination technique was used. In 1954 Weaver was first of all used this statistical technique in the field of agricultural geography to establish the combinations of various crops in the Middle West (USA) as follows:
- ∑D2
- D = --------
- N
Where, ‘D’ is the tahsil wise difference between the area percentage occupied by one crop in a tahsil and the appropriate percentage in the district and ‘N’ is the number of crops in a given combination. In this method, first, identified the percentage of particular cropped area in selected crops to the total cropped area and then each percentage is deliberated against a standard norm and with the help of standard deviation. Delineated lowest deviation (variance) value indicates the significant crop combination and number of cops grown in the study area. For the measurement of possible combinations of crops, theoretical curve used as follows:
- Monoculture : Coverage of 100 percent crop land in single crop only
- Two crops combination : Coverage of 50 percent crop land in each of two crops
- Three crops combination : Coverage of 33.3 percent crop land in each of three crops
- Four crops combination : Coverage of 25 percent crop land in each of four crops
- Five crops combination : Coverage of 20 percent crop land in each of five crops, and so on
Results and discussion:
Agricultural land use land cover scenario of Beed district:
The taluka-wise agricultural land use land cover in Beed district showed that, out of total geographical area, the Wadwani taluka (6.77%) occupied by highest “area under forest” followed by Shirur (4.86%), Dharur (4.66%) and Patoda (4.25%) talukas. The lowest area coverage found in Parli (0.64%) and Majalgaon taluka (0.43%) under the forest. The maximum area “not suitable for cultivation” found in Patoda (21.70%) followed by Ashti (15.77%), Dharur (12.82%) and Beed (10.41%) talukas. The utmost percentage (69.56) of “uncultivated land, other than fallow” in Ambejogai taluka followed by Beed (67.17), Kej (51.29%) and Gevrai (45.95%). Maximum percentage (23.34%) area in fallow land found in Gevrai taluka followed by Beed (9.04%), Ashti (8.83%) and Dharur (8.28%) and minimum in Majalgaon taluka (0.89%). The study further revealed that (table1), out of 139.3 thousand ha of geographical area, only 9.50 percentages is net sown area in Beed taluka. The maximum net sown area (82.60%) found in Shirur followed by Parli (58.23%), Wadwani (53.25%), and Majalgaon (49.98%) talukas.

Table 1.
Land use land cover scenario of Beed district in 2013 (Ref. Yr. 2011-12).
| Si. No. | Taluka | Total Geographical area in ha | % area under forest | % area not suitable for agriculture | % uncultivated land other than fallow | % area in fallow land | % net sown area |
|---|---|---|---|---|---|---|---|
| 1. | Ashti | 138100 | 1.96 | 15.77 | 27.39 | 8.83 | 46.06 |
| 2. | Patoda | 91600 | 4.25 | 21.70 | 34.83 | 2.65 | 36.58 |
| 3. | Shirur | 46525 | 4.86 | 6.67 | 2.52 | 3.34 | 82.60 |
| 4. | Gevrai | 145100 | 1.14 | 6.53 | 45.95 | 23.34 | 23.03 |
| 5. | Majalgaon | 87000 | 0.43 | 3.48 | 45.22 | 0.89 | 49.98 |
| 6. | Wadwani | 11800 | 6.77 | 4.87 | 28.66 | 6.44 | 53.25 |
| 7. | Beed | 139300 | 3.89 | 10.41 | 67.17 | 9.04 | 9.50 |
| 8. | Kej | 118900 | 2.62 | 2.02 | 51.29 | 3.07 | 40.99 |
| 9. | Dharur | 66100 | 4.66 | 12.82 | 45.69 | 8.28 | 28.55 |
| 10. | Parli | 68700 | 0.64 | 9.07 | 27.64 | 4.43 | 58.23 |
| 11. | Ambejogai | 150700 | 2.90 | 7.50 | 69.56 | 1.44 | 18.60 |
| District Total | 1063855 | 2.64 | 9.47 | 45.95 | 7.38 | 34.56 |
In the district as a whole, showed that the percentage of uncultivated land other than fallow (Figure 2) was about 46 percent as compare to net sown area is only 35 percent in total geographically bounded area of Beed district i.e. 1063855ha.
Figure 2.
Percentage distribution of land use land cover in Beed district.
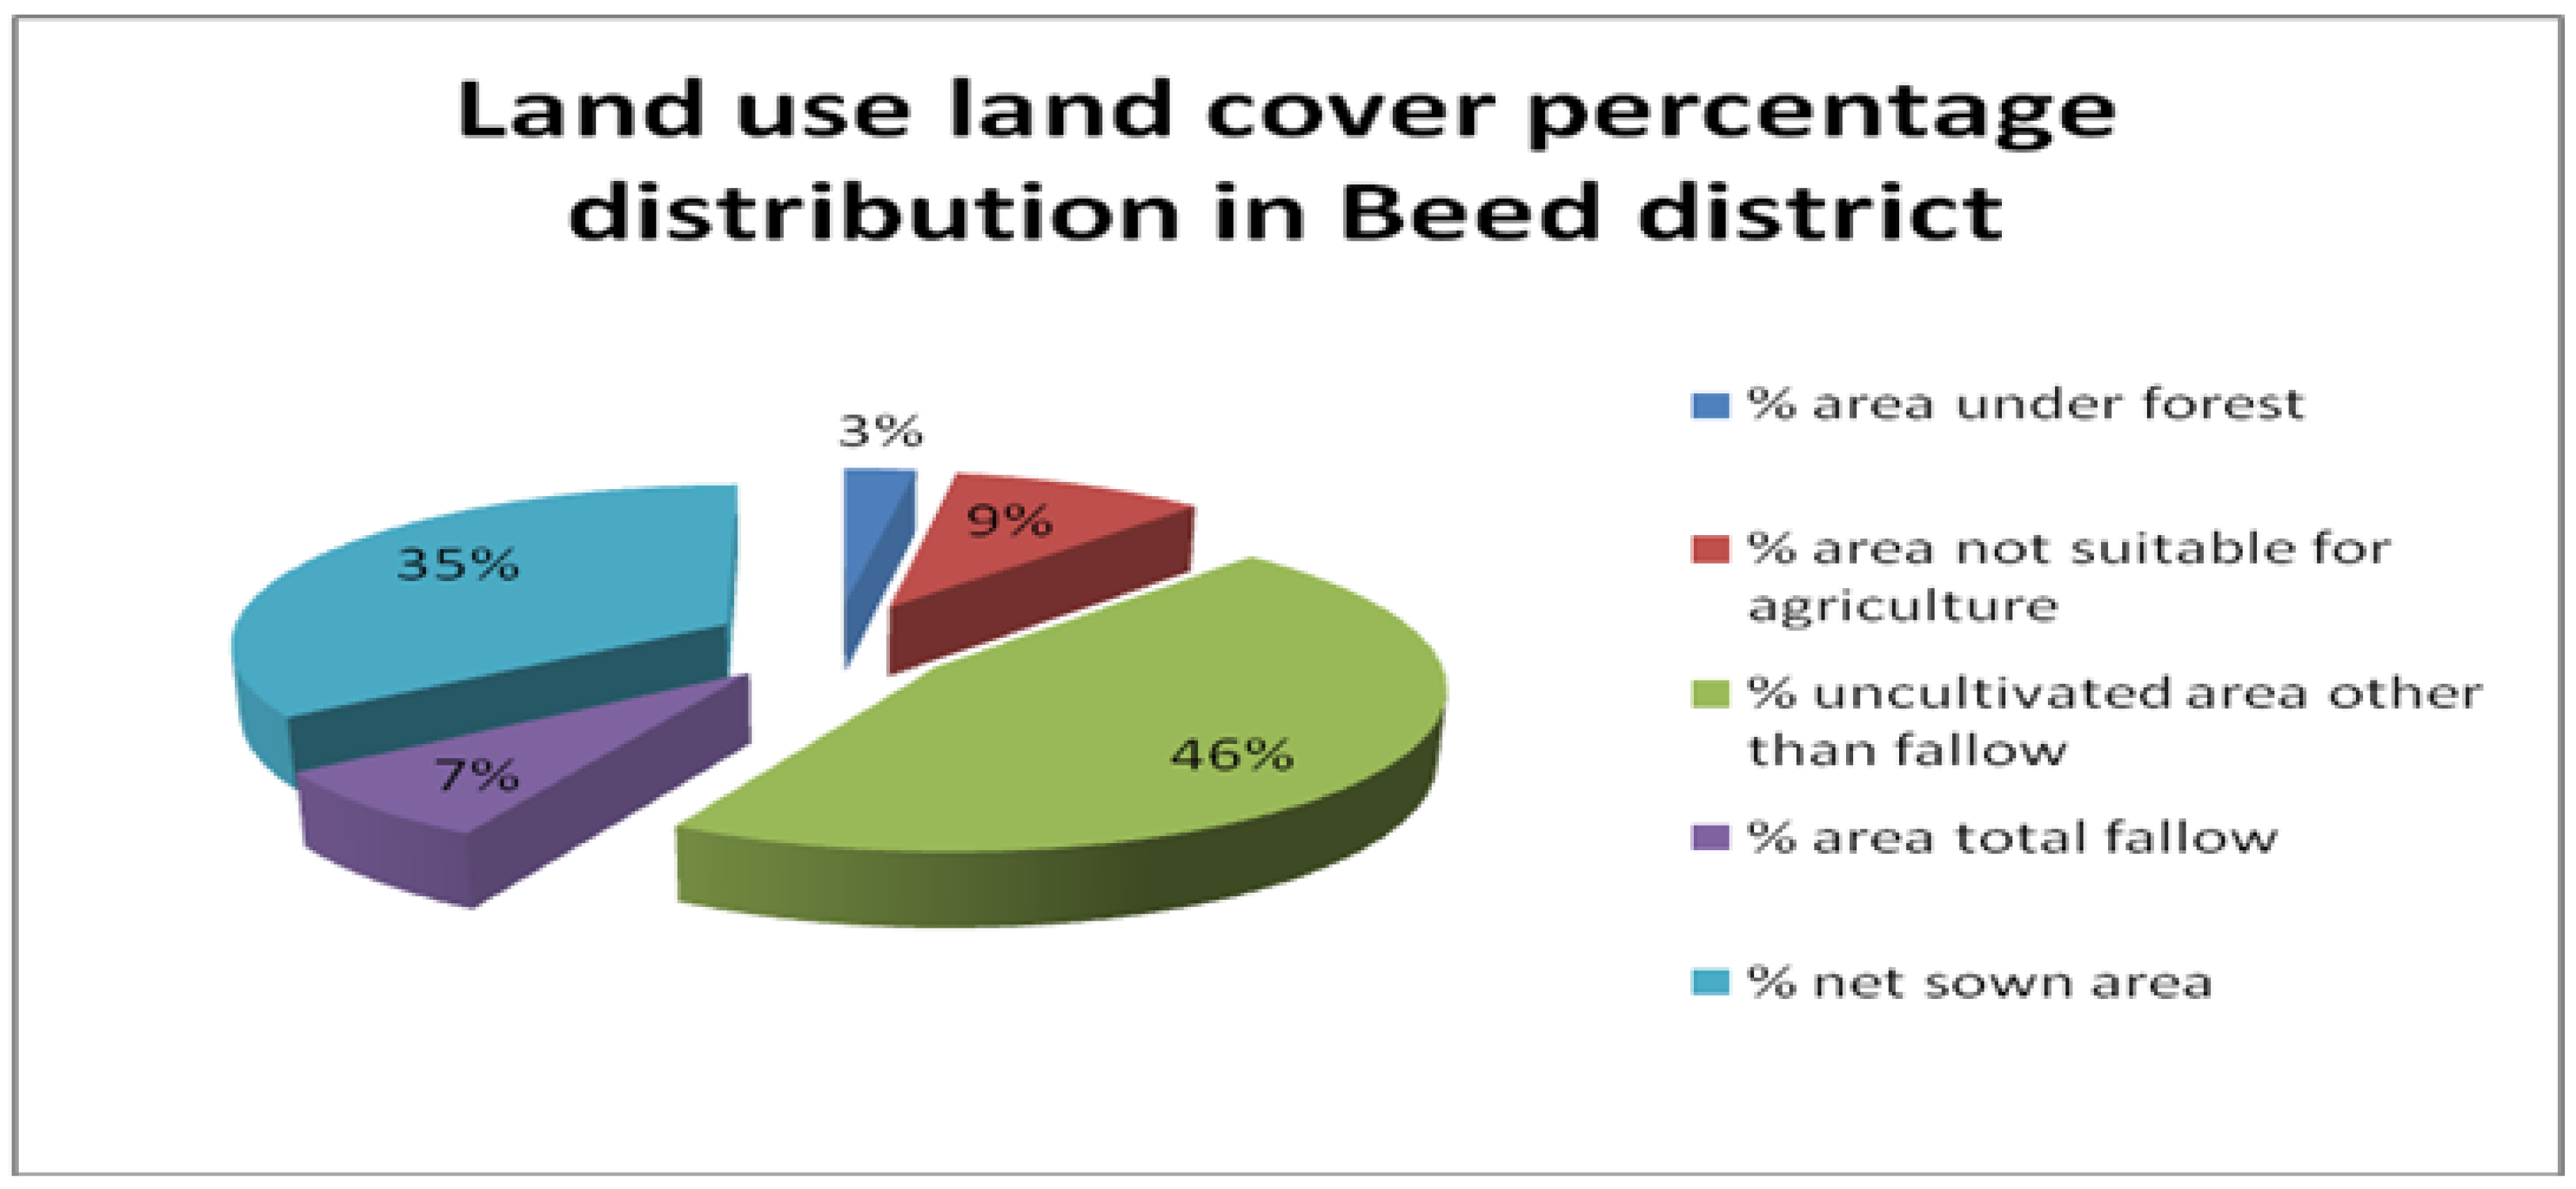
Table 2.
Taluka wise land use land cover percentage of different crops in Beed district.
| Taluka | Land use land cover status in defferent crops (in %) | |||||||
|---|---|---|---|---|---|---|---|---|
| Cereasls | Pulses | Oil seeds | Fruits & vegetables | Sugarcane | Cotton | Food crops | Non food crops | |
| Ashti | 34 | 2 | 1 | 1 | 0 | 7 | 62 | 38 |
| Patoda | 18 | 15 | 0 | 0 | 4 | 13 | 63 | 37 |
| Shirur | 36 | 27 | 1 | 0 | 2 | 22 | 33 | 67 |
| Gevrai | 13 | 12 | 6 | 5 | 7 | 14 | 58 | 42 |
| Majalgaon | 53 | 7 | 13 | 1 | 6 | 15 | 20 | 80 |
| Wadwani | 20 | 8 | 7 | 24 | 11 | 13 | 28 | 72 |
| Beed | 60 | 16 | 5 | 8 | 5 | 5 | 6 | 94 |
| Kej | 2 | 6 | 39 | 2 | 2 | 33 | 48 | 52 |
| Dharur | 22 | 45 | 13 | 7 | 3 | 6 | 10 | 90 |
| Parli | 6 | 4 | 14 | 5 | 13 | 57 | 58 | 42 |
| Ambajogai | 21 | 22 | 27 | 5 | 6 | 2 | 19 | 81 |
| District Total | 25 | 13 | 12 | 3 | 5 | 19 | 42 | 58 |
Taluka wise land use land cover scenario of differet crops in Beed district:
In Beed district, about 42 and 58 pecent area occupied by food and non food crops respectiely which includes cereals (25%), cotton (19%), pulses (13%), oilseed (12%), sugarcane (5%) and fruits and vegetables(3%). taluka-wise analysis showed that the highest area under food crops (63%) found in Patoda taluka followed by Ashti(62%), Gevrai (58%) Parli (58%), and Kej (48%). Cereals are the major crops of most of the talukas (Beed 60%, Majalgaon 53%, Shirur 36% and Ashti 34%) followed by cotton (Parli 57%, Kej 33% and Shirur 22%), pulses (Dhrur 45%, Shiur 27%, Ambeogai 22% and Beed 16%) and oilseed (Kej 39%, Ambejogai 27% and Parli 14%). Good amount of area found in fruits and vegetables in Wadwani (24%), Beed (8%) and Dharur (7%). Area under sugarcane in Parli (13%) and Wadwani (11%) talukas of Beed district also found .
Table 3.
Taluka wise crops combination and variance value results of Weaver’s method in Beed district.
Table 3.
Taluka wise crops combination and variance value results of Weaver’s method in Beed district.
| Crop combination | Ashti | Ambejogai | Beed | Dharur | Gevrai | Kaij | Majalgaon | Parli | Patoda | Shirur | Wadwani |
|---|---|---|---|---|---|---|---|---|---|---|---|
| Monoculture | 5768 | 9484 | 6609 | 9100 | 9583 | 9134 | 9171 | 9562 | 7635 | 5307 | 9632 |
| Two crops | 1159 | 2247 | 582 | 2130 | 2331 | 2238 | 1106 | 2129 | 1822 | 1389 | 2306 |
| Three crops | 449* | 2174 | 531 | 1883 | 2254 | 944 | 1110 | 2078 | 1699 | 1229 | 2178 |
| Four crops | 481 | 422 | 304 | 402 | 480 | 1521 | 373 | 506 | 332 | 326 | 430 |
| Five crops | 260 | 224 | 238 | 281 | 272 | 291 | 316 | 214 | 218 | 260 | |
| Six crops | 161 | 185 | 173 | 163 | 207 | 239 | 176 | 139 | 156 | 156 | |
| Seven crops | 98 | 158 | 142 | 102 | 196* | 199 | 124 | 80* | 116 | 90 | |
| Eight crops | 68 | 143 | 121 | 73 | 321 | 163 | 321 | 363 | 82 | 69 | |
| Nine crops | 47 | 124 | 107 | 47 | 137 | 289 | 77 | 56 | |||
| Ten crops | 32 | 116 | 97 | 38 | 125 | 264 | 74* | 38 | |||
| Eleven crops | 23 | 103 | 86 | 29* | 115 | 38* | 117 | 21 | |||
| Twelve crops | 20 | 101 | 82 | 228 | 106 | 227 | 21 | ||||
| Thirteen crops | 23 | 94 | 75 | 99* | 406 | 18 | |||||
| Fourteen crops | 21 | 87 | 69 | 102 | 16 | ||||||
| Fifteen crops | 20 | 81 | 64 | 15 | |||||||
| Sixteen crops | 19 | 76* | 60 | 14* | |||||||
| Seventeen crops | 17* | 58 | 41 | ||||||||
| Eighteen crops | 24 | 55* | |||||||||
| Ranking# | XI | II | VII | V | III | X | IX | IV | VIII | VI | I |
*Lowest variance value indicates the accurate crop combination in particular taluka. #Ranks given to eleven talukas on the basis of lower to greater variance values taluka wise within the lowest variance values.
Taluka wise crops combination and variance value results of Weaver’s method
Results of well accepted Weaver’s method compiled in table 3 showed that the Wadwani taluka demarcated as most diversified taluka by means of maximum number (16 crops) of crops combinations with the lowest variance value (14) followed by Ambejogai (variance value 17) with seventeen crops combinations, Gevrai (variance value 29) with eleven crops combinations, Parli (variance value 38) with eleven crops combinations, Dharur (variance value 55) with eighteen crops combinations, Shirur (variance value 74) with ten crops combinations, Beed (variance value 76) with sixteen crops combinations, Patoda (variance value 80) with seven crops combinations, Majalgaon (variance value 99) with thirteen crops combinations and Kaij (variance value 196) with seven crops combinations found suitable and accurate groups of crops. Whereas, Ashti taluka found most suitable for three crops combinations with variance value 449. These values indicated the high crop diversification in selected talukas. After that the values may not be uniform or found as increasing trend. Accordingly ranks also have been given to the talukas as per the accurate crop combination and on the basis of lower to greater variance values taluka wise.
Table 4.
Taluka wise suitable crops and diversity ranking results of Weaver’s method in Beed district.
Table 4.
Taluka wise suitable crops and diversity ranking results of Weaver’s method in Beed district.
| Crops combination | No. of talukas | Name of talukas | Suitable important crops of taluka | Diversity ranking≈ |
|---|---|---|---|---|
| Three crops | 1 | Ashti | Jowar, Bajri, Cotton | VIII |
| Seven crops | 2 | Kaij | Pigeon pea, blackgram, sugarcane, cotton, groundnut, sunflower, soybean | VII |
| Patoda | Jowar, Bajri, other cereals, black gram, other pulses, sugarcane, cotton | VII | ||
| Ten crops | 1 | Shirur | Jowar, Bajri, other cereals, gram, pigeon pea, moong, black gram, other pulses, cotton, sugarcane | VI |
| Eleven crops | 2 | Parli, | Jowar, soybean, maize, gram, pigeon pea, sugarcane, other fruits, cotton, groundnut, sunflower, safflower | V |
| Gevrai | Wheat, Jowar, Bajri, Maize, pigeon pea, moong, sugarcane, citrus fruits, cotton groundnut, safflower | V | ||
| Thirteen crops | 1 | Majalgaon | Wheat, jowar, bajri, gram, pigeon pea, moong, other pulses, sugarcane, cotton, groundnut, sunflower, safflower, soybean | IV |
| Sixteen crops | 2 | Beed | Wheat, jowar, bajri, maize, gram, moong, blackgram, bengalgram, sugarcane, mango, other fruits, onion, other vegetables, cotton soybean | III |
| Wadwani | Rice, wheat, jowar, bajri, maize, gram, sugarcane, other fruits, potato, brinjal, tomato, other vegetables, cotton, groundnut, soybean, other oil seeds | III | ||
| Seventeen crops | 1 | Ambejogai | Rice, wheat, jowar, bajri, maize, gram, pigeon pea, moong, blackgram, sugarcane, other vegetables, cotton, soybean, sunflower, safflower, groundnut, oter oilseeds | II |
| Eighteen crops | 1 | Dharur | Wheat, jowar, bajri, maize, gram, pigeonpea, moong, blackgram, sugarcane, other spices, other fruits, onion, other vegetables, cotton groundnut, soybean, other oilseeds, other non eatable crops | I |
≈ Diversity ranking given taluka wise on the basis of maximum to minimum number of crop combinations occurred in different talukas.
Taluka wise crop suitability and diversity ranking results of Weaver’s method:
Results presented in table 4 revealed that the high crop diversity found in Dharur taluka with eighteen crop combinations. So that first rank given to the taluka. Seventeen crops combinations found suitable in Ambejogai and second rank has been given as per the crop diversification in the taluka. Beed and Wadwani talukas found appropriate for sixteen crops, Majalgaon fitted for thirteen crops, Gevrai and Parli suitable for eleven crops, Shirur suitable for ten crop combinations, Patoda and Kaij found suitable for seven crops and Ashti taluka found suitable for three crop combinations. As per the maximum to minimum number of crop combinations occurred in different talukas, ranks have been given to the talukas in Beed district.
Conclusions:
Exploration of taluka-wise agricultural land use land cover and crop combination in Beed district of Maharashtra state, India is the indispensable attempt carried out by the authors since agricultural land use analysis is essential for solving and optimizing the land use problem, maintaining socio-ecological balance, best utilization of scarce resources, finding the consumption pattern, health and nutritional status and market sustainability. Results of well-known Weaver’s technique highlighted in paper indicates that how land use patterns of different talukas showed the various levels of crop diversification by means of number of crops combinations with the lowest variance values in certain area or in a given piece of land. These values designated to the high crop diversification to low crop diversification in selected talukas. As per the maximum to minimum number of crop combinations occurred in different talukas, ranks have been given to the talukas in Beed district. Taluka wise ranking in accordance with the accurate crop combination and lower to greater variance values revealed the conversions in land use and cropping patterns in the study area. In this way, the authors enlightened that the rational use of agricultural land has important for food security and biodiversity which increase the productivity and profitability of the agriculture sector and it indicates the decision making ability of farmers in study area.
References
- Bhattacharyya, R., Ghosh, B., Mishra, P., Mandal, B., Rao, C., Sarkar, D., Das, K., Anil, K., Lalitha, M., Hati, K., & Franzluebbers, A. (2015). Soil degradation in India: Challenges and potential solutions. Sustainability, 7(4), 3528– 3570. [CrossRef]
- FAO (2017). FAOSTAT: Food and agricultural data. Retrieved September 25, 2017, from http://www.fao.org/faostat/en/#home.
- Figueiredo J, Pereira HM. Regime shifts in a socio-ecological model of farmland abandonment. Landscape Ecology 2011; 26: 737-749. [CrossRef]
- Gerlak AK. Policy interactions in human-landscape systems. Environmental Management 2014; 53(1): 67-75. [CrossRef]
- India economic survey 2018: Farmers gain as agriculture mechanization speeds up, but more R&D needed". The Financial Express. 29 January 2018. Retrieved 18 December, 2020.
- J. P. Lesschen, P. H. Verburg, S. J. Staal. (2005) Statistical methods for analyzing the spatial dimension of changes in land use and farming systems. The International Livestock Research Institute, Nairobi, Kenya and LUCC Focus 3 office, Wageningen University, Netherlands, 2005.
- Radoslava Kanianska (July 27th 2016). Agriculture and Its Impact on Land-Use, Environment, and Ecosystem Services, Landscape Ecology - The Influences of Land Use and Anthropogenic Impacts of Landscape Creation, Amjad Almusaed, IntechOpen. Available from: https://www.intechopen.com/books/landscape-ecology-the-influences-of-land-use-and-anthropogenic-impacts-of-landscape-creation/agriculture-and-its-impact-on-land-use-environment-and-ecosystem-services#B14. [CrossRef]
- Roy, P., Roy, A., Joshi, P., Kale, M., Srivastava, V., Srivastava, S., Dwevidi, R., Joshi, C., Behera, M., Meiyappan, P., Sharma, Y., Jain, A., Singh, J., Palchowdhuri, Y., Ramachandran, R., Pinjarla, B., Chakravarthi, V., Babu, N., Gowsalya, M., Thiruvengadam, P., Kotteeswaran, M., Priya, V., Yelishetty, K., Maithani, S., Talukdar, G., Mondal, I., Rajan, K., Narendra, P., Biswal, S., Chakraborty, A., Padalia, H., Chavan, M., Pardeshi, S., Chaudhari, S., Anand, A., Vyas, A., Reddy, M., Ramalingam, M., Manonmani, R., Behera, P., Das, P., Tripathi, P., Matin, S., Khan, M., Tripathi, O., Deka, J., Kumar, P., & Kushwaha, D. (2015). Development of Decadal (1985–1995–2005) Land use and land cover database for India. Remote Sensing, 7(3), 2401– 2430. [CrossRef]
- Rudel TK. Tree farms: driving forces and regional patterns in the global expansion of forest plantations. Land Use Policy 2009; 26(3): 545-550. [CrossRef]
- Sunatkar, S. V. (2016) Agriculture land use pattern in Gadchiroli district. International Journal of Social Science & Interdisciplinary Research, Vol. 5 (4), April (2016), pp. 85-90. Online available at indianresearchjournals.com.
- Teluguntla, P. G., Thenkabail, P. S., Xiong, J. N., Gumma, M. K., Giri, C., Milesi, C., et al. (2015). Global Cropland Area Database (GCAD) derived from remote sensing in support of food security in the twenty-first century: Current achievements and future possibilities. In P. S. Thenkabail (Ed.), Remote sensing handbook. Volume II, Land resources monitoring, modeling, and mapping with remote sensing (Chap. 7, p. 849), Chapter 7. Boca Raton: CRC Press.
- Tian, H., Banger, K., Bo, T., & Dadhwal, V. K. (2014). History of land use in India during 1880-2010: Large-scale land transformations reconstructed from satellite data and historical archives. Global and Planetary Change, 121, 78– 88. [CrossRef]
- UN-Pop (2017). World Population Prospects: The 2017 Revision, Online Demographic Profiles. Retrieved November 26, 2018, from https://population.un.org/wpp/Graphs/DemographicProfiles/.
- Upendra V. Dhonde, Ground water information Beed district Maharashtra, Government of India, Ministry of water resources, Central ground water board, Central region Nagpur 2014, pp 1-16 http://cgwb.gov.in/District_Profile/Maharashtra/Beed.pdf.
- Zhang J, Niu J, Buyantuev A, Wu J. A multilevel analysis of effects of land use policy on land-cover change and local land use decisions. Journal of Arid Environments 2014; 108: 19-28. [CrossRef]
Figure 1.
Location map of Beed district of Maharashtra state in India.
Disclaimer/Publisher’s Note: The statements, opinions and data contained in all publications are solely those of the individual author(s) and contributor(s) and not of MDPI and/or the editor(s). MDPI and/or the editor(s) disclaim responsibility for any injury to people or property resulting from any ideas, methods, instructions or products referred to in the content. |
© 2024 by the authors. Licensee MDPI, Basel, Switzerland. This article is an open access article distributed under the terms and conditions of the Creative Commons Attribution (CC BY) license (http://creativecommons.org/licenses/by/4.0/).
Copyright: This open access article is published under a Creative Commons CC BY 4.0 license, which permit the free download, distribution, and reuse, provided that the author and preprint are cited in any reuse.


