Submitted:
23 April 2024
Posted:
25 April 2024
You are already at the latest version
Abstract
Density is a crucial parameter for quantitatively describing the physical properties of liquids. It serves as an important indicator for scientific research, production process control, pipeline transportation, and other aspects. In oil pipeline transportation and raw material processing, real-time online measurement of liquid density is of great significance. This paper analyzes the working principle of an on-line vibrating tube densitometer and derives the fitting equation for temperature, pressure, and density;it also conducts experiments with an on-line vibrating tube liquid densitometer and establishes a traceability chain for the experimental device. The experimental setup includes a desktop densitometer system, a multi-temperature field constant temperature stirring system, a walk-in constant temperature box, an automatic blowing system, and a frequency acquisition and calculation system. The uncertainty of the device's evaluation is U= 0.08kg/m3, k=2.The experimental research on the on-line vibrating tube liquid densitometer can be carried out within the range of (650~1400) kg/m3, (10~70)℃, (0~50)bar the metrological performance of the vibrating tube densitometer can be researched by utilizing the straight tube type and the elbow type on-line vibrating tube densitometer. A preliminary study was conducted on the effects of different densities, temperatures, and pressures on the vibrating tube system's vibration cycle. The fit coefficient and error were calculated, and the experimental results were compared to the theoretical analysis to confirm the device's conformity. The study verified the device's scientific and reasonable design, and demonstrated that it is feasible to use the device for follow-up research.
Keywords:
online vibrating tube liquid densitometer
; theoretical analysis
; experimental setup
; temperature
; pressure
1. Introduction
Fluid density is a crucial physical parameter in the process of fluid pipeline transportation. Online measurement of its density can be obtained through its coefficient of thermal expansion, compression coefficient, and other indicators, ensuring the normal transportation of liquids. [1]. For the measurement of liquid density there are two main methods: one is the use of density formula for direct measurement, this type of method generally need to be measured samples to be brought back to the laboratory offline measurement is completed, so the offline measurement of low timeliness, subject to the human factor is greater, can not meet the needs of the measurement of modern pipeline
Transportation. The other is based on the physical properties of fluids and the relationship between certain physical quantities generated by the indirect method of measurement, to achieve the online density of fluid real-time measurement, this method is generally known as online fluid density measurement [2,3]. Dynamic online measurement of fluid density, high measurement accuracy, good timeliness, wide range of applications.
Based on the working principle of on-line vibrating tube liquid densitometer, in order to get the accurate calculation error in practical application, it is necessary to use reasonable experimental equipment to carry out scientific calibration experiments on the on-line vibrating tube liquid densitometer to get the accurate equation coefficients in different temperature bands and pressure ranges, and then to calculate the on-line density of the measured liquid in practical use.
2. Study on the Working Principle of On-Line Vibrating Tube Liquid Densitometer
2.1. Working Principle of On-Line Vibrating Tube Liquid Densitometer
Vibrating tube liquid density meter according to the number and shape of the vibrating tube can be divided into a single straight tube type, double straight tube type, multi-straight tube type, U-type vibrating tube, regardless of the kind of online vibrating tube liquid density meter, the working principle is the same [3,4]. Vibration tube material and size of a certain amount of its intrinsic vibration frequency and mode is a certain, when the fluid into the vibration tube, the total mass of liquid so that the vibration changes, the fluid will vibrate with the vibration tube vibration and vibration, the vibration tube of the intrinsic vibration frequency will be vibration tube with the change in the quality of the change, due to the vibration of the tube volume is fixed, through the vibration frequency can be measured by the vibration of the change in the density of fluid in the tube [4,5].
Figure 1.
Working principle of on-line vibrating tube liquid densitometer.
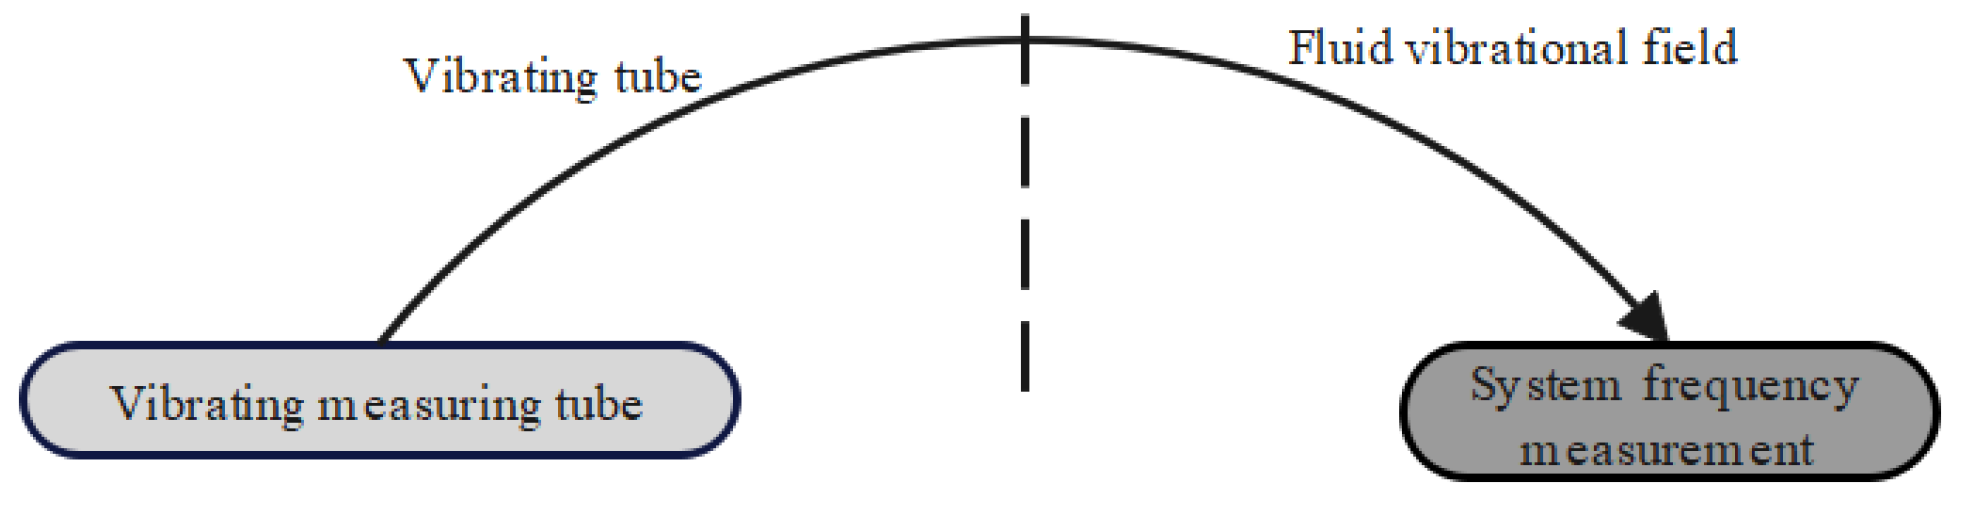
Figure 2.
Structure of a single straight tube type vibrating tube densitometer. 1. Flange; 2. Bellows; 3. Vibrating tube; 4 Fluid flow; 5. Protective shell; 6. Temperature sensor; 7. Pressure sensor; 8. Shaker.
Figure 2.
Structure of a single straight tube type vibrating tube densitometer. 1. Flange; 2. Bellows; 3. Vibrating tube; 4 Fluid flow; 5. Protective shell; 6. Temperature sensor; 7. Pressure sensor; 8. Shaker.
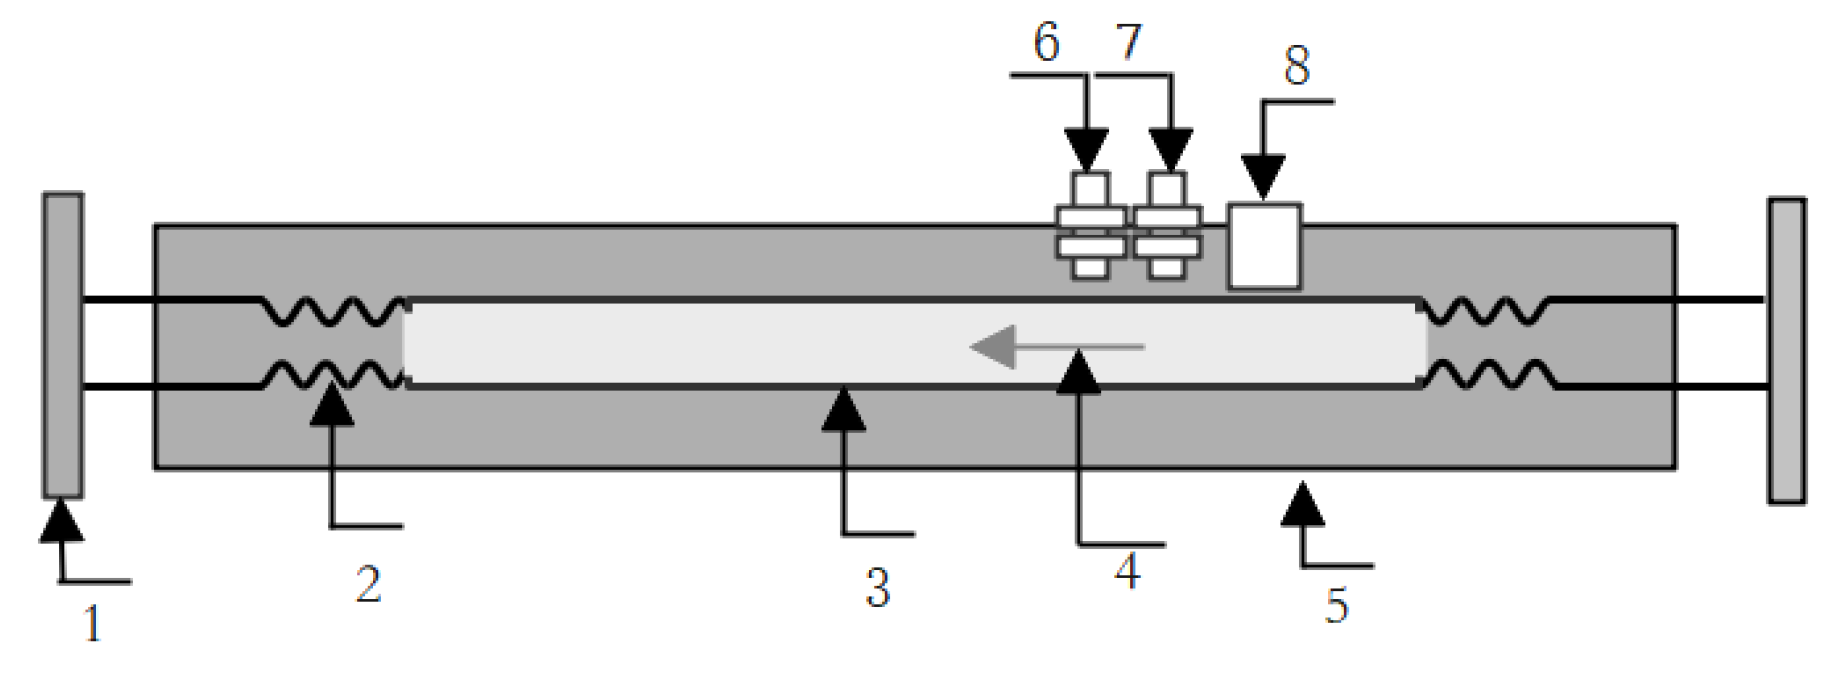
When the vibrating tube works, the vibration is performed by free vibration, according to the composition and working principle of the vibrating tube, the vibrating tube can be regarded as a spring-damping-mass system [5]. When no fluid passes through the vibrating tube, the vibrating tube vibrates at the natural frequency, and the vibration period can be measured by the sensor. When the fluid flows through the vibrating tube, the mass and stiffness of the vibrating system will change, and the intrinsic frequency of the vibrating tube system will change, and the frequency-density system equation of the vibrating tube system can be obtained after appropriate compensation and correction [5,6]. According to the principle of elastic mechanics, the two ends of the fixed spring support vibration tube system transverse parallel vibration of the intrinsic angular frequency can be expressed as [7,8].
From (1) can be seen in the vibration tube system spring modulus of elasticity k is a constant, and its natural frequency changes only with the system mass M, vibration tube material and volume is certain, so the quality of the fluid is determined only by the density of the fluid, that is, changes in fluid density changes in the natural frequency of the vibration tube system. Vibration tube vacuum state resonance angular frequency can be used (2) expressed as follows.
At room temperature and pressure, the air mass inside the vibrating tube is much smaller than the mass of the vibrating tube, so the air mass inside the tube can be ignored [9]. when calculating the mass of the empty tube in practice, and the resonant angular frequency under the empty tube state can also be expressed as (2). When the vibration tube has the fluid through the vibration tube system resonance angular frequency can be expressed as:
The combination of equations (2), (3)
For the flow through the vibration tube of the liquid density (kg/m3); for the vibration tube material density(kg/m3), vibration tube material volume is certain, the vibration tube density and intrinsic frequency for a constant.
Equation (5) is a mathematical model of density versus frequency obtained under ideal conditions. In practical applications, the relationship between density and frequency of vibrating tube vibration under ideal conditions is:
T is the vibrating tube vibrating tube vibration period(us), K0, K1, K2 is a constant. Due to the complexity of the actual working environment, the actual work can not be directly calculated theoretically K0, K1,K2 need to be experimentally calibrated, through different liquid density and frequency fitting calculation of the above three coefficients [9,10].
2.2. Effect of Temperature Variation on Measurement Results
(6) Eq is the density-frequency fitting equation under ideal conditions, and the temperature is not constant in practical applications. Changes in temperature, which affect the structure, material properties and density characteristics of the vibrating tube, will affect the intrinsic frequency of the vibrating tube itself and the measured frequency signal will deviate from the actual value, so the system needs to be corrected for the temperature of the vibrating tube densitometer being experimented with.
2.3. Pressure Effects on Measurement Results
Online vibrating tube densitometer in the actual online measurement, the use of the environment is more complex, in the actual use of the vibrating tube system is not only affected by inertial force is also affected by the impact of the liquid force. The interaction of these forces and the family force caused by unnecessary deformation of the vibrating tube, thus affecting the vibration of the tube system, the change in the intrinsic frequency of the system.
The correction for the effect of pressure on the on-line vibrating tube liquid densitometer is made by measuring the vibration period Tp and the density of the liquid in the pressurized state condition of the tube and inserting them into the fitted equation (8)[10]. The density value and compression factor F of the liquid at standard pressure are obtained from the table, and the actual density values at different pressures are calculated as follows [10]:
3. Research and Development of the Experimental Setup
3.1. Establishing the Traceability Chain
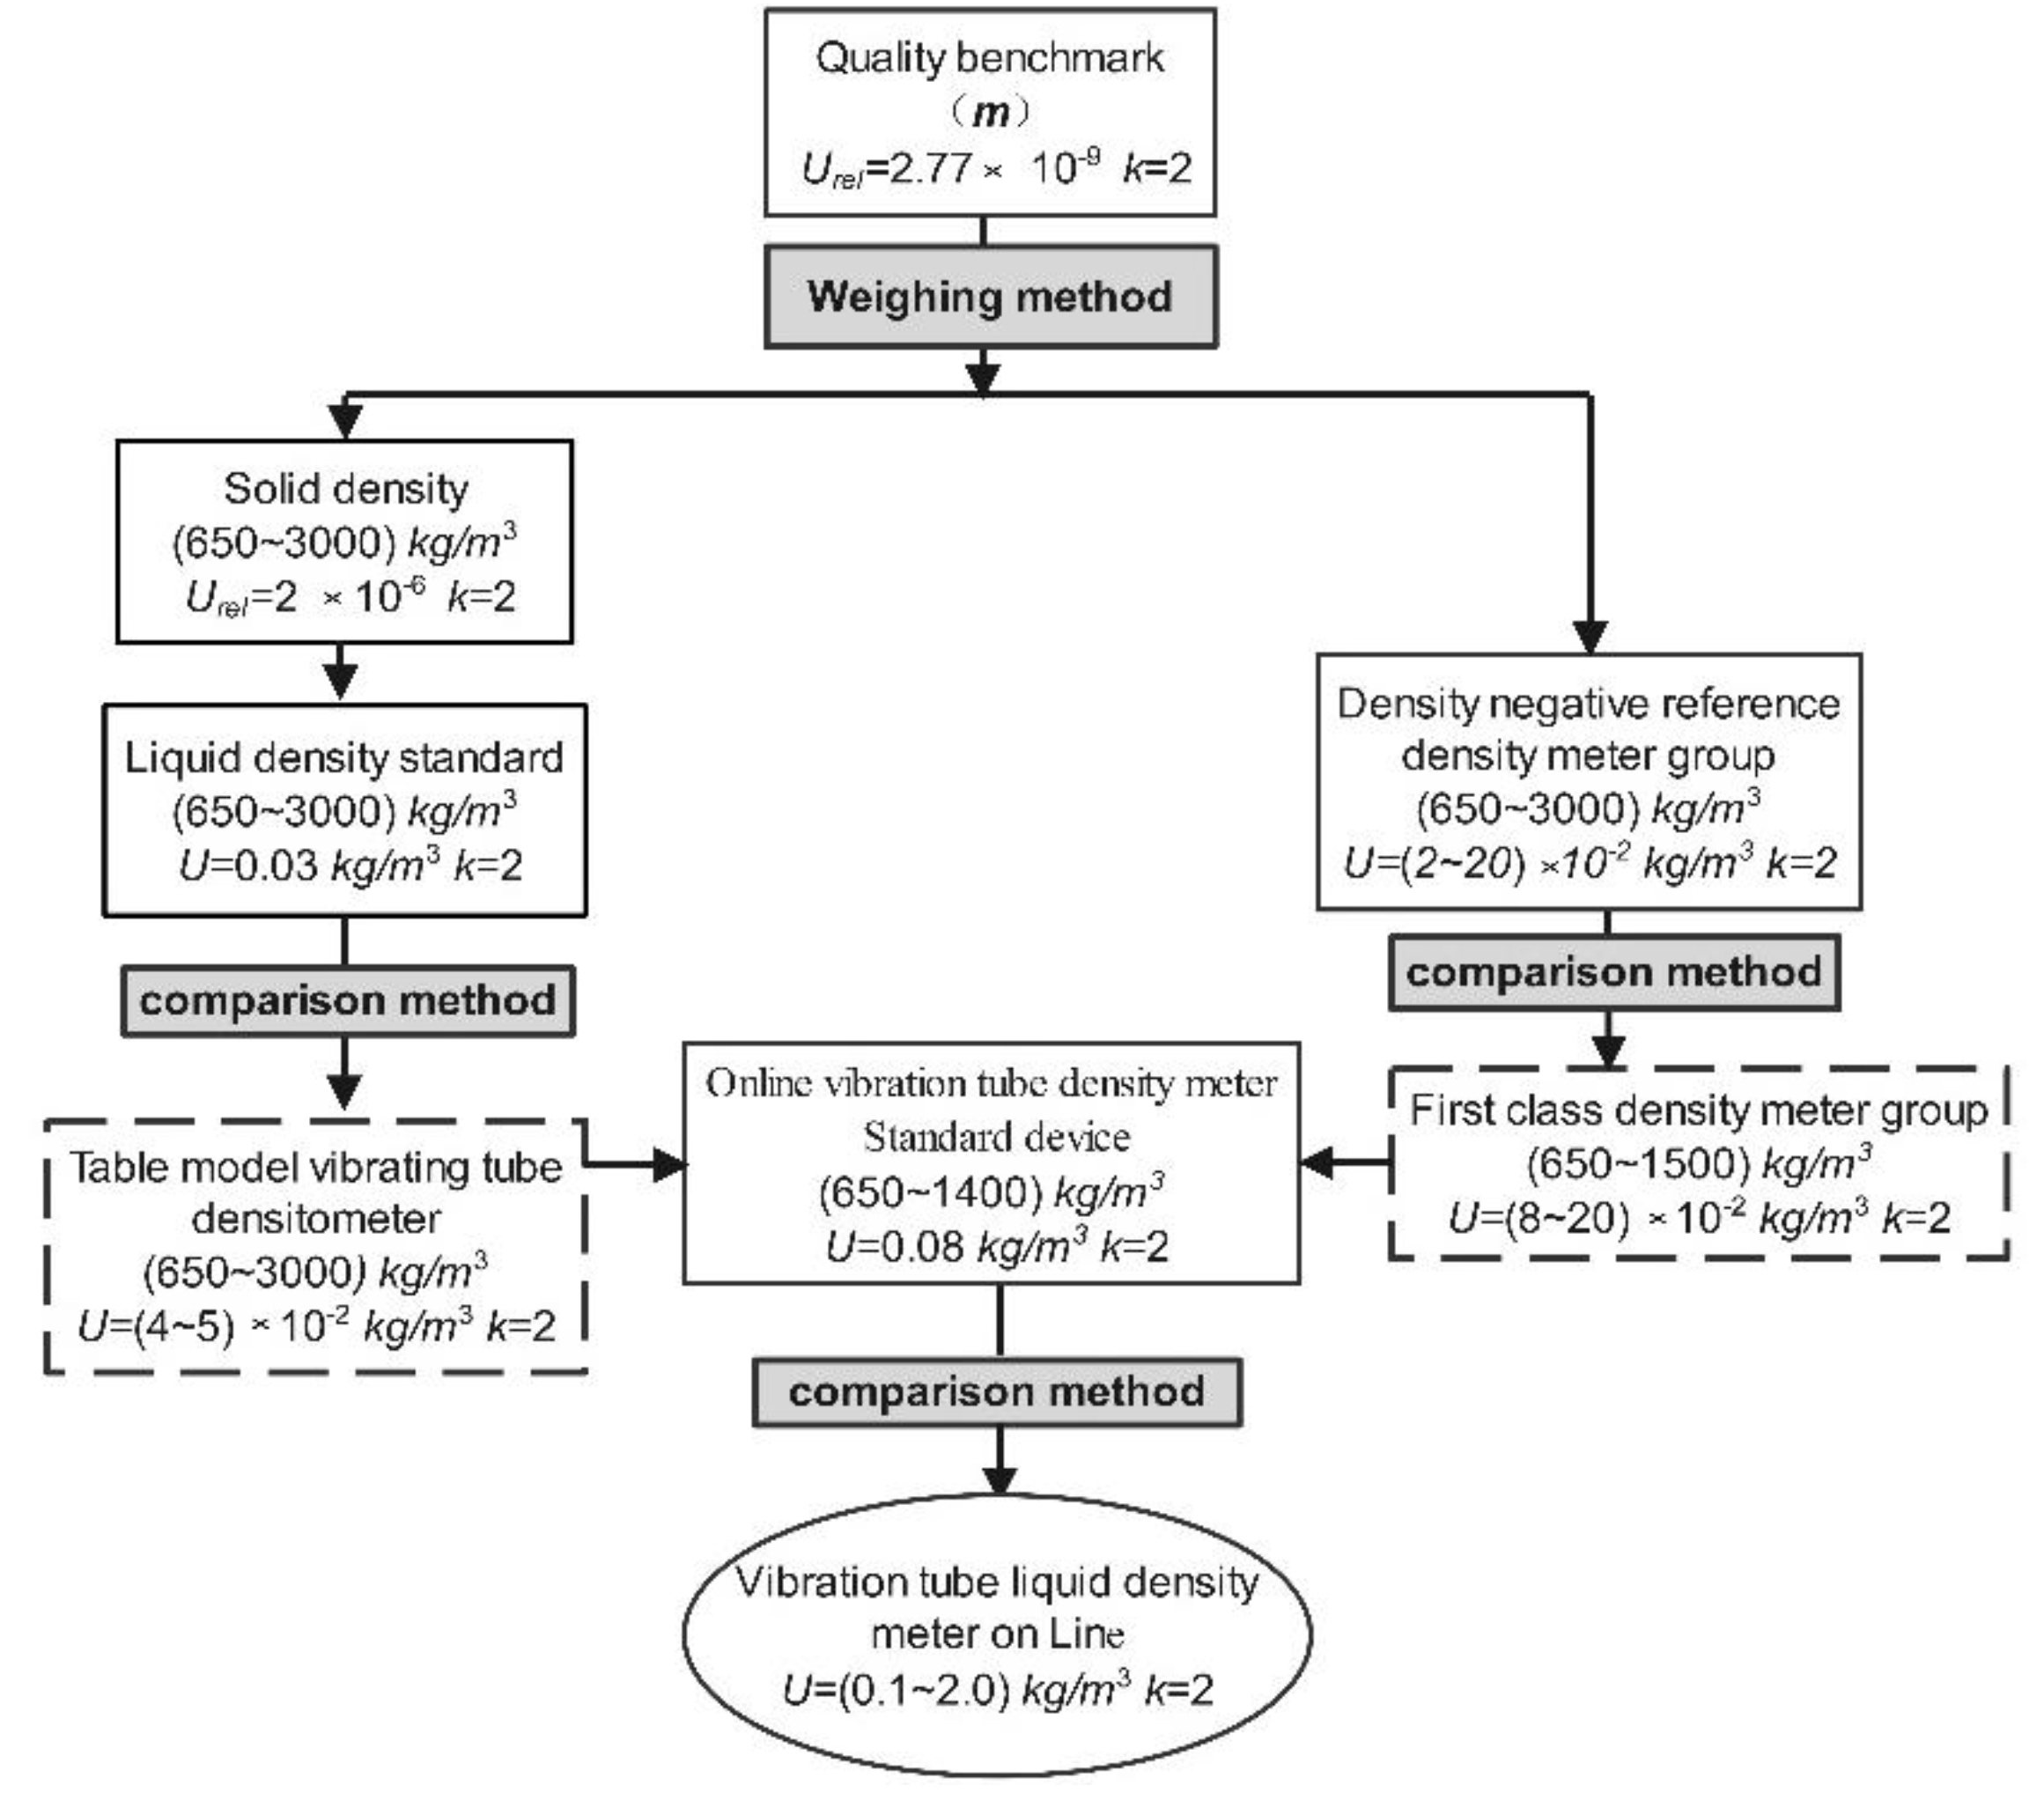
If you want to obtain scientific, accurate, and peer-reviewed experimental data, the parameters of the instrument and the basis of construction must have a complete and accurate traceability chain to ensure that each parameter can be traced directly or indirectly to international units.
Figure 3.
Traceability chain for on-line vibrating tube density measurements.
3.2. Device Composition and Structure
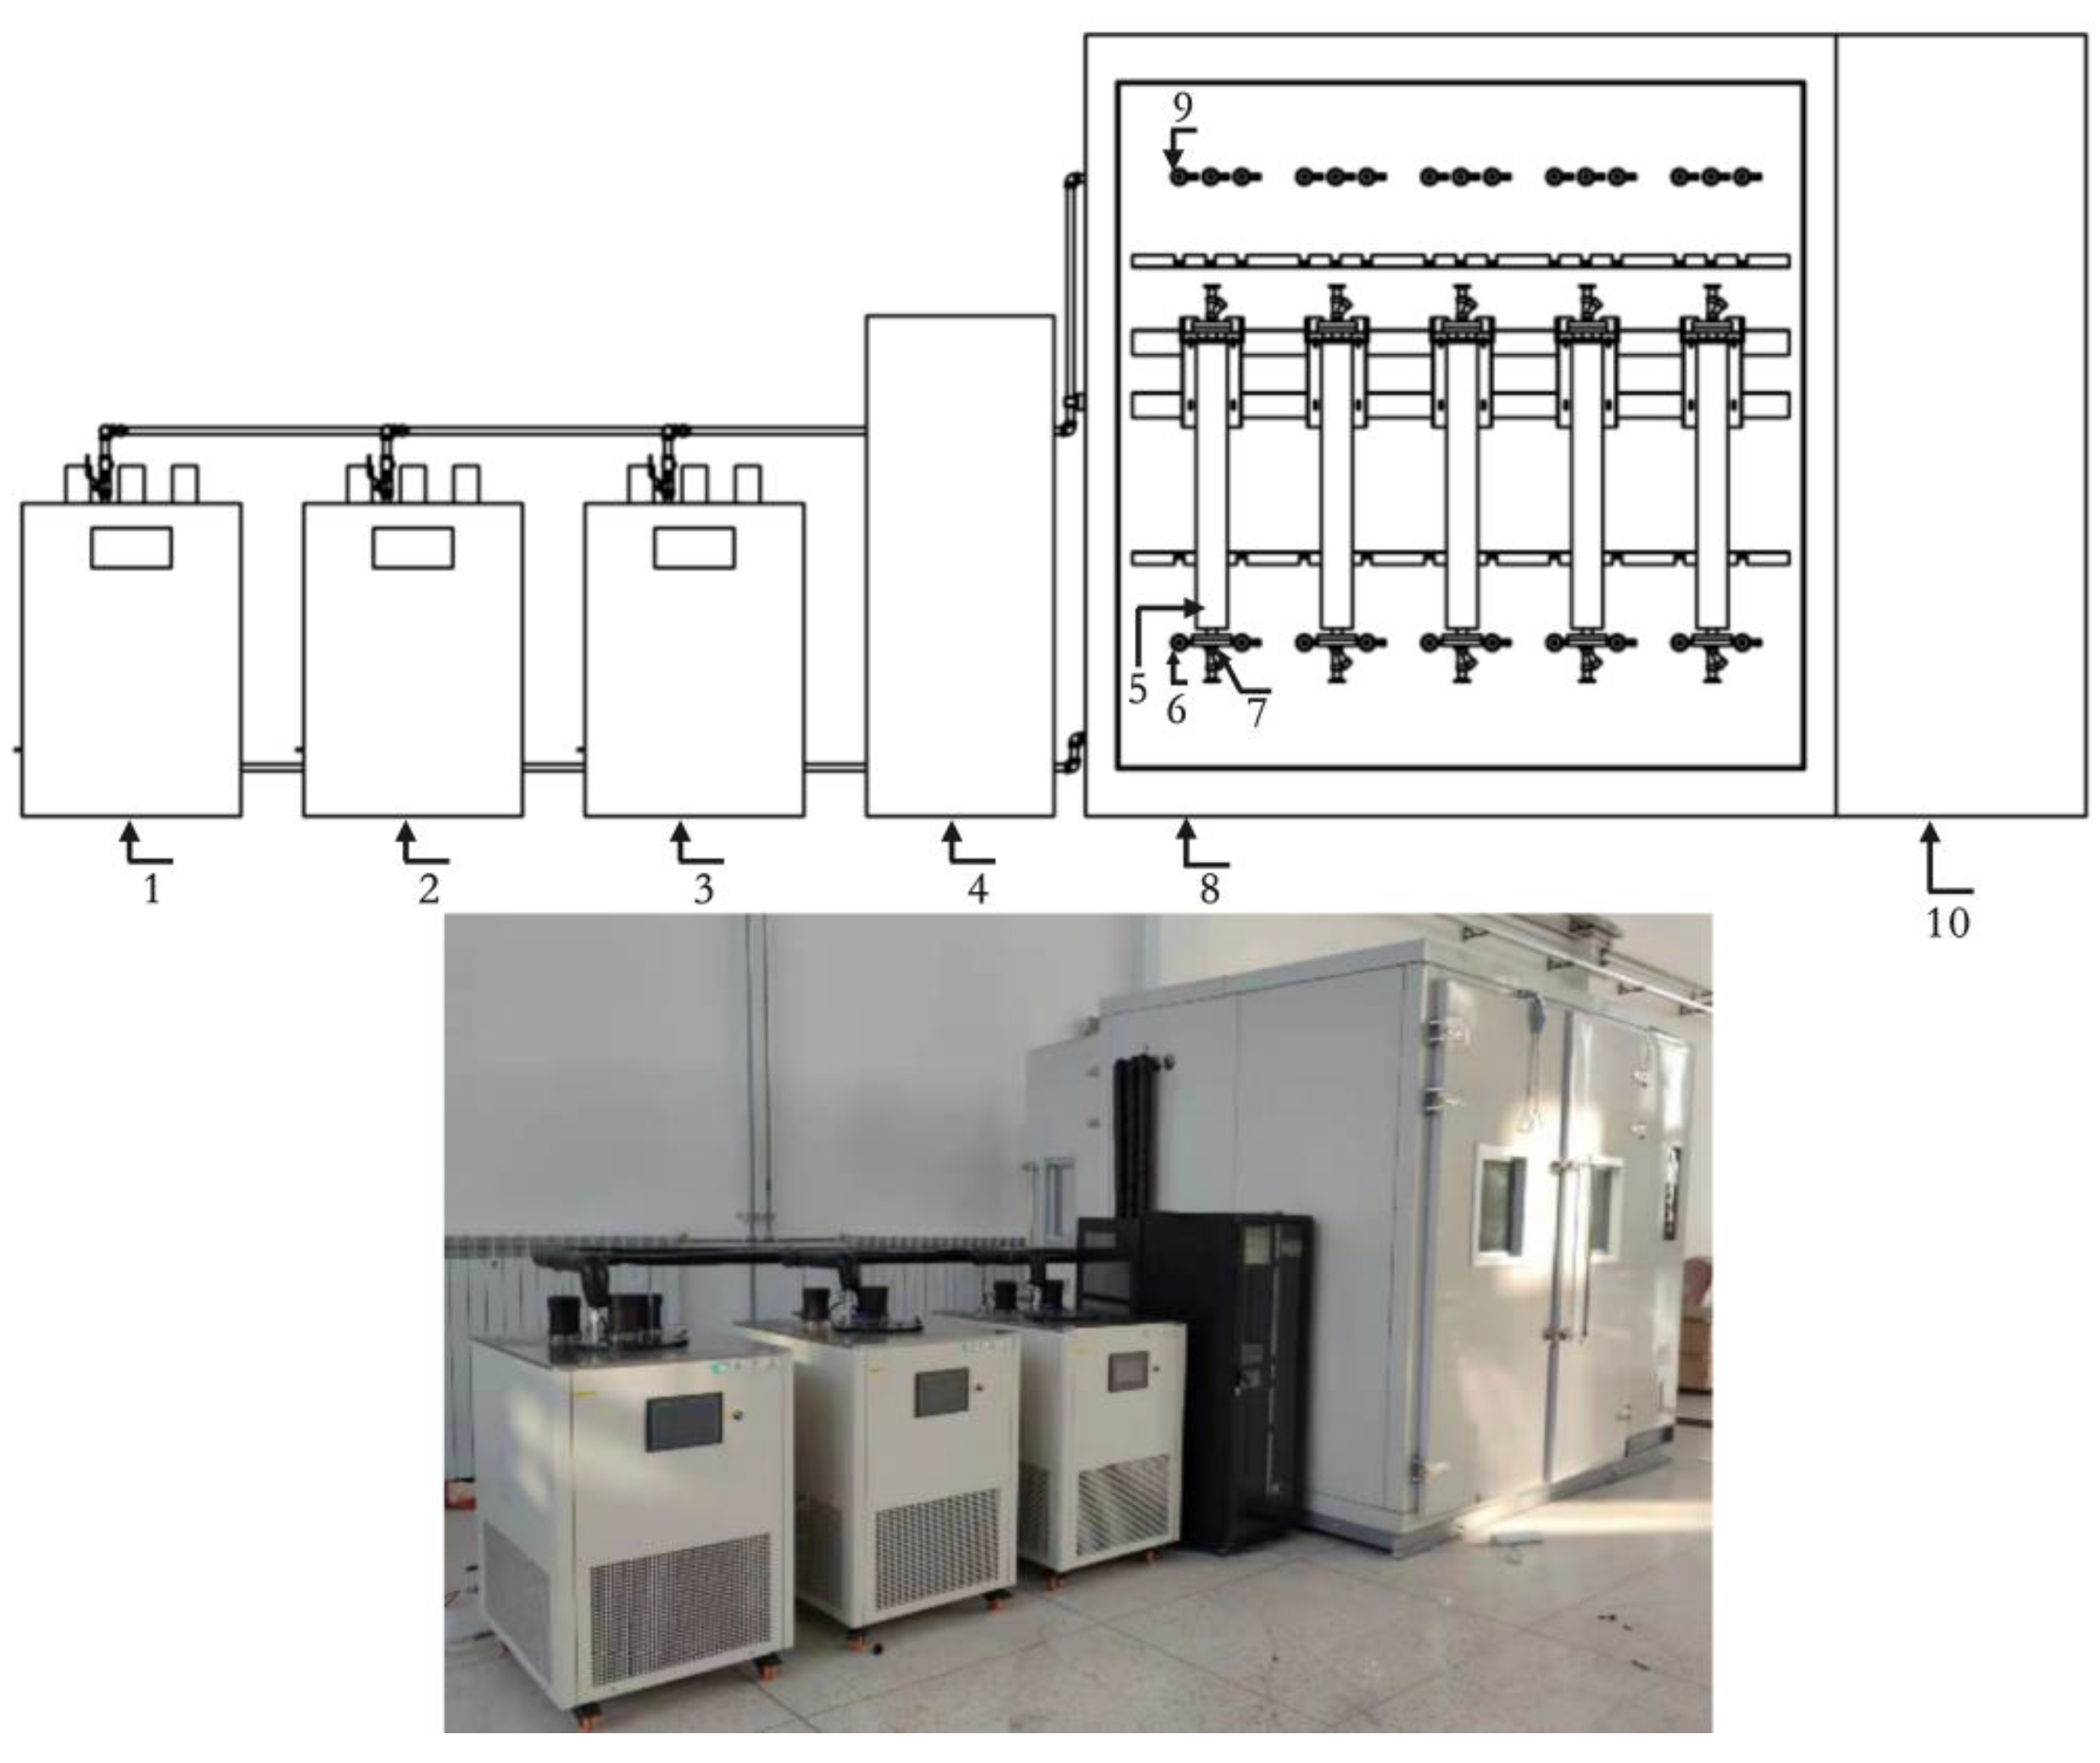
The whole equipment adopts the design of variable temperature field and multiple pipelines, which can carry out 5 on-line densitometers and 3 kinds of liquid experiments at the same time. It consists of thermostatic stirring control system, walk-in thermostatic field, high precision benchtop densitometer, pipeline pressurization system, blowing system, frequency acquisition system. The main standard uses the high-precision Anton Paar 5000, while the first-class densitometer group is used as the period of verification.
Figure 4.
Anton Paar 5000 and frst class densitometer set.

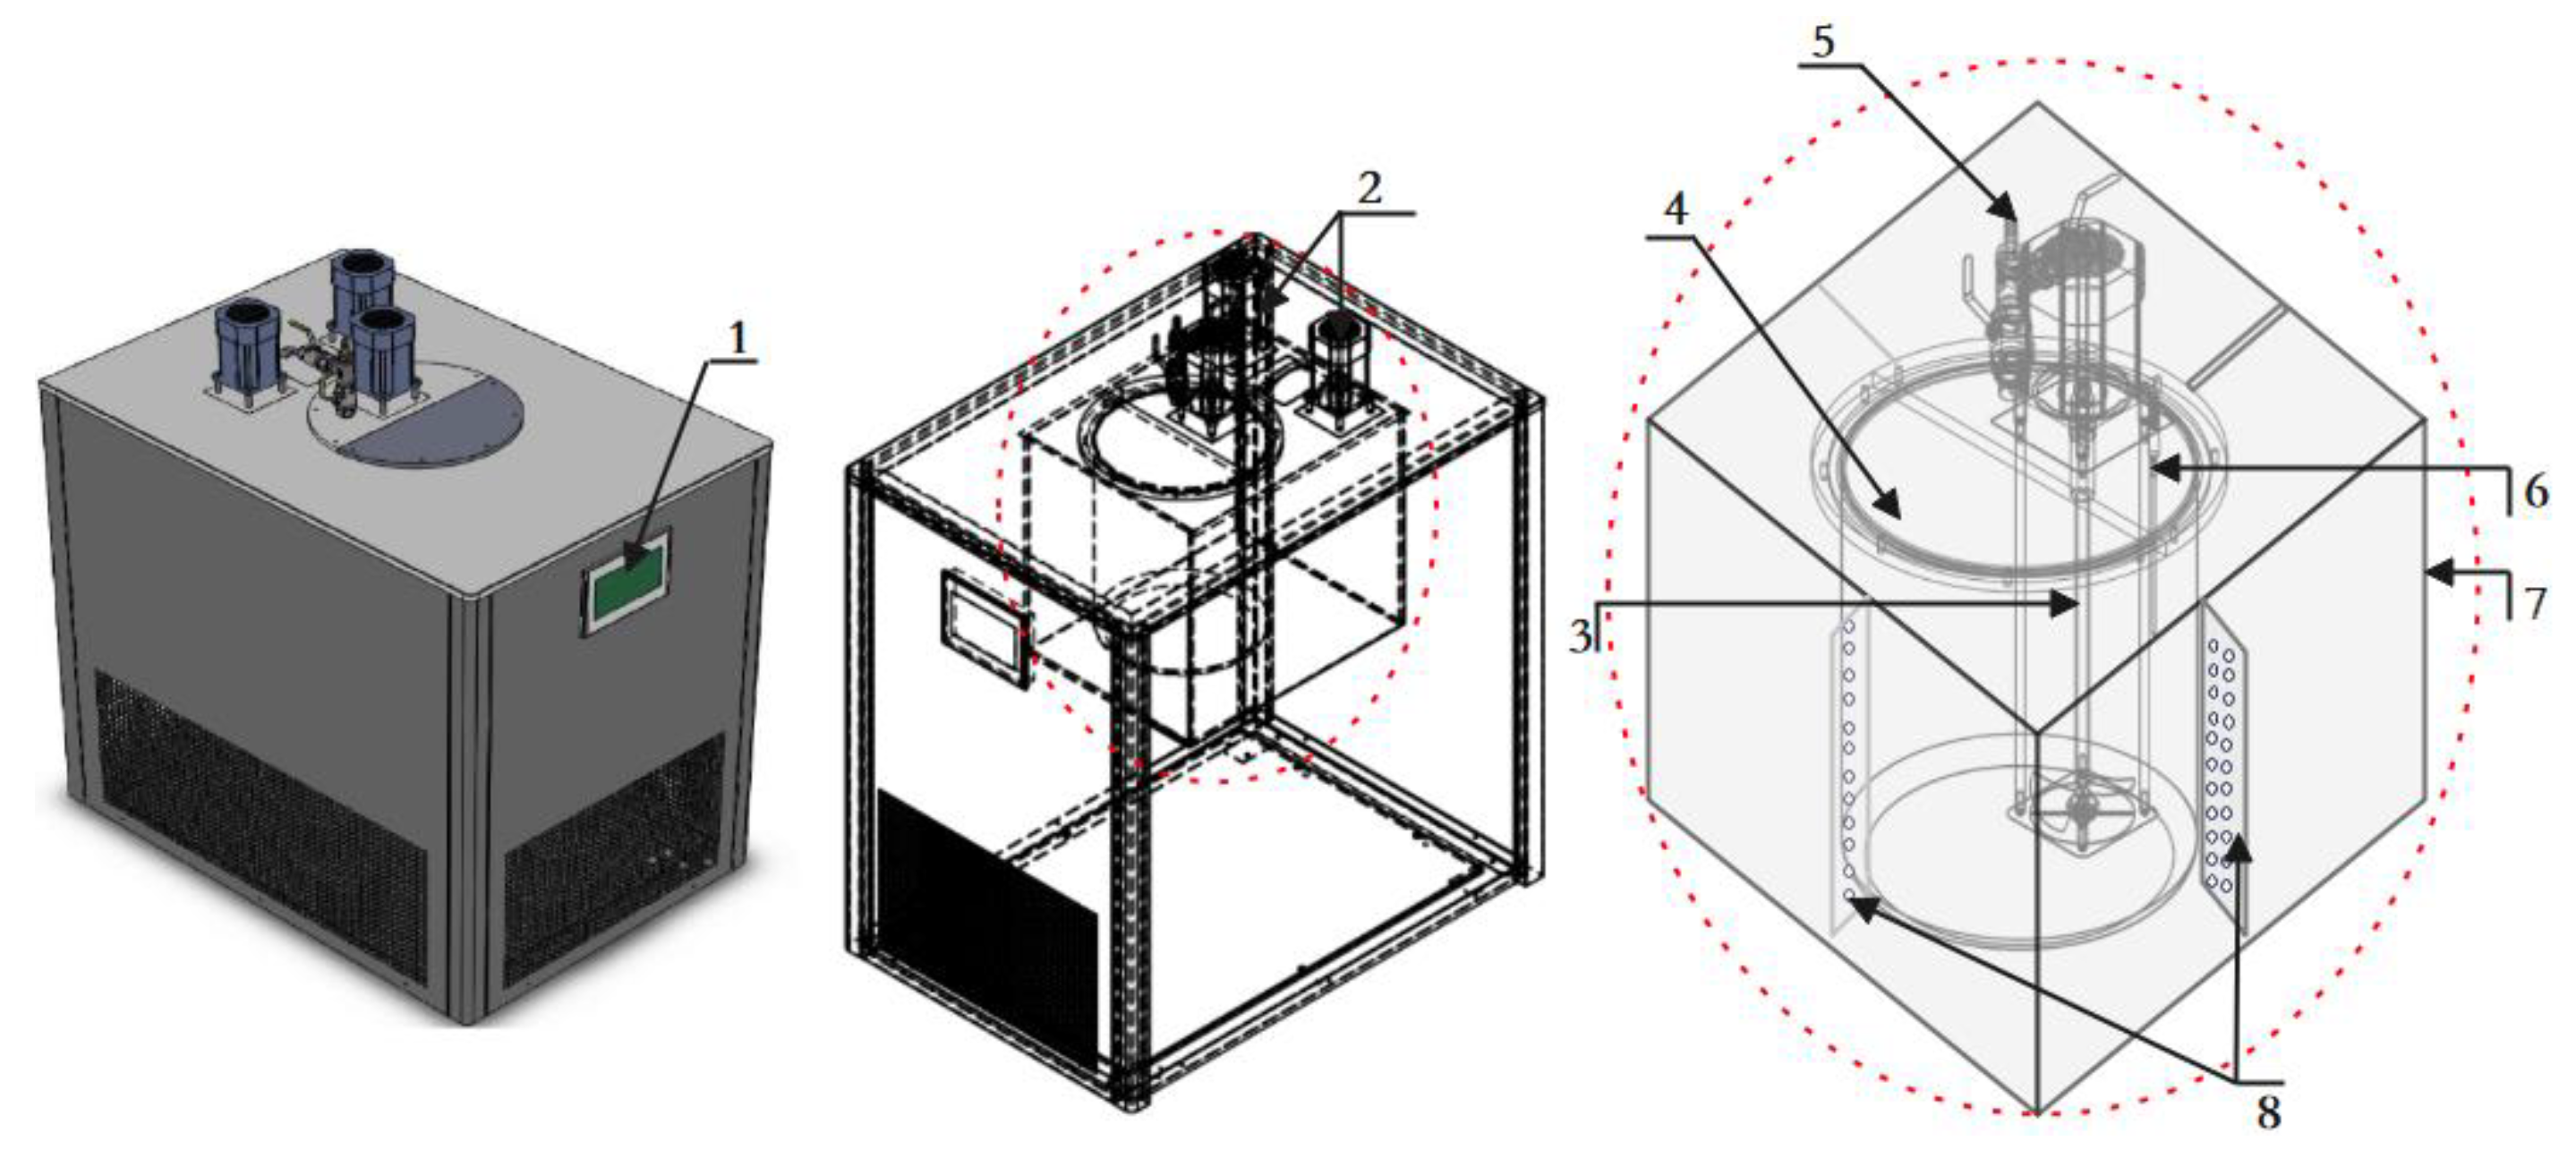
Figure 5.
Online vibrating tube liquid densitometer experimental device general view. 1, 2, 3. thermostat tank; 4. system control cabinet; 5. experimental densitometer; 6. connecting densitometer flange; 7. thermometer interface; 8 walk-in thermostat box; 9. piping connector; 10 thermostat box control system.
Temperature is one of the most important parameters affecting the density change, the liquid in the circulation system is in a stable state to collect the stable vibration frequency. The constant temperature tank adopts internal and external double layer design, the internal circulation system adopts heatless magnetic stirring pump, which effectively prevents the pump from affecting the temperature field of the tank due to its own heat generation. The outer tank and inner tank are uniformly distributed around the 4 pieces of guide plate, which effectively ensures the uniformity of the fluid flow in the outer tank, and realizes the turbulence of the flow field in the inner tank and a high degree of uniformity of the temperature field. The volume ratio of the inner and outer tanks is 0.51, which can meet the requirements of low energy consumption and full pipe flow at the same time, and all the pipes of the whole system are insulated to ensure that the temperature change in the process of liquid circulation is in a small change interval.
Figure 6.
Inner and outer tanks of thermostat. 1. LCD control board; 2. outer tank circulation pump; 3. inner tank agitator; 4. inner tank body; 5. liquid circulation inlet; 6. temperature sensor; 7. outer tank body; 8. deflector plate.
Figure 6.
Inner and outer tanks of thermostat. 1. LCD control board; 2. outer tank circulation pump; 3. inner tank agitator; 4. inner tank body; 5. liquid circulation inlet; 6. temperature sensor; 7. outer tank body; 8. deflector plate.
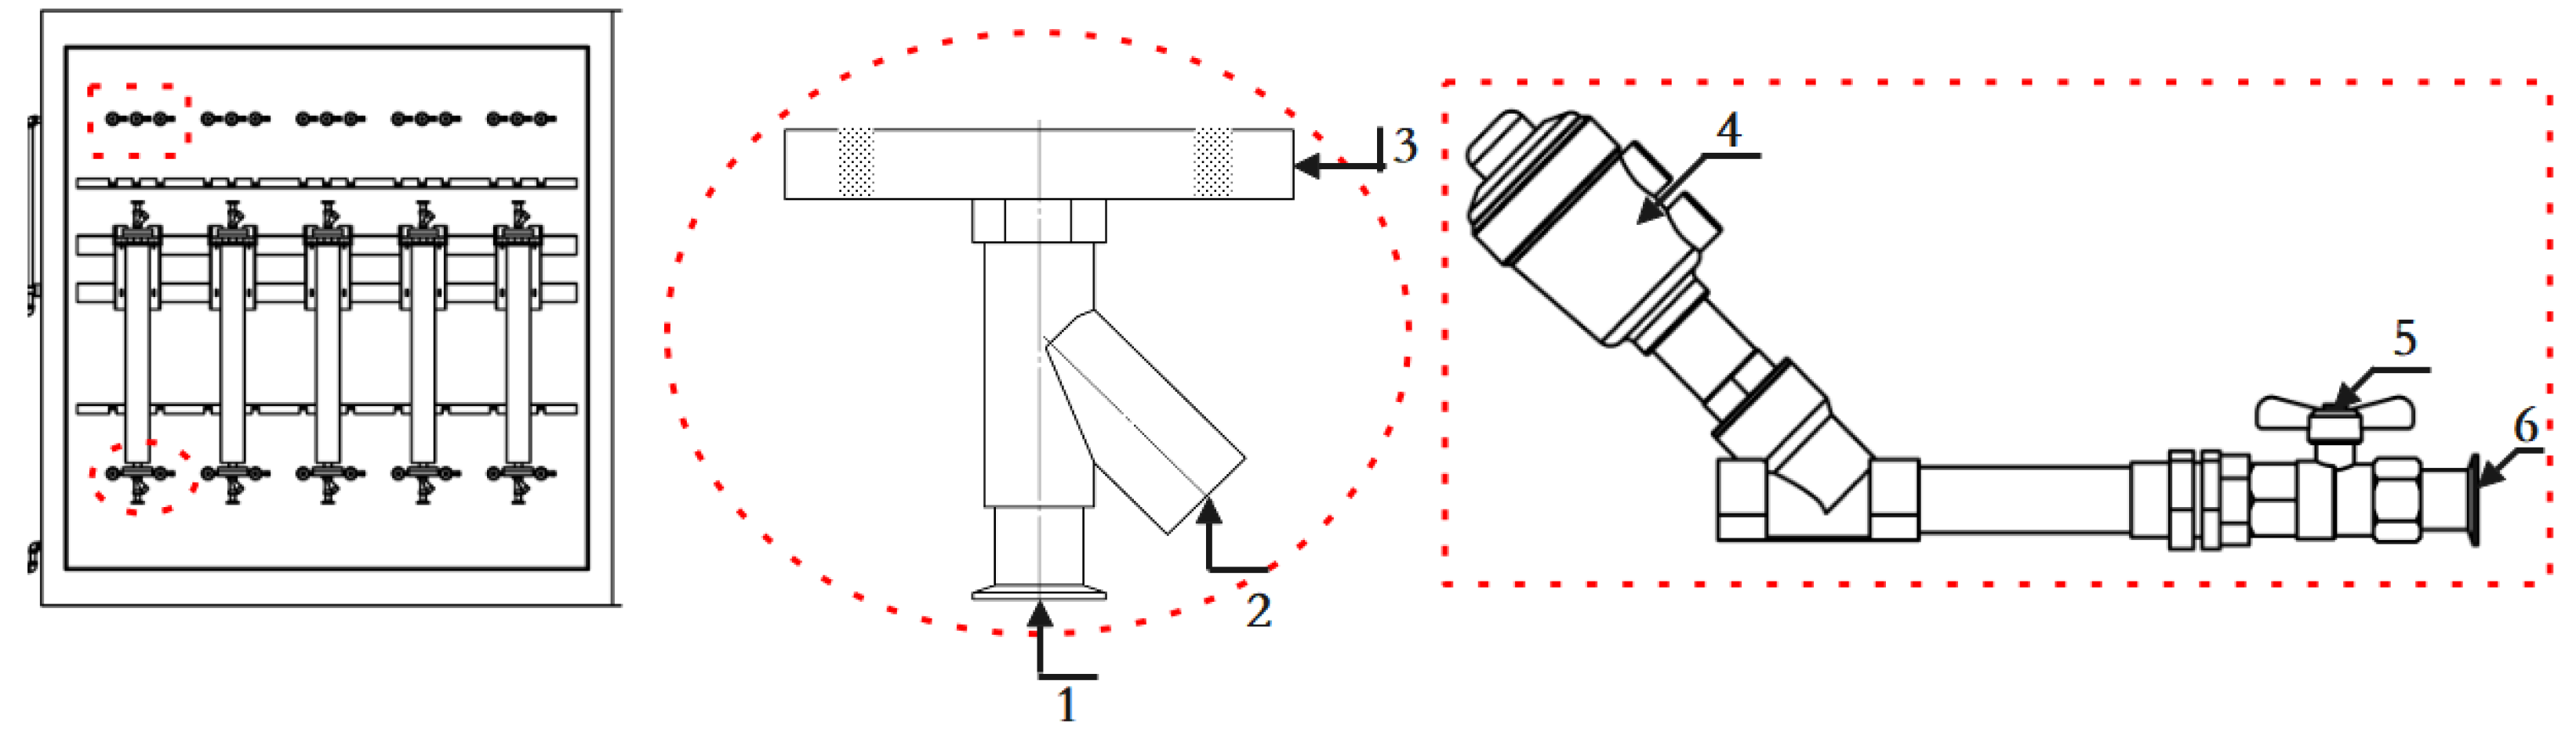
In order to reduce the stress on both ends of the vibration tube vibration impact, the density meter and the device to take the flange bolt connection. Vibration tube frequency measurement by the liquid temperature changes have a greater impact on the import and export of the experimental densitometer installed U = 0.02 ℃, k = 2 thermometer, thermometer installed in the flange at one end of the experimental densitometer at an angle of 45 °, not only can accurately measure the temperature, but also can effectively avoid the thermometer flange hole in the liquid residue.
Figure 7.
Density meter connecting flange and pipeline connection valve. 1.line connection port; 2. thermometer interface; 3. densitometer connection flange; 4. pneumatic angle valve; 5. manual valve; 6. line connection port.
Figure 7.
Density meter connecting flange and pipeline connection valve. 1.line connection port; 2. thermometer interface; 3. densitometer connection flange; 4. pneumatic angle valve; 5. manual valve; 6. line connection port.
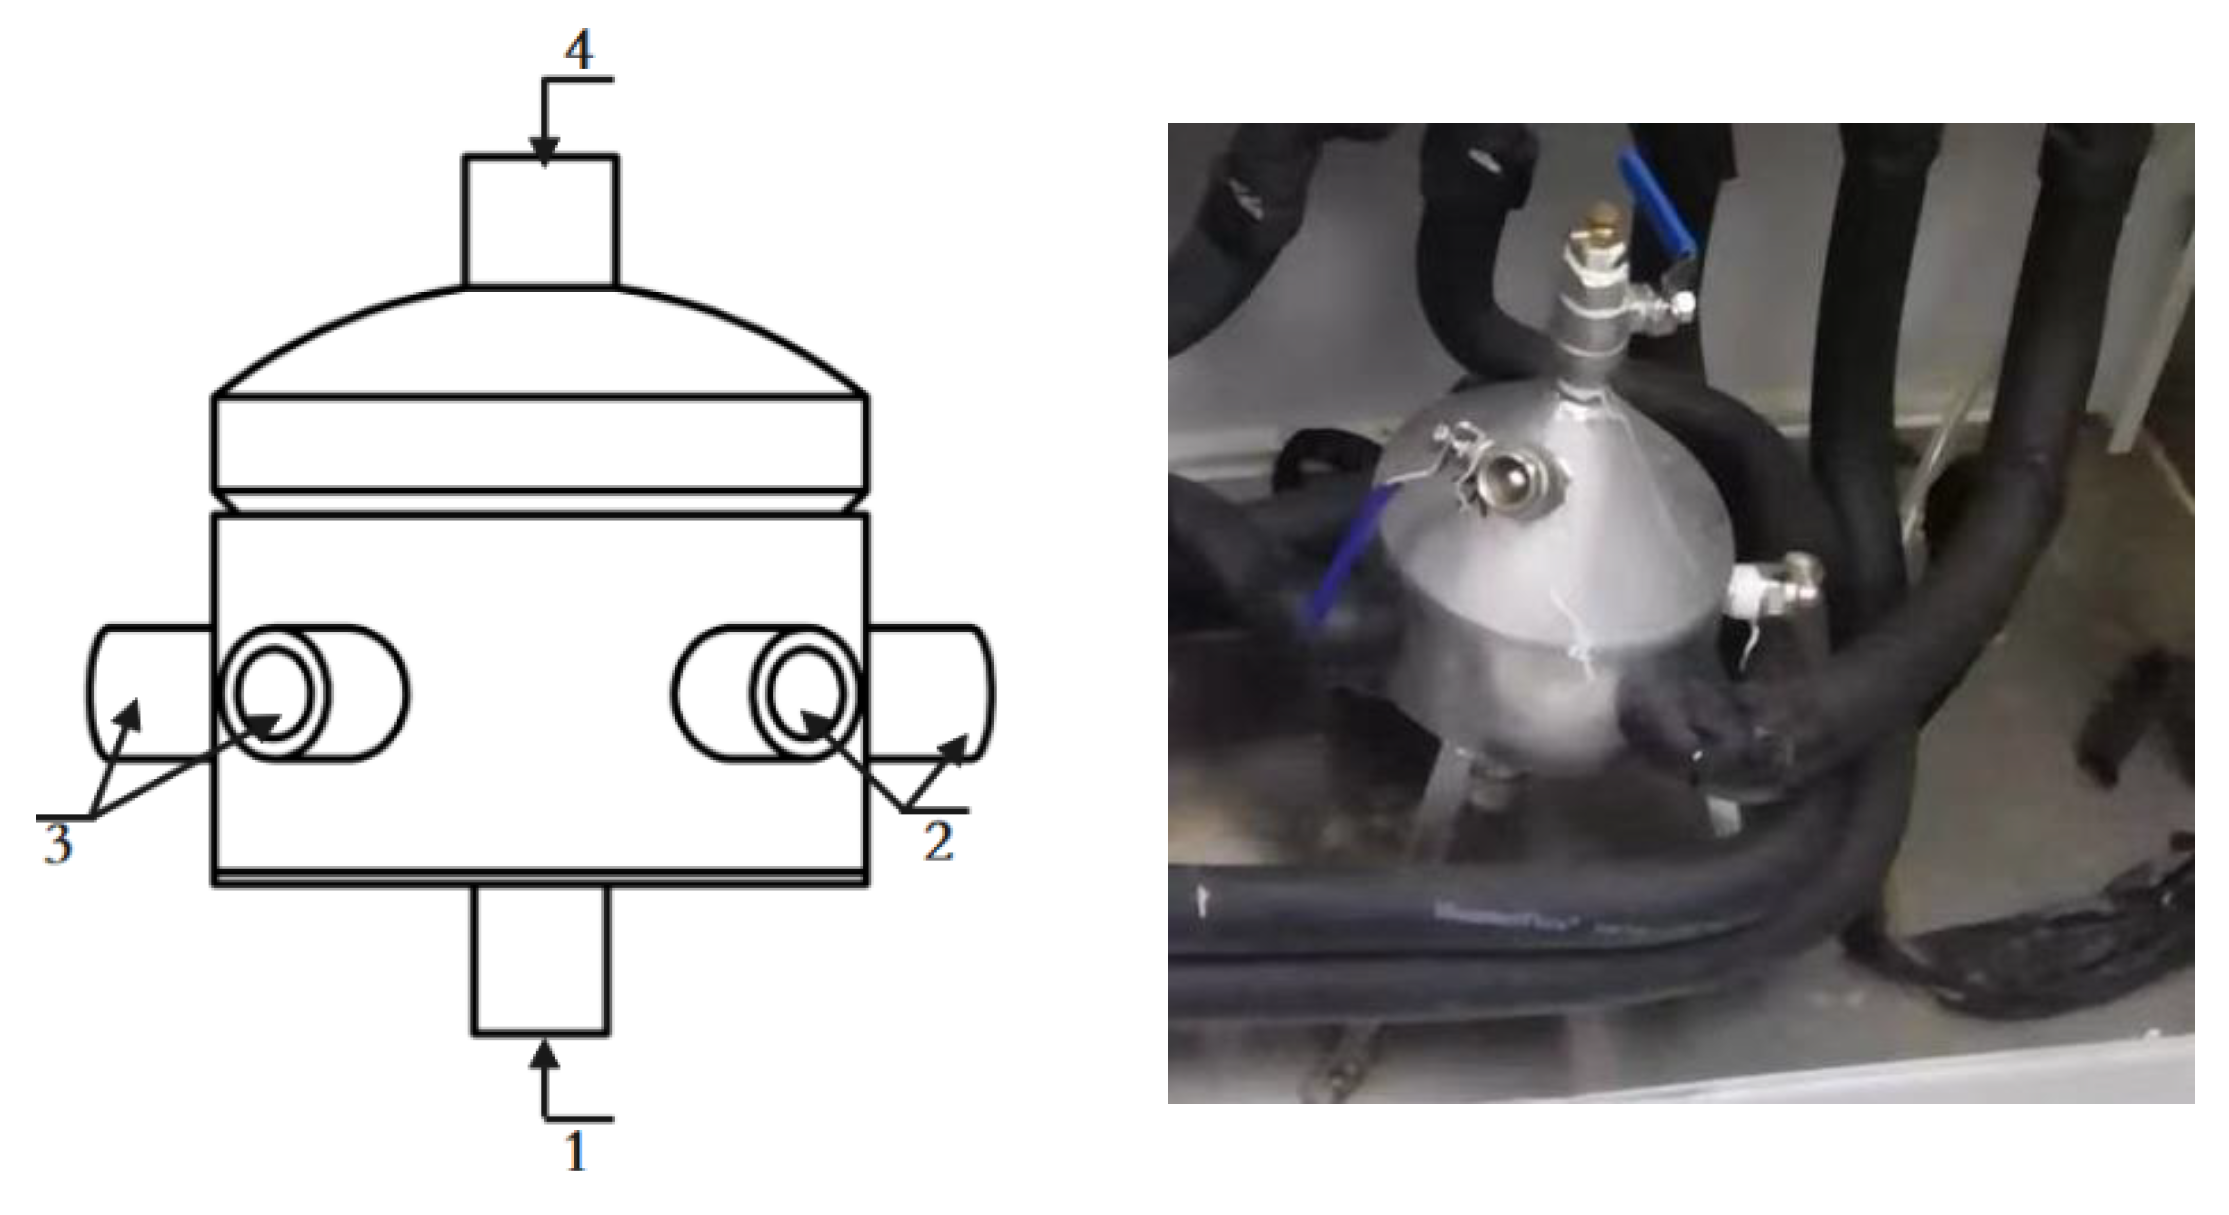
The system adopts the bottom-up liquid inlet mode, the circulating liquid is divided into five ways after flowing out from the thermostatic tank through the degassing system, corresponding to five different experimental stations, so it can realize the simultaneous experiments of five densitometers with three kinds of liquids. In order to prevent the experimental error caused by mixing liquid during the experiment, after the experiment of different liquids is finished, the corresponding pipe is purged and the frequency of the empty pipe is compared to check whether it is purged cleanly.
Figure 8.
Degassing Liquid Separator. 1. Liquid inlet; 2, 3. Liquid outlet; 4. One-way exhaust port.
Figure 8.
Degassing Liquid Separator. 1. Liquid inlet; 2, 3. Liquid outlet; 4. One-way exhaust port.
3.3. Device Uncertainty Assessment
Online vibrating tube liquid densitometer experimental device uncertainty is mainly composed of benchtop densitometer, first-class densitometer group, temperature sensor, frequency collector and other introduced uncertainty. In this paper, the uncertainty of the theoretical model, assessment, representation are in accordance with JJF1059-1999 "Assessment and Representation of Measurement Uncertainty"[11]. The uncertainty of the whole set of instruments when using the table densitometer as a standardizer is estimated in the following table:

Table 1.
Device uncertainty assessment table.
| NO. | Source | Type |
u(xi) (kg/m³) |
Combined expanded uncertainty | Combined expanded uncertainty |
|---|---|---|---|---|---|
| 1 | Desktop density meter | B | 0.0225 | 0.039 kg/m3 |
U=0.08 kg/m3 k=2 |
| 2 | densitometer measurement | A | 5.592×10⁻⁵ | ||
| 3 | frequency meter measurement | B | 0.00092 | ||
| 4 | temperature measurement | B | 0.007 | ||
| 5 | Fit process | A | 0.031 |
3.4. Workflow of the Experimental Setup
Online vibrating tube liquid density meter sent to the laboratory for calibration experiments before the need to check the sensor internal pollution, for unclean instruments need to be cleaner cleaning, blowing, to keep the sensor wall clean. Use the endoscope to obtain real-time image or video data of the sensor wall, the computer software to determine the cleanliness of the inner wall to give the conclusion of whether to clean, no need to clean, the end of the process; such as the need for cleaning, connecting piping, valves, to be connected to the density meter connected to the end of the control pump, open the pump, select the time to clean, the end of the time, start the compressed air device, the compressed air blowing the internal sensors of the density meter, to the end of the process at the set time. Use the endoscope again to check the cleanliness of the inner wall of the sensor, until it meets the calibration requirements.
4. Online Vibrating Tube Densitometer Measurement Performance Experiment
4.1. Temperature Vibration Frequency Test
Straight-tube and curved-tube on-line vibrating tube liquid densitometers were selected for experimental validation. Solutions of n-tridecane, anhydrous ethanol, lye, pure water and sodium tungstate were selected for experimental validation. Standard temperature calibration experiments were performed at a constant temperature of (20±0.02)°C, and temperature tests were performed within (15~45)°C. The temperature of the liquid passing through the vibrating tube densitometer was measured by the inlet and outlet thermometers of the vibrating tube densitometer during the experimental process, and the temperature was collected every 500 ms, and the average value of the inlet and outlet temperatures was taken as the temperature of the liquid passing through the vibrating tube densitometer, and the standard density value was determined by Anton Paar 5000. In order to reduce the experimental error caused by mixing the liquid in the experimental process, 1, 2, 3 three thermostatic stirring tank were used to hold water, mixed liquids, organic solvents, and each liquid after the completion of the experiments on the pipeline to blow, the end of blowing compared to the frequency of 20 ℃ when the empty tube to verify whether it is blown clean.
Straight tube type, curved tube type two typical densitometer nominal accuracy of ± 0.2kg / m3, ± 0.1kg / m3. In practice, it is not possible to directly calculate the theoretical Kx coefficient must be experimentally calibrated by a different density and frequency to calculate the above coefficients, adjusted to the density of the difference between the density and the standard density to calculate the fit error. The system collects the vibration period of the vibrating tube, once every 500ms, 10 times each time, and takes the average value of 10 times as a measurement value of the measured liquid.
According to the measured frequency values and standard density values calculated using the least squares method straight tube type K0 = -1.233610 × 10³; K1 = -4.782074 × 10⁻²; K2 = 1.081764 × 10⁻³; K18 = 8.58998 × 10⁻⁶; K19 = 5.94276 × 10⁻³.
According to (6), (7) type experimental straight tube type density meter in the standard condition of the liquid density and vibration frequency of the relationship is:
ρx=-1233.610-0.04782074×T+0.001081764×T2
Calculation of straight tube on-line densitometer at (20±0.01) °C, (15~45) °C fitted density with error.
Table 1.
Straight tube accuracy experiments density, frequency and fit error at (20±0.01)°C.
| Liquid name | Measuring temperature(℃) | Vibration period(us) | Standard density(kg/m3) | Fit density(kg/m3) | Fit error(kg/m3) |
| N-Tridecane | 20.001 | 1378.541607 | 756.226 | 756.226 | 0.00 |
| Anhydrous ethanol | 20.000 | 1401.152815 | 823.136 | 823.136 | 0.00 |
| Mixture 1 | 19.995 | 1415.154277 | 865.123 | 865.123 | 0.00 |
| Industrial white oil | 20.001 | 1403.815470 | 831.088 | 831.088 | 0.00 |
| Mixing solution 2 | 19.996 | 1423.031064 | 888.930 | 888.930 | 0.00 |
| Pure water | 20.001 | 1458.638571 | 998.226 | 998.226 | 0.00 |
| Tungstate solution | 20.010 | 1584.048720 | 1405.012 | 1405.013 | 0.01 |
Table 2.
Straight tube (15-45)°C temperature experiment density, frequency, fit error.
| Liquid name | Measuring temperature(℃) | Vibration period(us) | Standard density(kg/m3) | Fit density(kg/m3) | Fit error(kg/m3) |
| Tridecane | 15.497 | 1379.68479 | 759.442 | 759.526 | -0.08 |
| 20.000 | 1378.53900 | 756.226 | 756.218 | 0.01 | |
| 29.412 | 1376.25237 | 749.509 | 749.630 | -0.12 | |
| 40.231 | 1374.62239 | 745.123 | 744.991 | 0.13 | |
| 45.213 | 1372.95320 | 740.369 | 740.170 | 0.20 | |
| Anhydrous ethanol | 14.253 | 1404.62236 | 833.236 | 833.425 | -0.19 |
| 20.000 | 1403.81547 | 831.088 | 831.088 | 0.00 | |
| 30.123 | 1402.83650 | 828.369 | 828.295 | 0.07 | |
| 40.224 | 1402.19565 | 826.326 | 826.512 | -0.19 | |
| 45.237 | 1400.63691 | 822.136 | 821.925 | 0.21 | |
| Anhydrous ethano2 | 14.953 | 1424.40283 | 892.909 | 893.021 | -0.11 |
| 20.000 | 1423.03450 | 888.930 | 888.940 | -0.01 | |
| 29.096 | 1420.48395 | 881.237 | 881.340 | -0.10 | |
| 36.415 | 1419.56231 | 878.639 | 878.651 | -0.01 | |
| 44.215 | 1418.32352 | 875.236 | 875.011 | 0.22 | |
| Water | 14.362 | 1459.03692 | 999.191 | 999.382 | -0.19 |
| 15.564 | 1458.90888 | 999.009 | 999.002 | 0.01 | |
| 20.002 | 1458.63911 | 998.221 | 998.228 | -0.01 | |
| 29.259 | 1457.84188 | 995.898 | 995.885 | 0.01 | |
| 43.894 | 1456.12524 | 990.651 | 990.767 | -0.12 | |
| Tungstate solution | 14.653 | 1585.58569 | 1410.236 | 1410.112 | 0.12 |
| 20.000 | 1584.04872 | 1405.012 | 1405.012 | 0.00 | |
| 29.251 | 1582.86922 | 1401.236 | 1401.194 | 0.04 | |
| 40.123 | 1582.01231 | 1398.369 | 1398.496 | -0.13 | |
| 45.369 | 1580.97900 | 1395.237 | 1395.104 | 0.13 |
According to the measured frequency value and the standard density value calculated by the least squares method curved tube type online vibrating tube liquid densitometer coefficient K0 = -3.642245 × 10³; K1 = 0; K2 = 3.464284 × 10⁻⁴; K18 = 1.418323 × 10⁻⁴; K19 = -3.908279 × 10⁻¹, according to (6), (7) the experimental straight tube type densitometer in the standard condition, different temperatures of liquid density and the standard condition of vibration, different temperature and the density of liquid.
K19 = -3.908279 × 10⁻¹, according to (6), (7) the experimental straight tube type densitometer in the standard condition, different temperatures under the liquid density and vibration frequency relationship is
ρx=-3642.245+3.464284 × 10⁻⁴ × T2
Table 3.
Curved tube densitometer accuracy experiment density, frequency, fit error.
| Liquid name | Measuring temperature(℃) | Vibration period(us) | Standard density(kg/m3) | Fit density(kg/m3) | Fit error(kg/m3) |
| Tridecane | 20.001 | 3659.93511 | 998.226 | 998.208 | -0.02 |
| Anhydrous ethanol | 20.000 | 3607.10110 | 865.123 | 865.198 | 0.08 |
| Mixture 1 | 20.000 | 3590.20928 | 823.136 | 823.080 | -0.06 |
| Industrial white oil | 20.001 | 3563.23146 | 756.226 | 756.225 | -0.00 |
| Mixing solution 2 | 19.996 | 3593.46230 | 831.088 | 831.176 | 0.09 |
| Pure water | 20.001 | 3616.59763 | 888.930 | 888.963 | 0.03 |
| Tungstate solution | 20.010 | 3816.98624 | 1405.012 | 1405.004 | -0.01 |
Table 4.
Curved tube densitometer (15-45) °C temperature experiment density, frequency, fit error.
| Liquid name | Measuring temperature(℃) | Vibration period(us) | Standard density(kg/m3) | Fit density(kg/m3) | Fit error(kg/m3) |
| Tridecane | 15.551 | 3564.05124 | 759.442 | 759.510 | 0.07 |
| 20.000 | 3563.23146 | 756.226 | 756.225 | 0.00 | |
| 29.312 | 3561.62569 | 749.509 | 749.616 | 0.11 | |
| 40.189 | 3561.10569 | 745.123 | 745.239 | 0.12 | |
| 45.112 | 3559.74569 | 740.369 | 740.472 | 0.10 | |
| Anhydrous ethano l | 14.331 | 3593.69892 | 833.236 | 833.312 | 0.08 |
| 20.000 | 3593.46230 | 831.088 | 831.176 | 0.09 | |
| 30.002 | 3593.40000 | 828.369 | 828.291 | -0.08 | |
| 40.224 | 3593.69000 | 826.326 | 826.225 | -0.10 | |
| 45.247 | 3592.55426 | 822.136 | 822.016 | -0.12 | |
| Anhydrous ethano 2 | 14.536 | 3617.61236 | 892.909 | 892.950 | 0.04 |
| 20.000 | 3616.55763 | 888.93 | 888.862 | -0.07 | |
| 29.026 | 3614.44563 | 881.237 | 881.175 | -0.06 | |
| 36.435 | 3614.21369 | 878.639 | 878.626 | -0.01 | |
| 44.215 | 3613.68000 | 875.236 | 875.219 | -0.02 | |
| Water | 14.211 | 3659.75236 | 999.191 | 999.188 | 0.00 |
| 15.113 | 3659.73000 | 999.009 | 998.906 | -0.10 | |
| 20.002 | 3659.95351 | 998.221 | 998.254 | 0.03 | |
| 29.152 | 3659.93123 | 995.898 | 995.917 | 0.02 | |
| 43.544 | 3659.29000 | 990.651 | 990.698 | 0.05 | |
| Tungstate solution | 14.653 | 3818.55000 | 1410.236 | 1410.162 | -0.07 |
| 20.000 | 3816.98624 | 1405.012 | 1405.004 | -0.01 | |
| 29.331 | 3816.26000 | 1401.236 | 1401.294 | 0.06 | |
| 40.023 | 3815.92360 | 1398.369 | 1398.496 | -0.13 | |
| 45.441 | 3815.13123 | 1395.237 | 1395.104 | 0.13 |
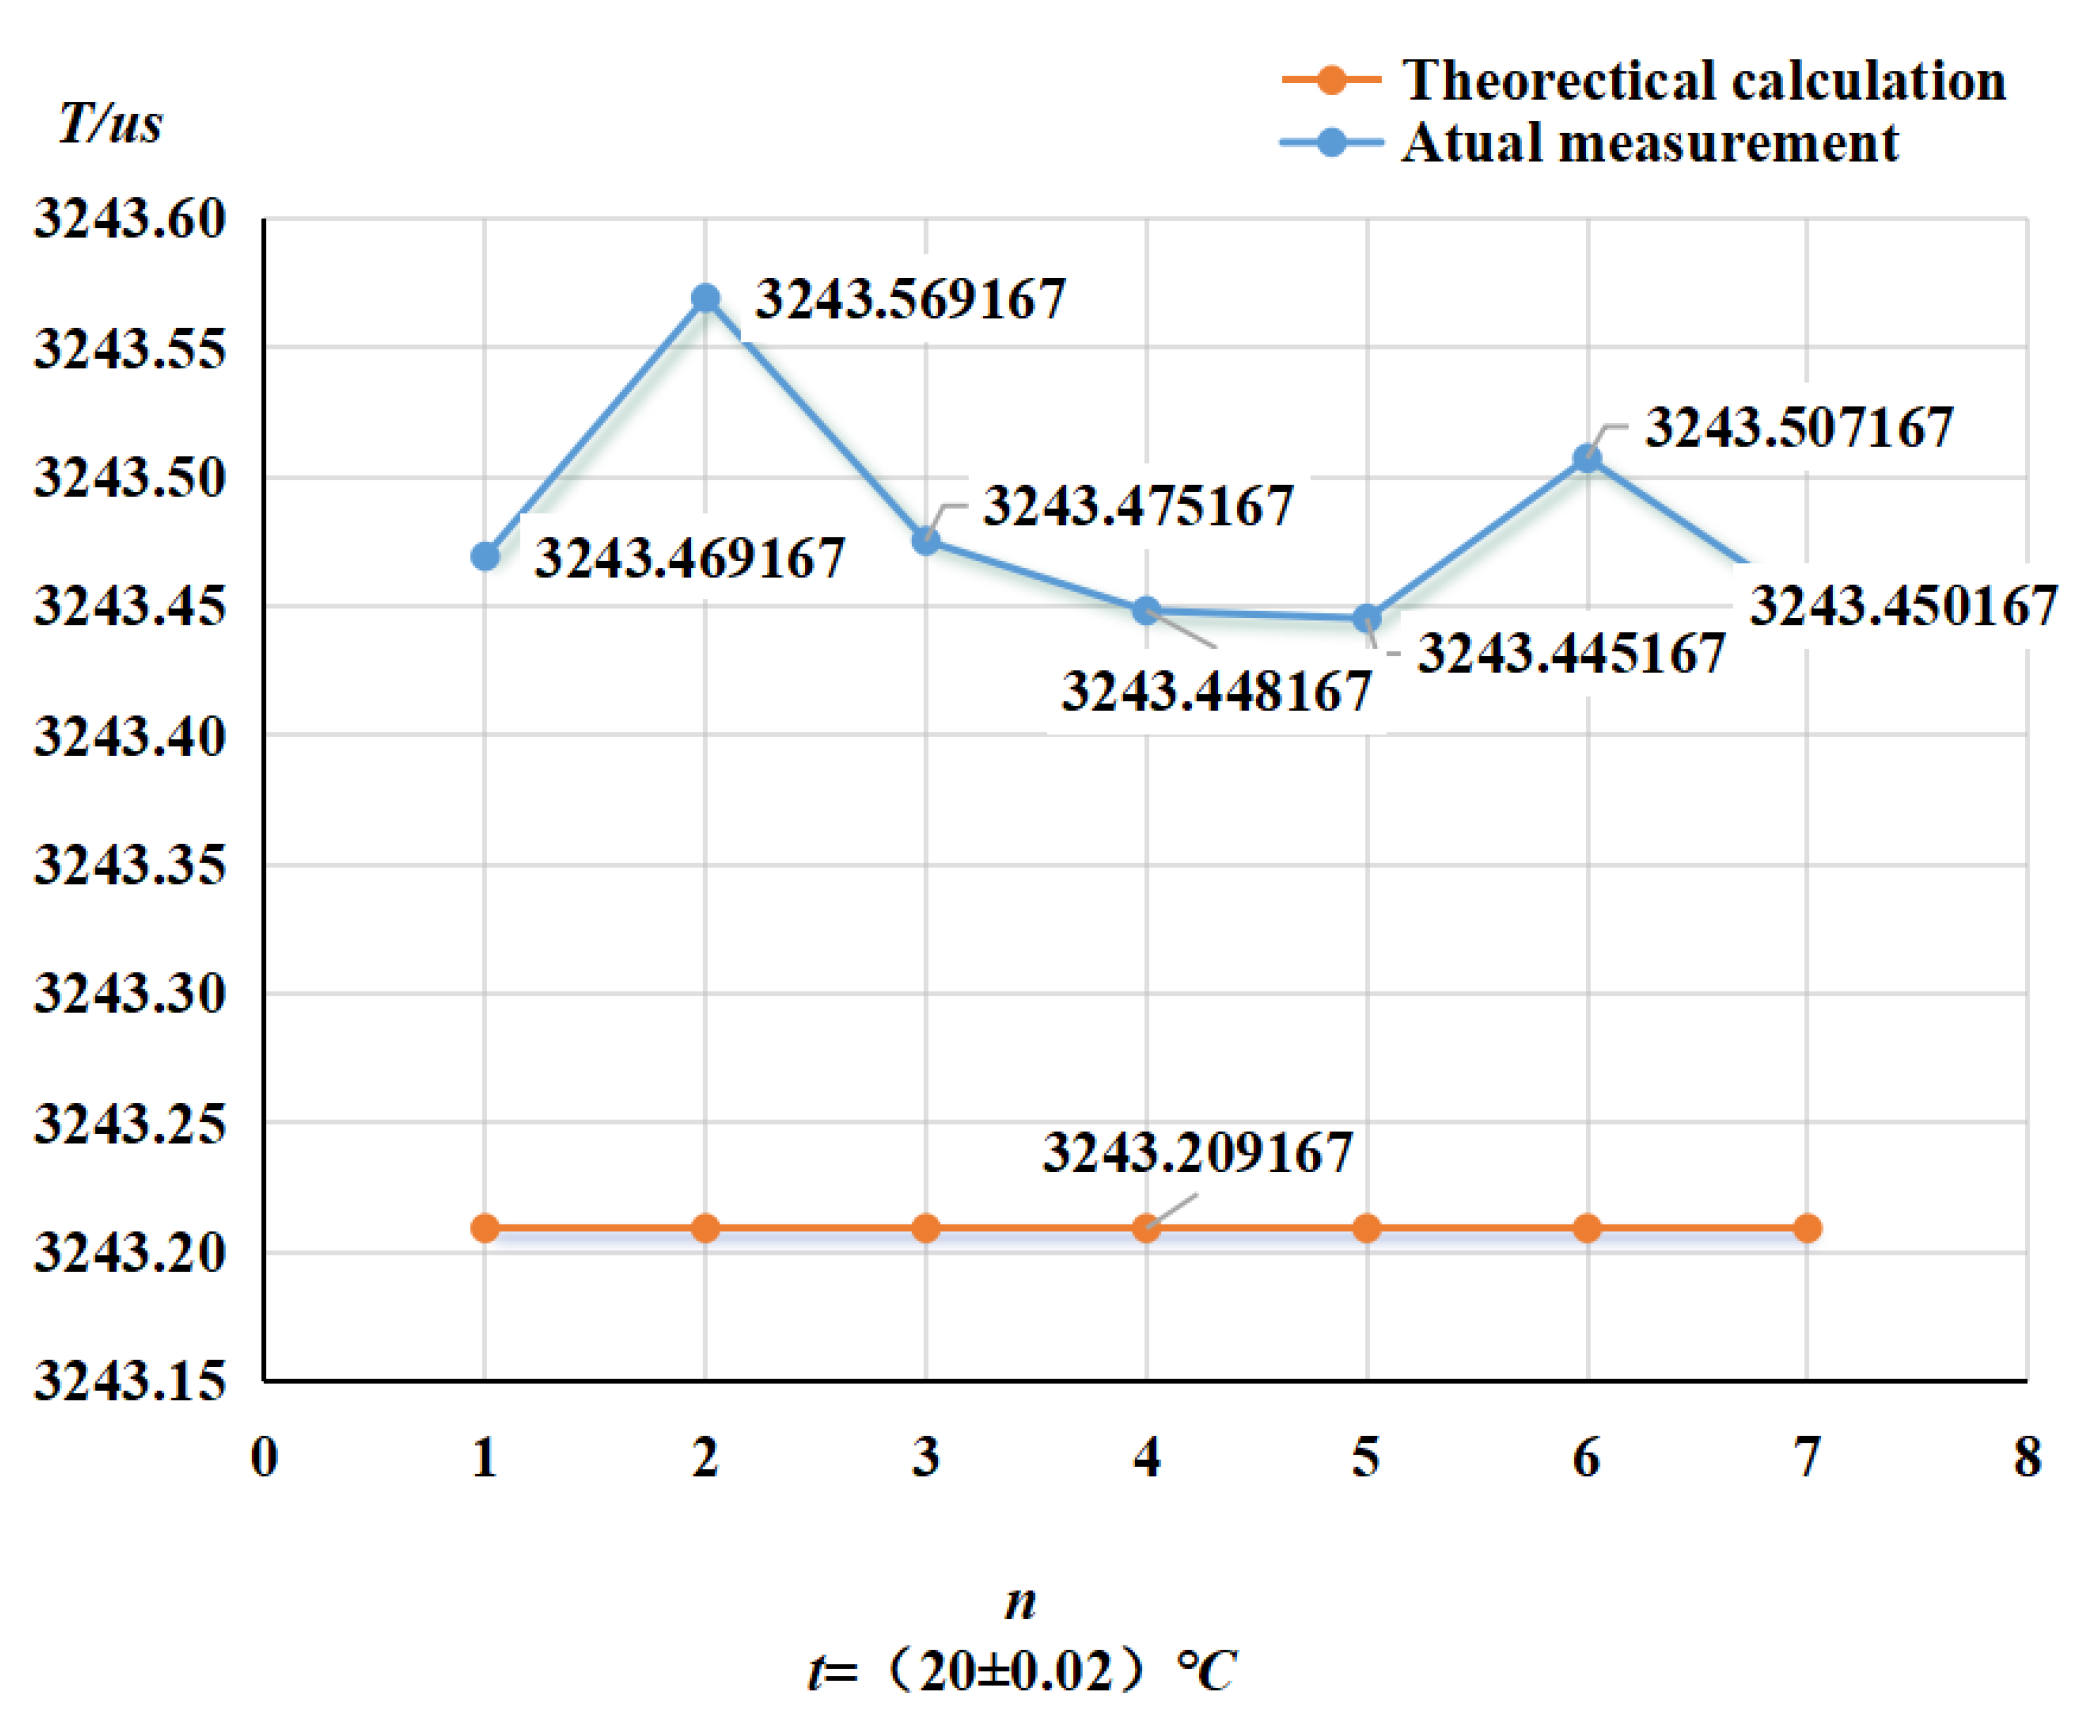
Figure 6.
Variation of air tube frequency for straight tube densitometer.
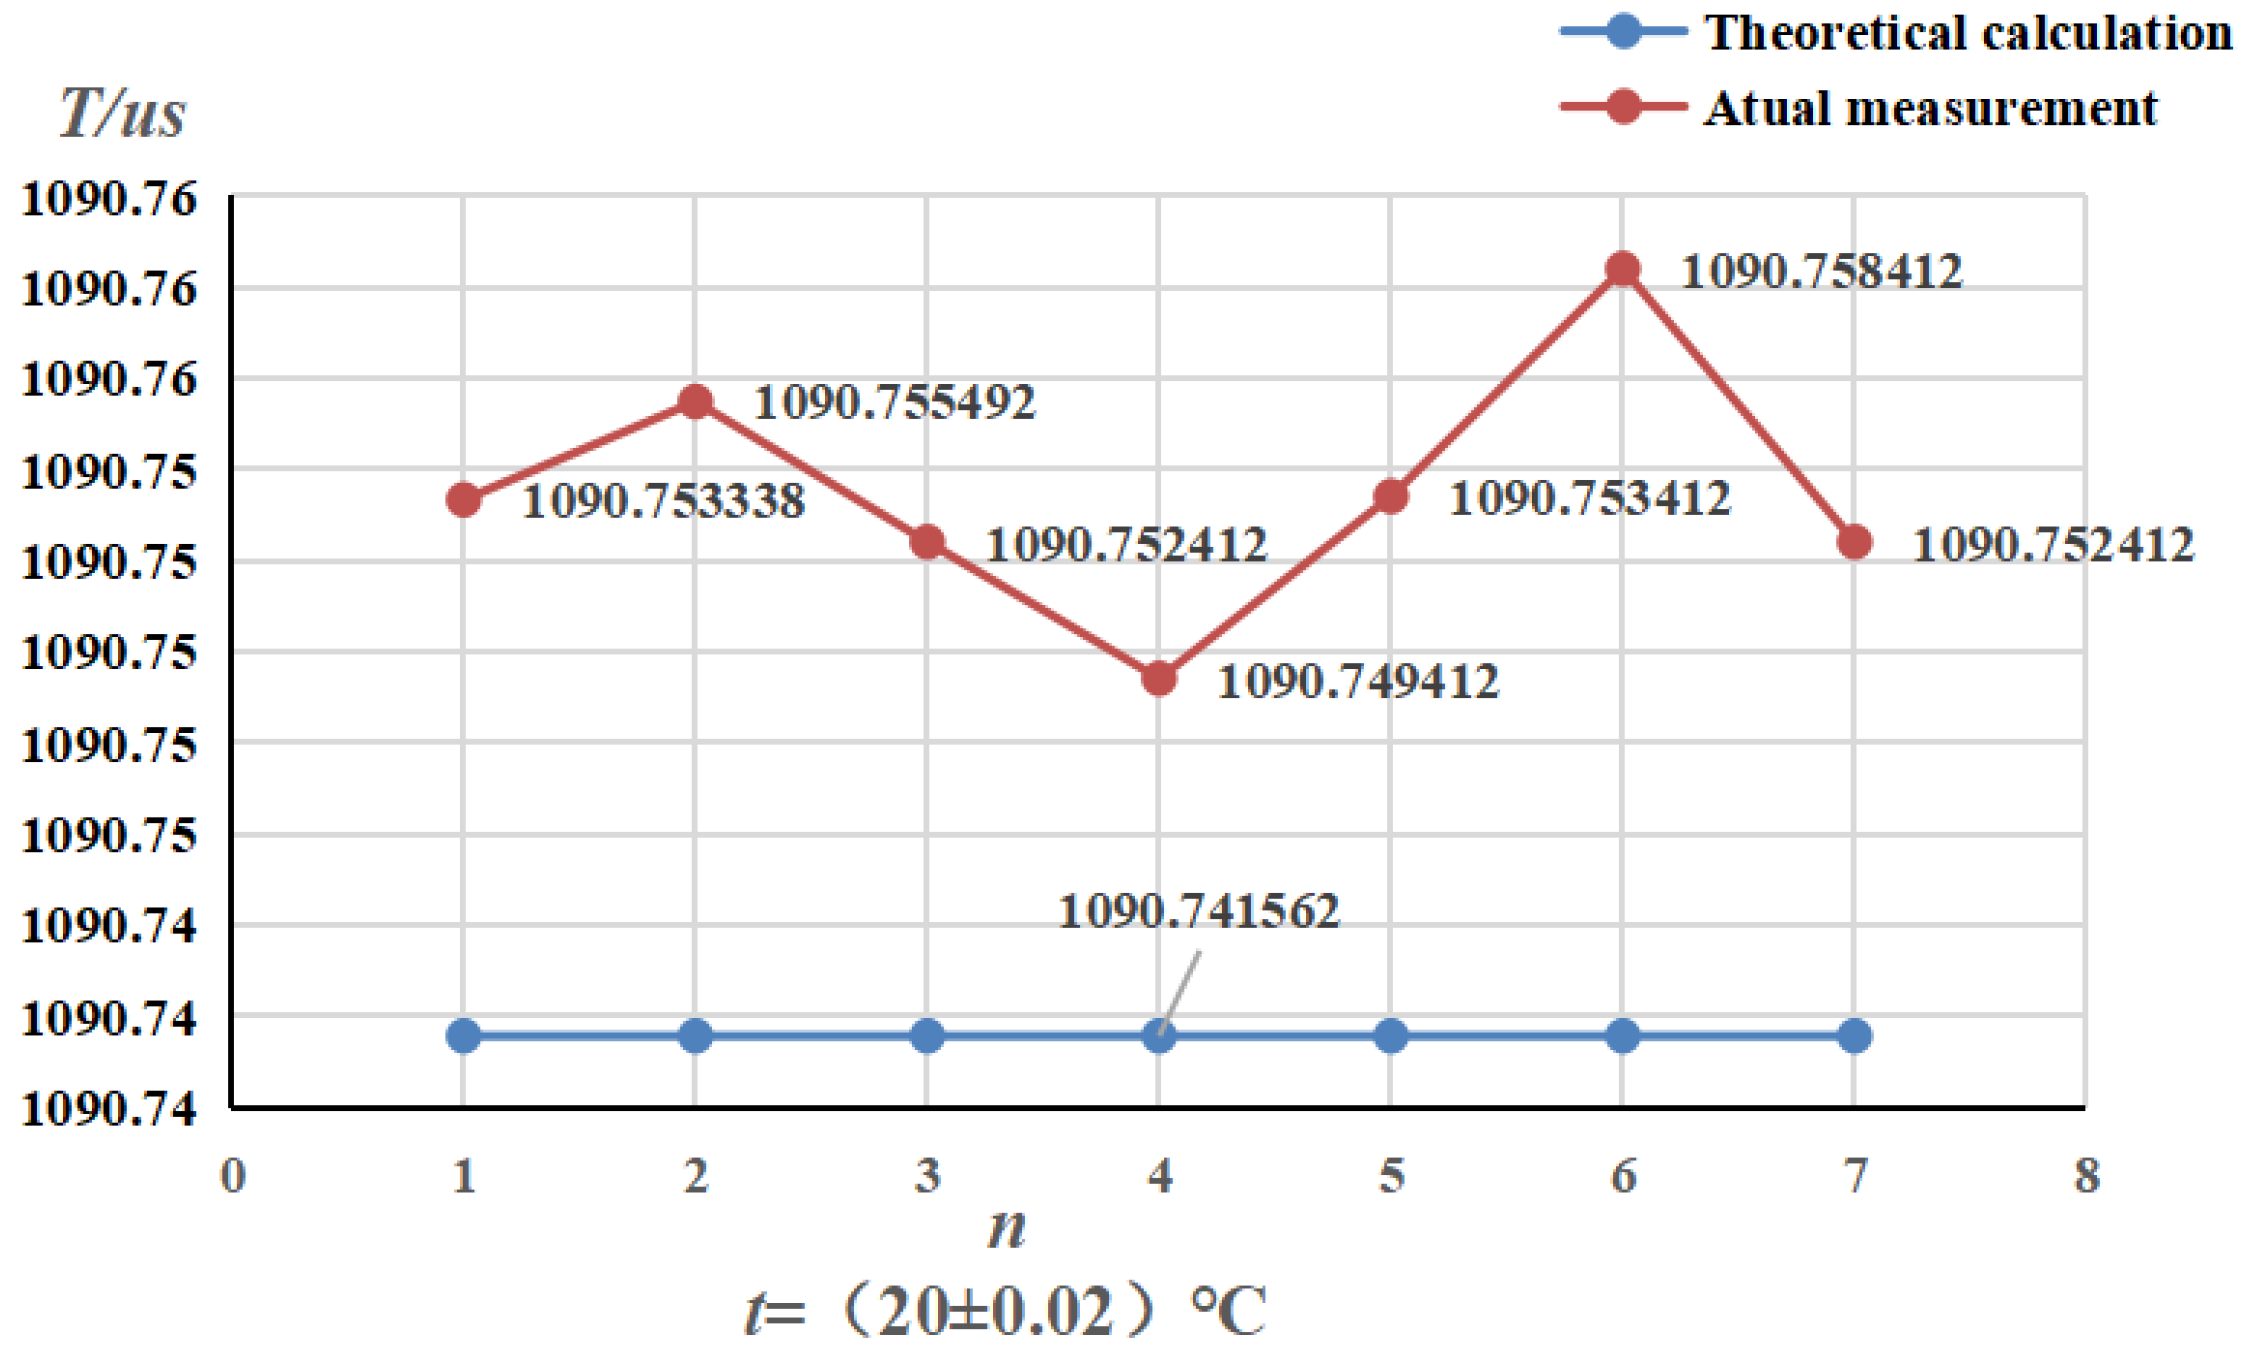
Figure 7.
Variation of air tube frequency for curved tube densitometer.
In (20 ± 0. 01) ℃, (756 ~ 1400) kg / m3 range of accuracy experiments, straight tube and curved tube change trend is consistent with the increase in density vibration frequency is also greater; in (15 ~ 45) ℃, respectively, selected five types of liquids for the temperature experiments, the two types of densitometers in the five types of liquids in the temperature experimental section of the change trend is also consistent with the increase in temperature vibration frequency Decrease, the trend of change and the theoretical derivation is basically consistent, indicating that the instrument has a good degree of differentiation and reasonableness, with the follow-up to carry out the experimental requirements.
From the change of ATC frequency, it can be concluded that the environment is maintained at 20 ℃ near the ATC frequency fluctuation is small, kept near the resonance and the theoretical value of the difference is not significant. Straight tube maximum ATC frequency fluctuation value of 0.009us, the average value and the theoretical value of 0.11us, curved tube maximum ATC frequency fluctuation value of 0.12us, the average value of the difference between the theoretical value of 0.27us. The ATC frequency change is small, and are kept near the resonance frequency, indicating that blowing is relatively clean and no risk of mixing in subsequent experiments. smaller, and are kept near the resonance frequency, indicating that the blowing is cleaner and there is no risk of mixing in the subsequent experiments.
Figure 8.
Distribution of fit errors for curved tube densitometers.
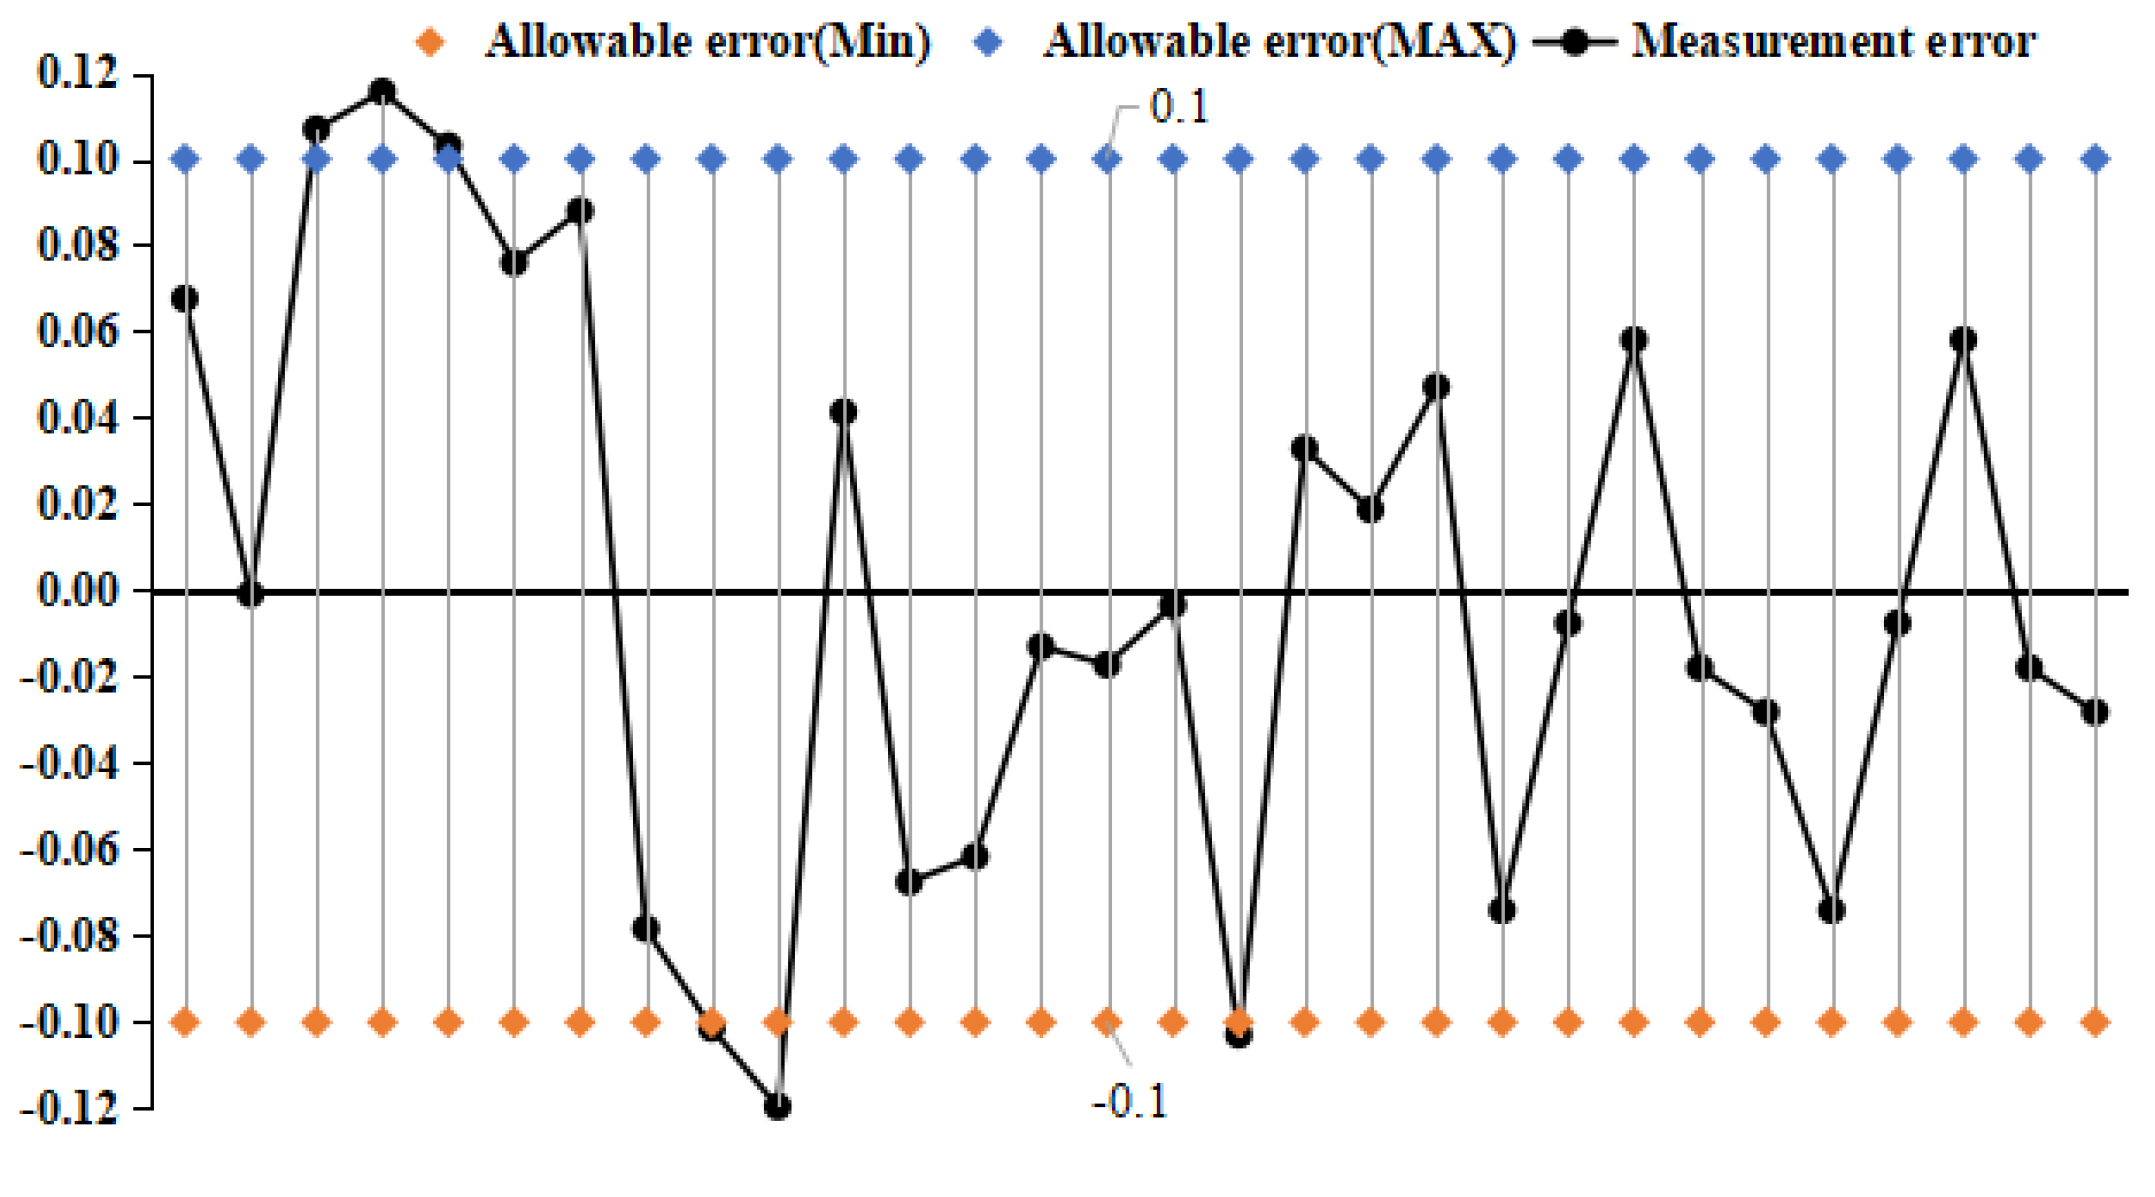
Figure 9.
Distribution of fit errors for straight tube densitometer.
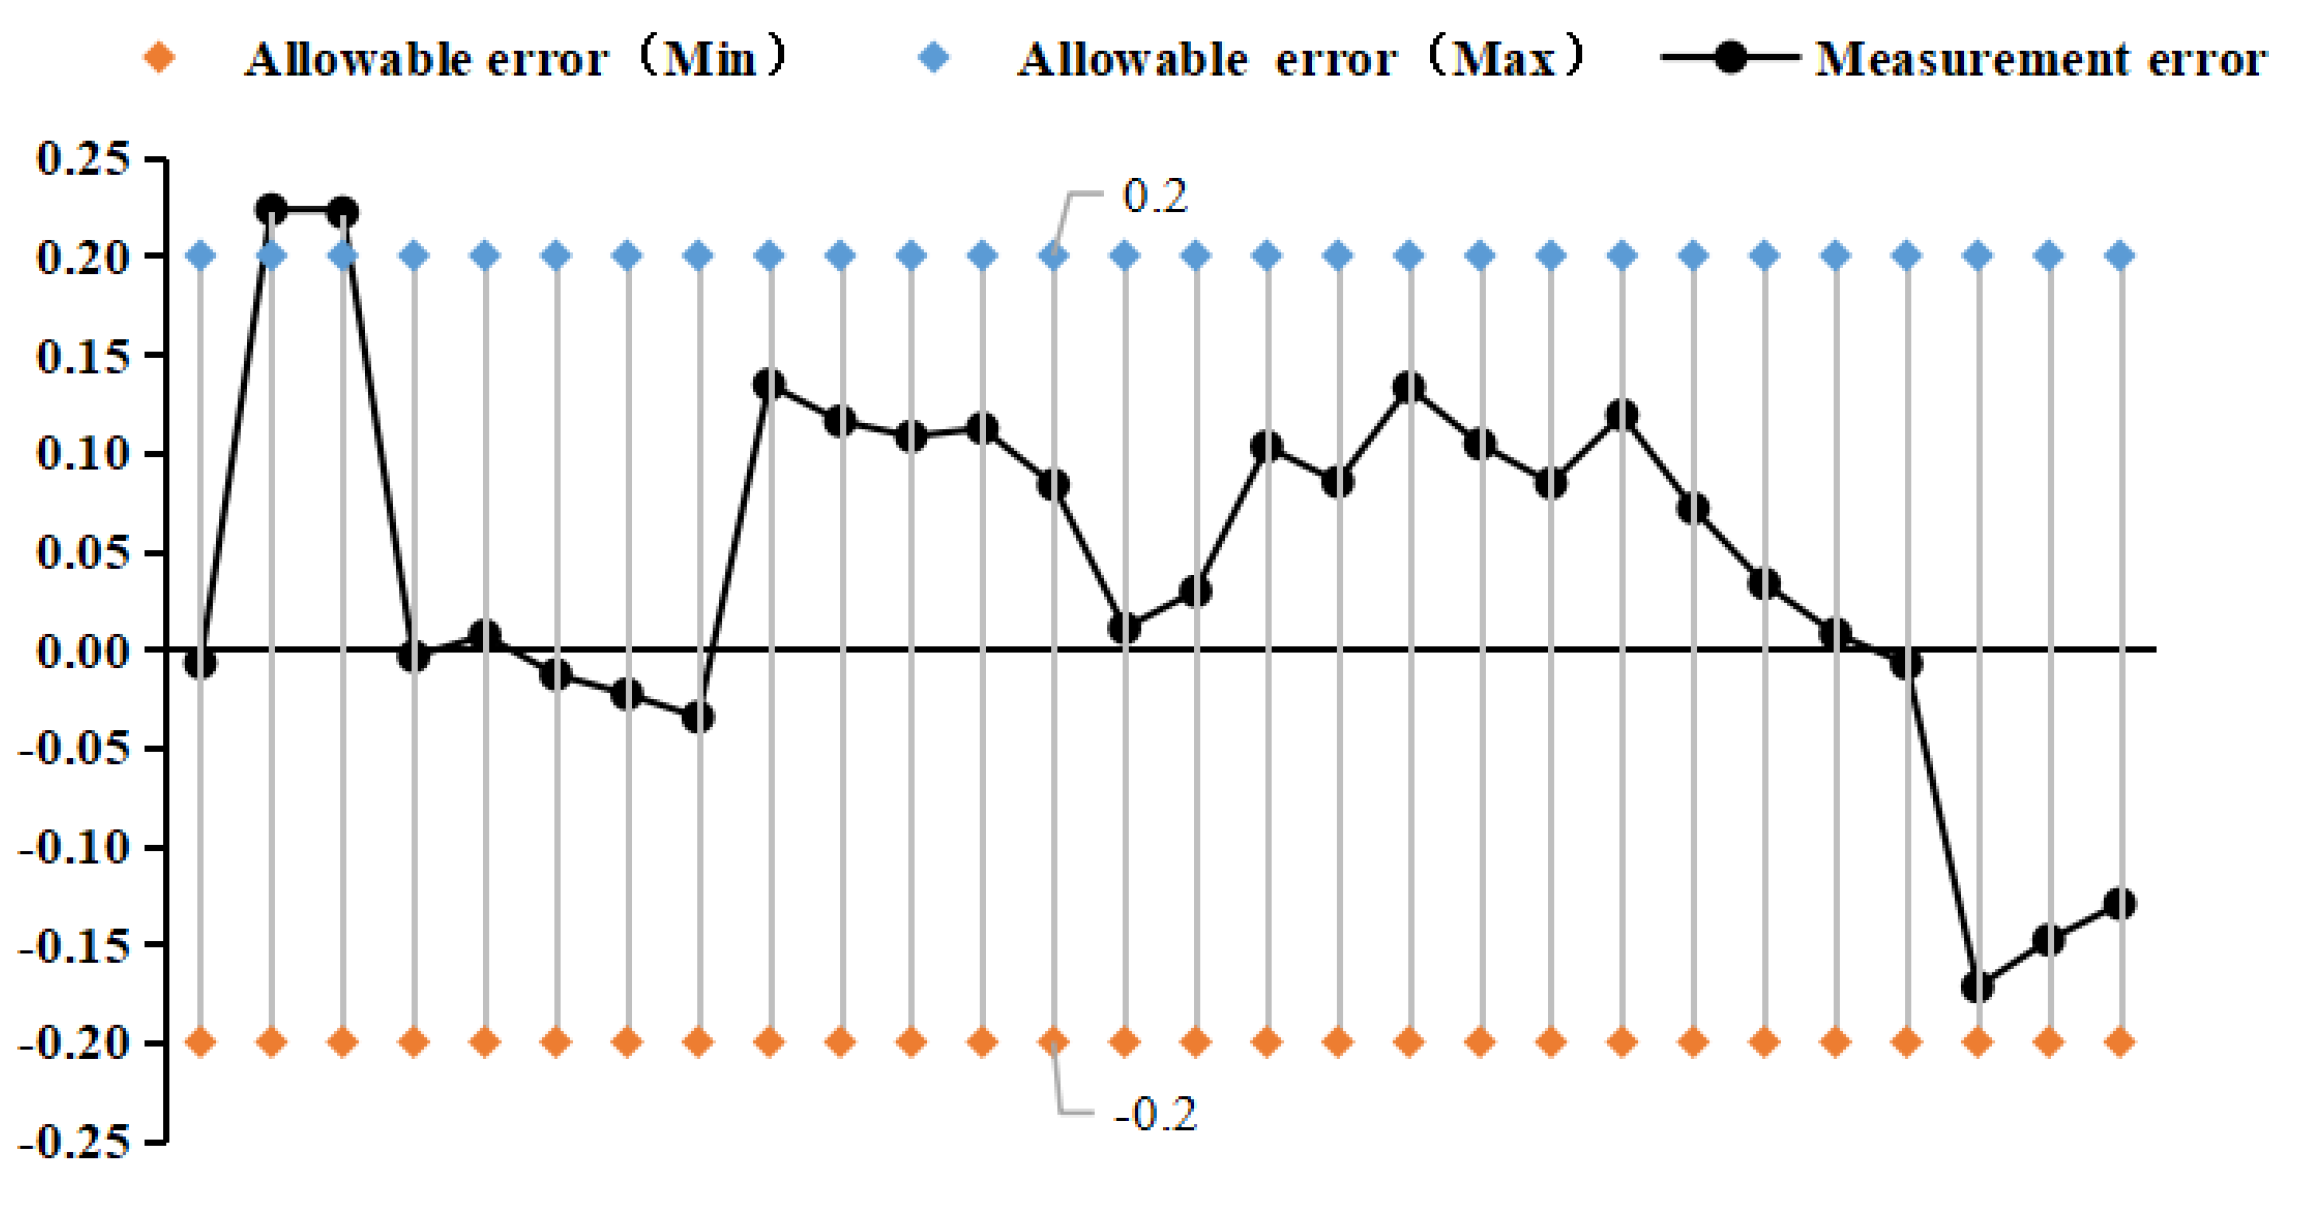
The Kx coefficients were derived from different liquids and vibration frequencies using the principle of least squares, and the experimental fit errors of the two densitometers were obtained by comparing the fitted densities derived from the fitting equations with the standard densities. From the fitting error distribution can be seen that most of the fitting error distribution falls within the nominal error. Straight tube type maximum fitting error absolute value of 0.22kg/m3, curved tube type maximum absolute error absolute value of 0.12kg/m3, are close to the nominal error.
4.2. Pressure Frequency Experiment
Six pressure test points are evenly distributed at (0~25) bar, and two liquids are selected for static pressure test to determine the vibration frequency of the tested densitometer at each pressure point. The pressure generation system uses printer DPI612 Flex series as the pressure generator, and water and tridecane are used as the pressure test liquids in the pressure test of this paper.
Figure 10.
Pressure generating system.
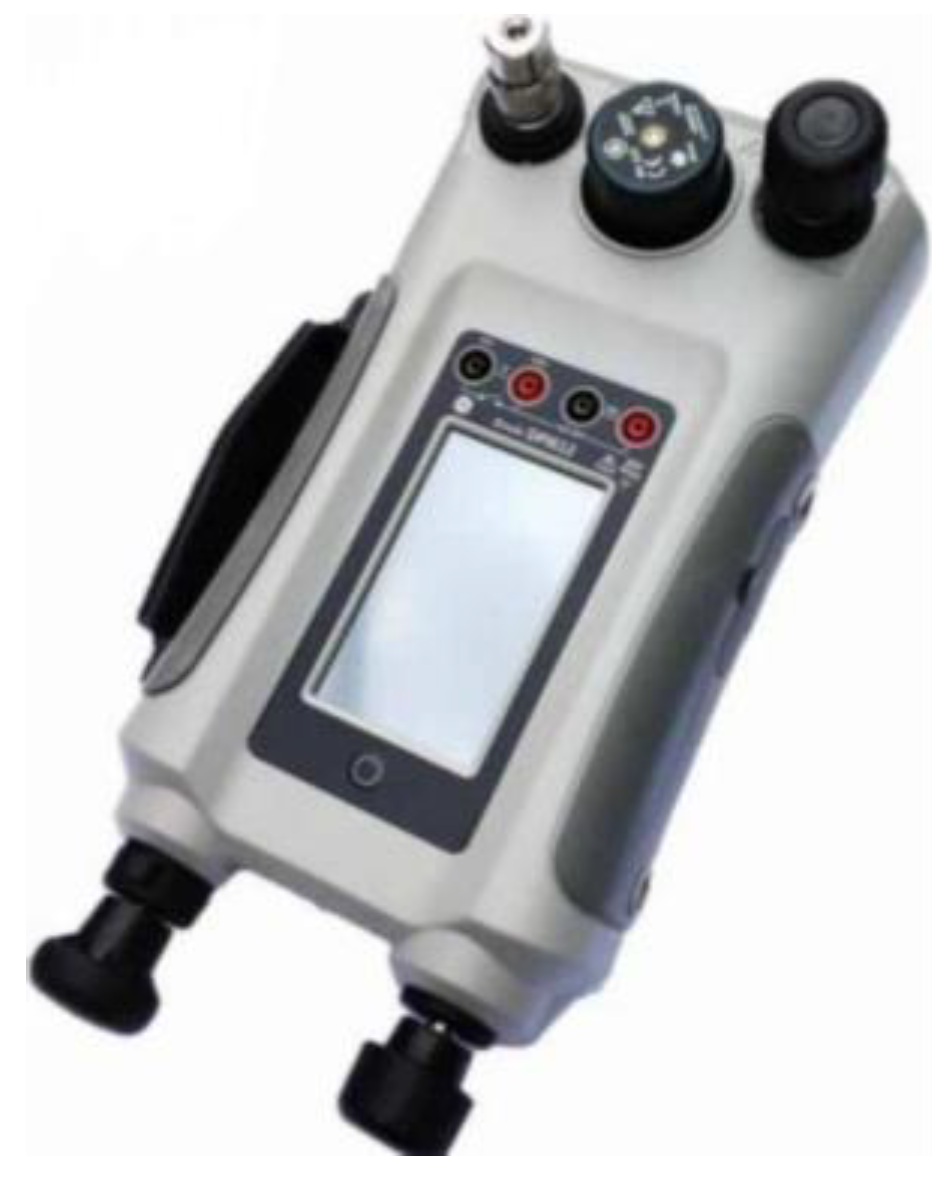
Figure 11.
Pressure frequency density experiment.
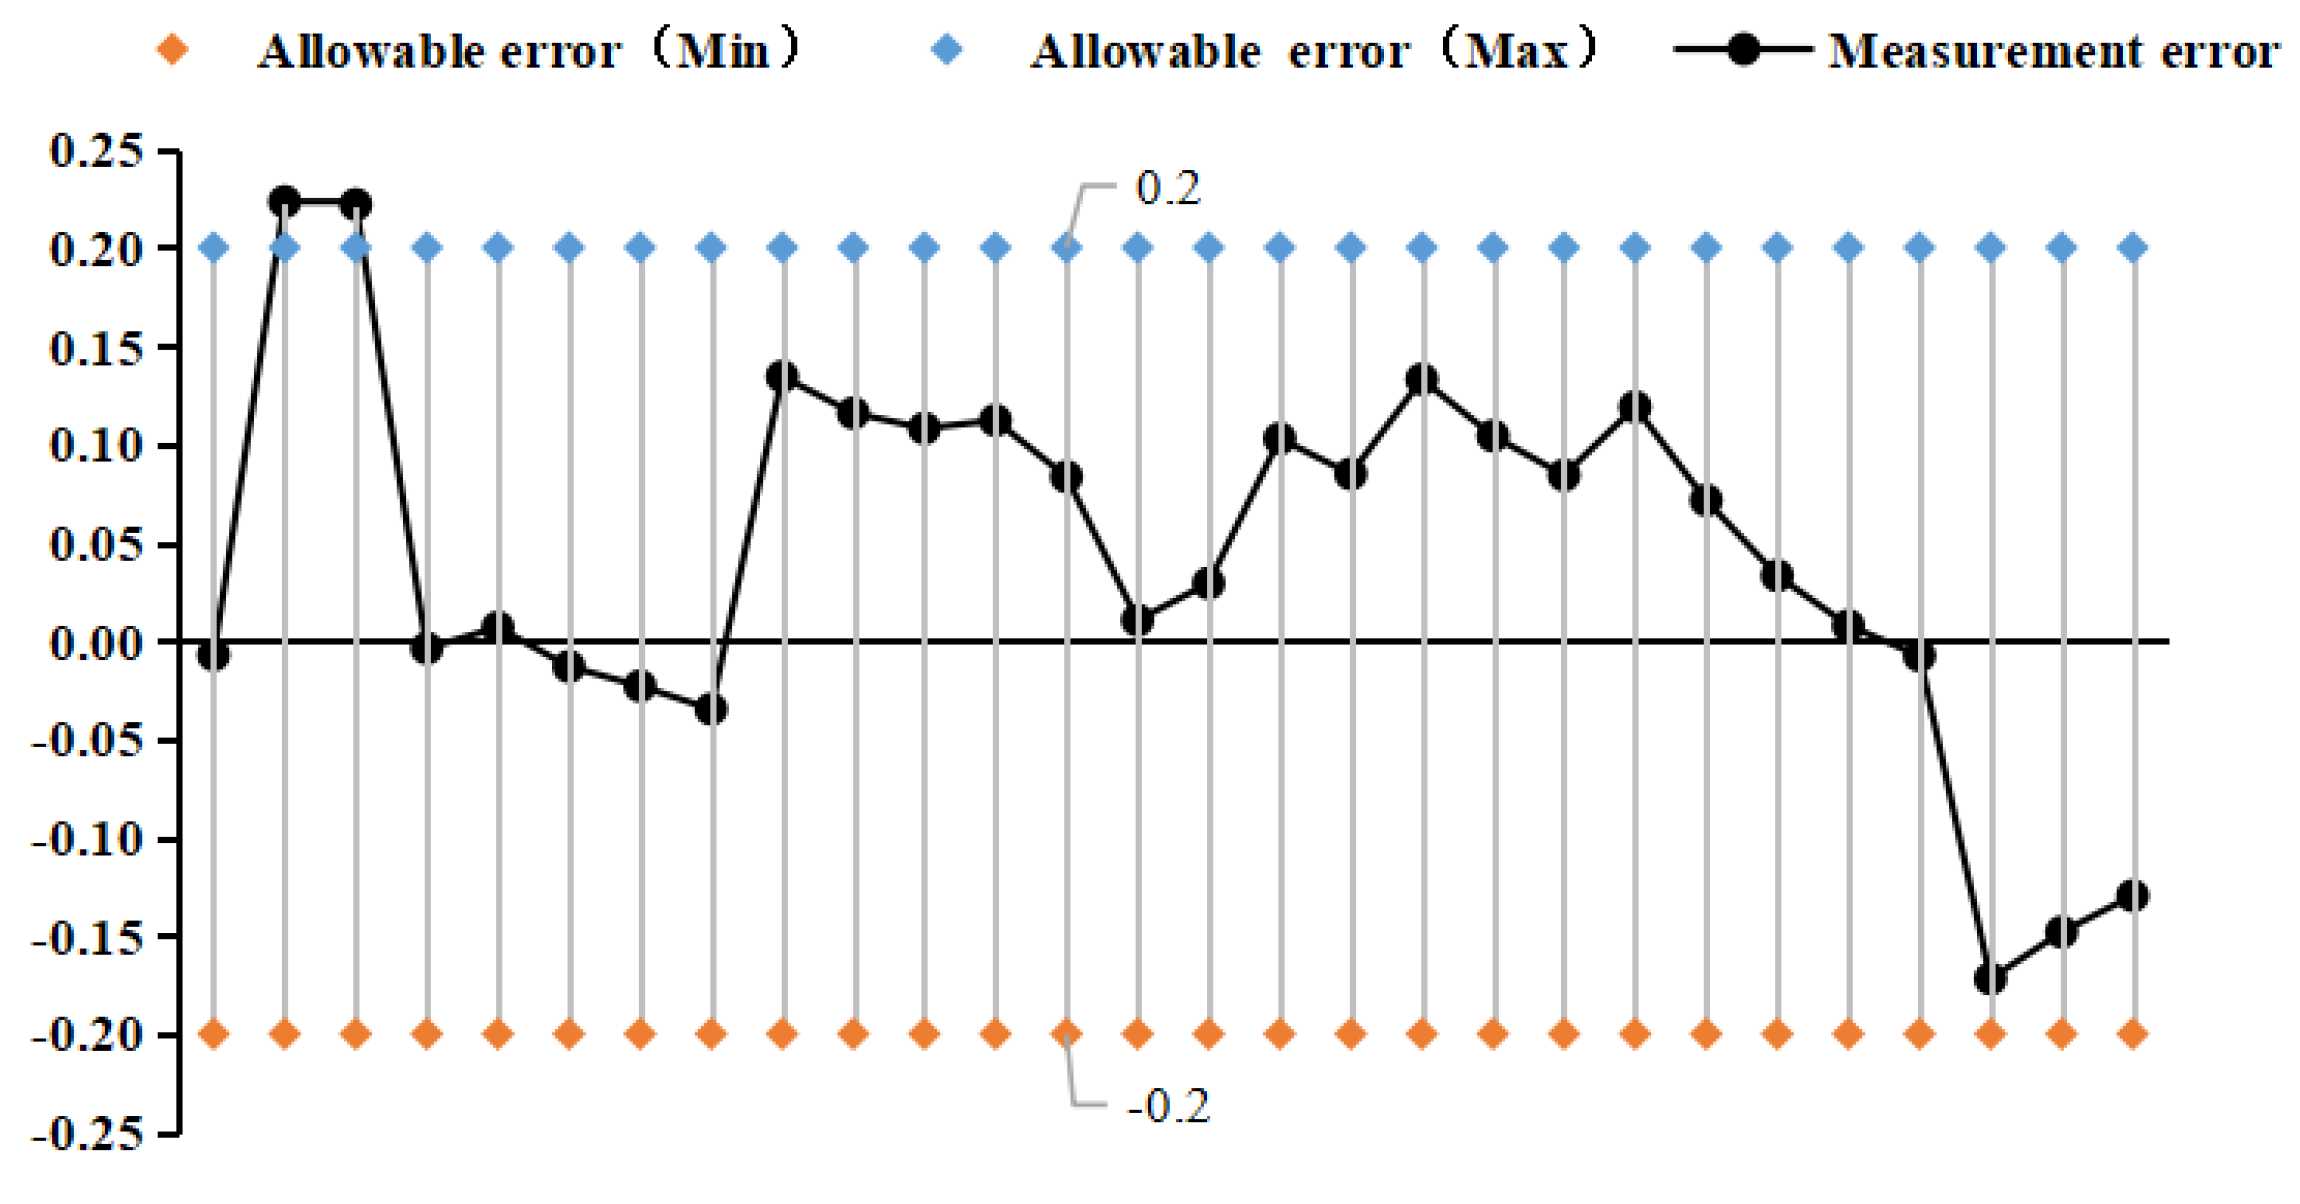
Figure 12.
Variation of vibration frequency vs. pressure for curved tube densitometer.
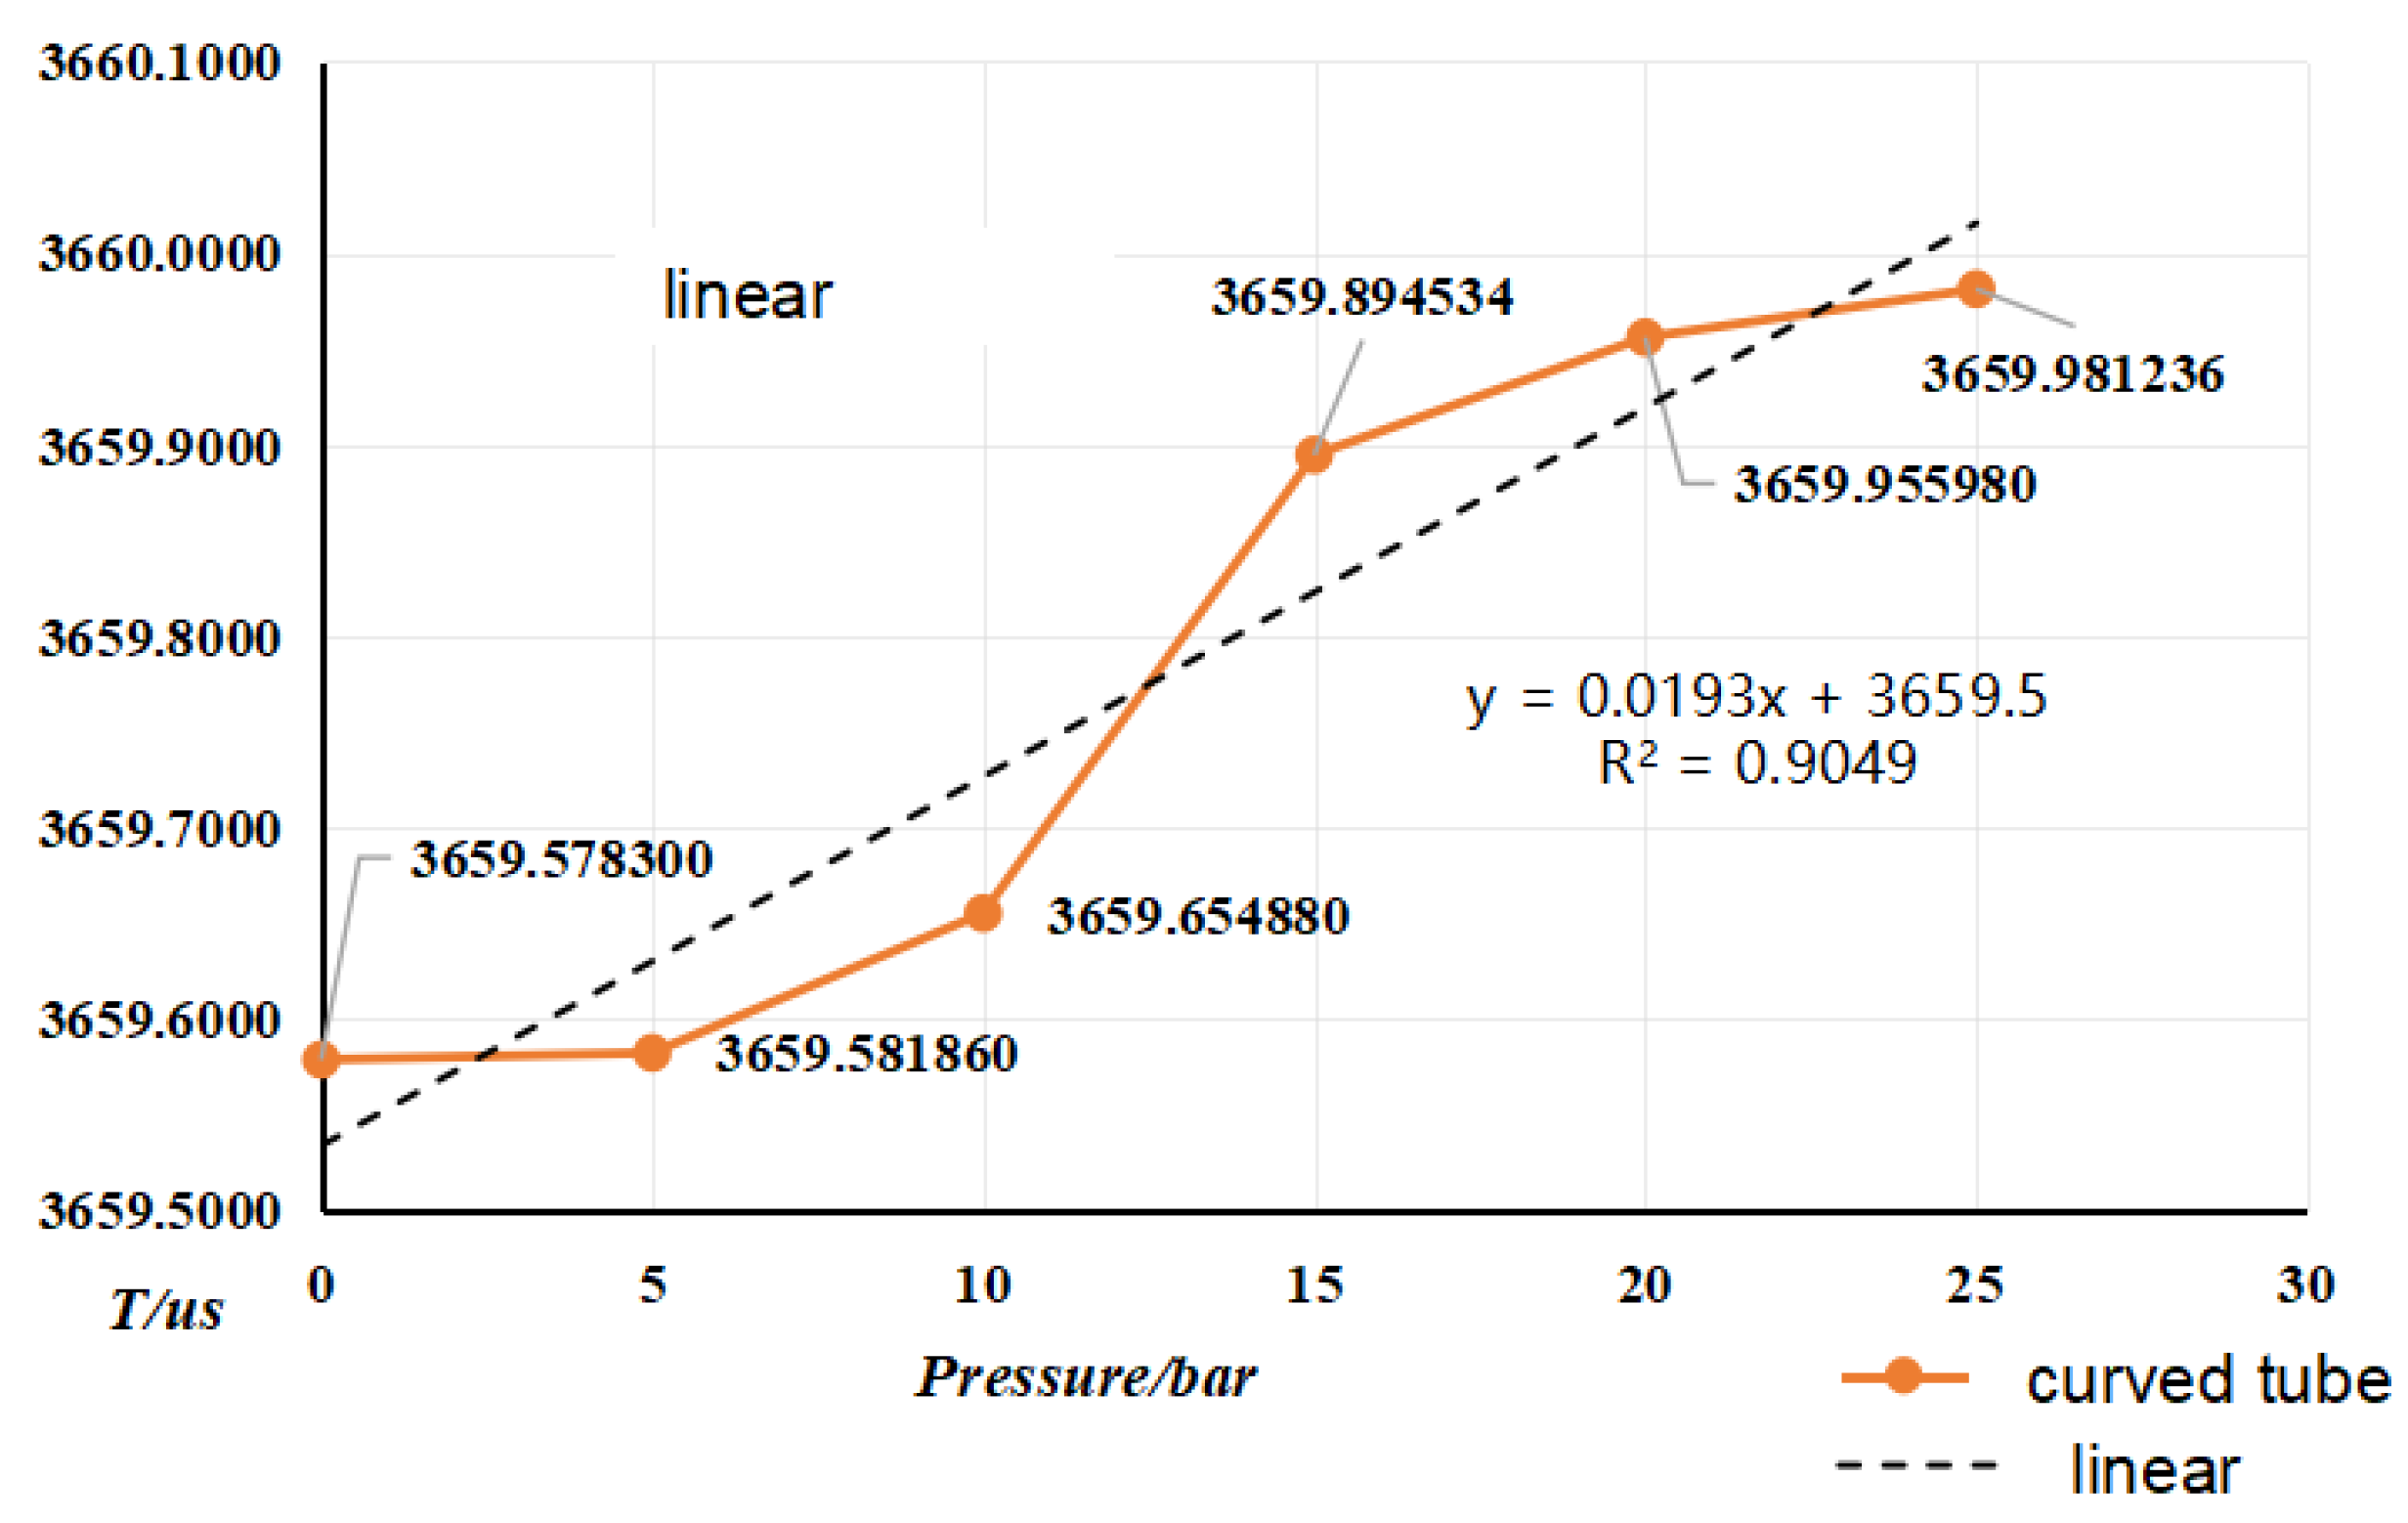
Figure 13.
Vibration frequency vs. pressure for straight tube densitometer.
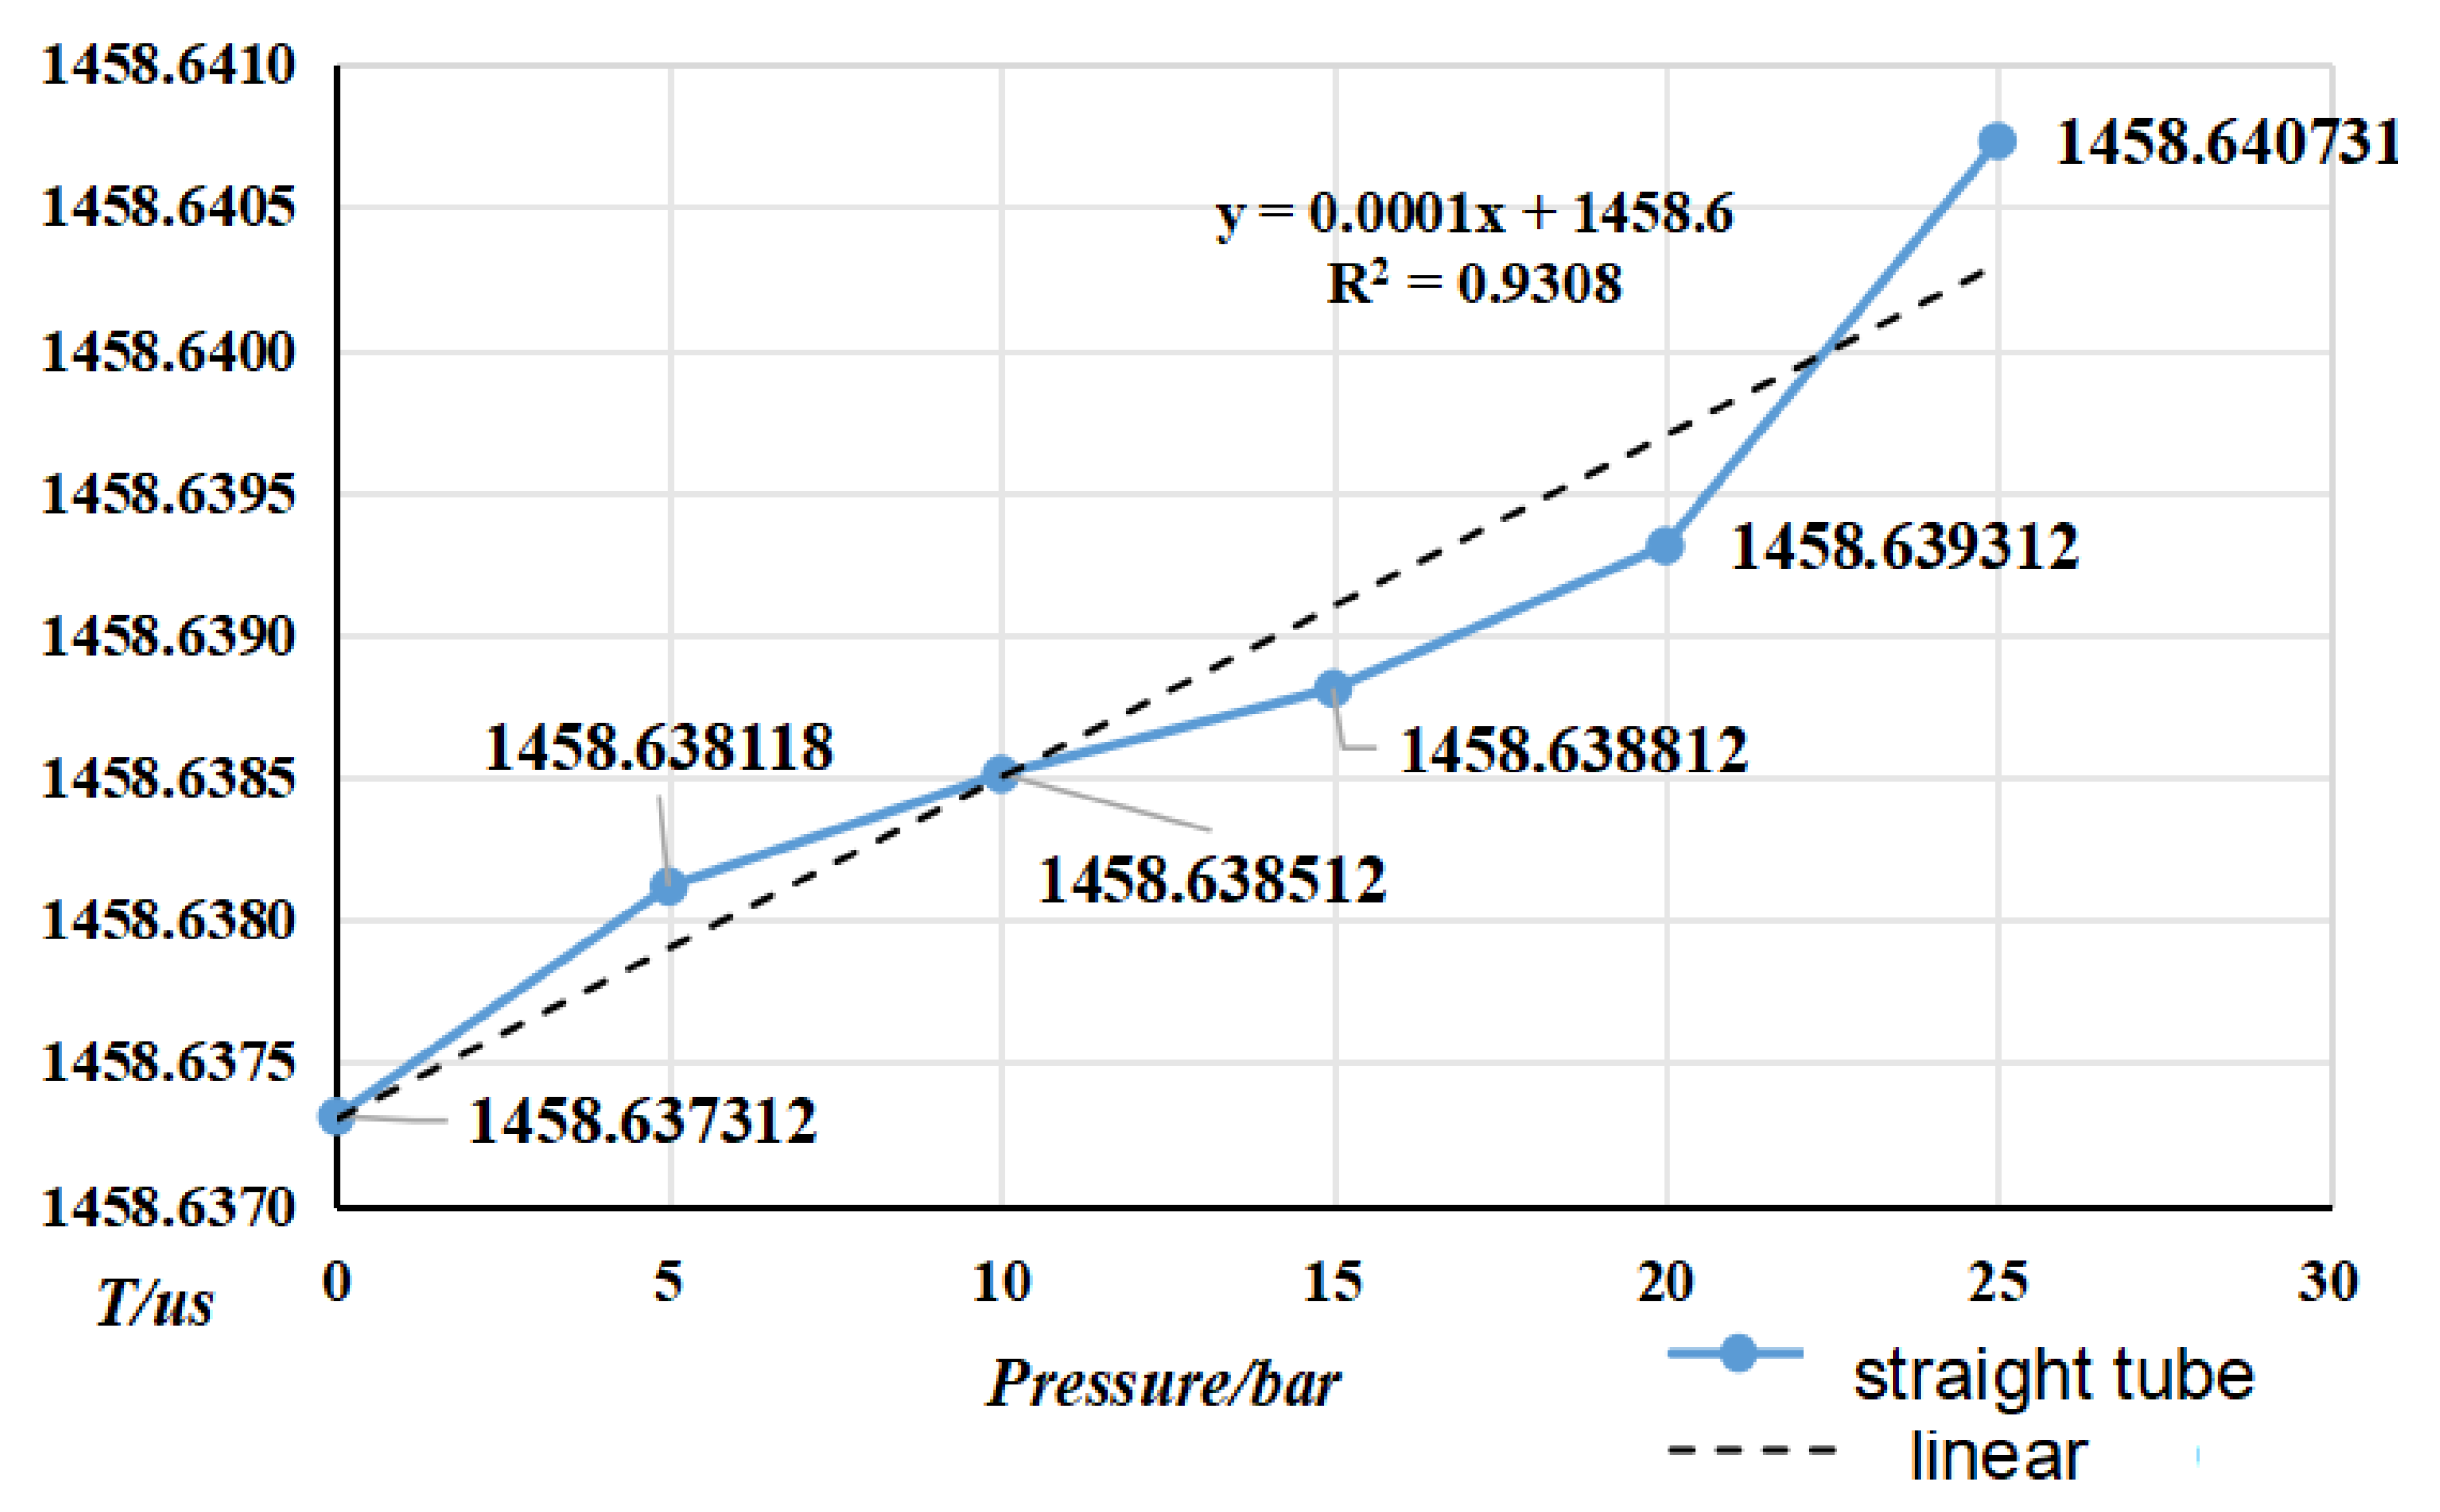
Table 5.
Pressure fit coefficients.
| fit factor | k20a | k20b | k21a | k21b |
| straight tube | -1.4209×10⁻⁴ | -2.74958E×10-7 | 1.88777×10⁻¹ | 2.47360×10⁻⁴ |
| curved tube | 1.49944×10⁻² | 0.00 | 0.00 | 0.00 |
By the vibration frequency and pressure can be seen vibration frequency with the increase in pressure and increase, a linear degree of adaptation, by the adaptation coefficient can be seen from the change in pressure and frequency is not a linear relationship. Vibration in the family type force and pressure under the action of the vibration tube impact is more significant, resulting in changes in the intrinsic frequency of the vibration tube. In addition, the increase in pressure in the pipe will lead to vibration pipe deformation at both ends of the bellows, equivalent elasticity coefficient K and the theoretical value of the deviation, resulting in resonance frequency is small, but the pressure and elasticity coefficient K change rule still need to be further studied. From the trend of change on the bending-type density meter by the pressure is more obvious.
6. Conclusions
For the online vibrating tube densitometer carried out theoretical research and the derivation of fitting equations, built a number of experimental devices, selected straight tube type and curved tube type two kinds of densitometer in (750~1400) kg/m3, (15~45) ℃, (0~25) bar to carry out densitometer metrological performance of the experiments, the main conclusions are as follows:
-

- A set of on-line vibrating tube liquid densitometer experimental device has been built based on the quantity and value transfer system, the whole device consists of desktop densitometer, multi-temperature thermostatic stirring system, walk-in thermostat, blowing system, frequency acquisition system, etc. The experimental research on 5 densitometers can be carried out at the same time under different temperatures and densities, and the device evaluates the accuracy of U=0.08kg/m3, k=2;
-
- Selected straight tube type and elbow type two kinds of densitometers, in (15~45)℃, selected five kinds of liquids to carry out on-line vibrating tube densitometer metrological performance of the experiment, concluded that different density vibration tube frequency with the increase in density and decrease with the increase in temperature; using the frequency and density values obtained from the experiments, calculated the K coefficient of the theoretical equations, and came up with the fitted density difference, the two kinds of densitometers fitted the error is basically in the nominal The fitting error of the two densitometers is basically within the nominal error, which indicates that the device has a good degree of differentiation and reasonableness; in (0~25) bar carried out on-line vibrating tube densitometer pressure-frequency experiments, it is concluded that the vibration frequency increases with the increase of pressure in the vibrating tube, the pressure in the pipe and the interaction of the Coefficients of the vibrating tube at both ends of the equivalent elasticity coefficient of the corrugated pipe K deviates from the pressure and the elasticity coefficient of the K change rule. Still need to further study, from the trend of change in the bend type density meter by the pressure is more obvious.
Through the experiment, the rationality and scientific of the device were verified, and the change rule of vibration frequency with temperature and pressure of on-line vibrating tube densitometer was studied, which has certain reference significance for the use of on-line vibrating tube densitometer and its subsequent application.
Author Contributions
Conceptualization, Y.S. and D.X.; methodology, Y.S.; validation, Y.S. and D.X.; formal analysis, D.X.; investigation, D.X.; resources, D.X; C.L and J.M.; data curation, D.X.; writing—original draft preparation, D.X.; writing—review and editing. D.X.;W.P.; funding acquisition, C.L; J.M. All authors have read and agreed to the published version of the manuscript.
Funding
This research was supported by Natural Science Foundation of Xinjiang Uygur Autonomous Region [grant number 2022D01B51].
Institutional Review Board Statement
Not applicable.
Informed Consent Statement
Not applicable.
Data Availability Statement
All data generated or analyzed during this study are included in this manuscript.
Acknowledgments
The authors would like to sincerely thank the Flow Center of Xinjiang Metrology Institute.
Conflicts of Interest
The authors declare no conflict of interest.
References
- Lagourette, B, C Boned, H Saint-Guirons, P Xans, and H Zhou. 1992. “Densimeter Calibration Method versus Temperature and Pressure.” Measurement Science and Technology, August, 699–703. [CrossRef]
- Wang, D.l.; Yang, T.T.;Mao, S.; et al.2019. “Analysis of liquid density measurement methods”. Measurement and Testing Technology, November,55-60. [CrossRef]
- Xu, C. “Research on online monitoring system of pipeline liquid density”. Harbin Institute of Technology, Harbin, China 2021. [CrossRef]
- Puttmer, A., P. Hauptmann, and B. Henning. 2000. “Ultrasonic Density Sensor for Liquids.” IEEE Transactions on Ultrasonics, Ferroelectrics and Frequency Control, January, 85–92. [CrossRef]
- L, F; Zhang, X.Z.; 2012 “Experimental study on the performance of single straight tube vibrating fluid densitometer”. Nuclear Power Engineering, December,19-22. https://kns.cnki.net/kcms2/article/abstract?v.
- Higuti, Ricardo Tokio, Flávio Buiochi, Júlio Cezar Adamowski, and Francisco Montero de Espinosa. 2006. “Ultrasonic Density Measurement Cell Design and Simulation of Non-Ideal Effects.” Ultrasonics ,302–309. [CrossRef]
- Zheng, D.Z.; Ji, Y. S.; Shang.S. F. 2012. “Design and Theoretical Analysis of a Resonant Sensor for Liquid Density Measurement.” Sensors, June, 320–324. [CrossRef]
- Yin, J.G.; Jiang. W.; Xian,Y. M.; and Ilmutdin Abdulagatov. 2011. “Compressed Liquid Density Measurements of Dimethyl Ether with a Vibrating Tube Densimeter.” The Journal of Chemical Thermodynamics, September,1371-1374. [CrossRef]
- Majer, Vladimir, Lü Hui, Rosa Crovetto, and Robert H. Wood. 1991. “Volumetric Properties of Aqueous 1-1 Electrolyte Solutions near and above the Critical Temperature of Water I. Densities and Apparent Molar Volumes of NaCl (Aq) from 0.0025 Mol·kg−1 to 3.1 Mol·kg−1, 604.4 K to 725.5 K, and 18.5 MPa to 38.0 MPa.” The Journal of Chemical Thermodynamics 23 (3): 213–229. [CrossRef]
- Aida, Tsutomu, Ai Yamazaki, Makoto Akutsu, Takumi Ono, Akihiro Kanno, Taka-aki Hoshina, Masaki Ota, et al. 2007. “Laser-Doppler Vibrating Tube Densimeter for Measurements at High Temperatures and Pressures.” Review of Scientific Instruments 78 (11). [CrossRef]
- JJF 1059-1999 “Measurement Uncertainty Assessment and Representation”.
Disclaimer/Publisher’s Note: The statements, opinions and data contained in all publications are solely those of the individual author(s) and contributor(s) and not of MDPI and/or the editor(s). MDPI and/or the editor(s) disclaim responsibility for any injury to people or property resulting from any ideas, methods, instructions or products referred to in the content. |
© 2024 by the authors. Licensee MDPI, Basel, Switzerland. This article is an open access article distributed under the terms and conditions of the Creative Commons Attribution (CC BY) license (http://creativecommons.org/licenses/by/4.0/).
Copyright: This open access article is published under a Creative Commons CC BY 4.0 license, which permit the free download, distribution, and reuse, provided that the author and preprint are cited in any reuse.


