Submitted:
22 April 2024
Posted:
24 April 2024
You are already at the latest version
Abstract
Balancing the efficiency and robustness of food systems is a well-known trade-off process. Over-optimization of efficiency may lead to excessive use of resources. On the other hand, under-optimization of efficiency may lead to excessive waste of resources. Using non-parametric methods can help in developing actionable frameworks through which decision-makers and stakeholders can effectively balance and improve food systems' efficiency and robustness. Under this context, this paper presents a new structured approach integrating two well-suited non-parametric methods for analyzing and balancing the interconnection between the efficiency and robustness of food systems. This approach consists of three main steps. First, the slacks-based data envelopment analysis (SBM-DEA) is utilized to analyze the efficiency of five food robustness dimensions. Second, the weighted efficiency of these dimensions is computed and analyzed to provide an insight into their influence on the food system efficiency. Finally, two search methods were developed to identify opportunities for improving efficiency and robustness. The outcomes of these methods have been analyzed and validated to ensure their effectiveness and viability. The operational and mathematical properties of the proposed approach were evaluated using data from thirty-seven food-producing countries. The weights of the robustness dimensions in this study were determined using the analytic hierarchy process (AHP) method. The input matrix of the AHP was constructed using expert judgment and consultations with stakeholders. The results of this study have shown an appropriate level of applicability and effectiveness of the proposed approach. While the first search method provided valuable insights, the second method proved to be more effective in identifying the sources of inefficacy of robustness dimensions. Several conclusions have been drawn and reported with some recommendations for future research works.
Keywords:
Data Envelopment Analysis (DEA)
; Food Systems Robustness
; Food Security
; Slacks Based Measure (SBM)
; Analytic Hierarchy Process (AHP)
1. Introduction
The trade-off between efficiency and robustness of food systems is important to reduce waste and ensure resilience to withstand shocks and disruptions. The success in achieving a better balance between efficiency and robustness depends on the level of consistency between the constraints and characteristics of the food systems, such as standards and regulations, food strategy and vision, diversification of resources, and technological innovation. Several managerial approaches for achieving this balance have been explored over recent years, such as cost-benefit analysis, demand forecasting, and resource optimization. Managerial approaches in food systems share a core set of principles that facilitate the adoption of methods and performance comparison across all industry scales. The selection of the method mainly depends on the specific goal and objectives of the industry, which may vary from improving productivity, enhancing customer satisfaction, improving food security and resilience, etc. While these approaches have been widely known for their ability to provide robust solutions, their applicability and effectiveness may encounter serious challenges relevant to data structure analysis, data accessibility, data dynamicity, and estimating relative weights.
Data structure analysis is important to understand the complex relationship between the factors and dimensions influencing the food system's efficiency and robustness. Failing to utilize the appropriate methods of data analysis may lead to skewed and incredible results that do not accurately reflect the underlying food system's efficiency or robustness. For instance, the lack of understanding of the consequences of climate change and then the factors related to this natural crisis, such as water scarcity, availability of agricultural land, and crop diversity, may lead to a short-term enhancement of food system efficiency at the expense of long-term food system robustness. Some of the data structure methods are, are outliers’ detection, data flow analysis, and correlation analysis (Abdella et al. 2019a).
Data accessibility is critical to ensure enough size and type of datasets. Utilizing incomplete or inappropriate datasets may result in unacceptable levels of data uncertainty posing critical challenges in providing a comprehensive insight into the food system performance and hence identifying areas of optimization. For instance, when a dataset describing the amount of electricity consumed is incomplete, the results may reveal an insignificant impact of this factor on the food system efficiency, which is the opposite of the fact that the electricity consumption significantly impacts the food system performance at least in both enhancing productivity (+ve impact) and increasing cost (-ve impact). Involving a wide range of stakeholders and practitioners is one of the well-known approaches for validating the selected subset of factors and dimensions. This approach is very important to ensure that the selected factors are enough to expose the unseen issues and provide key factors that significantly influence both the food system's efficiency and robustness. These days there are several reputable sources and databases related to food systems on local and global levels. These sources and databases adopt reliable data collection and analysis methods.
Data dynamicity is the opposite of static data. Data dynamicity refers to data that constantly changes over time, which is a common feature of food systems data. Managerial approaches utilizing static data lack comprehensive and futuristic insight into opportunities for balancing food system efficiency and robustness. The situation gets worse when factors of dynamic nature are included, such as the ratio of urban population, food demand, and diversity of food stocks. Utilizing methods considering changes in food system factors and dimensions over time helps decision-makers and stakeholders to develop solutions more effectively to maintain an appropriate balance between food system efficiency and robustness. Some of these methods are time series analysis, system dynamic models, and linear mixed regression models.
The composite indicators are widely utilized to provide a comprehensive overview of food system performance. The composite indicators assess the system’s efficiency or robustness by combining several indicators into a single index, such as efficiency ratio, robustness, and cost efficiency. However, the relative weights assigned to the indicators (or factors) become essential to the composite indicator’s effectiveness. In such a case, weighing methods that involve the stakeholders are more recommended. Individuals and stakeholders with enough knowledge and experience with food systems can significantly contribute to assigning relative weights reflecting the importance of indicators (or factors) to the food system’s capacity. This process should be conducted by meeting individuals with enough knowledge and experience with food systems. Due to the variety of principles and procedures of existing weighing methods, Section 2 will be dedicated to briefly introducing some of the most known of these methods.
However, the need for overcoming these challenges has become critical to developing methods that are more robust to these challenges and can capture the relationship between food system efficiency and robustness and provide stakeholders and decision-makers with opportunities for balancing these two food system performance measures.
2. Existing Weighting Methods
Several weighting methods have been developed and examined over the last decade. Using expert opinions or stakeholder inputs to assign weights to food system indicators (or factors) is widely spread among these methods; see Nardo et al., )2005( and Saisana )2012(. Selecting individuals with enough years of experience is important to avoid the influence of personal biases and subjective opinions; see Reisi et al.)2014(. Despite the approach being extensively criticized in literature, it is still applied in various contexts due to its computational simplicity and applicability.
Using analytical approaches for weight estimation is another promising research trend. These approaches can be used separately or in combination to understand the food system’s performance comprehensively. Several techniques commonly utilized in literature include the Analytic Network Process (ANP), Analytical Hierarchy Approach (AHP), and Technique for Order of Preference by Similarity of Ideal Solution (TOPSIS). Although these methods can be useful for their involvement of stakeholders, it is essential to consider the time-consuming and labor-intensive, especially under a high-dimensional space of indicators; see Doa'a et al., 2022; Kutty et al., 2020.
Several weighting methods utilizing statistical principles such as principal component analysis (PCA), factor analysis (FA), and multiple regression analysis (MRA) have been examined and validated to generate relative weight under different research contexts; see Cherchye et al., )2007(; Saisana, )2012(; Kao & Hung, )2017(; and Zhang et al., )2008(. However, these methods differ from the expert-based weighting methods in their heavy dependence on generating weights from the data. Hence, any violation of the statistical assumptions of the weighting method may significantly affect the accuracy of the estimated weights. The PCA is considered more favorable compared to other statistical models (Kao & Hung, 2017) because it relies on actual data variability (Zhang et al., 2008; Reisi et al., 2014). The PCA assumes that the indicators are linearly related and of equal importance.
The MRA methods have also received notable attention in recent years; see Gan et al., )2017(; Gallego-Álvarez and Ortas, )2017(; Becker et al., )2017(; Azzurra et al., )2019(; Beekaroo et al., )2019(; Abdella et al. (2019a-b). The MRA methods are particularly important in measuring the efficiency and robustness of food systems when the food system performance is modeled using both input and output indicators (Kutty et al., 2022a-b). The MRA methods help to understand the relationships between input-output indicators and hence facilitate the establishment of the relative weights for each indicator (Nardo et al., 2005). The last decade has witnessed a notable trend of extending the application of advanced MRA based-weighting methods, such as ridge regression, least absolute shrinkage and selection operator (lasso), and elastic-net regression (Abdella et al., 2019c-2020; Onat et al., 2021). The accuracy of the weights generated by these methods remains an active area of research, particularly in various contexts like sustainability and eco-efficiency assessment (Kutty et al. 2022a-b).
However, despite the variety of weighting methods, there is still no stand-alone method that can fit all research contexts. One common feature among all of these methods is that their effectiveness is heavily influenced by the success of involving individuals and stakeholders from the underlying industry with appropriate knowledge and experience.
3. Research Contribution and Significance
This paper introduces a non-parametric-based approach aiming to provide decision-makers and stakeholders with a realistic data-driven tool to effectively balance the trade-off between food system efficiency and robustness while simultaneously enhancing the overall food system resilience. The approach is structured in a way; see Figure 1, to include three modules. Each module aims to achieve specific objectives as described below:
Module 1 (Data Integration and Management): This module involves procedures to be followed to develop the I-O impact matrix. Mainly three steps are involved in this module. These are 1) selecting the input-output indicators, 2) developing the AAEEG impact matrix, and 3) weighing the AAEEG dimensions (availability, Affordability, Economic, Environmental, and Governance). Some other steps might be added to this module to ensure the consistency and credibility of the impact matrix, for instance, outlier detection, data imputation, dimension reduction, and data normalization.
Module 2 (Optimizing SBM-DEA Model): This module discusses the outcomes of the SBM-DEA model. The practitioner should examine the efficiency scores of all DMUs and categorize the DMUs into two groups, namely efficient and inefficient DMUs. Comparing the scores of the DMU across the five dimensions (AAEEG) can help in providing a comprehensive insight into the performance of the underlying DMU. Further analytical and comparative studies can also be added to this step for benchmarking. This step is recommended when the DMUs belong to a specific industry. For instance, sectors, facilities, departments, etc.
Module 3 (Investigating Improvement Plans): This module describes the procedures for exploring opportunities for balancing food system efficiency and robustness. In this module, a composite index is constructed to evaluate the technical efficiency across various robustness dimensions. The results are then analyzed using defined criteria to pinpoint the indicators that necessitate intervention to improve their efficiency and, consequently, the overall robustness of the underlying dimension(s). The role of stakeholders and practitioners in this module is to determine the extent of improvement required for low-performing indicators (or dimensions), taking into account the study's specific goals and objectives.
The significance of the proposed approach mainly lies in its ability to overcome challenges encountering the applications of several existing managerial-based approaches. Below is a list of distinctive advantages of the proposed approach:
- Utilizing the SBM-DEA, as one of the well-known non-parametric (distribution-free) methods, provides flexibility to incorporate a wide range of indicators (or factors) without imposing distributional assumptions. These methods are also valuable for their robustness to the impact of outliers and extreme values on the credibility of the findings. These methods are also advantageous due to their ability to handle the influence of outliers and extremes on the credibility of the findings and conclusions.
- Utilizing the input-output-based SBM-DEA model is important to provide stakeholders with opportunities to incorporate not only input indicators but also output indicators to reveal not just the resources available but also how efficiently these resources are used to achieve the desired food system outcomes.
- Utilizing the AHP promotes the incorporation of stakeholders and practitioner expertise. This collaborative approach provides them opportunities to assign relative weights to different indicators (or factors) and also to determine the low-performed robustness dimensions. This participatory feature would enhance the applicability of this approach to be easily extended to and repeatedly used across different food system levels, in which the indicator’s weight may vary at each level.
The remaining sections of the paper have been structured as follows: Section two introduces different DEA-based ranking techniques. Section three discusses the different orientation-based approaches of the DEA and the computational model of the slack-based model-based DEA. Section four introduces the proposed approach through an illustrative example using 37 food-producing countries. Finally, section five reports the research findings and recommendations.
4. Methods and Techniques
4.1. Slack Measure-Based DEA (SBM-DEA)
The DEA is a non-parametric data-driven approach that helps to assess the effectiveness of decision-making units (DMUs) (Mardani et al., 2017). The DMUs is an entity or a system that converts input into outputs. The DEA ranks the DMUs based on their efficiency scores. Several DEA models have been proposed and evaluated. The slack-based DEA (SBM-DEA) model is the most widely known among these models. The SBM-DEA is an advanced DEA model using the slack term (, and ) to identify ineffective DMUs and highlight by how much these DMUs can adjust their input or outputs to reach where a DMU can decrease its inputs or increase outputs without impacting its efficiency score (Mardani et al., 2017; Pastor et al. 1999; Tone 2001). The SBM-DEA model compares the DMU’s inputs and outputs to those of its peers and determines the extent to which the unit falls short of achieving the same output level with the same level of inputs. The SBM-DEA approach helps identify an inefficient DMU and benchmark its efficiency performance versus its counterpart DMUs.
The efficiency score for each DMU indicates the extent to which it can achieve the best possible efficiency performance, subject to its input and output requirements. However, according to Tone (2001), a DMU is considered an efficient DMU when it fully utilizes its resources to achieve its desired outputs. For further reading and information regarding the slack measure properties see Banker et al. (1984), Tone (2001), Azizi et al. (2015), and Arabi et al. (2017), Tran et al., (2019).
4.2. Analytic Hierarchy Process (AHP)
The AHP is a structured decision-making approach developed by Saaty (1977, 1980) to prioritize alternatives based on multiple criteria and sub-criteria. The AHP is widely used for weighting and prioritizing criteria in decision-making processes. The AHP uses a hierarchical structure to represent the problem and allows decision-makers to compare and prioritize different criteria and alternatives based on their relative importance; see Chaiyaphan et al. (2020), Ersoy (2021, Abdella et al. 2021b). Figure 2 illustrates a typical hierarchal structure of the AHP with number of decision criteria and number of generated alternative solutions.
The consistency ratio (CR) serves as an essential tool in the AHP to evaluate the consistency of pairwise comparisons made by decision-makers, ensuring their judgments are reliable and consistent. CR is computed by dividing the consistency index (CI) by the random consistency index (RI); see Equation 1. The resulting ratio should ideally be less than 0.1 for the comparison to be considered consistent. When CR ≤ 0.1, the judgment matrix has acceptable consistency; otherwise, the decision-maker may need to revise their judgments (Garoma et al., 2014).
The CI is calculated using Equation 2, where max is the maximum eigenvalue obtained by multiplying the total sums vector by the weighted values vector for paired comparisons, and represents the number of decision criteria being compared.
When CI = 0, the judgment matrix has completion consistency, as CI increases, the degree of consistency decreases. The RI is a reference value based on the size of the number of criteria being compared; see Aguarón & Moreno-Jiménez (2003). The RI values for matrices of different sizes are pre-defined and can be found in tables; for instance, see Saaty (1980).
5. Illustrative Example
This section provides a practical illustration to demonstrate the operational and mathematical procedures of the four modules shown in Figure 1.
5.1. Selecting Robustness Indicators
The effectiveness of the proposed approach heavily relies on carefully selecting the appropriate inputs and outputs to measure the efficiency of food robustness dimensions. Therefore, two selection approaches were followed in this study. First, several previous research works under the same context were reviewed, and the most relevant inputs and outputs indicators were selected. Second, several experts were consulted to assess and validate the relevance of the selected indicators to the efficiency of food robustness dimensions.
This example uses a set of 30 (25 inputs and 5 outputs) indicators of 37 food-producing countries. Table 1 reports these indicators with their symbols and measurement units. The selected indicators were distributed over five robustness dimensions (AAEEG) based on managerial and computational considerations. The selected input-output indicators are aligned with the 17 goals of the sustainable development goals (SDGs). The matter provides governmental policymakers with data-driven in establishing the regulatory environment, investing in infrastructure and research, and allocating resources to support the development of robust and sustainable food systems.
The availability dimension consists of five input indicators and one output indicator to measure the ability of a food system to provide a sufficient and reliable food supply to society. The availability dimension consists of six input indicators and one output indicator to represent food production, distribution, infrastructure, and logistics. The accessibility dimension consists of six input indicators and one output indicator measuring the capability of individuals to access safe and sufficient food. The economic dimension consists of six input indicators and one output indicator to measure the economic outputs and externalities of the food system. The environmental dimension consists of six input indicators and one output indicator to measure the impacts of food system activities on the surrounding natural environment. Finally, the governance dimension consists of two input indicators and one output indicator describing the interactions between food production, processing, and consumption concerning the different drivers of food systems.
5.2. Developing Impact Matrix
The study employs data from various sources, including the Food and Agriculture Organization (FAO), World Bank, Organization for Economic Co-operation, and Development (OECD), Eurostat, and global economic data statistics. Using the feature scaling method, we transformed the matrix into common scales. This step is important to ensure the indicators are uniformly represented and comparable across different dimensions. The normalized scores of the input and output indicators can be computed using Equations 3 and 4, respectively:
where (, ) and (, ) represent the maximum and minimum scores of the ith input and rth output indicators. The pairs ( and ( are predetermined constants for the range of and , respectively. The two pairs of constants were set at their customary values (0,1), and then Equations 3 and 4, above, were used to generate the normalized pairs and of matrix. The new version of the matrix will be referred to as .
5.3. Weighting Robustness Dimensions
This paper uses the AHP method to generate weights for the robustness dimensions. The initial step in the AHP is the development of the pair-wise comparison matrix. This comparison is critical to the weight scores generated by the AHP. There are two different approaches, in practice, to conduct this comparison. These are indicator-based or dimension-based pair-wise approaches. The indicator-based approach follows a simple mechanism in which the stakeholders and experts compare all possible pairs of indicators and assign scores representing the relative importance of each indicator relative to the other. The dimension-based approach follows, somehow, the same mechanism, but the pairs are formed from the dimensions rather than the indicators. The stakeholders and experts will compare pairs of dimensions and assign a score representing the relative importance of each dimension relative to the other.
For the convenience of experts and stakeholders, this study follows the dimension-based approach. First, the relative importance from the governance’s perspective of the five dimensions is determined to develop the pairwise comparison matrix. Then, a group of experts and stakeholders in the relevant field provided their rating using a scale from 1/9 and 9, where 9 means “absolutely more importance) and 1/9 means “absolutely low importance” (Szabo et al., 2021; Nguyen et al., 2021). Table 3 shows the results of the dimension-based pairwise comparison.
To continue, the relative weights () of each of the AAEEG dimensions are estimated and reported in Table 4. The results show that the governance dimension (43.60%) leads the list of dimensions, followed by the economic dimension (33.90). The results also show that the rest of the dimensions (availability, Affordability, and environmental) significantly differ from these two dimensions.
Following this, we computed the CI ratio using Equation 2 to check the consistency of pairwise comparison. To calculate the weighted sum value of each dimension, let (k =1,2, …, 5) represents the weight of the kth dimension (Table 4) and represents the priority index of the ijth pair of dimensions (Table 5).
Then the weighted sum value () of the kth dimension is calculated using Equation 5.
The maximum eigenvalue (max) is then calculated as follows:
The CI value is calculated using Equation 2 as follows:
Finally, we calculate the CR as follows:
The CR value at n=5 is often used as 1.12. Since the calculated CR = 0.08 is less than 0.1, we can conclude the adequacy of the pair-wise comparison matrix.
5.4. SBM-DEA Output Analysis
The SBM-DEA model was utilized to estimate the efficiency (TE) and slack (SE) scores of each dimension. The scores were collected to form the efficiency, (37,1), k), and slack, (37,1, k) lists. The TE scores measure the capacity of each DMU to utilize resources to produce outputs relative to the other DMUs. The TE scores take a value from 0 to 1, where 1 indicates an efficient DMU, and 0 indicates an inefficient DMU. The SE scores measure the amount by which each DMU can reduce inputs or increase output to enhance the efficiency relative to the other DMUs. To help decision-makers focus their efforts on a subset of DMUs that require urgent intervention, we use the quartile method to classify the inefficient DMUs into two categories (low-efficient and moderate-efficient). Simply, we define low-efficient DMUs as these countries with <Q1, while moderate-efficient DMUs are these DMUs with Q1<<Q3.
Table 6 reports the statistics of the scores under the availability dimension. The statistics show that the availability dimension has average efficacy ( equals to 0.718. and standard deviation () equals to 0.228. The results also reveal that 12 of the countries have achieved the maximum efficacy score. These countries are usually referred to as Frontiers. Other DUMs, mainly 67.4% of the DMUs, have achieved efficiency scores ranging from low efficiency (9 DMUs) to moderate efficiency (16 DMUs). This percentage highlights that the majority of the countries are not effectively converting resources into sufficient food. The minimum score of the achieved under this dimension is 42.5%, meaning that there is at least one DMUs which was unable to utilize (1- 0.425)%=57.47% of the available resources. Some factors which might have affected the scores are the food system typology, food technology advancement, and climate change. However, the decision-makers can still improve food availability, especially for the low-efficient DMUs, by examining several input-based strategies, such as food waste management, sustainable agriculture, and diversifying food resources.
Table 7 reports the statistics of the scores under the availability dimension. The statistics show that the accessibility dimension’s average (=0.769) slightly outperforms the availability dimension’s average (=0.718), meaning that the countries are more efficient in utilizing resources relevant to food accessibility than food availability. The number of countries that achieved maximum efficiency under this dimension is 13 countries. Table 7 shows that 27.70% of the DMUs are classified as low-efficient and 37.78% as moderate-efficient DMUs. The minimum score of the achieved under the accessibility is 45.7%, meaning that there at least one DMUs was unable to utilize (1- 0.457) % = 54.3% of the accessibility resources, which is slightly less than the same ratio under the availability dimension. Even though these two dimensions have shown almost similar efficiency scores, the decision-makers may require different improvement strategies due to the different nature of the context of these dimensions. Food availability is more focused on the food supply, such as food production, local and national food stock, and agricultural land areas. Food accessibility is more focused on the ability of individuals and society to obtain enough food, such as household income, food prices, and food market diversity.
Table 8 reports the statistics of the TE scores under the economic dimension. The number of low-efficient DMUs under this dimension is 21 DMUs. This explains the low TE average score (=0.637) of the economic dimension compared with the previous two dimensions. However, 81.08% of the countries have shown from low-efficient to moderate-efficient. This percentage highlights the poor performance of the majority of the countries under this dimension. The minimum score of the achieved under the economic is 48.8%, meaning that there at least one DMUs was unable to effectively utilize (1- 0.424) % = 57.6% of the resources, which is less than the same ratio under the two previous dimensions. Considering the high priority of this dimension (33.90%); see Table 4, we can surely say that the economic dimension requires more decision-maker attention compared with the previous two dimensions.
Table 9 reports the statistics of the TE scores under the environmental dimension. The average TE score of this dimension is 0.475. This value is the lowest among all the previous dimensions. There are 17 DMUs under the low-efficient category and 10 DMUs under the moderate-efficient category, meaning that 72.97% of the countries have failed to efficiently convert environmental resources into outputs. These numbers urgent the need for these countries to adopt environmental practices to enhance food system efficiency and robustness. The minimum score of the achieved under the environmental dimension is 7.5%. This is a very low score. However, investigating the factors beyond this low-efficiency performance requires the collaboration of food authorities and stakeholders at a country level. Some factors that deserve to be considered are inefficient sustainability farming practices, improper food system typology, and lack of food technological advancement.
Table 10 reports the statistics of the TE scores under the governance dimension. The dimension governance, according to the AHP results, is the most important among all with a priority of 43.60%. The governance role is crucial to developing food system strategies, promoting research and development, and ensuring the implications of the food system's regulations. Despite the highest importance of the governance dimension for food system robustness, the average of its TE scores (=0.650) is less than the availability and accessibility dimensions, having the lowest priority. This finding emphasizes the need to find practical solutions to enhance the utilization of the governance inputs and maintain appropriate levels of food robustness and resilience.
5.5. The Efficiency of the Robustness Dimension
This section provides further analysis of the efficiency scores of the AAEEG robustness dimensions. Five impact matrices ( were developed in this study. Each matrix has a size of 37(+), where =37 is the total number of the DMUs, and (+) is the sum of input and output indicators of the kth dimension. The terms and represent the impact of the ith input indicator and the rth output indicator of the jth DMU of the kth dimension, where=1, 2, …, , =1,2, …, , and =1,2,…,5.
Ensuring an adequate sample size is crucial and depends on various factors, including the number of DMUs, inputs, and outputs. In the literature, two rules have been extensively discussed to assess the adequacy of the sample size, as proposed by Kumar & Gulati (2008). The first rule states that the sample size should be greater than or equal to the product of inputs and outputs (i.e., ). The second rule, according to Kumar & Gulati (2008), suggests that the number of DMUs should be at least three times the sum of inputs and outputs (i.e., . Table 11 reveals the adequacy of the impact matrix of the robustness dimensions involved in this study.
The weighted-SBM-DEA optimization model was then applied for all sub-matrices separately to calculate the efficiency of the DMUs. The weight of each input () and output () indicator under the th dimensions were distributed using Equation 8 below:
To determine the aggregated efficiency performance of each dimension, we first calculate the weighted sum of the TE under each dimension as follows:
where is the weight of the kth dimension calculated using AHP. The aggregated efficacy of the th dimension ( can be computed as follows:
Figure 3 shows the distribution of the and for the robustness distributions. The results show that the availability dimension is the lowest (=0.037) compared with the other dimensions. The economic and governance are the best among all the dimensions.
Two approaches are suggested in this paper to identify opportunities for efficiency improvement. These are 1) an inefficient dimensions-based approach and 2) a criterion-based approach. The first approach initially identifies the dimensions with the lowest , and then the low-efficient DMUs under this dimension are selected for efficiency improvement. The main role of the stakeholders and experts in this approach is mainly focused on prioritizing and validating the set of resource indicators (input or output) under each DMU in the low-efficient subset of DMUs. The second approach uses a specific criterion to identify the low-efficient subset of DMUS across all the dimensions, for instance, the DMUs with the highest frequency of being inefficient among all the dimensions. The slack scores of the indicators of the selected DMUs are then analyzed for better opportunities for efficiency improvement.
5.5.1. Approach One: Inefficient Dimension-Based Improvement
This approach follows a hierarchal sequence in identifying the opportunity for improvement. The dimension with the minimum sum of or is first identified. Once it is determined, the practitioner starts to investigate the DMU(s) performance under the corresponding dimension and determine the th DMU with min (). The final step involves defining the improvement strategy. However, the involvement of industry and government representatives is important to the outcome of this step.
Three distinct approaches can be applied to enhance the efficiency performance of DMUs within the system. The first is the input-oriented approach. It focuses on reducing the input while keeping the output at its current level. The second is the output-oriented approach. It focuses on increasing the output while maintaining the same level of inputs. The third is the mix-oriented approach. This approach combines the two previous approaches. The selection among these three orientations might be the intervention of decision-makers and stakeholders.
This example utilizes the input-oriented approach. The initial analysis of the or scores; see Figure 3, showed that the availability dimension is the least efficient (1.381, and =0.037. The DMUs within the availability dimension were also analyzed, and three DMUs were identified as having better opportunities to promote their efficiency scores under the availability dimension. These are Italy, Portugal, and Netherlands.
A correlation analysis is conducted to understand how indicators are related to each other so that we can target them in a way that optimizes the robustness efficiency. From the correlation analysis of the availability dimensions, see Table 12, it is inferred that there is a heavy positive correlation between the indicators “Land area equipped for irrigation” and “Diversity of food in stocks,” with a coefficient of 0.53. The positive correlation means that when one indicator increases, the other increases. Similarly, the indicator “Land area equipped for irrigation” also positively correlates with “Diversity of food in stocks” with a coefficient of 0.41. A negative correlation between the indicators can also be found between the indicators. The indicator “Diversity of domestic production” has two negative correlations, with the indicator being “Availability of electricity access” and the latter being “Diversity of import sources,” with a correlation coefficient of -0.78 and -0.44, respectively.
As previously mentioned, the selection of indicators should be completed in coordination with stakeholders to incorporate their demands and expertise to optimize the aggregated score. However, the investigations found that the “Land area equipped for irrigation” or IAV4 is the more valuable indicator for enhancing food system efficiency and robustness. Note that whatever the improvement approach is to be followed, the reduction of inputs or increasing output should not exceed the slack scores of the targeted indicators. Table 13 shows the suggested improvement plan. Several strategies for enhancing robustness using the unutilized land area can be suggested and discussed with decision-makers. Some of these strategies should include but are not limited to, promoting crop diversification, implementing sustainable food production, and increasing livestock to meet demand. Since the DMUs used in this study are countries, we can say Italy has saved the most land compared with others.
The SMB-DEA is applied to determine the and ; see Figure 4. The results show a slight improvement in both the and of the availability dimension. Despite this relatively small improvement in the efficiency performance and considering the cost of land area equipped for irrigation, one should expect a significant cost reduction, especially in the European region.
However, the effectiveness of approach one may be influenced by several factors such as the number of DMUs involved in the improvement, the weight of the chosen dimension, and the percentage of input or output reduction. With this in mind, another approach is suggested in this study mainly to overcome the impact of these factors on the effectiveness of the improvement plan.
5.5.2. Approach Two: A Criterion-Based Improvement
This approach uses a specific criterion to identify the low-efficient DMUs across all the dimensions. The range of search of this approach is more comprehensive than the first approach. However, one possible challenge of using this criterion is that the number of DMUs might be significantly large. To overcome the high-dimensionality issue; this study uses a combined criterion; see Equation 11.
where is the subset of low-efficient DMUs, and is the number of times that a DMU is classified as efficient across all dimensions. Two main advantages of this criterion are its ability to control the number of DMUs for improvement and its coverage of all the robustness dimensions, unlike approach one.
The results showed that seven of the DMUs have revealed scores meeting the criterion in Equation 7. To examine the impact of the second approach, an improvement plan with equal slack reduction has been suggested. Table 14 shows the targeted dimensions and indicators.
Table 14 shows the improvement plan. The target inputs of all the DMUs involved in this plan are set at 50% of their original values. Other percentages of slack reduction might be used considering that the maximum limit of the target reduction is specified by the slack scores of each indicator.
Figure 5 illustrates the distribution of the efficiency of the robustness dimension after the improvement using the second approach. The economic, environmental, and governance-weighted averages have increased marginally. The availability dimension has shown efficiency performance similar to approach one.
The results above showed the outperformance of the second criterion compared with the criterion used in approach one. Despite this, it should be noted that setting the separation limit might affect the second approach’s performance and applicability. A deep understanding of how the separation limit may affect the selection of the indicators to be involved in the improvement plan is crucial to the second approach. However, one way to avoid this challenge is by involving experts and stakeholders with the appropriate knowledge of the food system characteristics. Another way is by modifying the criterion such only the DMUs with the highest frequency of appearing as low-efficient DMUs”.
5. Conclusions and Remarks
This study proposes an analytical approach based on SBM-DEA for balancing the efficiency and robustness of food systems. Two approaches were proposed in this study to investigate opportunities to improve the efficiency of the robustness dimensions. The applicability and operational procedures of the proposed approach have been evaluated using a dataset representing the impact of five robustness dimensions. The proposed approach has revealed an acceptable level of applicability in identifying the low-efficient robustness dimensions and providing decision-makers with relevant measures required for establishing plans to improve the efficacy of the underlying dimensions. These measures help provide management with data-based insight into the most effective practices for evaluating and developing resource allocation plans and identifying deficiencies in food systems.
Two aspects make the proposed approach applicable to high-dimensional spaces of food robustness dimensions. First, the approach adopts the grouping principle in which all related indicators are listed under the same robustness dimension. Second, the SBM-DEA model can comprehend the interaction within or between robustness dimensions and provide outcomes that help management or stakeholders examine the effectiveness of any potential intervention, even when the number of dimensions is significant. In contrast to regression methods, the SBM-DEA is a non-parametric approach that doesn't rely on any statistical assumptions about the dataset. This attribute enhances the approach's usability and applicability, making it more suitable for a wide range of dataset types.
The first approach for identifying opportunities for improvement has revealed some notable findings that should be considered in real-life practices. It has been noted that the first approach is not recommended when there are many dimensions. This approach focuses on one robustness dimension at a time. Despite this approach being practically straightforward, stakeholders might recommend it as food robustness improvement might not be characterized by one dimension. In addition, this approach may not deliver the expected outcomes when the selected dimension has a small relative weight. The second approach has shown more desirable features. This approach has two setting parameters, which stakeholders can use to examine multiple improvement plans. In addition, the approach has a wide range of searching for the low-efficient dimensions, as it is not limited to one dimension as in the first approach. The low-efficient dimensions may include DMUs from multiple food dimensions, which meet the practitioner’s and stakeholders’ expectations. In this study, the second approach selected inefficient DMUs across all robustness dimensions, resulting in more significant efficiency improvement and resource-saving than the first approach.
The proposed approach relied on the stakeholders and experts in grouping the robustness dimension. However, although this approach has practical advantages, the authors recommend other methods, such as k-means clustering, k-neighborhood clustering, and Gaussian mixtures models, for future research works.
Acknowledgments
This paper was made possible by GSRA6-1-0614-19088 from the Qatar National Research Fund and I-GA 1030 from Qatar University. The authors of this paper would like to thank the anonymous reviewers for their helpful comments that highly contributed to enhancing the quality of this paper.
References
- Abdella G. M., Kim J., Al-Khalifa, K. N, and Hamouda, A. M. S, (2019a). Penalized Conway-Maxwell-Poisson regression for modeling dispersed discrete data: The case study of motor vehicle crash frequency. Safety Science, 120, 157-163. [CrossRef]
- Abdella G. M., Al-Khalifa, K. N, Maha, T., and Hamouda, A. M. S., (2019b). Modeling Trends in Road Crash Frequency in Qatar State. International Journal of Operational Research (IJOR), 34(4), 507-523.
- Abdella, G. M., Kim, J., Kim, S., Al-Khalifa, K. N., Jeong, M. K., Hamouda, A. M., & Elsayed, E. A. (2019c). An adaptive thresholding-based process variability monitoring. Journal of Quality Technology, 51(3), 242-256. [CrossRef]
- Abdella, G. M., Kucukvar, M., Onat, N. C., & AL-Yafay, H. M., Bulak, M. E., (2020). Sustainability assessment and modeling based on supervised machine learning techniques: The case for food consumption. Journal of Cleaner Production, 251, 119661. [CrossRef]
- Abdella, G. M., Kucukvar, M., Kutty, A. A., Abdelsalam, A. G., Sen, B., Bulak, M. E. and Onat, N. C., (2021b) A novel approach for developing composite eco-efficiency indicators: The case for US food consumption, Journal of Cleaner Production, vol. 299, 126931.
- Aguarón, J., & Moreno-Jiménez, J. M. (2003). The geometric consistency index: Approximated thresholds. European journal of operational research, 147(1), 137-145. [CrossRef]
- Arabi, B., Doraisamy, S. M., Emrouznejad, A., & Khoshroo, A. (2017). Eco-efficiency measurement and material balance principle: an application in power plants Malmquist Luenberger Index. Annals of operations research, 255, 221-239. [CrossRef]
- Azizi, H., Kordrostami, S., & Amirteimoori, A. (2015). Slacks-based measures of efficiency in imprecise data envelopment analysis: An approach based on data envelopment analysis with double frontiers. Computers & industrial engineering, 79, 42-51. [CrossRef]
- Azzurra, A., Massimiliano, A., Angela. M., 2019. Measuring sustainable food consumption: A case study on organic food. Sustainable Production and Consumption, 17, 95–107. [CrossRef]
- Banker, R. D. (1984). Estimating most productive scale size using data envelopment analysis. European journal of operational research, 17(1), 35-44. [CrossRef]
- Becker, W., Saisana, M., Paruolo, P., & Vandecasteele, I. (2017). Weights and importance in composite indicators: Closing the gap. Ecological indicators 80, 12-22. [CrossRef]
- Beekaroo, D., Callychurn, D.S., Hurreeram, D.K., 2019. Developing a sustainability index for Mauritian manufacturing companies. Ecological Indicators, 96, 250–257. [CrossRef]
- Chaiyaphan, C., & Ransikarbum, K. (2020). Criteria analysis of food safety using the Analytic Hierarchy Process (AHP)-a case study of Thailand’s fresh markets. In E3S Web of Conferences (Vol. 141, p. 02001). EDP Sciences. [CrossRef]
- Cherchye, L., Moesen, W., Rogge, N., & Puyenbroeck, T. V. (2007). An introduction to ‘benefit of the doubt’composite indicators. Social indicators research, 82, 111-145.
- Doa'a, M. F., Abdella, G. M., & Kucukvar, M. (2022). Sustainable Food Systems: Recent Advances, Assessment Techniques, and Methodological Compositions.
- Ersoy, Y. (2021). Supplier selection in the food industry using analytic hierarchy process (AHP) method. In Handbook of Research on Institutional, Economic, and Social Impacts of Globalization and Liberalization (pp. 657-670). IGI Global.
- Gallego-Álvarez, I., & Ortas, E. (2017). Corporate environmental sustainability reporting in the context of national cultures: A quantile regression approach. International Business Review, 26(2), 337-353. [CrossRef]
- Gan, X., Fernandez, I. C., Guo, J., Wilson, M., Zhao, Y., Zhou, B., Wu, J., 2017. When to use what: Methods for weighting and aggregating sustainability indicators. Ecological Indicators, 81, 491-502. [CrossRef]
- Garoma, T., & Diriba, S. (2014). Modeling and analysis of supplier selection method using analytical hierarchy process (AHP). Science, Technology and Arts Research Journal, 3(1), 145-151. [CrossRef]
- Kao, C., Hung, H.T., 2017. Data envelopment analysis with common weights: the compromise solution approach. Journal of the Operational Research Society, 56, 1196-1203. [CrossRef]
- Kumar, S., & Gulati, R. (2008). An examination of technical, pure technical, and scale efficiencies in Indian public sector banks using data envelopment analysis. Eurasian Journal of Business and Economics, 1(2), 33-69.
- Kutty, A. A., & Abdella, G. M. (2020). Tools and techniques for food security and sustainability related assessments: a focus on the data and food waste management system. In Proceedings of the 5th NA Conference on Industrial Engineering and Operations Management (pp. 10-14).
- Kutty, A.A.; Wakjira, T.G.; Kucukvar, M.; Abdella, G.M.; Onat, N.C. (2022a) Urban Resilience and Livability Performance of European Smart Cities: A Novel Machine Learning Approach. J. Clean. Prod., 378, 134203. [CrossRef]
- Kutty, A.A.; Kucukvar, M.; Abdella, G.M.; Bulak, M.E.; Onat, N.C. (2022b) Sustainability Performance of European Smart Cities: A Novel DEA Approach with Double Frontiers. Sustain. Cities Soc., 81, 103777.
- Mardani, A., Zavadskas, E. K., Streimikiene, D., Jusoh, A., & Khoshnoudi, M. (2017). A comprehensive review of data envelopment analysis (DEA) approach in energy efficiency. Renewable and Sustainable Energy Reviews, 70, 1298-1322. [CrossRef]
- Nardo, M., Saisana, M., Saltelli, A., & Tarantola, S. (2005). Tools for composite indicators building. European Comission, Ispra, 15(1), 19-20.
- Nguyen, T. D. L., & Bleys, B. (2021). Applying analytic hierarchy process to adaptation to saltwater intrusion in Vietnam. Sustainability, 13(4), 2311. [CrossRef]
- Onat, N. C., Abdella, G. M., Kucukvar, M., Kutty, A. A., Al-Nuaimi, M., Kumbaroğlu, G., & Bulu, M. (2021). How eco-efficient are electric vehicles across Europe? A regionalized life cycle assessment-based eco-efficiency analysis. Sustainable Development, 29(5), 941-956.
- Pastor, J.T., Ruiz, J.L., Sirvent, I., 1999. An enhanced DEA Russell graph efficiency measure. European Journal of Operational Research 115, 596-607. [CrossRef]
- Reisi, M., Aye, L., Rajabifard, A., Ngo, T., 2014. Transport sustainability index: Melbourne case study. Ecological Indicators, 43, 288-296. [CrossRef]
- Saaty, T. L. (1977). Modeling unstructured decision-making-AHP. In International Conference on Mathematical Modeling.
- Saaty, T. L. (1980). The analytical hierarchy process, planning, priority. Resource allocation. RWS publications, USA.
- Saisana, M, Philippas, D., 2012. Sustainable Society Index (SSI): Taking societies' pulse along social, environmental and economic issues.
- Saisana, M. and Tarantola, S., 2002. State-of-the-art report on current methodologies and practices for composite indicator development. Report EUR 20408 EN. European Commission-Joint Research.
- Szabo, Z. K., Szádoczki, Z., Bozóki, S., Stănciulescu, G. C., & Szabo, D. (2021). An analytic hierarchy process approach for prioritisation of strategic objectives of sustainable development. Sustainability, 13(4), 2254. [CrossRef]
- Tone, K., 2001. A slacks-based measure of efficiency in data envelopment analysis. European Journal of Operational Research 130, 498-509. [CrossRef]
- Tran, T. H., Mao, Y., Nathanail, P., Siebers, P. O., & Robinson, D. (2019). Integrating slacks-based measure of efficiency and super-efficiency in data envelopment analysis. Omega, 85, 156-165. [CrossRef]
- Zhang, X., Austin, S., Glass, J., Mills, G., 2008. Toward collective organizational values: a case study in UK construction. Construction Management. [CrossRef]
Figure 1.
The outlines of the proposed approach.
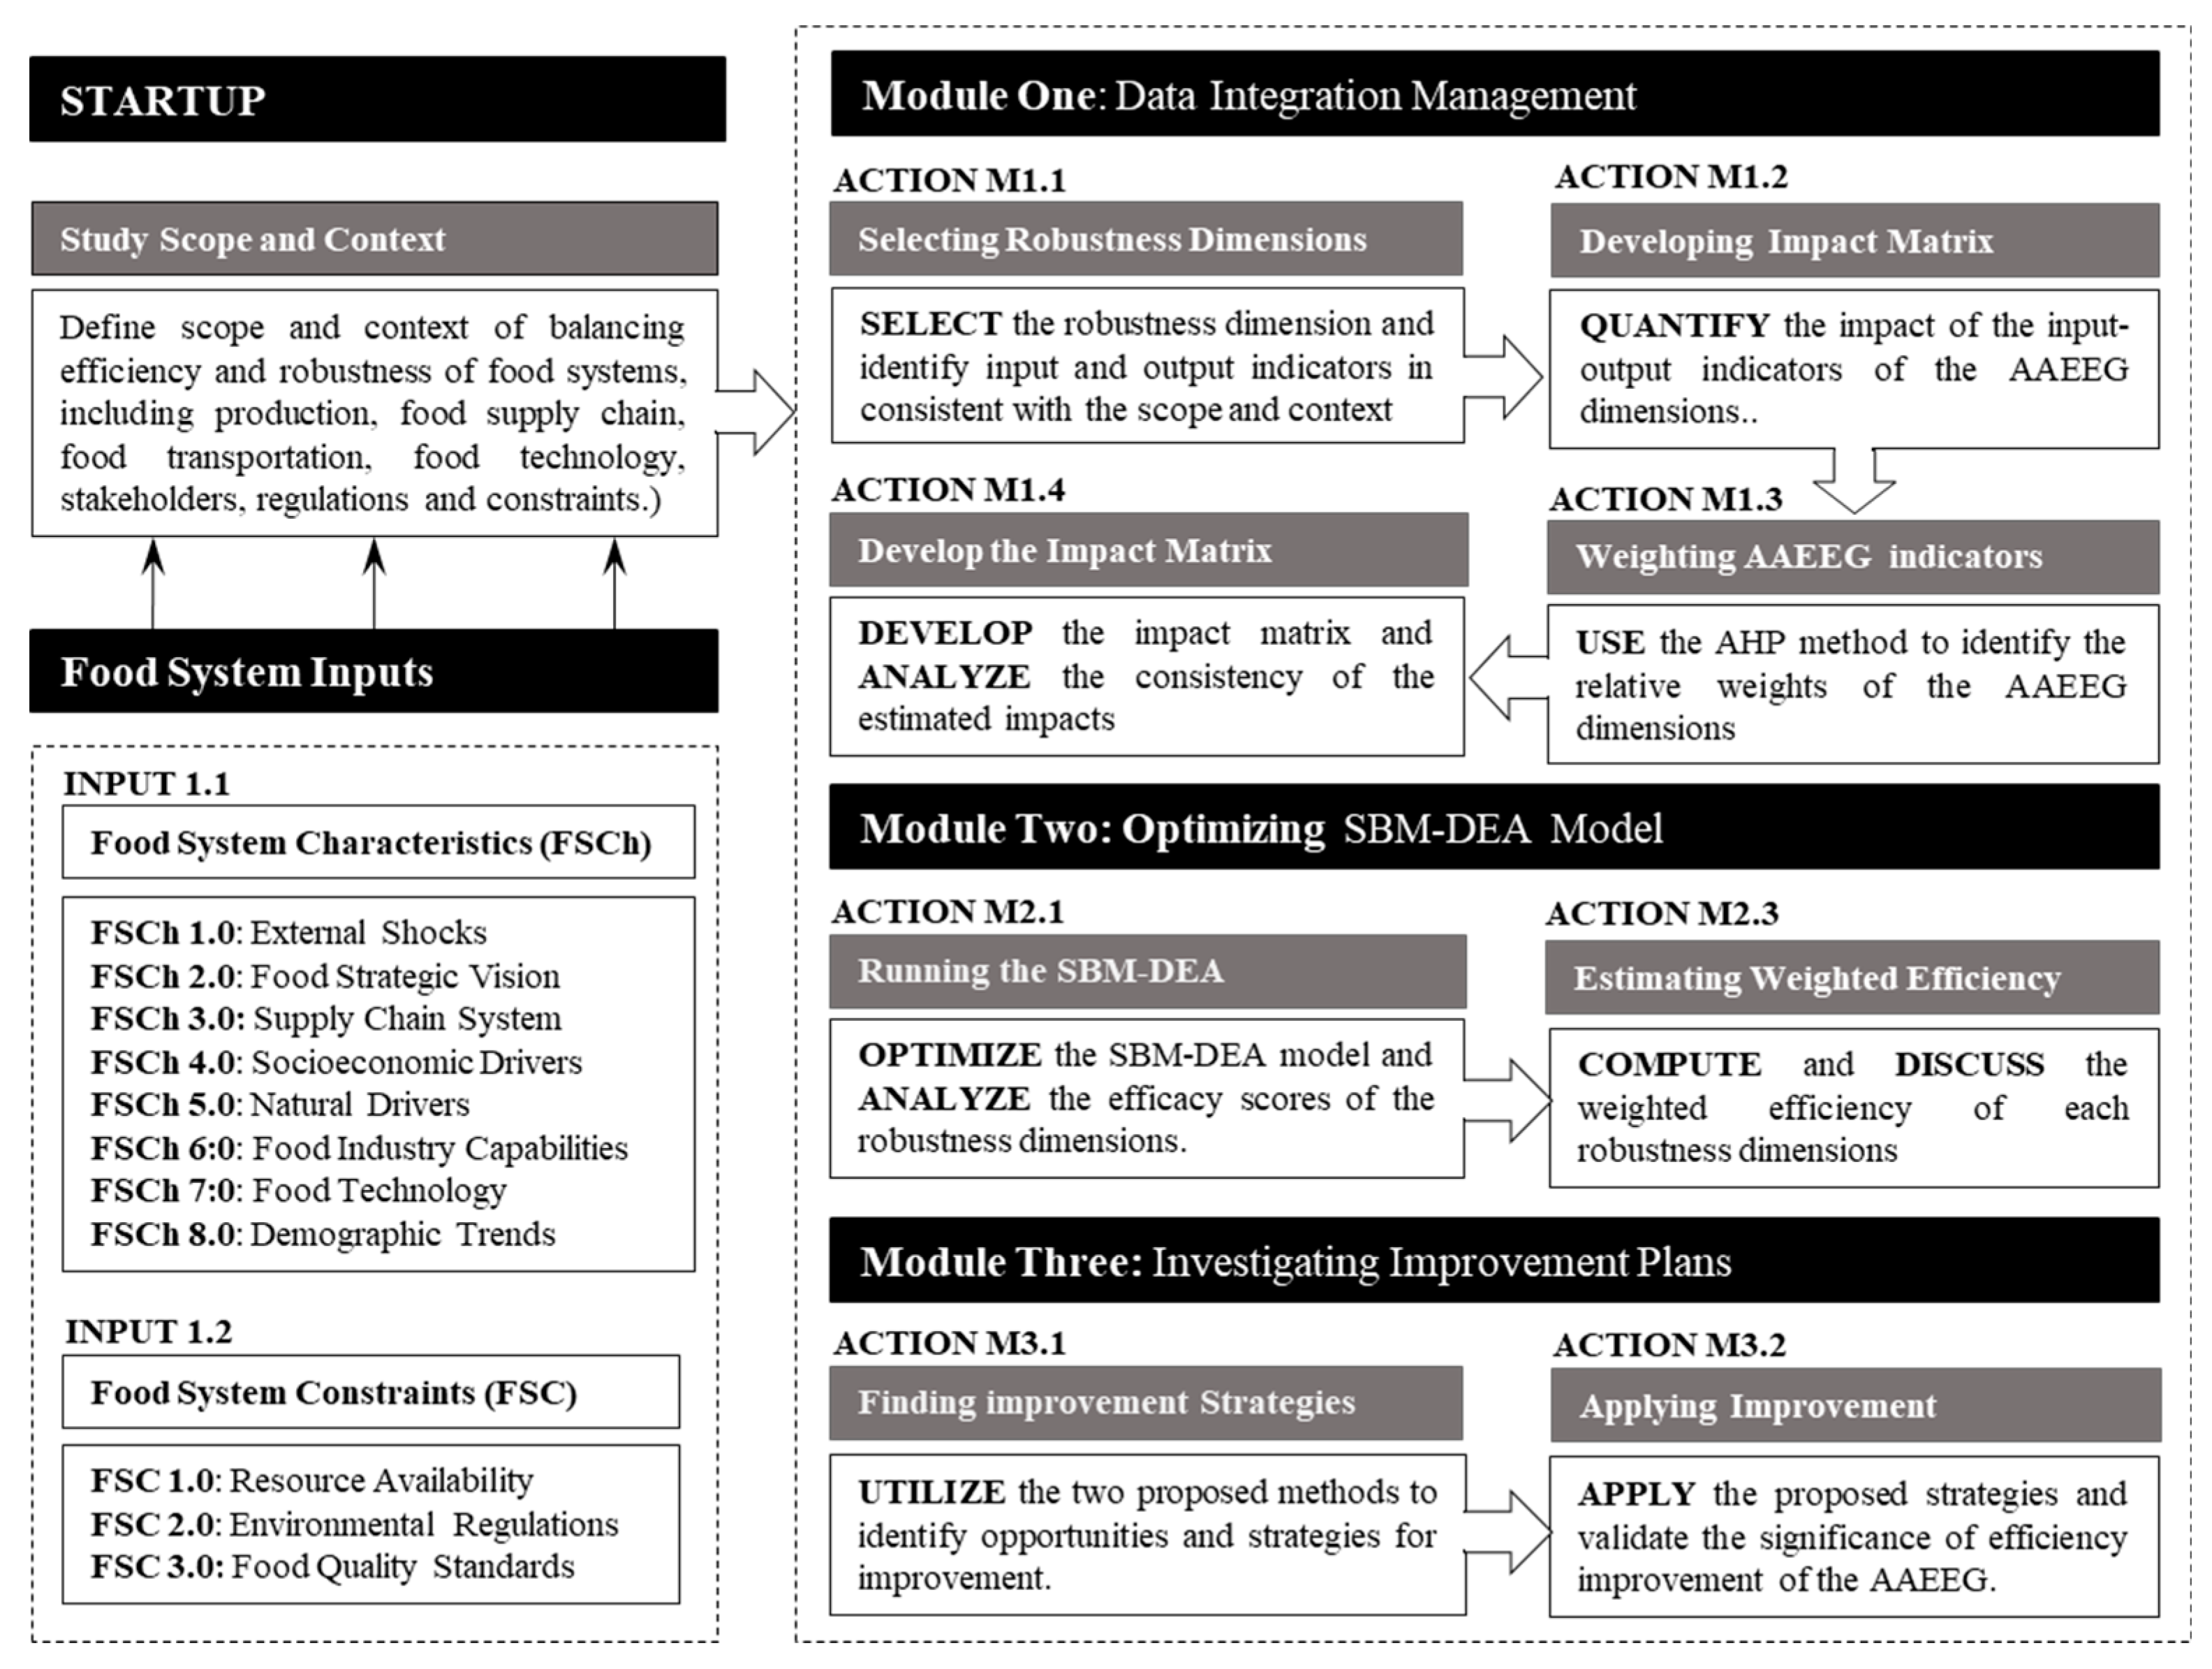
Figure 2.
Typical hierarchical structure of the AHP method.
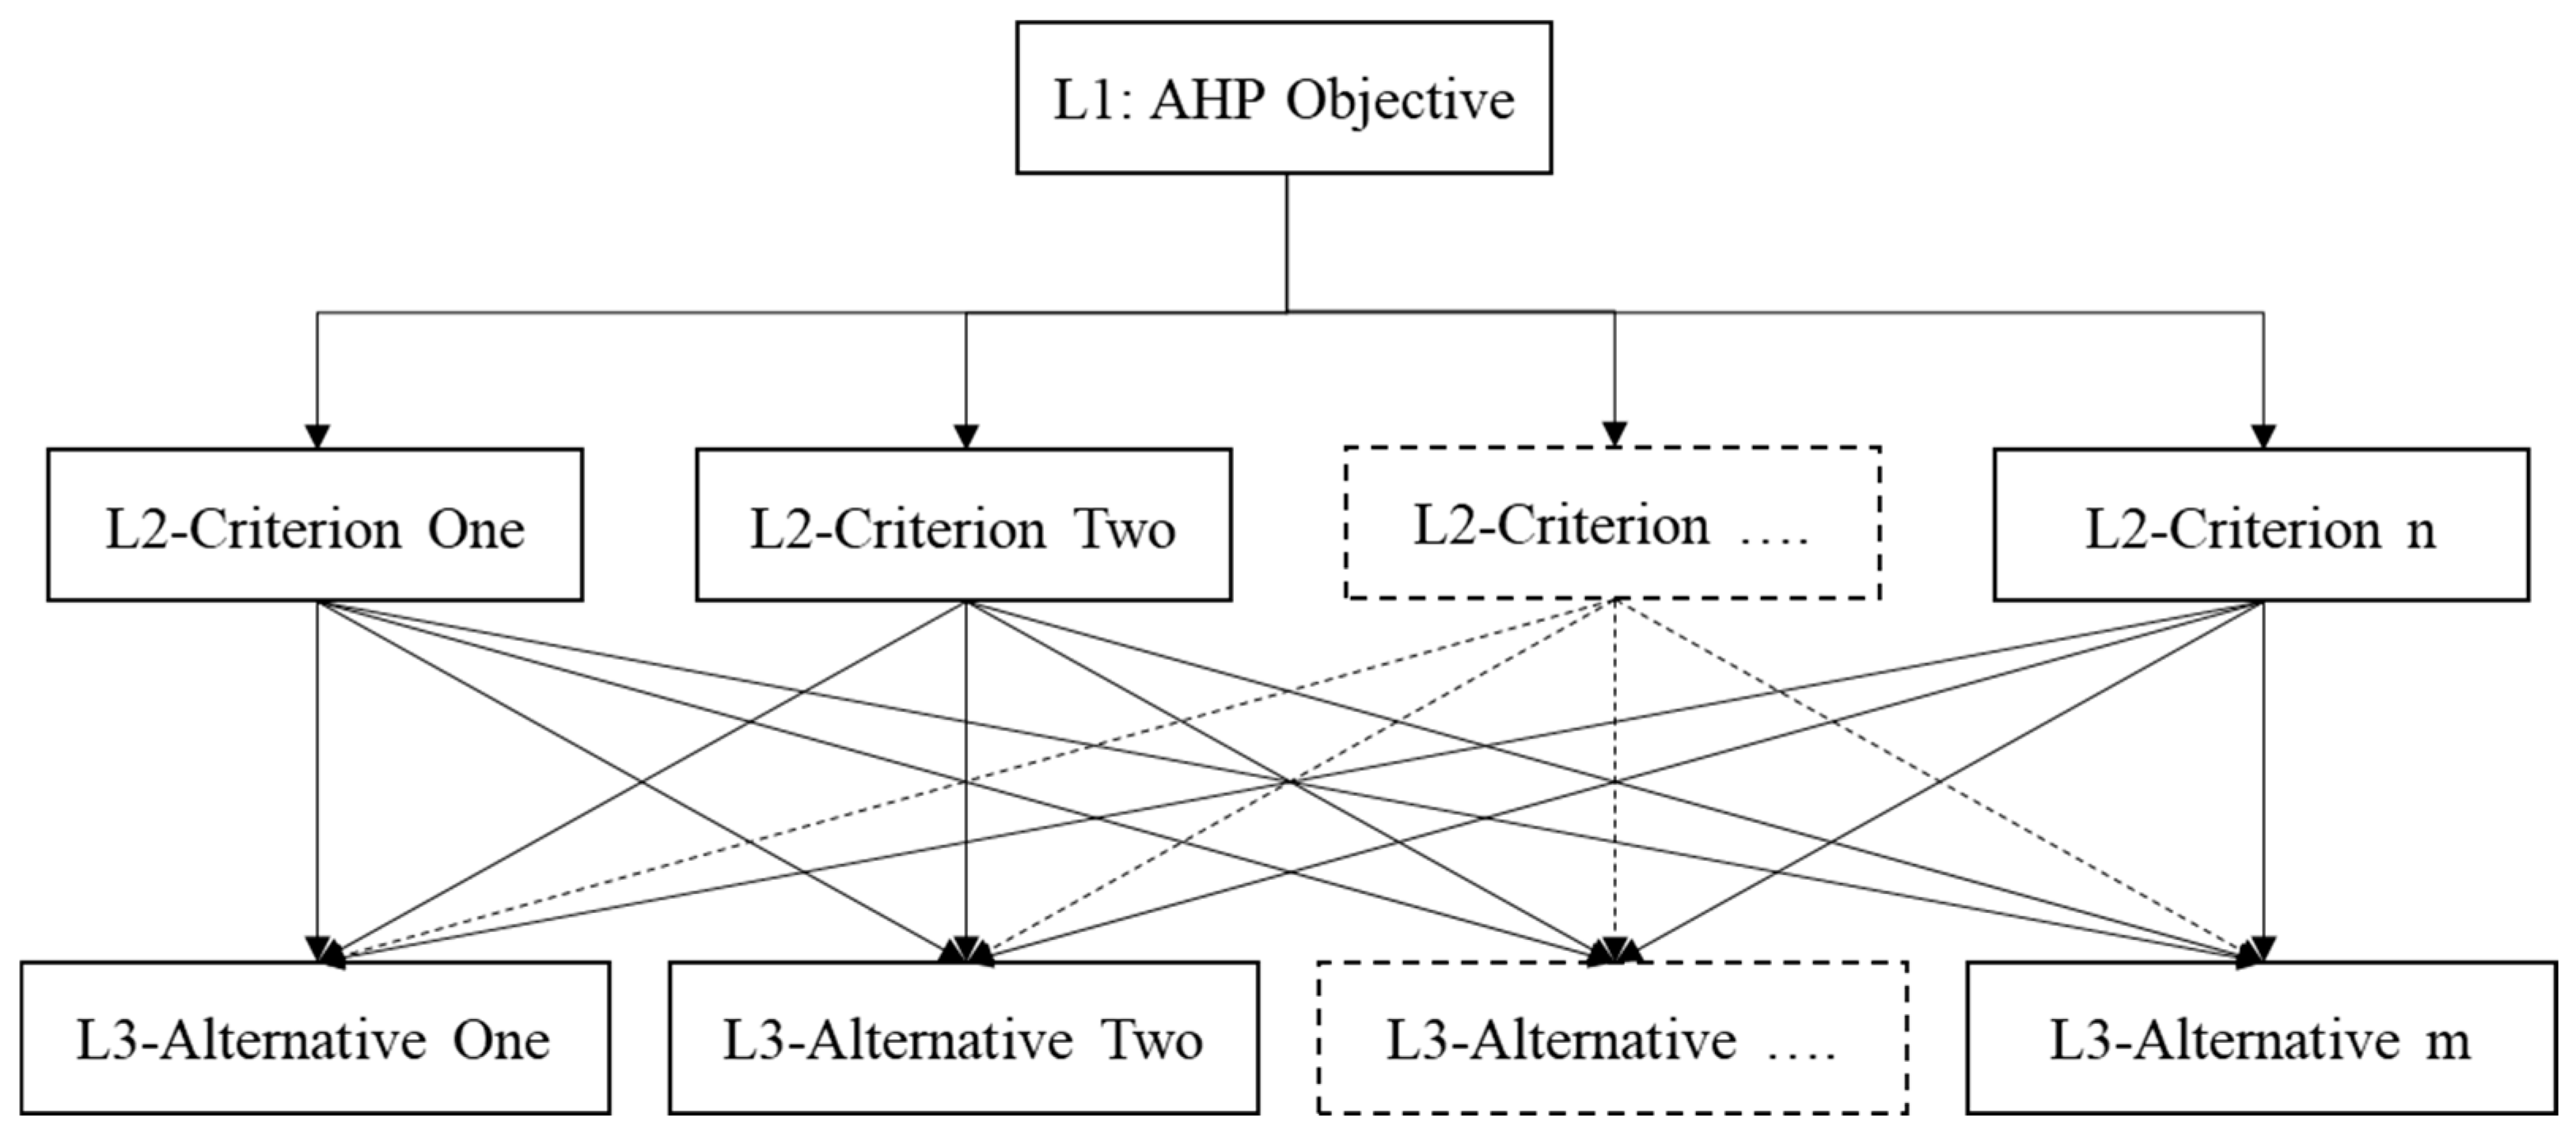
Figure 4.
Technical Efficiency-based distribution after improvement (first approach).
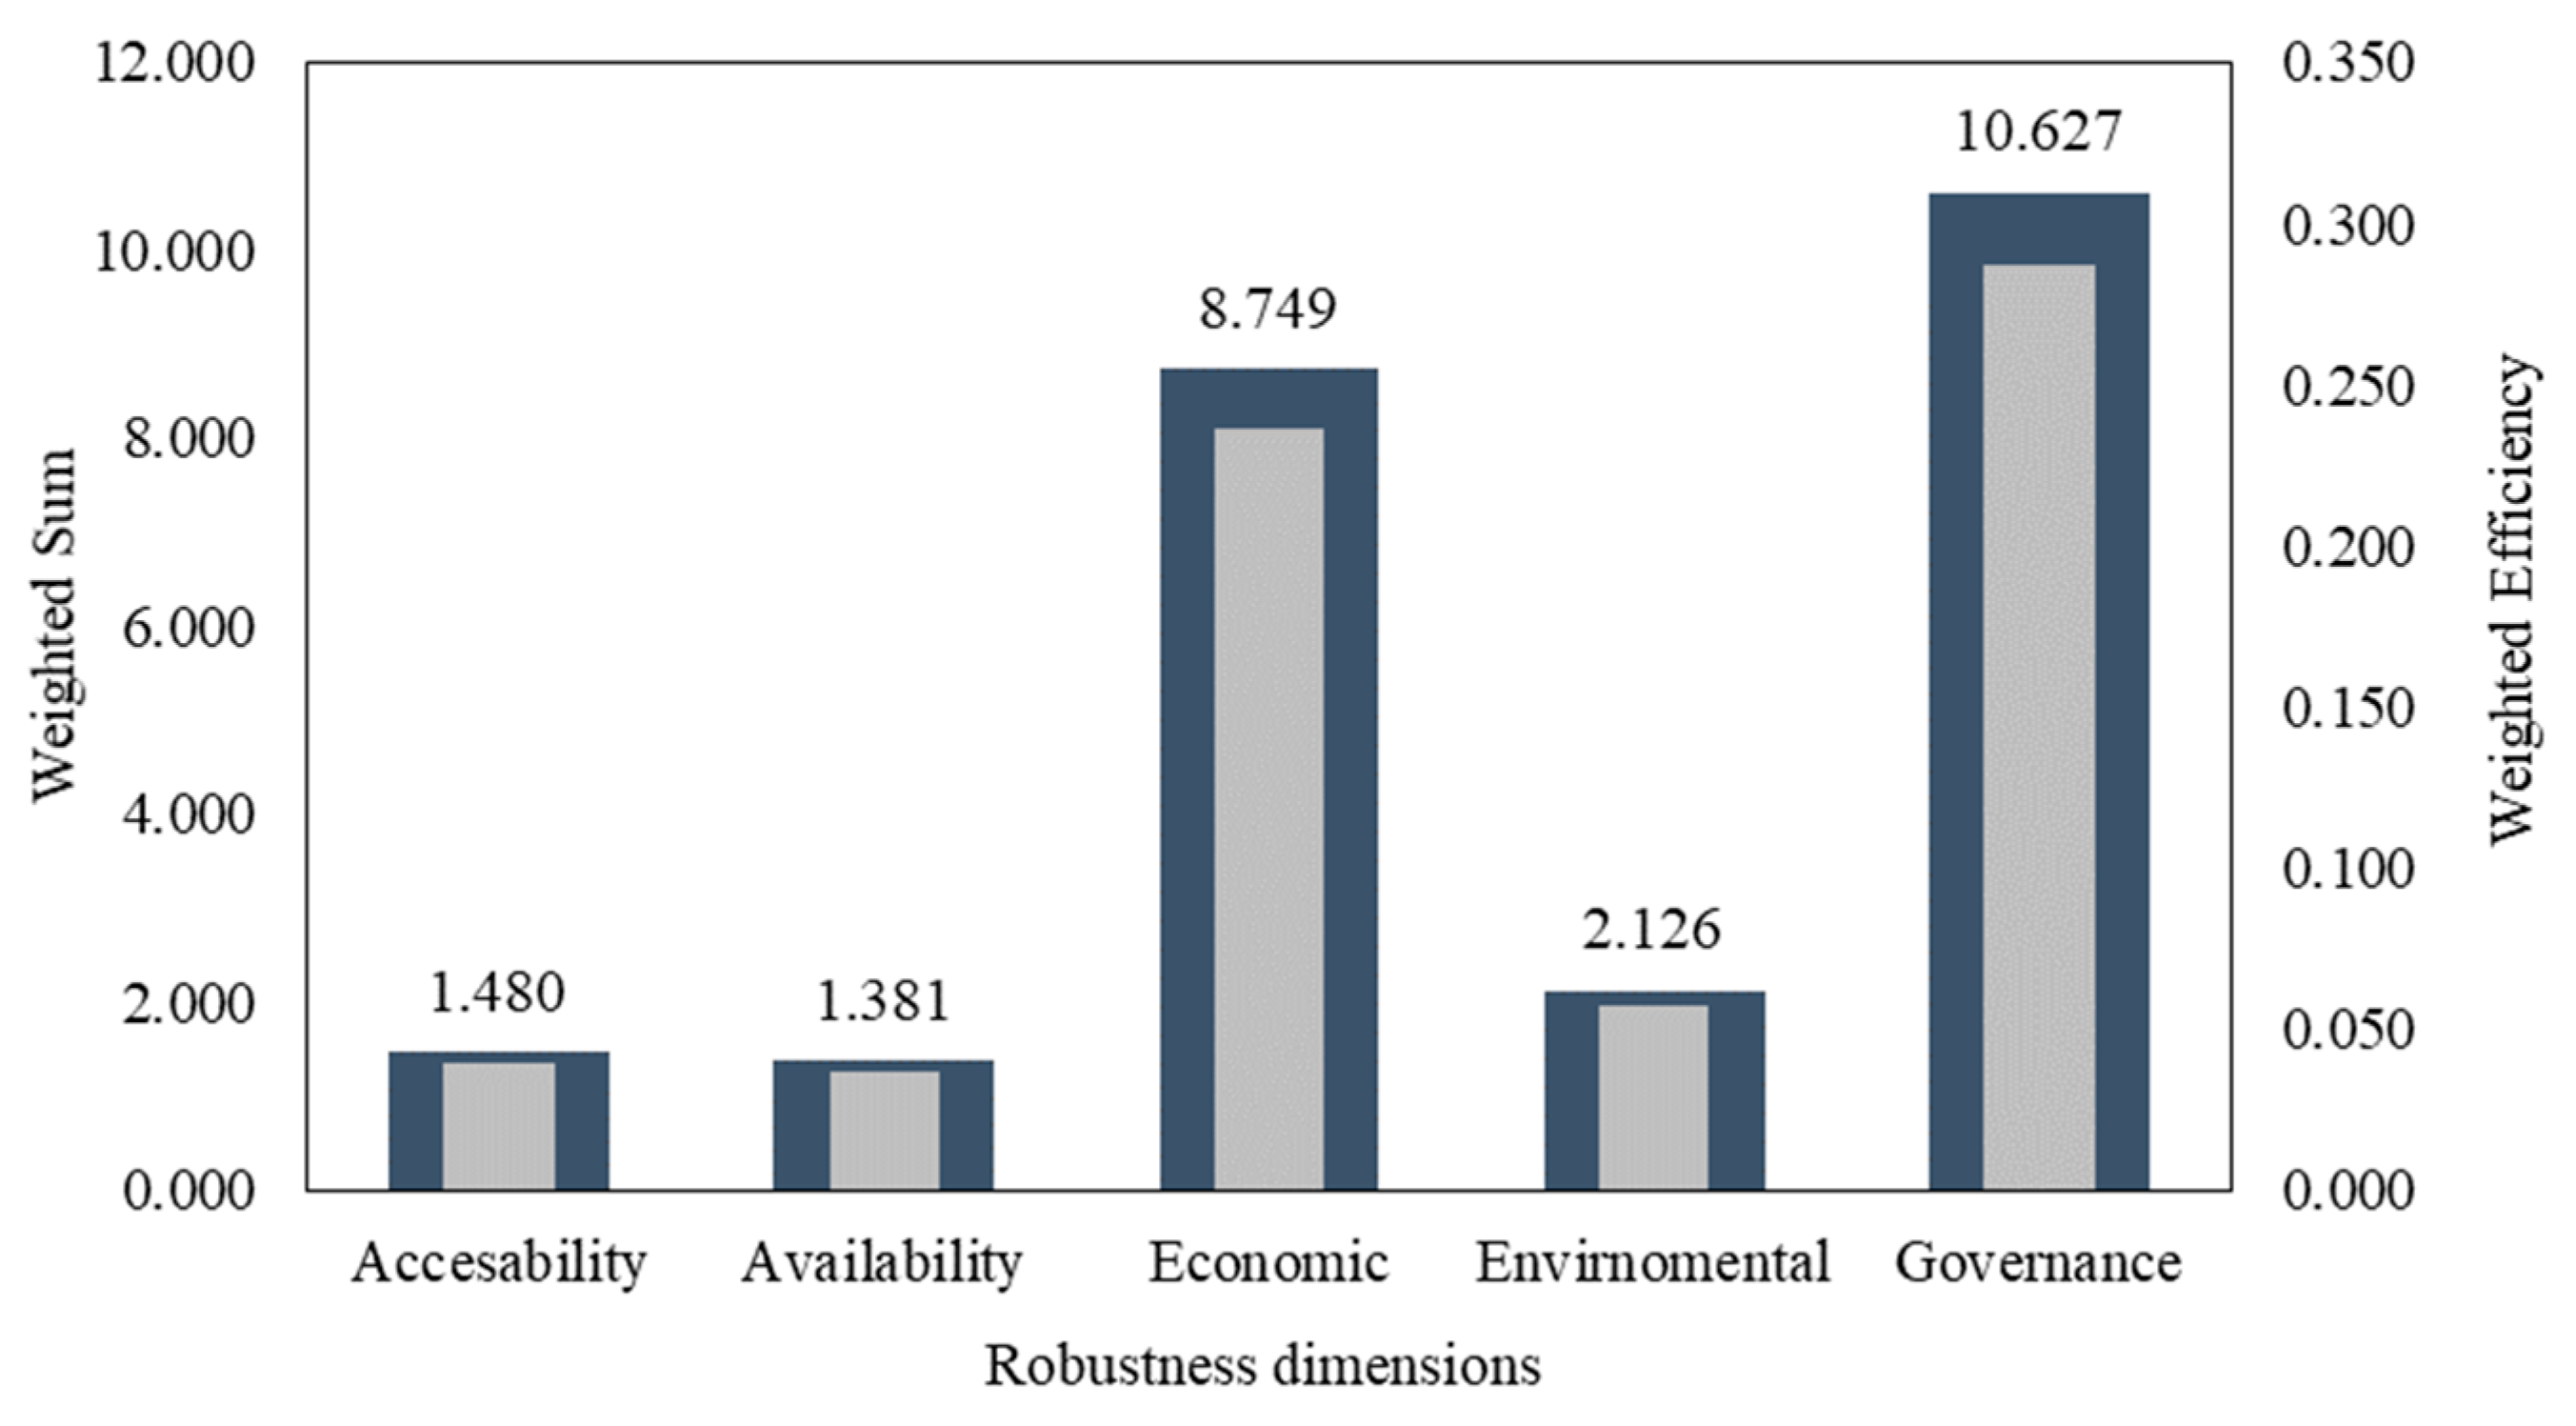
Figure 5.
Technical Efficiency-based distribution after improvement (second approach).
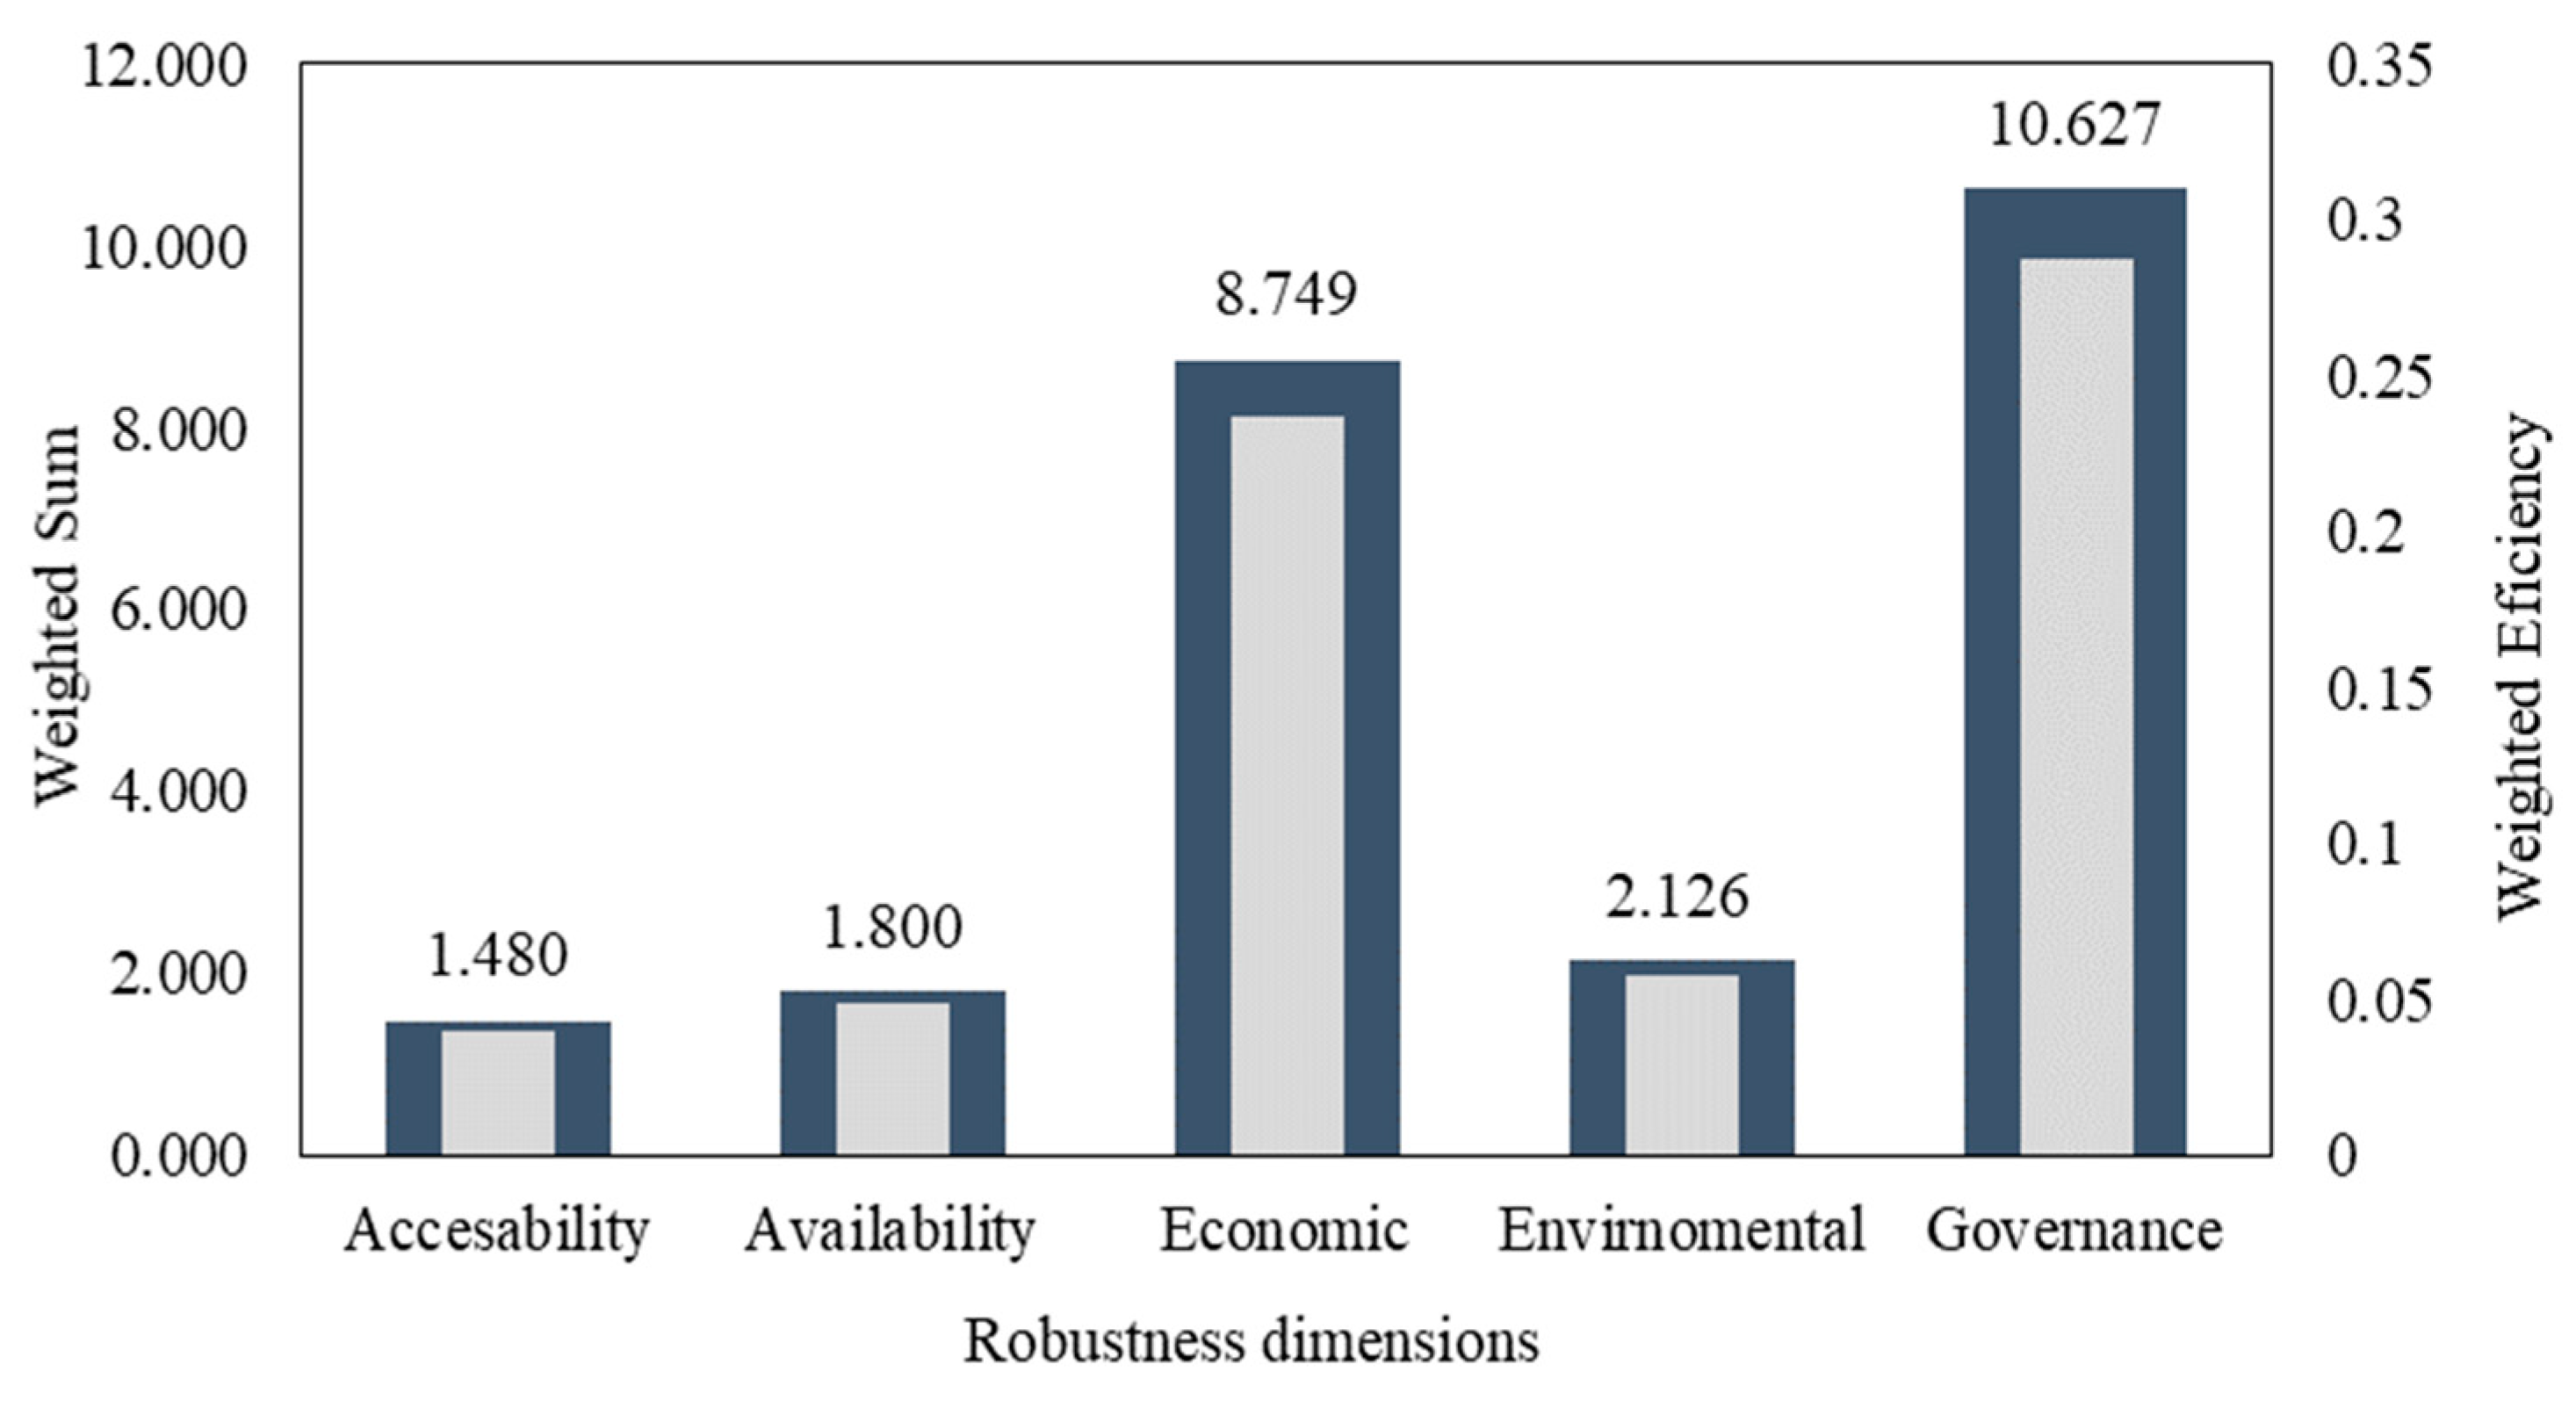
Figure 3.
Technical Efficiency-based distribution of robustness dimension.
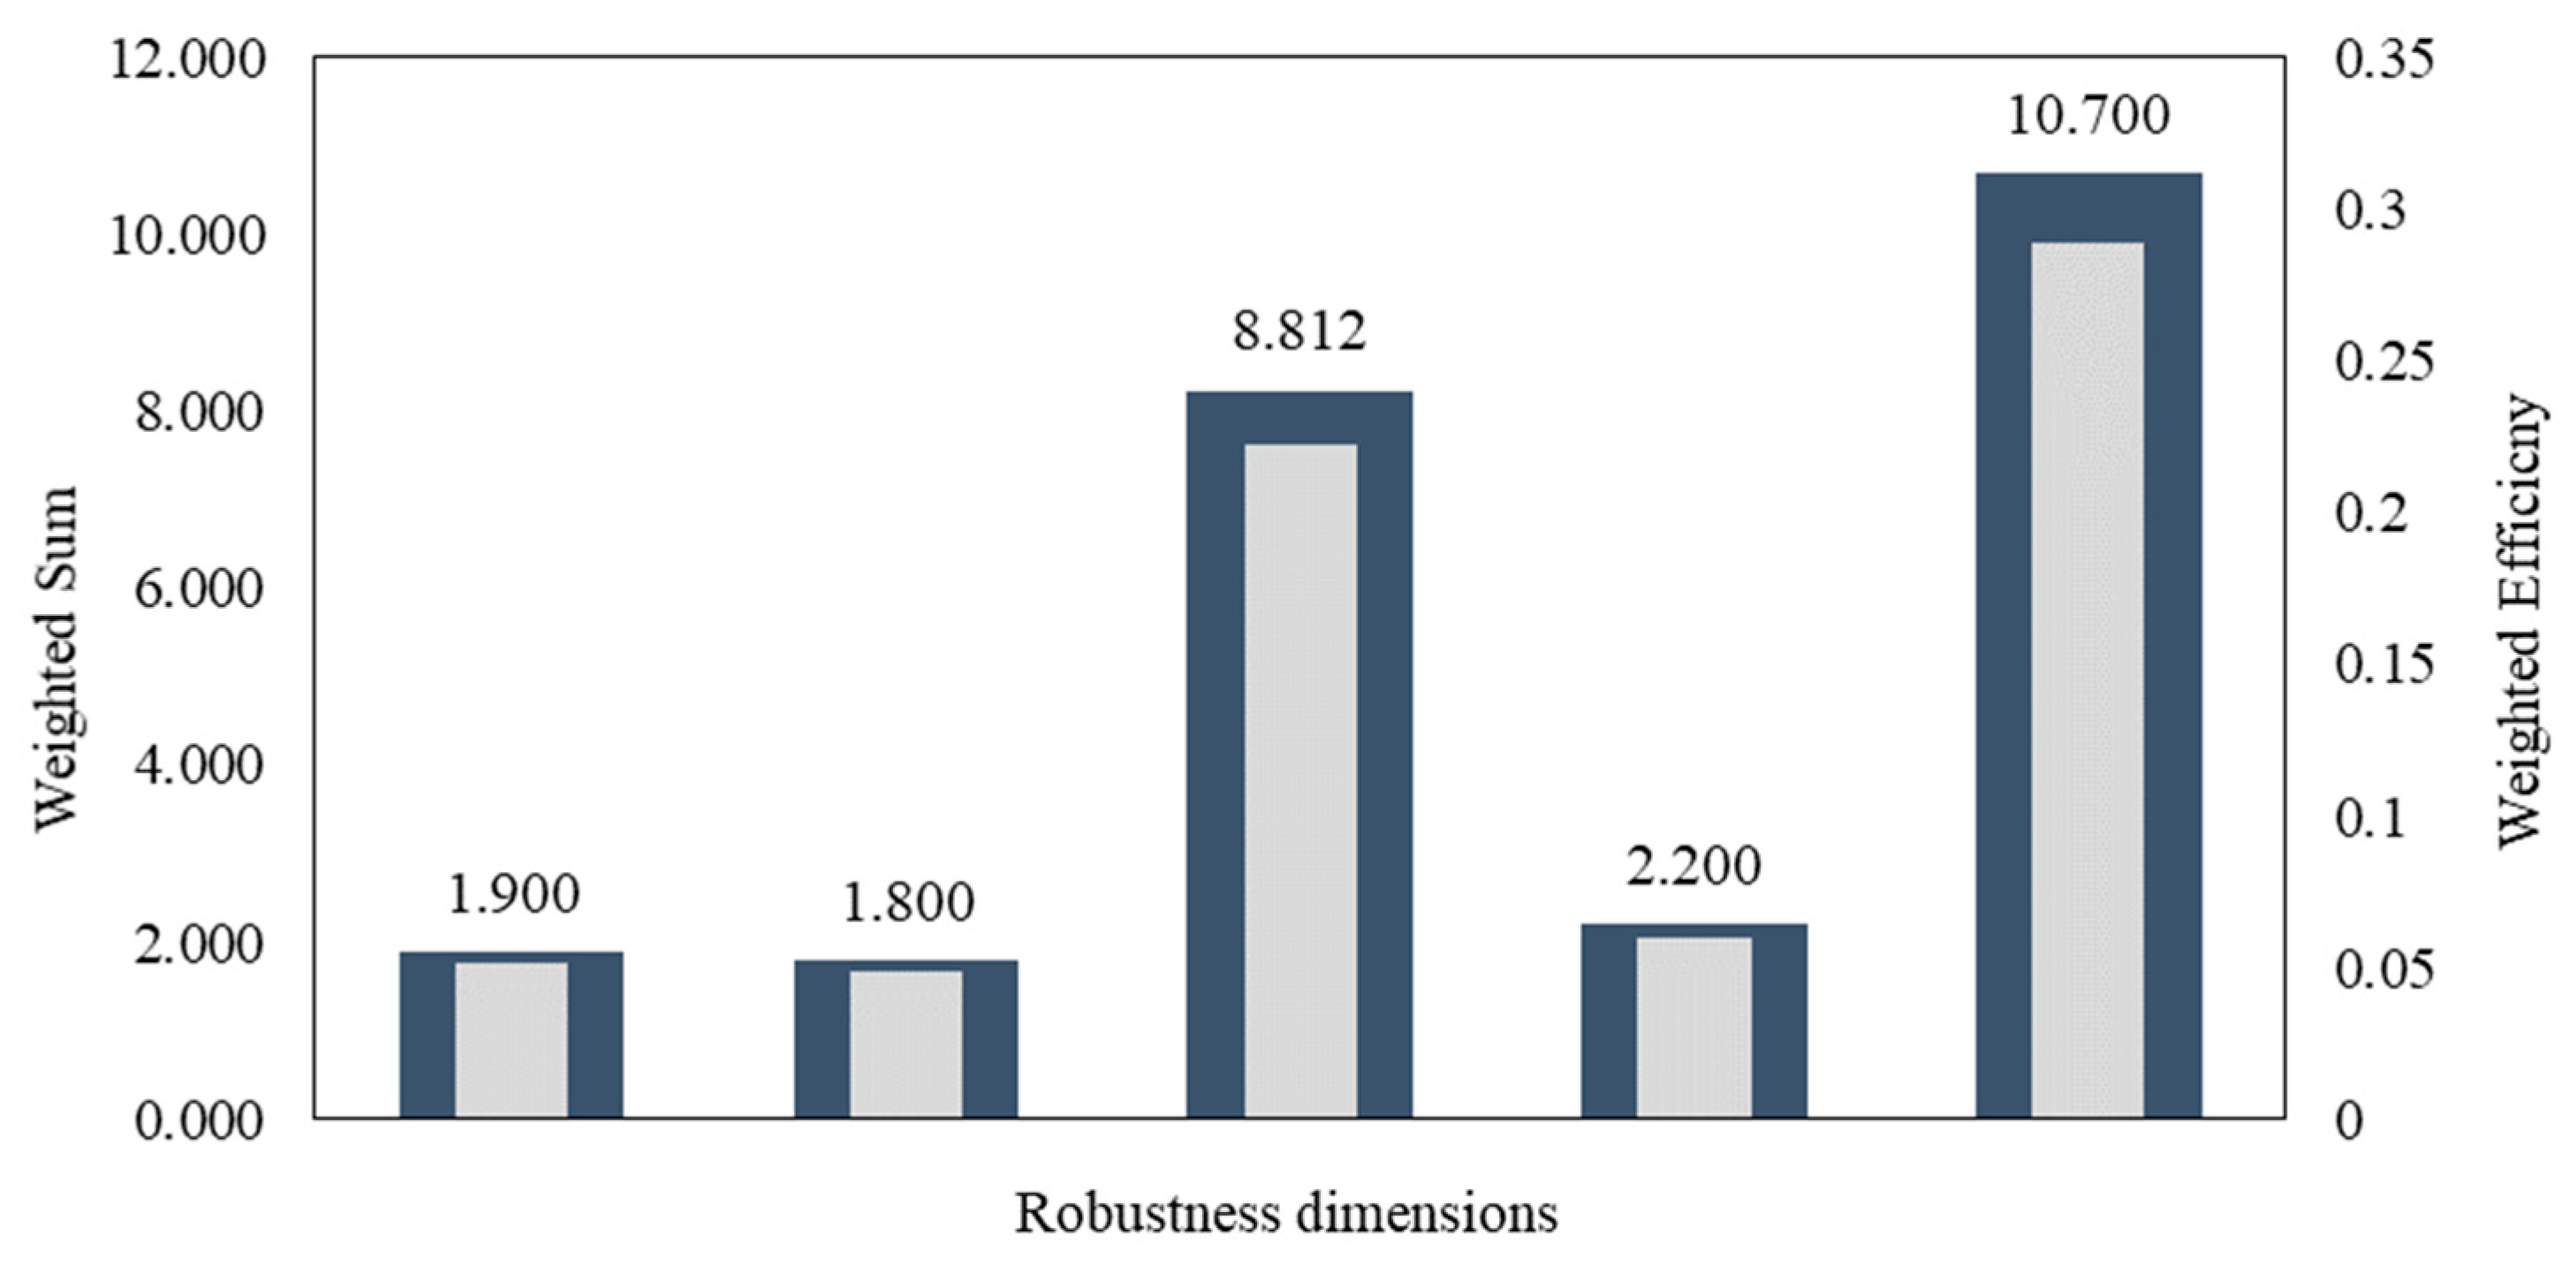

Table 1.
Robustness dimensions and indicators.
| Dimensions | Type | Indicators | Source | Symbol | Units |
|---|---|---|---|---|---|
| Availability | Output | 1. Diversity of domestic production: Food Calories | FAO | OAV1 | Kcal(1) |
| Input | 2. Diversity of import sources: Food Calories | FAO | IAV1 | Kcal | |
| 3. Diversity of stocks: Food Calories | FAO | IAV2 | Kcal | ||
| 4. Availability of Electricity access | World Bank | IAV3 | % of population | ||
| 5. Land Area equipped for irrigation | FAO | IAV4 | 103 Ha(2) | ||
| 6. Availability of irrigation facility land | FAO | IAV5 | 103 Ha | ||
| Accessibility | Output | 7. Cereal yield | World Bank | OAC1 | Kg/Ha |
| Input | 8. Adult literacy | World Bank | IAC1 | % | |
| 9. Unit labor Cost | OECD | IAC2 | € | ||
| 10. Mobile phone subscribers | World Bank | IAC3 | Per 100 people | ||
| 11. Total paved and unpaved roads | Eurostat | IAC4 | Km | ||
| 12. Short-term household Credit | OECD | IAC5 | Bn. € | ||
| 13. Access to electricity, rural | World Bank | IAC6 | % of rural population | ||
| Economic | Output | 14. Consumer price index | World Bank | OEC1 | (2010 = 100) |
| Input | 15. Affordability of daily calorie intake | FAO | IEC1 | % | |
| 16. Personal disposable income | Eurostat | IEC2 | € | ||
| 17. Expenditure on food per capita | World Bank | IEC3 | 103 € | ||
| 18. Ratio of urban population | World Bank | IEC4 | % | ||
| 19. Energy imports | EUROPA | IEC5 | % | ||
| 20. Household Annual disposable income | OECD | IEC6 | 1000 US dollars | ||
| Environmental | Output | 21. Air quality index | World Air Quality Report | OEV1 | µg/ m3 |
| Input | 22. Renewable freshwater resources | Eurostat | IEV1 | 106 m3 | |
| 23. Energy used in agriculture | FAOSTAT | IEV2 | TJ(3) | ||
| 24. Purchased Electricity consumption | FAOSTAT | IEV3 | TJ | ||
| 25. Internal renewable water resources | World Bank | IEV4 | Bn. m3 | ||
| 26. Annual rate of net forest change | FAOSTAT | IEV5 | % | ||
| 27. Used Water for drinking | EUROPA | IEV6 | liters per capita | ||
| Governance | Output | 28. Transportation infrastructure value | OECD | OGN1 | € |
| Input | 29. Protection of intellectual property | EUROPA | IGN1 | BoP(4), US$ | |
| 30. Government spending | OECD | IGN2 | % of GDP(5) | ||
| 1 Kcal= Kilo Calories 2 Ha= Hectare 3 TJ=Tera Joule 4 BoP= Balance of Payment 5 GDP= Gross Domestic Product | |||||
Table 3.
Governance expert-based AHP pair-wise comparison matrix.
| Accessibility | Availability | Economic | Environmental | Governance | |
|---|---|---|---|---|---|
| Accessibility | 1.000 | 1.000 | 0.143 | 0.333 | 0.200 |
| Availability | 1.000 | 1.000 | 0.143 | 0.333 | 0.200 |
| Economic | 7.000 | 7.000 | 1.000 | 5.000 | 0.333 |
| Environmental | 3.000 | 3.000 | 0.200 | 1.000 | 0.3333 |
| Governance | 5.000 | 5.000 | 3.000 | 3.000 | 1.000 |
Table 4.
Governance expert-based AHP weights.
| Dimension | Dimension weight |
|---|---|
| Accessibility | 5.20 % |
| Availability | 5.20 % |
| Economic | 33.90 % |
| Environmental | 12.10 % |
| Governance | 43.60 % |
Table 5.
The weighted sum values matrix.
| Accessibility | Availability | Economic | Environmental | Governance | ||
|---|---|---|---|---|---|---|
| Accessibility | 0.052 | 0.052 | 0.048 | 0.040 | 0.087 | 0.14 |
| Availability | 0.052 | 0.052 | 0.048 | 0.040 | 0.087 | 0.14 |
| Economic | 0.364 | 0.364 | 0.339 | 0.605 | 0.145 | 6.89 |
| Environmental | 0.156 | 0.156 | 0.068 | 0.121 | 0.145 | 0.91 |
| Governance | 0.260 | 0.260 | 1.017 | 0.363 | 0.436 | 7.41 |
Table 6.
TE Statistics of the availability dimension.
| Statistic | (37,1), 1) | <Q3 | Q1 |
|---|---|---|---|
| No. of DMUs | 37 | 16 | 9 |
| Minimum | 0.425 | 0.513 | 0.425 |
| Maximum | 1.000 | 0.998 | 0.511 |
| 1st Quartile () | 0.513 | 0.556 | 0.448 |
| 3rd Quartile () | 1.000 | 0.680 | 0.468 |
| Average ( | 0.718 | 0.649 | 0.465 |
| Standard deviation () | 0.228 | 0.131 | 0.029 |
Table 7.
TE Statistics of the accessibility dimension.
| Statistic | (37,1), 2) | <Q3 | Q1 |
|---|---|---|---|
| No. of DMUs | 37 | 14 | 10 |
| Minimum | 0.457 | 0.569 | 0.457 |
| Maximum | 1.000 | 1.000 | 0.556 |
| 1st Quartile () | 0.556 | 0.634 | 0.499 |
| 3rd Quartile () | 1.000 | 0.761 | 0.529 |
| Average ( | 0.769 | 0.739 | 0.511 |
| Standard deviation () | 0.217 | 0.156 | 0.030 |
Table 8.
The TE Statistics of the economic dimension.
| Statistic | All DMUs | Q1 | Q1<TE<Q3 |
|---|---|---|---|
| No. of DMUs | 37 | 9 | 21 |
| Minimum | 0.424 | 0.424 | 0.478 |
| Maximum | 1.000 | 0.470 | 1.000 |
| 1st Quartile () | 0.478 | 0.428 | 0.589 |
| 3rd Quartile () | 1.000 | 0.459 | 0.800 |
| Average ( | 0.697 | 0.447 | 0.704 |
| Standard deviation () | 0.218 | 0.018 | 0.158 |
Table 9.
The TE statistics of the environmental dimension.
| Statistic | All DMUs | Q1 | Q1<TE<Q3 |
|---|---|---|---|
| No. of DMUs | 37 | 10 | 17 |
| Minimum | 0.075 | 0.075 | 0.165 |
| Maximum | 1.000 | 0.161 | 1.000 |
| 1st Quartile () | 0.161 | 0.100 | 0.185 |
| 3rd Quartile () | 1.000 | 0.151 | 0.435 |
| Average ( | 0.475 | 0.123 | 0.373 |
| Standard deviation () | 0.385 | 0.031 | 0.270 |
Table 10.
The TE statistics of the governance dimension.
| Statistic | All DMUs | Q1 | <Q3 |
|---|---|---|---|
| No. of DMUs | 37 | 9 | 19 |
| Minimum | 0.365 | 0.365 | 0.457 |
| Maximum | 1.000 | 0.448 | 1.000 |
| 1st Quartile () | 0.457 | 0.394 | 0.496 |
| 3rd Quartile () | 1.000 | 0.435 | 0.652 |
| Average ( | 0.659 | 0.414 | 0.613 |
| Standard deviation () | 0.247 | 0.030 | 0.176 |
Table 11.
Checking the adequacy of the impact matrices (=37).
| Dimension | Rule 1 | Rule 2 | Result | |||||
|---|---|---|---|---|---|---|---|---|
| 1 | Availability | 5 | 1 | 5 | 18 | Yes | Yes | Pass |
| 2 | Accessibility | 6 | 1 | 6 | 21 | Yes | Yes | Pass |
| 3 | Economic | 6 | 1 | 6 | 21 | Yes | Yes | Pass |
| 4 | Environmental | 6 | 1 | 6 | 21 | Yes | Yes | Pass |
| 5 | Governance | 2 | 1 | 2 | 9 | Yes | Yes | Pass |
Table 12.
Correlation measurements between all pairs of indicators of availability dimension.
| OAV1 | IAV1 | IAV2 | IAV3 | IAV4 | IAV5 | |
|---|---|---|---|---|---|---|
| OAV1 | 1 | -0.444 | 0.152 | -0.788 | 0.343 | 0.19 |
| IAV1 | -0.444 | 1 | 0.064 | 0.131 | 0.043 | 0.104 |
| IAV2 | -0.152 | 0.064 | 1 | 0.221 | 0.537 | 0.092 |
| IAV3 | -0.788 | 0.131 | 0.221 | 1 | 0.413 | -0.171 |
| IAV4 | -0.343 | 0.043 | 0.537 | 0.413 | 1 | 0.028 |
| IAV5 | 0.19 | 0.104 | 0.092 | -0.171 | 0.028 | 1 |
Table 13.
Suggested improvement plans.
| DMU | Indicator | Slack Reduction, % | Saved, Ha |
|---|---|---|---|
| Italy | IAV4 | 70 | 4831 |
| Netherlands | 70 | 704.83 | |
| Portugal | 40 | 380.61 |
Table 14.
Suggested improvement plan based on approach two.
| DMU | Dimension | Indicator | Slack Reduction, % |
|---|---|---|---|
| Iceland | Economic | IEC3 | 50 |
| Luxembourg | Environment | IEV1 | 50 |
| Governance | IGV1 | 50 | |
| Macedonia | Environment | IEV1 | 50 |
| Montenegro | Governance | IGV1 | 50 |
| Economic | IEC2 | 50 | |
| Romania | Economic | IEC2 | 50 |
| Spain | Accessibility | IAC4 | 50 |
| Availability | IAV4 | 50 | |
| Sweden | Governance | IGT1 | 50 |
| Governance | IGT1 | 50 |
Disclaimer/Publisher’s Note: The statements, opinions and data contained in all publications are solely those of the individual author(s) and contributor(s) and not of MDPI and/or the editor(s). MDPI and/or the editor(s) disclaim responsibility for any injury to people or property resulting from any ideas, methods, instructions or products referred to in the content. |
© 2024 by the authors. Licensee MDPI, Basel, Switzerland. This article is an open access article distributed under the terms and conditions of the Creative Commons Attribution (CC BY) license (http://creativecommons.org/licenses/by/4.0/).
Copyright: This open access article is published under a Creative Commons CC BY 4.0 license, which permit the free download, distribution, and reuse, provided that the author and preprint are cited in any reuse.


